Shifting Hardiness Zones: Trends in Annual Minimum Temperature


Department of Civil Engineering and NOAA-CREST, The City College of New York, New York, NY 10031, USA
Climate 2018, 6(1), 15; https://doi.org/10.3390/cli6010015
Submission received: 28 December 2017
/
Revised: 5 March 2018
/
Accepted: 6 March 2018
/
Published: 9 March 2018
(This article belongs to the Special Issue Decadal Variability and Predictability of Climate)
Abstract
:Work published in 2012 revealed that annual minimum temperatures over the coterminous United States (USA) have increased faster than mean temperatures, causing a pronounced poleward shift in the positions of hardiness zones defined by the expected annual minimum temperature. Here, estimates of increases in annual minimum temperatures are updated and extended to other land areas where station temperature records are available. Annual minimum temperatures have increased faster than mean temperatures in seasonally cold regions globally, but have warmed at about the same rate as mean temperatures in tropical climates. The mean increase in annual minimum temperature across the available weather stations was 2.0 °C between 1970 and 2016 (or almost 0.5 °C per decade), as compared to an increase of 1.2 °C in mean temperature. Recent cold winters in regions such as Eastern North America did not clearly break with this trend and were within the range of variability seen in past decades. Overall, annual minimum temperatures appear to be increasing steadily, though with considerable inter-annual variability.
1. Introduction
In the United States (USA), hardiness zones for assessing the expected ranges of perennial plants and overwintering insects are defined in terms of the expected annual minimum surface air temperature [1]. Globally, annual minimum temperature is used to define agroecological zones [2,3,4]. In previous work, changes in annual minimum temperature as compared to mean temperature over the USA up until the winter of 2011–2012 were studied using weather station records [5]. Annual minimum temperature was found to have increased on average by ∼2 °C since 1970, compared to an increase of ∼0.8 °C in mean temperature, and 2011–2012 had the warmest average minimum temperatures of any year in the observational record.
Subsequent winters, while also featuring many reports of warmer periods, also included a number of cold spells relative to the past few years and even decades. Further, it has been suggested that melting of Arctic sea ice has increased the likelihood of persistent extreme weather conditions in the northern midlatitudes, which could lead to colder annual minimum temperatures as compared to mean temperatures [6]. In particular, Arctic sea ice loss has been correlated with a greater number of cold winter days (defined as 1.5 standard deviations below climatology) in the northern continents [7]. According to some analyses, Arctic sea ice loss and enhanced Arctic warming [8] have lead to changes in air pressure and circulation patterns that favor cold winters in the Eastern USA and Northern Eurasia [9,10], though this causative role is disputed [11,12]. A weakening stratospheric polar vortex may be a mediating factor [13]. Whether there has been a slowdown or reversal of the rapid warming in annual minimum temperatures observed over the last decades (which might be a consequence of these factors) has not been investigated.
There are thus two main goals in the current paper. The first is to assess the robustness of the contrast between annual minimum and mean temperature trends by extending the analysis of trends from the USA worldwide (wherever weather station data are available), and in particular across the northern hemisphere midlatitudes, where Arctic sea ice loss could be causing winter cooling. The second goal is to update the previous analysis to evaluate whether there is any discernible recent trend toward colder or more variable annual minimum temperatures.
2. Methods
2.1. Temperature Data
Temperature observations were obtained from the Daily Global Historical Climatology Network (GHCN-Daily), a compilation of weather station records that is freely available and updated in near real time by the USA National Climatic Data Center (NCDC) [14]. Data flagged as failing any of the automatic quality control tests [15,16] were considered to be missing and not used.
Years were taken to begin in March, so that Northern Hemisphere winters are not split across two years. Only stations with mostly complete years of daily maximum and minimum temperature data since 1970 (i.e., at least 24 years), including at least one of the most recent 5 years (2012–2016), were used. This gave 1428 available stations. Most (1049 stations or 71%) were in the Northern Hemisphere midlatitudes (30°–60° N), split evenly between the Western and Eastern Hemispheres (505 and 544 stations respectively). Station density was the highest in North America, Europe, and Northern Asia (Figure 1). All years with at least 50 available stations were included in the analysis steps.
2.2. Data Analysis
An imputation method based on singular value decomposition [17,18] was used to fill in missing annual values for the selected stations, in order to minimize the impact of changing station coverage over time in terms of the estimated regional trends [5]. Estimates of changes in expected minimum and mean annual temperatures since 1970 were obtained by smoothing splines applied to the temperature time series. The degree of smoothing was chosen to optimize the corrected Akaike information criterion, which provides an indication of the expected prediction error from the constructed spline function [5,19,20,21]. Confidence intervals for the smoothing splines were also obtained [22,23]. Average values and trends were averaged across all stations. Imputation and averaging were also carried out separately for the northern midlatitude (30°–60° N), the Eastern and Western Hemispheres, and for the region of Eastern North America (35°–50° N, 60°–90° W) that has experienced several recent cold winters. Mean warming amounts were also assessed across stations as functions of baseline climatology (1976–2005) using minimum and mean temperatures in order to compare the amount of warming over areas with different levels of winter severity.
3. Results
The average increase in annual minimum temperature over 1970–2016 was 2.04 ± 0.58 °C (uncertainty covers the estimated 95% confidence interval of the smoothed trend) globally (over the available stations), compared to average increase in annual mean temperature of 1.16 ± 0.15 °C (over the same stations) (Figure 2). The difference between the two increases in temperature was 0.88 ± 0.49 °C, significantly greater than zero. The mean increases in temperature for the northern midlatitude stations, and for the Eastern and Western Hemispheres separately, were comparable to the global mean (Table 1).
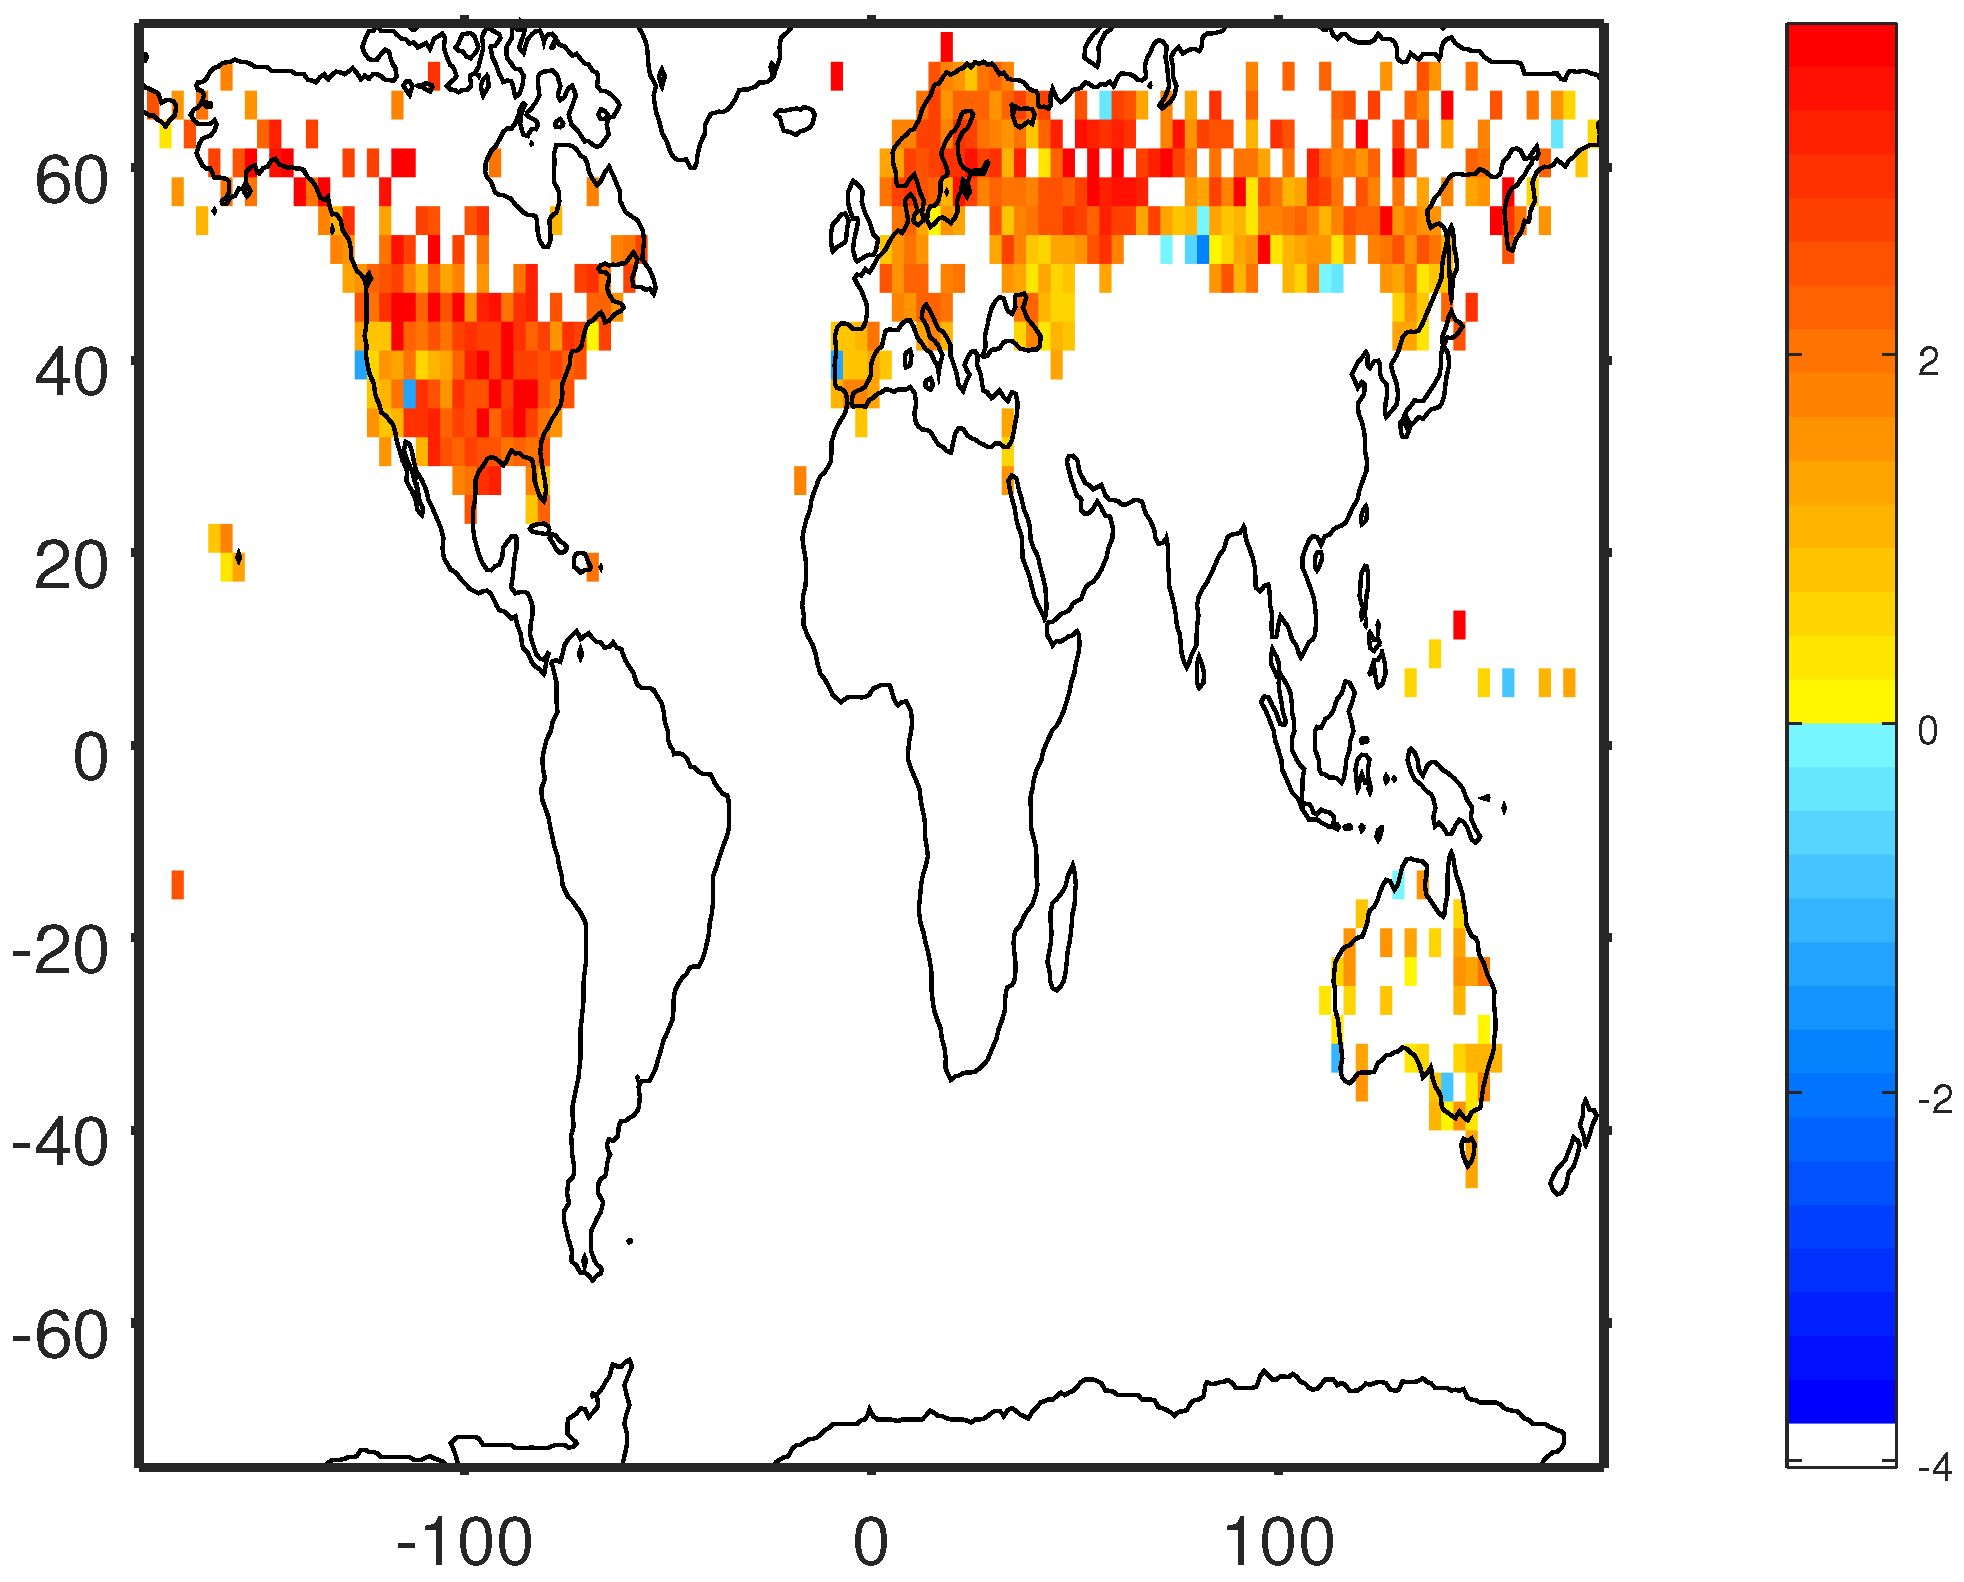
The increase in annual minimum temperature by 1–3 °C from 1970 to 2016 was geographically widespread, with only a few areas (such as Southern Siberia and the Southwest United States) tending to show less or no warming (Figure 3).
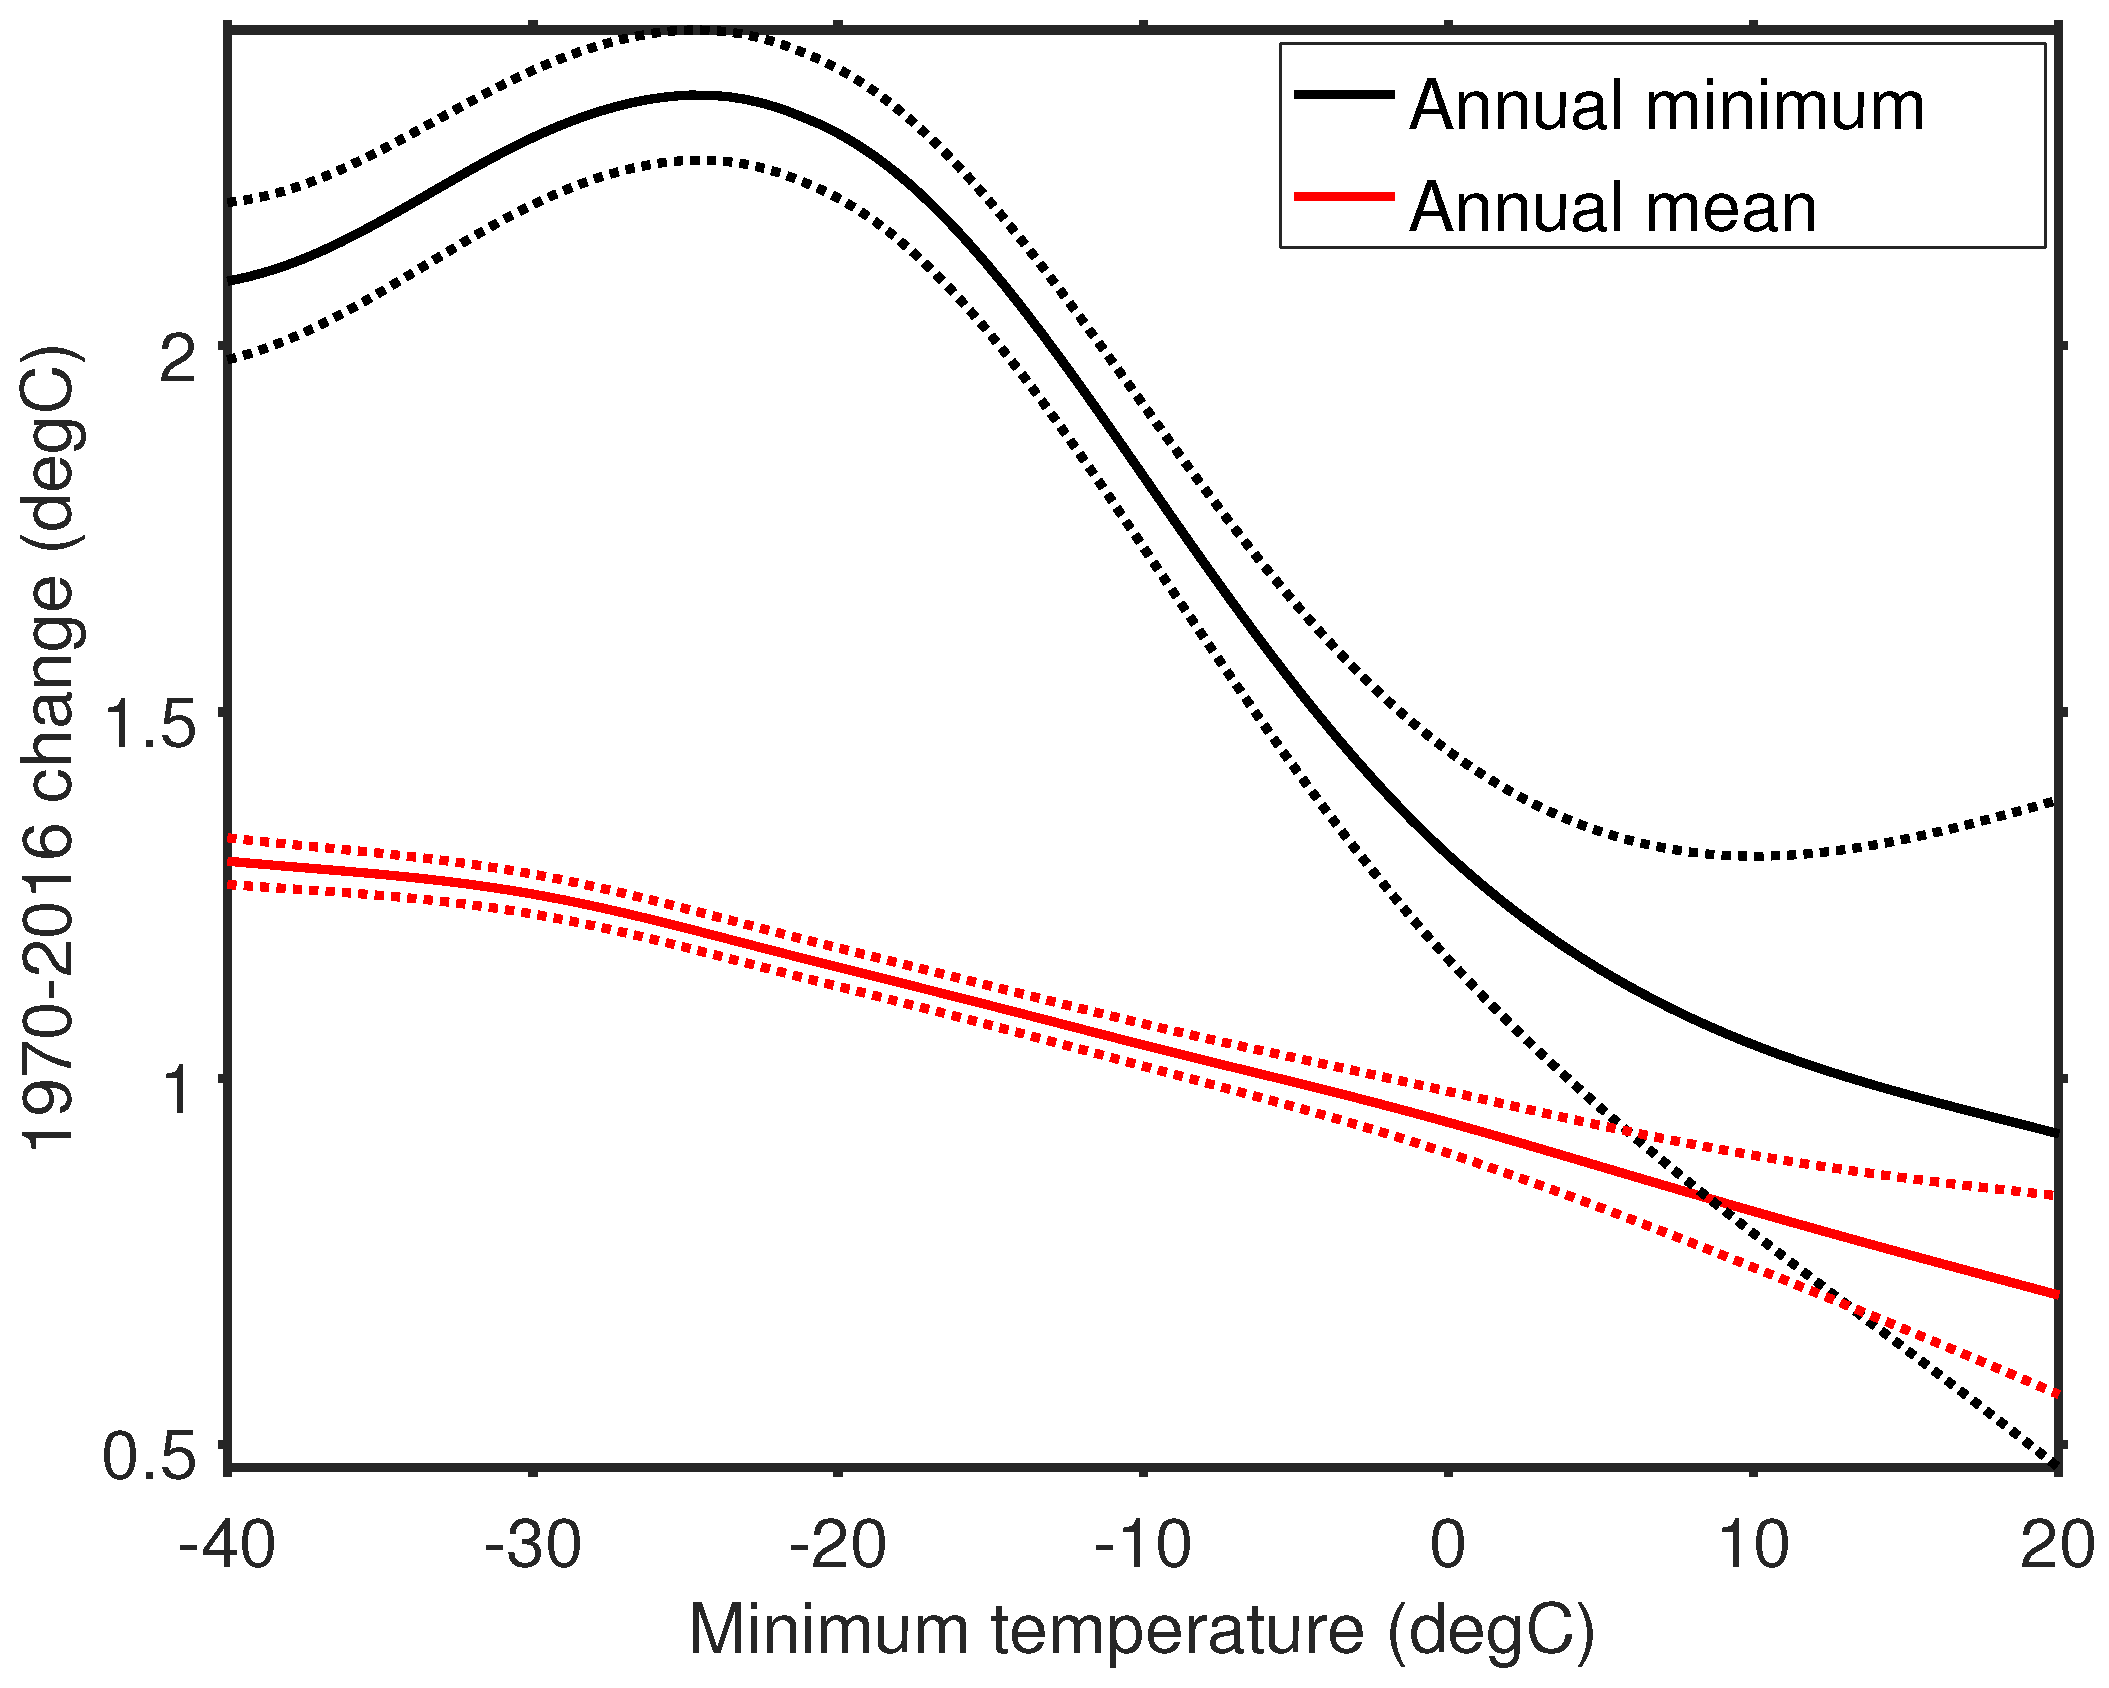
The increase in annual minimum temperature as well as mean temperature is associated with the baseline temperature. Places with cold winters (annual minimum temperatures below −10 °C) warmed an average of 1.5–2.5 °C in annual minimum temperatures and 1–1.2 °C in mean temperatures. For tropical places (annual minimum temperatures above 0 °C), mean temperatures increased by an average of 0.8–1 °C and annual minimum temperatures also increased by about 1 °C or less (Figure 4).
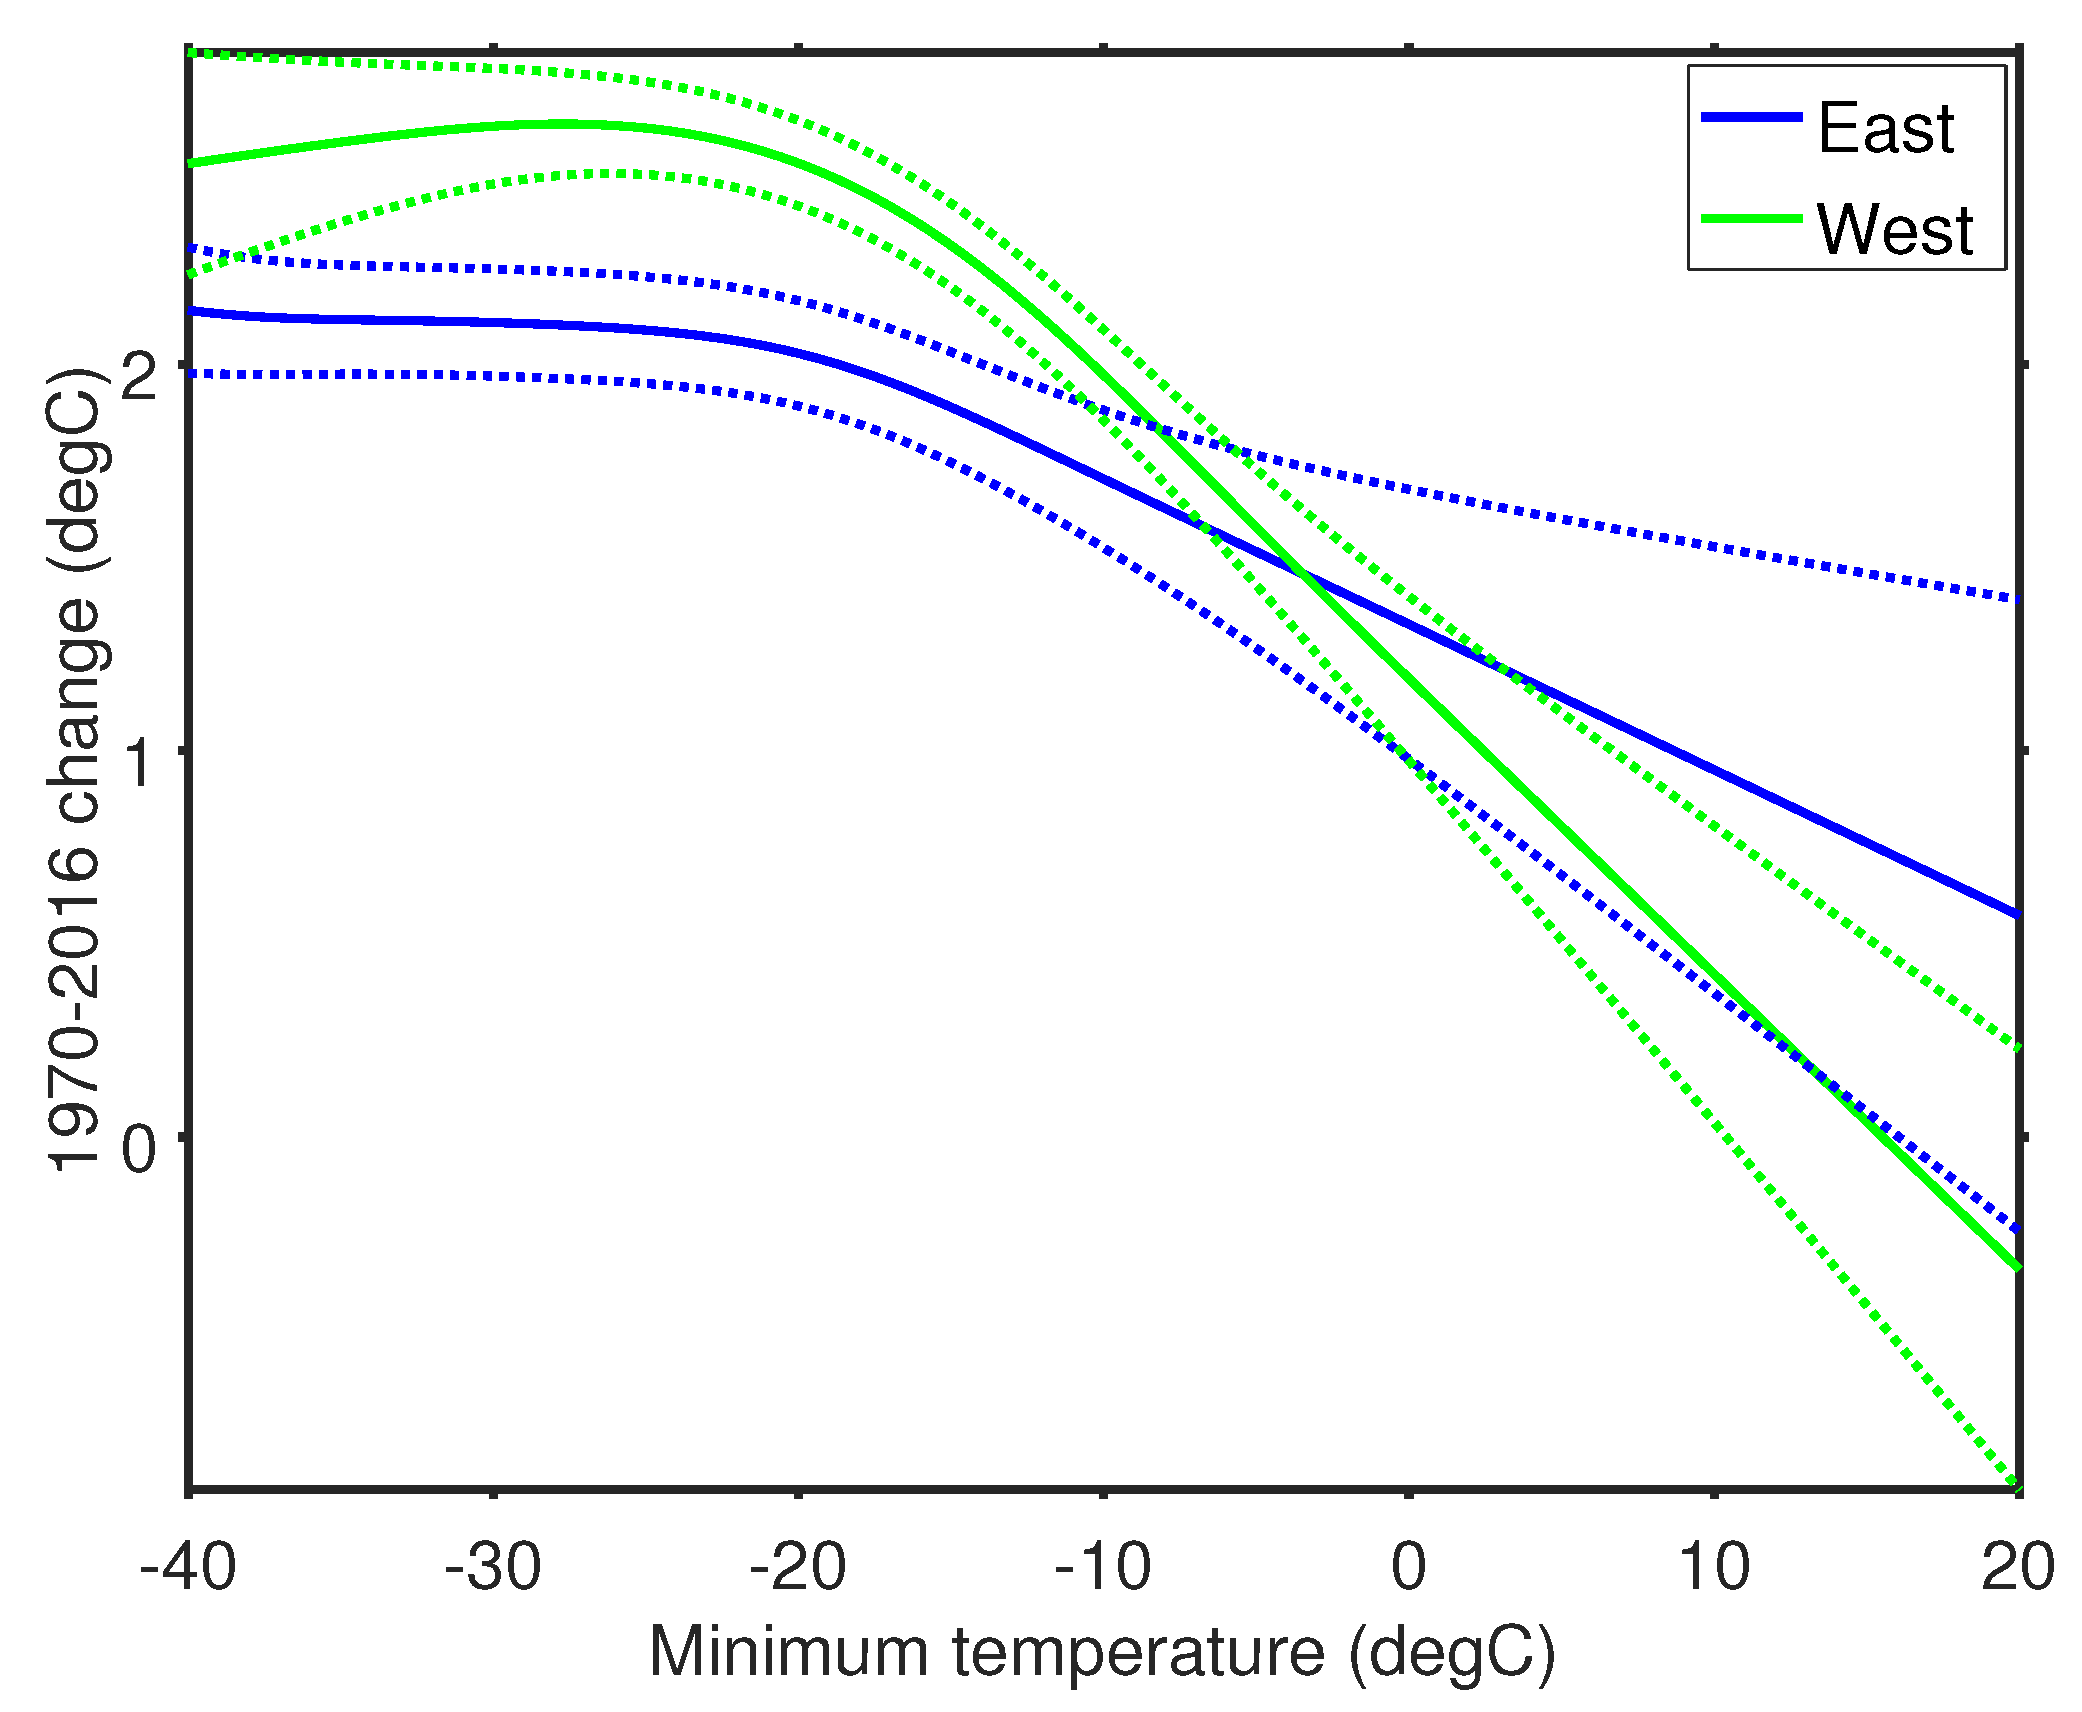
Stations in the Western Hemisphere midlatitudes with cold winters have averaged increases in temperature of a few tenths of a degree more than similarly cold stations in the Eastern Hemisphere (Figure 5). The midlatitude mean warming was close to 2 °C globally (over the available stations) and for both hemispheres (Table 1).
Globally, the smoothing spline fit suggests a near-linear increase in annual minimum temperatures since the 1960s of some 0.5 °C per decade. There is considerable year-to-year variability, of the same order as the magnitude of the trend, even averaged across all the stations. The warmest years in the time series are 1991 and 2007 (Figure 6).
Averaged over all stations, the last few winters (2012–2016) are quite consistent with the previously observed warming trend (Figure 6). However, there has been regional variability. Compared with the smoothed value inferred for 2011 using only data up to 2011, much of North America, particularly the Northeast and Northwest United States, had relatively cold winters in 2012–2016, while Europe was relatively warm and Siberia showed a mixed pattern (Figure 7).
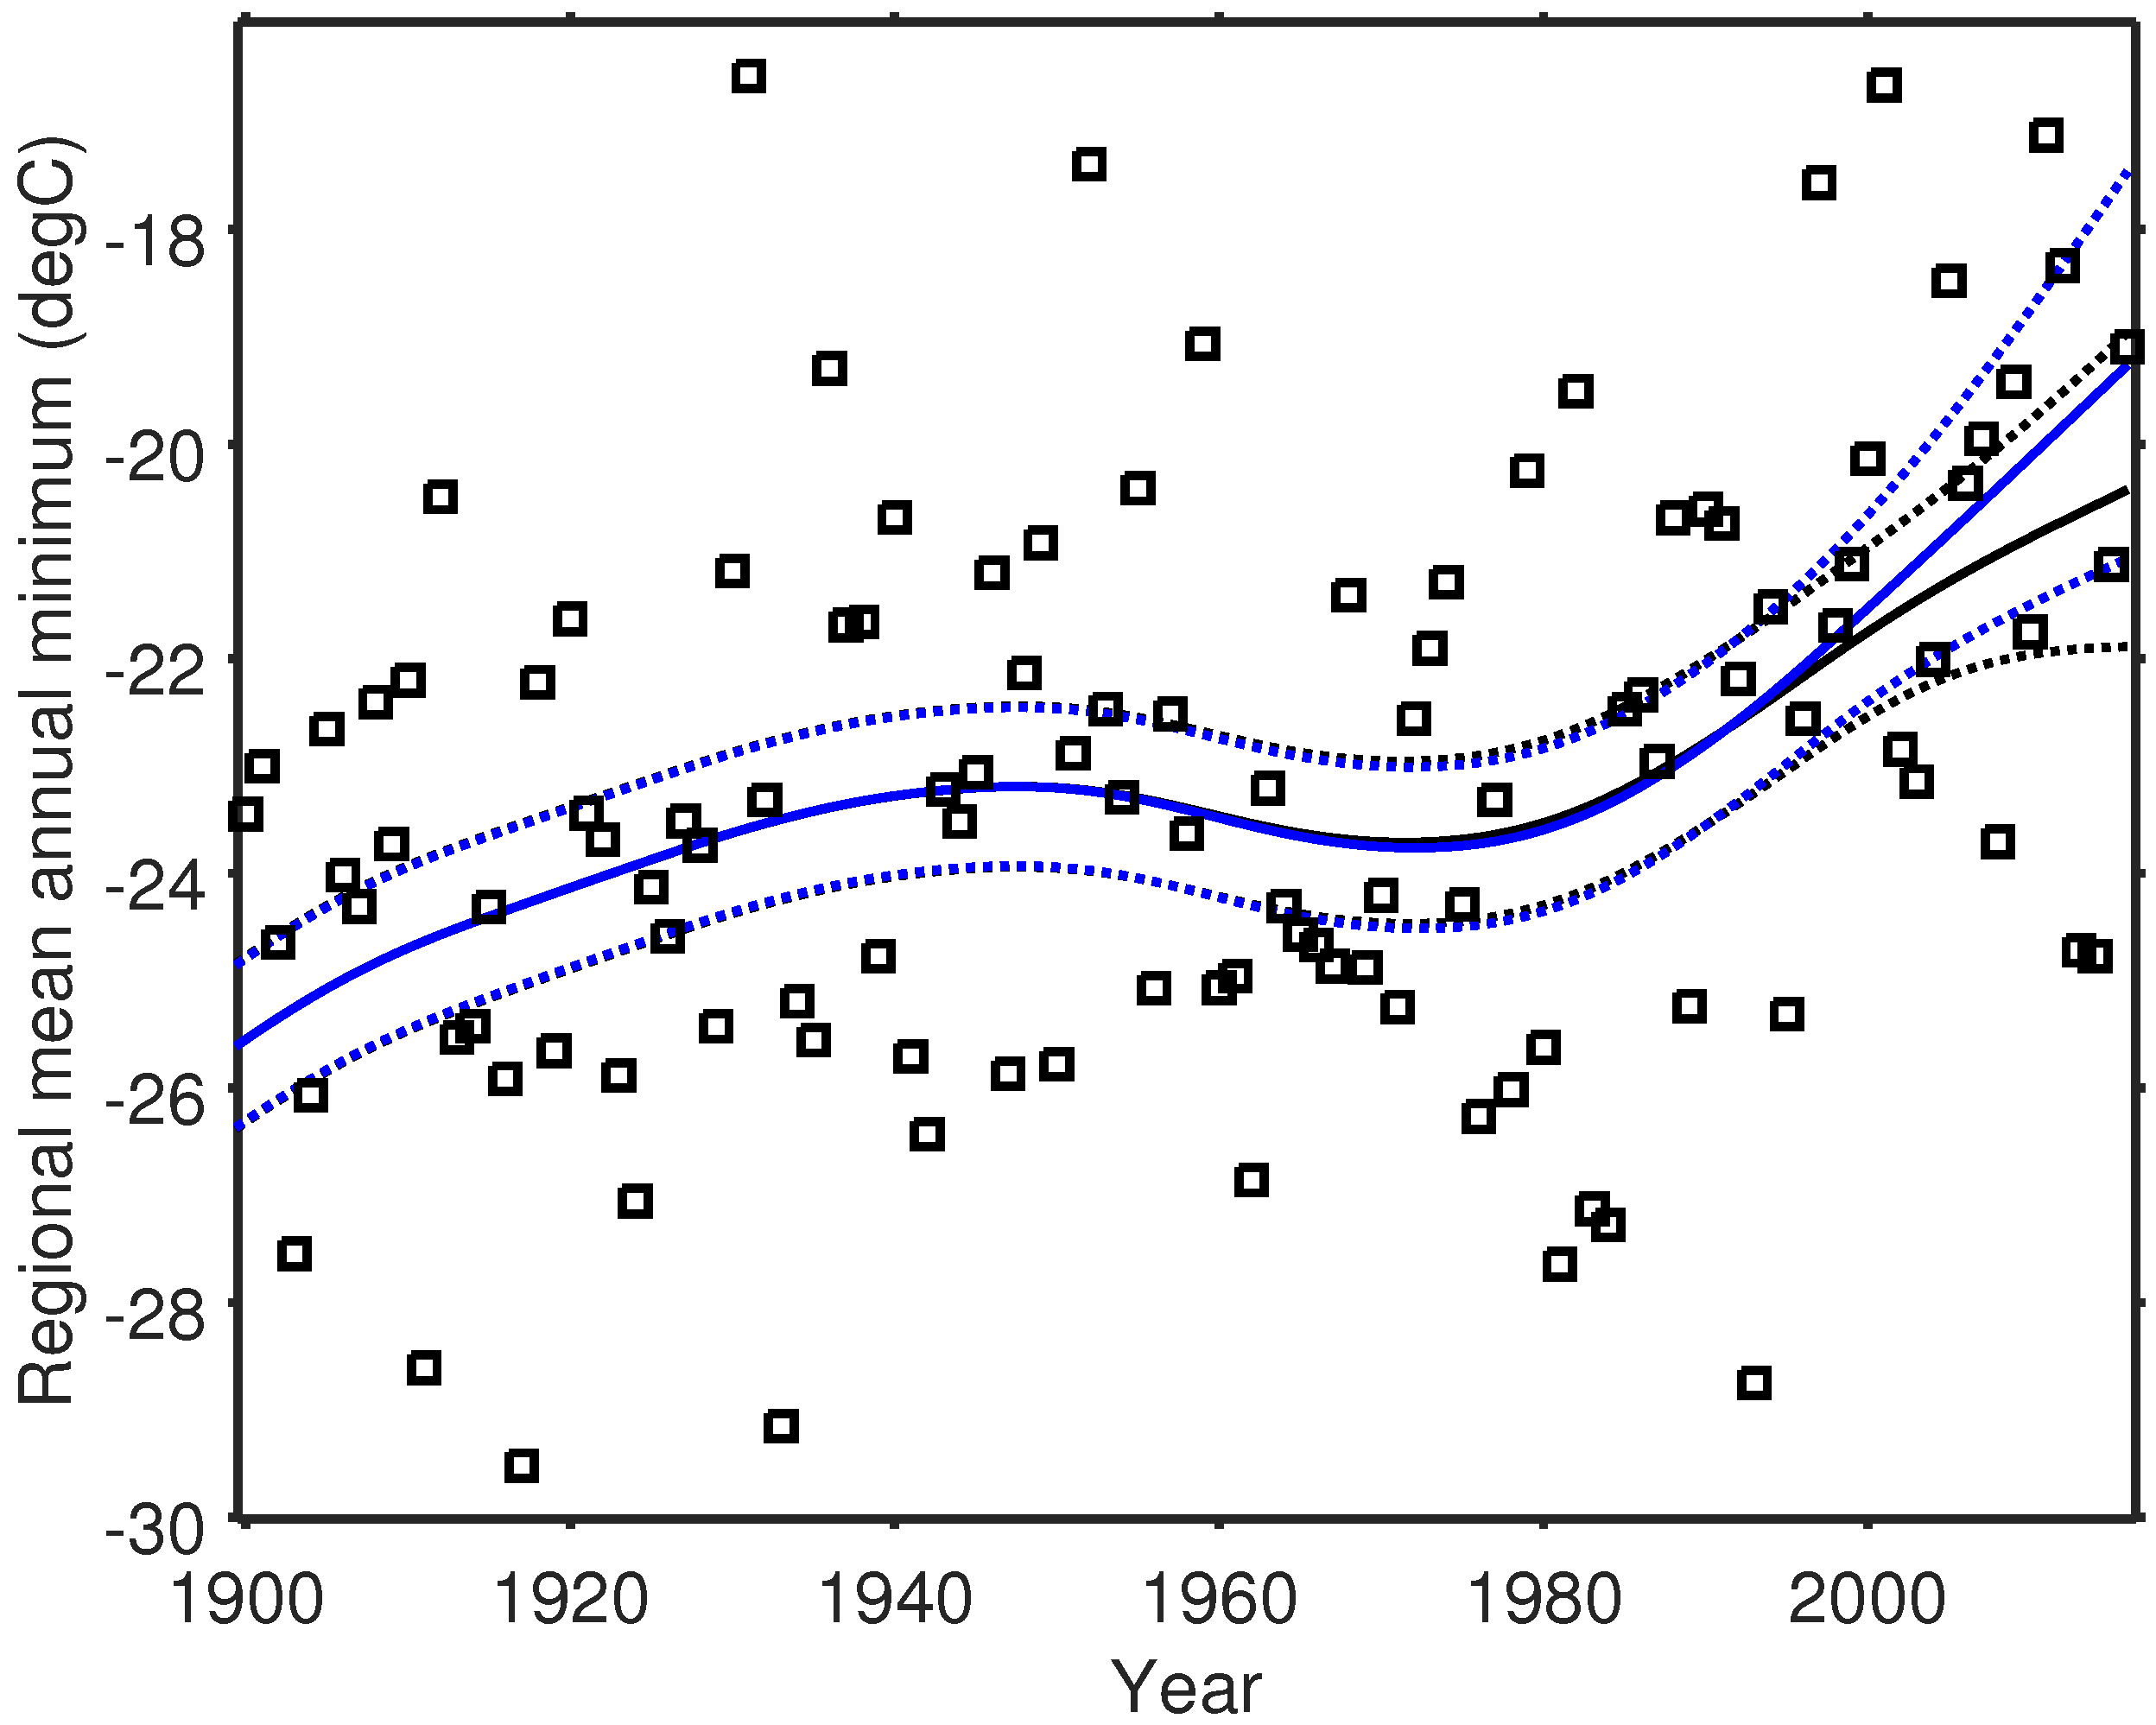
Are these regional anomalies seen over the last few years unusual in the weather records? This was examined in more detail for the region with the greatest cold anomaly over Eastern North America, taken as 35°–50° N, 60°–90° W (Figure 7). Data from stations in this region with at least 30 years of complete minimum temperature data () were averaged, after imputing missing values with the same algorithm employed globally (but using only data from stations in the region). The resulting time series clearly showed cold winters in 2013–2014 and 2014–2015, which were the coldest since 1995–1996 in terms of annual minimum temperatures (Figure 8). These two cold winters pushed down the inferred warming trend over the last 20 years, although the change was well within the confidence interval generated using only data up to 2011 (Figure 8). The magnitude of the cold anomalies in these winters relative to the trend was 4–5 °C, which is consistent with the interannual variability seen in previous decades. Interestingly, the warming in this region was been great enough that these winters, unusually cold for the 2010s, would have been normal or even warmer than average based on measurements before ∼1920 (Figure 8). Overall, this time series suggests that cold anomalies seen regionally in recent years are consistent with recorded past interannual variability (Figure 8) and do not provide clear evidence of a break in the warming trend trend for annual minimum temperatures.
4. Discussion and Conclusions
In this study, available weather stations show a trend towards faster warming in annual minimum temperature compared to that of mean temperature. In general, global studies of surface temperatures have found daily minimum temperatures to be increasing faster than daily maximums and winter temperatures to be increasing faster than summer temperatures, resulting in reduced diurnal and seasonal temperature ranges [24,25,26,27]. The most recent Intergovernmental Panel on Climate Change report concluded with medium confidence that globally, daily minimum temperatures have increased more than daily maximum temperatures since 1950 [28]. A study of European station data found that, in the winter, the coldest percentiles of the temperature distribution have been increasing in temperature the fastest since 1950, although the temperatures of the hottest summer days have increased faster than those of the coolest ones [29].
Annual minimum temperatures have increased the fastest in the coldest places. By contrast, under tropical conditions, annual minimum temperatures warmed no faster than mean temperatures. These patterns can be attributed to carbon dioxide and other anthropogenic greenhouse gases exerting the greatest warming effect under cold and dark conditions. Some other climate forcings, such as haze due to local pollution and aircraft contrails, also depress diurnal and seasonal temperature ranges [30,31,32]. In warm climates, worsening drought conditions could be one reason for the increases in mean and maximum temperatures being relatively higher than the increases in minimum temperatures [33,34,35,36], in contrast to the impact of added irrigation, which depresses maximum temperatures much more than minimum temperatures [37,38,39]. A denser network of stations in the tropics is needed to better understand the possible roles of these factors. Regional and global gridded datasets of temperature at daily resolution are becoming available [40,41,42,43], and could be investigated for retrieving trends in annual minimum temperatures with better spatial coverage.
The warming trend in annual minimum temperature looks steady, at some 0.5 °C per decade globally (over available weather stations), or 2.0 °C in total over 1970–2016. There is no evidence of an interruption of this warming trend over the last few years, despite the changes in winter atmospheric circulation patterns noted by other studies. Even for regions such as Eastern North America that have seen relatively cold winters recently, their frequency and magnitude is so far consistent with temporally constant interannual variability superimposed on an uninterrupted warming trend. The evidence to date implies that hardiness zones are continuing to migrate poleward, with important economic and ecological consequences.
Acknowledgments
This study was supported by National Oceanic and Atmospheric Administration (NOAA) under grants NA16SEC4810008 and NA15OAR4310080 and by the United States Agency for International Development (USAID) under the U.S.-Pakistan Centers for Advanced Studies in Water. All statements made are not the opinions of the funding agency or the U.S. government, but reflect the author’s views.
Conflicts of Interest
The author declares no conflict of interest.
References
- Daly, C.; Widrlechner, M.P.; Halbleib, M.D.; Smith, J.I.; Gibson, W.P. Development of a new USDA plant hardiness zone map for the United States. J. Appl. Meteorol. Climatol. 2012, 51, 242–264. [Google Scholar] [CrossRef]
- DeGaetano, A.T.; Shulman, M.D. A climatic classification of plant hardiness in the United States and Canada. Agric. For. Meteorol. 1990, 51, 333–351. [Google Scholar] [CrossRef]
- Vogel, K.P.; Schmer, M.R.; Mitchell, R.B. Plant adaptation regions: Ecological and climatic classification of plant materials. Rangel. Ecol. Manag. 2005, 58, 315–319. [Google Scholar] [CrossRef]
- Lin, Y.; Liu, A.; Ma, E.; Zhang, F. Impacts of future climate changes on shifting patterns of the agro-ecological zones in China. Adv. Meteorol. 2013, 2013, 9. [Google Scholar] [CrossRef]
- Krakauer, N.Y. Estimating climate trends: Application to United States plant hardiness zones. Adv. Meteorol. 2012, 2012, 404876. [Google Scholar] [CrossRef]
- Francis, J.A.; Vavrus, S.J. Evidence linking Arctic amplification to extreme weather in mid-latitudes. Geophys. Res. Lett. 2012, 39, L06801. [Google Scholar] [CrossRef]
- Tang, Q.; Zhang, X.; Yang, X.; Francis, J.A. Cold winter extremes in northern continents linked to Arctic sea ice loss. Environ. Res. Lett. 2013, 8, 014036. [Google Scholar] [CrossRef]
- Matthes, H.; Rinke, A.; Dethloff, K. Recent changes in Arctic temperature extremes: Warm and cold spells during winter and summer. Environ. Res. Lett. 2015, 10, 114020. [Google Scholar] [CrossRef]
- Cohen, J.; Pfeiffer, K.; Francis, J. Winter 2015/16: A turning point in ENSO-based seasonal forecasts. Oceanography 2017, 30, 82–89. [Google Scholar] [CrossRef]
- Mascioli, N.R.; Previdi, M.; Fiore, A.M.; Ting, M. Timing and seasonality of the United States ‘warming hole’. Environ. Res. Lett. 2017, 12, 034008. [Google Scholar] [CrossRef]
- Woollings, T.; Harvey, B.; Masato, G. Arctic warming, atmospheric blocking and cold European winters in CMIP5 models. Environ. Res. Lett. 2014, 9, 014002. [Google Scholar] [CrossRef]
- Li, C.; Stevens, B.; Marotzke, J. Eurasian winter cooling in the warming hiatus of 1998–2012. Geophys. Res. Lett. 2015, 42, 8131–8139. [Google Scholar] [CrossRef]
- Kretschmer, M.; Coumou, D.; Agel, L.; Barlow, M.; Tziperman, E.; Cohen, J. More-persistent weak stratospheric polar vortex states linked to cold extremes. Bull. Am. Meteorol. Soc. 2018. [Google Scholar] [CrossRef]
- Menne, M.; Durre, I.; Vose, R.; Gleason, B.; Houston, T. An overview of the Global Historical Climatology Network-Daily database. J. Atmos. Ocean. Technol. 2012, 29, 897–910. [Google Scholar] [CrossRef]
- Durre, I.; Menne, M.J.; Vose, R.S. Strategies for evaluating quality assurance procedures. J. Appl. Meteorol. Climatol. 2008, 47, 1785–1791. [Google Scholar] [CrossRef]
- Durre, I.; Menne, M.J.; Gleason, B.E.; Houston, T.G.; Vose, R.S. Comprehensive automated quality assurance of daily surface observations. J. Appl. Meteorol. Climatol. 2010, 49, 1615–1633. [Google Scholar] [CrossRef]
- Golub, G.H.; Van Loan, C.F. Matrix Computation, 3rd ed.; Johns Hopkins University Press: Baltimore, MD, USA, 1996. [Google Scholar]
- Troyanskaya, O.; Cantor, M.; Sherlock, G.; Brown, P.; Hastie, T.; Tibshirani, R.; Botstein, D.; Altman, R.B. Missing value estimation methods for DNA microarrays. Bioinformatics 2001, 17, 520–525. [Google Scholar] [CrossRef] [PubMed]
- Hurvich, C.M.; Simonoff, J.S.; Tsai, C.L. Smoothing parameter selection in nonparametric regression using an improved Akaike information criterion. J. R. Stat. Soc. 1998, 60B, 271–293. [Google Scholar] [CrossRef]
- Burnham, K.P.; Anderson, D.R. Multimodel inference: Understanding AIC and BIC in model selection. Sociol. Methods Res. 2004, 33, 261–304. [Google Scholar] [CrossRef]
- Krakauer, N.Y.; Krakauer, J.C. A new body shape index predicts mortality hazard independently of body mass index. PLoS ONE 2012, 7, e39504. [Google Scholar] [CrossRef] [PubMed]
- Wahba, G. Bayesian “confidence intervals” for the cross-validated smoothing spline. J. R. Stat. Soc. 1983, 45B, 133–150. [Google Scholar]
- Silverman, B.W. Some aspects of the spline smoothing approach to non-parametric regression curve fitting. J. R. Stat. Soc. 1985, 47B, 1–52. [Google Scholar]
- Karl, T.R.; Jones, P.D.; Knight, R.W.; Kukla, G.; Plummer, N.; Razuvayev, V.; Gallo, K.P.; Lindseay, J.; Charlson, R.J.; Peterson, T.C. A new perspective on recent global warming: Asymmetric trends of daily maximum and minimum temperature. Bull. Am. Meteorol. Soc. 1993, 74, 1007–1034. [Google Scholar] [CrossRef]
- Braganza, K.; Karoly, D.J.; Arblaster, J.M. Diurnal temperature range as an index of global climate change during the twentieth century. Geophys. Res. Lett. 2004, 31, L13217. [Google Scholar] [CrossRef]
- Stine, A.R.; Huybers, P.; Fung, I.Y. Changes in the phase of the annual cycle of surface temperature. Nature 2009, 457, 435–440. [Google Scholar] [CrossRef] [PubMed] [Green Version]
- Thorne, P.W.; Menne, M.J.; Williams, C.N.; Rennie, J.J.; Lawrimore, J.H.; Vose, R.S.; Peterson, T.C.; Durre, I.; Davy, R.; Esau, I.; et al. Reassessing changes in diurnal temperature range: A new data set and characterization of data biases. J. Geophys. Res. Atmos. 2016, 121, 5115–5137. [Google Scholar] [CrossRef]
- Hartmann, D.L.; Klein Tank, A.M.; Rusticucci, M.; Alexander, L.V.; Brönnimann, S.; Charabi, Y.A.R.; Dentener, F.J.; Dlugokencky, E.J.; Easterling, D.R.; Kaplan, A.; et al. Observations: Atmosphere and Surface. In Climate Change 2013: The Physical Science Basis. Contribution of Working Group I to the Fifth Assessment Report of the Intergovernmental Panel on Climate Change; Stocker, T.F., Qin, D., Plattner, G.K., Tignor, M.M., Allen, S.K., Boschung, J., Nauels, A., Xia, Y., Bex, V., Midgley, P.M., Eds.; Cambridge University Press: Cambridge, UK, 2013; pp. 159–254. [Google Scholar]
- Stainforth, D.A.; Chapman, S.C.; Watkins, N.W. Mapping climate change in European temperature distributions. Environ. Res. Lett. 2013, 8, 034031. [Google Scholar] [CrossRef]
- Travis, D.J.; Carleton, A.M.; Lauritsen, R.G. Regional variations in U.S. diurnal temperature range for the 11–14 September 2001 aircraft groundings: Evidence of jet contrail influence on climate. J. Clim. 2004, 17, 1123–1134. [Google Scholar] [CrossRef]
- Ramanathan, V.; Ramana, M.V.; Roberts, G.; Kim, D.; Corrigan, C.; Chung, C.; Winker, D. Warming trends in Asia amplified by brown cloud solar absorption. Nature 2007, 448, 575–578. [Google Scholar] [CrossRef] [PubMed]
- Cohan, D.S.; Krakauer, N.Y.; Corbett, J.J.; Rife, D.; Zhang, R.; Halberstadt, A.R.; Parks, L.Y. Could Cuts in Sulfur from Coal and Ships Help Explain the 2015 Spurt in Northern Hemisphere Temperatures? Earthzine, 20 May 2016. [Google Scholar]
- Krakauer, N.Y.; Cook, B.I.; Puma, M.J. Contribution of soil moisture feedback to hydroclimatic variability. Hydrol. Earth Syst. Sci. 2010, 14, 505–520. [Google Scholar] [CrossRef]
- Dai, A. Drought under global warming: A review. Wiley Interdiscip. Rev. Clim. Chang. 2011, 2, 45–65. [Google Scholar] [CrossRef]
- Hirschi, M.; Seneviratne, S.I.; Alexandrov, V.; Boberg, F.; Boroneant, C.; Christensen, O.B.; Formayer, H.; Orlowsky, B.; Stepanek, P. Observational evidence for soil-moisture impact on hot extremes in southeastern Europe. Nat. Geosci. 2011, 4, 17–21. [Google Scholar] [CrossRef]
- Philip, S.Y.; Kew, S.F.; Hauser, M.; Guillod, B.P.; Teuling, A.J.; Whan, K.; Uhe, P.; Oldenborgh, G.J.v. Western US high June 2015 temperatures and their relation to global warming and soil moisture. In Climate Dynamics; Springer: New York, NY, USA, 2017; pp. 1–15. [Google Scholar]
- Bonan, G.B. Observational evidence for reduction of daily maximum temperature by croplands in the Midwest United States. J. Clim. 2001, 14, 2430–2442. [Google Scholar] [CrossRef]
- Lobell, D.B.; Bonfils, C.; Faurès, J.M. The role of irrigation expansion in past and future temperature trends. Earth Interact. 2008, 12, 1–11. [Google Scholar] [CrossRef]
- Cook, B.I.; Puma, M.J.; Krakauer, N.Y. Irrigation induced surface cooling in the context of modern and increased greenhouse gas forcing. Clim. Dyn. 2011, 37, 1587–1600. [Google Scholar] [CrossRef]
- Alexander, L.V.; Zhang, X.; Peterson, T.C.; Caesar, J.; Gleason, B.; Klein Tank, A.M.G.; Haylock, M.; Collins, D.; Trewin, B.; Rahimzadeh, F.; et al. Global observed changes in daily climate extremes of temperature and precipitation. J. Geophys. Res. 2006, 111, D05109. [Google Scholar] [CrossRef]
- Haylock, M.R.; Hofstra, N.; Klein Tank, A.M.G.; Klok, E.J.; Jones, P.D.; New, M. A European daily high-resolution gridded data set of surface temperature and precipitation for 1950-2006. J. Geophys. Res. 2008, 113. [Google Scholar] [CrossRef]
- Hofstra, N.; Haylock, M.; New, M.; Jones, P.D. Testing E-OBS European high-resolution gridded data set of daily precipitation and surface temperature. J. Geophys. Res. 2009, 114. [Google Scholar] [CrossRef]
- Oyler, J.W.; Ballantyne, A.; Jencso, K.; Sweet, M.; Running, S.W. Creating a topoclimatic daily air temperature dataset for the conterminous United States using homogenized station data and remotely sensed land skin temperature. Int. J. Climatol. 2015, 35, 2258–2279. [Google Scholar] [CrossRef]
Figure 1.
Locations of Daily Global Historical Climatology Network (GHCN-Daily) stations used. ‘Hotter’ marker colors denote locally higher station density.
Figure 1.
Locations of Daily Global Historical Climatology Network (GHCN-Daily) stations used. ‘Hotter’ marker colors denote locally higher station density.
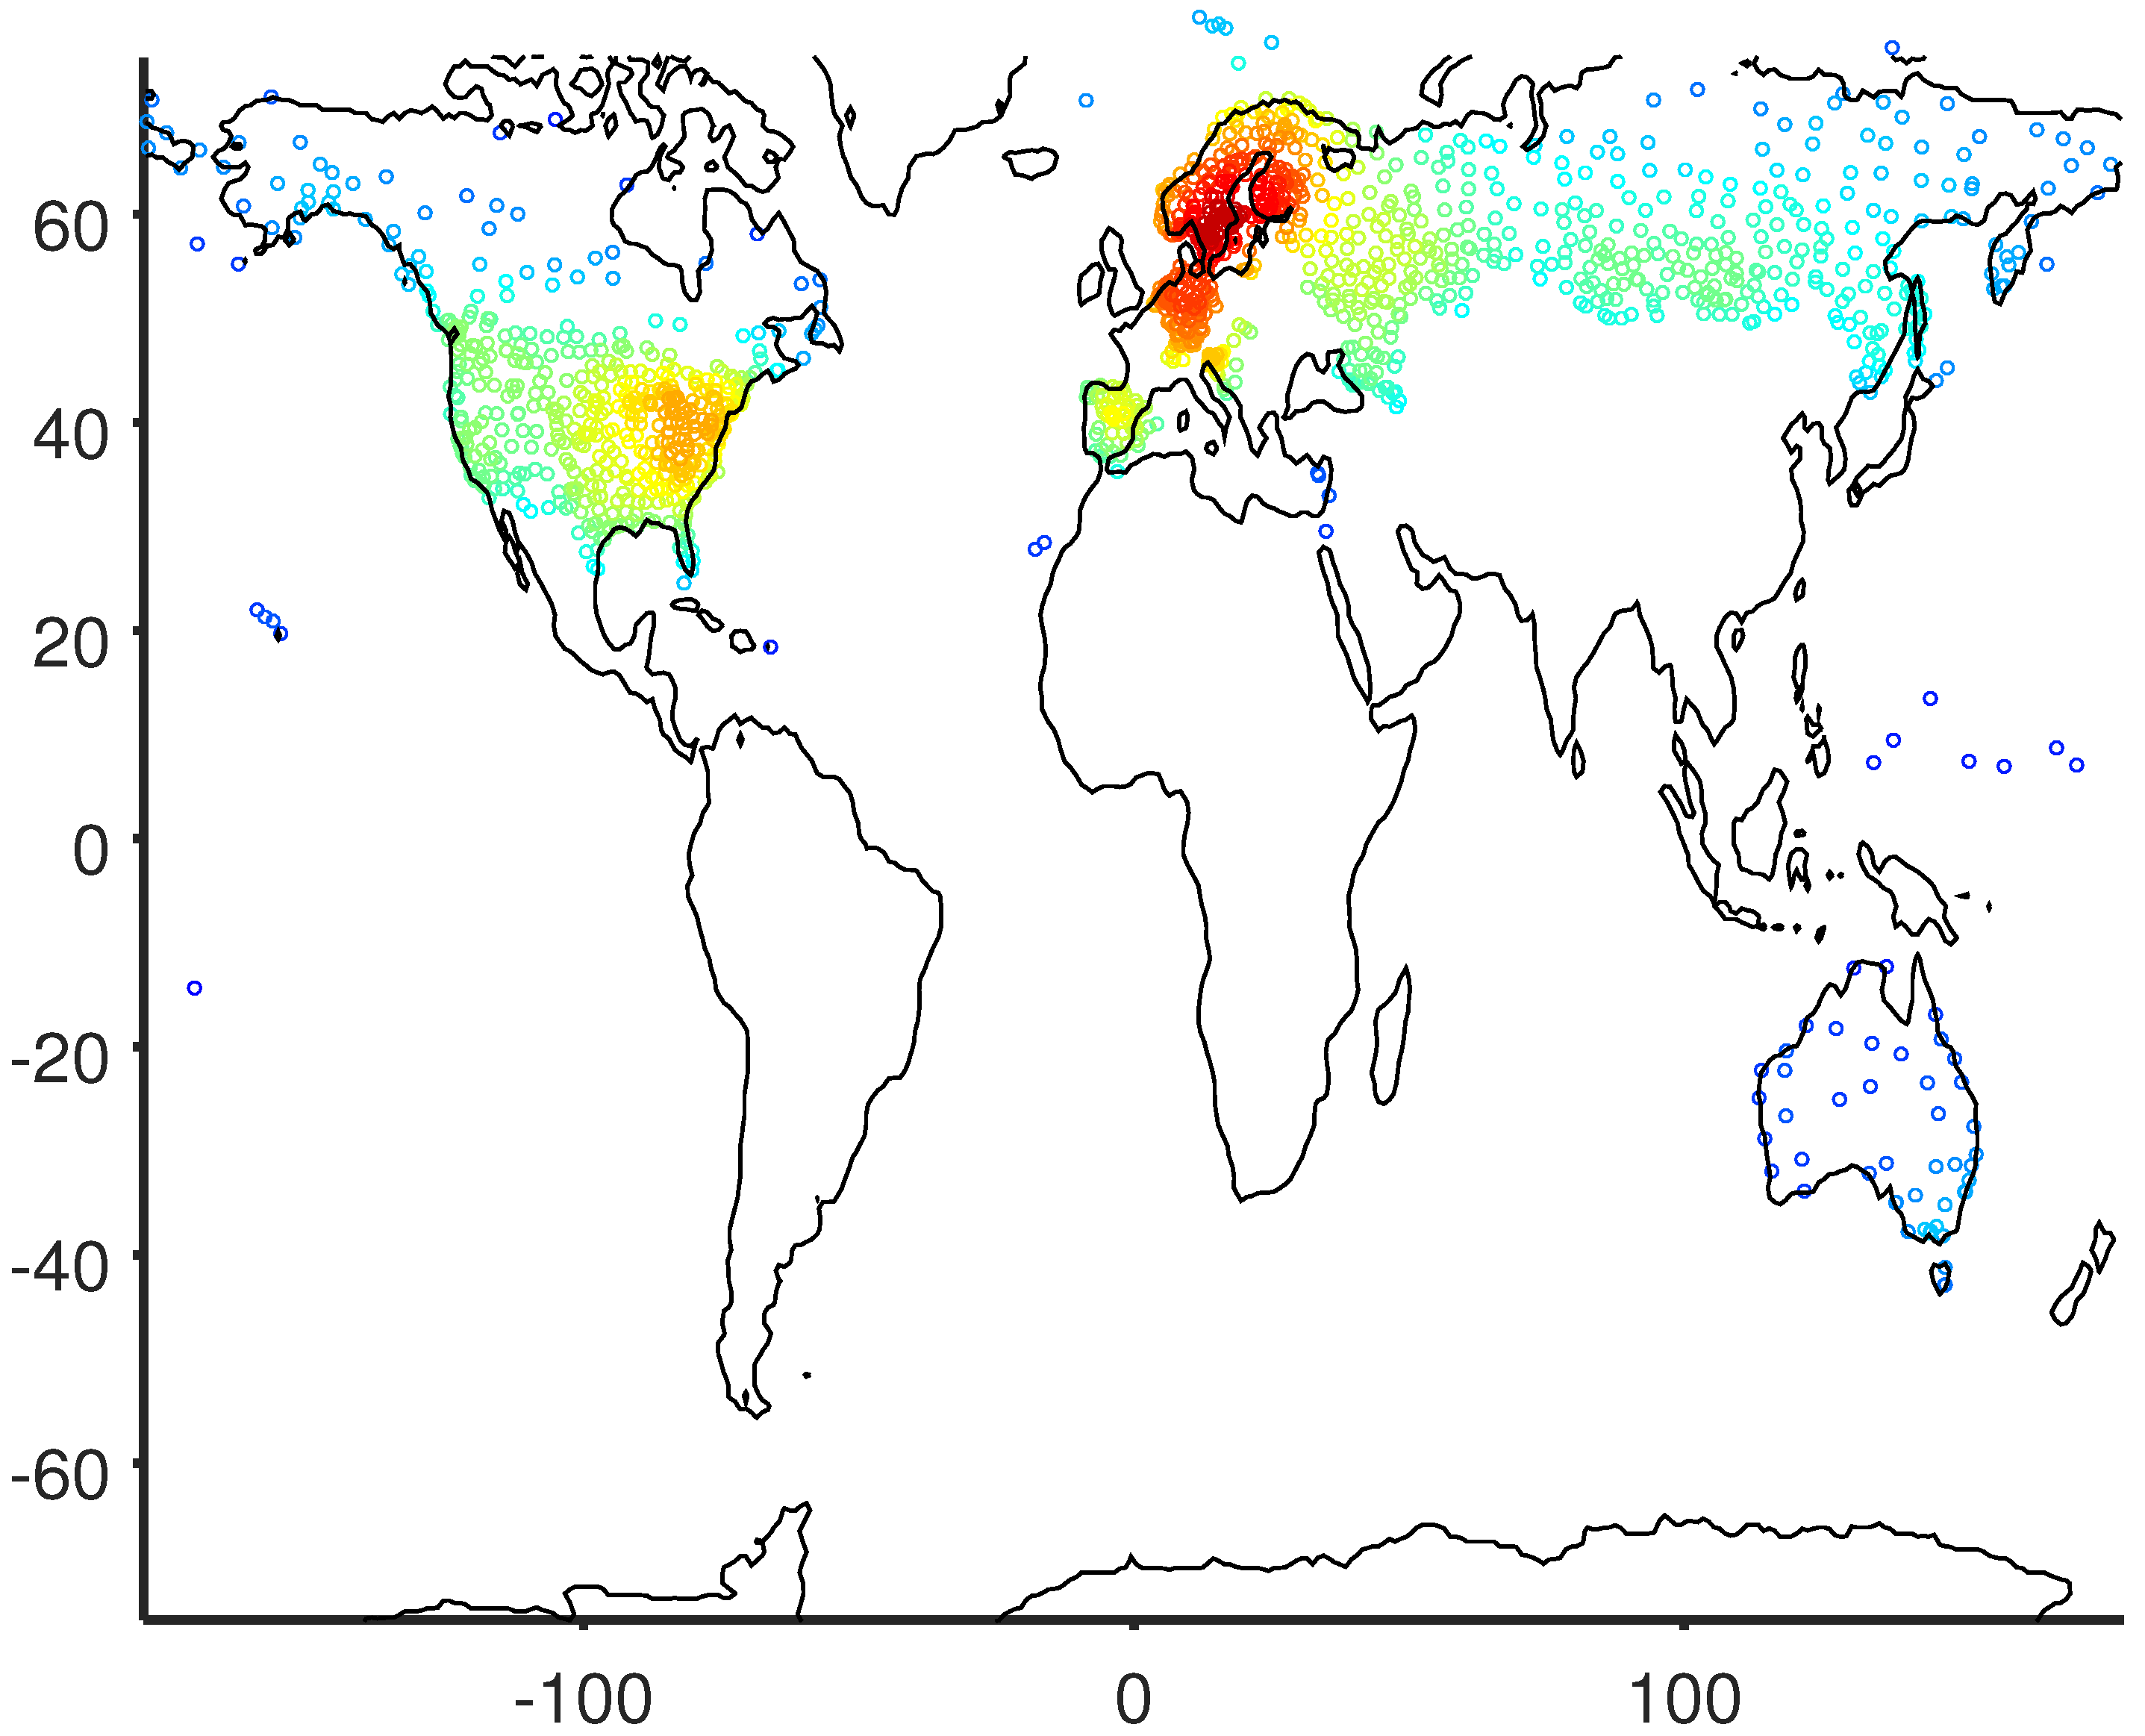
Figure 2.
Smoothed global mean anomalies (over stations) in annual mean and annual minimum temperatures (1950–2016), expressed relative to the 1900 smoothed value. The dashed lines show 95% confidence intervals of the smoothed values.
Figure 2.
Smoothed global mean anomalies (over stations) in annual mean and annual minimum temperatures (1950–2016), expressed relative to the 1900 smoothed value. The dashed lines show 95% confidence intervals of the smoothed values.
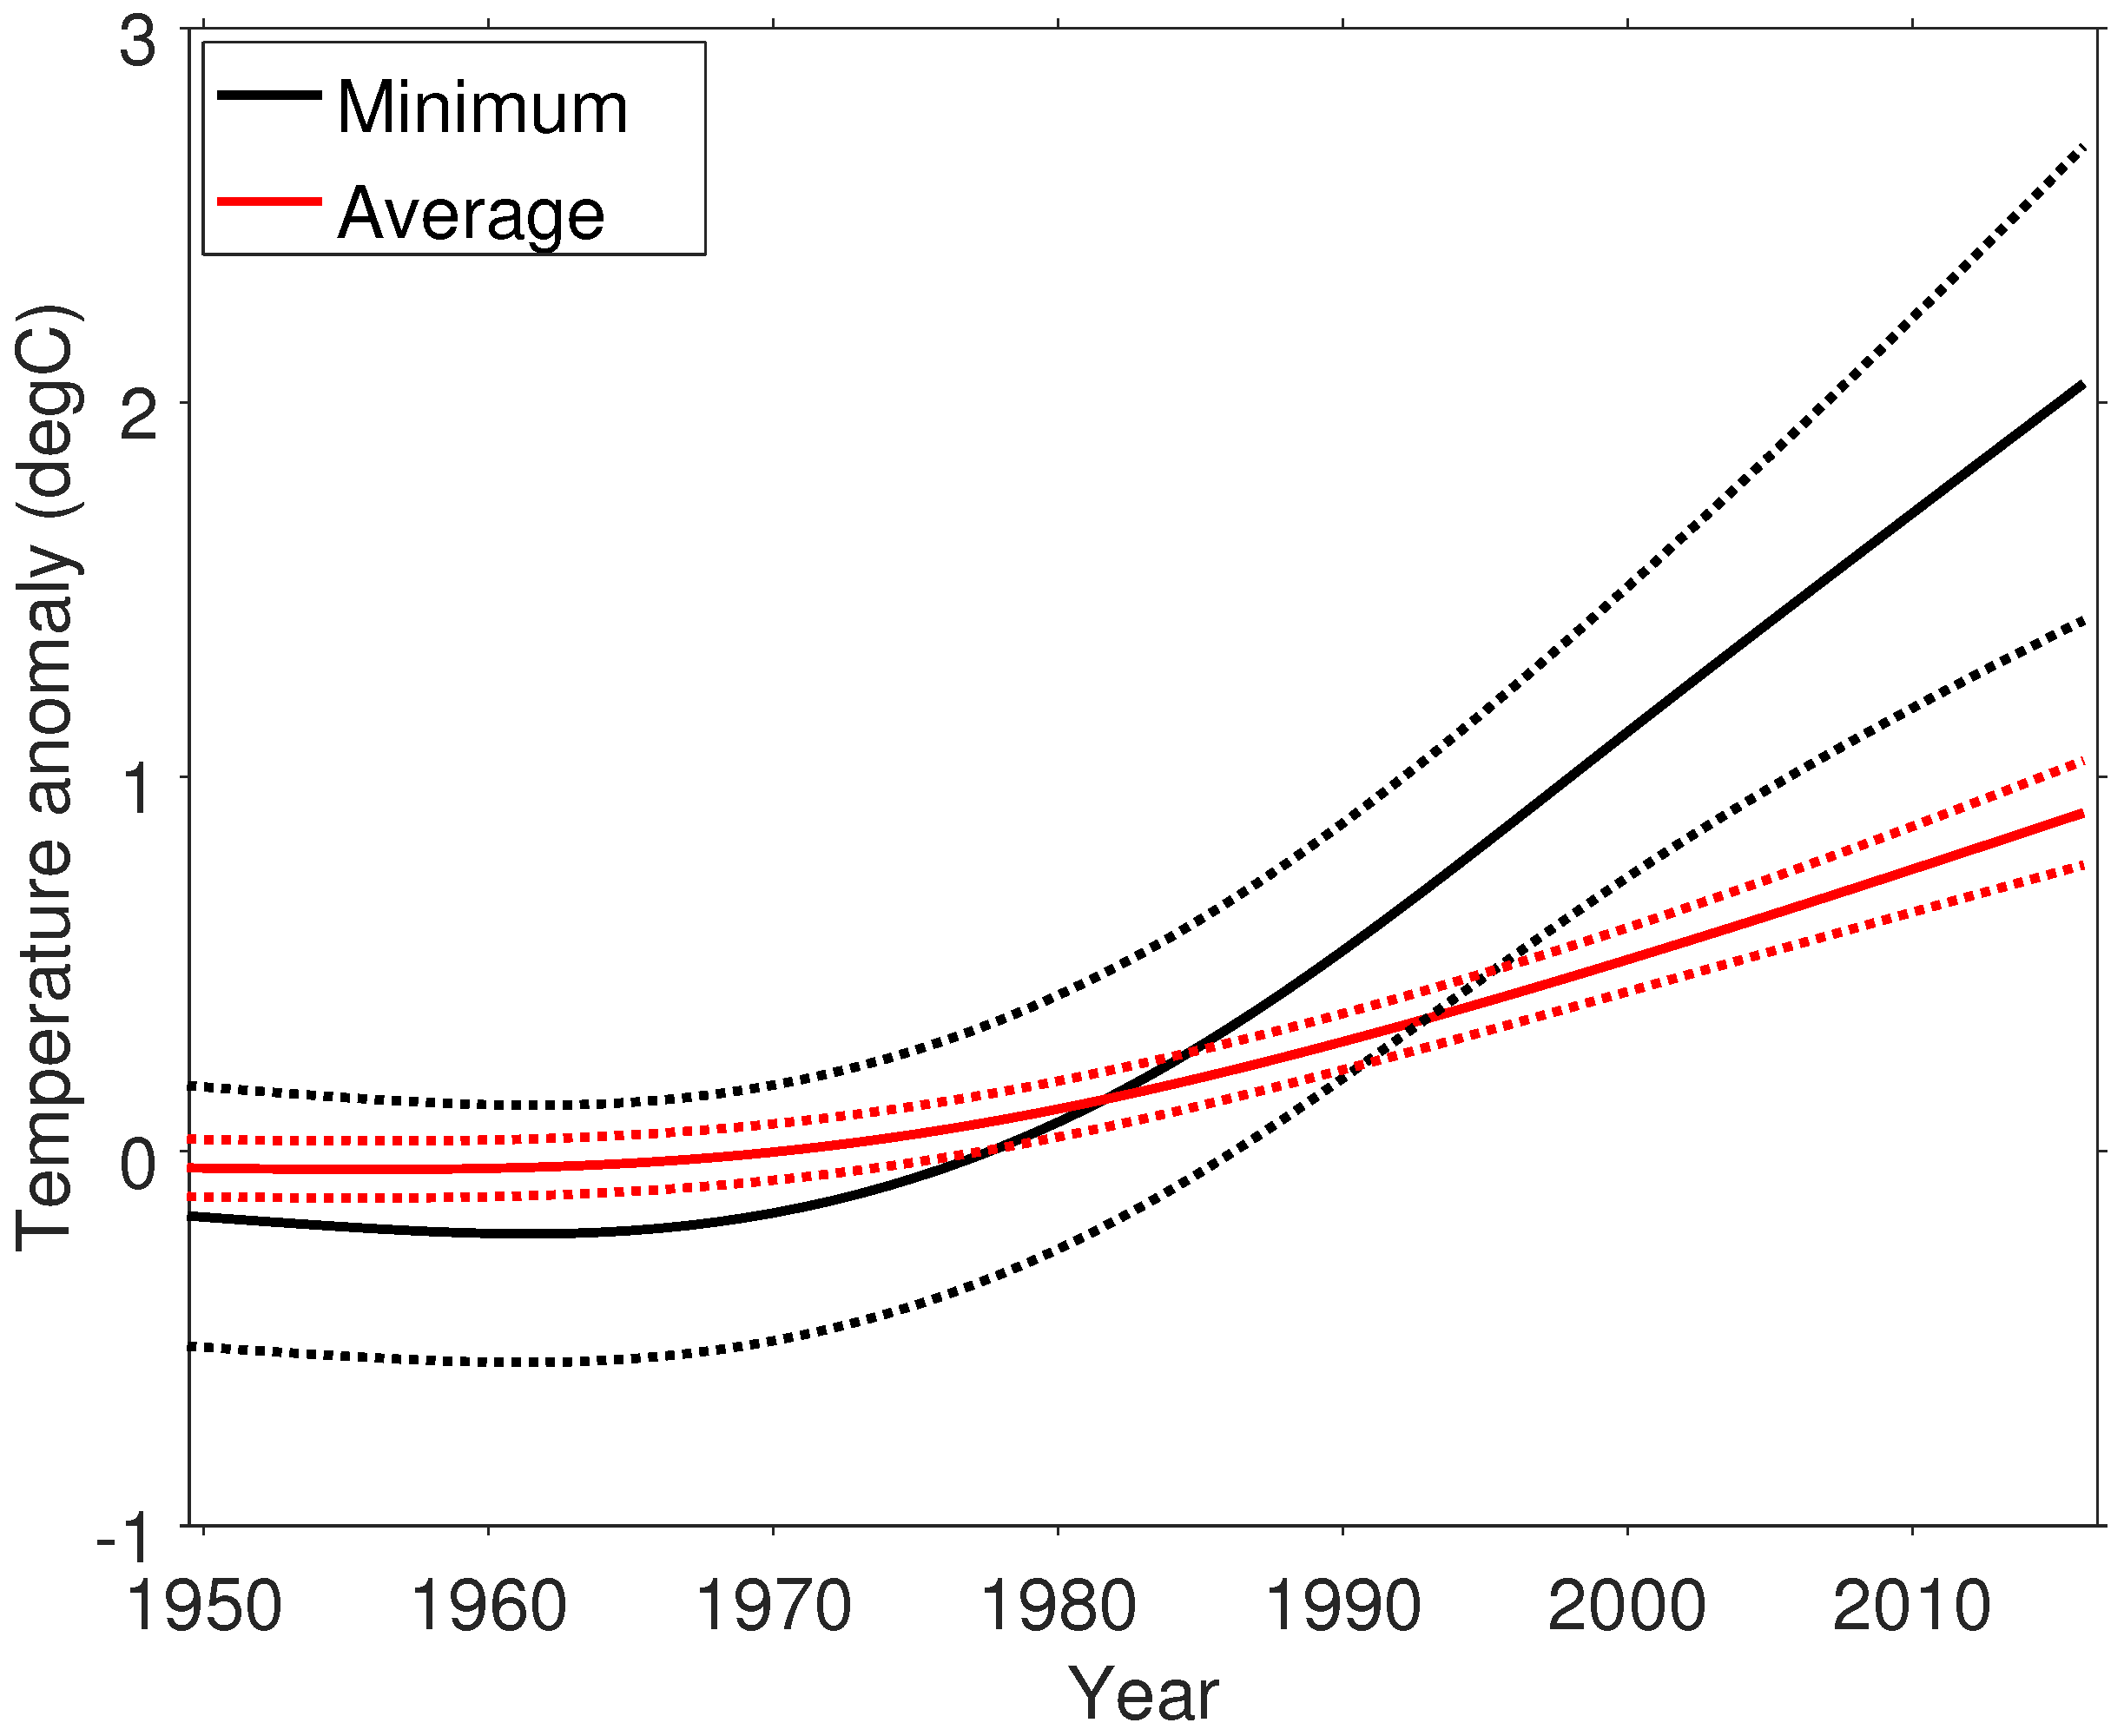
Figure 3.
Increase in annual minimum temperature (°C) over 1970–2016, averaged on a 3° grid for visualization. Grid cells with no stations are left blank. The color scale is centered on 0, and the interval shown in the color bar covers 95% of the observations.
Figure 3.
Increase in annual minimum temperature (°C) over 1970–2016, averaged on a 3° grid for visualization. Grid cells with no stations are left blank. The color scale is centered on 0, and the interval shown in the color bar covers 95% of the observations.

Figure 4.
Mean increase in annual minimum temperature (black line) and in annual mean temperature (red line) over 1970–2016, as a function of climatological (1976–2005) annual minimum temperature. Dashed lines show 95% confidence intervals of the smoothed values.
Figure 4.
Mean increase in annual minimum temperature (black line) and in annual mean temperature (red line) over 1970–2016, as a function of climatological (1976–2005) annual minimum temperature. Dashed lines show 95% confidence intervals of the smoothed values.

Figure 5.
Mean warming in annual minimum temperature over 1970–2016, as a function of climatology (1976–2005) using annual minimum temperature, calculated separately for the Eastern and Western Hemisphere midlatitudes. Dashed lines show 95% confidence intervals of the smoothed relationships.
Figure 5.
Mean warming in annual minimum temperature over 1970–2016, as a function of climatology (1976–2005) using annual minimum temperature, calculated separately for the Eastern and Western Hemisphere midlatitudes. Dashed lines show 95% confidence intervals of the smoothed relationships.

Figure 6.
Annual minimum temperature averaged over GHCN-Daily stations for 1970–2016, along with the smoothing spline fit and its 95% confidence interval.
Figure 6.
Annual minimum temperature averaged over GHCN-Daily stations for 1970–2016, along with the smoothing spline fit and its 95% confidence interval.
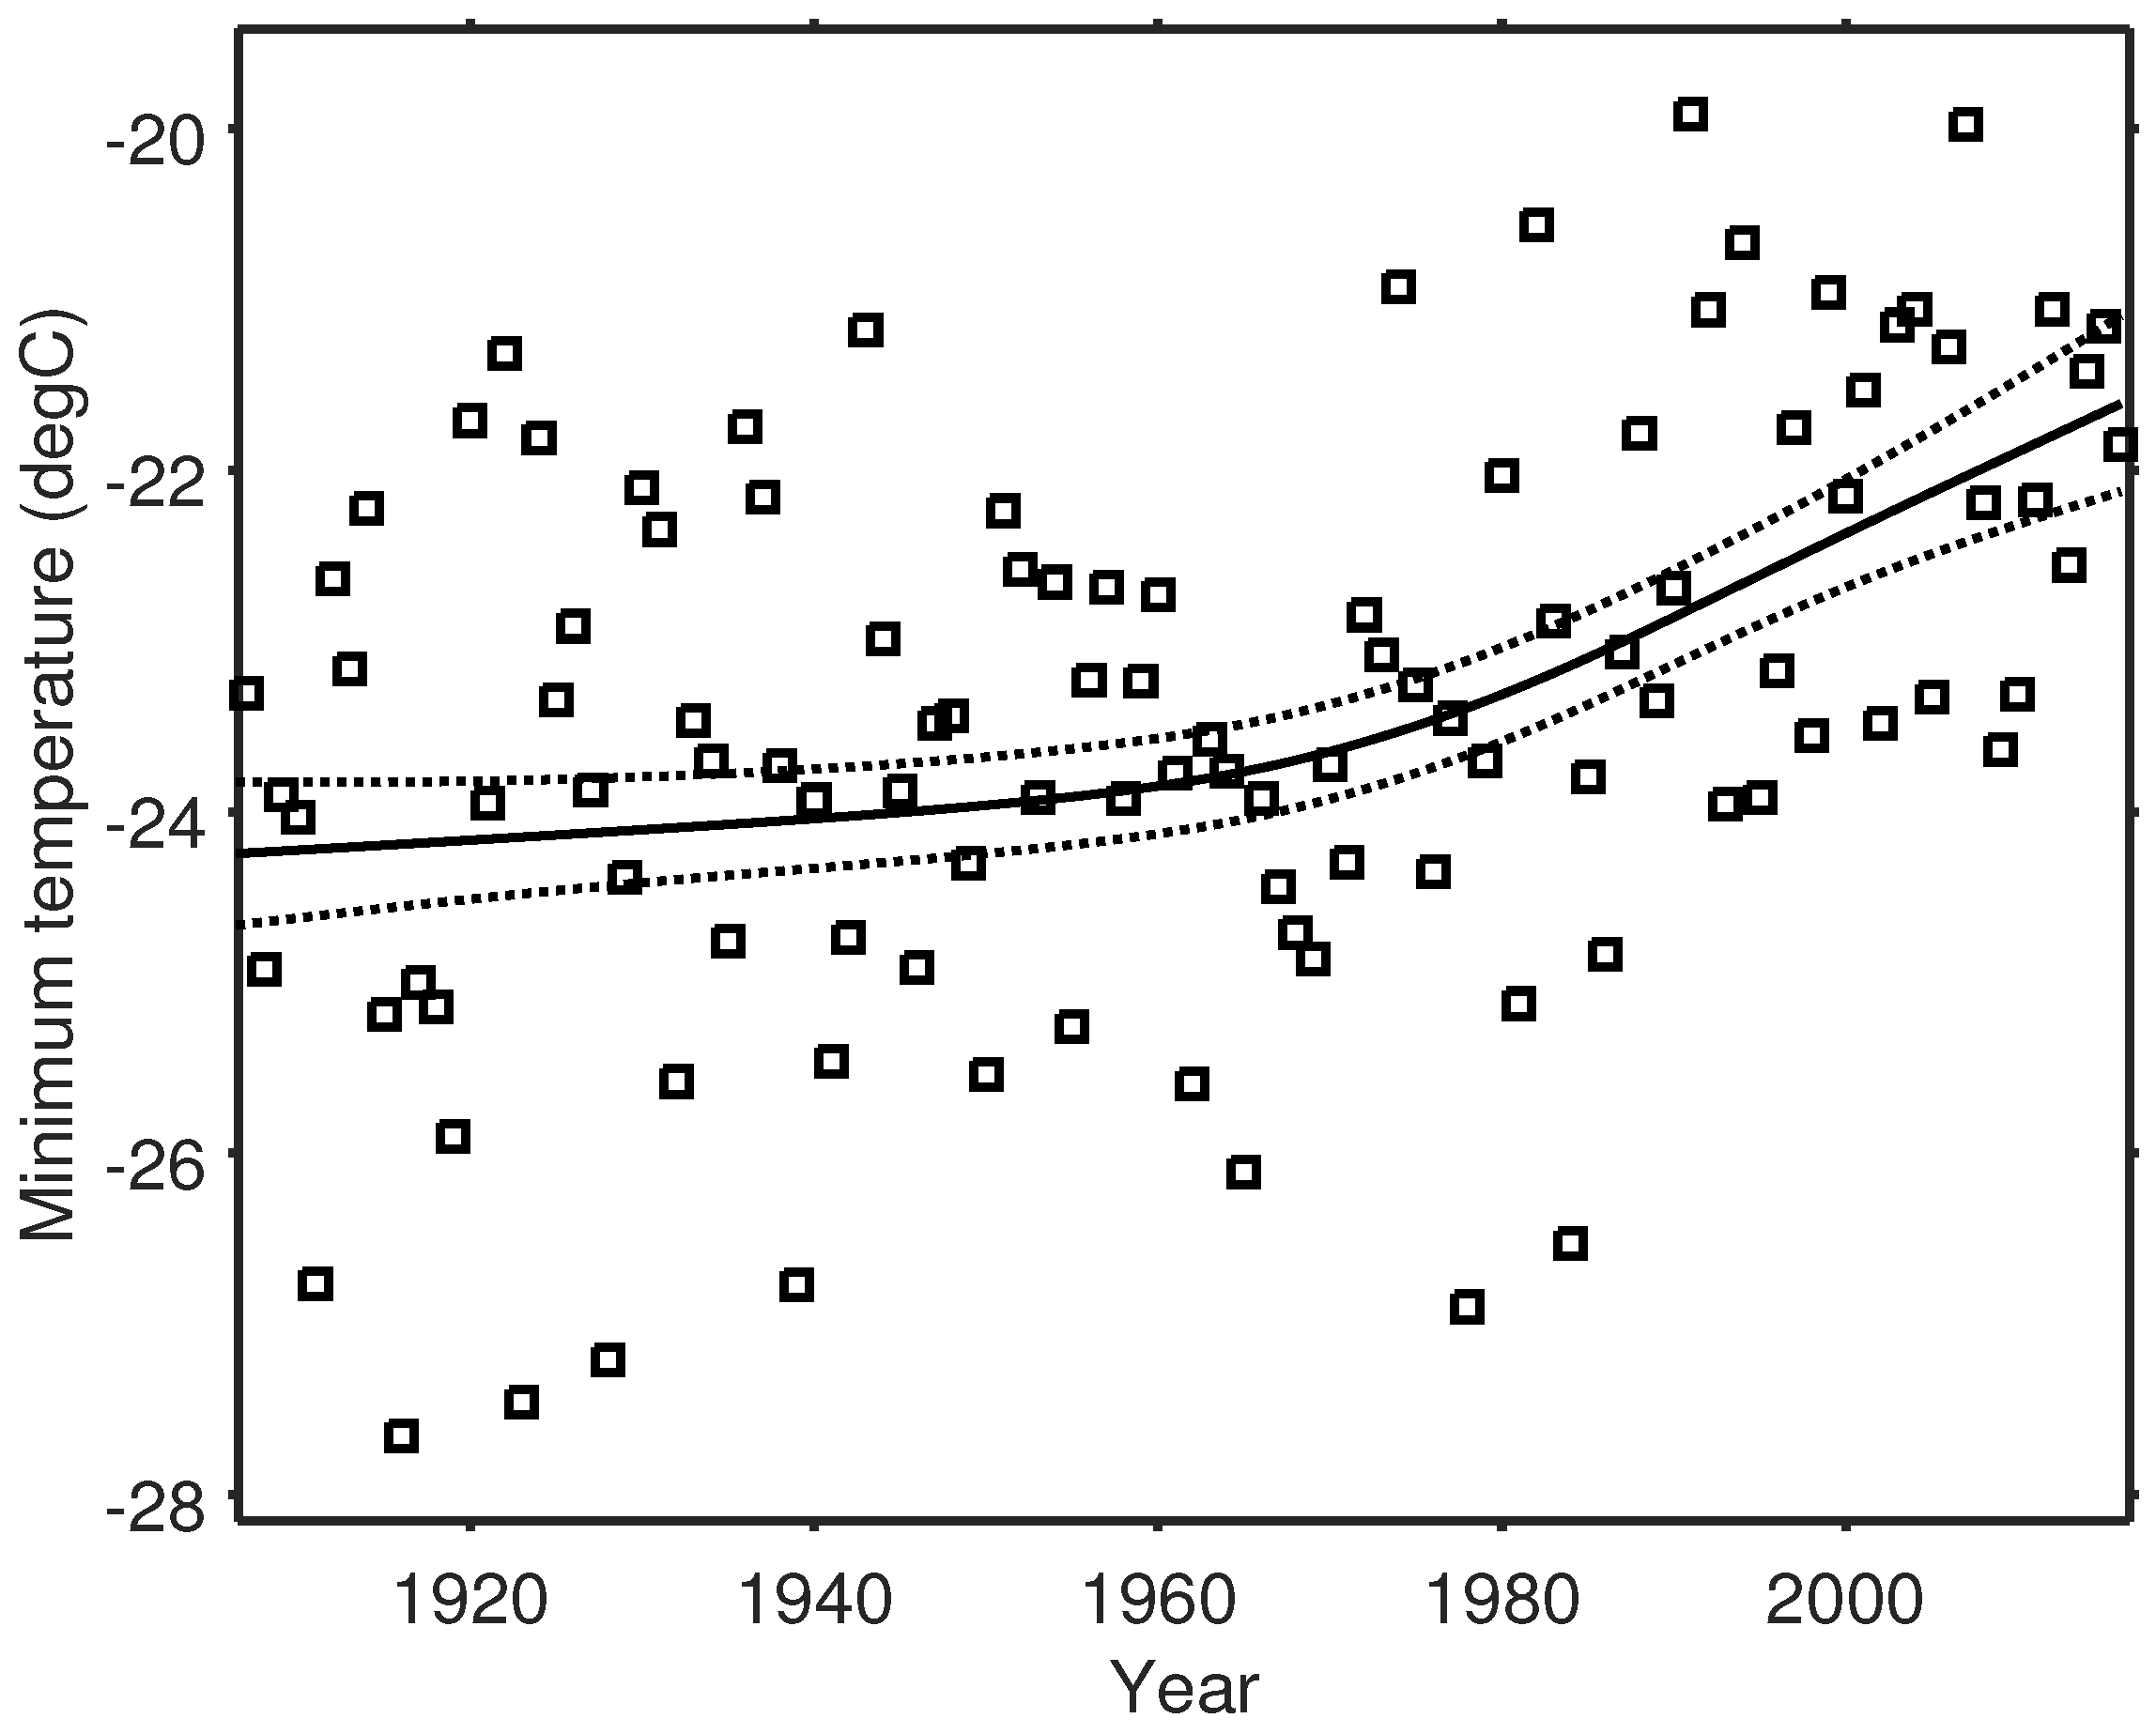
Figure 7.
Map of recent (2012–2016) anomalies in annual minimum temperature (°C), averaged on a 3° grid.
Figure 7.
Map of recent (2012–2016) anomalies in annual minimum temperature (°C), averaged on a 3° grid.
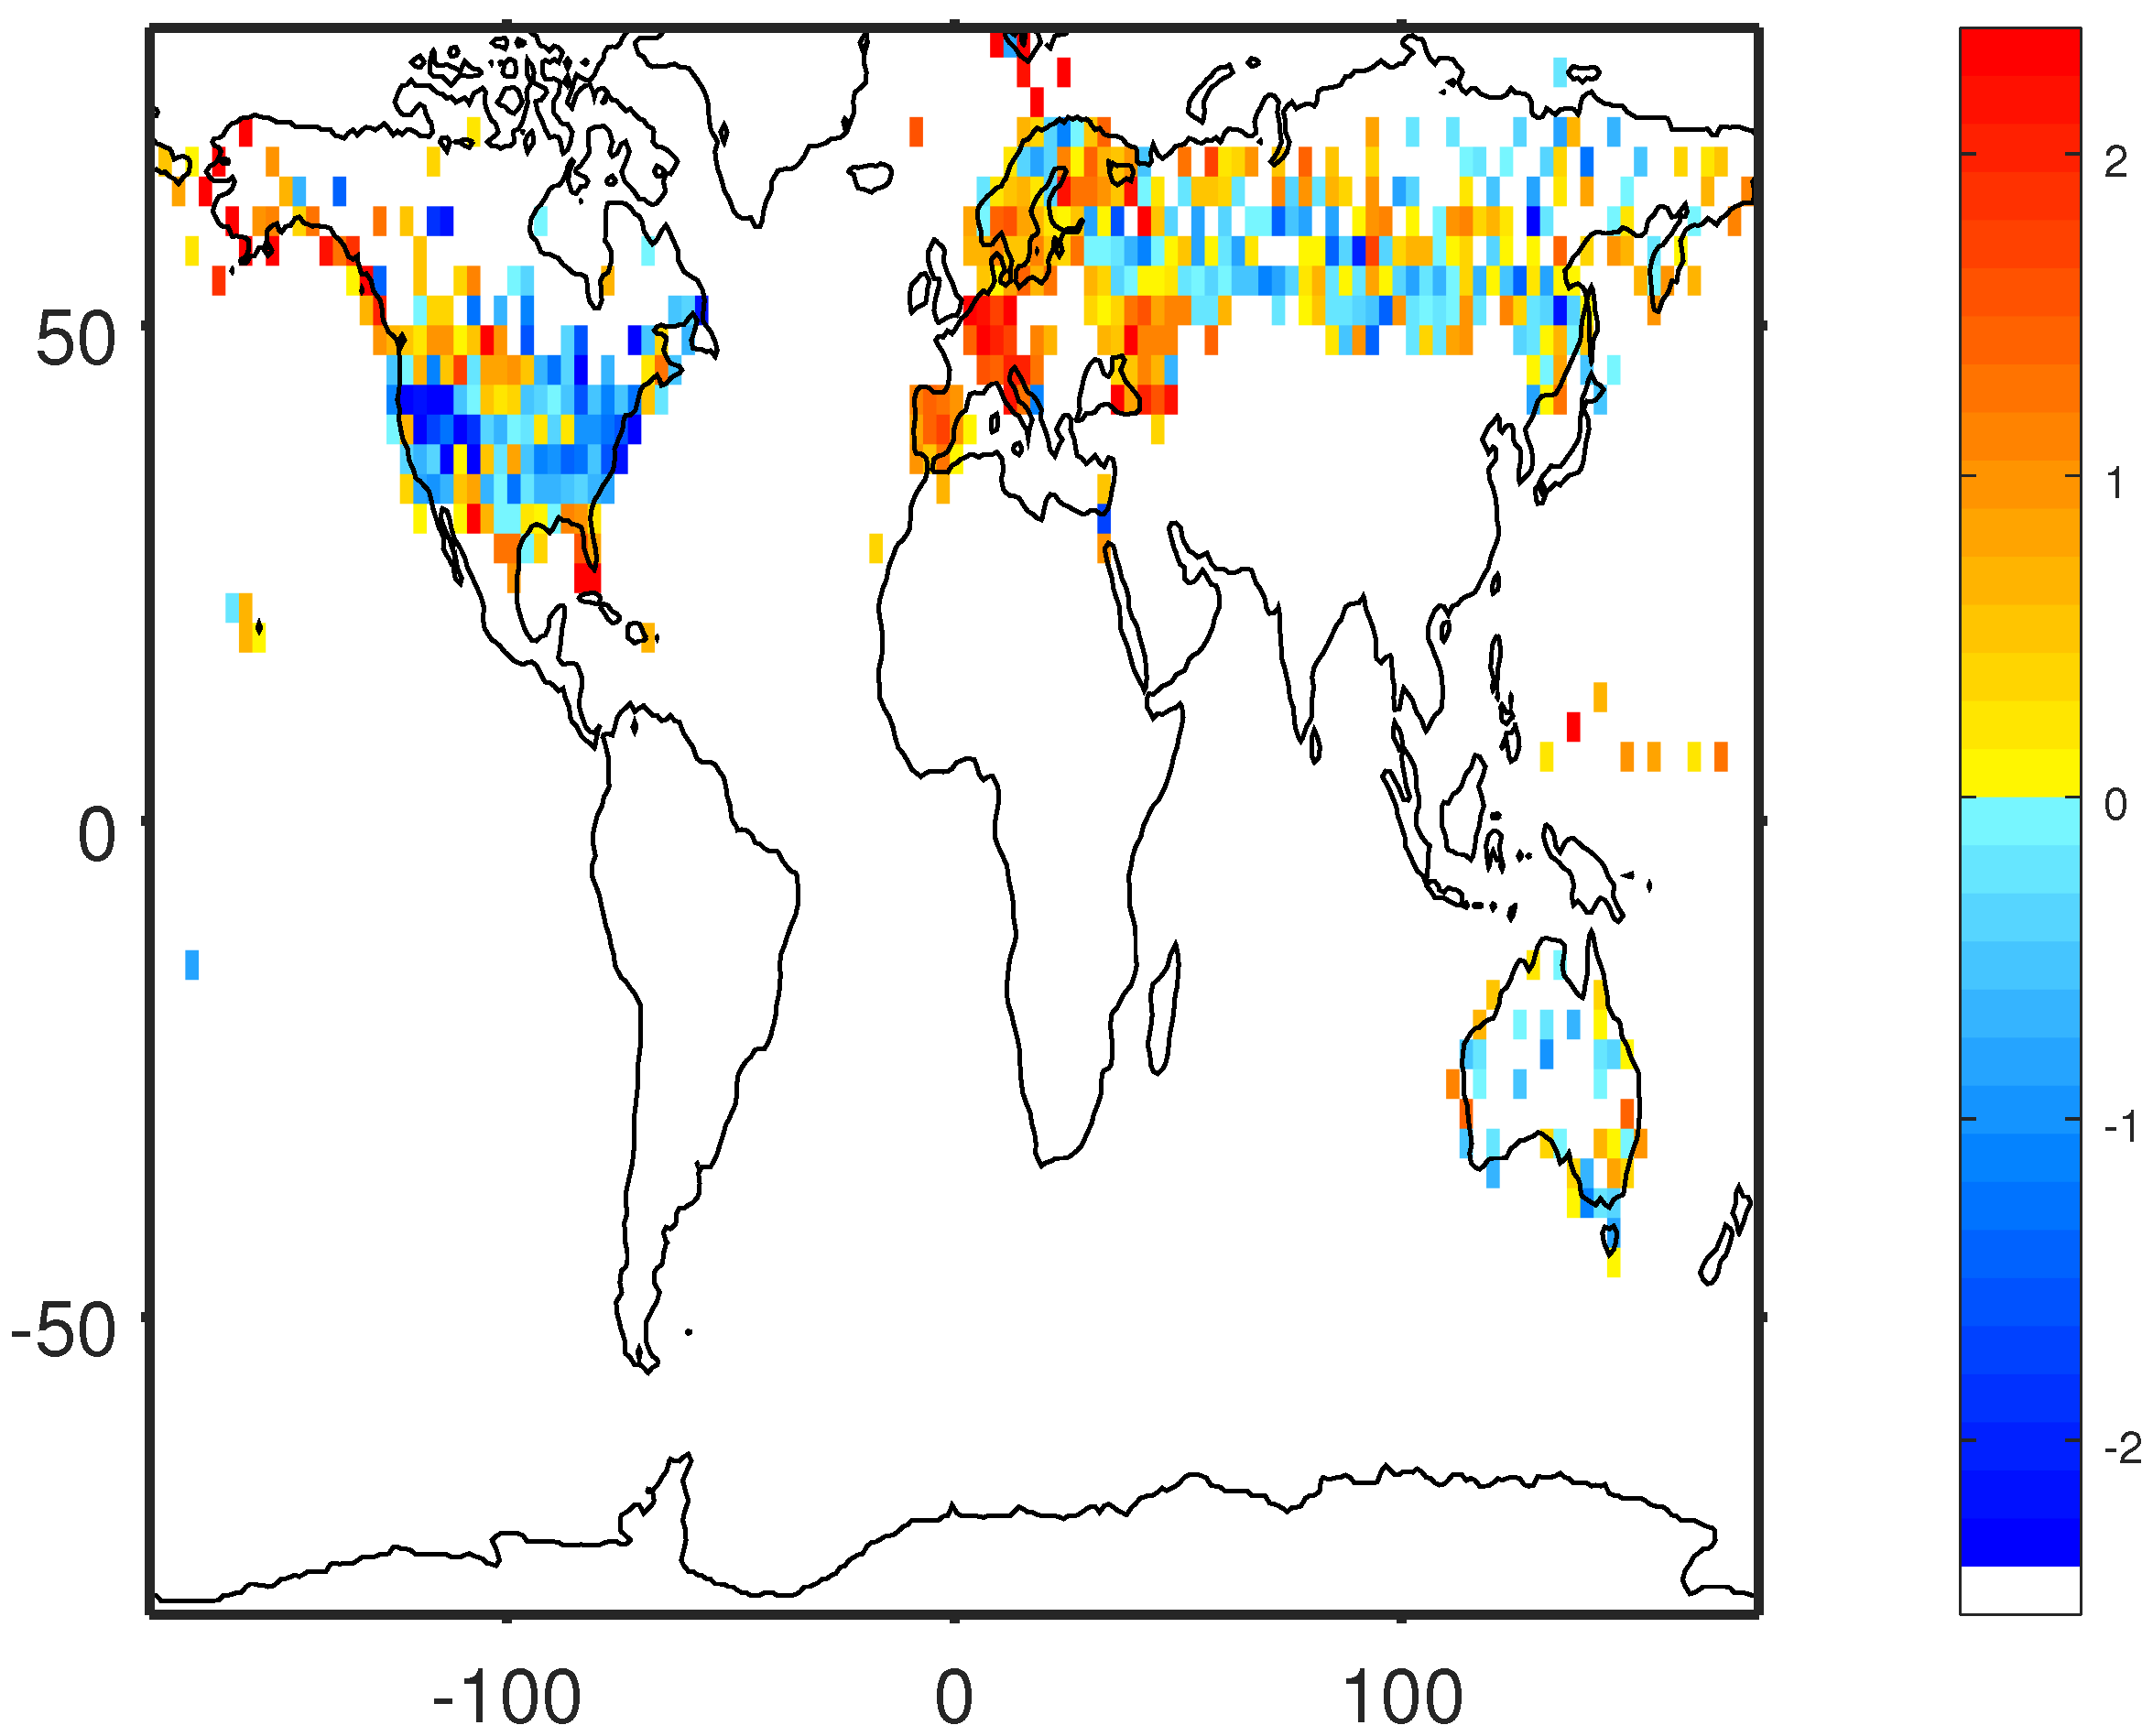
Figure 8.
Mean annual minimum temperature averaged across stations in Eastern North America (squares), and smoothed trends with 95% confidence intervals using data only up to 2011 (blue line) or all data up to 2016 (black line).
Figure 8.
Mean annual minimum temperature averaged across stations in Eastern North America (squares), and smoothed trends with 95% confidence intervals using data only up to 2011 (blue line) or all data up to 2016 (black line).


Table 1.
Mean temperature increase across stations (°C), 1970–2016. Minimum: annual minimum temperature. Mean: annual mean temperature. Midlat: northern midlatitudes, 30°–60° N. EH: Eastern Hemisphere. WH: Western Hemisphere. n: Number of stations. Confidence intervals of 95% are given.
Table 1.
Mean temperature increase across stations (°C), 1970–2016. Minimum: annual minimum temperature. Mean: annual mean temperature. Midlat: northern midlatitudes, 30°–60° N. EH: Eastern Hemisphere. WH: Western Hemisphere. n: Number of stations. Confidence intervals of 95% are given.
| n | Minimum | Mean | |
|---|---|---|---|
| All | 1428 | 2.04 ± 0.58 | 1.16 ± 0.15 |
| Midlat | 1049 | 1.94 ± 0.60 | 1.09 ± 0.15 |
| EH | 544 | 2.00 ± 0.85 | 1.30 ± 0.20 |
| WH | 505 | 2.22 ± 0.72 | 0.91 ± 0.16 |
© 2018 by the author. Licensee MDPI, Basel, Switzerland. This article is an open access article distributed under the terms and conditions of the Creative Commons Attribution (CC BY) license (http://creativecommons.org/licenses/by/4.0/).
Share and Cite
MDPI and ACS Style
Krakauer, N.Y. Shifting Hardiness Zones: Trends in Annual Minimum Temperature. Climate 2018, 6, 15. https://doi.org/10.3390/cli6010015
AMA Style
Krakauer NY. Shifting Hardiness Zones: Trends in Annual Minimum Temperature. Climate. 2018; 6(1):15. https://doi.org/10.3390/cli6010015
Chicago/Turabian StyleKrakauer, Nir Y. 2018. "Shifting Hardiness Zones: Trends in Annual Minimum Temperature" Climate 6, no. 1: 15. https://doi.org/10.3390/cli6010015
Note that from the first issue of 2016, this journal uses article numbers instead of page numbers. See further details here.