Recent Changes of Floods and Related Impacts in Niger Based on the ANADIA Niger Flood Database
by

Edoardo Fiorillo
1,*, 
Alfonso Crisci
1,
Hassimou Issa
2,
Giampiero Maracchi
1,
Marco Morabito
1 and
Vieri Tarchiani
1,* 1
Institute of Biometeorology—National Research Council (IBIMET-CNR), Via G. Caproni 8, 50145 Florence, Italy
2
Niger Early Warning System Agency, BP 893 Niamey, Niger
*
Authors to whom correspondence should be addressed.
Climate 2018, 6(3), 59; https://doi.org/10.3390/cli6030059
Submission received: 22 May 2018
/
Revised: 25 June 2018
/
Accepted: 26 June 2018
/
Published: 3 July 2018
(This article belongs to the Special Issue Climate Services for Local Disaster Risk Reduction in Africa)
Abstract
:During the last two decades, the sub-Saharan region has experienced unusual floods that have differentially impacted the region. No official and precise data regarding flood damage and impacts on the population are available, and the magnitude of events are not easily evaluated. Most previous studies have investigated this new threat using data derived from local media sources or world disaster databases. The aim of this study was to provide the scientific community and policy makers with an updated and reliable referenced data source concerning floods in Niger between 1998 and 2015, at national, regional and sub-regional scales. Reliable information regarding floods was derived from the national official flood damage database (ANADIA DB) showing their impact on the country. During the investigated period, considerable numbers regarding flood impacts were found (about 4000 settlements and 1.7 million people were affected by floods). The analysis also indicates a sudden increase in flood impacts since 2010. Regions in the south-west (Tillabery, Dosso and Niamey district) are the most affected; however, this kind of risk involves the whole country, and some particularly vulnerable areas have been identified. A data modeling comprehensive framework based on remotely sensed rainfall (climate hazards group infrared precipitation with stations (CHIRPS)) and vegetation index (moderate resolution imagery spectroradiometer normalized difference vegetation index (MODIS NDVI)) datasets data along with census data were used to investigate which variables are most able to explain the recent and sudden Niger flood vulnerability detected at the departmental scale. Only a few statistically significant flood damage models were found (61 out of 297), due essentially to the non-linearity of the increase in damage time series compared to environmental and climatic trends. The population increase is the most significant variable at national level; however, at regional and sub-regional scales, different patterns provided evidence to identify local triggers for vulnerability.
1. Introduction
The Sahelian rural population is considered to be one of the most vulnerable on earth [1,2]. This vulnerability is partly caused by the variability of the West African monsoon, the main water resource for agriculture in these areas. During the 1970s and 1980s, the Sahelian population experienced several droughts with severe consequences [3,4]. Since the end of 20th century, Sahelian countries have begun suffering from the effects of heavy rains and devastating floods in many parts of the Niger basin.
The intensification of flood risk is related to a combination of factors, such as recovering discharges which raise flood probability, rapid population growth rates and widespread poverty, which reduce coping capacity and resilience. Increasing river discharge is recognized as being due to two main drivers: climatic variations and land cover changes. Variability in climate, and especially in rainfall, plays a significant role in discharge variation. Roudier et al. [5] analyzed the impacts of climate change on runoff in West Africa and concluded that runoff changes are strictly linked to changes in rainfall. Recent scientific results suggest that the decades of abnormally dry conditions in the Sahel have been reversed by positive anomalies in rainfall [6,7]. Moreover, researchers have reported a higher frequency of extreme events and a related higher proportion of the annual rainfall amount. Mouhamed et al. [8] stated that, during the 1960–2000 period, the cumulated rainfall of extremely wet days showed a positive trend in the West African Sahel and that extreme rain events had become more frequent during the last decade of the 20th century. Other studies [9,10] recorded an increase in both extreme rainfall events since the second half of the decade 2001–2010 and the proportion of annual heavy rainfall events. However, according to these authors, neither the number of events above certain thresholds nor the amount of rain falling during these events exceeded those observed during the 1950s and 1960s, before the drought period.
Favreau et al. [11] observed that in semiarid regions, land cover changes may result in modifications to the water balance. In a context of the so-called “regreening” of the Sahel, the recent increase in seasonal greenness at the Sahelian regional scale [12], investigations highlighted that this vegetation evolution is not spatially uniform, and large areas remain affected by degradation. Descroix et al. [13] observed that land degradation in the Sahelian part of West Africa, due to human pressure on the environment (the significant increase in cropped area and disappearance of natural bushes and landscapes, for example), has led to severe soil crusting. Higher runoff as a long-term consequence of land clearance and soil crusting was described at various scales in the Sahel, from small watersheds of a few tens of square kilometers [14] to larger catchments of up to 21,000 km2 [15]. Leblanc et al. [16] and Fiorillo et al. [17] showed how large natural vegetation areas had been cleared in the last decades, foremost to open up new areas for agriculture and secondly for firewood supply. These modifications reduce the amount of water needed for a flood-inducing rain event and contribute to an increase in flood hazard frequency.
Moreover, the Sahelian area is characterized by high population growth rates leading to increasing vulnerability. New settlements are established or urban areas expand in flood-prone zones where land is cheap or free [18]. In several cases, houses destroyed by floods were built in valley bottoms or in the pathway of drainage channels, exacerbating the damaging effects of rainfall and flooding. The causes of flood damage also include the effects of inadequate drainage facilities and poor construction materials. In addition, Tschakert et al. [19] provided evidence that the increased vulnerability of the population to catastrophic floods is also linked to the loss of traditional knowledge about flood adaptation.
To what extent each of these factors is responsible for the increase in flood risk in the Sahel is still debated and is not fully understood. Amogu et al. [20], Descroix et al. [21] and Séguis et al. [22] identified land cover changes as the main driver of increasing flood magnitudes, especially for the drier Sahelian parts of the Niger River basin. In contrast, Aich et al. [23] identified climate change and a return to wet conditions as the major driver. Moreover, nearly all of these studies focus on southern Niger, specifically southwestern (Tillabery and Dosso Regions and Niamey area). Few data are available, and insufficient analyses have been performed for other parts of the country that are also affected by floods, even if to a lesser extent.
In West African countries, data useful for characterizing climatic events, their consequences and impacts are often scarce and spatially inhomogeneous, and the same applies to flood data. In previous investigations, researchers analyzed flood time series mainly using information derived from newspapers and world disaster databases. Tarhule et al. [24] used information from newspaper accounts between 1970 and 2000 to analyze flood occurrence and impacts in the Sahel. Aich et al. [23] and Aich et al. [25] analyzed flood time series across the Niger River Basin derived from three different sources: the NatCatService of the Munich Reinsurance Company, the Emergency Events Database (EM-DAT) of the University of Leuven, Brussels and the Global Active Archive of Large Flood Events of the Dartmouth Flood Observatory. All data are based on media reviews of the respective organizations and the collection of data from official sources. As stated by the authors themselves, the numbers reported in these investigations often differ substantially between sources.
Reliable flood information is needed to improve the understanding of flood risks and impacts, to develop appropriate prevention and mitigation strategies, and provide a more complete picture of the vulnerability of the region to hydrological hazard. Since 1998, the Niger early warning system (Systeme d’Alerte Précoce—hereafter SAP) agency has collected flood data recording affected settlements and people, flood dates and related damage. Initially, these data were in most cases collected roughly at departmental or regional levels, in paper form and without homogeneous measurement units; since the first years of the last decade, the system has been refined and information on flooding is now collected at the settlement level in a standardized way. Since 2014, a specific relational database, called the ANADIA (French acronym for climate change adaptation, disaster prevention and agricultural development for food safety) Niger floods database, hereafter ANFD, has been developed in order to store data in digital format and allow the assessment of the impacts of floods. Exploiting the information issued by ANFD, the broader goal of this study is to provide the scientific community and policy-makers with an updated and reliable referenced data source concerning floods, assessing their impacts on humans and ecosystems in Niger between 1998 and 2015 at national, regional and sub-regional scales. This investigation also aims to contribute to the discussion regarding the causes and attributions of floods in the Sahel. In the first step, we analyzed the moderate resolution imagery spectroradiometer normalized difference vegetation index (MODIS NDVI) and climate hazards group infrared precipitation with stations (CHIRPS) maximum yearly rainfall pixel-wise trends during the time span from 2000 to 2015. Afterwards, a linear model analysis was performed to understand whether environmental and climatic parameters and population growth trends contributed to explaining the sharp increase of floods in the period investigated at a departmental scale.
2. Materials and Methods
2.1. Study Area
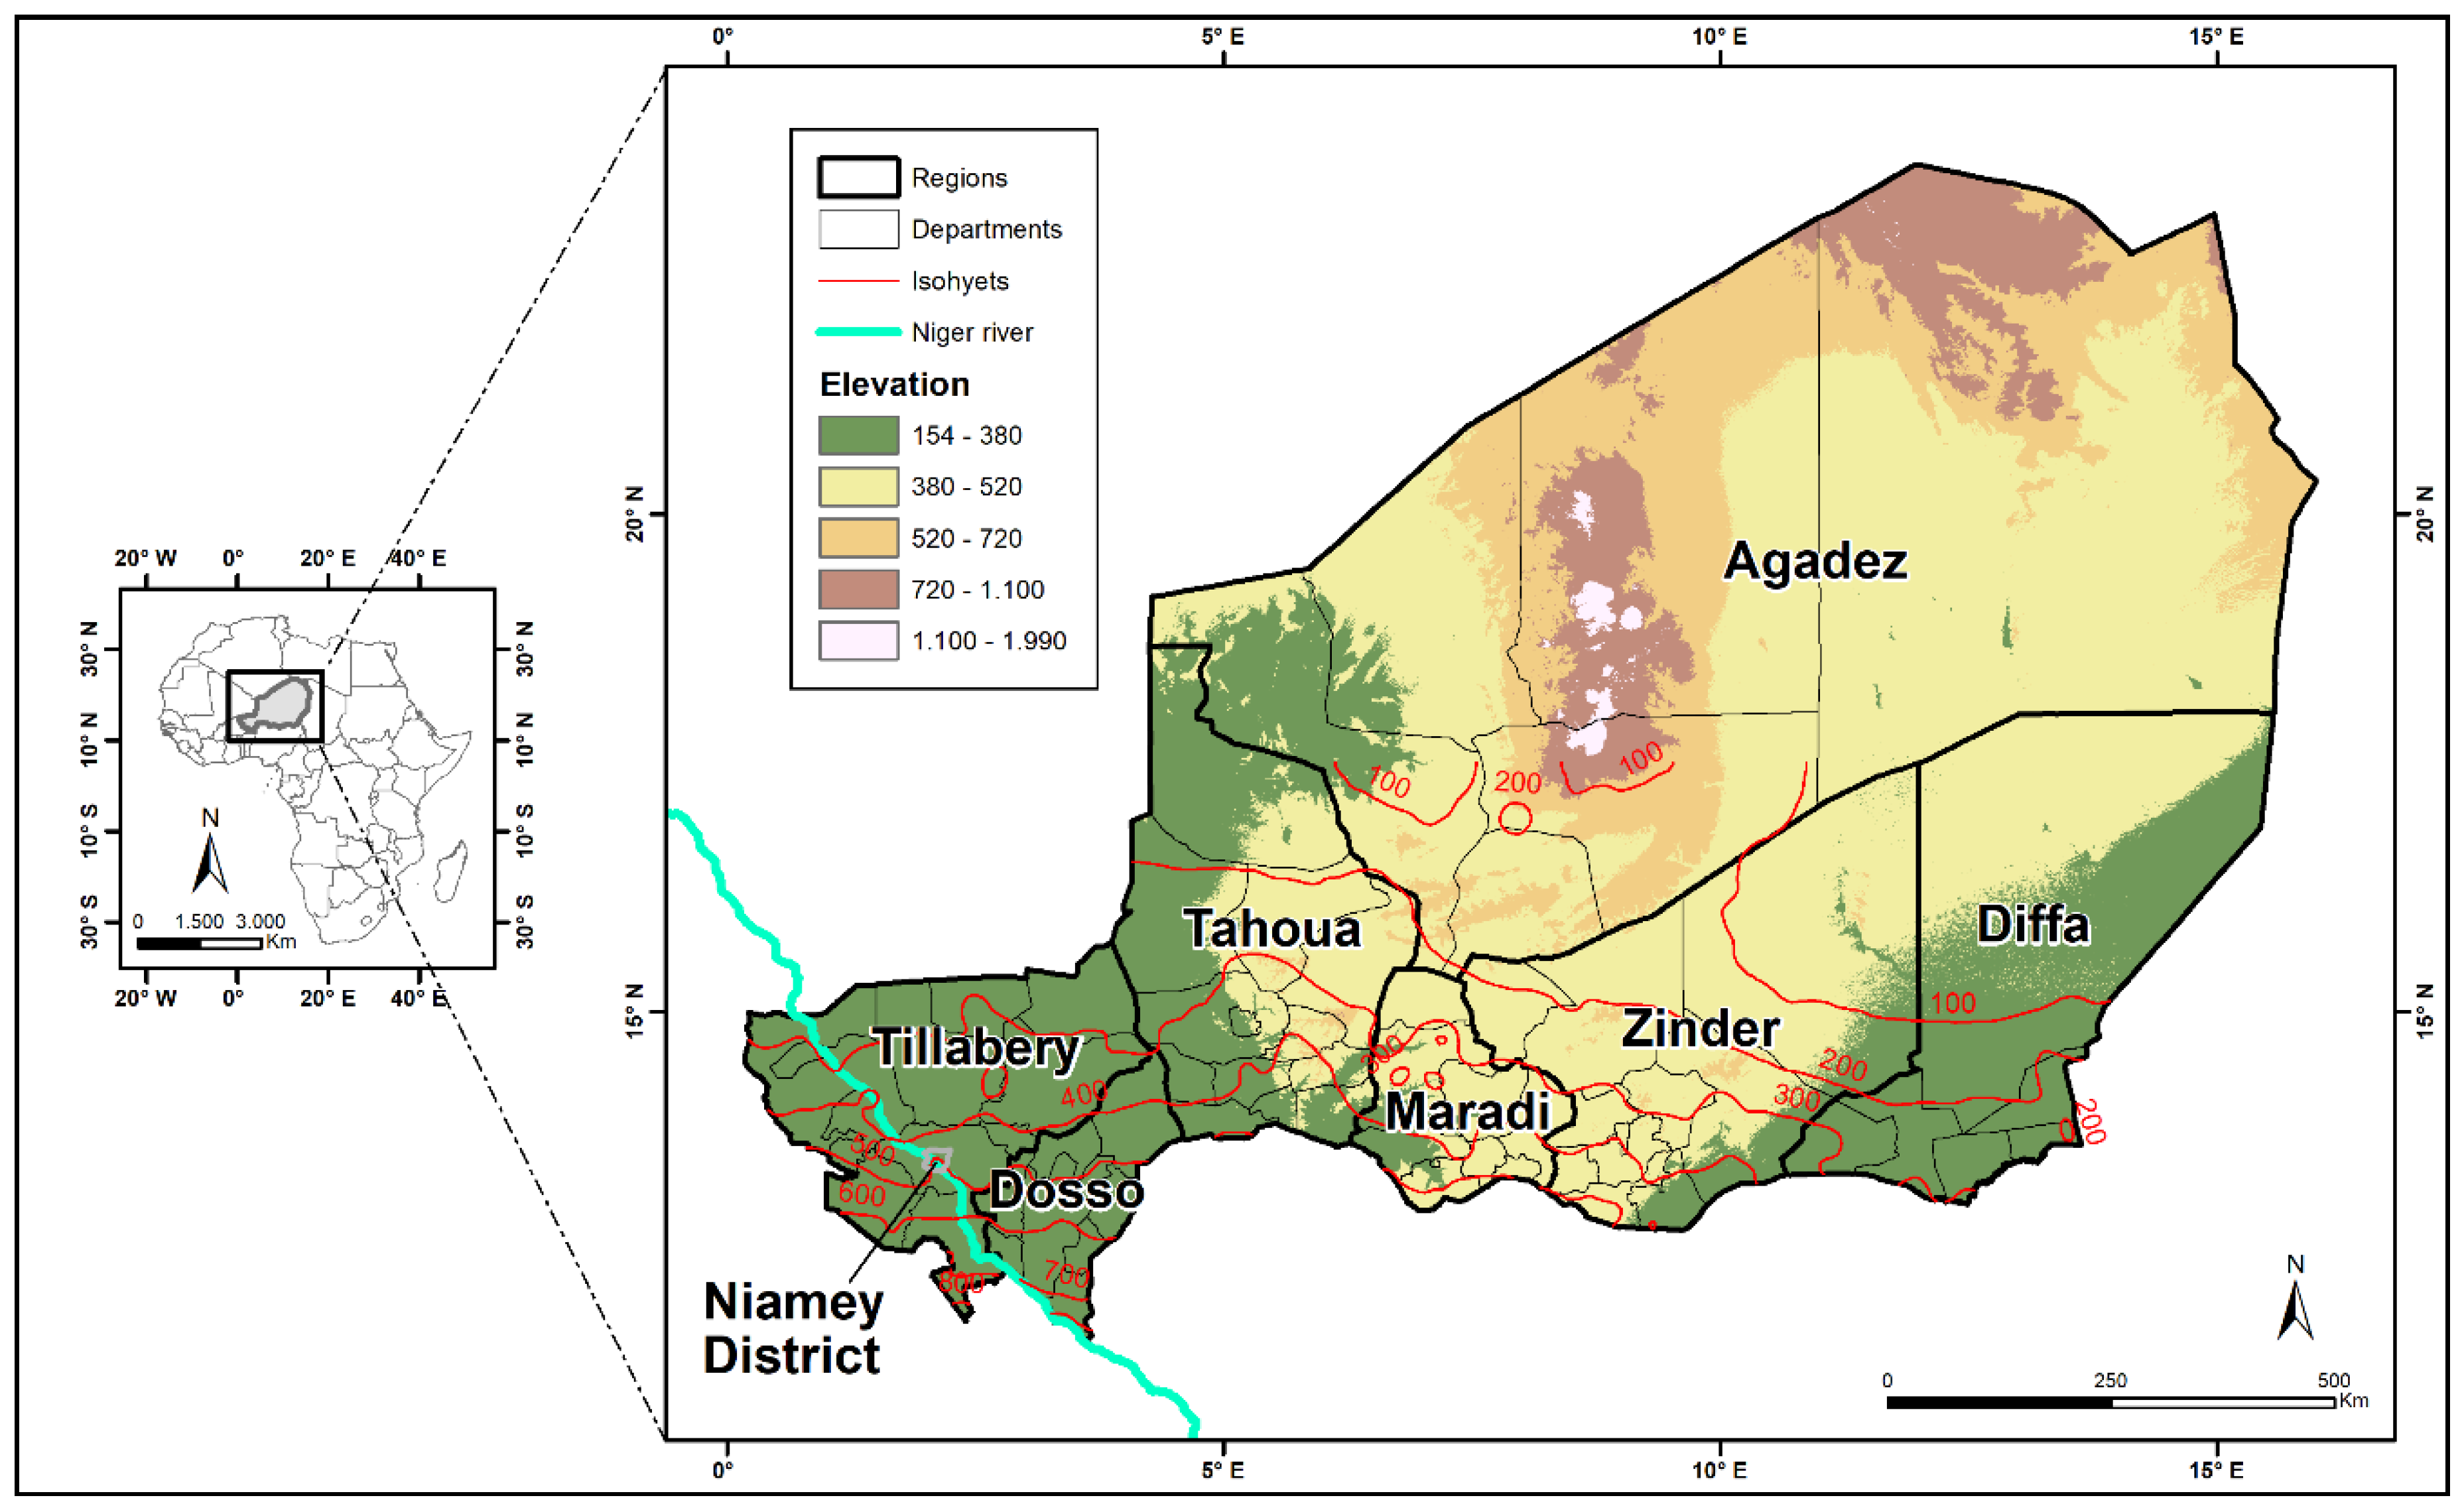
Niger is a landlocked Sahelian country located in the heart of West Africa covering an area of 1267 million km2 between 11°65′ and 23°55′ N and 0°20′ E and 16°00′ E. The country can be divided into three zones: (i) the northern zone, which covers more than half of the country and is mostly in the Sahara; (ii) central Niger, which is semi-arid and part of the Sahel, defined by annual rainfall between 250 and 600 mm, and is essentially pastoral land; (iii) the southern part of the country, which is where rainfed agriculture is practiced with a mean annual rainfall that rarely exceeds 800 mm. The growing season in the central and southern zones lasts about 3 to 5 months, after which there is a long dry season of 7 to 9 months. Rainfed agriculture is the major farming practice, and the main cereal crop is millet, followed by sorghum. The principal river, the Niger, flows across the southwestern region and its seasonal flood contributes to recessional and irrigated farming along its banks. The economy of Niger is dominated by subsistence rainfed agriculture and animal husbandry.
Niger’s predominantly rural population of about 17 million in 2012 is mostly clustered over the far south and west of the country in small towns and villages. The capital city is Niamey, located in the southwest corner. From an administrative point of view, Niger is divided into seven regions and one capital district (Niamey), 67 departments and 265 municipalities (Figure 1).
The country, as with others in the Sahelian region of West Africa, has experienced strong climatic variability, and three main climatic periods are commonly distinguished for the second half of the 20th century [26]. The first, during the 1950s and 1960s, was above-average wet and was followed by a dry period during the 1970s and 1980s. The dramatic decrease in rainfall also had consequences for the ecosystems and hydrological processes. Many studies have reported the so-called ‘Sahelian paradox’ [13]: a decrease in rainfall but increase in runoff because of changing soil properties (crusting etc.). During the 1990s, rainfall increased again. The latest rainfall records tend to show that the Sahel region has been gradually recovering since the late 1990s and that the annual rainfall amounts are getting back to their pre-1970s level—at least in the eastern part of the Sahel [27].
2.2. ANFD and Flooding Data
The ANFD was set up in 2014; it gathers essential core data regarding flood impacts in Niger that had been collected since 1998 by SAP and is updated yearly. The systematic collection of data on floods by an official Niger agency began at the end of the 20th century because an awareness and real perception of this type of hazard was only finally achieved by policy makers at both national and local levels in this period. Until then, floods were considered sporadic events and their consequences considered negligible compared to those caused by droughts and other types of hazard.
The information recorded includes flooding dates, settlements involved, people affected, human losses, crop and livestock losses as well as other occasional or heterogeneously-quantified damage to equipment, public facilities (e.g., hospitals, schools) and infrastructure (transport facilities such as roads, bridges). No information is provided concerning causes, flood types and size of flooded areas. Due to this limitation, information regarding types of floods provided by authors in the Results and Discussion sections is mainly derived from the knowledge of SAP staff concerning the phenomenon and the available literature. Because the database is focused on impacts, floods are entered in the database only if they caused reported damage to people or property. Until 2014, flood data were collected in a heterogeneous way and mainly on sheet forms; therefore, before database mining, data were verified for inconsistencies and duplicates, harmonized and, where necessary, converted into a single unit of measurement. Floods occurring in the first years since the beginning of monitoring (1998–2002) are often simply described at a regional or departmental level and only the number of flooded settlements are available, without specific information regarding their toponyms. Since 2003, SAP has developed a specific framework to monitor population vulnerability to disasters and food security; it is based on a dense local network at the municipality level, known as vulnerability monitoring observatories (Observatories de Suivi de la Vulnerabilité—hereafter OSV). The mechanism covers the main vulnerable areas of the country and, among the various actions it performs, collects data concerning floods and their impacts. These data, after being validated by official multidisciplinary commissions at departmental and regional levels, are finally collected and gathered at the national level by SAP.
The data available from the ANFD are therefore much more precise and complete than those used in other studies based on media sources or data derived from global disasters databases, especially for small disasters and/or concerning remote areas. ANFD entries are constantly reviewed for redundancy, inconsistencies and incompleteness. However, not all flood records report complete information, mainly due to the difficulty of precisely geo-locating some flooded settlements indicated by OSV. These settlements may have two or more different local toponyms or toponyms analogous to other villages in the same municipality. Consequently, in these cases, which concern 395 flooded settlements out of a total of 1879, it was not possible to identify them from the official national list of settlements (Répertoire National des Localités—RENALOC—of the Niger National Institute of Statistics) and precisely geo-localate them. In these circumstances, information on flood location is only given roughly at the municipality level.
In this work, we focus on five categories of flood damage that give a comprehensive view of the impact of any flood event considered: number of (i) affected people and (ii) settlements, (iii) destroyed houses, (iv) crop and (v) livestock losses, calculated as hectares and tropical livestock units (TLU) respectively; these last two categories were chosen given that Sahelian countries’ subsistence is mainly based on agriculture and animal husbandry. Human losses and injuries were not considered in this study because validation of the dataset is still in progress regarding this kind of information. Indeed, the ANFD provides statistics only regarding victims due to direct consequences of floods without considering those related to indirect consequences such as malaria, dengue fever and cholera epidemics.
2.3. Precipitation Data
In the absence of a dense rain gauge network in the study area, a satellite rainfall estimation product was used as a proxy for rainfall, namely the climate hazards group infrared precipitation with stations (CHIRPS) dataset. CHIRPS incorporates satellite imagery resolution with in-situ station data to create gridded rainfall time series; specifications on this product are available in Funk et al. [28]. This dataset was chosen because, in a recent study, Dembélé and Zwart [29] compared several satellite rainfall products with local Burkina Faso rain gauge measurements and found that this product is appropriate for flood monitoring. CHIRPS gridded products from 1998 to 2015 at 0.05° spatial resolution (~5.3 km) and daily temporal resolution were acquired from the Climate Hazards Group data gateway (http://chg.geog.ucsb.edu/index.html).
2.4. Vegetation Indices Data
Moderate resolution imagery spectroradiometer (MODIS) normalized difference vegetation undex (NDVI) 16-day composite grid data (MOD13A2) for the Niger area were acquired between February 2000 and December 2015 from the NASA Earth Observing System (EOS) data gateway. MOD13A2 provides one image every 16 days (23 per year) at a 1-km spatial resolution. Vegetation indexes generated from this product are less noisy than daily data and allow easier processing [30].
The NDVI is the oldest remotely sensed vegetation index in use and remains, despite its shortcomings (sensitivity to soil color, atmospheric effects, illumination and observation geometry), the most widely used by the remote sensing community.
The NDVI is calculated as
where NIR and RED are the spectral reflectances in near infrared and red bands, respectively [31]. The NDVI data are dimensionless numbers varying from −1 to 1. Negative values of NDVI correspond to water, while values near 0 generally correspond to barren areas of rock, sand, or snow. Low values indicate very sparse vegetation, while dense vegetation is indicated by NDVI values approaching unity.
In this study, NDVI is used as an environmental variable providing information about the evolution of vegetation or land degradation [32].
2.5. Population Data
Data regarding Niger’s population were derived from the third (2001 Recensement Général de la Population et de l’Habitat Niger—RGPH2001) and fourth (2012 Recensement Général de la Population et de l’Habitat Niger—RGPH2012) Niger National Census. Annual population figures for the inter-census years were estimated using the official annual population growth rates.
2.6. Statistical Analysis Framework
The statistical analysis performed has two spatial scales: the first is a detailed level corresponding to the pixel image dimensions of CHIRPS and MODIS images, and the second is represented by polygon sizes of each administrative department. Rainfall data was analyzed as yearly daily maximum (MAX) for the 2000–2015 period at pixel level for the extent given by national boundaries. In addition, for each department, daily mean rainfall time series were extracted and two yearly rainfall indices were calculated: the annual mean sum (RSUM) and the sum of annual rainfall exceeding the annual 95-percentile value (SUM_Q95). In a similar way, annual mean NDVI values covering the 2000–2015 were extracted from 16-day MODIS images at both the pixel and departmental level.
In this work, two main statistical analyses were applied. The first is a nonparametric pixel-wise trend analysis using the Mann–Kendall trend test to detect the trend occurrence (if p-value < 0.1) and subsequently the Sen slopes for trend tendency (sign of the slope). These calculations were applied on each pixel/departmental annual time series available from the time stack of images. This information was mapped to detect if temporal patterns emerge during the period investigated. The choice of a nonparametric approach is due to the strong auto-correlation of vegetation data. All analyses were performed in an R free software environment [33] using a specific R “trend” package [34]. The second kind of statistical analysis was a multiple linear regression modelling applied at a department level on each annual damage time series as predictands (considered as dependent variables and obtained by the sum of each damage category) faced to a selected group of indices indicated as vulnerability state predictors (that represent the independent variables). These, calculated for each department, are represented by the annual sum of daily rainfall (RSUM), annual amount of extreme rainfall (SUM_Q95), population estimates (POP) and mean annual NDVI values (NDVI). The same static statistical design for each department was adopted without any model selection. The intrinsic goal of this analysis is to test if a linear dependence exists between different variables and to develop an administrative based linear damage model. For a given predictor, the potential multicollinearity between explanatory variables was assessed in each model by computing the variance inflation factor, hereafter VIF, by using the “fmsb” R-package [35]. VIF is a measure of how much the variance of a regression coefficient is inflated due to multicollinearity in the model. The VIF cut-off threshold considered to exclude multicollinearity was set to 10 [36]. The model significance was calculated by the p-value of the Fisher ANOVA test; we chose a low p-value (p-value < 0.1) significance threshold in order to deal with the shortness of the study period. If a significant value was observed, it is possible to claim that a potential link exists among environmental and sociological drivers and flood vulnerability in the area studied. The significance level of each individual predictor was evaluated with a t-test. The statistical framework was set up to merge the two sources of information regarding flood damage (temporal by trend investigation and structural by linear modeling) and to give a comprehensive view of recent and sudden flood impacts, focusing on the role of synergies between climate and demographic variables. Data and code functions developed for this work are available in the public repository on the GitHub platform (https://github.com/CLIMAIBIMETCNR/niger_climate_vulnerability).
3. Results
3.1. Exploring the ANFD
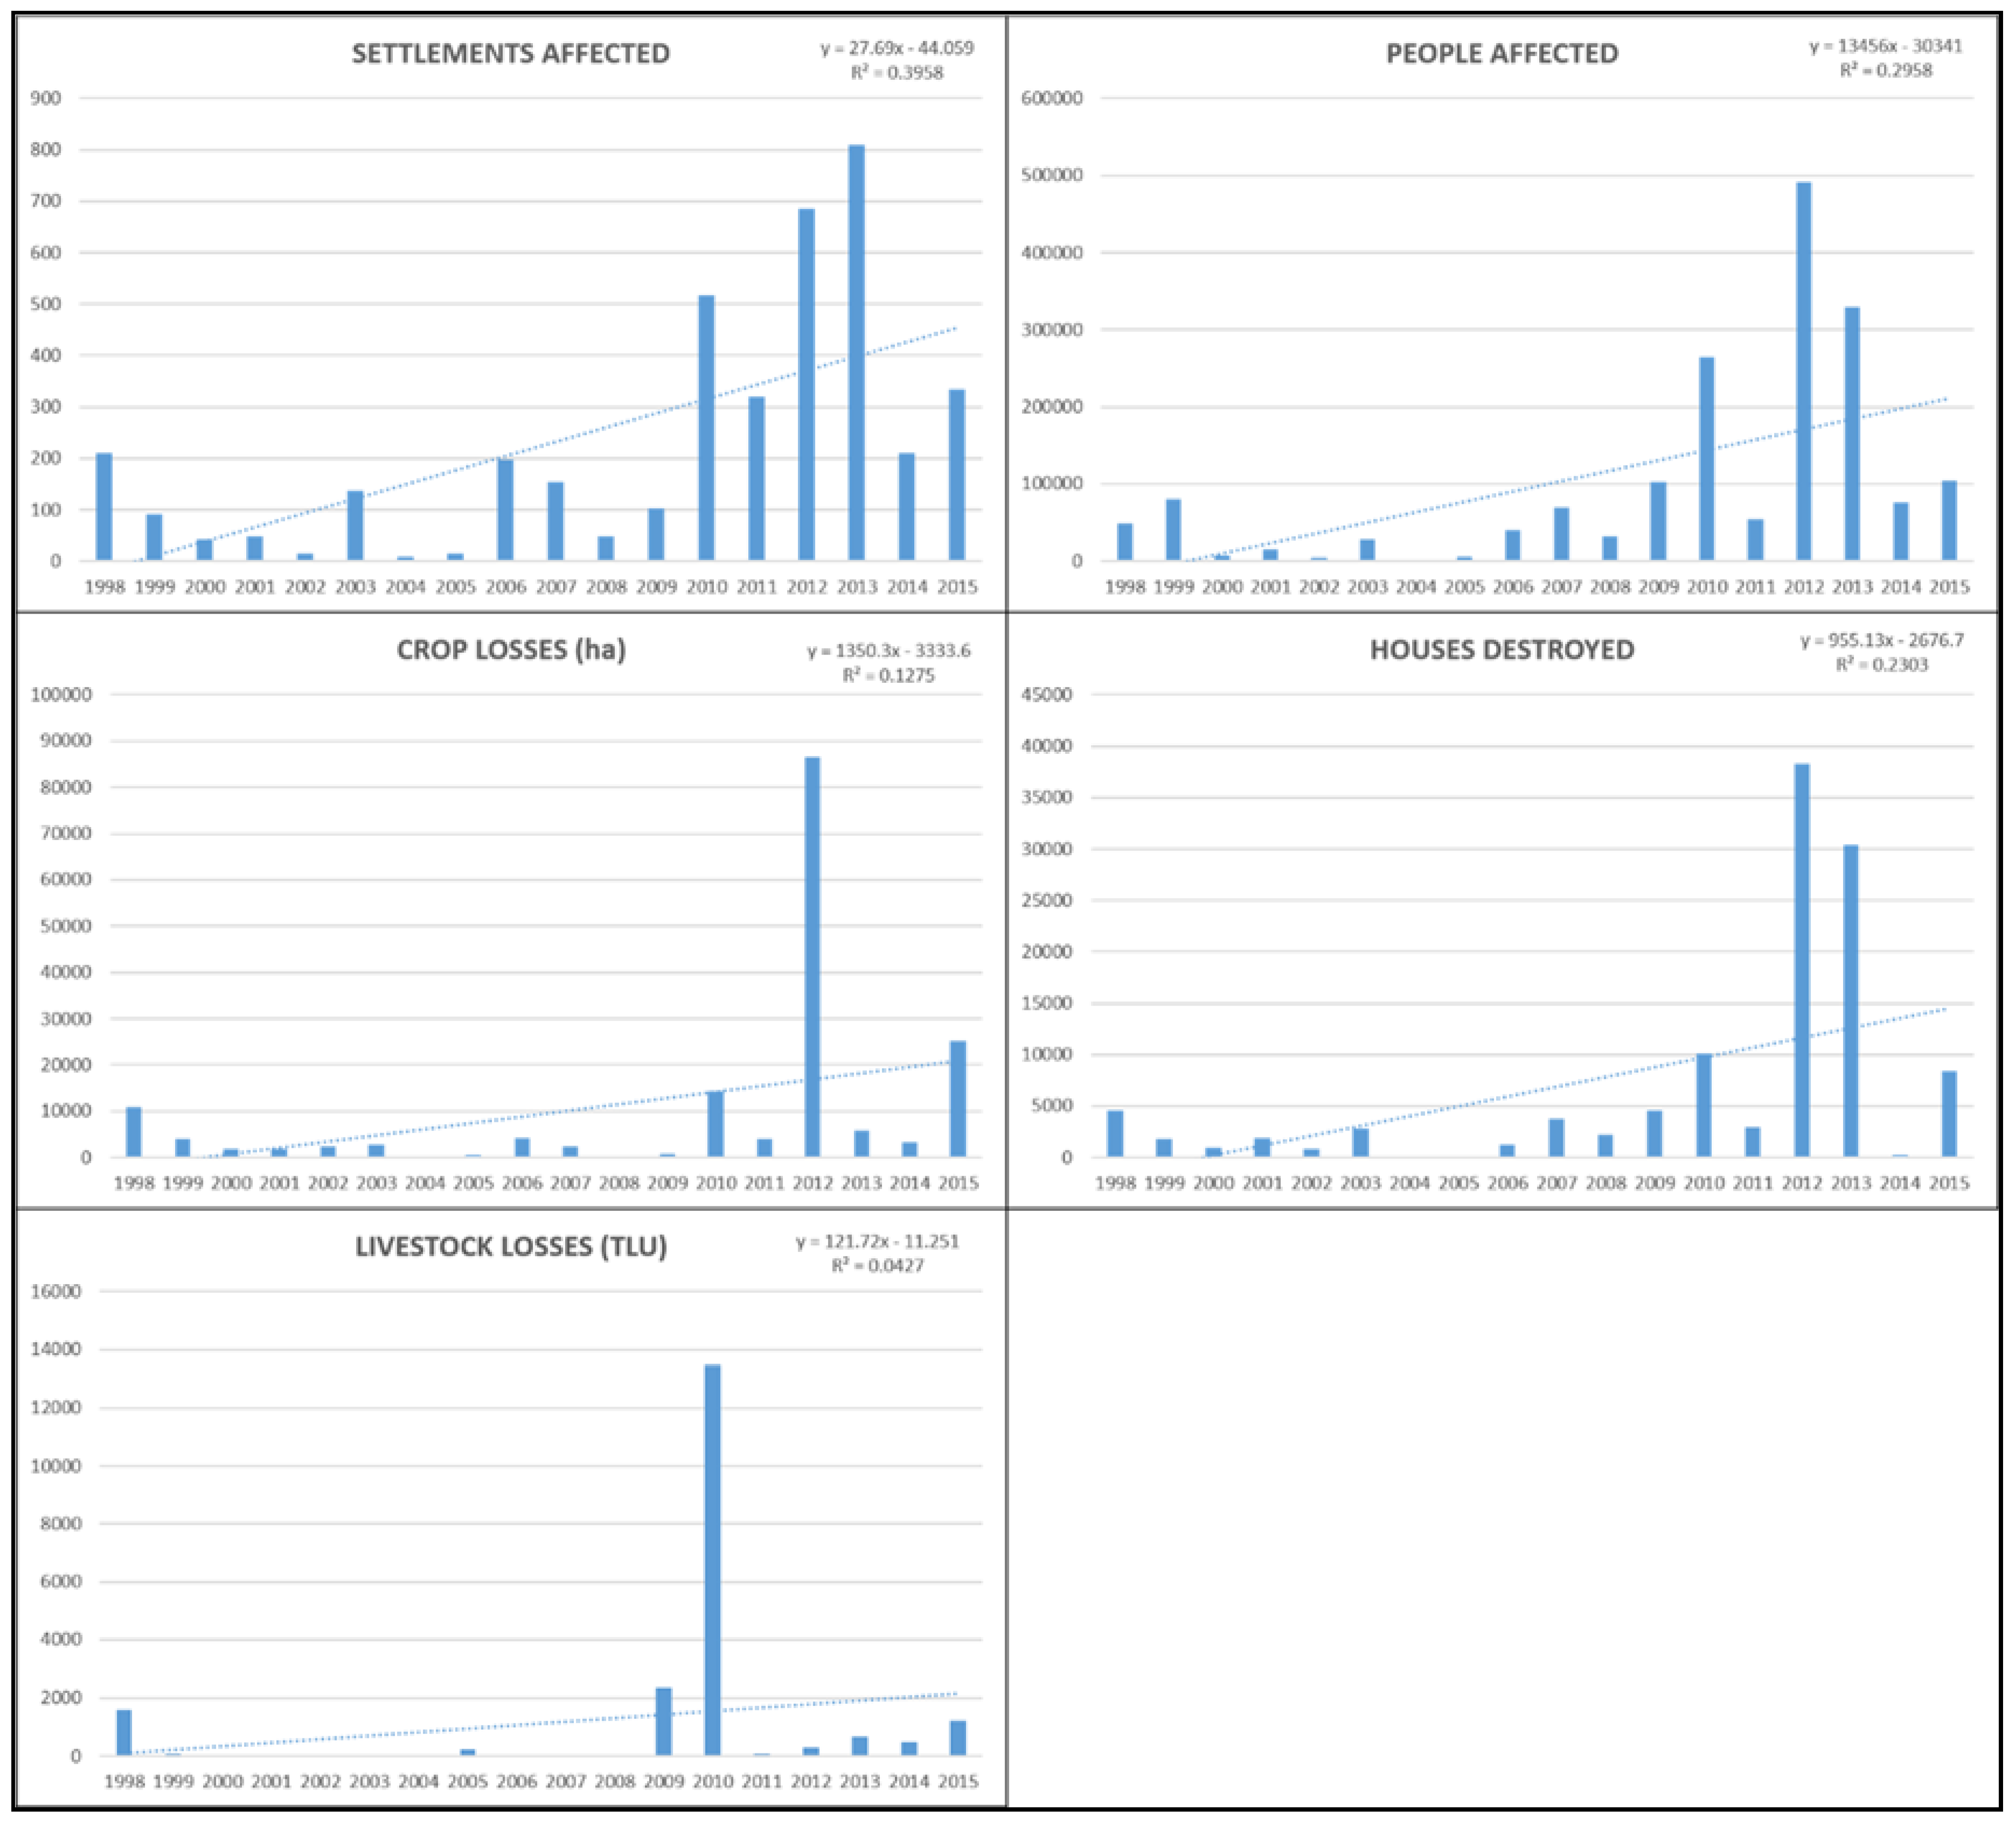
Data from the ANFD at the national level are shown in Figure 2. For all five series, linear trend lines are included. A total of more than 1,750,000 people and almost 4000 localities were affected by floods in the investigated period with more than 115,000 houses destroyed and losses of around 170,000 ha of crops and 20,000 TLU of livestock. A strong increase in the number of affected localities, population and destroyed houses is evident during the period 1998–2015. The trend shows a not unidirectional increase; most of the damage is concentrated in the 2010–2015 period at both national (Table 1) and departmental (Figure 3) levels, with peaks in 2012 (primarily in the Dosso Region) and 2013 (with many areas affected, but mainly Tillabery Region). The trend is less evident regarding the amount of crop and livestock losses, with the latter characterized by episodic events in 2009 and 2010.
Most floods happened in the southern Sahelian strip of the country characterized by average annual rainfall of 300 mm or more, but overall a very high percentage of municipalities (216 out of 261) were involved over the years, demonstrating a high vulnerability in the whole country. Recurrent floods affected 365 settlements, and 90 of them were flooded three or more times. Moreover, floods mainly affected rural areas, as 62.9% of people and 73.4% of localities involved are in rural municipalities.
Regional and departmental flood damage statistics are given in Table 2 and Table S1 in the Supplementary Material. Figure 4 shows the number of people affected per department and the flooded settlements that could be precisely identified and reveals that most floods are clustered in the following areas:
- Tillabery and Dosso Regions. These two regions are the most exposed to floods and account for 61.1 and 54.4% of the total of affected localities and population. They are both threatened mainly in two geomorphologic areas. Areas located on the banks of the Niger River are periodically flooded by the overflowing of the river, with serious consequences mainly in 2010–2012–2013–2015. Several studies have already highlighted increases and changes in Niger River flood characteristics and magnitude [9,20,37]. Moreover, Amogu [38] and Mamadou [39] indicated a silting up of the Niger riverbed and deposition on several alluvial fans that reduce the stream section and enhance the water level for a given discharge. We estimated that 231 localities in this area have been flooded over the study period. Considering also the number of times that each locality was flooded (Figure 3), it can be deduced that 16.6% of floods in Niger were caused by Niger River overflows. It must be taken into account that, in some cases, these localities on the banks of the Niger River have been flooded by surface runoff from small upslope sub-basins, so this percentage has to be considered to be in excess. The other main area where floods occur are the fossil valleys (locally called Dallols). Here, floods are mainly caused by surface runoff from small upper plateau basins that discharge into the fossil valleys; an aspect that worsens the exposure of these villages is related to fact that the water table is shallow in this area so infiltration is limited. Most of the damage happened in 2012 due to extreme rainfall events (600–800 mm in a short time). Other floods are occasionally caused by overflowing of the right bank ephemeral tributaries of the Niger River (Goruol, with five localities affected; Dargol, with 16 mainly in 2013; Sirba, with six, Gouroubou, with two). Finally, localities are sometimes affected by flash and areal floods in small endohereic basins, mainly in the areas located on the left bank of the River.
- Niamey district. The city of Niamey and its neighborhood has been affected by a dramatic increase in the frequency and intensity of floods (1998–2007–2010–2012–2013–2014), mainly due to Niger River overflows. About 160,000 people were affected and 20,000 houses destroyed in the 18-year study period, with more than 80% of damage concentrated in 2010–2015.
- South of Tahoua Region. In this region, most of the floods occurred in the south-western departments (Bagaroua, Illela, Birni Nkonni) in 2010 and 2014 and in the south-eastern Madaoua department during several years.
- South of Maradi Region. Floods are mainly caused by surface runoff and affect the southwestern areas surrounding Maradi town (Madarounfa, Guidan Roumdji, Ville de Maradi departments), part of the Goulbi seasonal river basin; other particularly affected areas are the eastern Mayayi and Tessaoua departments, part of the N’kaba seasonal river basin.
- Southwest of Zinder Region. Here, most floods affected localities in the endohereic Korama basin (Magaria, Mirriah and Dungass departments), part of the Lake Chad basin.
- Agadez Region. Most of the floods affected settlements located on the foothills of the Air Massif (departments of Arlit, Iferouane, Aderbissinat, Tchirozerine) and are mainly caused by displacements of young generations from the internal mountain areas who founded villages in particularly exposed areas on the sides of the wadis (“koris” in Hausa, the most widely spoken language in West Africa) and many floods are caused by these overflowing. It must be highlighted that in this area annual rainfall is scarce (around 100 mm per year), but the massif has very high runoff coefficients due to the presence of very shallow soils and rocky outcrops.
3.2. Environmental and Rainfall Trends
The pixel-wise analysis was performed to detect environmental (NDVI) and climatic (CHIRPS maximum rainfall) trends. The analysis suggested that mean departmental values trend analysis was not optimal, being influenced by the shortness of the investigated period and the large size of several departments which tends to flatten tendencies; thus, a per-pixel analysis was therefore preferred.
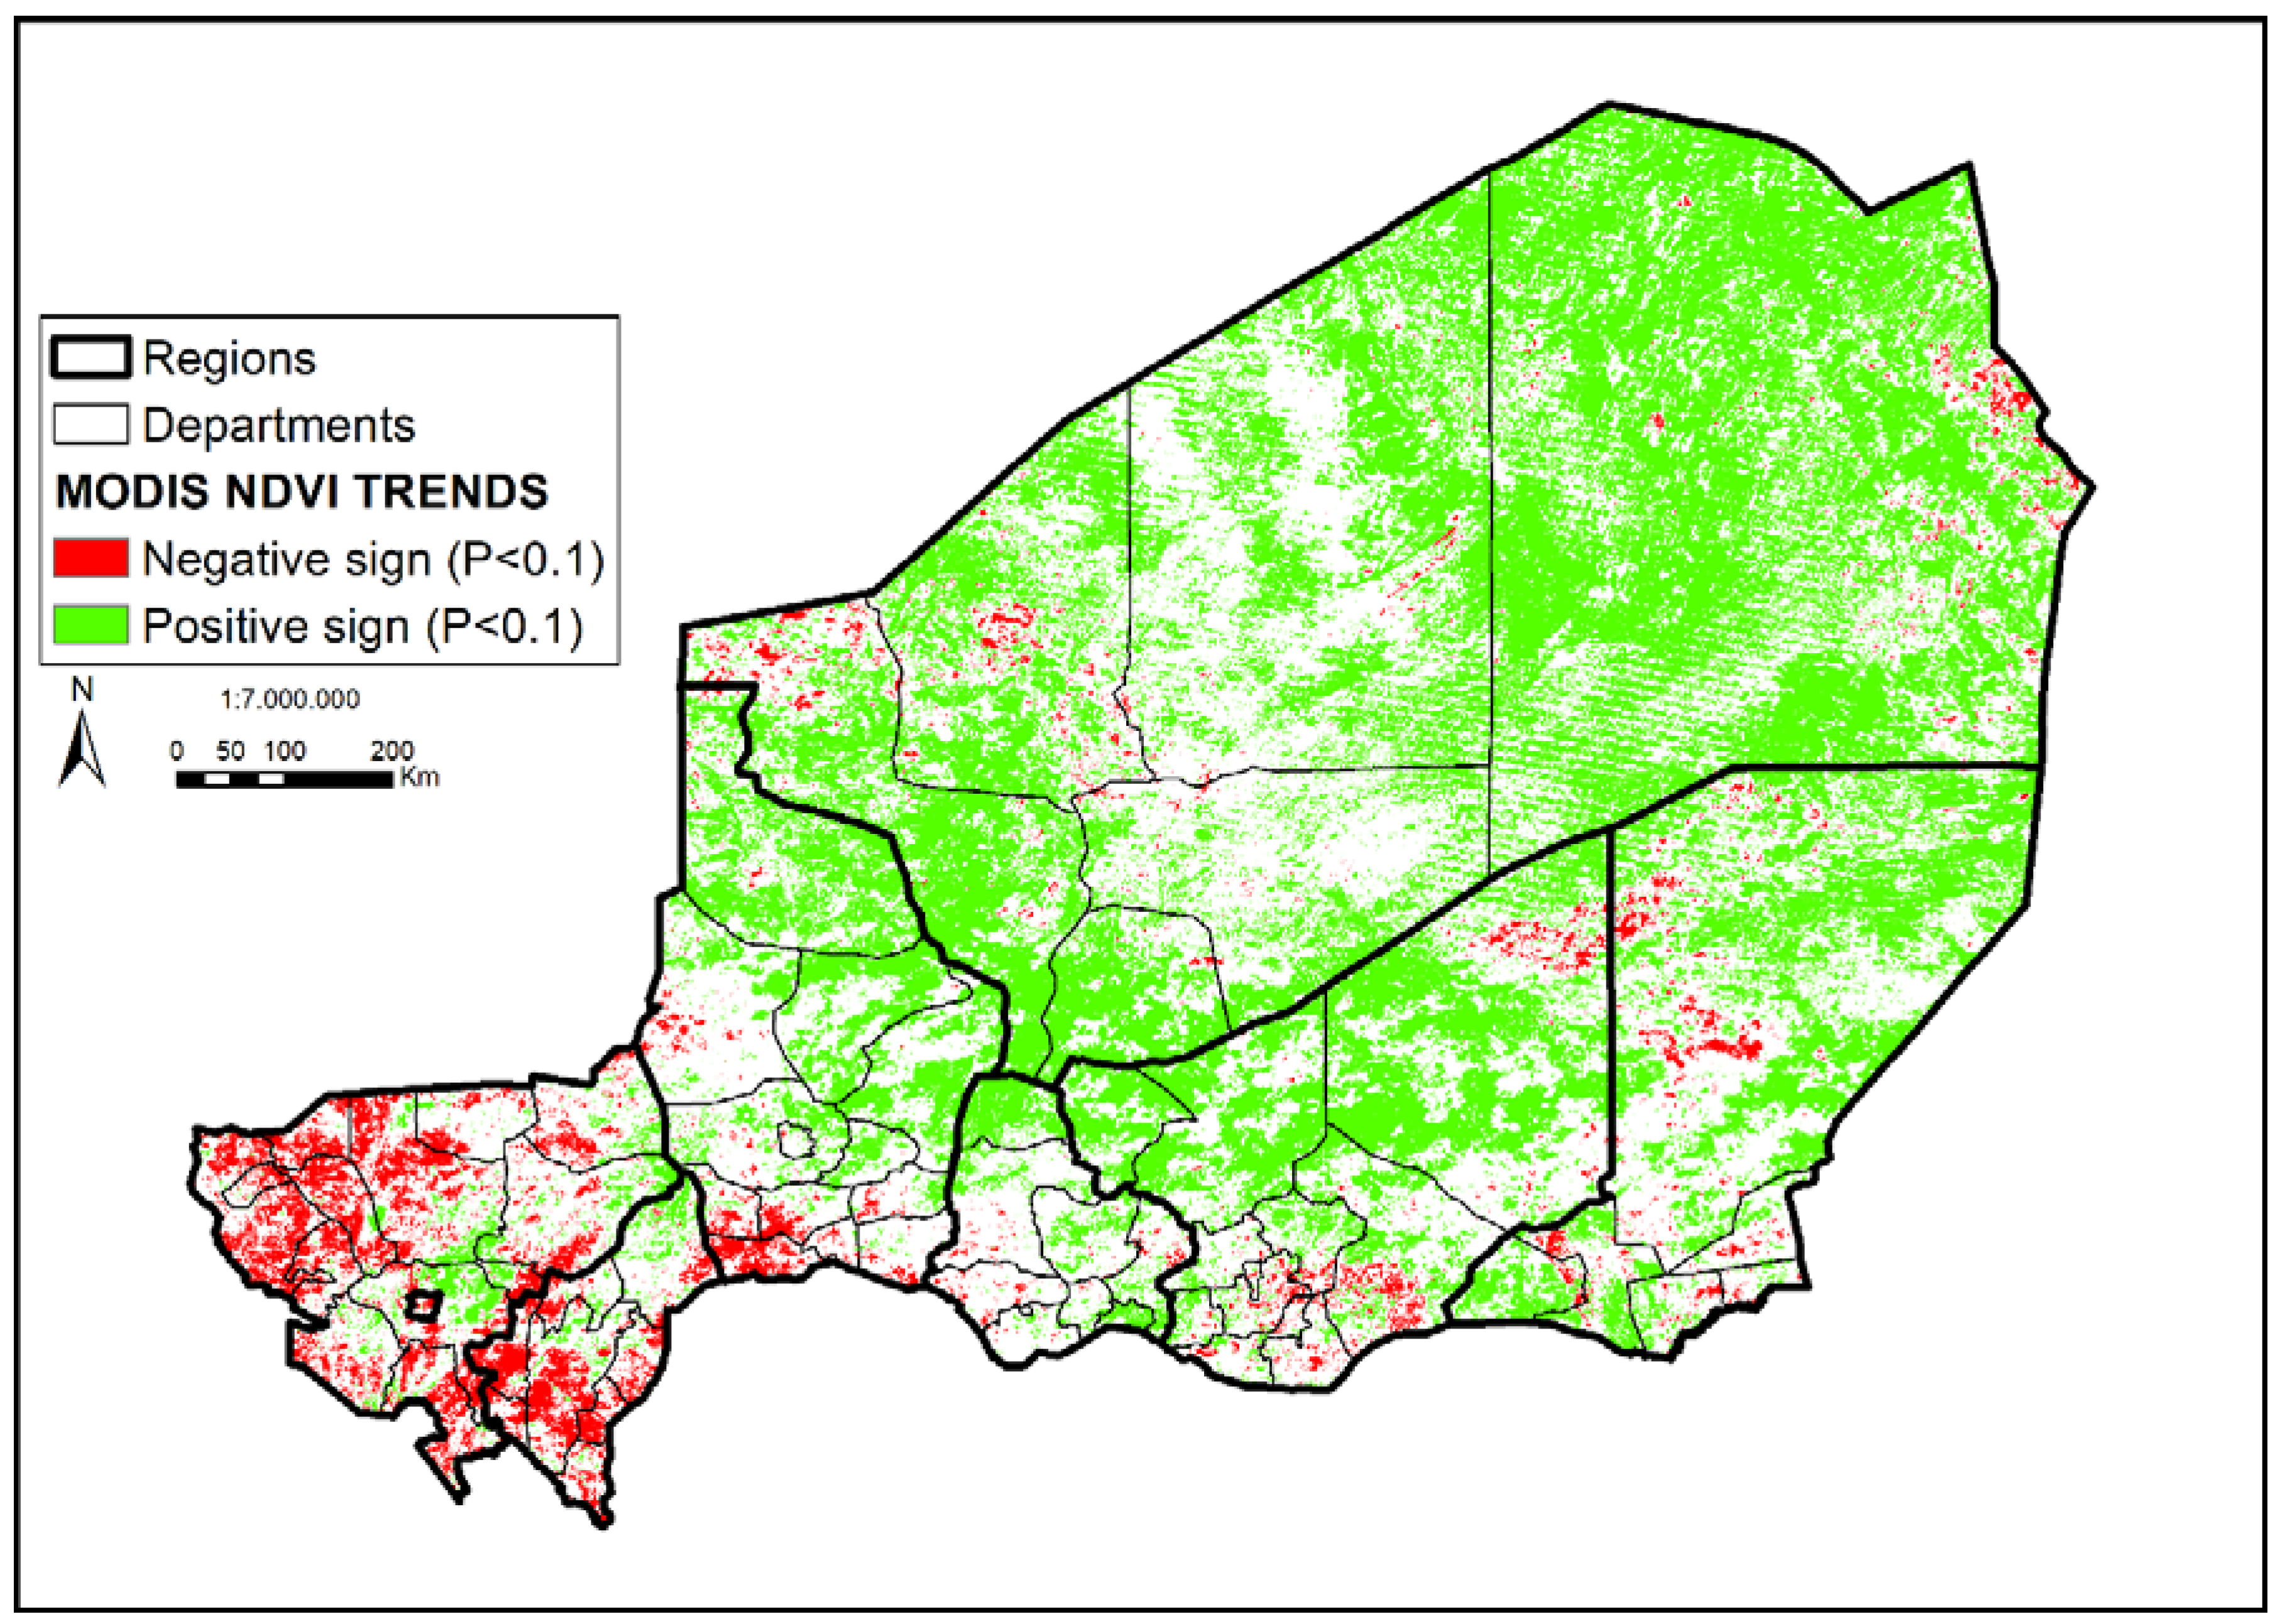
NDVI mean values trends are shown in Figure 5. We found that 49% of the pixels of Niger have significant (p < 0.1) trends, 15% having a negative sign and 34% being positive. NDVI negative trends provide evidence of vegetation or land cover degradation. These areas are mainly in the north-western (Tera, Tillabery, Gotheye, Ayerou, Ouallam) and southern (Say, Boboye, Dosso, Tibiri, Doutchi, Dioundiou, Gaya) departments of Tillabery and Dosso Regions. This is in agreement with many previous studies that, despite regional evidence of the so-called re-greening of the Sahel, indicated that south-western Niger areas have decreasing vegetation production. In some cases, clusters of flooded settlements fall precisely within these degraded patches, such as in areas of the Abala and Tibiri departments. Another area that shows evident signs of degradation is in the southern departments of Tahoua Region (Bagaroua, Illela, Birni N’Konni), while other smaller patches are mainly found in the more densely inhabited southern strip of the country. Regarding positive NDVI trends, these are found mainly in the central and northern areas of the country in accordance with the re-greening phenomenon indicated by several studies. It is worth noticing that positive trends are also found in southern areas repeatedly affected by floods, like in eastern Maradi Region.
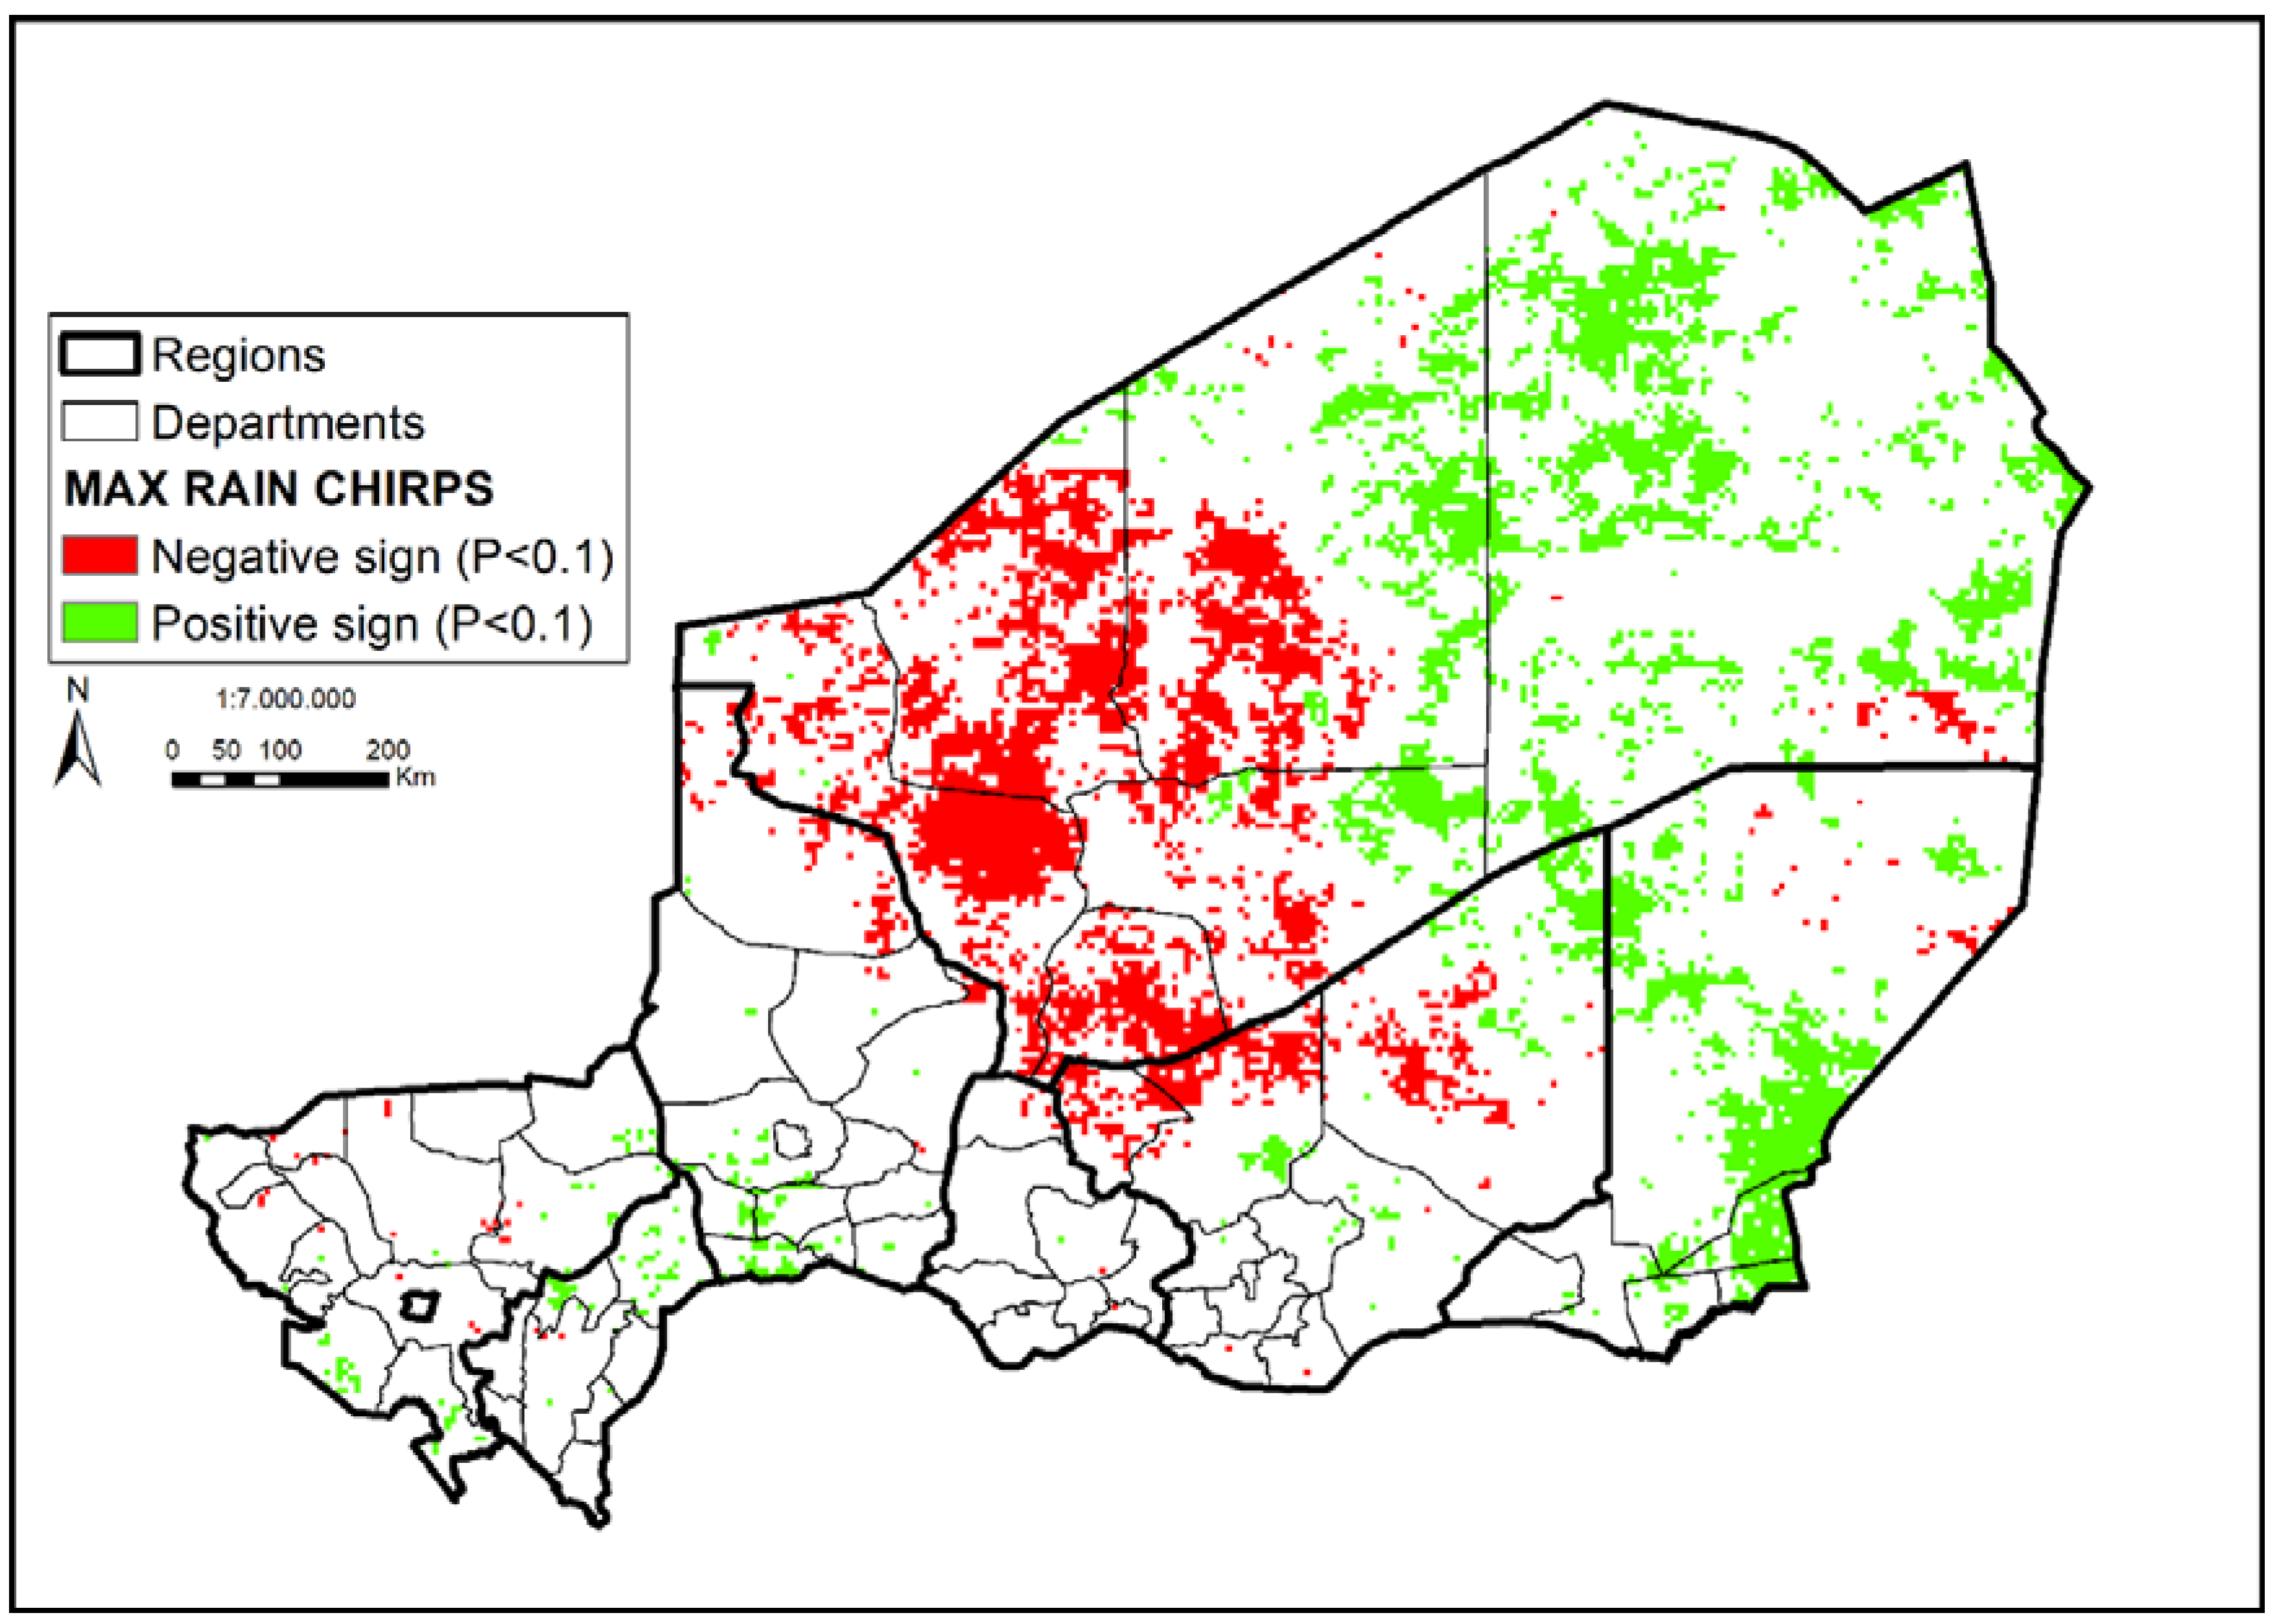
The maximum rainfall trend analysis, based on the CHIRPS dataset (Figure 6), provided less evident insights, with only 10% of the pixels of Niger characterized by significant (p < 0.1) trends. The areas mostly affected by floods generally do not show significant results, with only some small patches having positive signs. Significant trends are mainly found in the north-central area of the country and in the eastern desert area, which show negative and positive trends, respectively.
3.3. General Linear Model Analysis
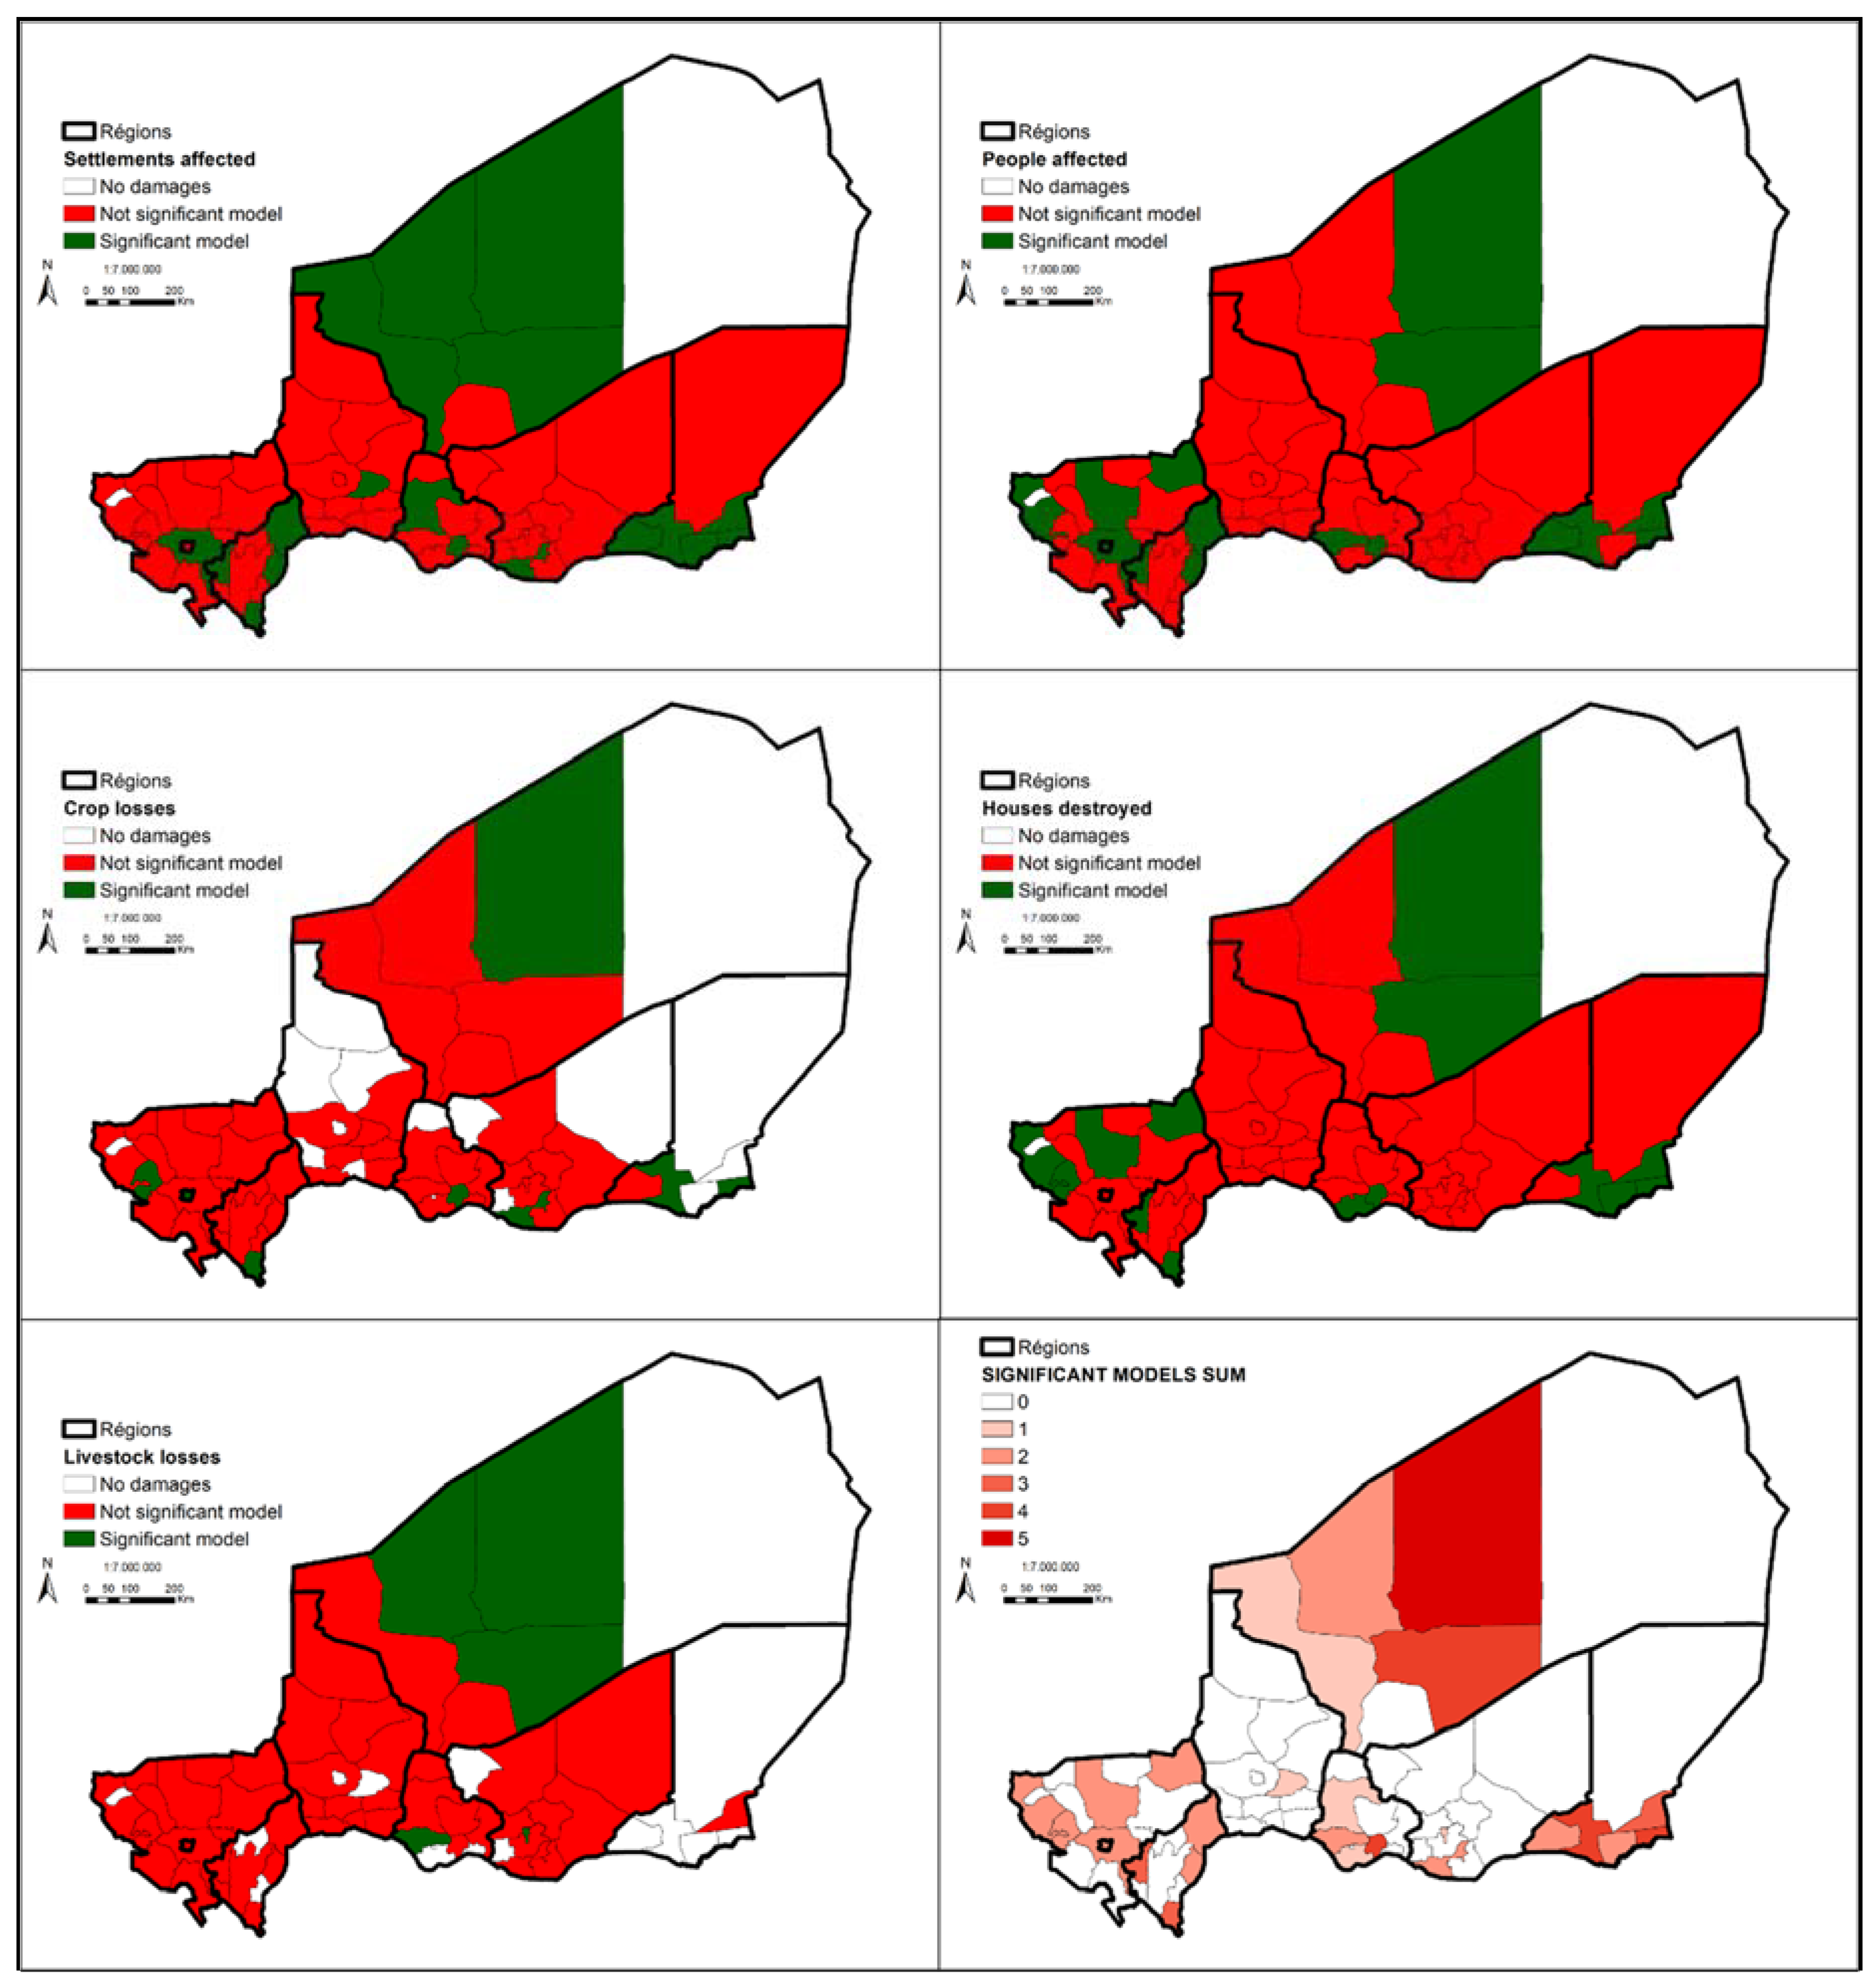
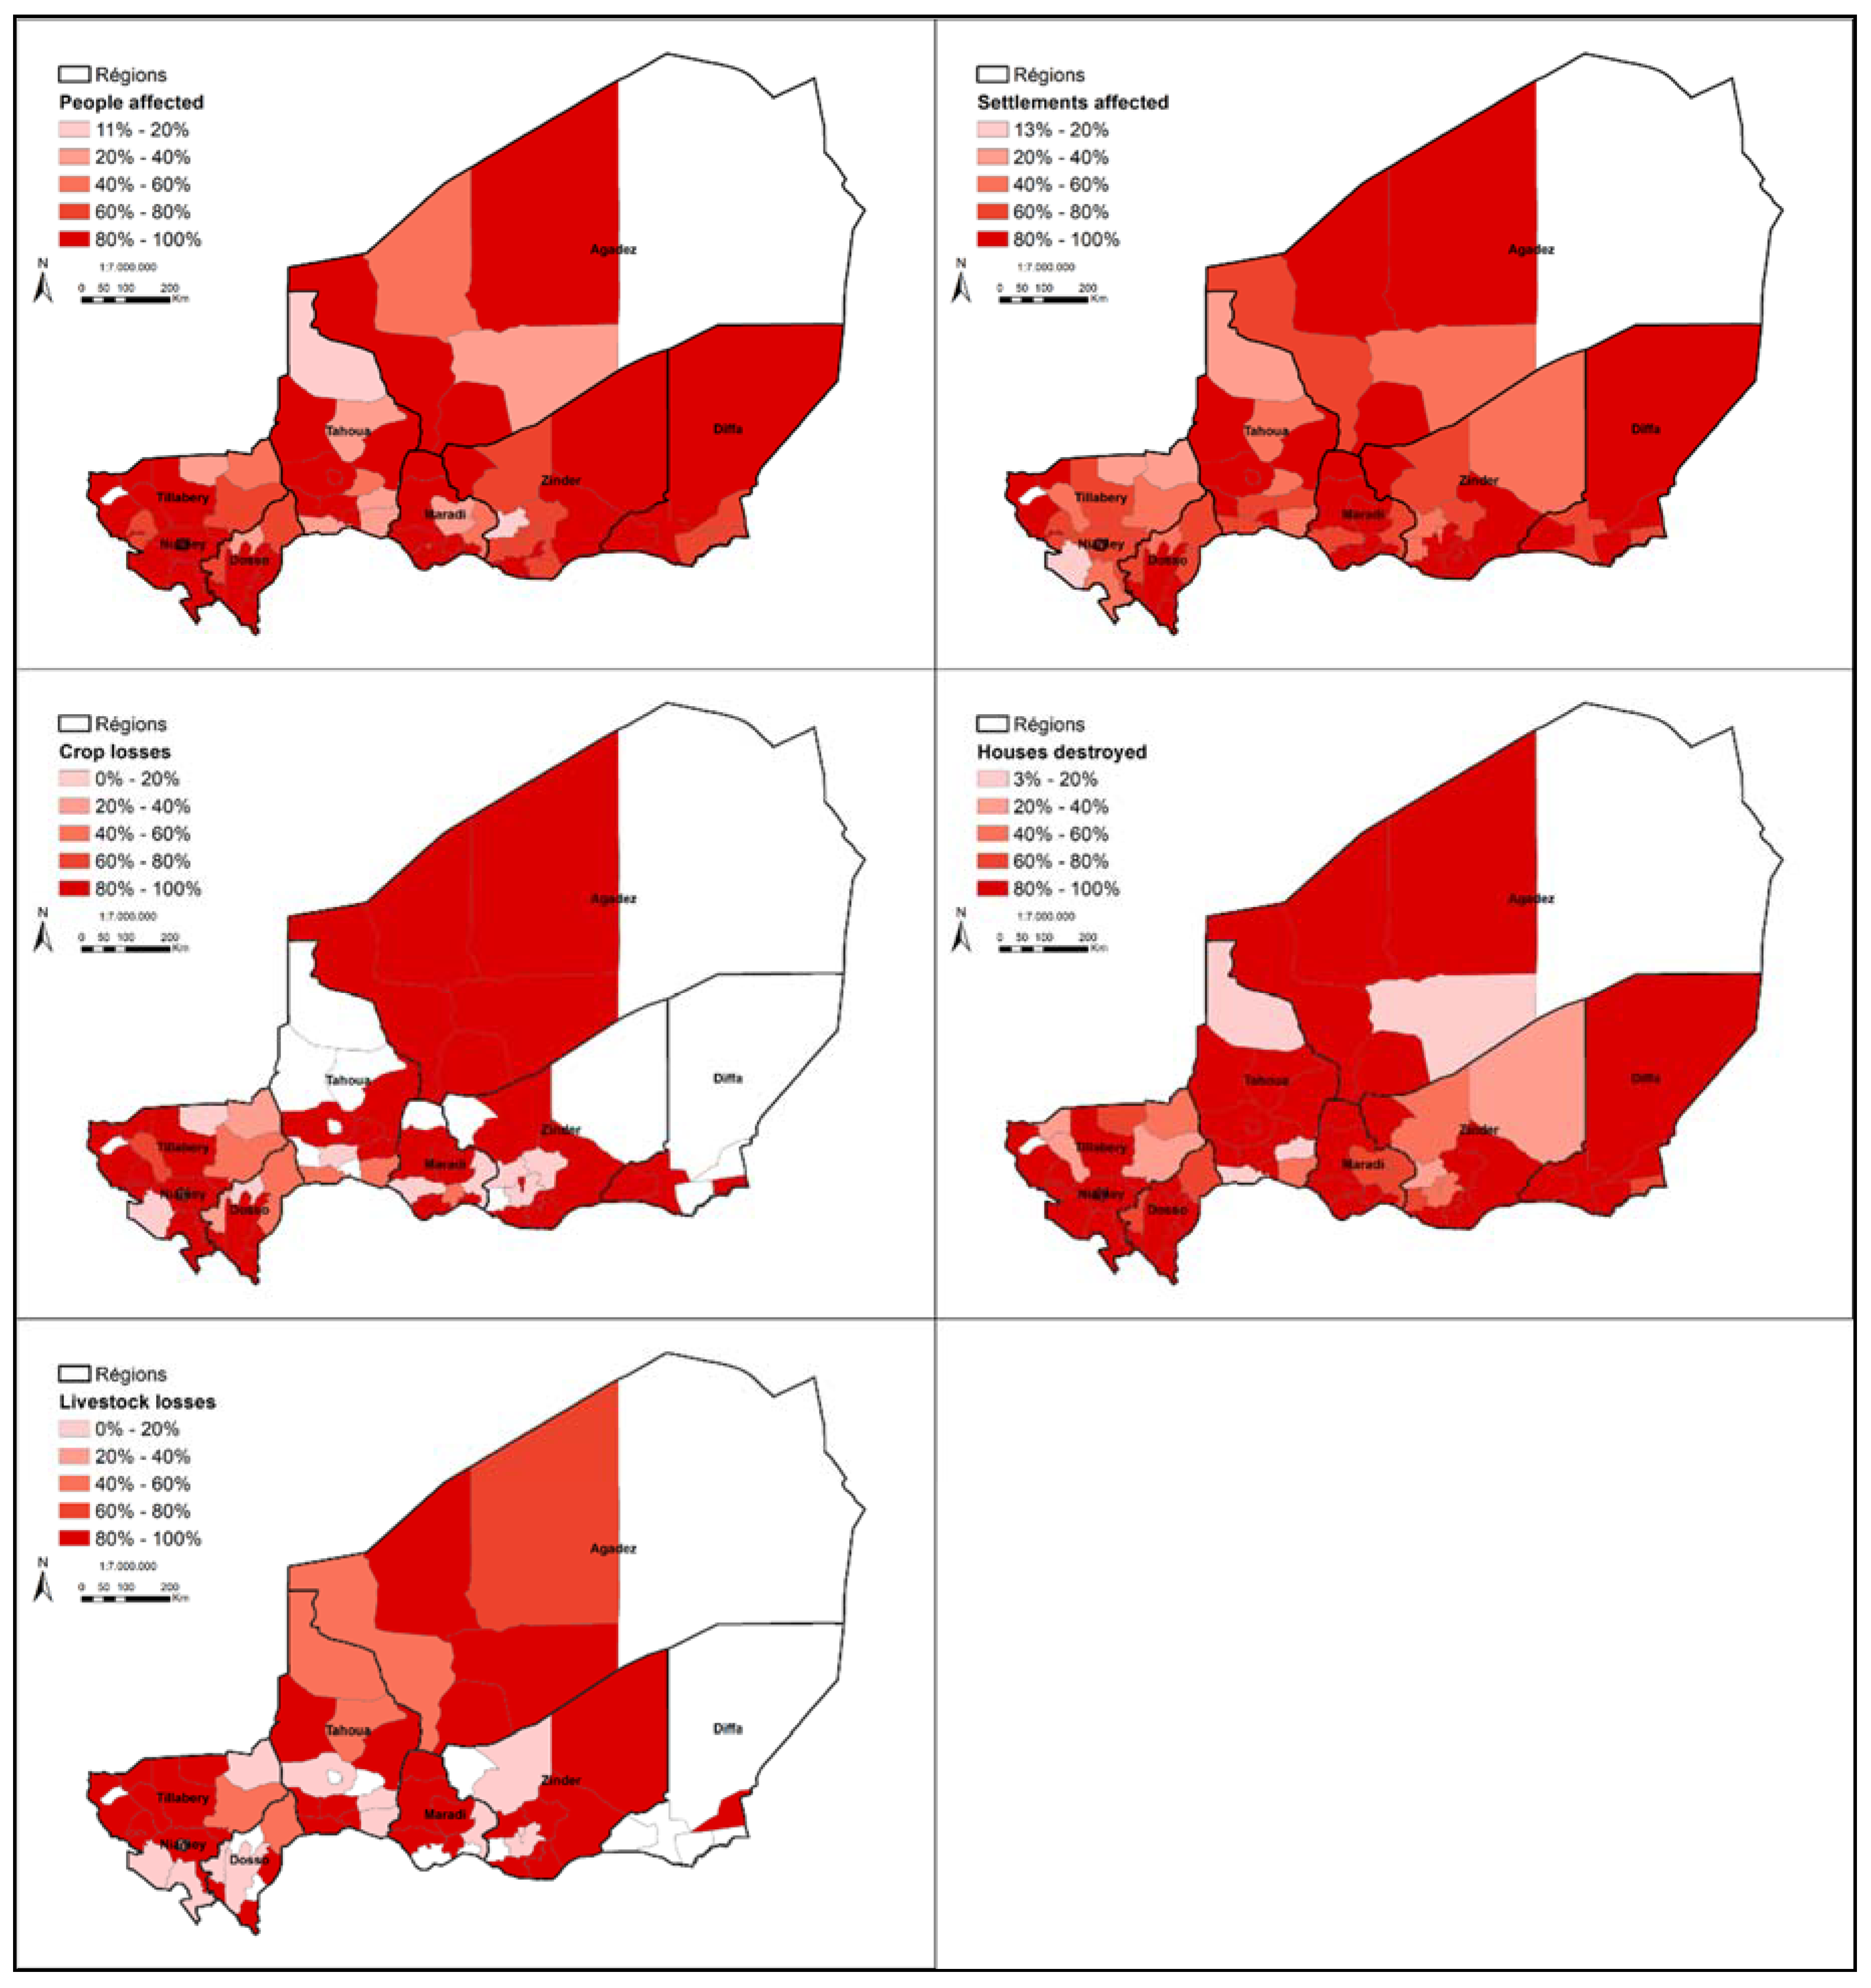
The statistically significant models make up 61 out of 297 models (Figure 7). The models are significant mainly for settlements affected (18), people affected (16) and houses destroyed (14), while very few significant results were found for crop (8) or livestock losses (5). Twenty-six departments show at least one significant model, but only one department (Iferouane) has significant models for all types of flood damage, and another eight departments (Maine Soroa, Bosso, Gaya, Aguie, Tchirozerine, Nguimi, Boboye and Ouallam) show at least three significant models.
The areas that show most of the significant results are the departments in southern Diffa Region and departments of Agadez Region that include the Air Massif. Tillabery, Dosso and Maradi Regions have roughly half of the departments with significant results, while very poor results are found for the Tahoua and Zinder Regions.
The variables that are significant in explaining the statistically significant models are shown in Tables S2–S6 of the supplementary material and summarized per Region in Table 3. At the national level, those that resulted in most cases of statistical significance are population (25), followed by the annual rainfall (24) and extreme rainfall (21) sums, while mean NDVI data were significant in 21 models. At regional level, in Agadez Region, flood impacts are linked to increases in population and annual rainfall sums. In Dosso Region, the variable which was generally significant was population, while in Maradi Region it was extreme rainfall events. In Tillabery Region, flood impacts are linked to decreases in vegetation and increases in extreme events.
4. Discussion
These results show that the actual flood risk in Niger is much worse than that presented for the first time to the scientific community by Tarhule et al. [24]. Those authors defined damaging rainfall and flooding as the new Sahel hazard. A comparison between data presented in their paper and ours is not directly possible given that, in the previous work, the authors used data from newspapers that, as stated by the authors themselves, are incomplete and often not verifiable. However, a different scale of magnitude is evident: Tarhule et al. [24] recorded 47 affected localities with 5580 destroyed houses and 27,289 homeless over the 1970–2000 study period. In our study, we found more than 1,700,000 people affected over almost 4000 settlements and 115,000 destroyed houses in an 18-year period. Another considerably different result is the percentage of floods attributed to urban areas. According to Tarhule et al. [24], 95% of all reported floods occurred in urban areas, while, according to ANFD, 37% of people and 27% of settlements affected by floods are in urban municipalities. This can be explained considering what Tarhule et al. [24] stated in their investigation, i.e., that urban flooding is disproportionately represented relative to floods in rural areas, reflecting the fact that newspaper accounts focus on damaging floods, which are more likely to occur in crowded built-up urban areas. Instead, the ANFD gathers data that is collected locally by a dense network of observers who record flood impacts even in small settlements. Moreover, results indicate that the flood damage increasing trend is not unidirectional, with two different periods being detected. The first one is a period of moderate flood occurrence, followed by a period of high flood occurrence with a sudden increase beginning in about 2010. This can partly be linked to increases in improvements in flood impacts collecting and reporting, which undoubtedly happened and is particularly evident for example with regard to the spatial characterization of floods. However, it should be noted that the implemented OSV local network for data collection was set up in 2003 and after three years of experimentation has been fully operational since 2006, while flood impacts show a strong increase from 2010. These trends are similar to those found at continental level by Sohoulande Djebou and Singh [40] based on the EM-disaster database; these authors also argued that yearly trends of population size being affected is more significant in Africa than in other continents, due to low levels of adaptation.
Regarding the regional and sub-regional characterization of flood impacts, the south-western areas of the country were confirmed to be the most exposed to flood risk, but some partially surprising results emerged. In fact, over the last 20 years, the scientific literature has focused on changes in Niger River flood magnitudes to try to understand both the changes underway in regional hydrological characteristics and the main factor triggering the increase of floods in the area. However, the results of this research state that the Niger River is just one of the causes of the flood risk increase in the area, responsible for 16.6% of the flooded settlements nationally, and that other mechanisms and triggers are present. The Niger left riverbank area is much more exposed to floods compared to the right, in particular those densely populated places in the Dallol fossil valleys. The number of flooded settlements in Dallol is around 200, a number more or less analogous to that recorded for the localities flooded by the Niger River. Only recently have researchers been focusing on the triggers of flood increase in the Niger left bank areas; Amogu et al. [20] and Mamadou et al. [41] have reported that the hydrological network is changing in this area and water channels are being created down to the main river bed. This phenomenon is known as endorheic rupture and increases the runoff contribution increasing population vulnerability. On the contrary, esorheic tributaries of the Niger River, even if they show discharges being 150% higher and runoff coefficients three times higher than those observed up to 50 years ago [9], are less directly responsible for floods, with only 29 flooded settlements over the 1998–2015 period.
However, this study shows that the flood threat is not exclusive to the south-western areas of the country and not relative only to the Niger River basin. Some of the most affected areas are in the eastern part of the country that falls in the Lake Chad basin, such as the south-west Zinder Region. The triggers of flood increases in the other particularly affected areas that were identified here have in most cases still not been investigated. In the literature, many studies (among them, [16,17,42,43,44]) are available regarding environmental triggers of increasing floods in the Sahelian part of the Niger basin, mainly in the areas around Niamey and in the south-west of Niger (Tillabery and Dosso Regions). Few studies have focused on other areas that were shown in this study to be particularly exposed and vulnerable. It must be considered that, unlike the south-western parts of the country, some of these areas appear not to be affected by evident signs of land cover degradation that can explain run-off increases and flood-related risks. On the contrary, they are in those areas where no significant or significant positive trends have been recorded in agreement with the so-called Sahel regreening phenomenon. Understanding these mechanisms precisely will be one of the focal points to find effective solutions to decrease and cope with flood vulnerability.
Regarding the multiple linear scheme, significant results are on the whole scarce. This is due to several factors, the first of which is certainly the shortness of the period examined. Other works that have examined longer time periods, since the 1960s or 1980s, found more evidence regarding land cover and precipitation changes. Niger, and more generally the countries of the Sahelian belt, is surely experiencing strong environmental and climatic changes, but these are often not enough to explain this sharp increase of floods and flood impacts considering only the 1998–2015 period. In other words, the vulnerability of the Niger population seems to increase more and more markedly than the factors that are generally identified as triggers; it should therefore not be surprising that the number of statistically significant models is low. Furthermore, it must be considered that the implemented regression modelling does not include triggering factors such as (i) the insufficient drainage systems and poor urbanization in urban areas; and (ii) the upstream precipitations that occur in areas of watersheds outside Niger and influence the Niger river and right bank esorheic tributaries flow regimes. The fact that a higher number of statistically significant models found for affected settlements, people and destroyed houses compared to crop and livestock losses is probably due to the difficulty in collecting consistent and standardized data for the latter two. In the first years of the study period, crop losses were collected simply as number of field losses, without any reference to measurement units such as hectares. Only since 2013, data standardization has led to all measurements being expressed as hectares. Similar problems have been found with livestock, where losses in the first years were generically expressed as number of animals lost without any reference to their type leading to later difficulties for the conversion in TLU units. The spatial pattern of the significant models is for some aspects surprising, given that they were found mostly in western Agadez and southern Diffa Regions and that the latter is an area just moderately affected by floods. Moreover, very few significant results were found in parts of regions heavily affected by floods, such as southern Tahoua and Zinder, suggesting that, in those areas, more complex or not easily detectable processes are occurring, leading to increased flood events. On the other hand, the significant variables provide valuable information indicating which are the main triggers locally.
5. Conclusions
Flood information is a key factor for improving flood risk management and developing appropriate prevention and mitigation strategies. Furthermore, flood data provide a more complete shaping of vulnerability of the region faced with hydro-climatic hazards. In this context, this work has presented the ANFD database providing a valuable source on floods, which is useful to estimate the impacts on humans and ecosystems in one of the most vulnerable countries in the world. A national database that gathers data on this type of catastrophe is quite a unique case in an area such as this where data infrastructure development is still at an early stage. The ANFD is a valuable resource for several reasons: it helps (i) to develop a vulnerability assessment framework in Sahelian areas: (ii) to assist humanitarian action at both national and local levels; and (iii) to inform decision-making for disaster preparedness. As stated by Sohoulande Djebou and Singh [40], although climate change adaptation strategies in developing countries are part of the political agenda, pragmatic strategies are poorly undertaken. In addition, the gathered data can themselves be used to integrate and deepen the information coming from catastrophe databases worldwide and also to verify and validate data coming from other sources, especially when analyses are performed at sub-regional scale.
The present analyses highlighted spatial trend patterns that need to be further investigated in order to cope with this threat at sub-regional and local scales. This is especially necessary for those areas that do not normally receive adequate attention in the scientific environmental and climate debate. However, the lack of specific information regarding crucial aspects that define floods, such as causes, type of flood, size of flooded areas, limits the understanding that can be gained from the ANFD data. Since 2014, the ANFD gathers, when available, the amount of rain that caused a flood; this is still not sufficient to comprehensively and effectively characterize floods, so more effort should be made to improve the quality and quantity of flood data, at least regarding causes. Unfortunately, it must be stated that the determination of these aspects may sometimes be too complex, especially when dealt with by not highly qualified personnel in remote areas.
Currently, Niger flood data are stored in a stand-alone relational database. Given the value of these data and the importance of sharing them within the scientific community, a new open-source based web version is planned in the framework of the second phase of the ANADIA Project. This tool will allow remote access, data and map visualization and data sharing.
Supplementary Materials
The following are available online at https://www.mdpi.com/2225-1154/6/3/59/s1, Table S1: Departmental flood statistics, Table S2: Statistical parameters of significant linear models for “settlements affected at departmental level” dependent variable, Table S3: Statistical parameters of significant linear models for “people affected at departmental level” dependent variable, Table S4: Statistical parameters of significant linear models for “houses destroyed at departmental level” dependent variable, Table S5: Statistical parameters of significant linear models for “crop losses at departmental level” dependent variable, Table S6: Statistical parameters of significant linear models for “livestock losses at departmental level” dependent variable.
Author Contributions
E.F. conceived the paper, supported the statistical analysis, analyzed data and wrote the manuscript. A.C. performed the statistical data analysis and analyzed data. H.I., G.M., M.M. and V.T. analyzed data.
Funding
The study was co-financed in the framework of the ANADIA (Adaptation au Changement Climatique Prévention des Catastrophes et Développent Agricole pour la Sécurité alimentaire) Niger Project by the Italian Agency for Development Cooperation, the Institute of Biometeorology of the National Research Council of Italy (IBIMET_CNR), the Interuniversity Department of Regional and Urban Studies and Planning of Turin University (DIST-POLITO) and the National Meteorology Directorate of Niger (DMN).
Acknowledgments
The study was co-financed in the framework of the ANADIA (Adaptation au Changement Climatique Prévention des Catastrophes et Développent Agricole pour la Sécurité alimentaire) Niger Project by the Italian Agency for Development Cooperation, the Institute of Biometeorology of the National Research Council of Italy (IBIMET_CNR), the Interuniversity Department of Regional and Urban Studies and Planning of Turin University (DIST-POLITO) and the National Meteorology Directorate of Niger (DMN). The ANADIA Niger Project aims to contribute to the development of sustainable agriculture through the adaptation of production systems to climate change, to render them less vulnerable to extreme events, in order to support food security. To achieve this objective, it is necessary to strengthen the capacities of the different actors at national and local levels. This project, lasting 24 months, provides for the establishment of a methodology, the implementation of theoretical/practical training modules, the realization of practical case studies and awareness actions, dissemination and information on the results of the project. The authors thank Bartosz Mazurkiewicz of IBIMET for technical support and help in data analysis and Mahaman-Bohari Barmou Batoure of SAP for data analysis. The authors are also grateful to the three anonymous reviewers for their helpful comments which contributed to improving this manuscript.
Conflicts of Interest
The authors declare no conflict of interest.
References
- Lebel, T.; Amani, A. Rainfall estimation in the Sahel: What is the ground truth? J. Appl. Meteorol. Climatol. 1999, 38, 555–568. [Google Scholar] [CrossRef]
- New, M.; Hulme, M.; Jones, P. Representing twentieth-century space–time climate variability. Part II: Development of 1901–96 monthly grids of terrestrial surface climate. J. Clim. 2000, 13, 2217–2238. [Google Scholar] [CrossRef]
- Gado, B.A. Une Histoire des Famines au Sahel: Étude des Grandes Crises Alimentaires (XIXe-XX Siecles); L’Harmattan: Paris, France, 1993. [Google Scholar]
- Mortimore, M.J.; Adams, W.M. Farmer adaptation, change and ‘crisis’ in the Sahel. Glob. Environ. Chang. 2001, 11, 49–57. [Google Scholar] [CrossRef]
- Roudier, P.; Ducharne, A.; Feyen, L. Climate change impacts on runoff in West Africa: A review. Hydrol. Earth Syst. Sci. 2014, 18, 2789–2801. [Google Scholar] [CrossRef]
- Ali, A.; Lebel, T. The Sahelian standardized rainfall index revisited. Int. J. Climatol. 2009, 29, 1705–1714. [Google Scholar] [CrossRef] [Green Version]
- Fensholt, R.; Rasmussen, K. Analysis of trends in the Sahelian ‘rain-use efficiency’ using GIMMS NDVI, RFE and GPCP rainfall data. Remote Sens. Environ. 2011, 115, 438–451. [Google Scholar] [CrossRef]
- Mouhamed, L.; Traore, S.B.; Alhassane, A.; Sarr, B. Evolution of some observed climate extremes in the West African Sahel. Weather Clim. Extrem. 2013, 1, 19–25. [Google Scholar] [CrossRef]
- Descroix, L.; Genthon, P.; Amogu, O.; Rajot, J.L.; Sighomnou, D.; Vauclin, M. Change in Sahelian Rivers hydrograph: The case of recent red floods of the Niger River in the Niamey region. Glob. Planet. Chang. 2012, 98, 18–30. [Google Scholar] [CrossRef]
- Panthou, G.; Vischel, T.; Lebel, T.; Quantin, G.; Pugin, A.C.F.; Blanchet, J.; Ali, A. From pointwise testing to a regional vision: An integrated statistical approach to detect nonstationarity in extreme daily rainfall. Application to the Sahelian region. J. Geophys. Res. Atmos. 2013, 118, 8222–8237. [Google Scholar] [CrossRef] [Green Version]
- Favreau, G.; Cappelaere, B.; Massuel, S.; Leblanc, M.; Boucher, M.; Boulain, N.; Leduc, C. Land clearing, climate variability, and water resources increase in semiarid southwest Niger: A review. Water Resour. Res. 2009, 45. [Google Scholar] [CrossRef] [Green Version]
- Herrmann, S.M.; Anyamba, A.; Tucker, C.J. Recent trends in vegetation dynamics in the African Sahel and their relationship to climate. Glob. Environ. Chang. 2005, 15, 394–404. [Google Scholar] [CrossRef]
- Descroix, L.; Mahé, G.; Lebel, T.; Favreau, G.; Galle, S.; Gautier, E.; Olivry, J.-C.; Albergel, J.; Amogu, O.; Cappelaere, B.; et al. Spatio-temporal variability of hydrological regimes around the boundaries between Sahelian and Sudanian areas of West Africa: A synthesis. J. Hydrol. 2009, 375, 90–102. [Google Scholar] [CrossRef]
- Albergel, J. Sécheresse, désertification et ressources en eau de surface: Application aux petits bassins du Burkina Faso. Influ. Clim. Chang. Clim. Var. Hydrol. Regime Water Resour. 1987, 168, 355–365. [Google Scholar]
- Mahe, G.; Paturel, J.E.; Servat, E.; Conway, D.; Dezetter, A. The impact of land use change on soil water holding capacity and river flow modelling in the Nakambe River, Burkina-Faso. J. Hidrol. 2005, 300, 33–43. [Google Scholar] [CrossRef]
- Leblanc, M.J.; Favreau, G.; Massuel, S.; Tweed, S.O.; Loireau, M.; Cappelaere, B. Land clearance and hydrological change in the Sahel: SW Niger. Glob. Planet. Chang. 2008, 61, 135–150. [Google Scholar] [CrossRef]
- Fiorillo, E.; Maselli, F.; Tarchiani, V.; Vignaroli, P. Analysis of land degradation processes on a tiger bush plateau in South West Niger using MODIS and LANDSAT TM/ETM+ data. Int. J. Appl. Earth Obs. Geoinf. 2017, 62, 56–68. [Google Scholar] [CrossRef]
- Di Baldassarre, G.; Montanari, A. Uncertainty in river discharge observations: A quantitative analysis. Hydrol. Earth Syst. Sci. 2009, 13, 913. [Google Scholar] [CrossRef]
- Tschakert, P.; Dietrich, K.A. Anticipatory learning for climate change adaptation and resilience. Ecol. Soc. 2010, 15. Available online: http://www.jstor.org/stable/26268129 (accessed on 17 April 2018). [CrossRef]
- Amogu, O.; Descroix, L.; Souley Yéro, K.S.; Le Breton, E.; Mamadou, I.; Ali, A.; Vischel, T.; Bader, J.-C.; Moussa, I.B.; Gautier, E.; et al. Increasing river flows in the Sahel? Water 2010, 2, 170–199. [Google Scholar] [CrossRef]
- Descroix, L.; Moussa, I.B.; Genthon, P.; Sighomnou, D.; Mahé, G.; Mamadou, I.; Vandervaere, J.-P.; Gautier, E.; Faran Maiga, O.; Rajot, J.-L.; et al. Impact of drought and land–use changes on surface–water quality and quantity: The Sahelian paradox. In Current Perspectives in Contaminant Hydrology and Water Resources Sustainability; InTech: Zagreb, Croatie, 2013. [Google Scholar] [CrossRef]
- Seguis, L.; Cappelaere, B.; Milési, G.; Peugeot, C.; Massuel, S.; Favreau, G. Simulated impacts of climate change and land-clearing on runoff from a small Sahelian catchment. Hydrol. Process. 2004, 18, 3401–3413. [Google Scholar] [CrossRef]
- Aich, V.; Koné, B.; Hattermann, F.F.; Müller, E.N. Floods in the Niger basin–analysis and attribution. Nat. Hazards Earth Syst. Sci. Discuss. 2014, 2, 5171–5212. [Google Scholar] [CrossRef]
- Tarhule, A. Damaging rainfall and flooding: The other Sahel hazards. Clim. Chang. 2005, 72, 355–377. [Google Scholar] [CrossRef]
- Aich, V.; Koné, B.; Hattermann, F.F.; Paton, E.N. Time series analysis of floods across the Niger River basin. Water 2016, 8, 165. [Google Scholar] [CrossRef]
- Ozer, P.; Hountondji, Y.; Laminou Manzo, O. Evolution des caractéristiques pluviométriques dans l’est du Niger de 1940 à 2007. Geol. Ecol. Trop. 2009, 33, 11–30. [Google Scholar]
- Lebel, T.; Ali, A. Recent trends in the Central and Western Sahel rainfall regime (1990–2007). J. Hydrol. 2009, 375, 52–64. [Google Scholar] [CrossRef]
- Funk, C.C.; Peterson, P.J.; Landsfeld, M.F.; Pedreros, D.H.; Verdin, J.P.; Rowland, J.D.; Romero, B.E.; Husak, G.J.; Michaelsen, J.C.; Verdin, A.P. A Quasi-Global Precipitation Time Series for Drought Monitoring. Data Ser. 832 2014, 4. [Google Scholar] [CrossRef]
- Dembélé, M.; Zwart, S.J. Evaluation and comparison of satellite-based rainfall products in Burkina Faso, West Africa. Int. J. Remote Sens. 2016, 37, 3995–4014. [Google Scholar] [CrossRef] [Green Version]
- Hmimina, G.; Dufrêne, E.; Pontailler, J.Y.; Delpierre, N.; Aubinet, M.; Caquet, B.; de Grandcourt, A.; Burban, B.; Flechard, C.; Granier, A.; et al. Evaluation of the potential of MODIS satellite data to predict vegetation phenology in different biomes: An investigation using ground-based NDVI measurements. Remote Sens. Environ. 2013, 132, 145–158. [Google Scholar] [CrossRef]
- Rouse, J., Jr.; Haas, R.H.; Schell, J.A.; Deering, D.W. Monitoring Vegetation Systems in the Great Plains with ERTS 351. In Proceedings of the Third ERTS Symposium, NASA SP-351, Washington, DC, USA, 11–14 December 1973; U.S. Govt. Printing Office: Washington, DC, USA, 1974; Volume 1, pp. 309–317. [Google Scholar]
- Fensholt, R.; Rasmussen, K.; Kaspersen, P.; Huber, S.; Horion, S.; Swinnen, E. Assessing land degradation/recovery in the African Sahel from long-term earth observation based primary productivity and precipitation relationships. Remote Sens. 2013, 5, 664–686. [Google Scholar] [CrossRef] [Green Version]
- R Core Team. R: A Language and Environment for Statistical Computing; R Foundation for Statistical Computing: Vienna, Austria, 2012. Available online: https://www.R-project.org/ (accessed on 20 April 2018).
- Pohlert, T.; Pohlert, M.T.; Test, M.K.T.; Test, B.U.; Test, S.N.H. Package ‘trend’: Non-Parametric Trend Tests and Change-Point Detection. R Package Version 1.0.1. 2018. Available online: https://CRAN.R-project.org/package=trend (accessed on 19 April 2018).
- Nakazawa, M. fmsb: Functions for Medical Statistics Book with Some Demographic Data. R Package Version 0.6.3. 2018. Available online: https://CRAN.R-project.org/package=fmsb (accessed on 10 April 2018).
- Hair, J.F., Jr.; Anderson, R.E.; Tatham, R.L.; Black, W.C. Multivariate Data Analysis, 7th ed.; Macmillan: New York, NY, USA, 2009; ISBN 10-0138132631. [Google Scholar]
- Sighomnou, D.; Descroix, L.; Genthon, P.; Mahé, G.; Moussa, I.B.; Gautier, E.; Mamadou, I.; Vandervaere, J.P.; Bachir, T.; Coulibaly, B.; et al. La crue de 2012 à Niamey: Un paroxysme du paradoxe du Sahel? Sécheresse 2013, 24, 3–13. [Google Scholar] [CrossRef]
- Amogu, O. La Dégradation des Espaces Sahéliens et ses Conséquences sur L’alluvionnement du Fleuve Niger Moyen. Ph.D. Thesis, Université Joseph Fourier, Grenoble, France, 2009. [Google Scholar]
- Mamadou, I. La Dynamique des Koris et L’ensablement de Leur Lit et de Celui du Fleuve Niger dans la Région de Niamey. Ph.D. Thesis, Paris 1 Panthéon Sorbonne University, Paris, France, Abdou Moumouni University, Niamey, Niger, 2012. [Google Scholar]
- Sohoulande Djebou, D.C.S.; Singh, V.P. Impact of climate change on the hydrologic cycle and implications for society. Environ. Soc. Psychol. 2015, 1, 9–16. [Google Scholar]
- Mamadou, I.; Gautier, E.; Descroix, L.; Noma, I.; Moussa, I.B.; Maiga, O.F.; Genthon, P.; Amogu, O.; Malam Abdou, M.; Vandervaere, J.-P. Exorheism growth as an explanation of increasing flooding in the Sahel. Catena 2015, 131, 130–139. [Google Scholar] [CrossRef]
- d’Herbès, J.M.; Valentin, C. Land surface conditions of the Niamey region: Ecological and hydrological implications. J. Hidrol. 1997, 188, 18–42. [Google Scholar] [CrossRef]
- Chinen, T. Recent accelerated gully erosion and its effects in dry savanna, southwest of Niger. Hum. Response Drastic Chang. Environ. Africa 1999, 67–102. [Google Scholar]
- Dardel, C.; Kergoat, L.; Hiernaux, P.; Grippa, M.; Mougin, E.; Ciais, P.; Nguyen, C.-C. Rain-use-efficiency: What it tells us about the conflicting Sahel greening and Sahelian paradox. Remote Sens. 2014, 6, 3446–3474. [Google Scholar] [CrossRef] [Green Version]
Figure 1.
Relief map of Niger with regional and departmental administrative divisions and isohyets (dataset climate hazards group infrared precipitation with stations (CHIRPS) v2p0 average 1981–2010).
Figure 1.
Relief map of Niger with regional and departmental administrative divisions and isohyets (dataset climate hazards group infrared precipitation with stations (CHIRPS) v2p0 average 1981–2010).

Figure 2.
Damage at the national level during the 1998–2015 period.

Figure 3.
Percentage of flood damage in 2010–2015 of the total 1998–2015 period per department; white areas represent departments not affected by flood damage over the 1998–2015 study period.
Figure 3.
Percentage of flood damage in 2010–2015 of the total 1998–2015 period per department; white areas represent departments not affected by flood damage over the 1998–2015 study period.

Figure 4.
Settlements and people affected per department in the 1998–2015 study period. See the “Exploring the ANFD” section for details.
Figure 4.
Settlements and people affected per department in the 1998–2015 study period. See the “Exploring the ANFD” section for details.
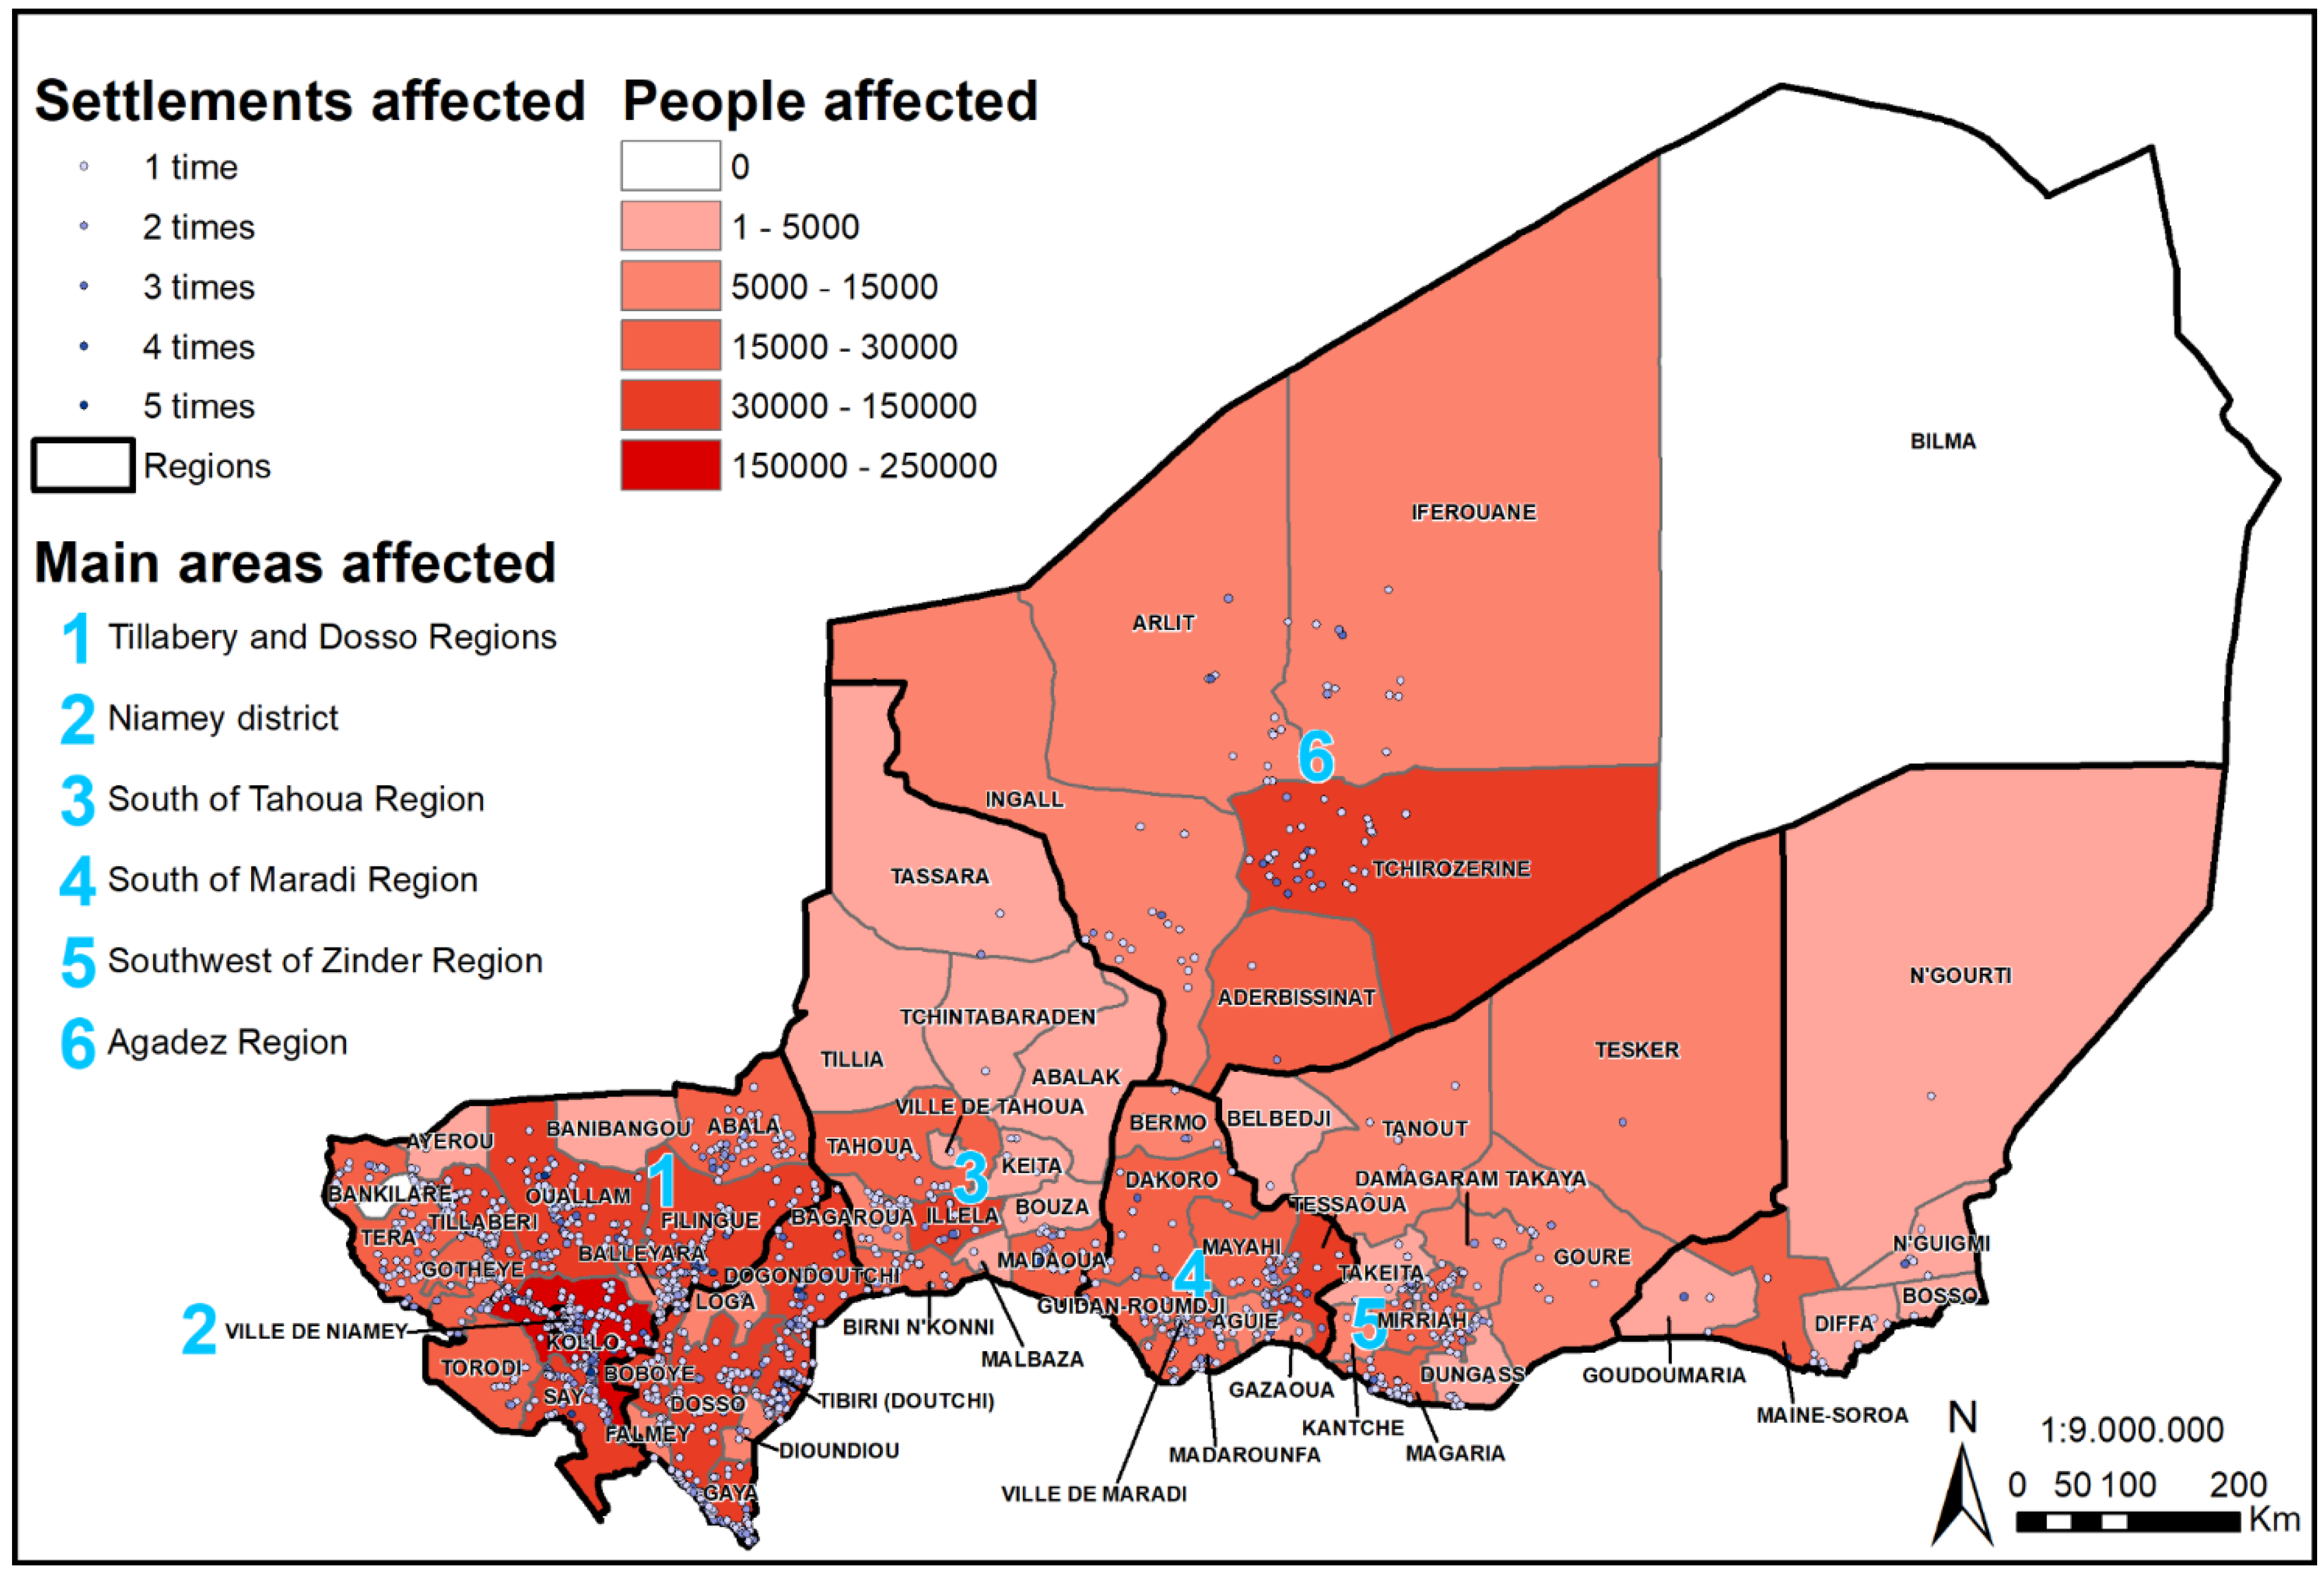
Figure 5.
Moderate resolution imaging spectroradiometer (MODIS) normalized difference vegetation index (NDVI) trends during the 2000–2015 period. White pixels are statistically not significant (p > 0.1).
Figure 5.
Moderate resolution imaging spectroradiometer (MODIS) normalized difference vegetation index (NDVI) trends during the 2000–2015 period. White pixels are statistically not significant (p > 0.1).

Figure 6.
Maximum rainfall CHIRPS trends during the 2000–2015 period. White pixels are statistically not significant (p > 0.1).
Figure 6.
Maximum rainfall CHIRPS trends during the 2000–2015 period. White pixels are statistically not significant (p > 0.1).

Figure 7.
Statistically significant (p < 0.1) models for the five investigated flood damage statistics at departmental level.
Figure 7.
Statistically significant (p < 0.1) models for the five investigated flood damage statistics at departmental level.

Table 1.
National flood damage and related percentages of the total dividing 1998–2015 into three periods. TLU: tropical livestock units.
Table 1.
National flood damage and related percentages of the total dividing 1998–2015 into three periods. TLU: tropical livestock units.
| Period | Settlements Affected | People Affected | Houses Destroyed | Crop Losses (ha) | Livestock Losses (TLU) | |||||
|---|---|---|---|---|---|---|---|---|---|---|
| Data | % | Data | % | Data | % | Data | % | Data | % | |
| 1998–2003 | 542 | 14 | 184,496 | 11 | 12,964 | 11 | 23,727 | 14 | 1718 | 8 |
| 2004–2009 | 524 | 13 | 249,897 | 14 | 11,825 | 10 | 8366 | 5 | 2650 | 13 |
| 2010–2015 | 2876 | 73 | 1,320,514 | 75 | 90,358 | 78 | 138,807 | 81 | 16,245 | 79 |
| TOTAL | 3942 | 100 | 1,754,907 | 100 | 115,147 | 100 | 170,900 | 100 | 20,612 | 100 |
Table 2.
Regional flood statistics (SA = settlements affected; PA = people affected; HD = houses destroyed; CL = crop losses; LL = livestock losses; Y = number of years with at least one flood).
Table 2.
Regional flood statistics (SA = settlements affected; PA = people affected; HD = houses destroyed; CL = crop losses; LL = livestock losses; Y = number of years with at least one flood).
| Region | SA | PA | DH | CL | LL | Y | |||||
|---|---|---|---|---|---|---|---|---|---|---|---|
| Data | % | Data | % | Data | % | ha | % | TLU | % | ||
| Agadez | 236 | 6 | 171,204 | 10 | 5652 | 5 | 22,413 | 13.1 | 5554 | 27 | 12 |
| Diffa | 89 | 2 | 38,383 | 2 | 2353 | 2 | 554 | 0.3 | 3 | 0 | 7 |
| Dosso | 1111 | 28 | 357,689 | 20 | 30,097 | 26 | 29,881 | 17.5 | 87 | 0 | 17 |
| Maradi | 554 | 14 | 163,479 | 9 | 9672 | 8 | 2755 | 1.6 | 1083 | 5 | 15 |
| Niamey district | 158 | 4 | 161,497 | 9 | 20,558 | 18 | 1511 | 0.9 | 128 | 1 | 15 |
| Tahoua | 193 | 5 | 128,708 | 7 | 6282 | 5 | 2486 | 1.5 | 167 | 1 | 17 |
| Tillaberi | 1296 | 33 | 596,940 | 34 | 29,241 | 25 | 108,352 | 63.4 | 8831 | 43 | 14 |
| Zinder | 305 | 8 | 137,007 | 8 | 11,292 | 10 | 2949 | 1.7 | 4759 | 23 | 8 |
| Total | 3942 | 100 | 1,754,907 | 100 | 115,147 | 100 | 170,900 | 100 | 20,612 | 100 | 12 |
Table 3.
Statistically significant explanatory variables for the significant departmental-scale models summarized per region (RSUM = annual rainfall; SUM_Q95 = extreme events rainfall; POP = population estimates).
Table 3.
Statistically significant explanatory variables for the significant departmental-scale models summarized per region (RSUM = annual rainfall; SUM_Q95 = extreme events rainfall; POP = population estimates).
| Region | NDVI | RSUM | SUM_Q95 | POP | REGIONAL TOTAL |
|---|---|---|---|---|---|
| Agadez | 4 | 9 | 4 | 9 | 26 |
| Diffa | 0 | 8 | 2 | 1 | 11 |
| Dosso | 4 | 3 | 3 | 6 | 16 |
| Maradi | 2 | 2 | 5 | 3 | 12 |
| Niamey district | 1 | 0 | 0 | 4 | 5 |
| Tahoua | 1 | 0 | 2 | 0 | 3 |
| Tillaberi | 6 | 4 | 5 | 3 | 18 |
| Zinder | 0 | 1 | 1 | 2 | 4 |
| National total | 18 | 27 | 22 | 28 | 95 |
© 2018 by the authors. Licensee MDPI, Basel, Switzerland. This article is an open access article distributed under the terms and conditions of the Creative Commons Attribution (CC BY) license (http://creativecommons.org/licenses/by/4.0/).
Share and Cite
MDPI and ACS Style
Fiorillo, E.; Crisci, A.; Issa, H.; Maracchi, G.; Morabito, M.; Tarchiani, V. Recent Changes of Floods and Related Impacts in Niger Based on the ANADIA Niger Flood Database. Climate 2018, 6, 59. https://doi.org/10.3390/cli6030059
AMA Style
Fiorillo E, Crisci A, Issa H, Maracchi G, Morabito M, Tarchiani V. Recent Changes of Floods and Related Impacts in Niger Based on the ANADIA Niger Flood Database. Climate. 2018; 6(3):59. https://doi.org/10.3390/cli6030059
Chicago/Turabian StyleFiorillo, Edoardo, Alfonso Crisci, Hassimou Issa, Giampiero Maracchi, Marco Morabito, and Vieri Tarchiani. 2018. "Recent Changes of Floods and Related Impacts in Niger Based on the ANADIA Niger Flood Database" Climate 6, no. 3: 59. https://doi.org/10.3390/cli6030059
Note that from the first issue of 2016, this journal uses article numbers instead of page numbers. See further details here.