Article

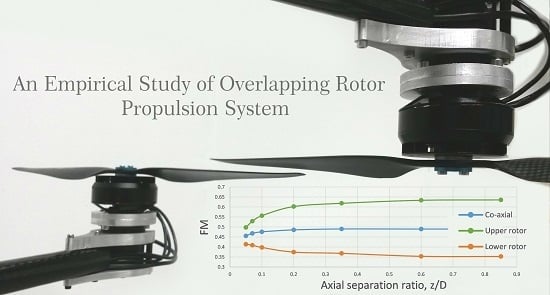
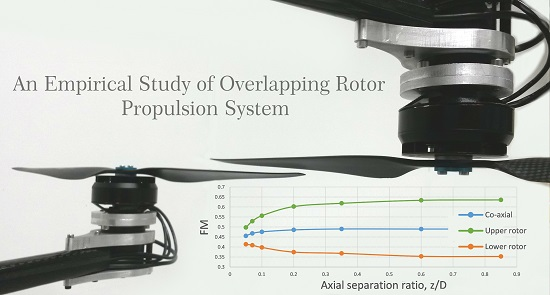
An Empirical Study of Overlapping Rotor Interference for a Small Unmanned Aircraft Propulsion System

by
Mantas Brazinskas
*,†,
Stephen D. Prior
and
James P. Scanlan
Boldrewood Innovation Campus, University of Southampton, Southampton SO16 7QF, UK
*
Author to whom correspondence should be addressed.
These authors contributed equally to this work.
Aerospace 2016, 3(4), 32; https://doi.org/10.3390/aerospace3040032
Submission received: 25 July 2016 / Revised: 23 September 2016 / Accepted: 28 September 2016 / Published: 10 October 2016
(This article belongs to the Collection Unmanned Aerial Systems)

Abstract

:
The majority of research into full-sized helicopter overlapping propulsion systems involves co-axial setups (fully overlapped). Partially overlapping rotor setups (tandem, multirotor) have received less attention, and empirical data produced over the years is limited. The increase in demand for compact small unmanned aircraft has exposed the need for empirical investigations of overlapping propulsion systems at a small scale (Reynolds Number < 250,000). Rotor-to-rotor interference at the static state in various overlapping propulsion system configurations was empirically measured using off the shelf T-Motor 16 inch × 5.4 inch rotors. A purpose-built test rig was manufactured allowing various overlapping rotor configurations to be tested. First, single rotor data was gathered, then performance measurements were taken at different thrust and tip speeds on a range of overlap configurations. The studies were conducted in a system torque balance mode. Overlapping rotor performance was compared to an isolated dual rotor propulsion system revealing interference factors which were compared to the momentum theory. Tests revealed that in the co-axial torque-balanced propulsion system the upper rotor outperforms the lower rotor at axial separation ratios between 0.05 and 0.85. Additionally, in the same region, thrust sharing between the two rotors changed by 21%; the upper rotor produced more thrust than the lower rotor at all times. Peak performance was recorded as a 22% efficiency loss when the axial separation ratio was greater than 0.25. The performance of a co-axial torque-balanced system reached a 27% efficiency loss when the axial separation ratio was equal to 0.05. The co-axial system swirl recovery effect was recorded to have a 4% efficiency gain in the axial separation ratio region between 0.05 and 0.85. The smallest efficiency loss (3%) was recorded when the rotor separation ratio was between 0.95 and 1 (axial separation ratio was kept at 0.05). Tests conducted at a rotor separation ratio of 0.85 showed that the efficiency loss decreased when the axial separation ratio was greater than 0.25. The lower rotor outperformed the upper rotor in the rotor separation ratio region from 0.95 to 1 (axial separation ratio was kept at 0.05) at an overall system thrust of 8 N, and matched the upper rotor performance at the tested overall thrust of 15 N.

Graphical Abstract

1. Introduction

The interest in small multi-rotor unmanned aerial vehicles (SUAVs) is increasing. These platforms are used in both the civilian and military sectors. Civilian applications are related to fire control, search and rescue, agriculture, maintenance of structures, and media. The military uses these platforms for ground control operations, border surveillance, crowd control and, in some cases, attack operations. The Teal Group’s study estimates that: “the drone market will increase from the current worldwide production of £3 billion annually to £316 billion, totaling £73 billion in the next ten years. With the addition of military research spending this would rise to £94 billion over the decade” [1].
When addressing multi-rotor systems, the system volume, payload capability, and endurance are the most important aspects. All of these areas are closely linked to the platform propulsion system. Overlapping rotor propulsion systems provide one of the smallest platform volume per thrust output, however, this comes at a cost to the efficiency when compared to fully isolated rotor systems [2].
Overlapping rotor propulsion systems in the UAV field can be used in a variety of ways. The most conventional design implements three overlapping rotor units in one platform, which individually operate at the zero torque condition. Moment equilibrium is achieved when the rotors in the overlapping propulsion unit rotate in different directions (clockwise and anticlockwise). There is a possibility to discard unit torque equilibrium when an equal number of overlapping rotor units are used. One example of such a system would be the co-axial quadrotor (Figure 1a). Overlapping rotor units on such platforms can be designed to have rotors spinning at different rates, disregarding the torque produced, rotors could also spin in the same direction as long as there is another overlapping unit in the system counteracting the induced torque moment (Figure 1b). However, there has been sparse empirical data produced to quantify efficiency gains or losses if such designs were implemented.
Though a variety of off-the-shelf SUAV rotors are available for multi-rotor systems, the data to support the design and optimization process is limited. Additionally, most of the empirical studies were conducted using full-sized helicopters. For smaller sizes of UAVs, there is a change in the propulsion system aerodynamic efficiency due to lower Reynolds number (Re). In fact, the size of small UAVs forces wings and rotors to work at low Re (20–250,000) much closer to those experienced by small birds and insects [3]. Formation of the laminar separation bubble (LSB) has a dominant effect on the Re = 10,000~100,000 flow field [4] causing higher induced drag on small propulsion systems as well. This issue is more apparent when it comes to overlapping rotor systems, due to the upper and lower rotor interference effects. Within this regime, a comparison between previously-developed full-sized aircraft systems is not applicable. Full-sized propulsion systems operate at a wide range of thrust coefficients since their flight dynamics are achieved by controlling rotor blade pitch. The majority of multi-rotor SUAVs adopt direct drive, fixed-pitch rotor systems, where flight is achieved by varying the angular velocities of the individual rotors. At heading-locked hover, multi-rotor platforms, unlike full-sized conventional helicopters, can have rotors operating at different torques as long as the system torque is at an equilibrium state (Qsystem = 0). The propulsion system performance of most SUAVs is driven by the characteristics of off-the-shelf rotors. However, studies on overlapping rotor effects when using highly twisted rotors that are optimized for isolated multi-rotor propulsion systems are limited.
Studies on overlapping, full-sized propulsion systems is summarized well by Coleman [5] through a report which included analysis of empirical and theoretical research conducted up to the mid-1990s. Most of the interest during that period was to study load sharing of two rotors and single rotor equivalent solidity when compared to co-axial systems. Benefits of an overlapping rotor propulsion system were already seen when research by [6,7] showed such system performance benefits when compared to the same solidity single rotor systems (~10% increase). When looking at Coleman’s report one could conclude that the field of overlapping propulsion systems, at least for a full-sized helicopter, is fairly defined, since numerous empirical tests were done to quantify overlapping propulsion systems. However, many studies were conducted using “non-self-sustained” test equipment, meaning that analytical tools had to be used to extract the data.
Several researchers [6,8,9,10,11,12,13,14,15,16] empirically investigated co-axial propulsion systems (d/D = 0). Most of the early research in this area was done using blades greater than 1.5 m in diameter. Only recently were smaller rotor tests put forward with the research carried out by McAlister [16], Bohorquez [13], Ramasamy [15], and Theys et al. [17]. Most of this research was conducted when both rotors are operating in torque equilibrium. Only [13] and [15] involve testing overlapping rotor configurations where thrust sharing of both the upper and lower rotors is equal, disregarding unit torque. However, in both works, this was achieved by varying the rotor blade pitch, unlike in the UAV field where optimization of the propulsion system would be hard to achieve when identical off-the-shelf rotors with fixed pitch are used.
Even less research exists in the literature that deals with tandem propulsion systems where 0 < d/D < 1. Full-sized helicopter rotors achieving trim by changing rotor pitch and fixing rotational velocities were investigated by [15,18,19]. Some of the higher fidelity tests on overlapping rotor systems closer to the sizes of small UAV rotors used in this research (D = 0.406 m) could be seen in [15,17]. Ramasamy [15] has used twisted variable pitch rotors of 1.314 m in diameter. Theys et al. [17] have conducted overlapping rotor tests using fixed pitch off-the-shelf Graupner 9 inch × 5 inch rotors which have a diameter of 0.229 m.

2. Research Aims

There are two main overlapping rotor propulsion system areas, with multiple sub-categories towards which this research is aimed. The propulsion system configuration diagram is presented in Figure 2. Data deficiencies and contradictory findings in this research field that motivated this study are listed below:

2.1. Overlapping Rotor System d/D = 0

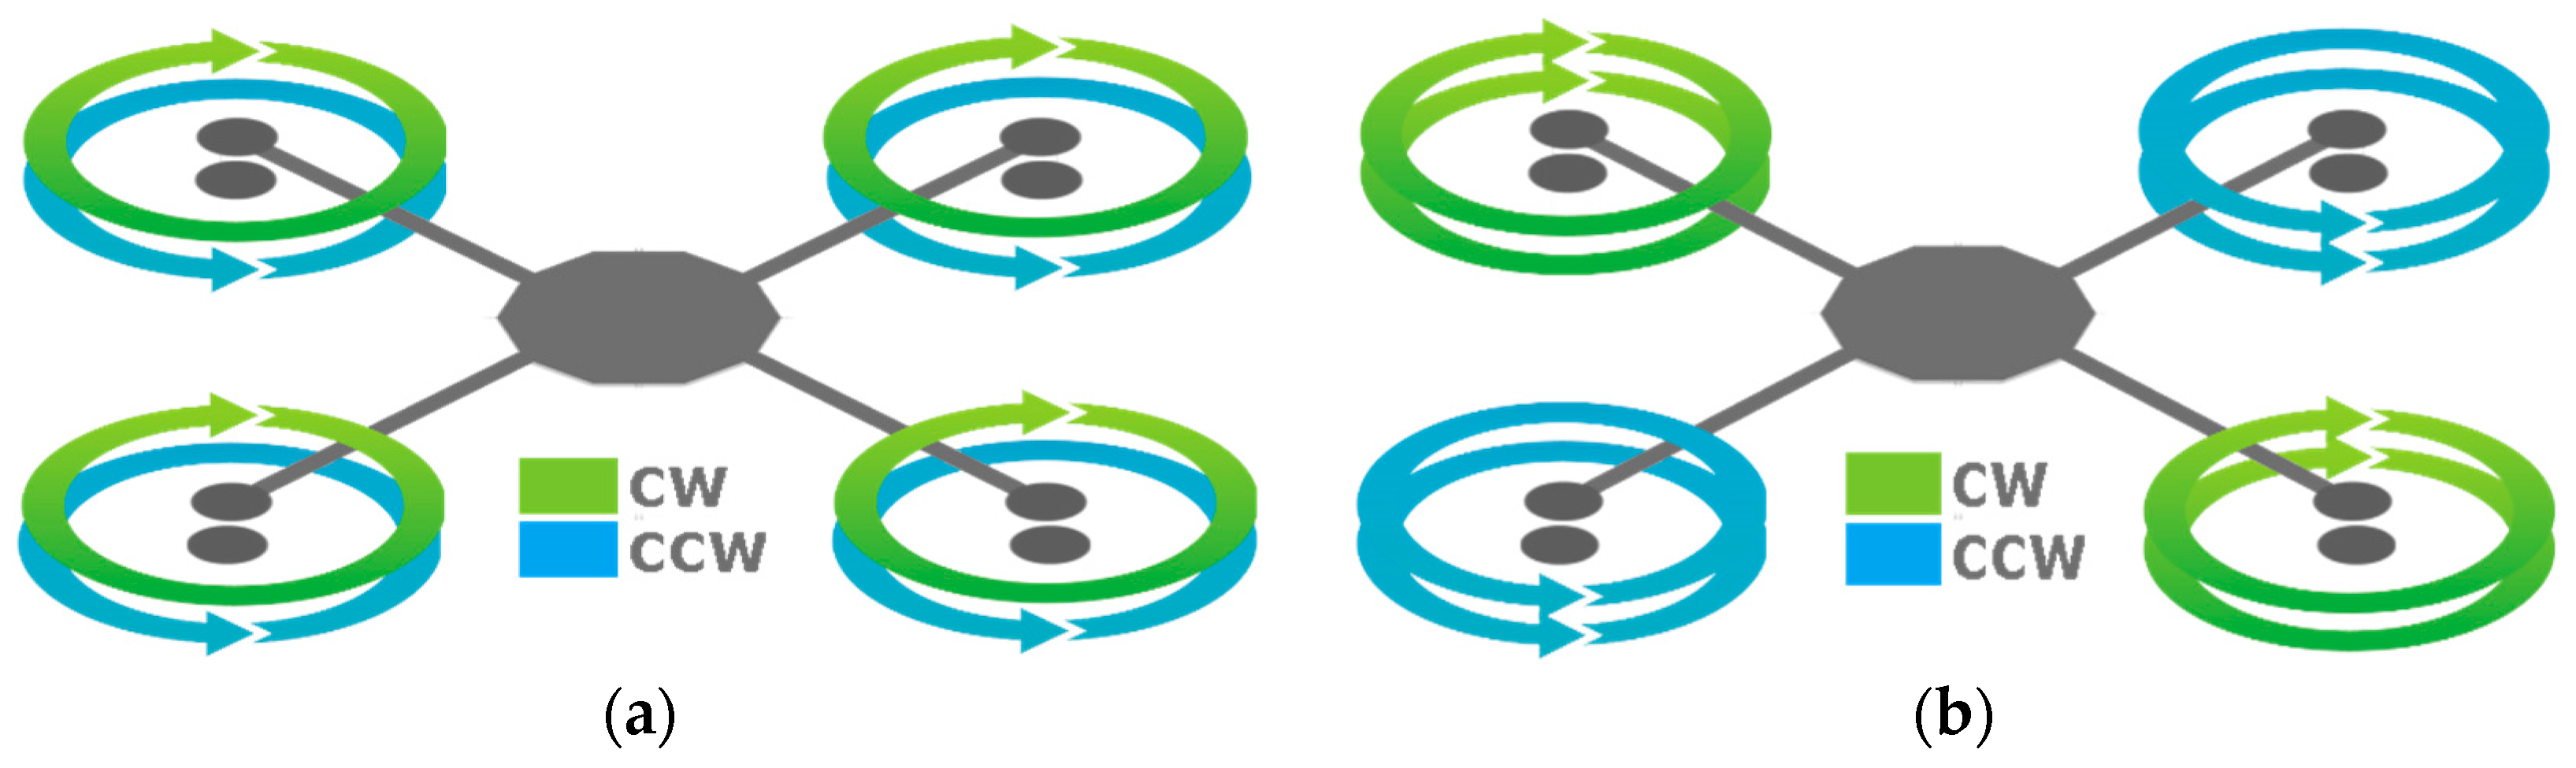
2.1.1. Thrust Sharing

The research interest lies in the quantification of overlapping rotor propulsion thrust sharing between upper and lower rotors in a coaxial system. Contradictions in this area could be seen when results are compared from Nagashima et al. [6], who state that there is a 50% change in the lower rotor thrust through the 1D axial rotor separation range, and McAlister et al. [16], who have observed only a 10% change through the same range. Some clarification has been introduced with the research done by Ramasamy [15] with an approximately 20% change when highly-twisted rotors were used (similar to UAV rotors). It has to be noted that Nagashima et al. [6] obtained torque balance mathematically since the tests were done on a “torque imbalanced” setup. McAlister et al. [16] allowed net thrust to vary when measurements were taken and Ramasamy [15] balanced the torque by changing the collective pitch of the rotors.

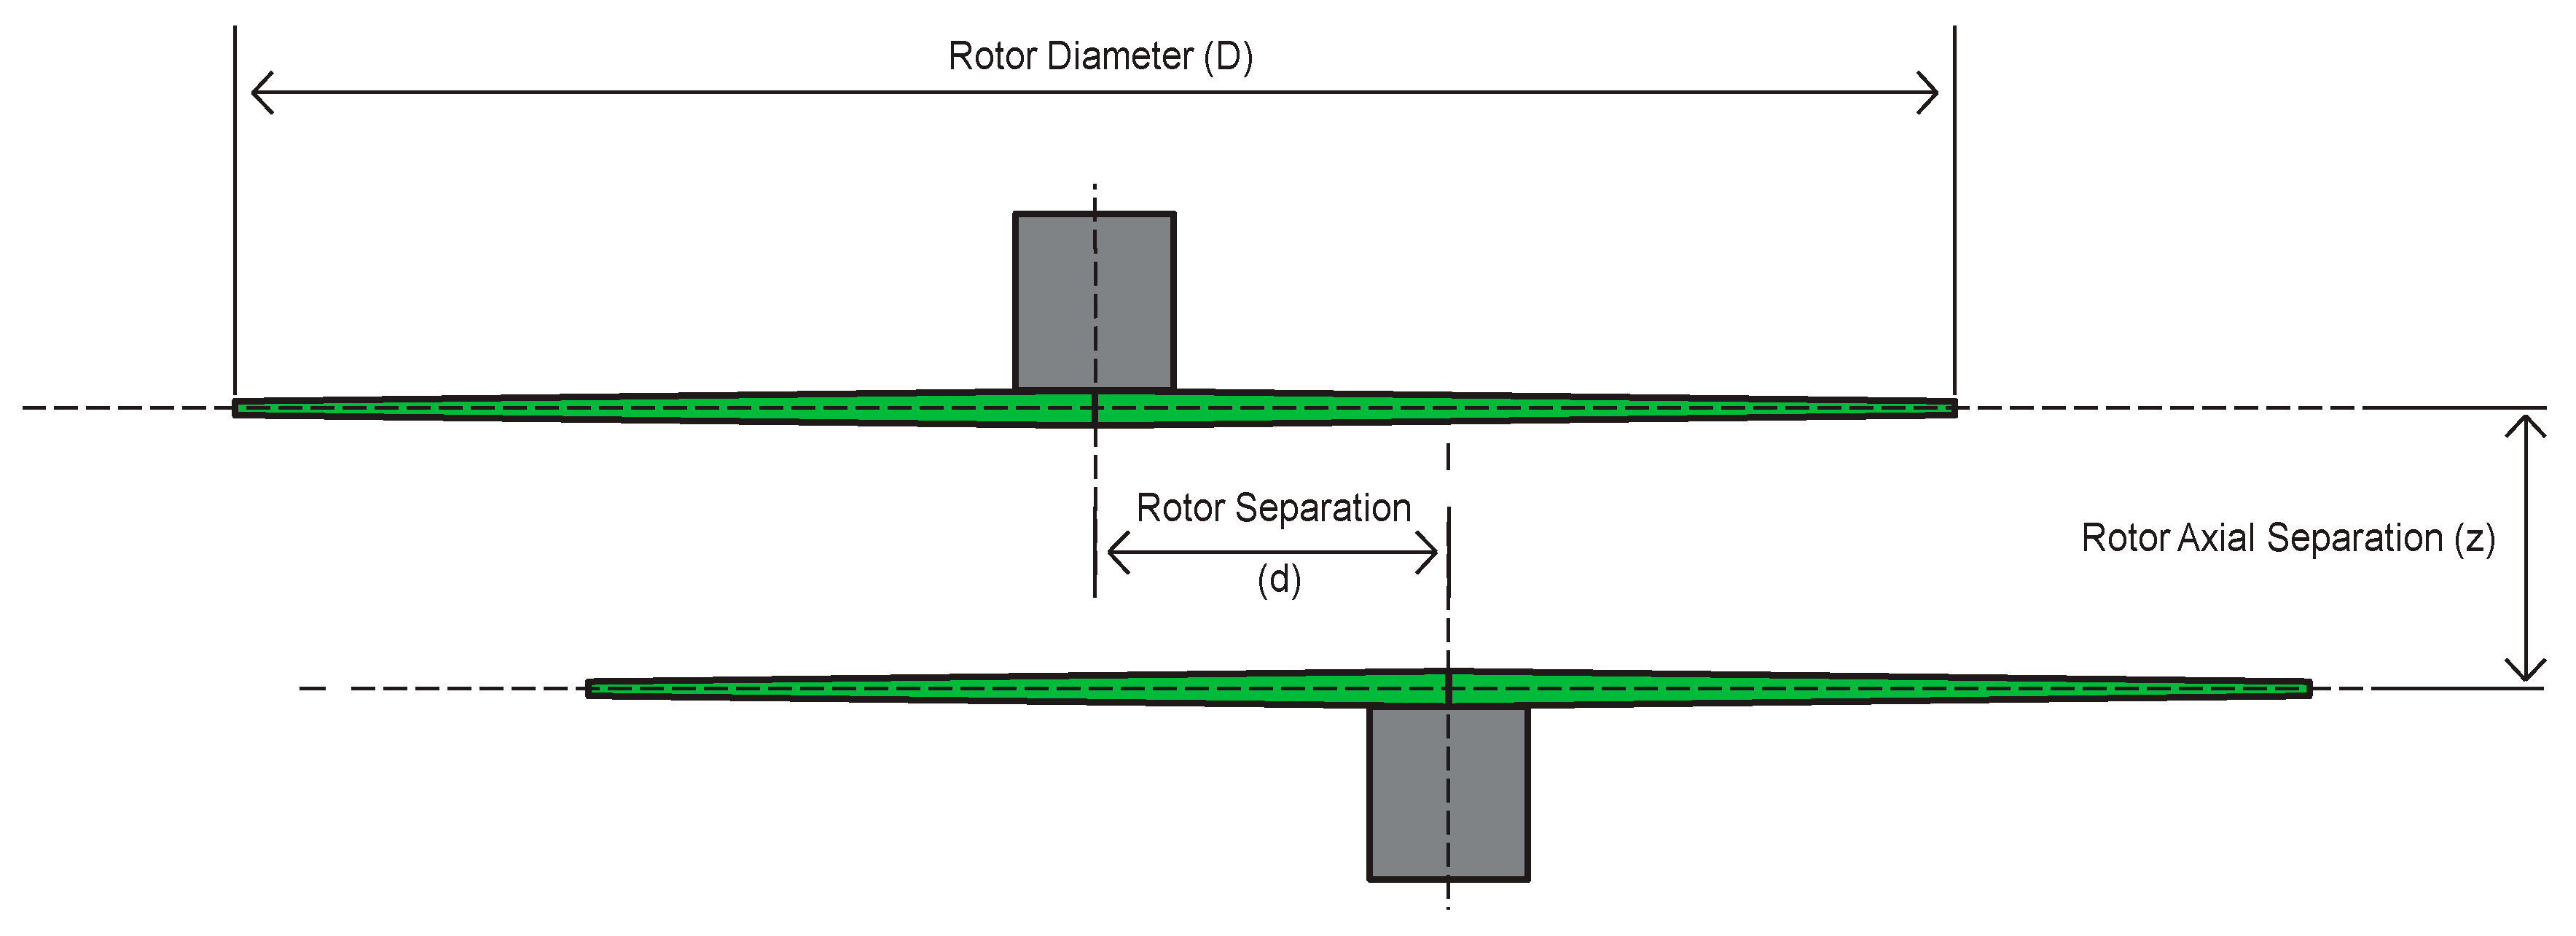
2.1.2. Vertical or Axial Rotor Separation (z/D)

Inspection of most full-sized co-axial helicopters reveals that propulsion systems have been designed to an average z/D = 0.09 [20]. Empirical data obtained by [6,13,14,16] show performance gains up to z/D = 0.1, contrary to research done by [15,21,22], which indicates performance gains all the way up to z/D = 0.15.

2.1.3. Co-Rotating Rotor Performance

Even from the early days co-axial propulsion systems were assumed to fundamentally benefit from a swirl recovery due to the use of contra-rotating rotors. On the other hand, research in this field in a form of empirical data is almost non-existent due to the inherent benefit of efficiency gains when the tail rotor is no longer needed when designing full-sized helicopters [5]. Multi-rotor systems have the advantage of flexibility in this area, therefore, they would benefit from any effect quantification. Only recently Ramasamy [15] has conducted a limited number of tests that revealed a 5% gain in efficiency of contra-rotating rotors over a co-rotating system. All tests were done at z/D = 0.07, contra-rotating rotors were operated at torque-balance (Qu + Ql = 0), and co-rotating rotors were tested at equal torques (Qu = Ql).

2.2. Overlapping Rotor System d/D > 0

Various Overlapping Rotor d/D Ratios
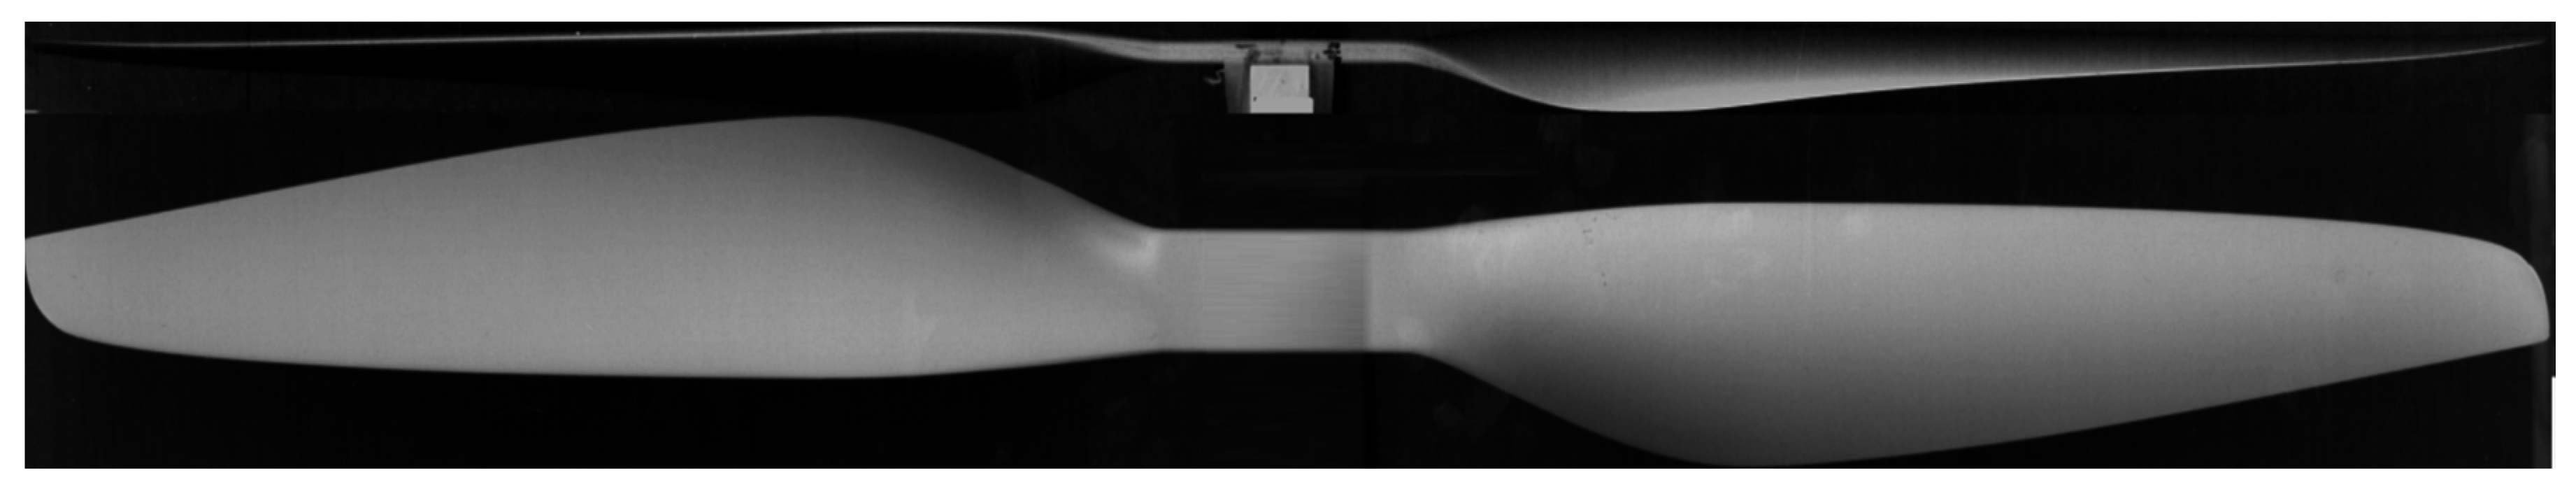
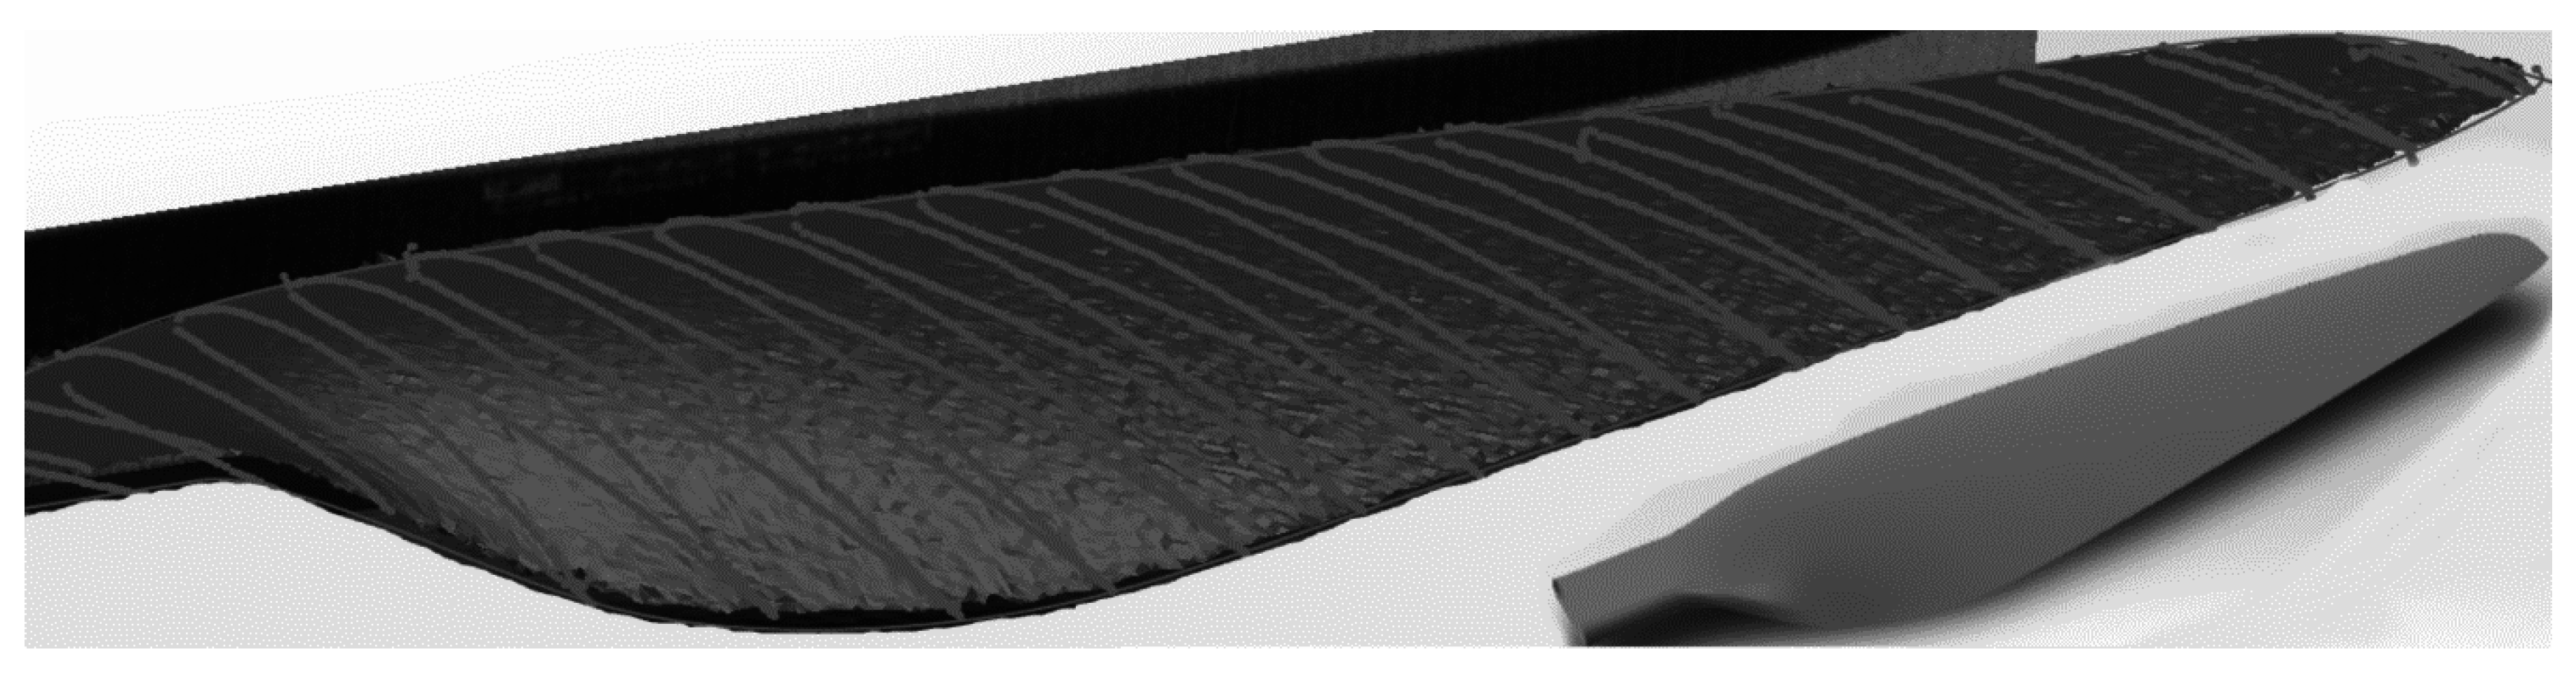
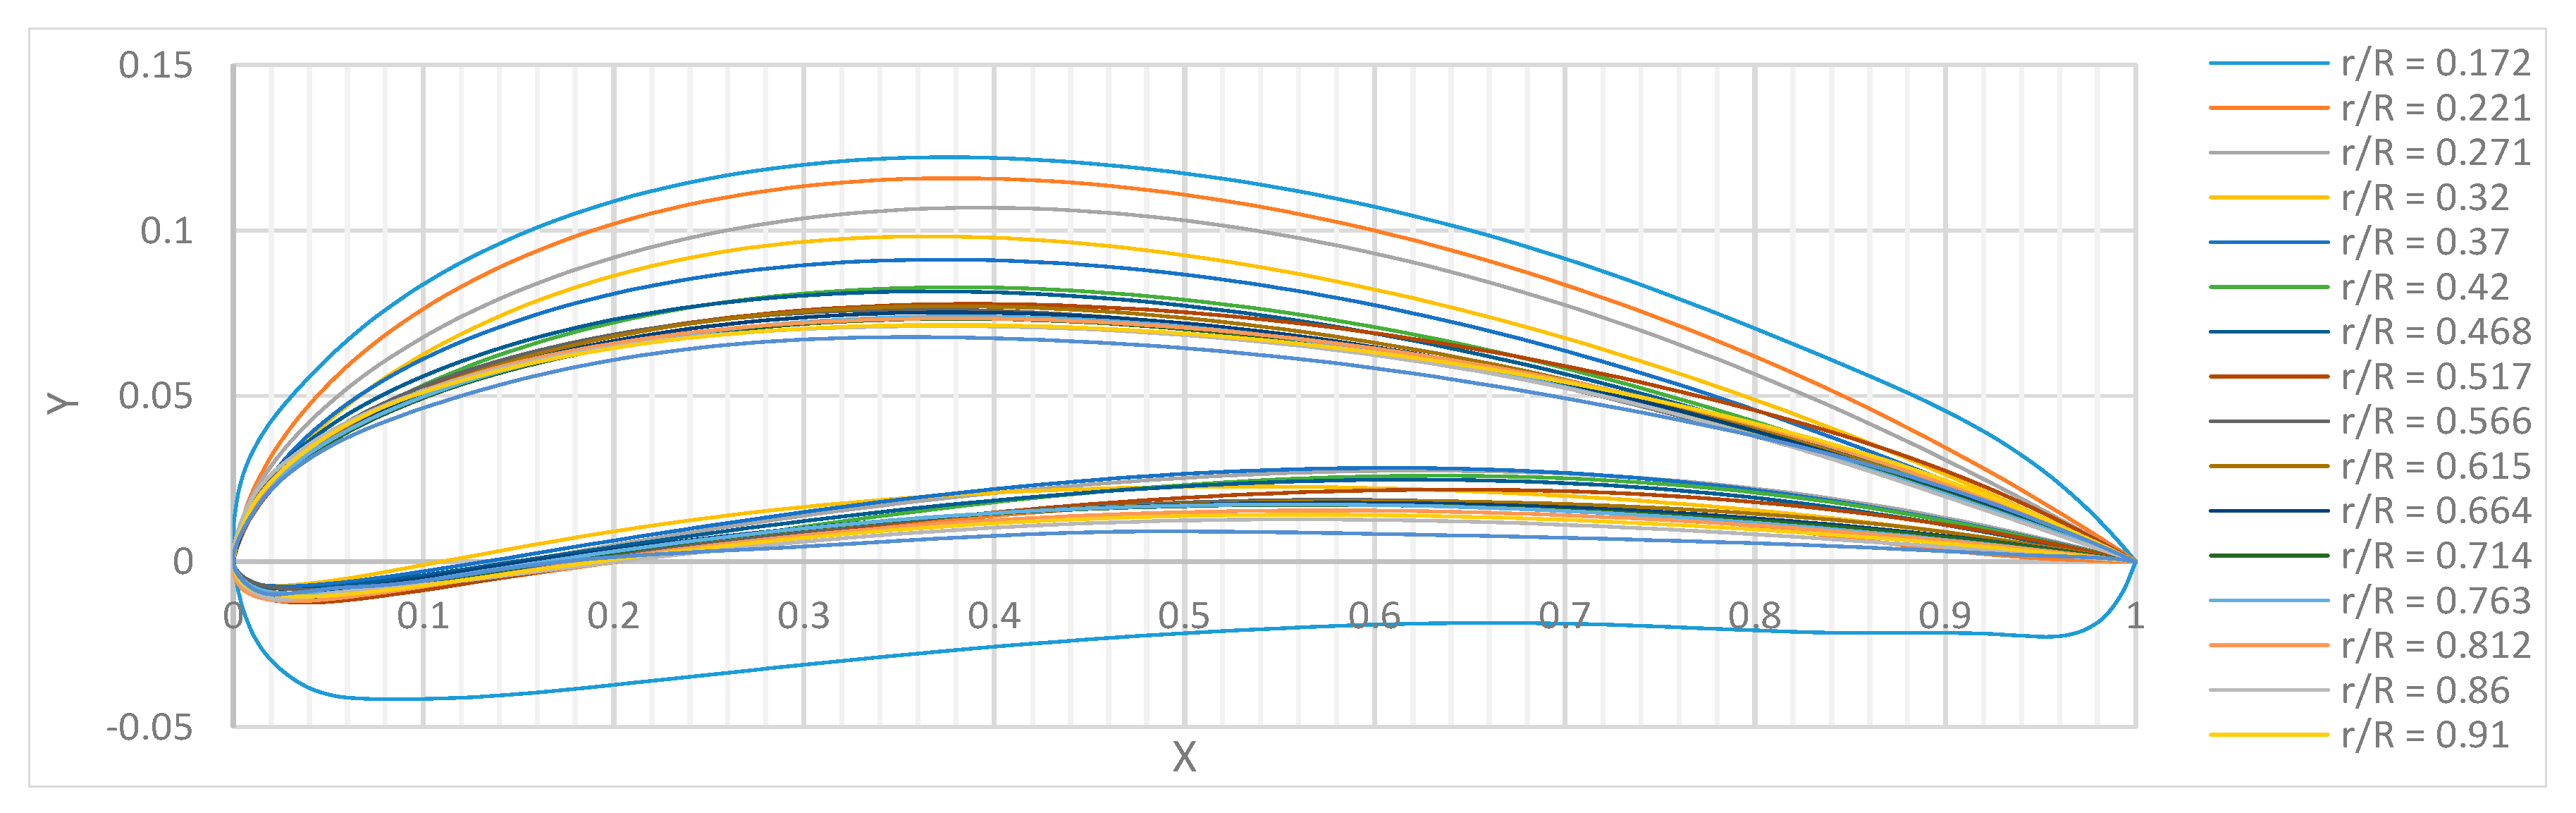
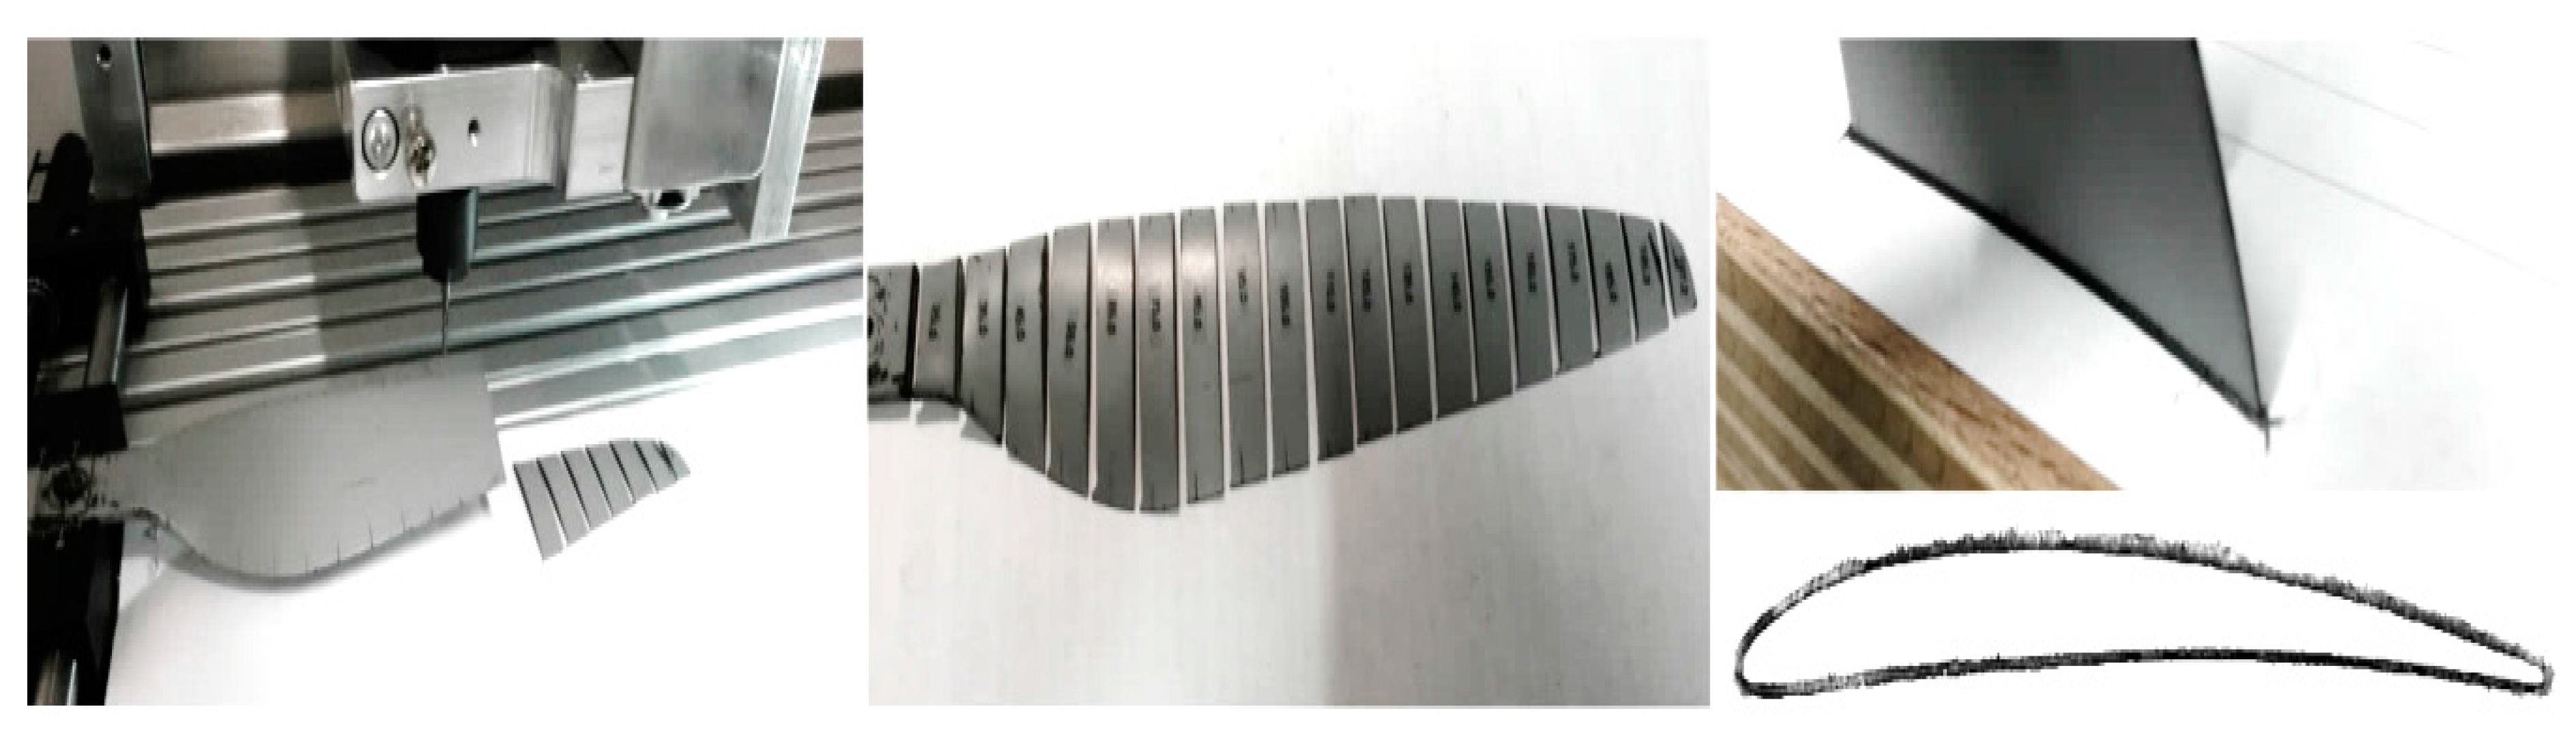
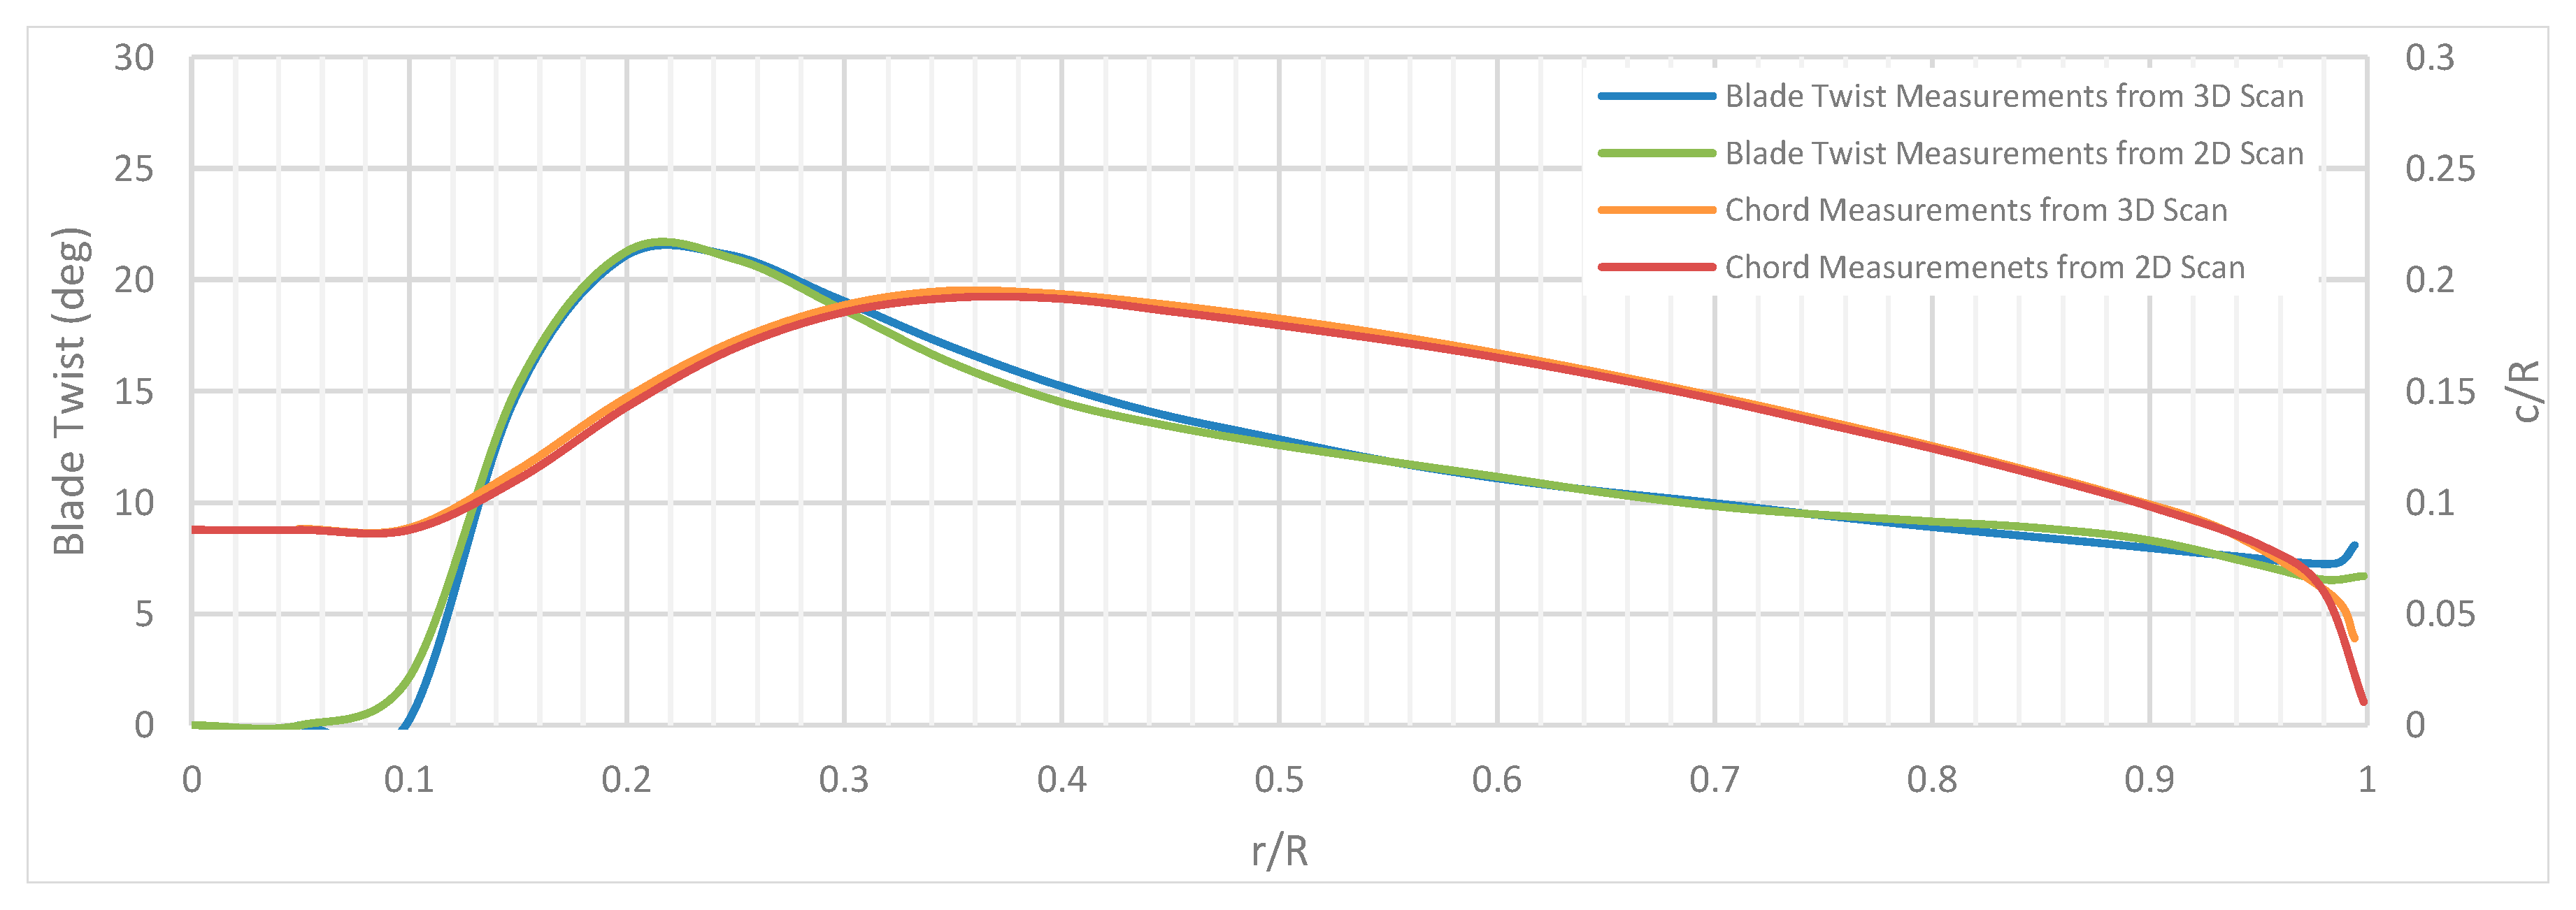
Only a handful of previous experiments have provided individual rotor data in the overlapping rotor system setup. Stepniewski and Keys [23] measured performance of an overlapping system, however, analytical tools had to be used afterwards to analyze the data since experiments were done on a “torque imbalanced” system. Contradicting data could be found as well at d/D ratios close to 1 (rotors close to being separated). Leishman and Griffiths [24] predicted an increase in propulsion system efficiency with peak gains at d/D ~ 0.9, which was backed by Dingledein [9], who has recorded an 18% efficiency increase. Contradictory observations can be found when looking at Ramasamy [15], who has measured losses of more than 3% at d/D close to 1 when highly-twisted rotors are used. Even greater efficiency losses (~14%) were recorded by Heyson [25] and Sweet [26]. Theys et al.’s [17] experiments using SUAV components showed no decline or increase in propulsion system performance at 0.85 < d/D < 0.9, however, there is a lack of information on their test setup in regards to the torque balance of the rotors.

3. Rotor Geometry

A commercially available T-Motor 16 inch × 5.4 inch rotor was used for this overlapping rotor propulsion system analysis. The T-Motor 16 inch × 5.4 inch geometry is optimized for isolated propulsion systems and used specifically in the multi-rotor field. The rotor geometry was digitally recreated using three complimentary methods (3D scanning, 2D scanning, and section cut tracing) to obtain a better rotor geometry definition.
2D scanning was achieved using a conventional scanner. Rotor isometric, side, and top views were acquired by placing the rotor level on the scanner bed (Figure 3). Contrast differences in the image were used to detect rotor leading and trailing edges. Rotor geometry parameters were extracted from 1:1 scale images. The chord length was measured by integrating the pixel count from the leading to the trailing edges using the top view. The inverse tangent of the top and side view pixel count gave the geometric angle of attack. Span locations were measured from the centerline of the rotor.
3D scanning was conducted using a handheld scanner (ZScanner 600) (ZCorp, Rock Hill, SC, USA). The scanner has a resolution of 0.1 mm. Upper and lower surfaces of the rotor were obtained separately due to the constraints of the scanner itself. SolidWorks CAM (SolidSolutions, London, UK) software was used to manage and stitch both surfaces together. For extra accuracy 2D isometric images were used to provide surface alignment references, as well as scanned features, like rotor hub holes. The reconstructed model was sliced at various span locations to obtain airfoil contours (Figure 4).
The rotor was physically cut with a Computer Numerical Control (CNC) mill using the same span locations as for the 3D model. Rotor sections were traced using a sharp pencil (Figure 5). A second data set of airfoil coordinates was obtained to support the 3D scanning method data since the trailing and leading edges of some span sections were not captured sufficiently well enough using the previous method.
Figure 6 shows the external geometry of the rotor. Both methods (3D scanning and 2D scanning) yielded similar results, proving that 3D scanning is unnecessary when high-quality isometric pictures are obtained.
Two-dimensional airfoil shapes (Figure 7) were obtained using cut section tracing together with reconstructed sections of a 3D scanned rotor. Similar to the external geometry measurements, 3D scanning has required more work and provided a much coarser map of 2D airfoils, and was used only to sanity check data gathered by physically cutting a rotor into sections. Some of the recreated airfoils closer to the blade root could not be recognized or linked to any well-established airfoil family. For the purpose of this research defining rotor blade airfoils was not crucial, therefore, only bespoke airfoil coordinates were are shown (see Supplementary Material Table S1).

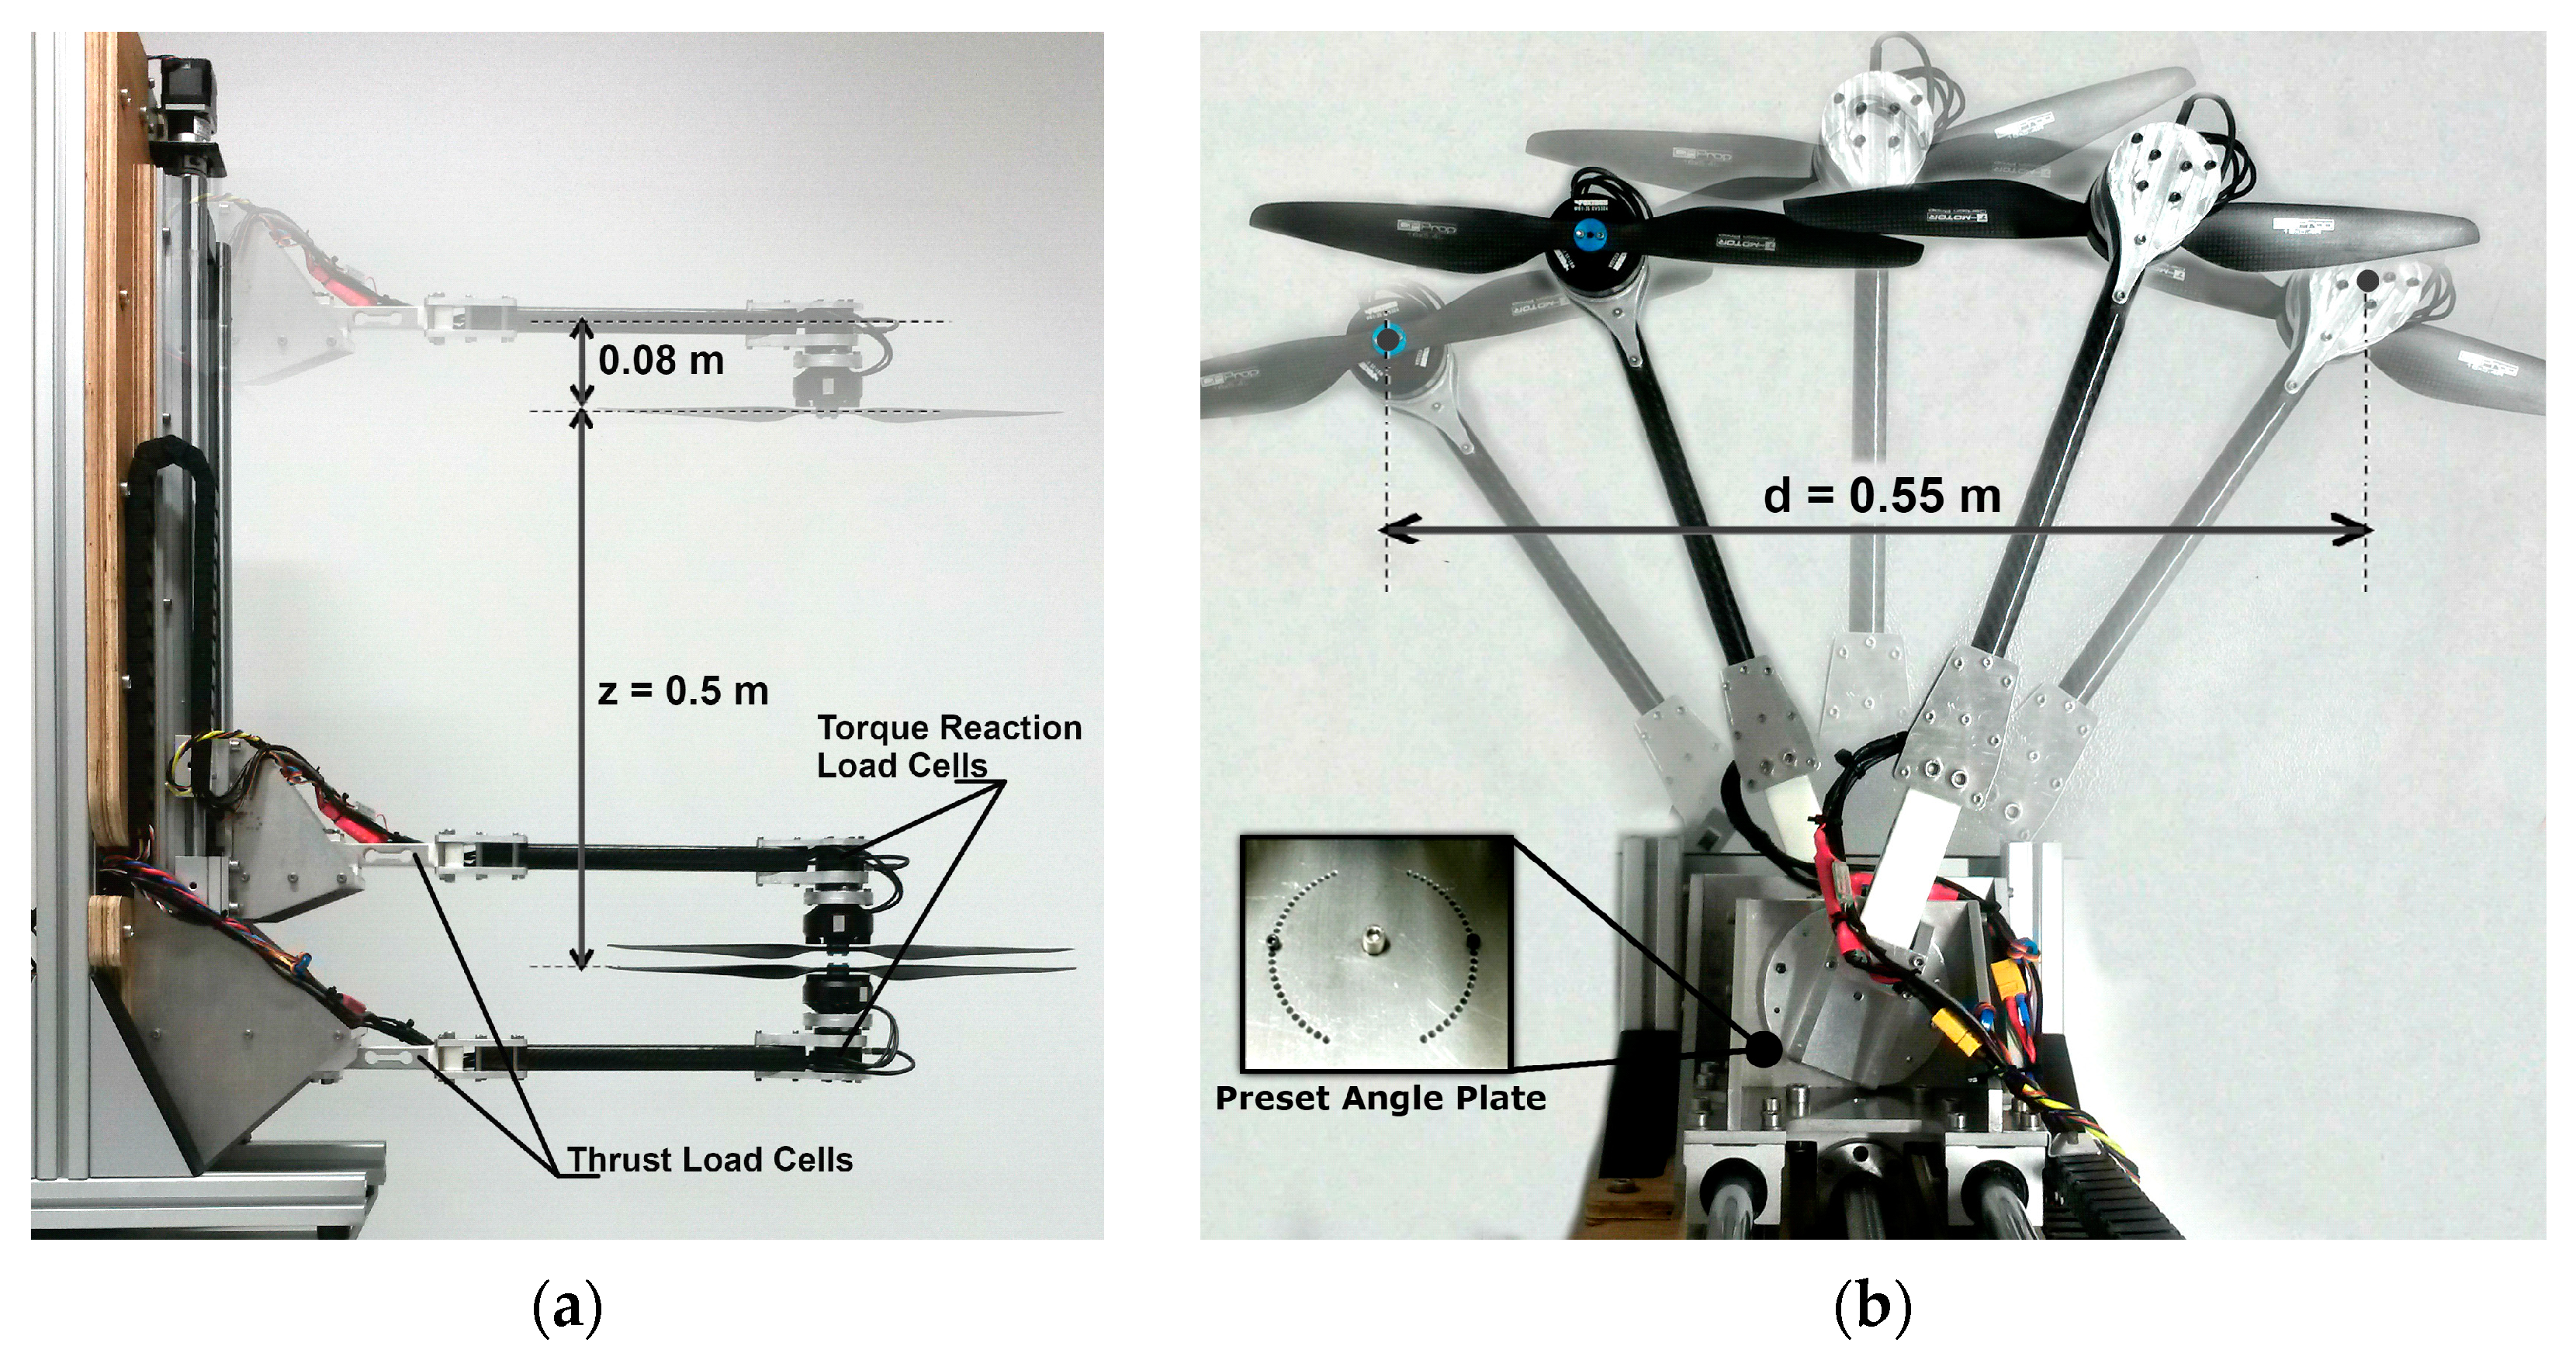
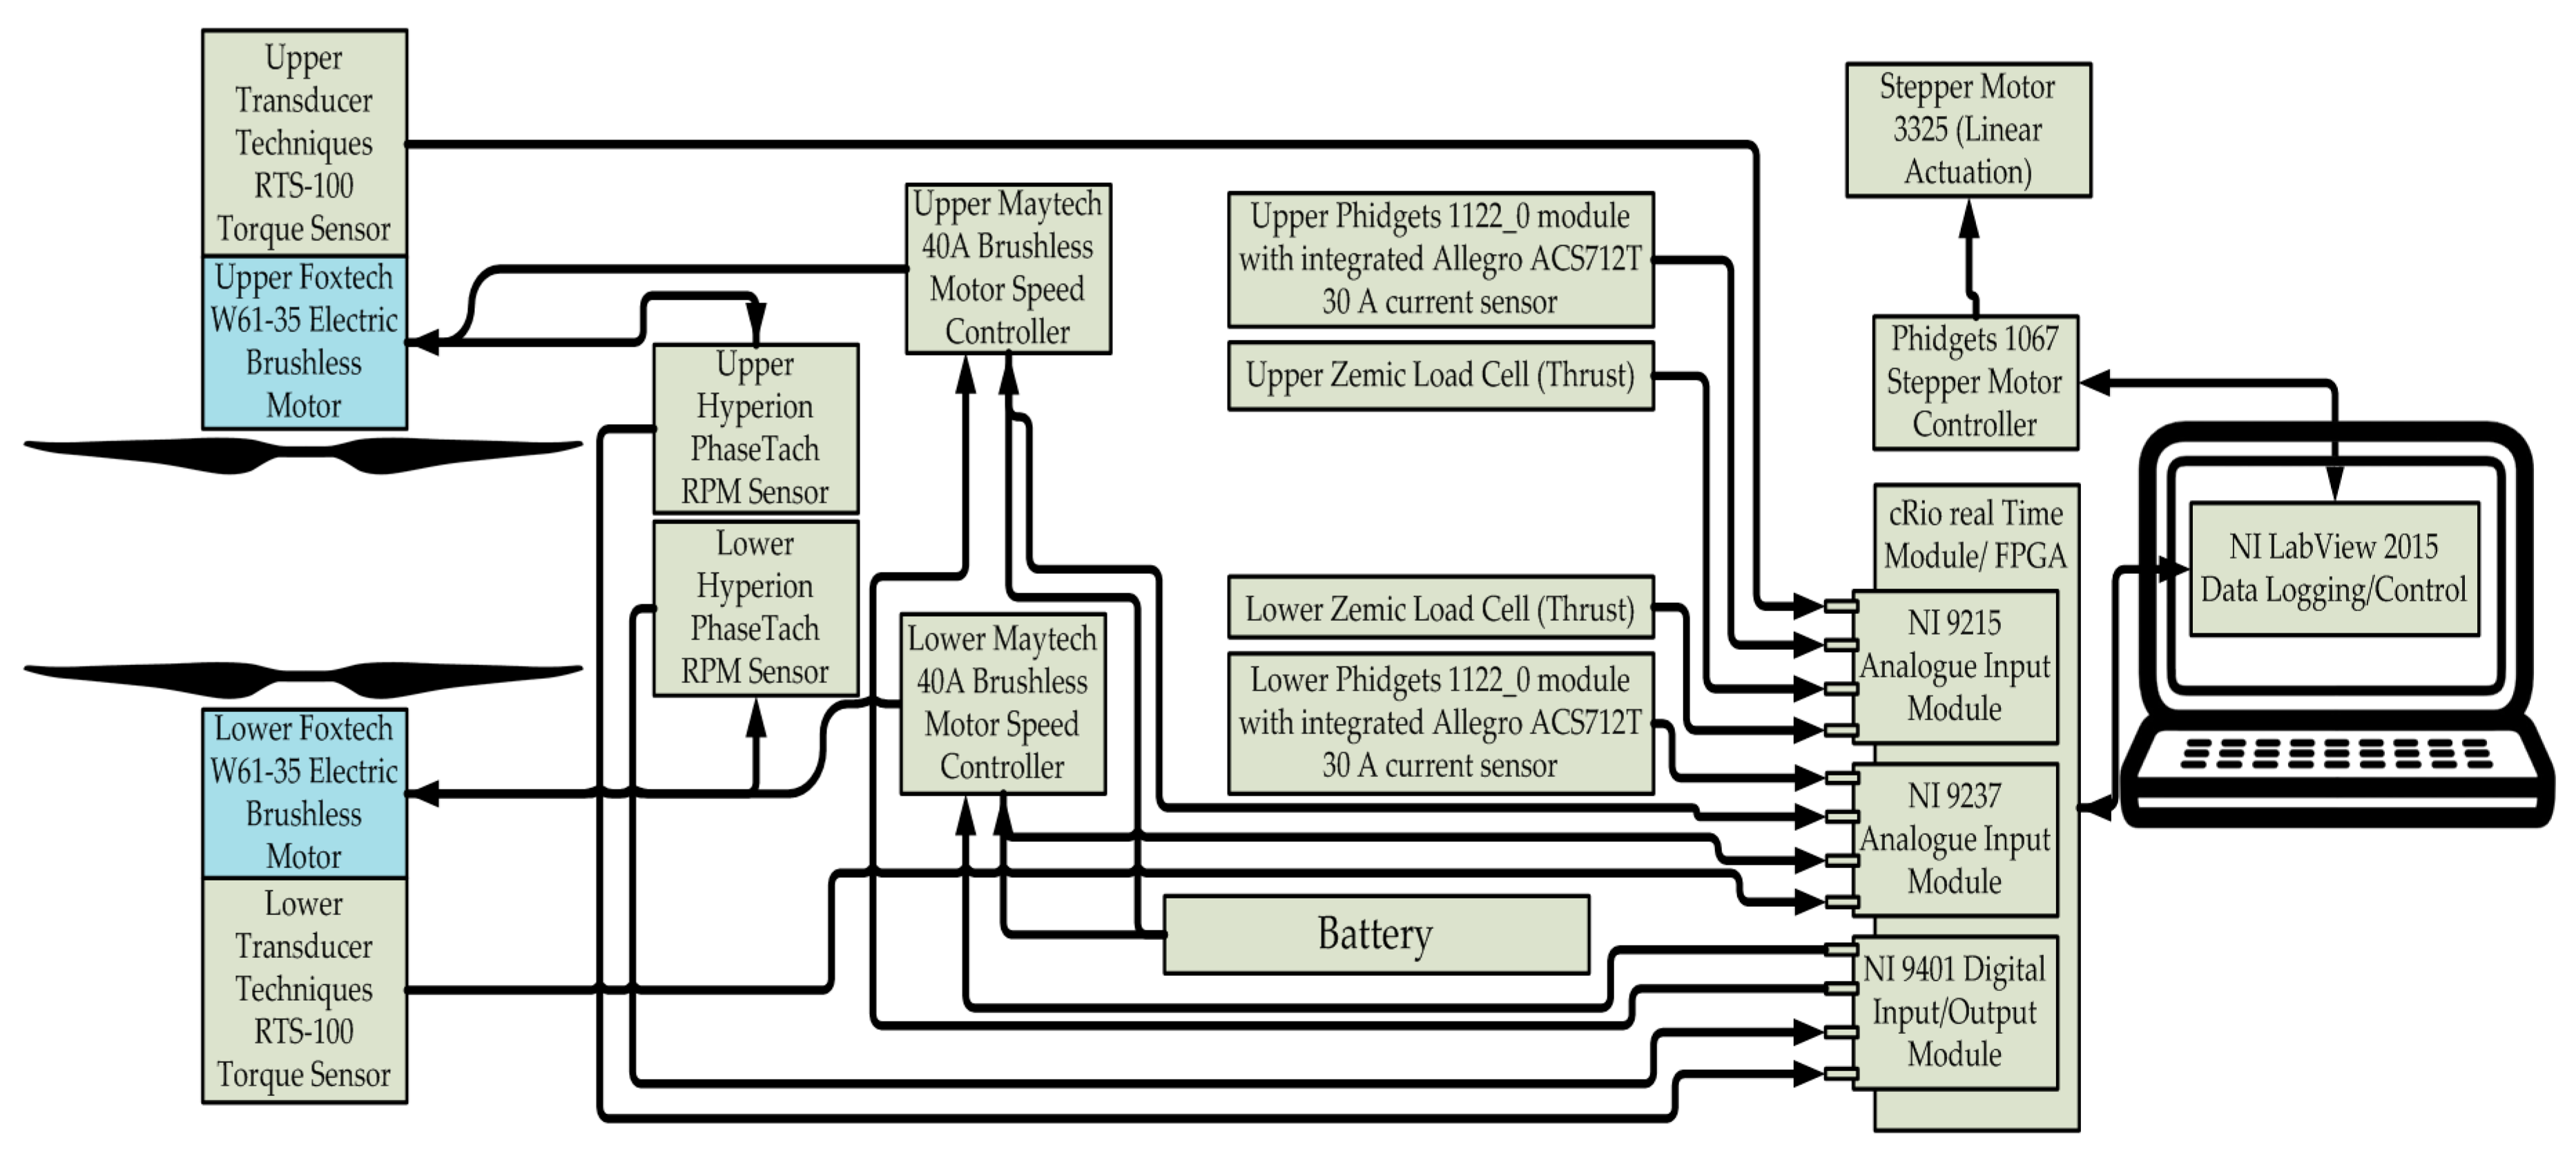
4. Experimental Setup

An overlapping rotor test rig was manufactured and built in-house at Southampton University (Figure 8). The test rig design allows manipulation of propulsion system parameters z/D and d/D. z/D rotor separation is achieved by a custom linear actuator traversing the upper rotor. The lower rotor always stays at the same distance from the ground. All of the tests for this study were achieved when the lower rotor plane was three rotor diameters away from the ground. The selected leadscrew and stepper motor configuration allows for 0.05 mm z/D resolution.
The rotor horizontal separation (d/D) is manually set when moving the test rig arms away from each other (Figure 8b). High-precision locating pins were used to set the arms at preset d/D ratios. Each arm was moved in the smallest increments of 5° guided by the individual arm preset angle plate. A high-accuracy (2 arcmin) mechanical protractor was used when d/D ratios other than the ones predefined by locating pins were desired.
Two FOXTECH W61-35 (FOXTECH, Tianjin, China) brushless DC (BLDC) (16 poles) 700 W motors were used to directly drive the rotors. Hyperion HP-EM2-TACHBL (Hyperion HK, Fo Tan, Shatin, N.T., Hong Kong, China) sensors were used for Rotations Per Minute (RPM) measurements (Figure 9). The sensors produce a square wave signal when back Electromotive Force (back-EMF) is detected on one of the three motor phases, thus giving eight pulses per one revolution when used with the 16 pole BLDC motors.
Thrust data was aquired by using the shear load cells on both arms separately (Figure 8a). Installing thrust sensors at the root of the arm is not ideal for the separate rotor thrust measurements in the overlapping setup. The data not only includes rotor thrust, but also arm profile drag (Figure 10b) when tests are done at d/D < 0.4. To investigate any possible skew in the data, the lower arm profile drag was measured at various upper rotor thrust and axial separations (Figure 10a). The lower arm thrust reading was corrected when the test rig was trimmed to have the desired net thrust for any tests done when d/D = 0. At any other d/D > 0 ratios, the corrections were neglected since the largest area of interest was d/D > 0.8, where the lower arm of the test rig is not directly underneath the upper rotor.
RTS-100 (Transducer Techniques, Temecula, CA, USA) reaction torque sensors were mounted underneath each motor/rotor assembly (Figure 8a). The sensor data-gathering and test rig control is achieved using National Instruments and Phidgets modules (listed in Figure 9). The test rig was programmed and controlled using Labview 2015 (National Instruments, Newbury, Berkshire, UK). The measurements were aquired at 2 kHz from all of the load cells simultaniously. A maximum of 7000 RPM was used in any test, which gives a minimum resolution of 4.2° when a 5 s data sample is taken. Initial tests revealed close to 2% scatter in the measured torque and thrust. Both rotors were initially individually tested on both arms to obtain a grasp on any asymmetry in the data, since the configuration of the test rig has arms on opposite sides of the rotors. Test results showed that performance difference between both tested arm locations is negligible. The same results have been found by McAlister et al. [16] and Ramasamy [15].

5. Results

The tests conducted on overlapping rotor propulsion systems were split into three main categories:
  • Isolated single rotor tests;
  • Overlapping rotor tests d/D = 0 (co-axial); and
  • Overlapping rotor tests d/D ≠ 0.
Propulsion system configuration performance data was compared to the momentum theory. The drag coefficient at zero lift (P0) needed for momentum theory was obtained using blade element momentum theory (BEMT) for a single rotor (Figure 11).
Several iterations were conducted by changing the angle of attack collectively on all of the 2D airfoils to find the zero lift point. 2D airfoil characteristics needed for BEMT were obtained using XFoil panel code created by Drela [27] at an average Re = 10 × 104. Equations used in the BEMT approach, along with the Prandtl tip-loss function, are explained in detail by Leishman and Ananthan [28].

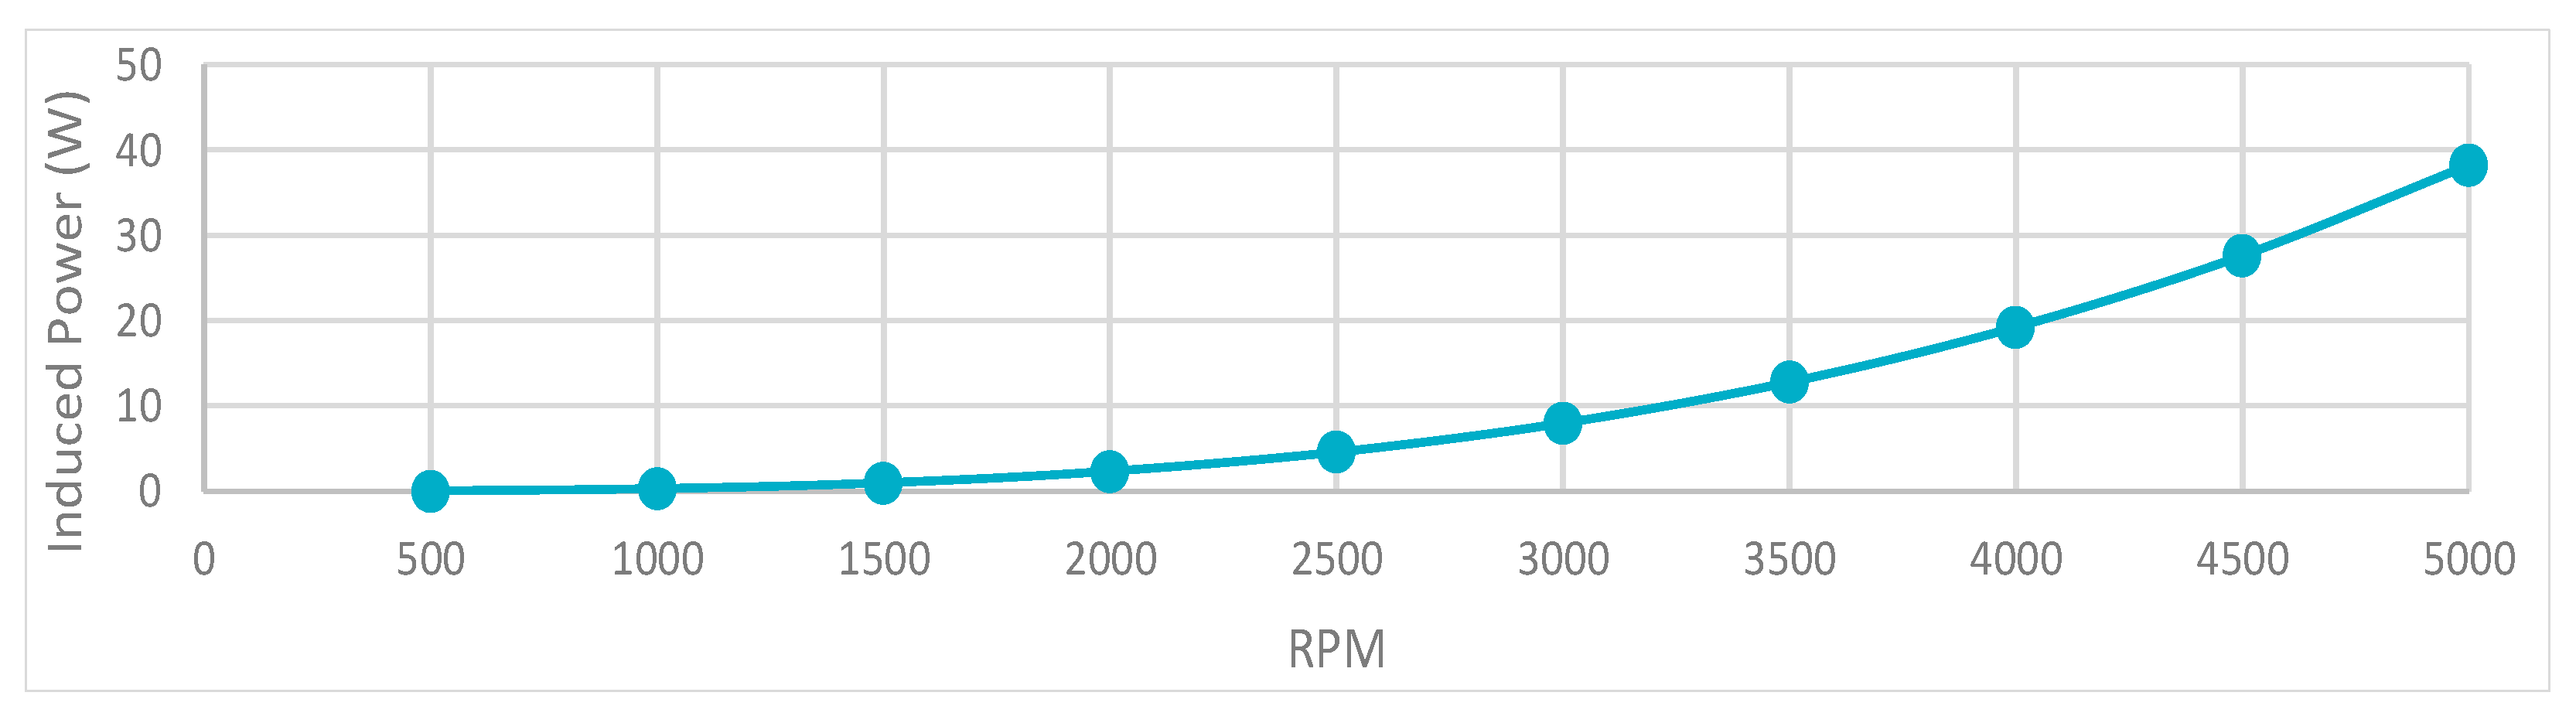
5.1. Isolated Single Rotor Tests

Figure 12 shows the experimental and theoretical isolated single and co-axial rotor data. The line fit theoretical data was obtained by using Glauerts momentum theory [29]. Isolated rotor power is calculated using Equation (1). Rotor profile power ( P 0 ), as discussed above, was estimated using BEMT. The induced power factor ( k ) for a single rotor was predicted to be 1.16. The co-axial test was conducted at z/D = 0.1 in torque equilibrium ( Q u + Q l = 0 ). Theoretically-estimated data was calculated using Equation (2). Momentum theory-derived data predicted a rotor interference factor ( k i n t ) of 1.24.
P = P 0 + k T i s o l a t e d 3 / 2 2 ρ A
P = P 0 + k   k i n t ( 2 T i s o l a t e d ) 3 / 2 2 ρ A
The agreement between theory and measured data is good and confirms that a SUAV overlapping rotor propulsion system could be treated as two isolated rotors experiencing interference effects accounted for by k i n t . Figure 12 also shows that a single isolated rotor, when compared to two same rotors in a co-axial configuration, has a higher induced power for a given thrust. This is to be expected since the single rotor has half the solidity of a constructed co-axial system out of those rotors. Therefore, as discussed by Leishman [30], the real performance gains or losses of an overlapping propulsion system could only be obtained when the overall solidity of both compared systems is equal.

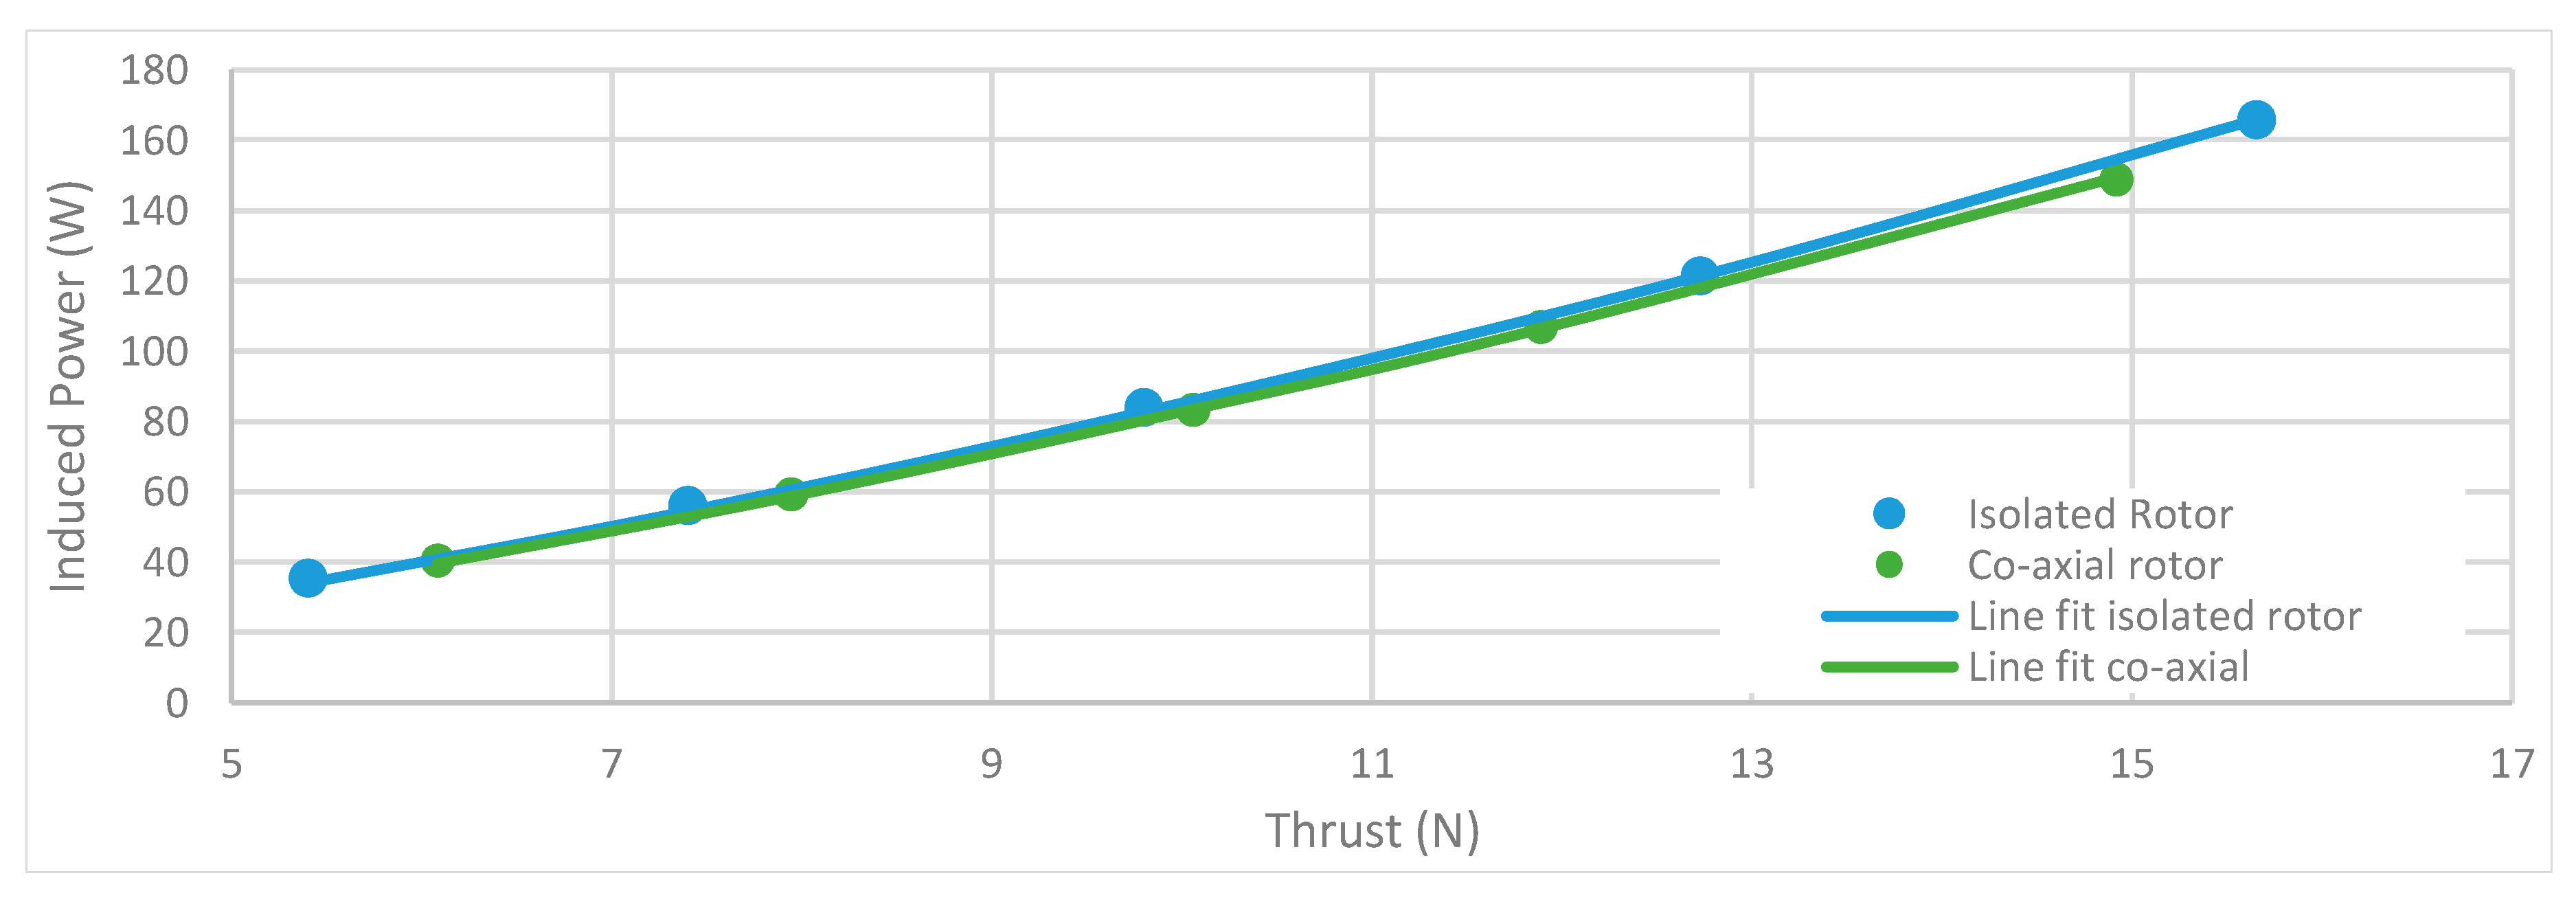
5.2. Overlapping Rotor Tests d/D = 0 (Co-Axial)

Thrust sharing between the upper and lower rotors was measured throughout a range of z/D ratios when both the upper and the lower rotors are operating in a torque-balanced mode, which was achieved through a variation of the lower rotor angular velocity (Figure 13). Three different system thrust levels were tested during this analysis. It can be stated that the thrust sharing between two rotors depends on the axial separation of the two rotors and the overall system thrust. The axial separation effect could be explained when looking at the rotor inflow angle change as defined by BEMT (Equation (3)).
α n = θ n ϕ n
As described by BEMT, rotor section aerodynamic angle of attack α n varies when the ratio ( ϕ n ) of the inflow velocity and tangential velocity produced by the rotor rotational speed is changing. In hover, when the rotor axial separation is decreased, the lower rotor has greater influence on the upper rotor. In turn, the upper rotor airfoil section inflow angles ( ϕ n u ) are increased. This causes the overall aerodynamic angle of attack of the upper rotor to decrease, thus reducing the magnitude of the upper rotor thrust and increasing torque.
In contrast, a reduction in the upper rotor thrust decreases the inflow velocity at the lower rotor. A smaller inflow velocity translates into a reduced rotor sectional inflow angle ( ϕ n l ), thus, the lower rotor’s overall aerodynamic angle of attack increases. A higher angle of attack leads to a higher thrust output of the lower rotor and a decrease in the lower rotor torque; since the system torque in this setup must stay the same, the lower rotor rotational speed was increased until equilibrium was reached. The upper rotor slipstream area (vena contracta) contribution can be seen as well, especially at lower axial separations, when the upper rotor wake is not fully developed (z/D < 0.35). Greater overall thrust leads to the faster rate of slipstream contraction which results in the variation of the lower rotor area that operates in the upper rotor slipstream. Independent of the overall thrust, the lower rotor thrust deviation throughout all z/D steps was recorded to be 21%, which is close to the one observed by [15] (~20%).
The individual rotor performance, when operating in the co-axial torque-balanced ( Q u + Q l = 0 ) setup at various axial separations, was tested (Figure 14). The performance of the co-axial system and the individual rotors was compared using the figure of merit (FM), which was derived by Leishman and Syal [31]. FM for individual upper and lower rotors is given by:
F M = T 3 / 2 / 2 ρ A P
and for overlapped rotor system:
F M u + l = ( T u 3 / 2 + T l 3 / 2 ) / 2 ρ A P u   + P l  
The test results show that the performance of a co-axial system, when operated at torque equilibrium, rapidly decreases when z/D approaches 0, which is in good agreement with the momentum theory. Figure 14 also shows that the co-axial system upper rotor outperforms the lower rotor at all of the z/D ratios.
The co-axial system was compared to two identical isolated rotors to further understand the interference effect and percentage efficiency losses involved (Figure 15). Momentum theory (Case 4b) predicts that interference factor for torque balanced co-axial system, when lower rotor is operating in a fully-developed slipstream of the upper rotor, is k i n t = 1.26 (a detailed derivation of all momentum theory cases can be found in [31]). The efficiency loss proportional to the interference factor ( k i n t ) for the co-axial system was calculated using Equation (6):
Δ η = 1 F M o v e r l a p p e d   r o t o r F M i s o l a t e d
where:
F M i s o l a t e d = ( T u 3 / 2 + T l 3 / 2 ) / 2 ρ A 2 P ( i s o l a t e d )
Isolated rotor power has to be obtained using half of the overall co-axial thrust to support the fact that two identical isolated rotors will operate at equal thrust and power when in torque equilibrium, whereas a co-axial system has a varying thrust ratio until z/D = 0.
Test results (Figure 15a) indicate that co-axial system performance is highest when the rotors are operating in a region z/D > 0.25. At that region the performance loss was recorded to be approximately 22% which is close to the values predicted by the momentum theory. It could be stated also that in this particular setup, with highly-twisted rotors, the performance gains are seen up until z/D = 0.25. Measurements show little to no variation in performance at two distinctively different net thrust magnitudes. Some variation is noticeable when z/D > 0.35, however, due to the test rig induced error, small differences should not be treated as efficiency gains/losses. Some of the data deviation from linearity could be linked to the drag force produced by the lower motor and torque sensor assembly interaction with the upper rotor slipstream; further investigation in this region is needed.
Figure 15b shows the percentage losses of the individual rotors in a torque-balanced co-axial configuration at various z/D ratios. Tests indicate that the lower rotor experiences approximately 10% performance loss for the tested z/D range (0.05 < z/D < 0.85). The upper rotor performance variation is much higher at 22% for the same z/D range. The upper rotor performance gradient has a higher slope in comparison to the lower rotor up until z/D = 0.35. Measurements also reveal that the upper rotor starts operating at a marginally higher efficiency than the same rotor in isolation when z/D >0.5.
The magnitude in performance gains/losses of co-axial system swirl recovery were also tested. Two rotors were spun in the same direction to counteract swirl effects and operated at ( Q u = Q l ). Test results were compared to the torque balanced ( Q u + Q l = 0 ) Contra-rotating co-axial system performance at the same overall thrust. A similar test was done by Ramasamy [15], who has recorded a 5% efficiency gain for a conventional co-axial system over a co-rotating one. However, tests were done using collective pitch trim to achieve both torque conditions. Test results presented in Figure 16 were collected when torque trim was achieved by manipulating the rotor angular velocity.
Test results presented in Figure 16a show a distinct performance loss for both co-rotating co-axial and conventional co-axial systems over two isolated rotors with equal overall system solidity. The co-rotating co-axial system is outperformed by the co-axial system at all z/D ratios. Both systems follow the similar trend line with regard to one another, however, the co-rotating system reaches a more linear performance loss state at a slightly higher z/D ratio of >0.3 in comparison to the conventional z/D > 0.25. Overall performance losses of co-rotating systems are approximately 4% higher throughout the range of z/D when compared to the conventional co-axial rotor system. Coming back to the measurements done by Ramasamy [15], it could be stated that pitch trim or rotor rotational speed trim (this study) have little to no effect on the co-rotating co-axial system performance when Q u = Q l . Effects on upper and lower rotors of co-rotating co-axial versus conventional co-axial systems could be quantified when looking at Figure 16b. The upper and lower rotors in both systems follow the momentum theory-defined trend, both the upper and the lower rotor performance approaches an equal state when z/D = 0. There is very little decrease in the upper rotor performance of a co-rotating system when compared to the upper rotor of a conventional co-axial system. In comparison to a conventional the co-axial system upper rotor, the co-rotating system, the upper rotor never reaches the state where it performs better than the isolated single rotor. Much greater swirl recovery effect can be seen when looking at both systems’ lower rotors. It is clear that the lower rotor of a co-rotating system is operating at lower efficiency throughout the tested range of z/D when compared to the lower rotor of a conventional co-axial system.

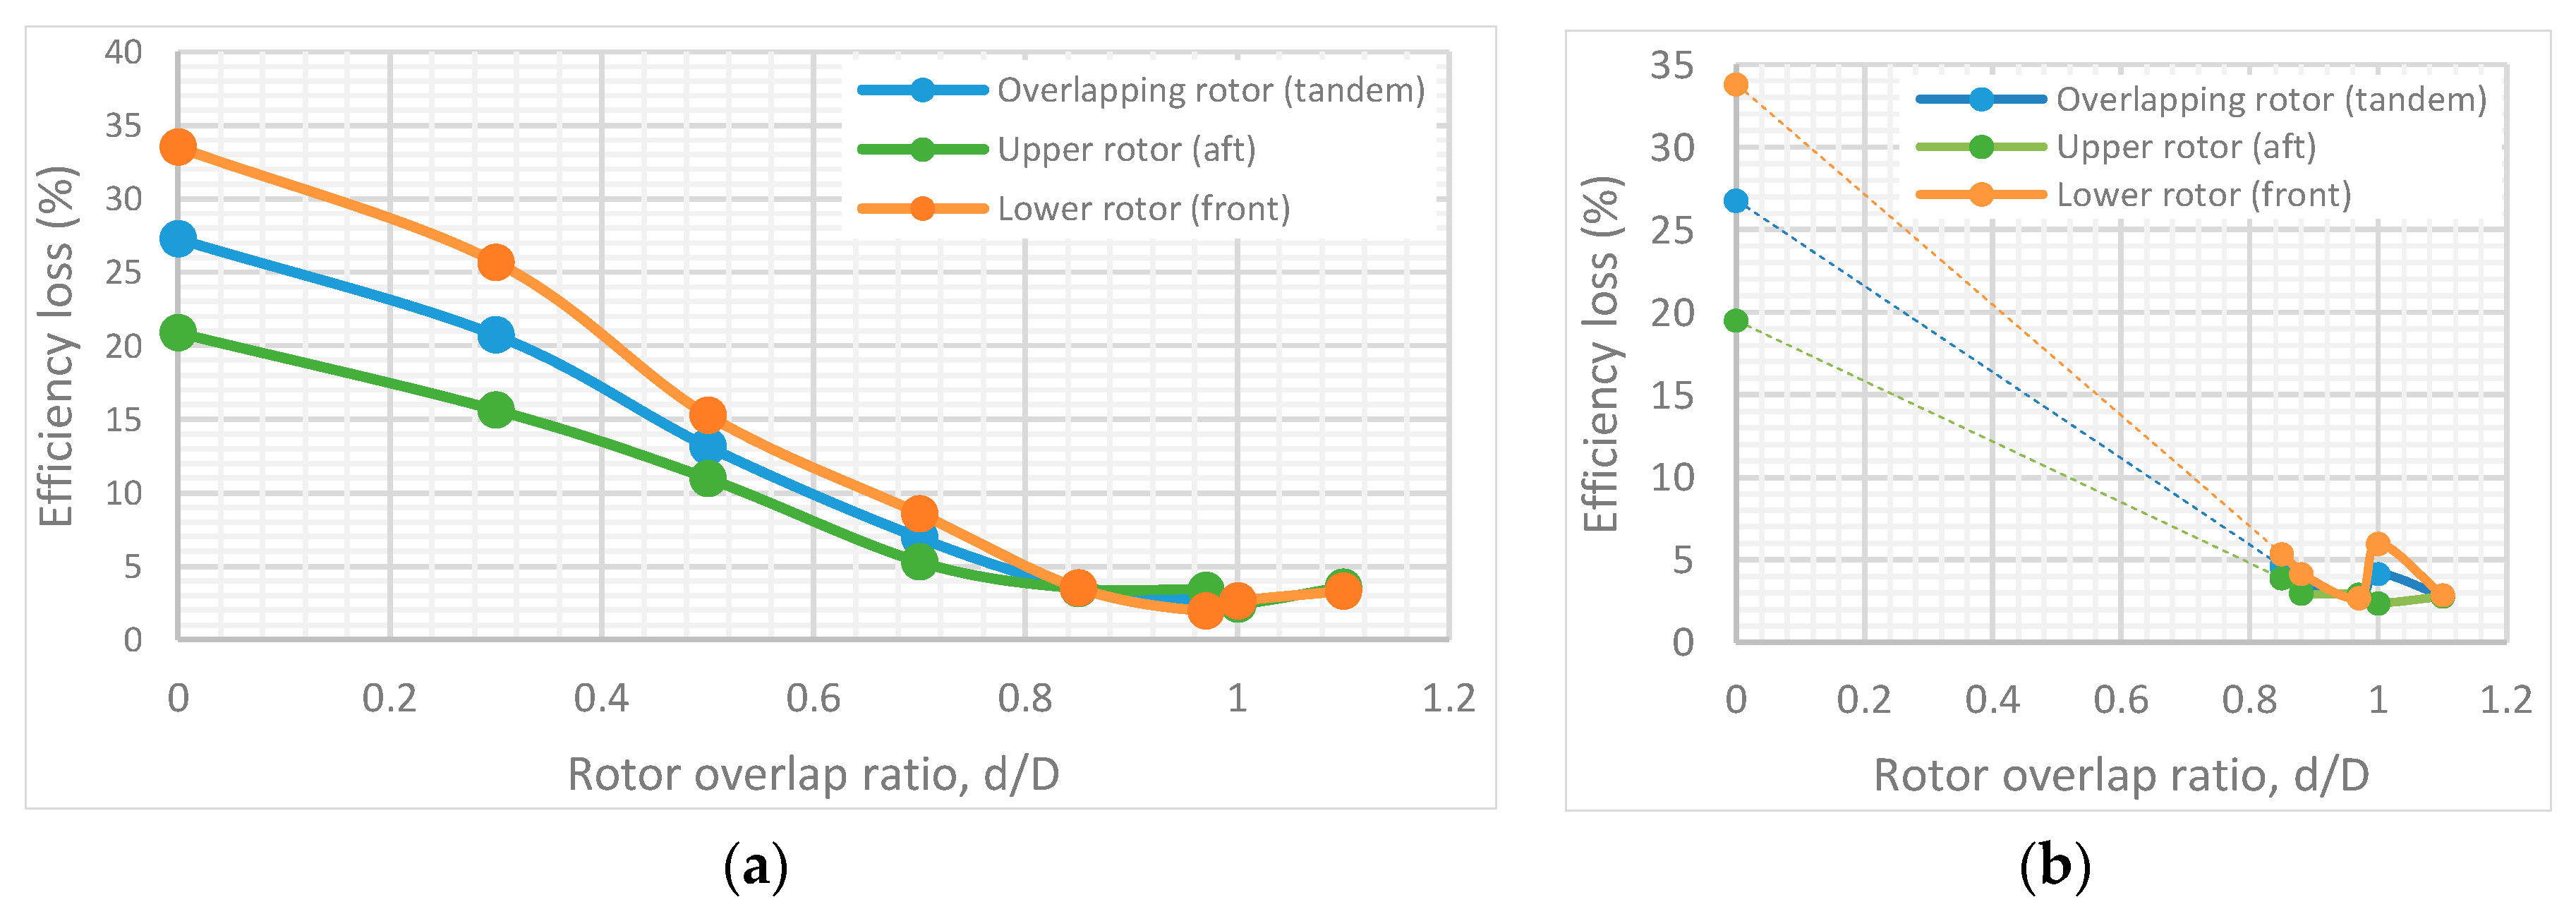
5.3. Overlapping Rotor Tests d/D ≠ 0

In this study the performance gains/losses are measured for rotors operating in a partially overlapped condition, known as a tandem rotor. Similarly, to the co-axial configuration (d/D = 0) one of the rotors is operating lower than the other. A good example of such a system in a full-sized helicopter is the Boeing Chinook. Due to their placement on the fuselage, the lower rotor in the full-sized helicopter is called the “front” and the upper rotor is called “aft”. These names are not usually used for small multi-rotor UAV systems, therefore, both terms will be used. The main partially-overlapped rotor configuration variable d/D is explained in Figure 2.
One of the goals for this study is to establish the rotor interference magnitude when compared to two isolated single rotors, as well as to investigate potential gains in performance when the rotor separation is close to d/D = 1 (separated rotors) and axial rotor separation z/D is approaching 0, as discussed in [24].
All of the tests were done using torque balance and predefined total system thrust. To achieve torque balance, the lower rotor angular velocity was allowed to vary. Performance results in terms of the FM are presented in Figure 17. Torque balancing between the rotors forced unequal thrust, therefore, FM was calculated using the same method as for a fully overlapped co-axial rotor defined in Equation (5). The percentage efficiency gains/losses for the overlapping rotor system over two isolated rotors is also presented in Figure 18; all calculations are done using the same method as for the co-axial rotor system (Equation (6)).
The rotor tested in this study has fixed pitch. As such, the angular synchronization of the rotors is not possible due to the requirement for torque balance, therefore, the desired z/D = 0 could not be achieved. The test results presented in Figure 17 were completed at the lowest possible z/D = 0.05. All of the gathered data was compared to the momentum theory using the derived overlap interference factor k o v . Two cases of momentum theory where compared to the test results—rotors were assumed to operate at the same plane and that the lower rotor is operating in the fully developed upper rotor slipstream (detailed derivation of all momentum theory cases can be found in [31]). Harris [32] derived overlap interference factors for the full range of d/D ratios, which were also used to compare the empirical results. Overlapping rotor, k o v was calculated from the gathered data by:
k o v = P u   ( m e a s u r e d ) + P l   ( m e a s u r e d ) 2 P i s o l a t e d   ( s i n g l e )
where the isolated power is obtained from single rotor tests, using half of the total power measured in overlapping rotor tests.
Test results show that at z/D = 0.05 in the region 1 < d/D < 1.1 (fully-separated rotors) both rotors perform slightly worse than two isolated rotors. In comparison to the co-axial setup, where the lower rotor is operating at a worse efficiency with regards to the upper rotor at any tested setup condition, the partially overlapping tests showed that, in some cases, the lower rotor can outperform the upper rotor. The lower and upper rotor in a partially overlapped system switch their performances at approximately 0.95 < d/D < 1, in the tested overall thrust condition 8 N (Figure 17a). At the higher system thrust of 15 N (Figure 17b) the lower rotor does not manage to outperform the upper one, however their performance almost matches. Similar results were observed by Ramasamy [15] when testing untwisted rotors. Observations by Ramasamy [15] show a much more distinct performance transition between the upper and lower rotor at d/D > 0.8. However, for highly-twisted rotors the performance switch was seen at d/D = 0.5. In both cases test results did not show any switch back past d/D = 1. It must be noted that Ramasamy’s [15] tests were done at a much higher overall thrust of approximately 72 N. These contradictory results with a possible link to the system thrust requires further analysis using rotor flow fields.
As observed in Figure 18, the overall system has an approximately 25% change in performance through the tested d/D range in comparison to two isolated rotors. The smallest efficiency loss (~3%), at both tested thrust conditions at z/D = 0.05 can be observed in the region close to the full rotor separation of d/D = 1. However, at the higher thrust settings d/D = 1 has more pronounced efficiency drop (~4%) when compared to the lower thrust test. This could be possibly explained by the increase of the energy in the rotor tip vortices. The same trends can be seen when looking at the thrust and power-sharing conditions of the upper and lower rotors through the tested d/D range (Figure 19). When d/D < 1, with the decrease of the rotor overlap ratio there is an increase in the lower rotor thrust output and decrease in the lower rotor induced power. Both slopes meet at approximately d/D > 0.9, meaning that both rotors start performing at similar efficiency.
Figure 20 shows measured data compared to the momentum theory-derived overlap interference factor k o v . Rotor interference data was obtained from the test results when the rotors were operating at an axial separation distance of z/D = 0.05, which equates to approximately 20.3 mm rotor plane separation since the tested rotor diameter is 406.4 mm. The whole range of tested rotor overlaps at an overall thrust of 8 N seems to agree fairly well with the momentum theory-derived interference factors for the rotors operating in the same plane. Additionally, in the region of 0.35 < d/D < 0.85, it follows the curvature of derived overlap interference by Harris [32].
The largest deviations from the theory are seen at d/D > 0.85 and d/D = 0 (co-axial). Overlap interference factor at d/D = 0 is over-predicted if looking at the trend which is followed by the rest of the measurements. However, this falls within the limits of both of the momentum theory cases—the upper rotor and lower rotor in the same plane, and the lower rotor operation in the fully-developed upper rotor wake. It is known that most of the upper rotor wake contraction happens within 0.25R distance away from the rotor plane, which equates to z/D = 0.125.
In contrast to the previously-discussed region, rotor interference at d/D > 0.85 is under-predicted and shows dependencies on overall thrust. This could be explained by the increase in angular velocities of both rotors when more thrust is required, which could lead to more frequent rotor-to-rotor interaction, since rotation of rotors in this setup is left to be asynchronous to obtain system torque balance.
To further analyze rotor-to-rotor interaction at the region closer to the tip, d/D = 0.85 was tested at the range of axial separations z/D (Figure 21).
Test results presented in Figure 21 show the overlap interference factor k o v dependencies to the axial separation ratio z/D at d/D = 0.85. Increasing the axial separation decreases the overlap interference factor. Two slopes could be seen in the range of tested z/D values. Interference between rotors decrease more rapidly in the region of 0 < z/D < 0.35. The recorded interference change in that region equates to 75% of the overall change through the tested z/D ratios. The second, more linear region, 0.35 < z/D < 0.85 accounts for the remaining 25%. This could be explained by the contracted slipstream of the upper rotor interfering less with the lower rotor tip when z/D is increased. It should be noted, however, that this recorded interference decrease would equate to a very small gain of ~2% in propulsion system performance.

6. Conclusions

This paper has attempted to bring some clarity to small UAV overlapping rotor propulsion system design and performance when off-the-shelf rotors are used. The off-the-shelf T-Motor 16 inch × 5.4 inch rotor, which has diameter of 0.4064 m and a fixed pitch of 9.5 degrees (measured at 75% span), was scanned and digitally reconstructed giving a better understanding of the airfoil shapes, chord distribution, and individual section angles of incidence. A unique semi-automatic test rig was designed and manufactured to give a flexible platform with which single and overlapping rotor propulsion systems could be tested. To support empirical single rotor and overlapping rotor test results, the rotor profile drag data was obtained using blade element momentum theory. In summary, the following observations were made:
  • A high quality small UAV off-the-shelf rotor has been measured to have a zero lift drag coefficient, C d 0 = 0.019.
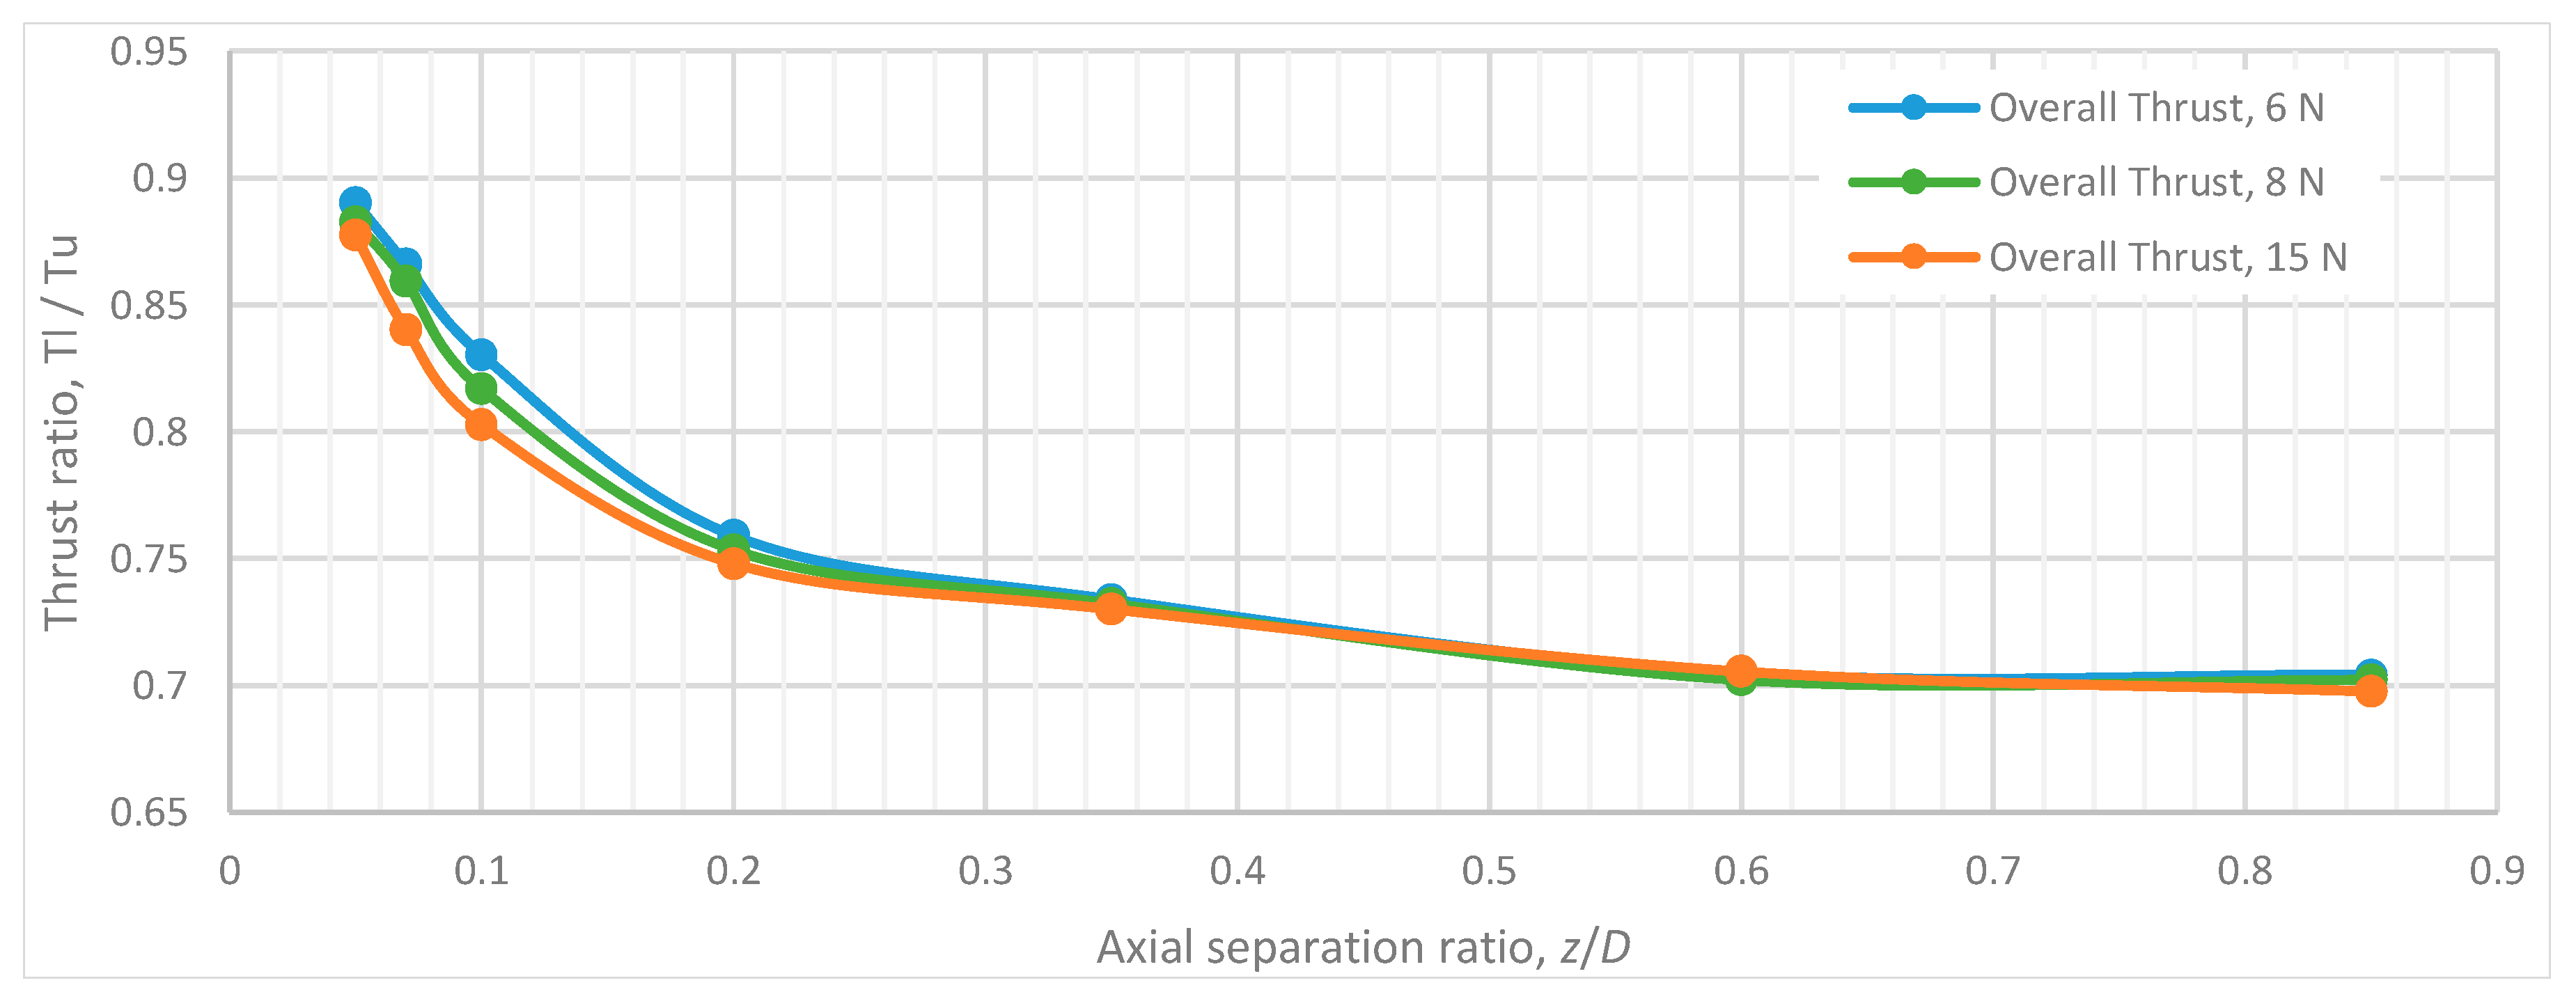
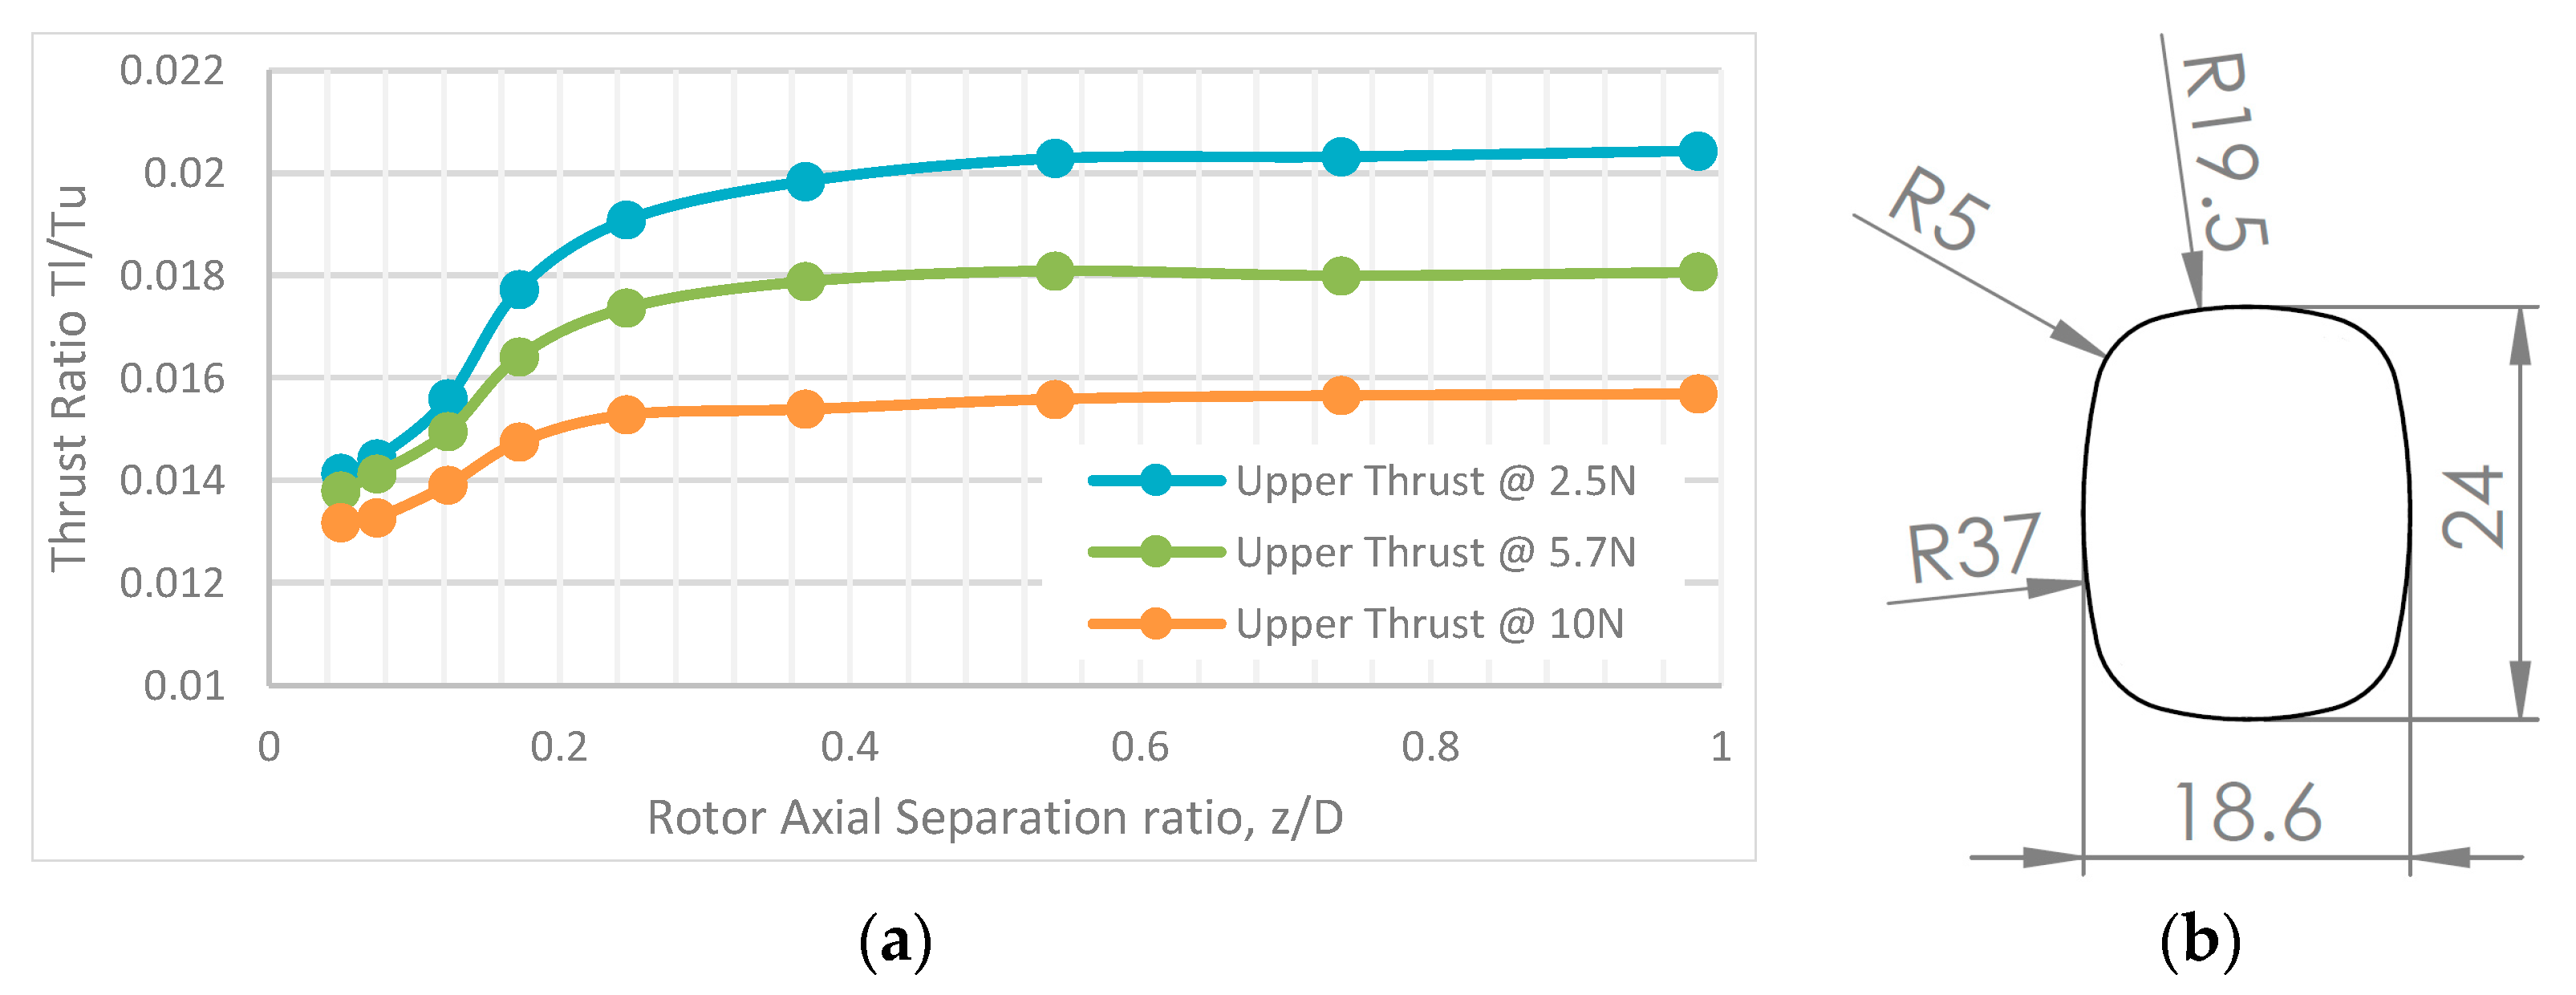
  • A thrust sharing change of 21% was measured over the tested axial separation distances 0.05 < z/D < 0.85, when fixed pitch rotors were operated in the torque-balanced setup. The upper rotor produced more thrust than the lower at any tested z/D ratio.
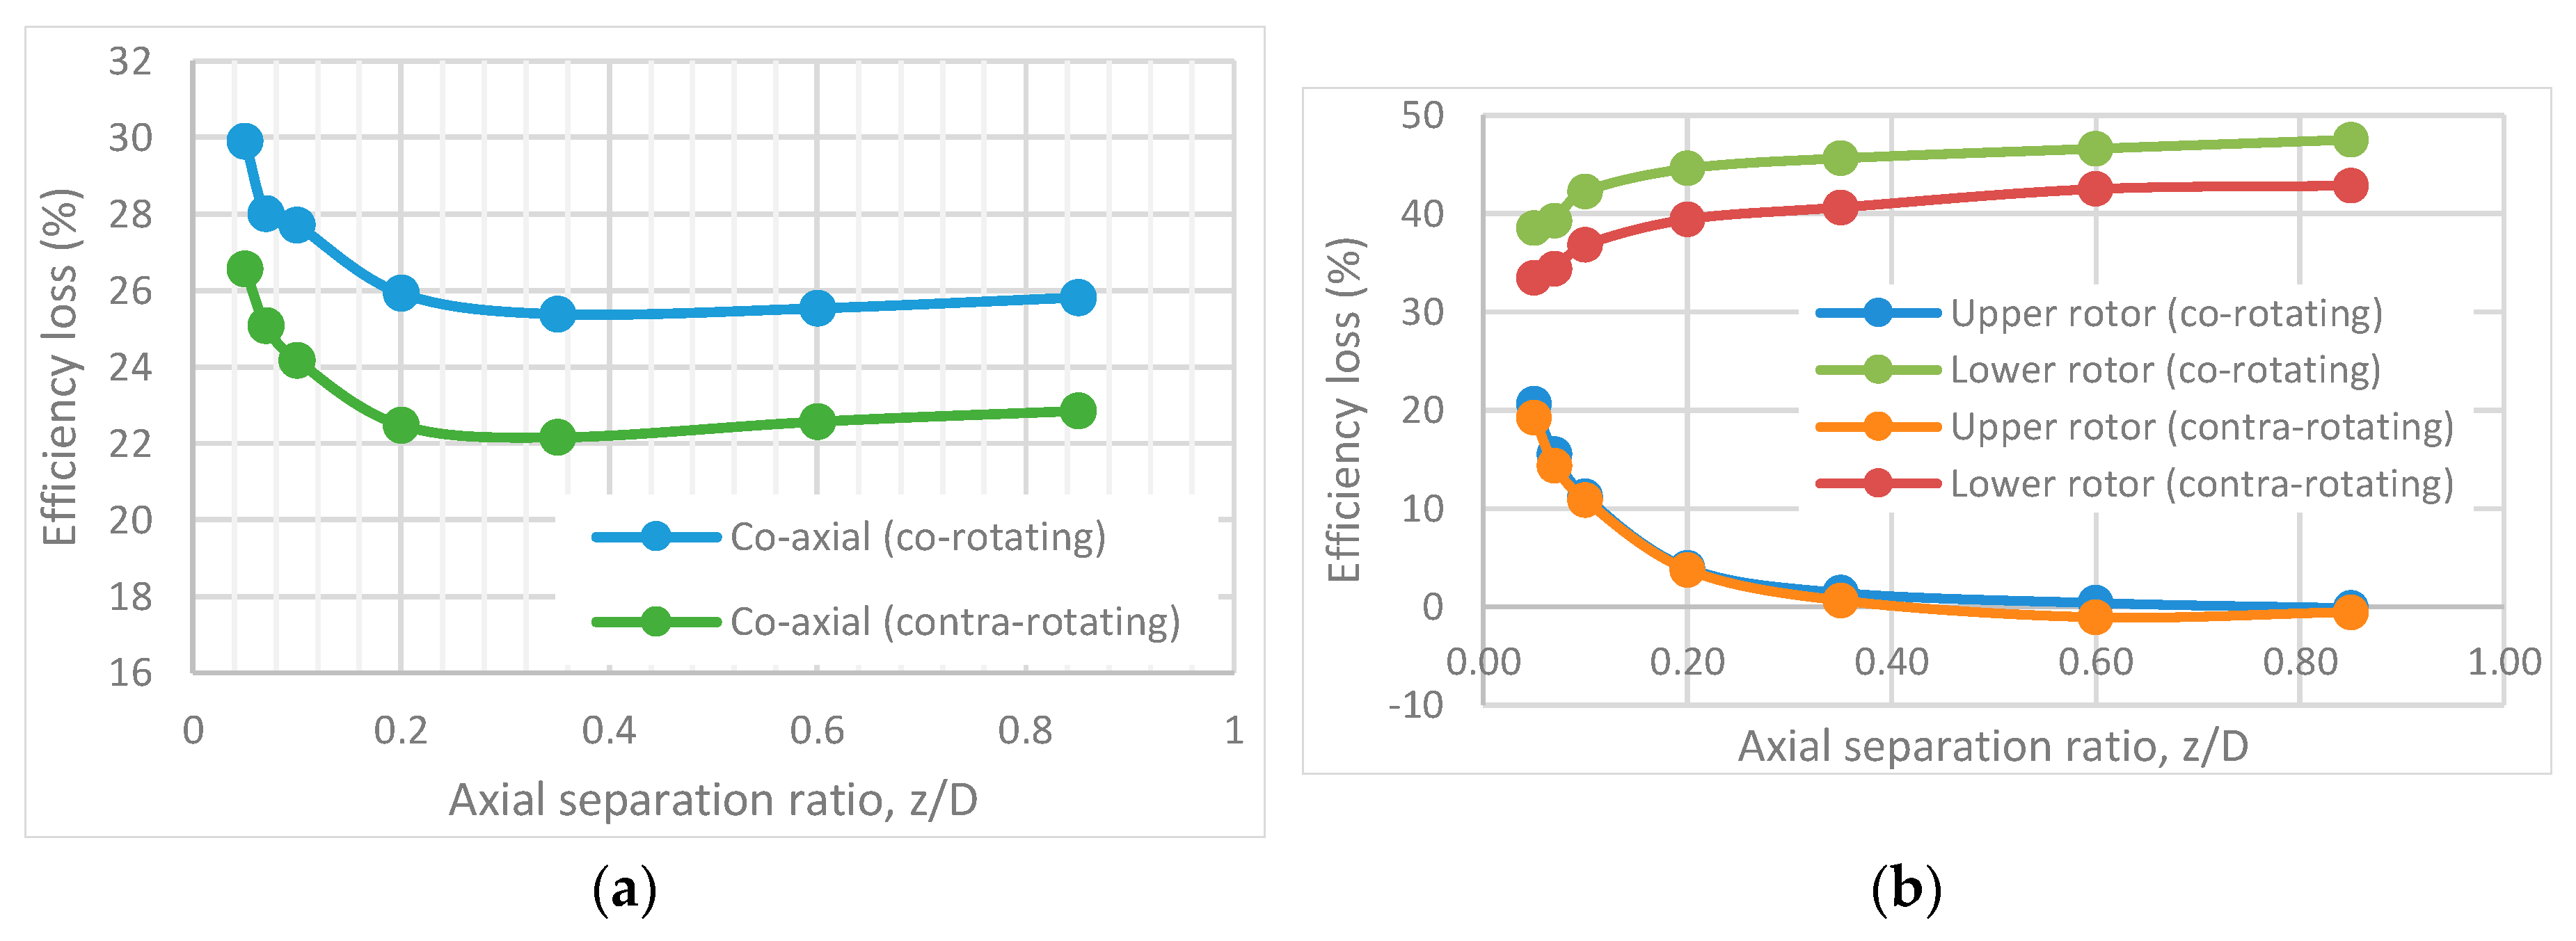
  • Highly-twisted small UAV rotors in a conventional torque-balanced co-axial configuration are 22% less efficient when compared to two isolated rotors whose combined solidity is equal to that of a co-axial system. Momentum theory predicts a 26% increase in the induced power for torque-balanced co-axial rotor setups. The rotor axial separation from z/D > 0.25 had no effect on the overall system performance. The lowest performance figure of 26% loss over two isolated rotors was observed at z/D = 0.05.
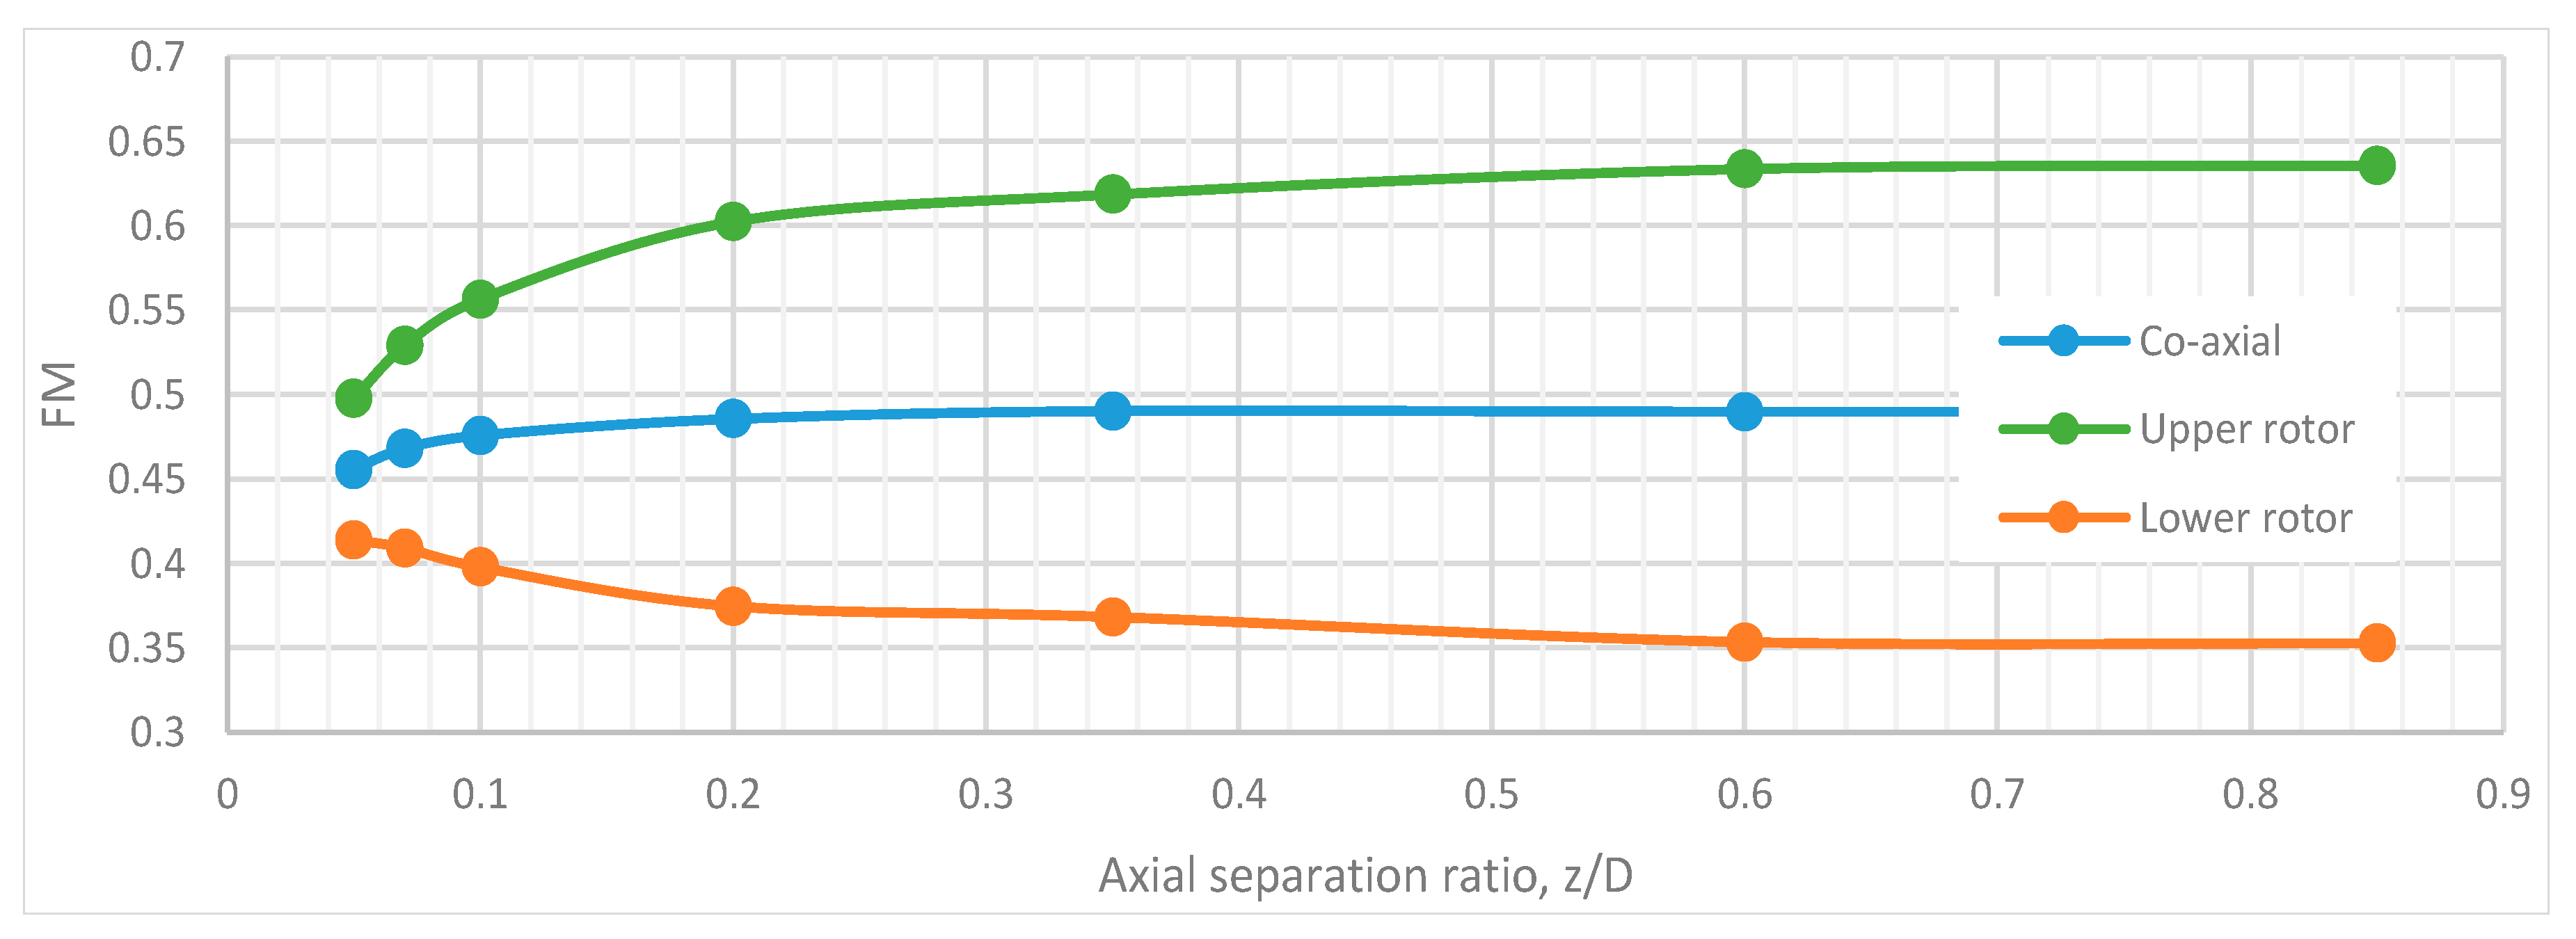
  • When comparing upper and lower rotors in a co-axial torque-balanced setup, it has been observed that the upper rotor operates at a higher efficiency than the lower rotor throughout the tested 0.05 < z/D < 0.85 range. Interference of the upper to the lower rotor was apparent throughout 0.05 < z/D < 0.85. Lower to upper rotor interference was observed only at 0.05 < z/D < 0.6 and the peak decrease the upper rotor efficiency was observed to be 21%. On the other hand, the lower rotor efficiency increased by 10% over the same axial separation range (0.05 < z/D < 0.6). These upper and lower rotor performance deviations affected the overall performance of the system at z/D < 0.25.
  • The upper and lower rotors were compared to a single isolated rotor’s performance when operating in a co-axial torque balanced setup. At the range of axial separation of z/D > 0.6 the upper rotor operates at a similar performance to that observed on a single isolated rotor. In contrast, the lower rotor at the same axial separation range experiences an efficiency loss of 42%, which decreased to 33% at z/D = 0.05.
  • Swirl recovery effects were observed in the overall co-axial rotor performance by running two co-rotating rotors in a co-axial setup, when the upper and lower rotor torque was equal. The results were compared to the conventional co-axial setup running rotors in the torque-balanced mode. Overall, the conventional co-axial rotor system was measured to be approximately 4% more efficient throughout all tested axial ratios 0.05 < z/D < 0.85, revealing the magnitude of the swirl recovery contribution to the overall system performance.
  • Swirl recovery effects were observed on the individual upper and lower co-axial rotor performance by running two co-rotating rotors in a co-axial setup when the upper and lower rotor torque was equal. This was then compared to the results of a conventional co-axial setup running rotors in the torque-balanced mode. The lower rotor in a co-axial co-rotating system runs approximately 4% less efficiently throughout all tested axial separations 0.05 < z/D < 0.85. No differences in upper rotor performance were detected. These measurements have revealed that swirl recovery has little to no effect on the upper rotor and all of the efficiency gains are linked to the lower rotor.
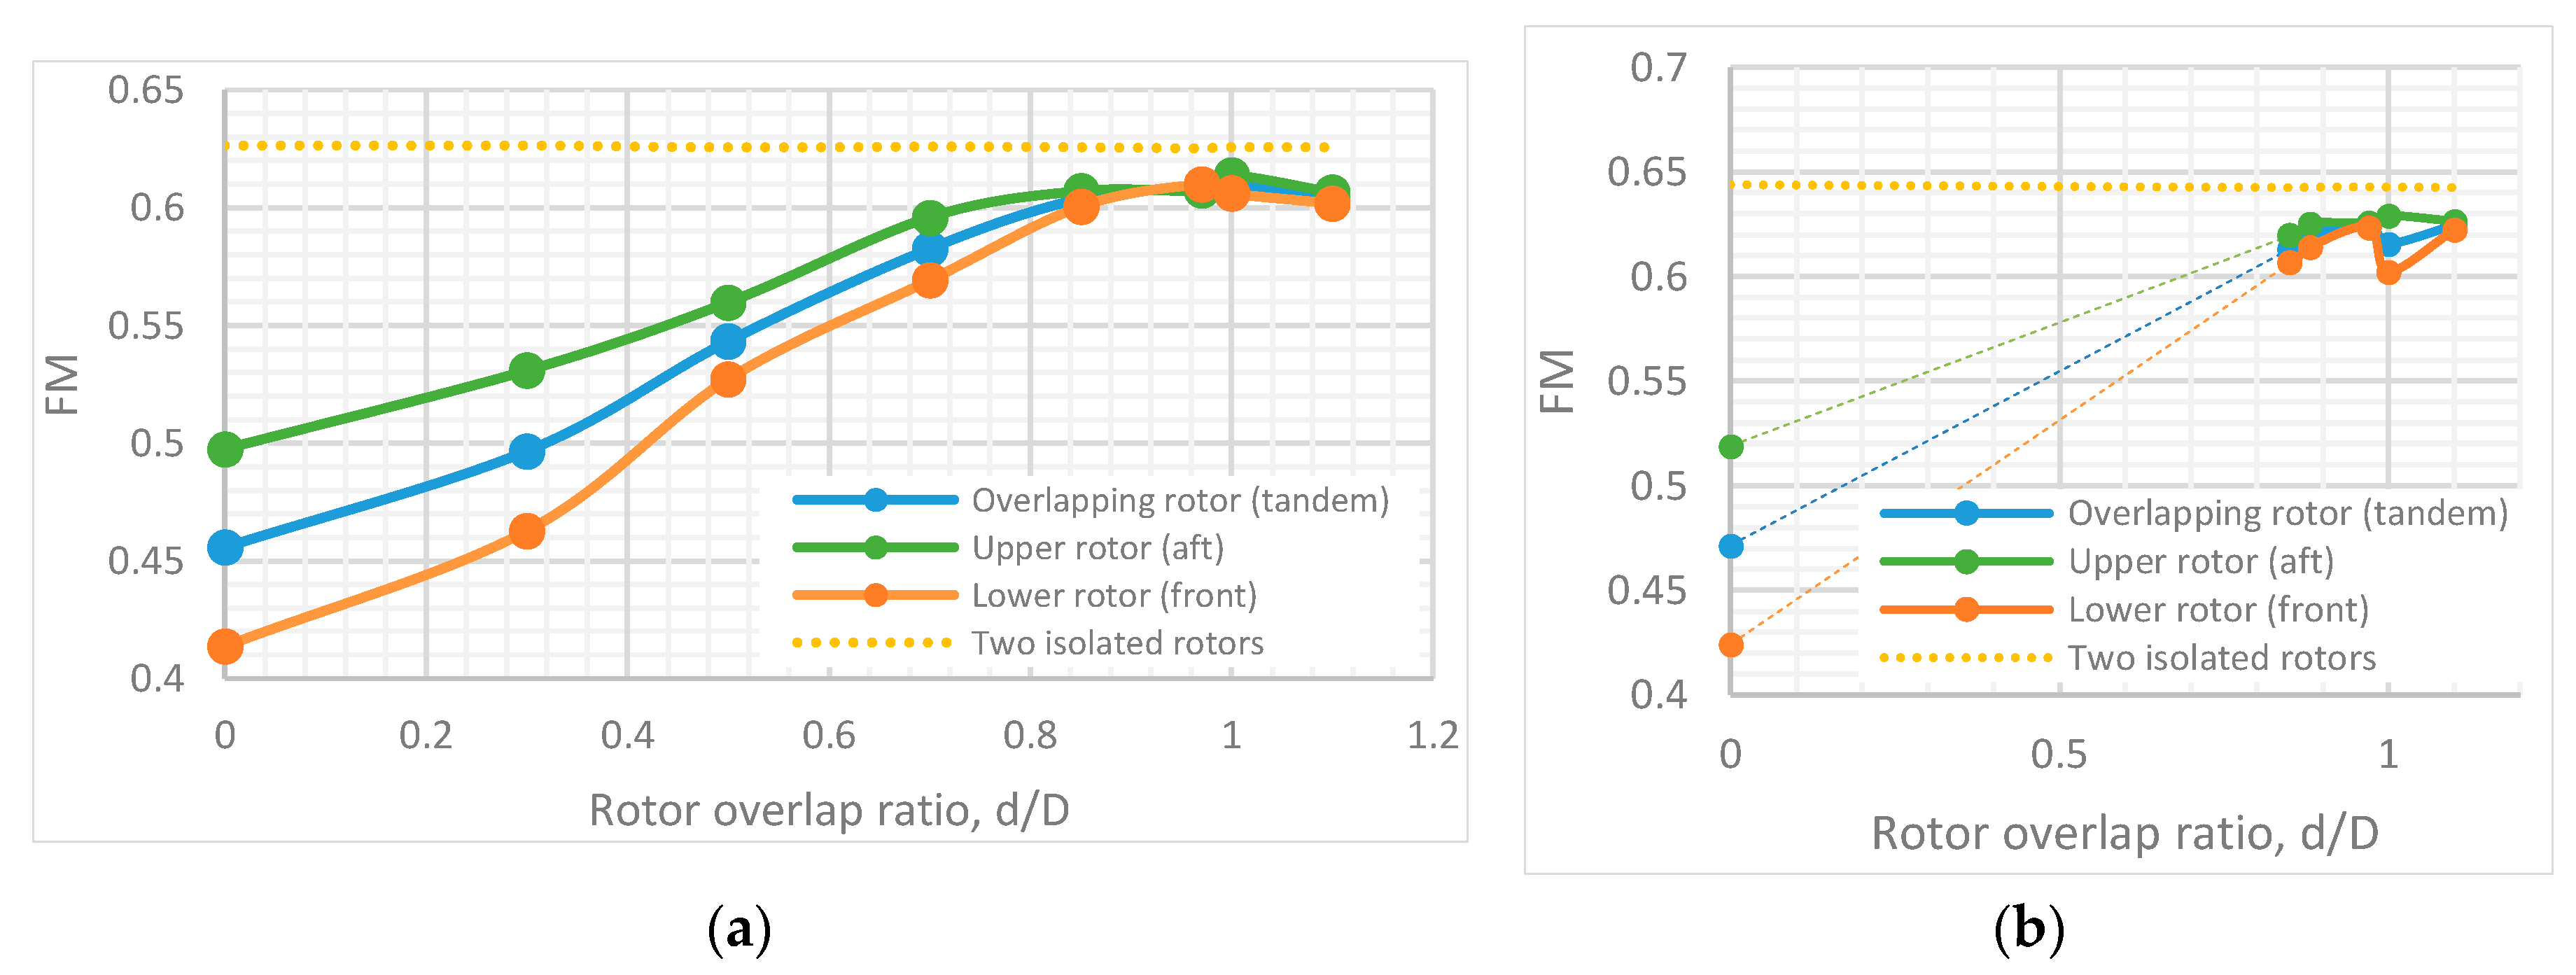
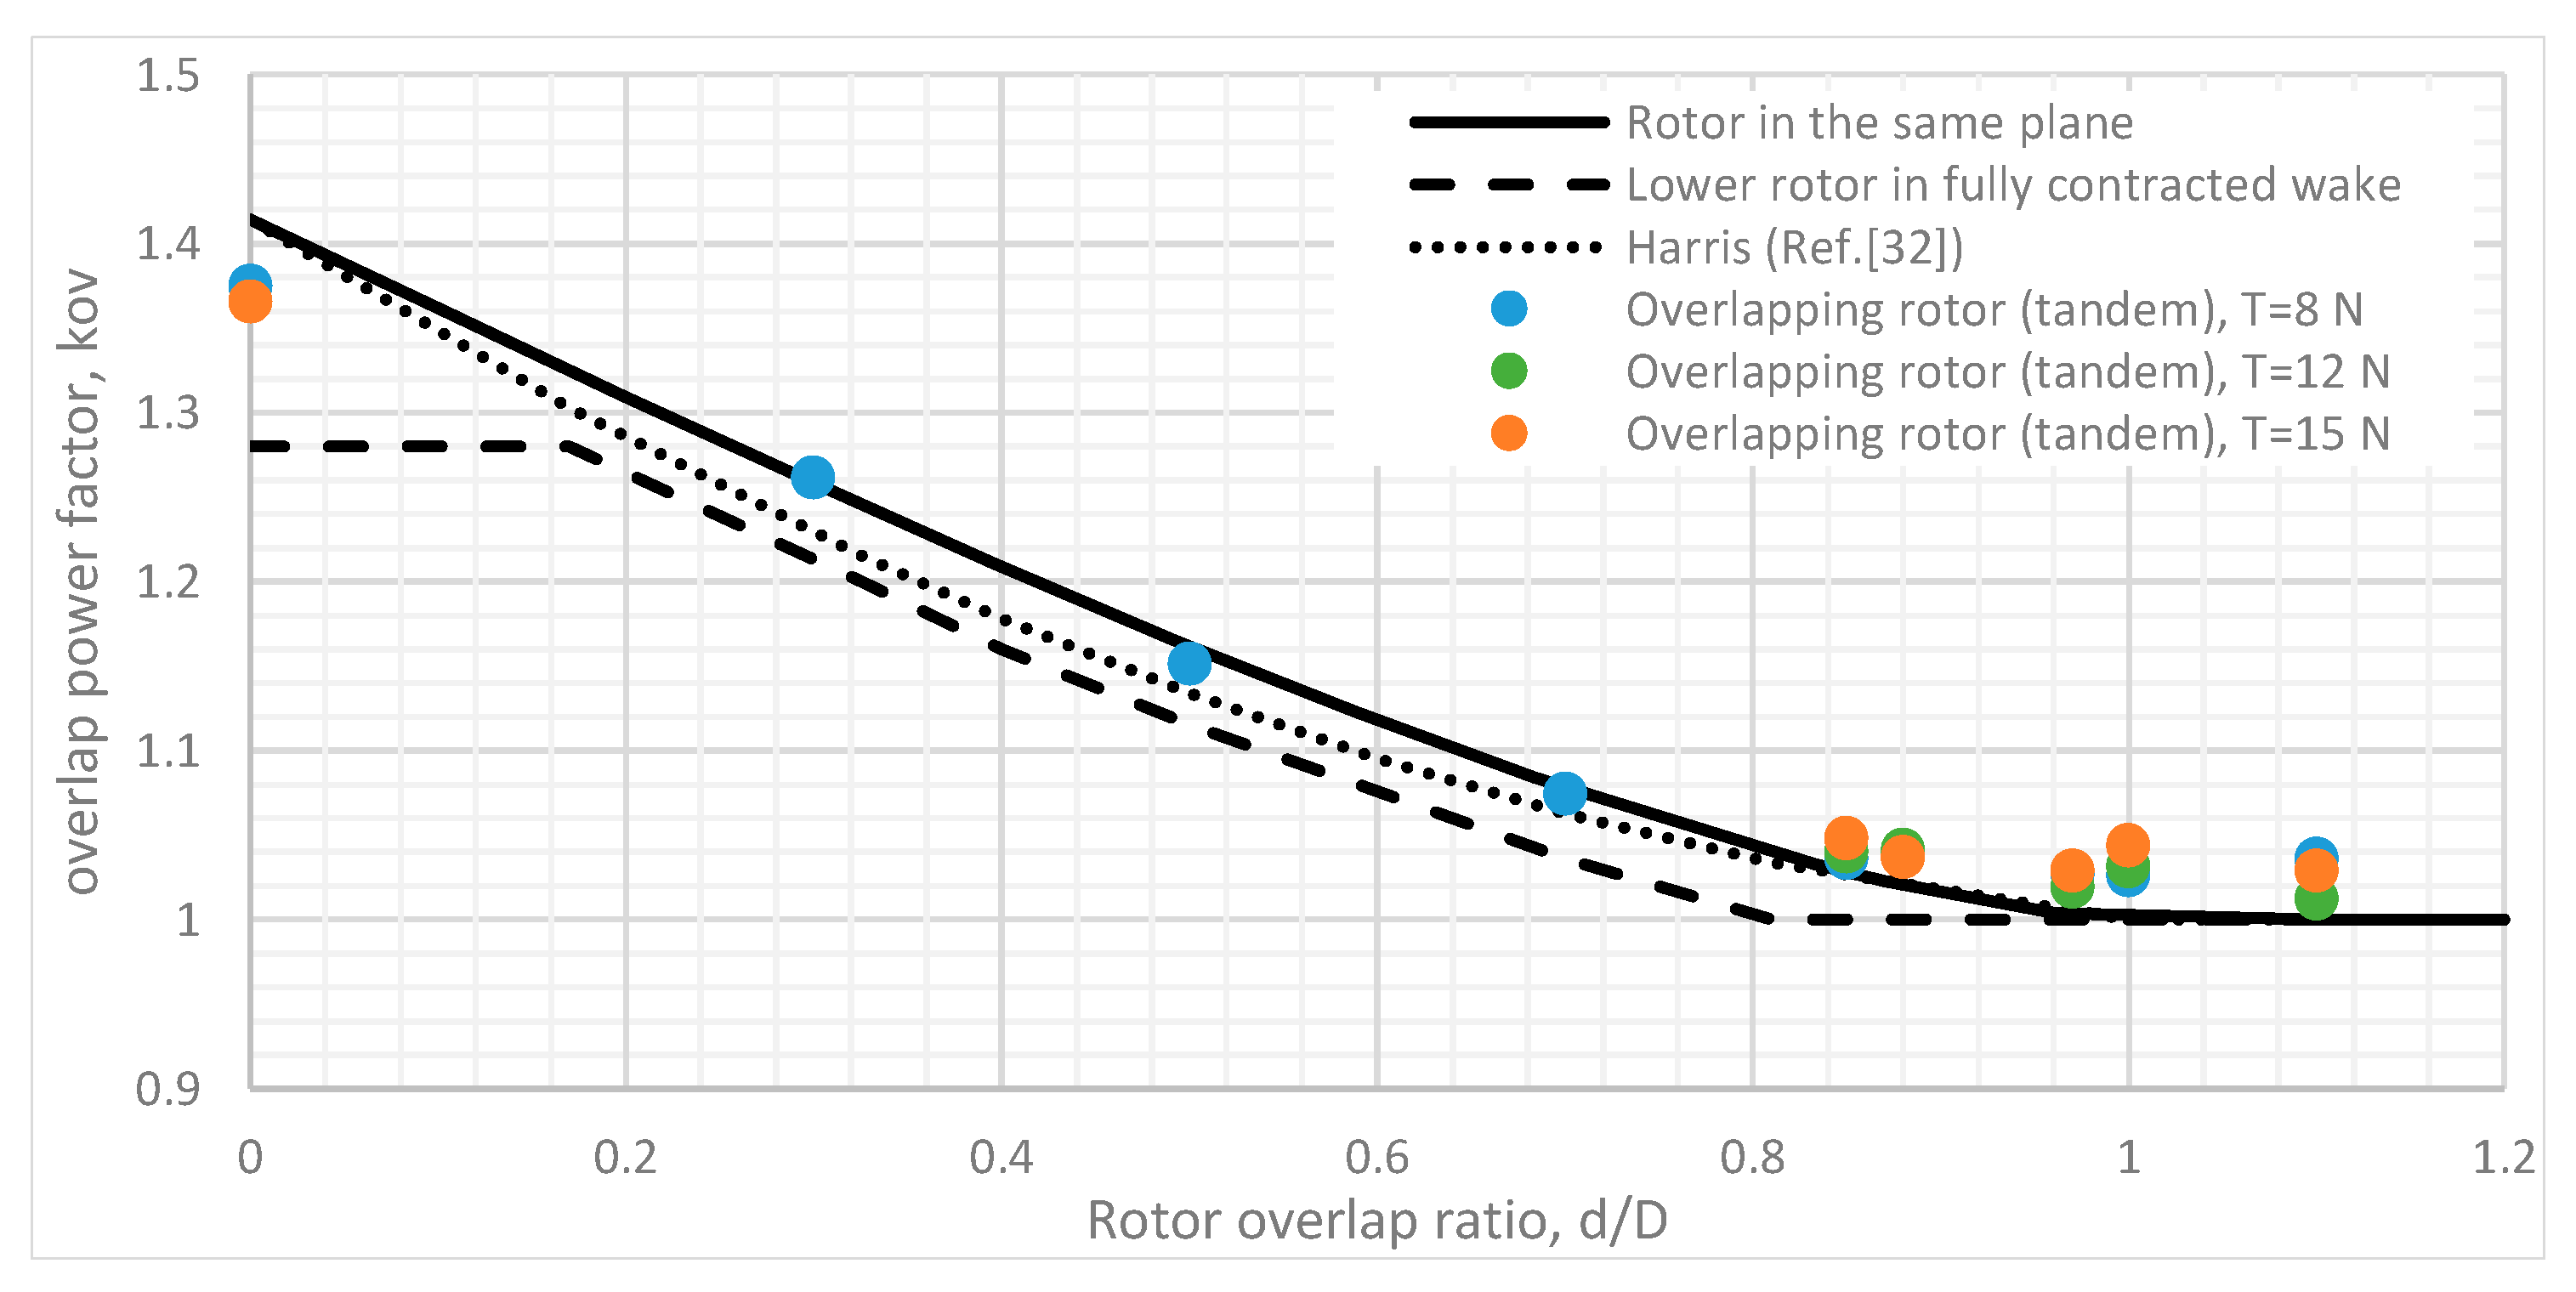
  • The performance of a partially-overlapped (tandem) multi-rotor system, in a torque-balanced setup, was tested at an axial separation ratio z/D = 0.05 and the results were compared to two isolated rotors. The overall efficiency of the system increased through the overlap range of 0 < d/D < 1. The efficiency of the system started to decrease again at d/D > 1. The peak efficiency of the system was observed at d/D = 0.97, but was approximately 3% less efficient when compared to the performance of two isolated rotors.
  • Performance of the upper (aft) rotor of a partially-overlapped torque-balanced system tested at z/D = 0.05 was better than the lower (front) rotor, up to d/D > 0.95. The lower rotor was observed to operate at a slightly higher efficiency in the region 0.95 < d/D < 1 at an overall thrust of 8 N. At a higher overall thrust of 15 N, such a performance change was not present. Dependencies on the overall thrust were recorded at d/D = 1 also, and with the increase of thrust the lower rotor performance decreased.
  • Dependencies on the axial separation ratio z/D when rotors are operating in partial overlap of d/D = 0.85 at a torque-balanced state were recorded. Through the tested axial separation range of 0.05 < z/D < 0.85, approximately a 2% increase in overall performance was recorded. Most of the gains occurred at z/D < 0.35.
Tests done in this research give an outline of what is to be expected from the off-the-shelf SUAV rotor when operated in isolation and in overlapping rotor configurations. However, anomalies in small rotor overlap were recorded and require deeper investigation in the region of 0.85 < d/D ≤ 1 when z/D < 0.35. Dependencies on overall thrust were also recorded, which require more tests to give a better picture on the overall propulsion system performance.
Additionally, the tests in this research were done using only a T-Motor 16 inch × 5.4 inch SUAV rotor, which represents only one geometry in a vast range of rotors that are available on the market. More detailed investigations are needed when looking at mismatched pairs (diameter, pitch) of rotors in overlapping propulsion system setups. Furthermore, disregarding the arm profile drag, there are some other possible upper rotor flow field interactions with the lower motor and torque reaction sensor assembly. Examination is needed to separate and quantify these effects.
To achieve a higher fidelity map of certain rotor overlaps and axial separations, and test more, different, rotors in a variety of overlapping rotor setups, more work on the test rig optimization, itself, has to be done to reduce the time required for testing, as well.

Supplementary Materials

The following are available online at www.mdpi.com/2226-4310/3/4/32/s1, Table S1: T-Motor 16 inch × 5.4 inch Airfoil Coordinates.

Acknowledgments

I would like to thank National Instruments and especially their field engineer Tony Gibbs who has kindly helped to get a loan of data acquisition hardware components for the initial test-rig design phase. Also I would like to say big thank you to Professor Keith Towell for his insight and the sharing of the great amount of experience that he has in the aerospace field.

Author Contributions

Mantas Brazinskas and Stephen D. Prior designed the experiments; the required hardware for the experimental setup was obtained by Stephen D. Prior; The test-rig was designed and manufactured by Mantas Brazinskas. Tests were conducted by Mantas Brazinskas; Mantas Brazinskas and Stephen D. Prior contributed to the data analysis. Mantas Brazinskas and Stephen D. Prior contributed to the writing of the article; Stephen D. Prior and James P. Scanlan contributed to the structure and review of this work.

Conflicts of Interest

The authors declare no conflict of interest.

Nomenclature

A Rotor disk area, π R 2 , m2
c Rotor blade chord, m
C d 0 Zero-lift drag coefficient
D Rotor diameter, m
d Rotor separation, m
d / D Rotor overlap ratio
c / R Non-dimensional chord length
K Induced power factor
K i n t Induced power factor from interference
K o v Induced power factor from overlap rotor interference
P Induced rotor power, W
P 0 Zero-lift induced rotor power, W
Q Rotor torque, Nm
R Rotor radius, m
r Distance from the blade root to the blade section, m
r / R Non-dimensional radial position
T Rotor thrust, N
z Rotor axial separation distance, m
z / D Rotor axial separation ratio
α n Blade section angle of attack, deg
θ n Blade section pitch angle, deg
ρ Density of air (sea-level), 1.225 kg/m3
ϕ n Blade section inflow angle, deg

References

  1. Aboulafia, R. World Military and Civil Aircraft Briefing; TEAL Group Corporation: Fairfax, VA, USA, 2016. [Google Scholar]
  2. Prior, S.; Shen, S.-T.; Erbil, M.A.; Brazinskas, M.; Mielniczek, W. HALO the winning entry to the DARPA UAVForge challenge 2012. In Design, User Experience, and Usability. User Experience in Novel Technological Environments; Marcus, A., Ed.; Springer: Berlin/Heidelberg, Germany, 2013; Volume 8014, pp. 179–188. [Google Scholar]
  3. Deters, R.W.; Selig, M.S. Static testing of micro propellers. In Proceedings of the 26th AIAA Aplied Aerodynamics Conference, Honolulu, HI, USA, 18–21 August 2008.
  4. Zhou, Y.; Wang, Z.J. Effects of surface roughness on separated and transitional flows over a wing. AIAA J. 2012, 50, 593–609. [Google Scholar] [CrossRef]
  5. Coleman, C.P. A Survey of Theoretical and Experimental Coaxial Rotor Aerodynamic Research; NASA-TP-3675; National Aeronautics and Space Administration National Technical Information Service: Moffett Field, CA, USA, 1997; p. 26.
  6. Nagashima, T.; Ouchi, H.; Sasaki, F. Optimum performance and load sharing of coaxial rotor in hover. J. Jpn. Soc. Aeronaut. Space Sci. 1978, 26, 293. [Google Scholar]
  7. Shinohara, K. Optimum Aerodynamic Character of the Coaxial Counter Rotating Rotor System; The National Defense Academy: Yokosuka, Japan, 1977. [Google Scholar]
  8. Harrington, R.D. Full-Scale-Tunnel Investigation of the Static-Thrust Performance of a Coaxial Helicopter Rotor; NACA-TN-2318; National Advisory Committee: Langley Field, VA, USA, 1951; p. 23.
  9. Dingeldein, R.C. Wind-Tunnel Studies of the Performance of Multirotor Configurations; National Advisory Committee for Aeronautics: Langley Field, VA, USA, 1 August 1954.
  10. Cheney, M.C. The ABC helicopter. J. Am. Helicopter Soc. 1969, 14, 10–11. [Google Scholar] [CrossRef]
  11. Rorke, J.B. Hover Performance Tests of Full Scale Variable Geometry Rotors; NASA: Washington, DC, USA, 1975.
  12. Arents, D.N. An Assessment of the Hover Performance of the XH-59A Advancing Blade Concept Demonstration Helicopter; Eustis Directorate: Fort Eustis, VA, USA, 1977. [Google Scholar]
  13. Bohorquez, F. Rotor Hover Performance and System Design of an Efficient Coaxial Rotary Wing Micro Air Vehicle. Ph.D. Thesis, University of Maryland, College Park, MD, USA, 2007. [Google Scholar]
  14. Lee, T.E. Design and Performance of a Ducted Coaxial Rotor in Hover and Forward Flight. Ph.D. Thesis, University of Maryland, College Park, MD, USA, 2010. [Google Scholar]
  15. Ramasamy, M. Hover performance measurements toward understanding aerodynamic interference in coaxial, tandem, and tilt rotors. J. Am. Helicopter Soc. 2015, 60, 1–17. [Google Scholar] [CrossRef]
  16. McAlister, K.W.; Tung, C.; Rand, O.; Khromov, V.; Wilson, J.S. Experimental and numerical study of a model coaxial rotor. In Proceedings of the 62nd American Helicopter Society Annual Forum, Phoenix, AZ, USA, 2006.
  17. Theys, B.; Dimitriadis, G.; Hendrick, P.; De Schutter, J. Influence of propeller configuration on propulsion system efficiency of multi-rotor unmanned aerial vehicles. In Proceedings of the 2016 International Conference on Unmanned Aircraft Systems (ICUAS), Arlington, VA, USA, 7–10 June 2016.
  18. Stepniewski, W.Z. Basic Theories of Rotor Aerodynamics (With Application to Helicopters). In Rotary-Wing Aerodynamics; Dover Publications: New York, NY, USA, 1979; Volume 1. [Google Scholar]
  19. Bender, G.L.; Sullivan, P.J.; Yamakawa, G.M.; Robbins, R.D.; Herbst, M.K.; Williams, R.A. Airworthiness and Flight Characteristics Test of the CH-47D Helicopter; USAAEFA: St. Louis, MO, USA, 1984. [Google Scholar]
  20. Prior, S.D.; Bell, C.J. Empirical measurements of small unmanned aerial vehicle co-axial rotor systems. J. Sci. Innov. 2011, 1, 1–18. [Google Scholar]
  21. Andrew, M.J. Coaxial Contrarotating Twin Rotor Aerodynamics. Ph.D. Thesis, University of Southampton, Southampton, UK, 1983. [Google Scholar]
  22. Johnson, W. Influence of lift offset on rotor performance. In Proceedings of the AHS Technical Specialists Meeting on Aeromechanics, San Francisco, CA, USA, 23–25 January 2008.
  23. Stepniewski, W.Z.; Sloan, L.H. Experimental Investigation of PV-14 Overlap; 14-A-03; Piasecki Corp.: Essington, PA, USA, 1948. [Google Scholar]
  24. Griffiths, D.; Leishman, J.G. A study of dual-rotor interference and ground effect using a free-vortex wake model. In Proceedings of the 58th AHS International Annual Forum, Montreal, QC, Canada, 11 June 2002.
  25. Heyson, H.H. An Evaluation of Linearized Vortex Theory as Aplied to Single and Multiple Rotors Hovering in and out of Ground Effect; NASA TN D-43; National Aeronautics and Space Administration: Washington, DC, USA, 1959.
  26. Sweet, G.E. Hovering Measurements for Twin-Rotor Configurations with and without Overlap; NASA TN D-534; National Aeronautics and Space Administration: Washington, DC, USA, 1960.
  27. Drela, M. XFOIL: An analysis and design system for low reynolds number airfoils. In Low Reynolds Number Aerodynamics: Proceedings of the Conference Notre Dame, Indiana, USA, 5–7 June 1989; Mueller, T.J., Ed.; Springer: Berlin/Heidelberg, Germany, 1989; pp. 1–12. [Google Scholar]
  28. Leishman, J.G.; Ananthan, S. Aerodynamic optimization of a coaxial proprotor. In Proceedings of the 62nd AHS International Annual Forum, Montreal, QC, Canada, 9 May 2006.
  29. Glauert, H. The Elements of Aerofoil and Airscrew Theory; Cambridge University Press: New York, NY, USA, 1983. [Google Scholar]
  30. Leishman, J.G. Principles of Helicopter Aerodynamics, 2nd ed.; Cambridge University Press: New York, NY, USA, 2006; p. 826. [Google Scholar]
  31. Leishman, J.G.; Syal, M. Figure of merit definition for coaxial rotors. J. Am. Helicopter Soc. 2008, 53, 290–300. [Google Scholar] [CrossRef]
  32. Harris, F.D. Technical note: Twin rotor hover performance. J. Am. Helicopter Soc. 1999, 44, 34–37. [Google Scholar] [CrossRef]
Figure 1. Overlapping rotor propulsion system co-axial quadrotor configurations: (a) system torque balanced at all four propulsion units internally; and (b) system torque balance achieved externally of the individual propulsion units.
Aerospace 03 00032 g001
Figure 2. Propulsion system configuration diagram.
Aerospace 03 00032 g002
Figure 3. T-Motor 16 inch × 5.4 inch isometric top and side view images taken with a conventional scanner.
Aerospace 03 00032 g003
Figure 4. 3D scanned T-Motor 16 inch × 5.4 inch surfaces with recreated airfoil shapes.
Aerospace 03 00032 g004
Figure 5. Rotor airfoil tracing method. Cuts obtained at various rotor span stations using a CNC mill.
Aerospace 03 00032 g005
Figure 6. T-Motor 16 inch × 5.4 inch blade twist and chord length at various rotor blade span stations r/R.
Aerospace 03 00032 g006
Figure 7. T-Motor 16 inch × 5.4 inch normalized 2D airfoil profiles.
Aerospace 03 00032 g007
Figure 8. Overlapped rotor propulsion system test rig. (a) The test-rig side view shows maximum axial rotor separation; (b) The test-rig top view shows maximum rotor horizontal separation.
Aerospace 03 00032 g008
Figure 9. Test rig system diagram.
Aerospace 03 00032 g009
Figure 10. Test rig arm profile drag. (a) Arm profile drag as a function of rotor axial separation z; (b) test rig arm profile geometry (in mm).
Aerospace 03 00032 g010
Figure 11. T-Motor 16 inch × 5.4 inch rotor theoretical profile drag at zero lift.
Aerospace 03 00032 g011
Figure 12. Performance analysis of an isolated rotor in comparison to a co-axial setup (z/D = 0.1).
Aerospace 03 00032 g012
Figure 13. Co-axial rotor propulsion system thrust sharing analysis as a function of the axial separation ratio, rotor operated at torque balance ( Q u + Q l = 0 ) .
Aerospace 03 00032 g013
Figure 14. Co-axial propulsion system performance at various axial separations (thrust = 8 N).
Aerospace 03 00032 g014
Figure 15. Co-axial propulsion system efficiency losses at various z/D ratios. (a) Overall co-axial system efficiency losses ( Q u + Q l = 0 ); (b) Individual rotor efficiency losses when operated in a co-axial setup ( Q u + Q l = 0 ) ; overall thrust, 8 N.
Aerospace 03 00032 g015
Figure 16. Performance comparison quantifying losses/gains of co-rotating rotor co-axial and conventional co-axial setups over two isolated rotors (overall thrust, 15 N). (a) Co-axial system performance; (b) Individual rotor performance.
Aerospace 03 00032 g016
Figure 17. Overlapping rotor (tandem) performance in terms of FM as a function of the overlap ratio (z/D = 0.05): (a) overall thrust = 8 N; and (b) overall thrust = 15 N.
Aerospace 03 00032 g017
Figure 18. Overlapping rotor (tandem) performance in terms of percentage efficiency loss over two isolated rotors (z/D = 0.05): (a) overall thrust = 8 N; and (b) overall thrust = 15 N.
Aerospace 03 00032 g018
Figure 19. Thrust and power ratios of the upper and lower rotors (z/D = 0.05) (overall thrust, 8 N).
Aerospace 03 00032 g019
Figure 20. Overlapping rotor (tandem)-induced power correction k o v for the hover state, derived from momentum theory (z/D = 0.05).
Aerospace 03 00032 g020
Figure 21. Effect of axial separation z/D at partial rotor overlap d/D = 0.85 (overall thrust, 8 N).
Aerospace 03 00032 g021

