Article

Linearized Euler Equations for the Determination of Scattering Matrices for Orifice and Perforated Plate Configurations in the High Mach Number Regime

Lehrstuhl für Thermodynamik, TU München, Boltzmannstr. 15, Garching D-85747, Germany
*
Author to whom correspondence should be addressed.
Aerospace 2016, 3(4), 33; https://doi.org/10.3390/aerospace3040033
Submission received: 19 July 2016 / Revised: 18 September 2016 / Accepted: 11 October 2016 / Published: 17 October 2016
(This article belongs to the Special Issue Recent Advances in Aeroacoustics)

Abstract

:
The interaction of a plane acoustic wave and a sheared flow is numerically investigated for simple orifice and perforated plate configurations in an isolated, non-resonant environment for Mach numbers up to choked conditions in the holes. Analytical derivations found in the literature are not valid in this regime due to restrictions to low Mach numbers and incompressible conditions. To allow for a systematic and detailed parameter study, a low-cost hybrid Computational Fluid Dynamic/Computational Aeroacoustic (CFD/CAA) methodology is used. For the CFD simulations, a standard kϵ Reynolds-Averaged Navier–Stokes (RANS) model is employed, while the CAA simulations are based on frequency space transformed linearized Euler equations (LEE), which are discretized in a stabilized Finite Element method. Simulation times in the order of seconds per frequency allow for a detailed parameter study. From the application of the Multi Microphone Method together with the two-source location procedure, acoustic scattering matrices are calculated and compared to experimental findings showing very good agreement. The scattering properties are presented in the form of scattering matrices for a frequency range of 500–1500 Hz.

Graphical Abstract

1. Introduction

The interaction effects of an acoustic wave and a sheared flow is of interest for various disciplines in which their consequences can be either beneficial or problematic. Typically, sheared flow conditions evolve due to a sudden change of flow cross-section, whereas the source of the acoustics can be manifold. Such situations can e.g., be found in experimental setups that require a decoupling of the system at its boundaries from the environment to avoid unknown interference from the surroundings. Such requirements arise especially if acoustic damping measurements are involved. At an inlet or outlet providing a mass flow to the system, an acoustic decoupling can be imposed by establishing supersonic flow conditions. The high Mach numbers are especially challenging for numerical tools to capture the relevant aeroacoustic interaction effects.
In [1], acoustic damping measurements of a rocket engine geometry with focus on the combustion chamber and nozzle parts including additional damping devices are performed with a flow of air at ambient temperature conditions. At the outlet, the system is decoupled from the environment by the natural supersonic flow condition at the exit of the nozzle. At the inlet, however, a perforated plate is used to establish high Mach numbers in the flow. Unexpectedly, measurements show that acoustic waves are subjected to great damping in this configuration, thus obscuring the intended determination of damping coefficients from the measurements. The knowledge of the corresponding acoustic reflection coefficient is essential for the understanding of the damping and for the application as a proper boundary condition in succeeding acoustic assessment tools.
The interaction of acoustic waves with sheared flow conditions has been studied for many years. Analytical derivations of the acoustic impedance and reflection coefficient for area discontinuities are performed in [2,3,4,5,6]. The authors postulate the generation of vortical structures due to the interaction of the acoustic wave with the jet flow. Experimental studies on the resistance and reactance of perforated plate with mean flow are presented in [7], showing that the resistance increases with mean flow and sound pressure level. A rich collection of further publications can be found, which investigate, however, the low Mach number regime [8,9,10,11,12,13].
The wealth of studies on the interaction of acoustic waves with sheared flow in the high Mach number regime is far less rich. Experimental investigations for higher Mach numbers of orifice and perforated plate configurations are reported in [14]. Herein, scattering matrices for different area ratios of orifice and perforated plate configurations are determined. Furthermore, considerations for Mach numbers until 0.7 in the single holes are presented. Especially, the downstream reflection coefficient amplitude shows an increasing and decreasing behavior over the Mach number. Analytical derivations of an “entropy wave theory” and a “vorticity wave theory” indicate possible interaction effects of an acoustic wave with vorticity and entropy fluctuations.
Nowadays, the progress in computational performance allows for more and more detailed computations on aeroacoustics. Sophisticated numerical methods based on Large Eddy Simulations (LES) techniques have been performed on simple geometries for non-resonant conditions in the low Mach number regime in [15,16,17], showing excellent agreement with experimental data. The computational efforts for LES simulations are, however, quite high and parameter studies are rather difficult to conduct. Moreover, due to increasing computational challenges arising in the high Mach number regime in terms of time step limitations and shock capturing techniques, LES still seems to be out of reach for detailed studies in this particular regime. A more promising technique for the simulation of the scattering of acoustic waves at sudden area changes is proposed in [18,19,20,21]. Herein, a coupled procedure to compute the acoustic fields of area changes including sheared flow conditions is presented. Linearized Navier–Stokes equations are evaluated to gain the aeroacoustic fields. Such methodologies are also found for problems including jet noise [22,23,24] and sound emission from aircrafts and their air-frames [25,26,27]. In addition, acoustic eigenmode studies in reactive flow problems with temperature distributions and high density gradients have been performed [28].
The investigations in this article are based on numerical results gained from a Computational Fluid Dynamic (CFD)/Computational Aeroacoustic (CAA) approach used in [29]. Herein, linearized Euler equations (LEE) are solved with a stabilized Finite Element Method (SFEM) in frequency space, which, in contrast to the methodology used in [18,19,20,21], does not need artificially enhanced viscous dissipation for numerical stabilization. Although, in this method, only a unidirectional coupling from the mean flow to the acoustic field is provided, its capability of capturing the relevant interaction effects is demonstrated in [29,30]. In comparison to LES simulations, the CFD/CAA approach reduces required computational resources substantially and thus allows for the investigation of physical processes in parameter studies in great detail. Furthermore, the usage of frequency space transformed equations greatly simplifies the boundary treatment. While in time domain codes acoustic boundary conditions are more difficult to realize (see [31,32]), acoustic impedances can directly be imposed in frequency space. In addition, the simulated results can be post-processed more conveniently. As the CAA solves only for fluctuating components, the characteristic waves necessary to determine the scattering matrices can be extracted with high accuracy. A disadvantage of LEE is that their applicability is restricted the description of small amplitude behavior.
The presented considerations are based on the experimental setup shown in [33]. Herein, the acoustic scattering properties of orifices and perforated plates are determined and presented in form of scattering matrices for different Mach numbers up to supersonic flow conditions within the holes. To simplify the investigations, air is used at ambient conditions. The analyses are restricted to longitudinal waves in confined ducts. The behavior of the reflection properties for an acoustic wave approaching the orifice or perforated plate, respectively, from downstream is especially analyzed.
The article is structured as follows: first, the experimental test configurations are presented in Section 2, followed by the introduction of the numerical methodology in Section 3. Herein, the discretization technique used to calculate the acoustic fields is explained and the procedure to evaluate scattering matrices is presented. The numerically evaluated scattering matrices for orifice and perforate plates as well as a comparison to experimental data is then shown in Section 4. The main conclusions of this article are presented in Section 5.

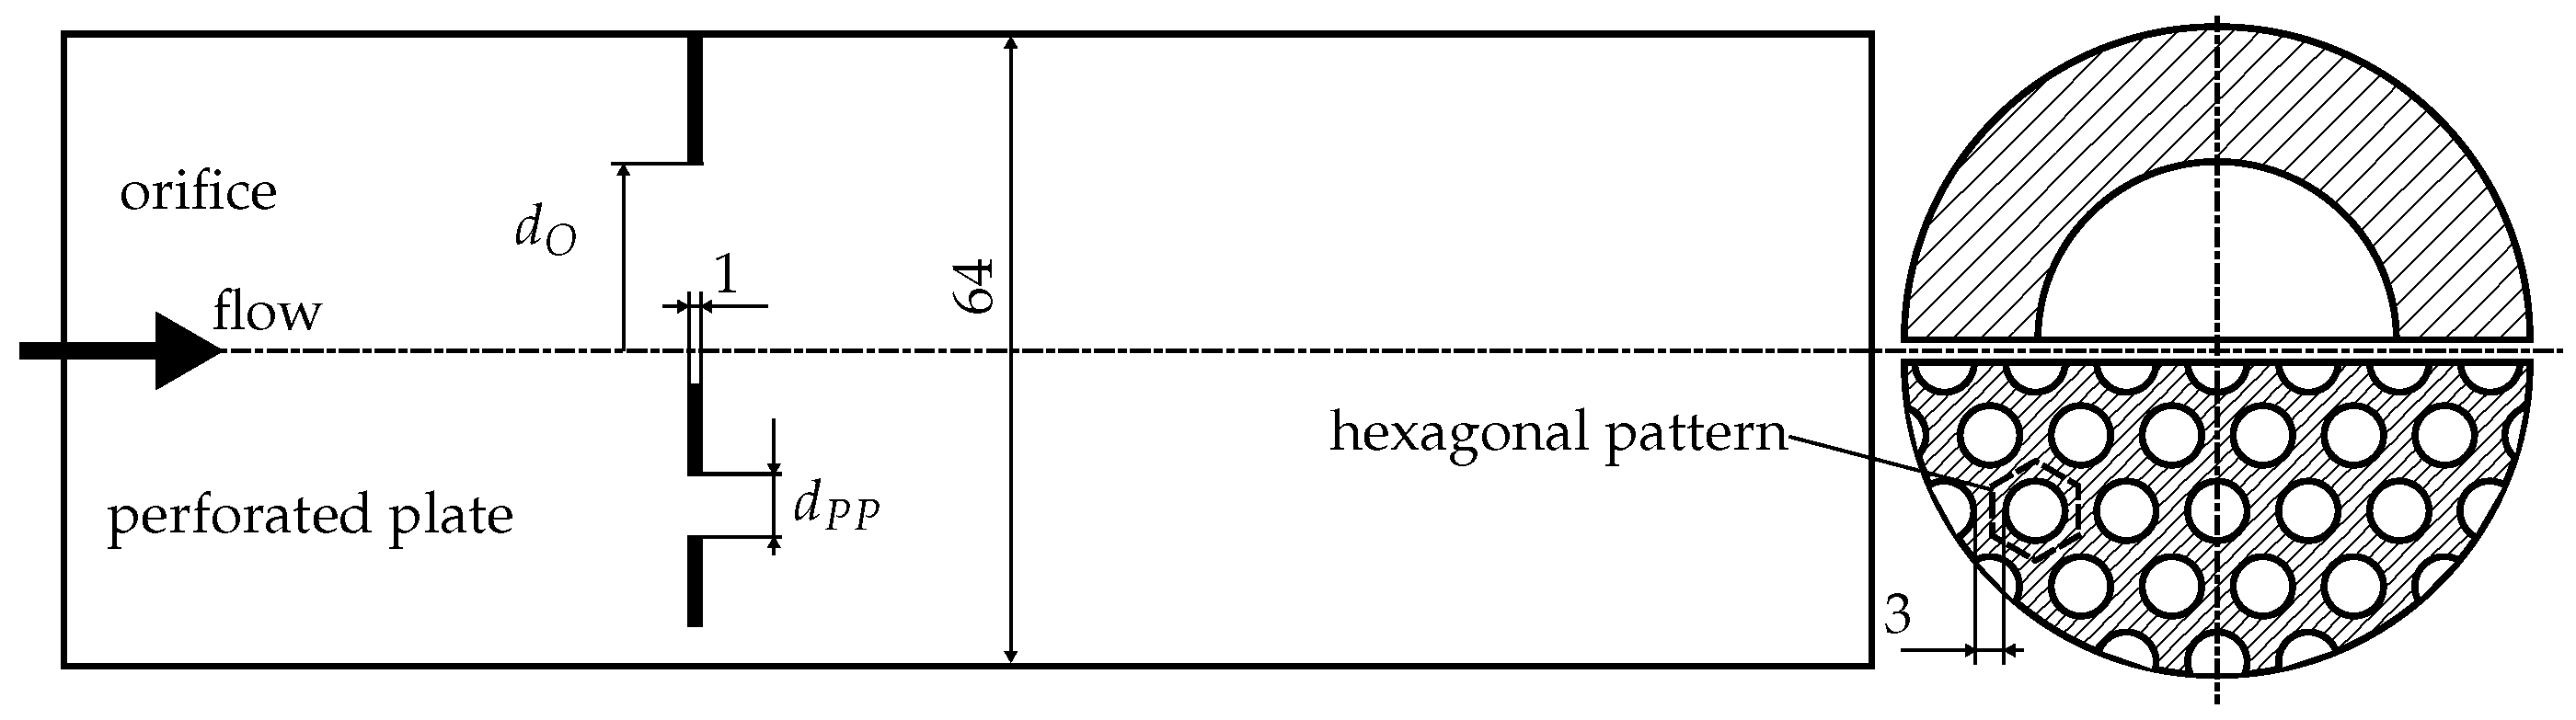
2. Test Case Description

In [33], a systematic investigation of the scattering properties of orifice and perforated plate configurations is conducted. The experimentally evaluated scattering matrix for an area ratio of A r = 35 . 43 % is used to validate the numerical methodology. The experiment consists of two co-axial pipe sections with a diameter of 64 . 0 mm . In between the two flanges, the orifice with a single hole diameter of d O = 38 . 1 mm or the perforated plate with about 58 holes of a diameter of d P P = 5 . 0 mm each is located (see Figure 1). In the case of the perforated plate, a regular hexagonal pattern with a distance between the holes of 3 . 0 mm is chosen. Both geometries are given with a thickness of t = 1 . 0 mm .
In the experiments, a mass flow of air (specific gas constant R = 287 J/(Kg·K) , isentropic exponent γ = 1 . 4 ) at ambient temperature ( 288 K ) and pressure ( 1 atm at the outlet) conditions is provided. Different load points, defined by a systematically reduced static pressure ratio p r over the orifice or perforated plate up to choked conditions and therefore a sonic Mach number in the single holes, are considered. The static pressure ratios together with the mass flows of air m ˙ are reported in Table 1.
A siren is used to apply a sinusoidal acoustic excitation on the system in a frequency range of 500–1500 Hz with a resolution of Δ f = 10 Hz . The maximum excitation frequency is kept under the cut-on frequency of higher-order acoustic modes to ensure plane acoustic wave propagation only.
To capture the acoustic waves, the fluctuating static pressure is measured using four axially distributed pressure sensors upstream and six sensors downstream of the orifice and perforated plate, respectively. From the pressure signals, the downstream and upstream running waves and finally the scattering matrices are evaluated. The experimental findings are shown together with the numerical results in Section 4.2.

3. Numerical Procedure

The determination of the scattering matrices for the orifice and the perforated plate configurations are conducted in a coupled CFD/CAA methodology following the procedure proposed in [29]. In the CFD simulation, the mean state of the system in the statistically converged sense incorporating turbulent influences is defined. Due to the absence of acoustic propagation in the CFD, the requirements of small time steps following the CFL (Courant–Friedrichs–Lewy) criteria can be met with acceptable computational efforts.
Based on the mean flow state, the acoustic propagation is then simulated in the CAA computations. For small enough amplitudes, linearity of the acoustic quantities allows for the usage of linearized field equations, which can be solved very efficiently through optimized discretization schemes. In terms of spatial discretization, the CAA simulation can be performed on coarser grids than the CFD, resolving only the mean flow gradients as well as relevant acoustic scales.
The separation of scales between the meanflow CFD simulation and the acoustic CAA computations reduces simulation times remarkably, which makes the coupled procedure especially advantageous for the parameter studies required in this investigation. Moreover, the inherent separated determination of acoustic fluctuations in the CAA makes their preceeding filtering from turbulent fluctuations obsolete and allows for effective analyses of acoustic effects.
It has been shown that the unidirectional coupling from the mean flow to the acoustics provides an adequate description of relevant interaction effects in acoustic problems using frequency transformed fields equations (see [20,29]), but time domain field equations are also very capable (see [34,35,36,37,38]) and references therein. The generation and interaction of vorticity and entropy fluctuations are especially well captured due to the incorporation of gradients of the mean flow quantities.
In the following, the mean flow simulations are discussed briefly from a numerical point of view, and the differences between orifice and perforated plate in terms of mean flow fields are highlighted. Then, a more detailed insight into the CAA is given and finally the procedure to extract scattering matrices from the acoustic fields is explained.

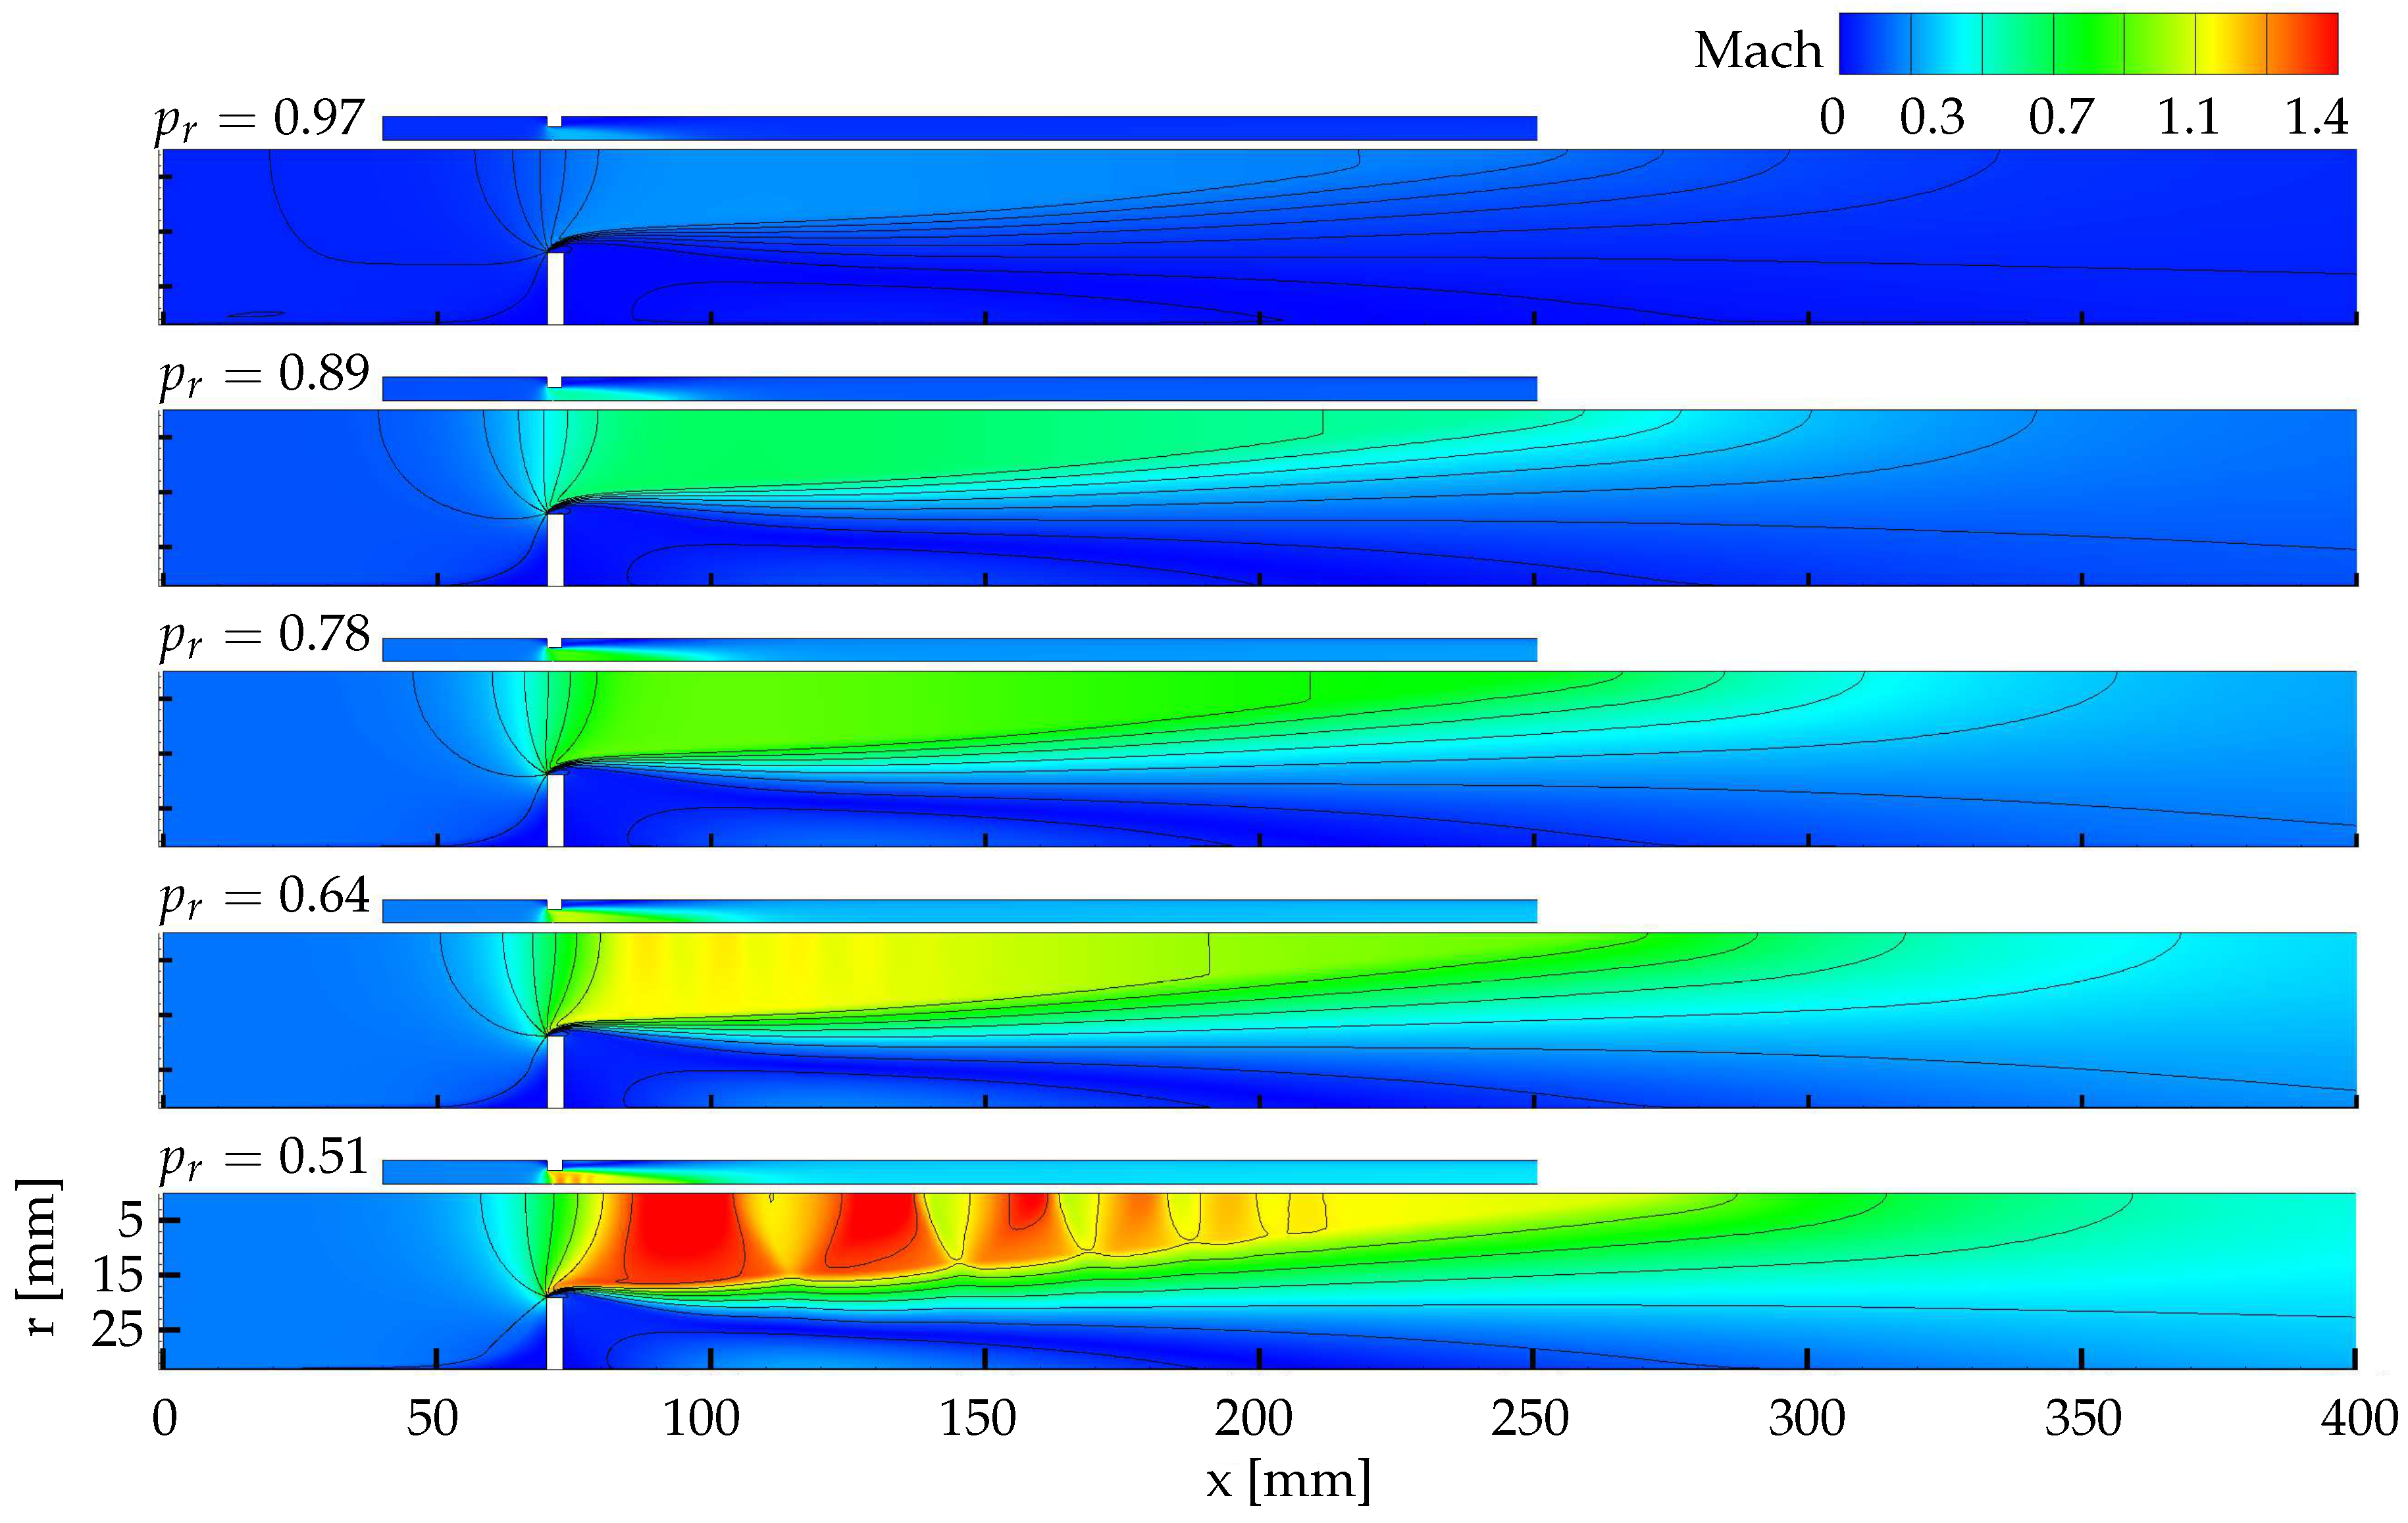
3.1. Mean Flow Computation

The mean flow fields are computed in a standard kϵ Reynolds-Averaged Navier–Stokes (RANS) simulation in ANSYS CFX 14.0 (ANSYS, Inc., Canonsburg, PA, USA). To match the given operating conditions in Table 1, mass flow rate and temperature are imposed at the inlet, while a standard outflow condition prescribing the ambient pressure is applied at the outlet. The walls are treated as inviscid and adiabatic.
In Figure 2, the Mach number distribution of both geometries for each static pressure ratio (except p r = 1 ) shows the formation of a jet structure after the contraction. Between the jet and its quiescent surroundings, a thin shear layer is formed. Isolines of the axial velocity indicate strong radial gradients in the shear layer structure. A decreasing static pressure ratio leads to an increased jet length, higher Mach numbers in the jet region, and therefore stronger gradients in radial direction of the axial mean velocity for both geometries.
On the basis of theoretical gas dynamics, supersonic conditions and associated shock patterns are expected to occur below pressure ratios of p r = 0 . 528 . However, Figure 2 shows a diamond shock pattern for pressure ratios of p r = 0 . 64 and lower. On one hand, this is due to deviations between the sharp area changes in orifice and perforated plate geometries and the perfect smooth nozzle structure in gas dynamic derivations. On the other hand, inaccurate predictions of the supersonic conditions are known to occur in numerical simulations and are also reported e.g., in [16].

3.2. Stabilized Linearized Euler Equations in Frequency Space

The coupled CFD/CAA procedure requires the decomposition of the fluiddynamic quantities q as function of space (x) and time (t) into a mean part ( ¯ ) and a fluctuating part ( ) according to
q ( x , t ) = q ¯ ( x ) + q ( x , t ) .
The fluctuating quantities are assumed to be sufficiently describable with linearized Euler equations with the mean part as linearization point, viz.
u i c , p p ¯ , ρ ρ ¯ ,
where u i denotes the i-th velocity component, p pressure and ρ density. Applying further harmonic time dependency for the fluctuating quantities, i.e.,
q ( x , t ) = q ^ ( x , ω ) e i ω t
with ω denoting the angular frequency, the LEE are transformed into frequency space and are finally given in terms of mass, momentum and energy conservation in index notation respecting Einstein summation notation by
i ω ρ ^ + u ¯ · ρ ^ + u ^ · ρ ¯ + ρ ¯ · u ^ + ρ ^ · u ¯ = L ^ ϕ = R ^ ,
i ω u ^ + ( u ¯ · ) u ^ + ( u ^ · ) u ¯ ρ ^ ρ ¯ 2 p ¯ + 1 ρ ¯ p ^ = L u ^ i ϕ = R u ^ i ,
i ω p ^ + u ¯ · p ^ + u ^ · p ¯ + κ p ¯ · u ^ + κ p ^ · u ¯ = L p ^ ϕ = R p ^ ,
with = ( / r , / z ) T and · u = ( 1 / r ( r u r ) / r , u z / z ) T . Furthermore, L = ( L ρ ^ , L u ^ i , L p ^ ) T denotes the LEE operator on the vector of unknowns ϕ = ( ρ ^ , u ^ i , p ^ ) T . For a converged solution, the residuum vector R = ( R ρ ^ , R u ^ i , R p ) T vanishes | | R 2 | | 2 0 . In the LEE (4)–(6), the diffusion of heat and momentum is neglected, i.e., the values of thermal conductivity and vicosity are set to zero. In contrast to [29], a non-isentropic description of the field equations due to density and temperature gradients is necessary.
The LEE are discretized in a stabilized Finite Element Method (SFEM) to ensure a numerically stable and consistent solution procedure. Using the Galerkin/least-squares (GLS) technique, which aims for the minimization of the residuum norm | | R 2 | | 2 of the stabilized field equations, the LEE are given in modified weak Finite Element form as
V L ^ ϕ w ρ ^ d V + V e τ ρ ^ ( L ^ w ρ ^ ) ( L ^ ϕ ) d V e = R ^ ,
V L u ^ i ϕ w u ^ i d V + V e τ u ^ i ( L u ^ i w u ^ i ) ( L u ^ i ϕ ) d V e = R u ^ i ,
V L p ^ ϕ w p ^ d V Standard FEM + V e τ p ^ ( L p ^ w p ^ ) ( L p ^ ϕ ) d V e GLS term = R p ^ ,
where the weighting function w = ( w ρ ^ , w u ^ i , w p ^ ) T is additionally introduced. The additional GLS term has to be calculated element-wise. In the stabilized form of the LEE, the stabilization parameter τ is evaluated according to [39] as
τ ρ ^ , u ^ i , p ^ = τ = max α h i u ¯ i + c ,
where h i denotes the element size in i-th direction. The parameter α is set to 0.1 throughout the entire investigation. All field equations are equally stabilized by setting τ the same and applying the GLS technique. A comprehensive overview of stabilization techniques for flow problems is given in [40].

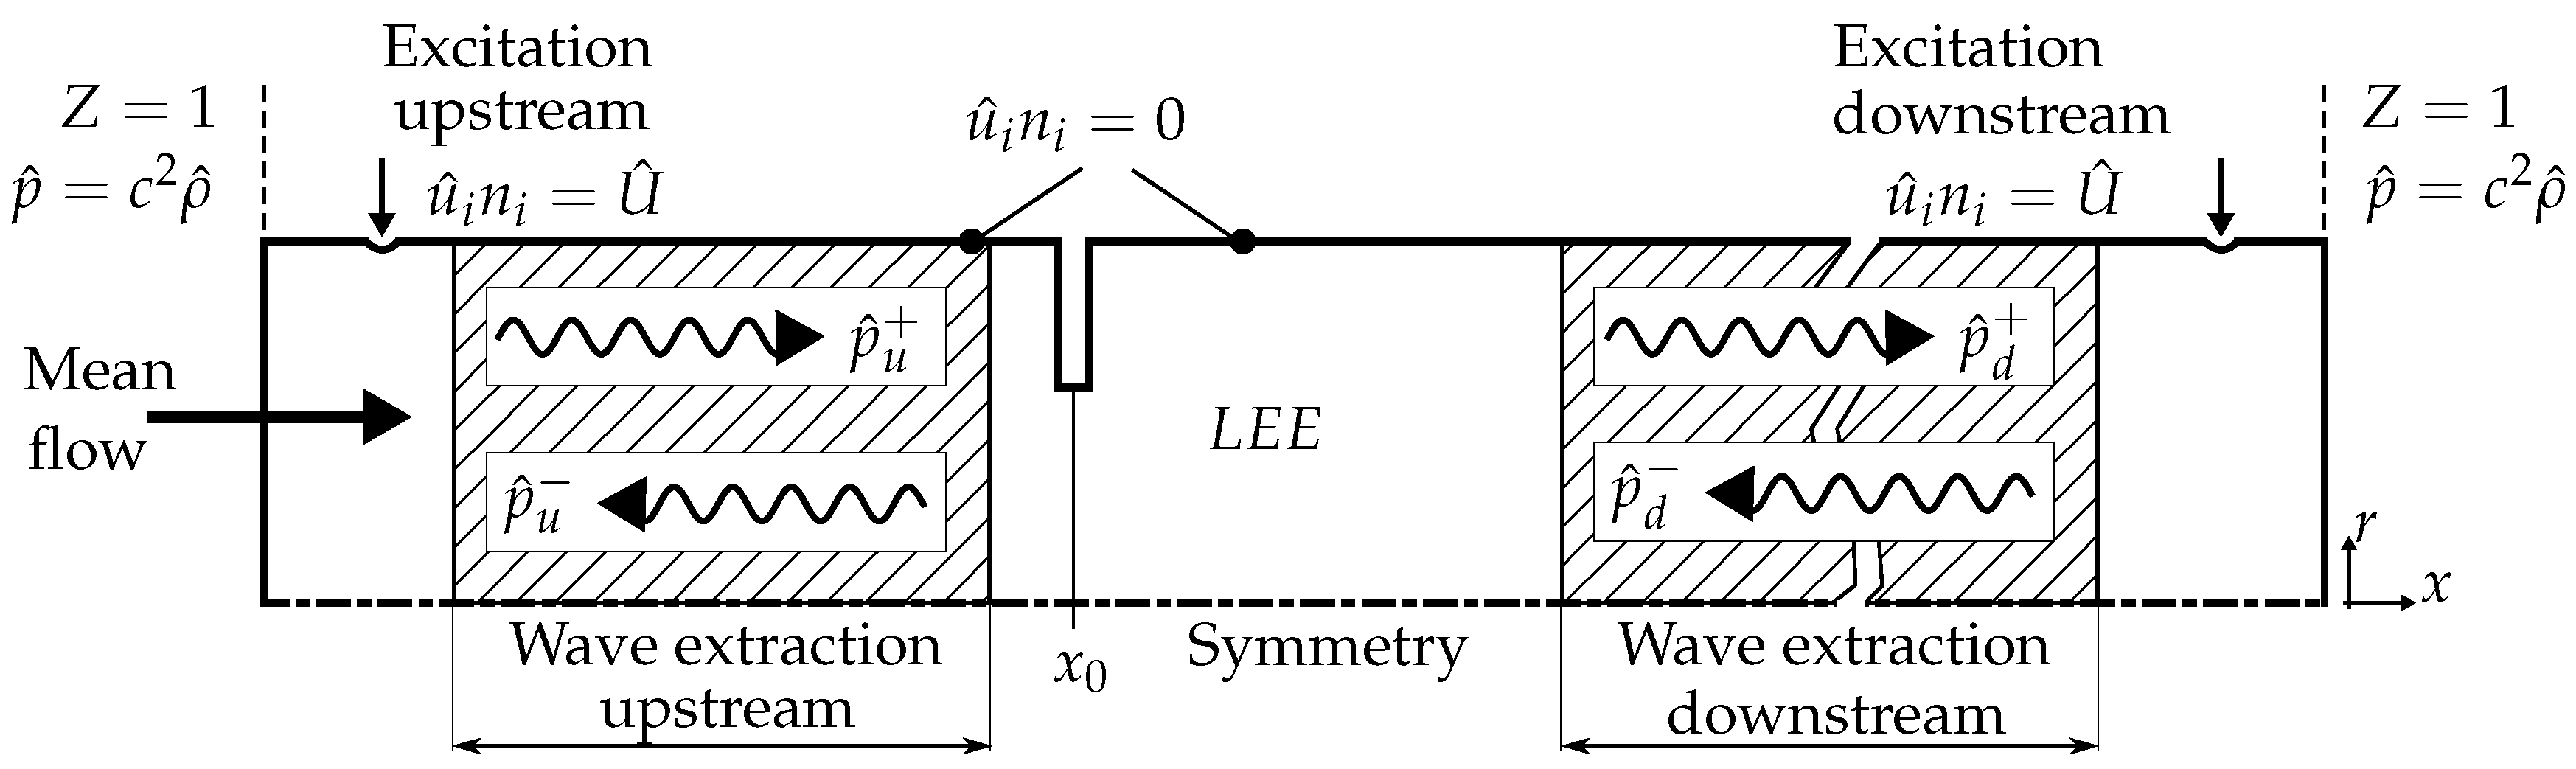
3.3. Numerical Setup for Orifice and Perforated Plate Configurations

Based upon the mean part, the acoustic field is evaluated from the LEE on a numerical setup as presented in Figure 3. At inlets and outlets, non-reflecting boundary conditions are imposed for the acoustic wave in the form of an impedance Z yielding
Z = p ^ u ^ i n i ρ ¯ c = 1 ,
with n i denoting the i-th surface normal vector component. This simple form of non-reflecting boundary conditions makes the frequency space description of acoustic propagation advantageous in comparison to time-domain computations, see e.g., [16] or [41] . Furthermore, isentropic conditions are assumed to treat the entropy fluctuations, viz.
p ^ = c 2 ρ ^ .
Due to the convective transport character of vorticity fluctuations, a special treatment of such is not necessary at the inlet. A significantly extended computational domain in the axial direction towards the outlet of 300 · d O in the case of the orifice, and even 2000 · d P P in the case of the perforated plate, leads to the conclusion that the vorticity fluctuations, originating in the shear layer region, are sufficiently dissipated before they reach the outlet. Therefore, boundary conditions at inlets and outlets are not necessary for the vorticity fluctuations.
Boundary conditions neglecting the acoustic boundary layer are assumed at the walls, viz.
u ^ i n i = 0 .
Furthermore, at the walls, zero gradient conditions for density and pressure are imposed, i.e.,
ρ ^ x i n i = p ^ x i n i = 0 .
The excitation of the system is performed by imposing an acoustic velocity amplitude U ^ at the wall, viz.
u ^ i n i = U ^
(see also Figure 3). The excitation velocity amplitude U ^ is designed such that the calculated pressure amplitudes p ^ are comparable to the measurements in [33].
Axis-symmetrical conditions are assumed, which reduce computational effort further to only half-plane considerations. Hence, symmetry boundary conditions are imposed at the axis of rotation and the LEE are evaluated in a cylindrical r , ϕ , x -coordinate system. Axis-symmetrical conditions require the independence of the quantities q of the azimuthal coordinate ϕ, i.e.,
q ϕ = 0 .
Moreover, the velocity component in azimuthal direction is set to zero, i.e.,
u ^ ϕ = u ¯ ϕ = 0 .
In the case of the perforated plate, only one single hole is considered and treated in the same way as the orifice case. That is, the mean flow simulation as well as the acoustic computation is performed for a single hole domain with wall (symmetry) boundary conditions. For the CFD simulation, this is an approximation. The good comparison of the computed results with the experimental data in terms of the scattering matrices shows, however, that the assumption is reasonable, cf. Section 4.
The domain is discretized using linear shape functions on tetrahedral elements in an unstructured grid. The grid resolution is refined in the vicinity of the contraction region to resolve the shear layer and vorticity fluctuations. In the remaining domain, the resolution is chosen such that the acoustic wave length is resolved with about 50 elements. Altogether, 120,000 elements are used leading to 250,000 degrees of freedom in the case of both the orifice and the perforate plate. The solution process is performed in COMSOL Multiphysics 4.3a (COMSOL, Inc., Burlington, MA, USA) using a MUMPS (Multifrontal Massively Parallel Sparse) direct solver. A numerical method has already been proposed by [18].

3.4. Wave Extraction and Evaluation of Scattering Matrix

In order to determine the scattering properties in terms of reflection and transmission, the acoustic fields upstream ( u ) and downstream ( d ) of each configuration are decomposed into pressure waves running in the downstream ( p ^ u / d + ) and upstream ( p ^ u / d ) directions. The running waves are extracted in a filter procedure to eliminate influences from entropy and vorticity fluctuations (see [21,29]). For that purpose, the acoustic pressure amplitudes p ^ u , i and p ^ d , i are recorded at m = 150 axial positions x i and a radial position of r = 0 . 5 d o / p p within the wave extraction zones upstream and downstream and fitted to the analytically given wave form of a plane acoustic wave of
p ^ ( u / d ) , i = p ^ u / d + e i k u / d + ( x i x 0 ) + p ^ u / d e i k u / d ( x i x 0 )
in a least-square sense. The wave numbers k u / d ± are defined as
k u / d ± = ± k 1 ± M u / d ,
where
k = ω c = 2 π f c .
In addition, M denotes the Mach number and x 0 the phase reference plane, which is located in the center of the single hole (see Figure 3).
The downstream and upstream running waves are linked to each other via reflection (R) and transmission (T) coefficients and presented in the form of frequency dependent scattering matrices S ( ω ) as
p ^ d + p ^ u = T d R u R d T u S ( ω ) p ^ u + p ^ d .
Besides the representation of the scattering properties, the scattering matrix also describes the absorption capabilities of acoustic wave energy.
The determination of the complete scattering matrix requires two independent states of the acoustic system. According to the two source-location method described, e.g., in [42,43,44,45,46,47,48], two independent acoustic fields can be achieved by locating the acoustic forcing upstream and downstream of the configuration, respectively, in two succeeding steps (see Figure 3).
Denoting the upstream excitation case with I and the downstream excitation case with II, the scattering matrix coefficients T u , R d , R u , T d in Equation (21) are finally calculated by solving the equation
p ^ d , I + p ^ u , I p ^ d , II + p ^ u , II = p ^ u , I + p ^ d , I 0 0 0 0 p ^ u , I + p ^ d , I p ^ u , II + p ^ d , II 0 0 0 0 p ^ u , II + p ^ d , II T u R d R u T d .

4. Scattering Matrices for Orifice and Perforated Plates

This section presents the results of the simulations in terms of acoustic fields as well as scattering matrices and a comparison to experimental findings. The acoustic fields are analyzed in detail for a representative case and first indications of the physical process, which leads to the damping of acoustic waves being explained.

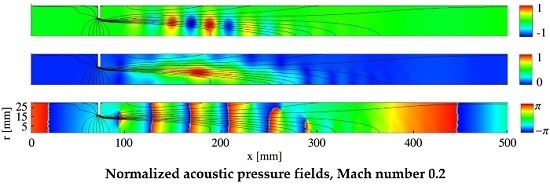
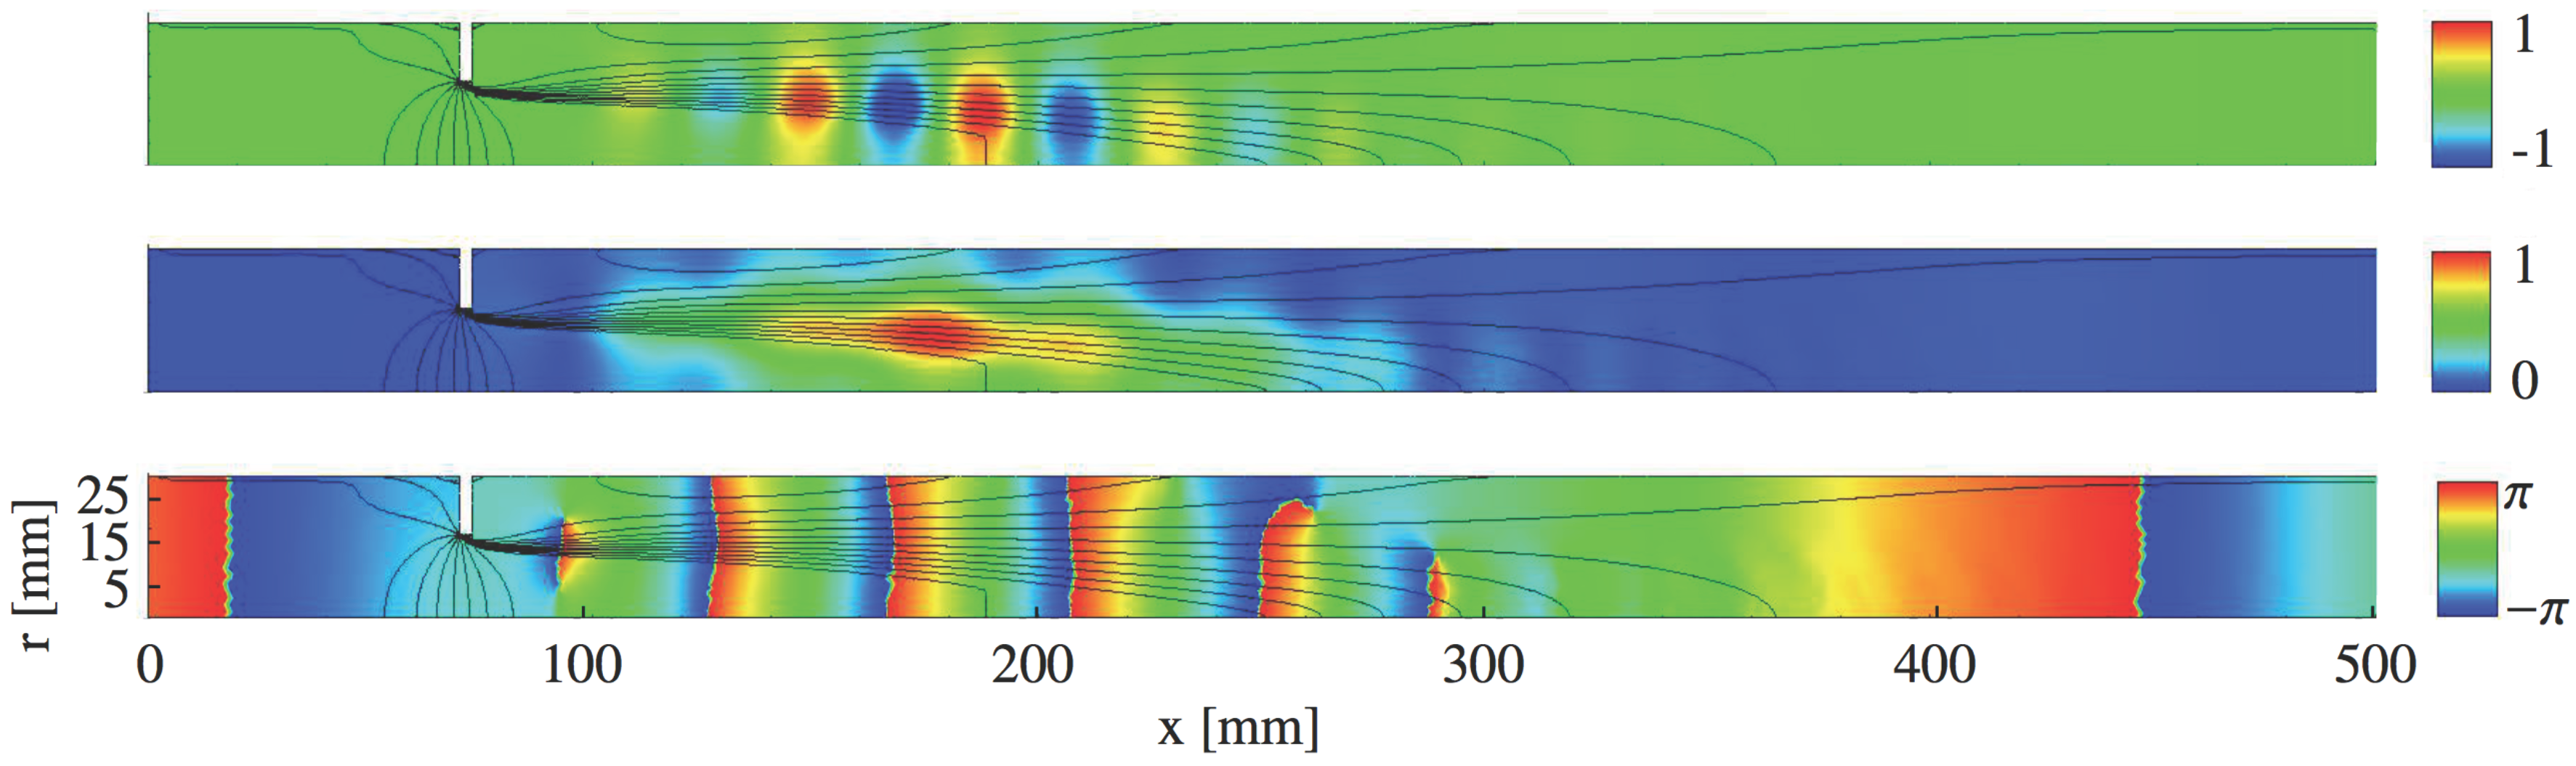
4.1. Acoustic Fields for Perforated Plate and Orifice

Exemplarily, the acoustic fields of an orifice configuration for the downstream excitation case and a static pressure ratio of p r = 0 . 97 (i.e., a Mach number of roughly 0.2 in the hole) are shown in Figure 4. For an excitation frequency of 1500 Hz , the acoustic pressure field in terms of its real part Re ( p ^ ) (top), its amplitude | p ^ | (middle), and its phase distribution ϕ ( p ^ ) (bottom) is presented.
The real part shows periodically fluctuating vortical structures within the shear layer of the mean flow, where the isolines of the axial mean velocity indicate strong radial gradients. The amplitude distribution shows a clear maximum in the region of 3–5 diameters d O downstream of the hole. Interestingly, the region of maximum amplitude does not correspond to the region of the strongest mean axial velocity gradients in the radial direction but is located further downstream.
Two regions can be distinguished in the phase plot. Within the downstream part close to the hole, a linear phase distribution indicates a convectively dominated behavior, which corresponds to a convective transport of the vortical structures observed in the real part plot. Further downstream and upstream, the phase distribution represents the shape of an acoustic wave. As can be observed, outside the shear layer and jet region, only longitudinal waves are present.
The phase plot indicates, as well, where the main interaction occurs. Shortly after the area change, the convective structures originate out of the shear layer. Within the region between x = 250 mm and x = 300 mm , the structures disappear again. This region marks the jet ending and only weak radial gradients are present here.
For higher Mach numbers, the overall behavior is similar. However, the wave lengths of the vortical structures increase. An approximative relation for the wave length of the vortical structures λ v reads according to [20]
λ v = M λ a c ,
which relates λ v to the acoustic wave length λ a c using the Mach number. Accordingly, for lower frequencies, the values of λ a c increase, which also leads to higher values of λ v . The relation (23) is confirmed by the pressure fields shown in Figure 4.
In case of the perforated plate, the ratio of the hole diameter d P P to the acoustic wave length λ a c is significantly lower than for the orifice case. Thus, the vortical wave length λ v is higher than the jet length itself and can hardly be recognized. The pressure distribution for the perforated plate configuration is thus not shown here.

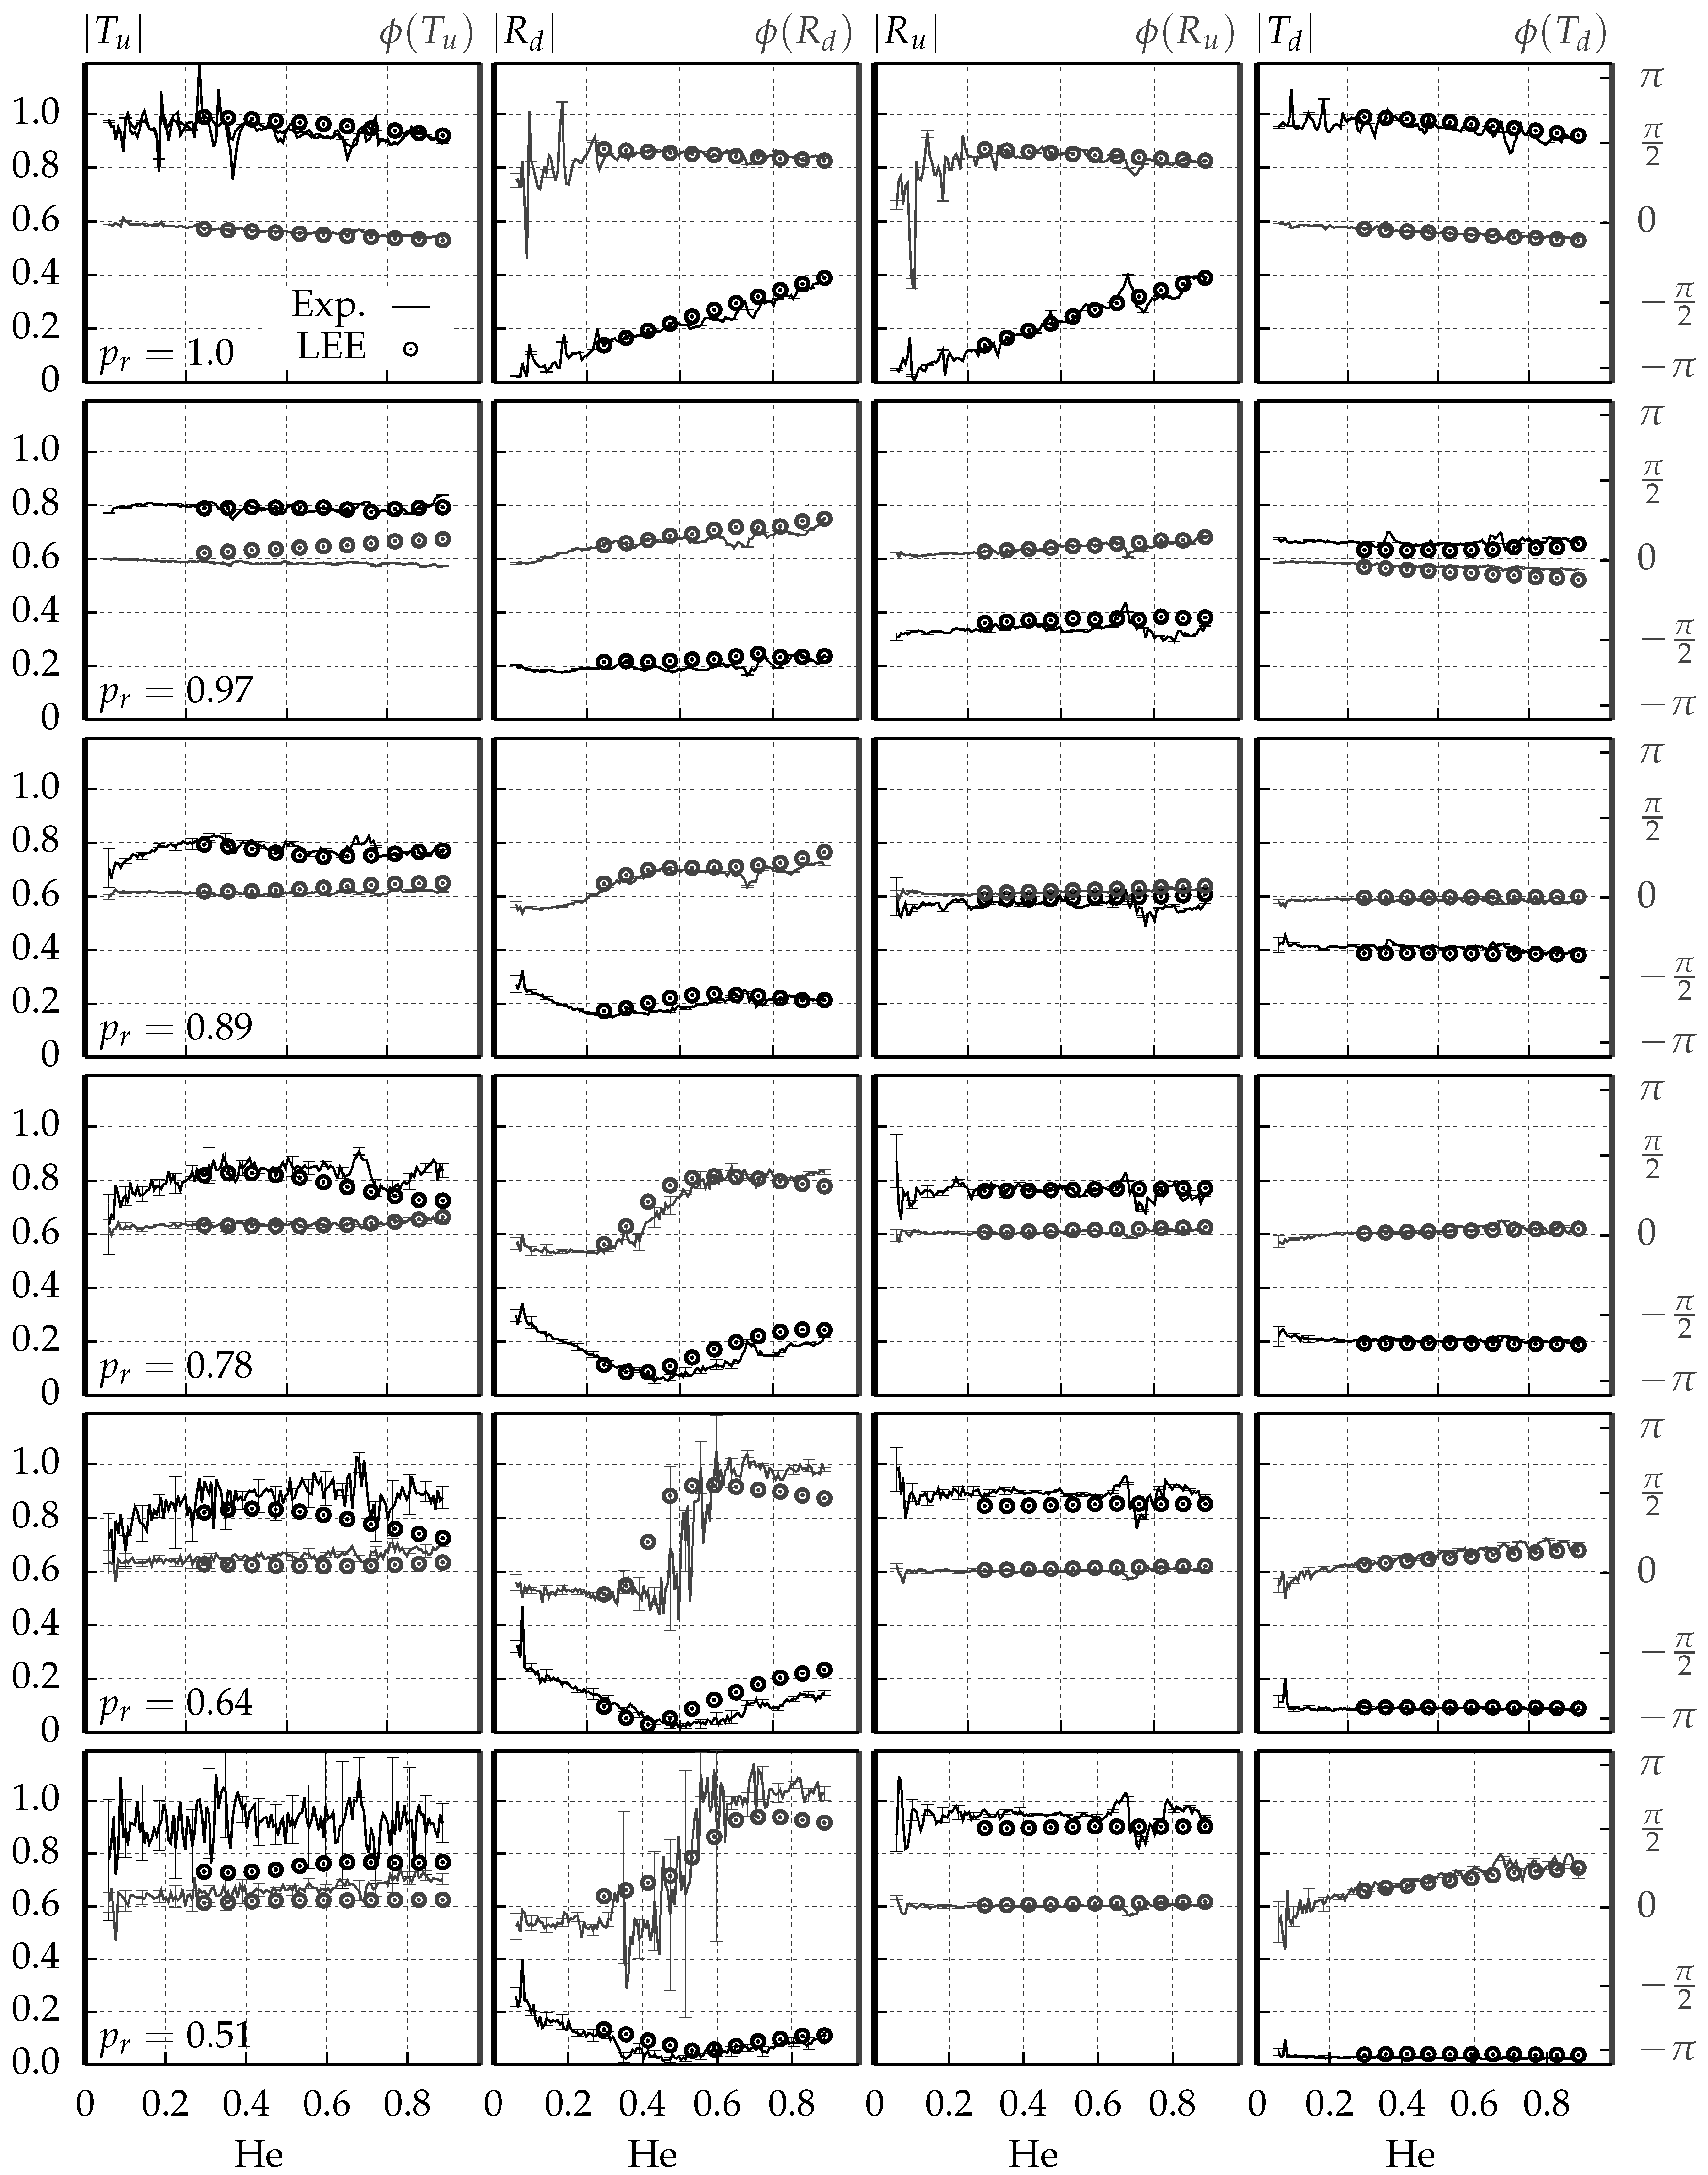
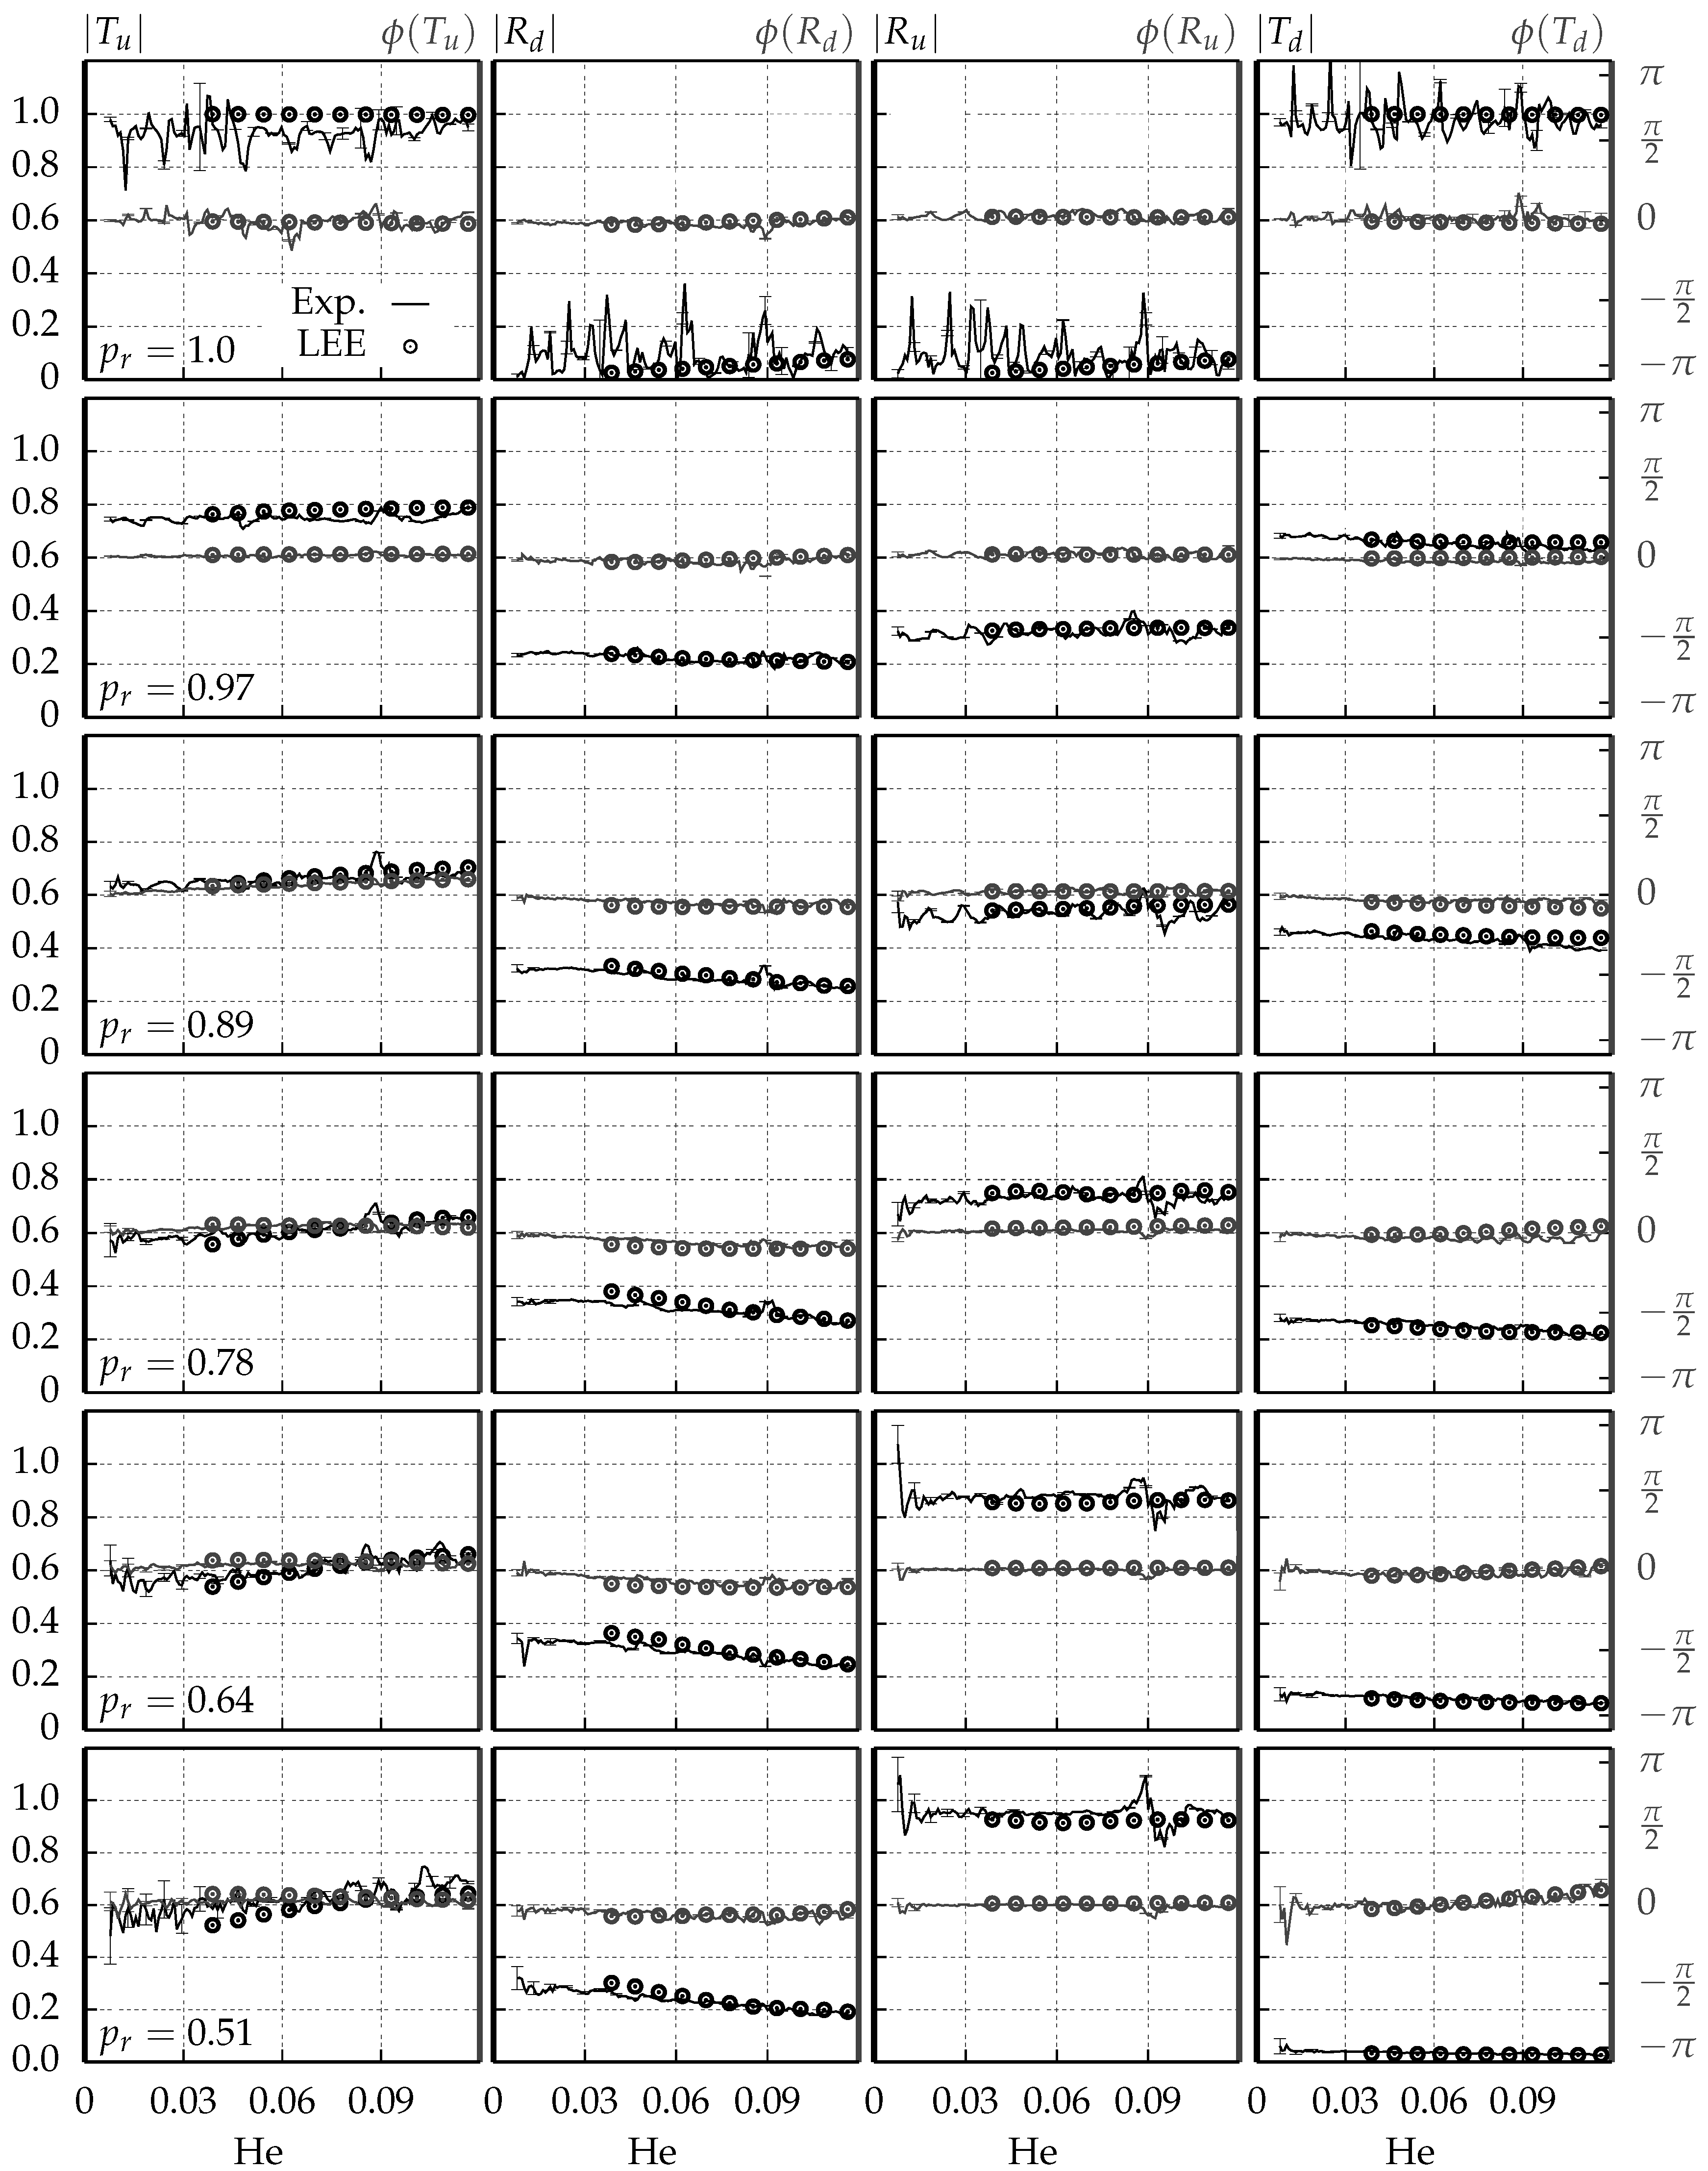
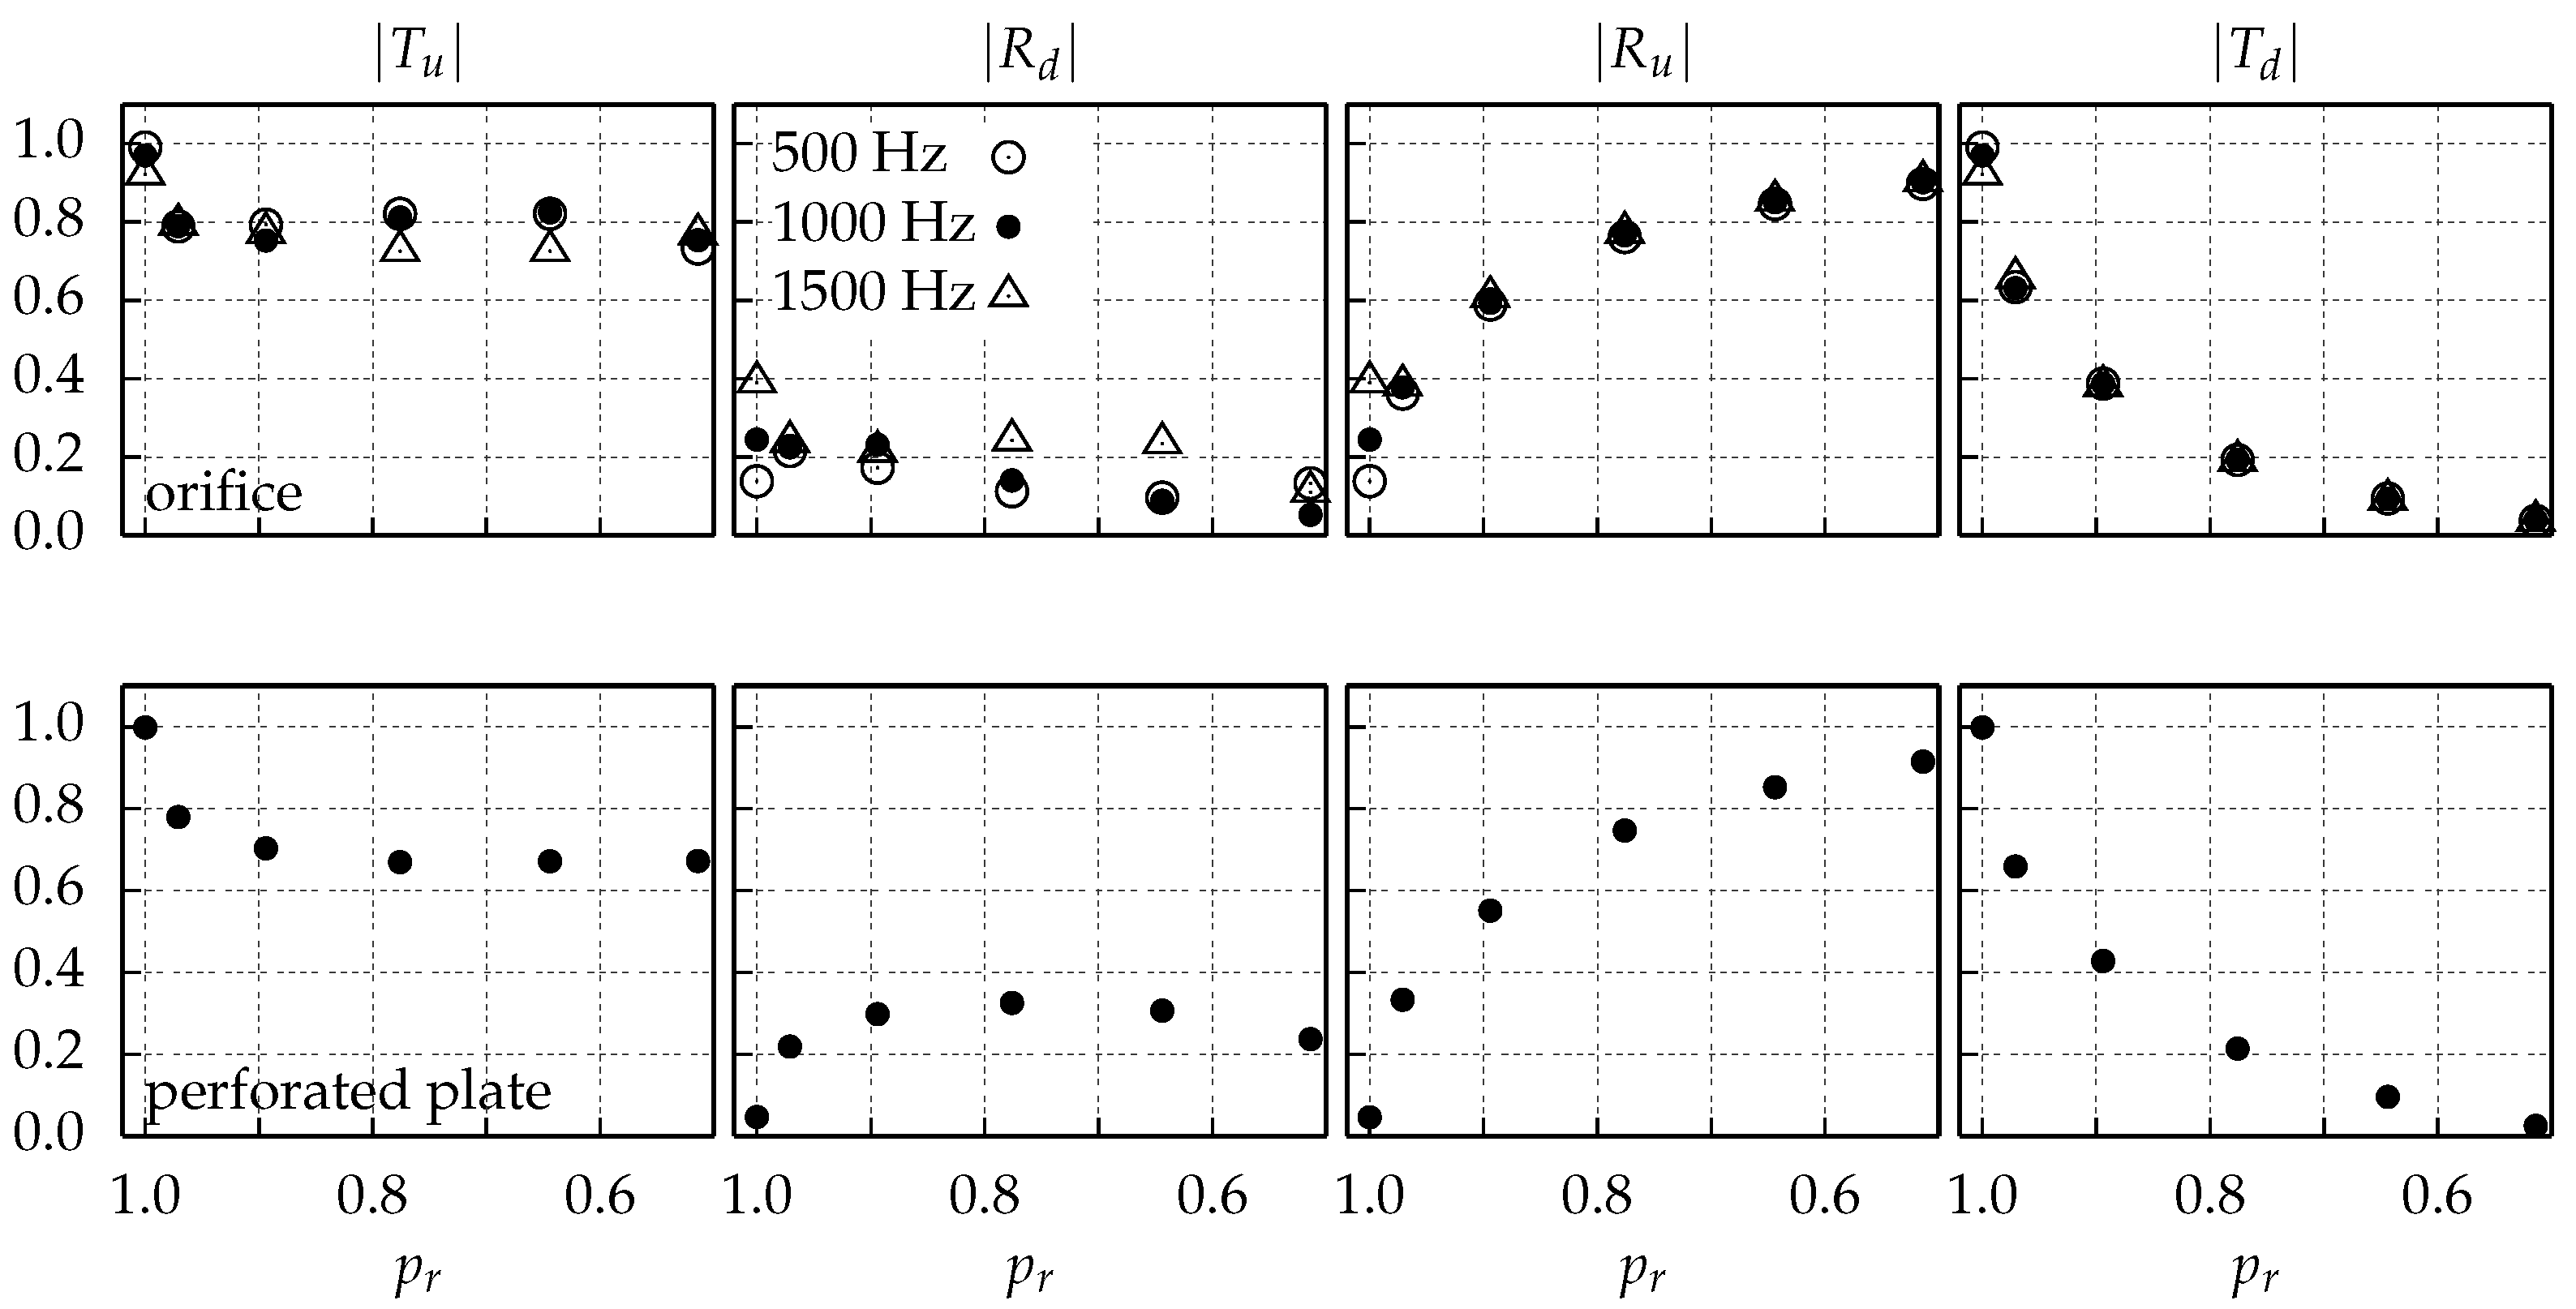
4.2. Scattering Matrices and Comparison to Experimental Data

The numerical results for the scattering matrices are compared to experimental findings in Figure 5 and Figure 6, respectively. The matrix elements are plotted over the non dimensional Helmholtz number according to
He = ω d u , O / P P 2 c ,
where d u , o / p p denotes the upstream diameter of the single hole configuration. For the orifice, d u , O corresponds to the pipe diameter. In the case of the perforated plate, d u , P P depends on the single hole diameter and is given by d u , P P = d P P / A r . The experimental data is supplemented by error bars, which indicate the standard deviation over five measurements. It can be noted that the standard deviations increase with a higher Mach number. Furthermore, the highest standard deviations are found for the transmission factor upstream T u .
The simulations are performed in a frequency sweep between 500 and 1500 Hz with a resolution of 100 Hz , which sufficiently reproduces the experimental curves. Altogether, a very good agreement is achieved for both configurations and for the entire Mach number regime considered. It is especially interesting to note that the CFD/CAA approach is capable of describing the scattering properties even in the high Mach numbers regime including complex interaction of the acoustic motion with the emanating shocks.
Small discrepancies between the simulation results and the experimental data are apparent in the orifice case in terms of T u and R d amplitude as well as the phase for p r = 0 . 78 and 0 . 64 in the higher frequency range. The simulated T u amplitude results tend to decrease, while the experimental findings indicate a rather constant behavior for higher frequencies. For the R d amplitude, a certain offset is present between the simulation results and the experimental findings for higher frequencies. The deviations cannot be explained by the systematic measurement errors since the numerical results do not match the standard deviation range. Because the deviations increase with frequency, it is likely that the jet length of the shear layer is not captured accurately enough using RANS kϵ simulation, cf. Figure 2. Another indication that the jet length might not be correctly predicted can be seen in the phase of R d for p r = 0 . 64 and 0 . 51 . The characteristic strong increase in phase occurs at lower frequencies in the case of the simulation results, which indicates that the shear layer dynamics might not be satisfactorily captured. A rather significant offset between simulation results and the experiments can be seen for the T u amplitude in the case of p r = 0 . 51 , which might also be attributed to insufficiently accurate mean flow simulations.
In the orifice case, a considerable stronger Helmholtz number, and thus frequency dependency, is observed. The Helmholtz numbers are one order of magnitude higher compared to the Helmholtz numbers in the case of the perforated plate and finally reach unity for higher frequencies. Hence, jet length and acoustic wave length are of the same order of magnitude, which indicates apparent interaction effects of the acoustic wave and the shear layer. In contrast, the small Helmholtz numbers for the perforated plate confirm its weak frequency dependency. The perforated plate can therefore be considered as acoustically compact.
In order to generate a better insight into the dependency of the scattering matrix elements from the pressure ratio p r , the element amplitudes are plotted over decreasing pressure ratio in Figure 7 for different frequencies. In the case of the perforated plate, mean values averaged over the frequency range are plotted due to their independence of frequency.
In Figure 7, the transmission coefficient downstream | T d | tends towards zero with decreasing pressure ratio and indicates more and more choked-like conditions within the holes until an acoustic wave is no longer able to propagate from downstream to upstream when choked conditions are reached. Similarly, the reflection coefficient upstream | R u | almost reaches unity, indicating vanishing acoustic propagation from upstream to downstream. The characteristic curves found for | R u | and | T d | are closely related to known scattering properties of a nozzle flow and are analytically given in [49]. Such scattering conditions are considered to be a reasonable choice in order to decouple an experimental setup from its environment. Consequently, reflection from downstream should be very strong to compensate the vanishing acoustic wave transmission to upstream.
However, Figure 7 clearly indicates that both for the orifice case and for the perforated plate configuration, the reflection coefficient downstream | R d | significantly differs from the expected high values for low static pressure ratios and reaches at most a value of max ( | R d | ) = 0 . 41 . Furthermore, a turning point from increasing to decreasing values is observed in the case of the perforated plate at about a pressure ratio of p r = 0 . 85 . In general, the orifice case confirms this observation with a stronger tendency to decrease over the entire frequency range covered. Similarly to the observations for | R d | , a characteristic turning point is also found for the transmission coefficient upstream | T u | .
The amplitude behavior of the reflection coefficient downstream | R d | over the pressure ratio emphasizes the presence of acoustic wave damping effects. With decreasing pressure ratio, less and less acoustic intensity is reflected and, since the transmission coefficient downstream tends towards zero, is not transmitted either. Moreover, the turning point indicates a damping mechanism which increases in strength with decreasing pressure ratio and therewith stronger associated radial gradients in the mean flow quantities in the shear layer.

5. Conclusions

In this article, a high fidelity and fast methodology has been used to conduct a detailed parameter study in terms of scattering matrices for orifice and perforated plate configurations with increasing Mach number until choked conditions are reached within the holes. The complex interaction phenomena between acoustic and shear flow is very well captured including the generation of vorticity and entropy fluctuations, both in the small and also in the high Mach numbers regime, where compressible effects play a crucial role. Altogether, the scattering matrices for both geometries are in very good agreement with experimental findings. Small discrepancies between the simulation results and experimental findings are, however, apparent and might originate from insufficiently accurate mean flow simulations in the higher Mach number regime. Nevertheless, frequency domain transformed linearized Euler equations seem to be very suitable for capturing the relevant aeroacoustic phenomena. In contrast to expensive LES methodologies, hybrid approaches reduce time consumptions significantly whilst providing high quality results.
The scattering matrices confirm the interesting experimental finding of an increasing–decreasing behavior of the amplitude of the reflection coefficient downstream with increasing Mach number in the holes. Its low values indicate strong acoustic damping, which cannot be explained using available theoretical models because of their restrictions to low Mach numbers.
One of the next steps will be to use a more accurate mean flow as the basis for the LEE simulation. For this purpose, unperturbed LES simulations are suitable. Furthermore, further studies will be conducted to investigate the damping effects occurring. Preliminary results already show that a theoretical derived maximal value of 50% absorption of acoustic energy, suggested in [8], is greatly exceeded.

Acknowledgments

Financial support has been provided by the German Research Council (Deutsche Forschungsgemeinschaft) in the framework of the Sonderforschungsbereich Transregio 40.

Author Contributions

Moritz Schulze and Michael Wagner conducted the experiments for the generation of validation data. Moritz Schulze performed all the simulations and calculated the scattering matrices. Furthermore, he wrote the paper. Thomas Sattelmayer supervised the project and supported the writing of the paper.

Conflicts of Interest

The authors declare no conflict of interest.

Abbreviations

The following abbreviations are used in this manuscript:
LEELinearized Euler Equations
CFDComputational Fluid Dynamic
CAAComputational Aeroacoustic
CFLCourant–Friedrichs–Lewy number

References

  1. Kathan, R. Verlustmechanismen in Raketenbrennkammern. Ph.D. Thesis, Technische Universität München, München, Germany, 2013. [Google Scholar]
  2. Karal, F.C. The analogous acoustical impedance for discontinuities and constrictions of circular cross section. J. Acoust. Soc. Am. 1953, 25, 327–334. [Google Scholar] [CrossRef]
  3. Bechert, D. Sound absorption caused by vorticity shedding, demonstrated with a jet flow. J. Sound Vib. 1980, 70, 389–405. [Google Scholar] [CrossRef]
  4. Boij, S.; Nilsson, B. Reflection of sound at area expansions in a flow duct. J. Sound Vib. 2003, 260, 477–498. [Google Scholar] [CrossRef]
  5. Boij, S.; Nilsson, B. Scattering and absorption of sound at flow duct expansions. J. Sound Vib. 2006, 289, 577–594. [Google Scholar] [CrossRef]
  6. Boij, S. Flow effects on the acoustic end correction of a sudden in-duct area expansion. J. Acoust. Soc. Am. 2009, 126, 995–1004. [Google Scholar] [CrossRef] [PubMed]
  7. Salikuddin, M.; Syed, A.; Mungur, P. Acoustic characteristics of perforated sheets with throughflow in a high intensity noise environment. J. Sound Vib. 1994, 169, 145–177. [Google Scholar] [CrossRef]
  8. Dowling, A.; Hughes, I. Sound absorption by a screen with a regular array of slits. J. Sound Vib. 1992, 156, 387–405. [Google Scholar] [CrossRef]
  9. Dupère, I.; Dowling, A. The absorption of sound near abrupt axisymmetric area expansions. J. Sound Vib. 2001, 239, 709–730. [Google Scholar] [CrossRef]
  10. Howe, M. On the theory of unsteady high reynolds number flow through a circular aperture. Proc. R. Soc. A Math. Phys. Eng. Sci. 1979, 366, 1725. [Google Scholar] [CrossRef]
  11. Bellucci, V.; Flohr, P.; Pasc, C. Numerical and experimental study of acoustic damping generated by perforated screens. AIAA J. 2004, 42, 1543–1549. [Google Scholar] [CrossRef]
  12. Lee, S.; Ih, J.; Peat, K.S. A model of acoustic impedance of perforated plates with bias flow considering the interaction effect. J. Sound Vib. 2007, 303, 741–752. [Google Scholar] [CrossRef]
  13. Mendez, S.; Eldredge, J. Acoustic modeling of perforated plates with bias flow for Large-Eddy Simulations. J. Comput. Phys. 2009, 228, 4757–4772. [Google Scholar] [CrossRef]
  14. Ronneberger, D.; Physikalisches Institut der Universität Göttingen. Theoretische und Experimentelle Untersuchung der Schallausbreitung Durch Querschnittssprünge und Lochplatten in Strömungskanälen: Abschlußbericht; Contract Ro-369-11-12-14; Deutsche Forschungsgemeinschaft (DFG): Bonn, Germany, 1987. [Google Scholar]
  15. Föller, S.; Polifke, W. Identification of aero-acoustic scattering matrices from large eddy simulation. Application to a sudden area expansion of a duct. J. Sound Vib. 2012, 331, 3096–3113. [Google Scholar] [CrossRef]
  16. Alenius, E. Flow Duct Acoustics: An LES Approach. Ph.D. Thesis, KTH Royal Institute of Technology, Stockholm, Sweden, 2012. [Google Scholar]
  17. Lacombe, R.; Föller, S.; Jasor, G.; Polifke, W.; Auregan, Y.; Moussou, P. Identification of aero-acoustic scattering matrices from large eddy simulation: Application to whistling orifices in duct. J. Sound Vib. 2013, 332, 5059–5067. [Google Scholar] [CrossRef]
  18. Kierkegaard, A.; Boij, S.; Efraimsson, G. A frequency domain linearized Navier–Stokes equations approach to acoustic propagation in flow ducts with sharp edges. J. Acoust. Soc. Am. 2010, 127, 710–719. [Google Scholar] [CrossRef] [PubMed]
  19. Kierkegaard, A.; Efraimsson, G. Simulations of acoustic scattering in duct systems with flow. In Proceedings of the 20th International Congress on Acoustics (ICA 2010), Sydney, Australia, 23–27 August 2010.
  20. Kierkegaard, A. Frequency Domain Linearized Navier-Stokes Equations Methods for Low Mach Number Internal Aeroacoustics. Ph.D. Thesis, KTH Royal Institute of Technology, Stockholm, Sweden, 2011. [Google Scholar]
  21. Kierkegaard, A.; Allam, S.; Efraimsson, G.; Åbom, M. Simulations of whistling and the whistling potentiality of an in-duct orifice with linear aeroacoustics. J. Sound Vib. 2012, 331, 1084–1096. [Google Scholar] [CrossRef]
  22. Bechara, W.; Bailly, C.; Lafon, P.; Candel, S.M. Stochastic approach to noise modeling for free turbulent flows. AIAA J. 1994, 32, 455–463. [Google Scholar] [CrossRef]
  23. Mankbadi, R.R.; Hixon, R.; Shih, S.H.; Povinelli, L.A. Use of linearized Euler equations for supersonic jet noise prediction. AIAA J. 1998, 36, 140–147. [Google Scholar] [CrossRef]
  24. Tam, C.K.W.; Auriault, L. Jet mixing noise from fine-scale turbulence. AIAA J. 1999, 37, 145–153. [Google Scholar] [CrossRef]
  25. Ma, Z.K.; Smith, M.G.; Richards, S.K. Attenuation of slat trailing edge noise using acoustic liners. Int. J. Aeroacoust. 2006, 5, 311–333. [Google Scholar] [CrossRef]
  26. Özyörük, Y.; Tester, B.J. Application of frequency-domain linearized Euler solutions to the prediction of aft fan tones and comparison with experimental measurements on model scale turbofan exhaust nozzles. J. Sound Vib. 2011, 330, 3846–3858. [Google Scholar] [CrossRef]
  27. Zhang, X. Aircraft noise and its nearfield propagation computations. Acta Mech. Sin. 2012, 28, 960–977. [Google Scholar] [CrossRef]
  28. Nicoud, F.; Wieczorek, K. About the zero Mach number assumption in the calculation of thermoacoustic instabilities. Int. J. Spray Combust. Dyn. 2009, 1, 67–111. [Google Scholar] [CrossRef]
  29. Gikadi, J.; Schulze, M.; Schwing, J.; Föller, S.; Sattelmayer, T. Linearized Navier-Stokes and Euler equations for the determination of the acoustic scattering behaviour of an area expansion. In Proceedings of the 18th AIAA/CEAS Aeroacoustics Conference, Colorado Springs, CO, USA, 4–6 June 2012.
  30. Gikadi, J.; Föller, S.; Sattelmayer, T. Impact of turbulence on the prediction of linear aeroacoustic interactions: Acoustic response of a turbulent shear layer. J. Sound Vib. 2014, 333, 6548–6559. [Google Scholar] [CrossRef]
  31. Poinsot, T.; Lele, S. Boundary conditions for direct simulations of compressible viscous flows. J. Comput. Phys. 1992, 101, 104–129. [Google Scholar] [CrossRef]
  32. Jaensch, S.; Sovardi, C.; Polifke, W. On the robust, flexible and consistent implementation of time domain impedance boundary conditions for compressible flow simulations. J. Comput. Phys. 2016, 314, 145–159. [Google Scholar] [CrossRef]
  33. Wagner, M.; Schulze, M.; Sattelmayer, T. Experimental investigation of acoustic properties of orifices and perforated plates in the high mach number regime. In Proceedings of the International Congress on Sound and Vibration (ICSV), Bangkok, Thailand, 7–11 July 2013.
  34. Morgenweck, D.; Pieringer, J.; Sattelmayer, T. Numerical determination of nozzle admittances in rocket engines. In New Results in Numerical and Experimental Fluid Mechanics VII; Springer: Berlin/Heidelberg, Germany, 2010. [Google Scholar]
  35. Köglmeier, S.; Kaess, R.; Morgenweck, D.; Tudisco, P.; Sattelmayer, T. Modelling of acoustic absorbers for liquid rocket combustion chambers. In Proceedings of the Space Propulsion Conference, Cologne, Germany, 19–22 May 2014.
  36. Denayer, H.; Tournadre, J.; Roeck, W.D.; Desmet, W.; Martinez-Lera, P. Combined numerical and experimental study of a slit resonator under grazing flow. In Proceedings of the 20th AIAA/CEAS Aeroacoustics Conference (AIAA Aviation), Atlanta, GA, USA, 16–20 June 2014.
  37. Ji, C.; Zhao, D. Numerical investigation of acoustically excited flow through an orifice using lattice boltzmann method. In Proceedings of the 9th AIAA/CEAS Aeroacoustics Conference, Hilton Head, SC, USA, 12–14 May 2003.
  38. Denayer, H.; Roeck, W.D.; Toulorge, T.; Desmet, W. Acoustic characterization of a helmholtz resonator under grazing flow conditions using a hybrid methodology. In Proceedings of the 19th AIAA/CEAS Aeroacoustics Conference, Berlin, Germany, 27–29 May 2013.
  39. Rao, P.; Morris, P. Use of finite element methods in frequency domain aeroacoustics. AIAA J. 2006, 44, 1643–1652. [Google Scholar] [CrossRef]
  40. Donea, J.; Huerta, A. Finite Element Methods for Flow Problems; John Wiley & Sons: Hoboken, NJ, USA, 2003. [Google Scholar]
  41. Kaess, R.; Huber, A.; Polifke, W. A time-domain impedance boundary condition for compressible turbulent flow. In Proceedings of the 14th AIAA/CEAS Aeroacoustics Conference (29th AIAA Aeroacoustics Conference), Vancouver, BC, Canada, 5–7 May 2008.
  42. Åbom, M. A note on the experimental determination of acoustical two-port matrices. J. Sound Vib. 1992, 155, 185–188. [Google Scholar] [CrossRef]
  43. Åbom, M.; Bodén, H. Error analysis of two-microphone measurements in ducts with flow. J. Acoust. Soc. Am. 1988, 83, 2429–2438. [Google Scholar] [CrossRef]
  44. Bodén, H.; Åbom, M. Influence of errors on the two-microphone method for measuring acoustic properties in ducts. J. Acoust. Soc. Am. 1986, 79, 541–549. [Google Scholar] [CrossRef]
  45. Lung, T.; Doige, A. A time-averaging transient testing method for acoustic properties of piping systems and mufflers with flow. J. Acoust. Soc. Am. 1983, 73, 867. [Google Scholar] [CrossRef]
  46. Munjal, M.L.; Doige, A. Theory of a two source-location method for direct experimental evaluation of the four-pole parameters of an aeroacoustic element. J. Sound Vib. 1990, 141, 323–333. [Google Scholar] [CrossRef]
  47. Paschereit, C.O.; Schuermans, B.; Polifke, W.; Mattson, O. Measurement of Transfer Matrices and Source Terms of Premixed Flames. J. Eng. Gas Turbines Power 2002, 124, 239–247. [Google Scholar] [CrossRef]
  48. Seybert, A.; Ross, D. Experimental determination of acoustic properties using a two-microphone random-excitation technique. J. Acoust. Soc. Am. 1977, 61, 1362–1370. [Google Scholar] [CrossRef]
  49. Marble, F.E.; Candel, S.M. Acoustic disturbance from gas non-uniformities convected through a nozzle. J. Sound Vib. 1977, 55, 225–243. [Google Scholar] [CrossRef]
Figure 1. Experimental setup of [33] for the orifice (top) and perforated plate (bottom) and relevant geometrical dimensions in ( mm ).
Aerospace 03 00033 g001
Figure 2. Spatial Mach number distribution of the perforated plate (top) and the orifice (bottom) for five static pressure ratios p r .
Aerospace 03 00033 g002
Figure 3. Linearized Euler equations (LEE) setup for the orifice case (perforated plate analogous): boundary conditions, wave extraction zones upstream and downstream and phase reference x 0 .
Aerospace 03 00033 g003
Figure 4. Acoustic pressure fields for the real part Re ( p ^ ) (top), amplitude | p ^ | (middle) and phase ϕ ( p ^ ) (bottom) for the orifice case with a pressure ratio of p r = 0 . 97 and isolines of the axial mean velocity. The values of Re ( p ^ ) and | p ^ | are normalized by their maximum values. The excitation of 1500 Hz is located downstream.
Aerospace 03 00033 g004
Figure 5. Experimentally and numerically evaluated scattering matrices for the orifice.
Aerospace 03 00033 g005
Figure 6. Experimentally and numerically evaluated scattering matrices for the perforated plate.
Aerospace 03 00033 g006
Figure 7. Scattering matrices of orifice (top) and perforated plate (bottom) plotted over the pressure ratio p r .
Aerospace 03 00033 g007
Table 1. Investigated operation conditions. Ma corresponds to the Mach number within the perforated plate/orifice.
Static Pressure Ratio p r Static Pressure Downstream p d (Bar)Mass Flow m ˙ (g/s)Ma
1.00.9370.00
0.970.93783.80.2
0.890.937160.80.4
0.780.937234.70.6
0.640.938330.50.8
0.510.944455.41.0

