
Effect of Leading-Edge Slats at Low Reynolds Numbers


Aerospace Engineering Department, Embry Riddle Aeronautical University, Prescott, AZ 86301, USA
*
Author to whom correspondence should be addressed.
†
These authors contributed equally to this work.
Aerospace 2016, 3(4), 39; https://doi.org/10.3390/aerospace3040039
Submission received: 5 August 2016
/
Revised: 10 October 2016
/
Accepted: 13 November 2016
/
Published: 17 November 2016
(This article belongs to the Collection Unmanned Aerial Systems)
Abstract
:One of the most commonly implemented devices for stall control on wings and airfoils is a leading-edge slat. While functioning of slats at high Reynolds number is well documented, this is not the case at the low Reynolds numbers common for small unmanned aerial vehicles. Consequently, a low-speed wind tunnel investigation was undertaken to elucidate the performance of a slat at Re = 250,000. Force balance measurements accompanied by surface flow visualization images are presented. The slat extension and rotation was varied and documented. The results indicate that for small slat extensions, slat rotation is deleterious to performance, but is required for larger slat extensions for effective lift augmentation. Deployment of the slat was accompanied by a significant drag penalty due to premature localized flow separation.
1. Introduction
The stall of an airfoil or wing is a viscous phenomenon attributed to flow separation [1]. Stall may be encountered whenever high-lift is desirous, e.g., during take-off, landing or during maneuvering. Early studies indicated that devices placed at the leading-edge that attenuated the suction peak and moved loading aft were effective in delaying stall [2,3,4,5,6,7,8,9,10]. Representative devices include leading-edge slats, fixed slots and auxiliary airfoils ahead and above the leading-edge, as well as flaps [2,3,4,5,6,7,8,9,10,11,12,13,14,15,16,17]. A slat (or slot) differs from a flap in having a gap through which windward surface fluid is vented to the leeward surface. An auxiliary airfoil [2,17] uses a low drag “vane” (typically an airfoil) placed ahead of and above the airfoil/wing. These devices commonly suffer from excessive drag at low angles of attack, but avoid the complication of a retraction mechanism required for a slat. Leading-edge stall control devices work by attenuating the loading over the main wing section and moving the loading peak aft. They also serve to “refresh” the boundary layer in that a new boundary layer forms on the wing panel. Studies have explored the effect of the defining variables for a slat, i.e., the forward extension of the slat and its rotation, the downward “droop” and the gap size at the slot outlet [2]. Data indicates that at low-speed, the slat should be rotated below the chord plane of the airfoil (droop) [8]. Suggested design parameters for a slat are [2] a length greater than 12% of the chord, a forward extension greater than or equal to 60% of the slat chord and a slot gap of approximately 3% of the chord.
The utility of unmanned aerial vehicles (UAVs) has promulgated a large research effort to develop and characterize supporting technologies to enhance efficiency. A complication of slats employed at low-speed is the resulting Reynolds number. As an example, assuming a chord of 125 mm for a small UAV with a slat of 15% of the chord yields a Re of 44,000 (sea level) at a flight velocity of 35 m/s. This value is extremely low and is well within the domain of laminar separation, compounded by difficulty in transitioning the boundary layer. Another low Reynolds number complication is an increase in the boundary layer thickness which may further promote separation and may require larger slat extensions than seen at higher Reynolds number.
This article serves to document the performance of a slat on a wing and airfoil at low Reynolds number. Force balance data as well as on surface flow visualization is used to characterize behavior.
2. Materials and Methods
Wind-tunnel tests were conducted in Embry-Riddle’s 0.61 m by 0.61 m blower wind tunnel. This facility has a measured turbulence intensity of 0.5% and a jet uniformity within 1% of the mean in the core. Force-balance measurements were undertaken using a six-component NK biotechnical (Minneapolis, MN, USA) sting balance (load range; 98.1 N for normal force and 49 N for axial force with a calibration based accuracy of 0.098 and 0.074 N respectively). Data acquisition and reduction was facilitated using a code written in Visual Basic 6. Balance output voltages were digitized using a National Instruments 16-bit A/D (analog-to-digital) board. Each presented data point is the average of 5000 samples. The reference area used to obtain the aerodynamic coefficients corresponded to the wing’s area with the slat retracted. The model’s angle of attack was set and measured using a feedback loop in conjunction with a Midori angle sensor. The angle-of-attack accuracy and repeatability was established as better than 0.1°. Wall corrections were not applied, as the tests were comparative in nature. During testing, the model was pitched from −4° to 27° in primarily 2° increments.
The model was designed in CATIA® (Vélizy-Villacoublay, France) and was rapid prototyped from acrylo-nitrile butadiene styrene using Embry-Riddle’s rapid-prototyping facilities (Stratasys, Eden Prairie, MN, USA), as shown in Figure 1. The model was manufactured in three pieces due to manufacturing size constraints of the rapid prototyper. After assembly, all joints were carefully filled and sanded. The airfoil section was a S8036 with a thickness of 16% and camber of 1.3% at 40.4% of the chord. The design of the slat was based upon those presented in References [8,9]. This form of slat implementation (i.e., primarily slat overhang) was investigated as it is comparatively simple and practical for implementation in a small unmanned aerial vehicle where drooping of the slat may be mechanically more challenging. As a result, the slat positioning may not be optimal. The slat chord was 15% of the retracted airfoil chord. The model was designed such that the slat could extend chordwise as well as rotate. Slat extensions of 5 and 10 mm (4% and 8% of the retracted chord) were evaluated along with rotation angles of 0°, 10°, 20° and 30°.
The nomenclature mentioned above, although practical for the slat implementation of this article, is not standard. Consequently, Table 1 presents the relation of Gap and θ to Slat overhang (SO) and Slat gap (SG) as may be more common place in the literature, see Figure 1.
The wing’s aspect ratio was 3 based on a chord of 0.125 m and a span of 0.375 m. Side plates extending from the floor to the roof of the test section (0.61 m high by 0.457 m wide) were also used to simulate nominally sectional flow. The distance from the wing trailing edge to the back of the side plate was 0.33 m; the plates extended ahead of the wing by 2 mm. When installed, the gap between the side plates and the wing was 0.6 to 0.9 mm as measured with a Feeler gauge for the full angle of attack range. Wind-tunnel testing was conducted at a freestream velocity of 35 m/s, yielding a Re of 2.5 × 10⁵ based on the reference chord length of 0.125 m. Wind-tunnel data repeatability was established and verified through examination of the data from multiple runs; estimated 99.7% uncertainty intervals are ΔCL = 0.01, ΔCD = 0.008 and ΔCM = 0.01. These uncertainties are presented as error bars in Figure 2a,b for the Clean wing. Note that the width of the error bars in Figure 2a is not reflective of angle of attack uncertainty, but is for visibility. The pitching moment reference location was the one-quarter chord. Surface flow visualization was undertaken using Titanium Dioxide suspended in a mixture of Linseed oil, Kerosene and Oleic acid. For these tests, the model was set at the desired angle of attack. Subsequently, a thin layer of the paint mixture was applied. The tunnel was then rapidly brought up to the desired velocity. When the pattern was frozen, images were recorded. To aid in interpretation, a video was also recorded during the development of the patterns.
3. Results and Discussion
3.1. Finite Wing Data
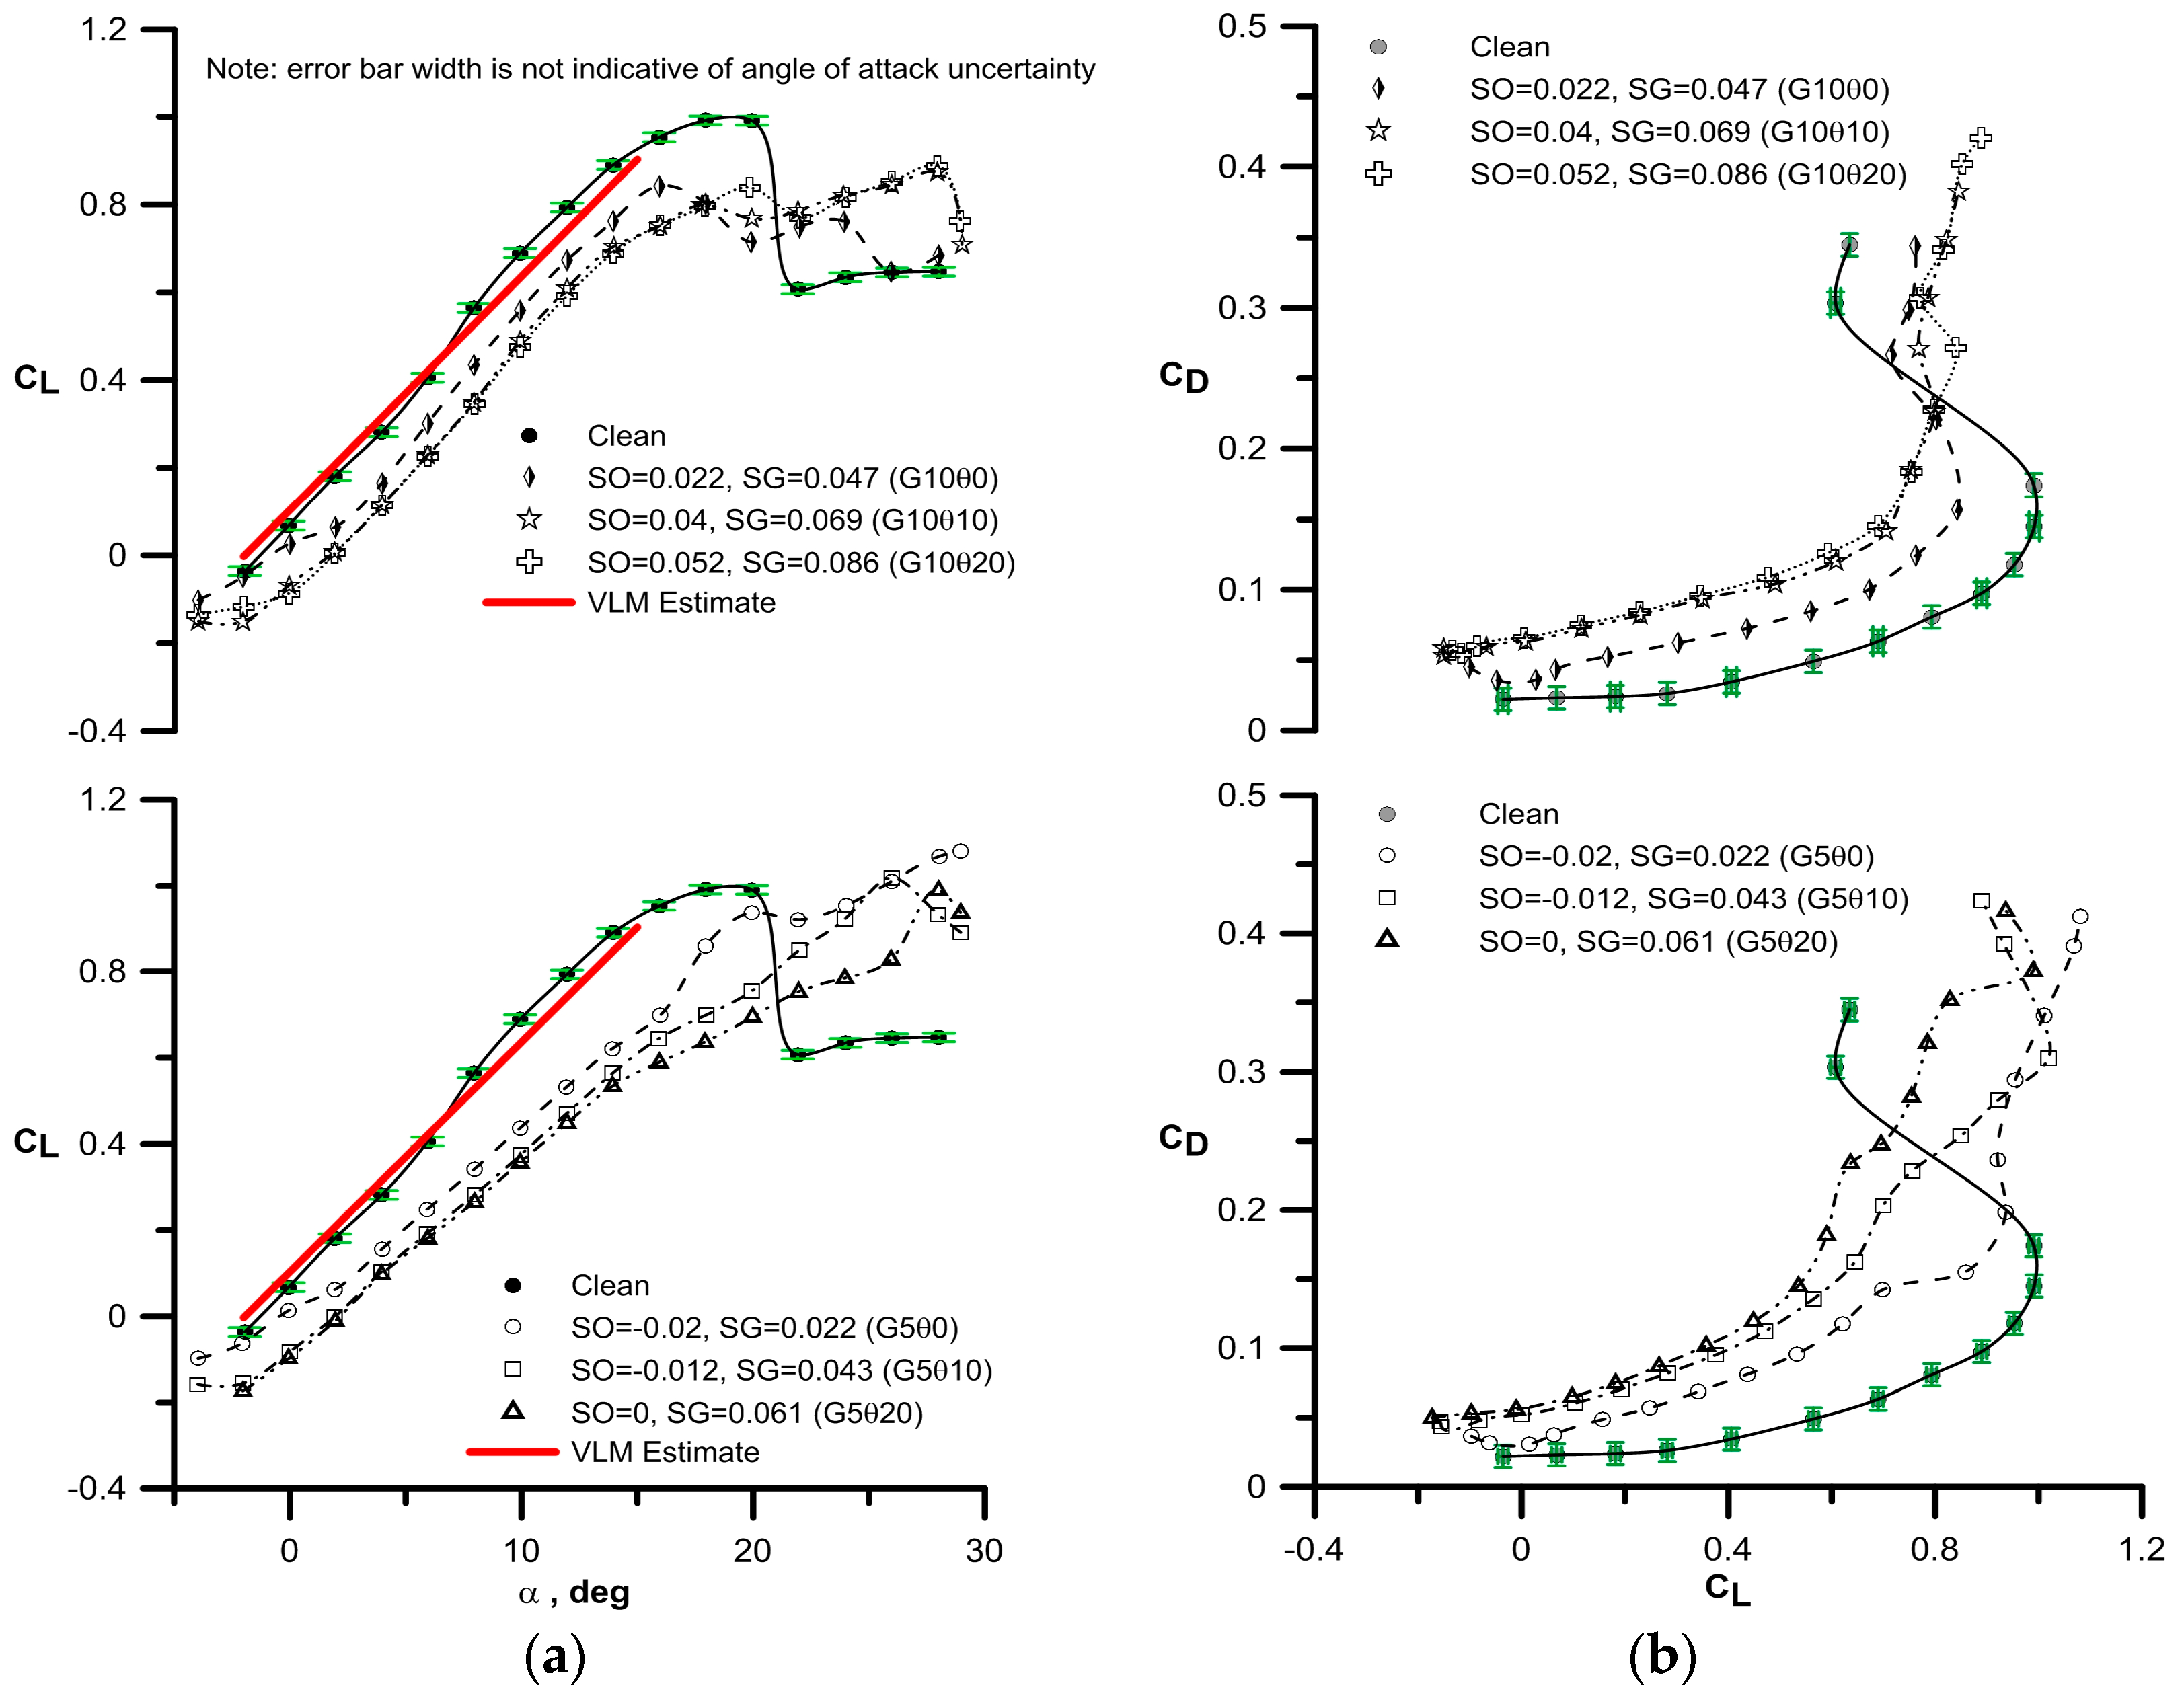
Data for the 30° slat rotation is not included as this setting was highly deleterious to performance. As an example of nomenclature, a designation of G10θ20 implies a 10 mm gap and a 20° slat rotation. The clean wing denotes that the slat is fully retracted. Figure 2 presents the effect of the slat angle and gap on the measured lift and drag coefficient. Deployment of the slat is seen to significantly attenuate lift in the attached flow regime (as an example, at α = 6°, CL is reduced by 53% and CD (for the associated CL) is increased by 102% for G5R10), a documented [8] result that may be attributed to a premature onset of flow separation from the slat. The attenuated lift is reflected in a large increase in the drag coefficient. A larger gap (10 mm) yields a smaller lift loss at lower angles of attack than a 5 mm gap, with a reversal in performance post-stall (i.e., the G5 performs better than the G10). The non-linearity in the lift curve for the clean wing is well documented for this airfoil and is commonly associated with migration of the upper surface laminar separation bubble and/or variable cambering through a displacement thickness effect at the trailing edge [18]. The non-linearity is eliminated for the wing with slat (as will be shown, slat deployment causes earlier onset of trailing edge separation at moderate angle of attack—attenuating lift). In all cases, the slat is not seen to provide enhanced CLMAX for the angle of attack range explored, but improved post-stall lift behavior. The smaller gap (5 mm) does delay the initial onset of stall despite significantly attenuating lift, whereas the larger gap (10 mm) shows stall onset at an angle of attack commensurate with the clean wing, however, without the large loss of lift post-stall. Analysis of the experimental data indicates a lift curve slope of the clean wing in the linear region of 0.054/° for −4° < α < 6°. Vortex lattice analysis (using 30 spanwise panels and 10 chordwise panels) using AVL [19] indicates a lift curve slope of 0.056/°, or agreement within 3.5%. The VLM (Vortex Lattice Method) estimate (which is inviscid and accounts for camber but not thickness) is included in Figure 2 and shows satisfactory accord with experiment.
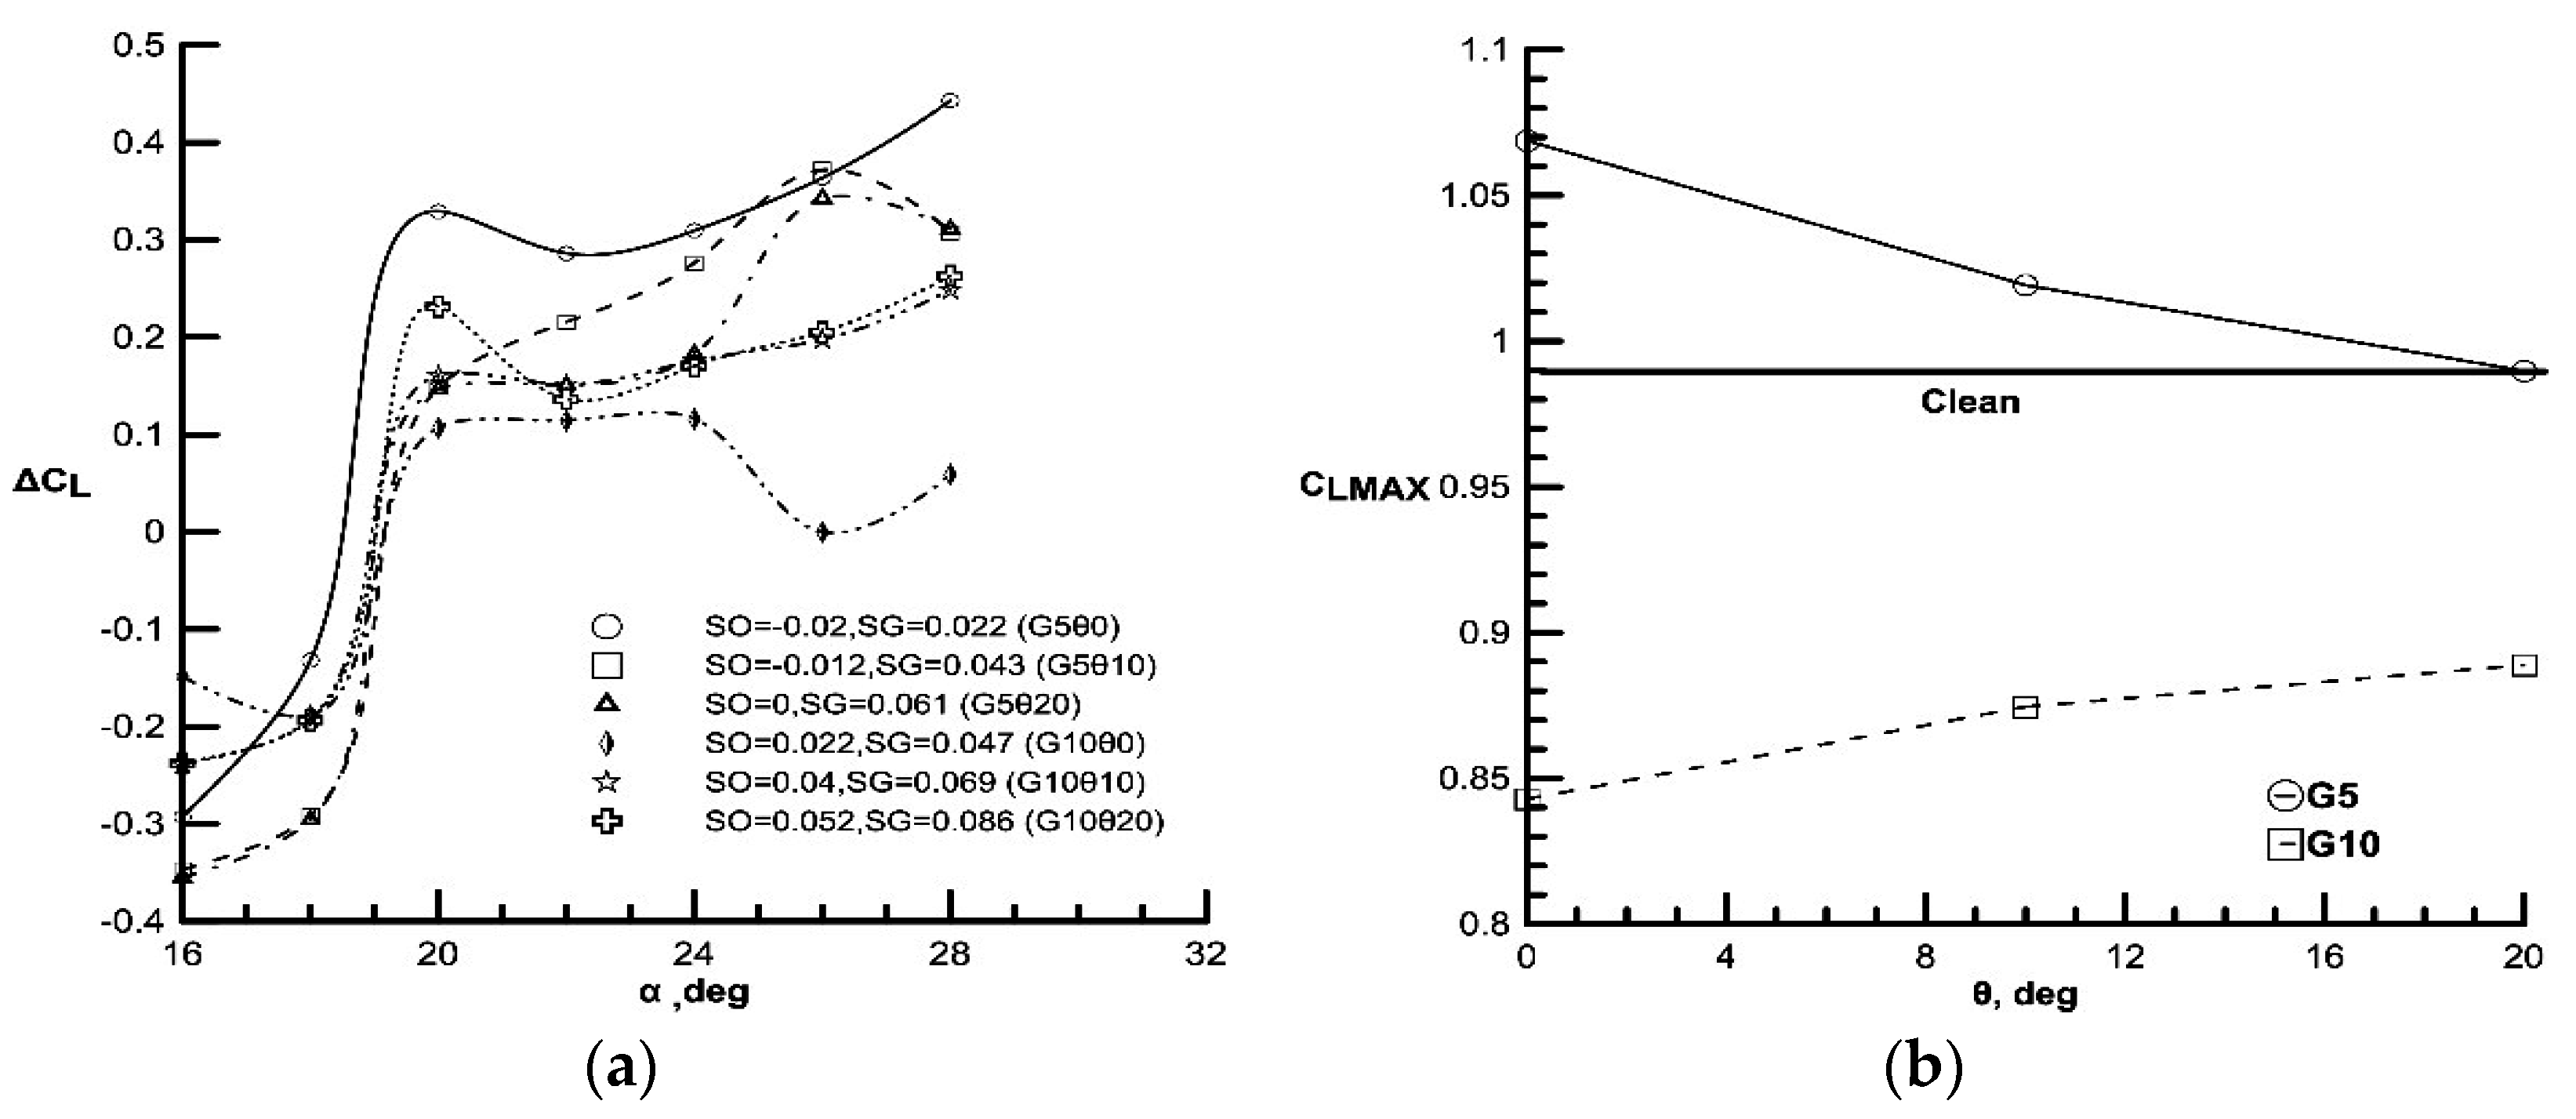
The relative lift increment compared to the clean wing is shown in Figure 3a while Figure 3b shows the maximum lift coefficient as affected by gap and slat angle. The slat is clearly seen to be detrimental to lifting performance prior to the onset of wing stall at a 20° angle of attack. For the current wing geometry, the smaller gap is observed to be preferable, with rotation of the slat deleterious to lift enhancement. Conversely, for the 10 mm slat extension, rotation of the slat is necessary to improve post-stall performance. These trends are clarified in Figure 3b, where the maximum measured lift coefficient is presented as a function of slat angle. The smaller gap is observed to be the most efficient in conjunction with no slat rotation. For the larger slat extension, rotation is required. Notice that the maximum measured lift is only (at best) 7% greater than the clean wing. This clearly shows that slats need to be considered carefully for operation at these test conditions with the current flap settings.
To elucidate the physics behind the results, limiting streamlines are presented in Figure 4 for the clean wing and the most effective slat geometry; the G5R0. At a 0° angle of attack, the patterns look similar although localized separation is seen at the front of the main wing element just adjacent to the slat for the G5R0 and clean geometry. Increasing the angle of attack to 10° shows the presence of a laminar separation bubble over the clean wing, with separation occurring ahead of the slat trailing edge and re-attachment occurring at approximately 30% of the chord. The lack of a bubble at a 0° angle of attack most likely stems from the effect of the slat junction serving as a trip strip, thus promoting boundary layer transition and consequently eliminating the bubble. The surface pattern over the G5R0 model at a 10° angle of attack is notable; the slat causes large-scale trailing edge separation while the slat itself also experiences separation towards its trailing edge. These patterns clearly indicate why the loss of lift is so marked and why the drag coefficient is so high with slat deployment. Increasing the angle of attack to 25° yields the two bottom images in Figure 4. The clean wing shows massive separation with separated rotating flow terminating in a focus of separation towards the trailing edge. In this instance, the slat is seen to markedly improve the flow behavior, with attached flow still present and extending over the outer third of the wing. The center region of the wing still reveals a separated flow cell. In all cases, the imprint of the wing tip vortex is visible and is seen as a strong sidewash pattern terminating in a line of separation.
Figure 5 examines the surface flow topology between the G10R0 and G10R10 geometries at a 25° angle of attack. The G10R0 pattern reveals large-scale separation, which is of reduced extent with slat rotation (to 10°). Both configurations show separation on the slat. Slat rotation reduces the extent of separation and the nature of the separated zone. The G10R10 geometry shows the presence of a localized separation just after the “knee” at the front of the wing panel as well as spanwise flow towards the root near the trailing edge.
Depending on deployment, a slat can increase the zero-lift pitching moment (if drooped) and move the aerodynamic center forward, stemming from added camber and a chord extension. Slat rotation is seen to increase the nose down pitching moment for the 10 mm gap and reduces the nose down moment magnitude for some of the G5 gaps, Figure 6. The net observed trend is that the smaller gap (5 mm) lessens the zero-lift pitching moment while the 10 mm gap increases it with respect to the clean wing. At high-lift coefficients, most slat settings are seen to eliminate the moment reversal visible for the clean wing.
3.2. Airfoil Force Data
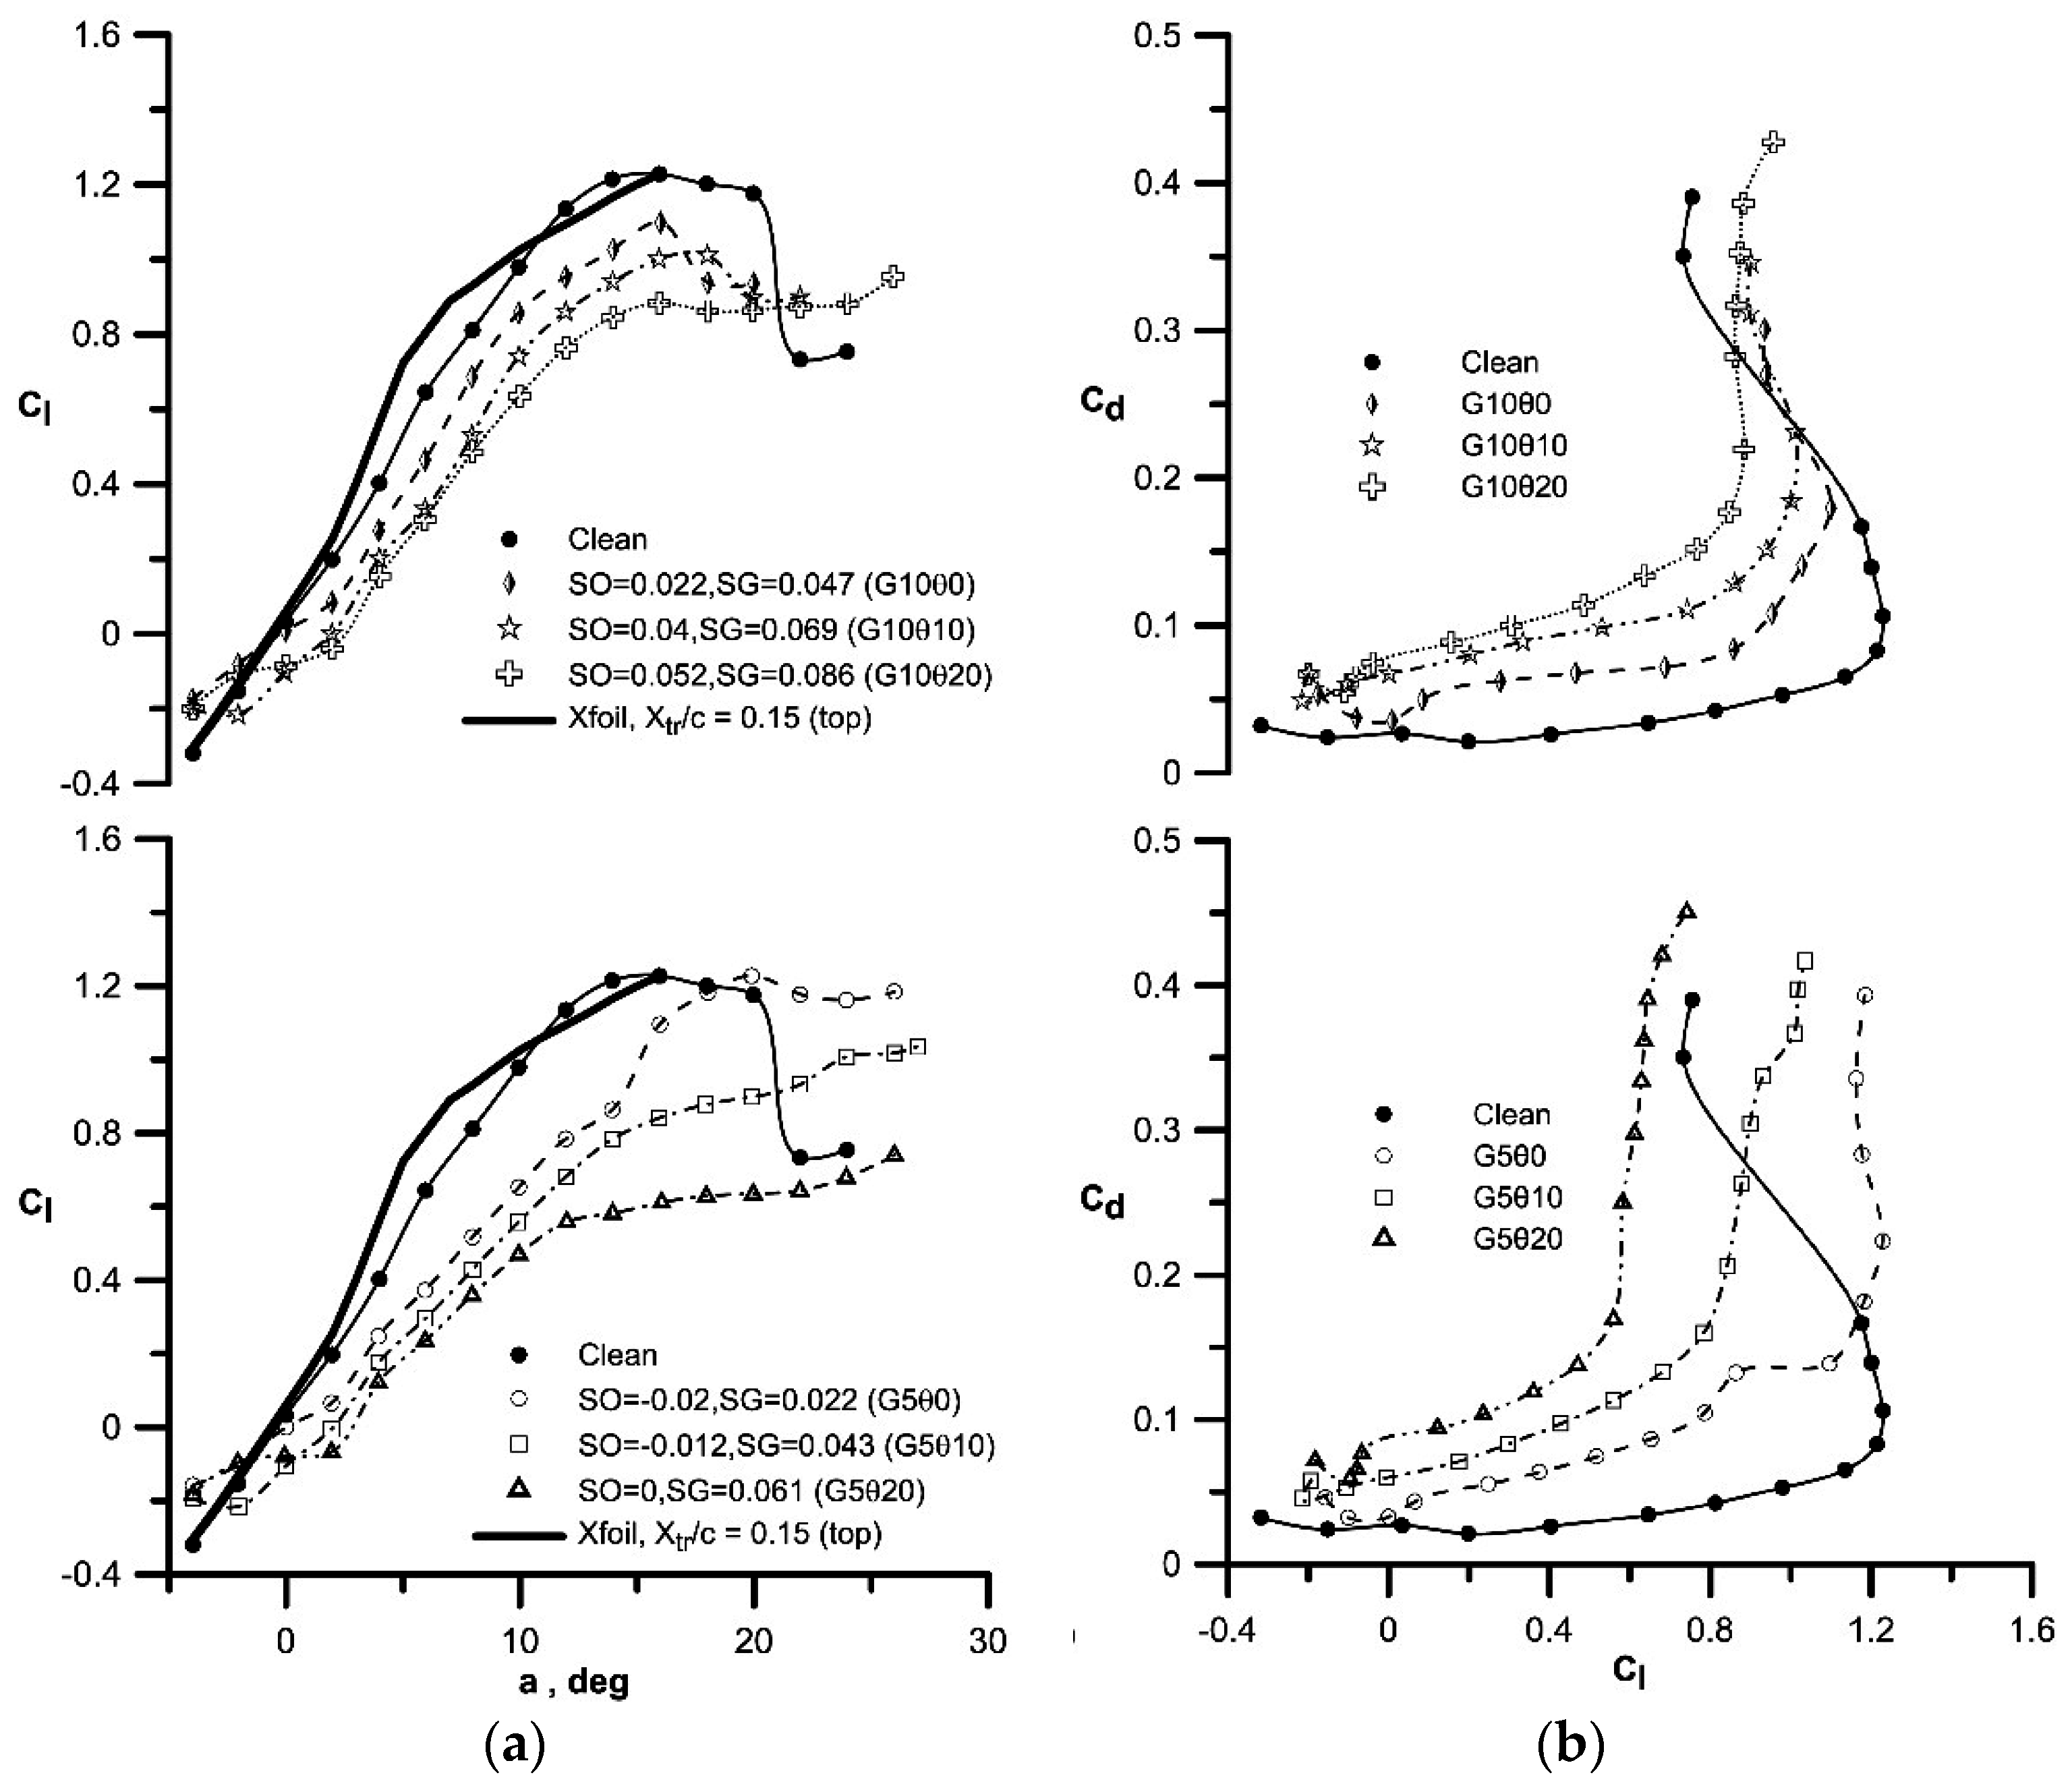
Figure 7 shows measurements of the lift and drag coefficient as affected by gap and slat angle with the side plates installed. With the addition of the plates, the flow should be nominally two-dimensional. The behavior observed for the AR = 3 wing is preserved, however, the magnitude of the lift loss and drag increment with slat deployment is amplified. This is a potential consequence of the stabilizing impact of the wing tip flow on the adjacent flow for the AR = 3 wing. Also included in Figure 7 is an estimate using Xfoil [20]. For the simulation, upper surface transition was fixed at 15% to be coincident with the slat—wing junction. As seen, agreement with Xfoil is excellent at low angles of attack (supporting the two dimensionality of the flow with side plates). The numerical predictions show a larger non-linearity than seen experimentally, however, the characteristics are consistent. The effect of the slat on the airfoil (Figure 7a) is seen to be larger in terms of lift variation than for the wing, Figure 2a. Lift loss with slat rotation (θ) is more systematic and greater in magnitude for the airfoil, and may be reflective of the modulating effect of downwash from the wing tip region for the wing case.
4. Conclusions
A low-speed wind tunnel investigation was conducted to explore the behavior of a leading-edge slat at a Reynolds number of 250,000. A S8036 profiled wing was designed to accommodate a leading-edge slat with variable gap and rotation angle. The results showed that the post-stall lift augmentation commonly associated with a slat was not present for the tested geometries; replaced by stall moderation yielding a plateau-like stall behavior. This outcome may change with droop of the slat, such that the slat extends below the front of the main wing element.
Author Contributions
Lance W. Traub conceived the experiments; Mashaan P. Kaula designed and performed the experiments and data reduction; Lance W. Traub and Mashaan P. Kaula analyzed the data; Lance W. Traub and Mashaan P. Kaula wrote the paper.
Conflicts of Interest
The authors declare no conflict of interest.
Abbreviations
| CD | drag coefficient |
| cd | sectional drag coefficient |
| CL | lift coefficient |
| cl | sectional lift coefficient |
| CLMAX | maximum lift coefficient |
| CM | pitching moment coefficient |
| G | slat gap |
| Re | Reynolds number |
| SG | Slat gap non-dimensionalized by the airfoil chord |
| SO | Slat overhang non-dimensionalized by the airfoil chord |
| α | angle of attack |
| θ | rotation angle of slat |
References
- Kuchemann, D. The Aerodynamic Design of Aircraft; Pergamon Press: Oxford, UK, 1978; pp. 168–172. [Google Scholar]
- Hoerner, S.F.; Borst, H.V. Fluid Dynamic Lift; Liselotte A. Hoerner, Hoerner Fluid Dynamics: Bricktown, NJ, USA, 1985; Chapter 6. [Google Scholar]
- Wenzinger, C.J.; Rogallo, F.M. Resume of Air-Loads on Slats and Flaps; NACA Report No. 690; National Advisory Committee for Aeronautics: Washington, DC, USA, 1939.
- Lachmann, G. Experiments with Slotted Wings; NACA Technical Note 71; Translated from Zeitschrift fur Flugtechnik und Motorluftschiffahrt; National Advisory Committee for Aeronautics: Washington, DC, USA, 1921.
- Handley Page, F. Developments in Aircraft Design by the use of Slotted Wings. Flight 1921, 13, 844–846. [Google Scholar]
- Weick, F.E.; Platt, R.C. Wind-Tunnel Tests on Model Wing with Fowler Flaps and Specially Developed Leading-Edge Slot; NACA Technical Note 459; National Advisory Committee for Aeronautics: Washington, DC, USA, 1933.
- Quinn, J.H. Tests of the NACA 641A212 Airfoil Section with a Slat, a Double Slotted Flap, and Boundary Layer Control by Suction; NACA Technical Note 1293; National Advisory Committee for Aeronautics: Washington, DC, USA, 1947.
- Axelson, J.A.; Stevens, G.L. Investigation of a Slat in Several Different Positions on an NACA 64A101 Airfoil for a Wide Range of Subsonic Mach Numbers; NACA Technical Note 3129; National Advisory Committee for Aeronautics: Washington, DC, USA, 1954.
- Kelly, J.A.; McCullough, G.B. Aerodynamic Loads on a Leading-Edge Flap and A Leading Edge Slat on the NACA 64A101 Airfoil Section; NACA Technical Note 3220; National Advisory Committee for Aeronautics: Washington, DC, USA, 1954.
- Weick, F.E.; Sanders, R. Wind Tunnel Tests of a Wing with Fixed Slots and Trailing-Edge Flap on the Lift and Drag of a Clark Y Aerofoil; NACA Report No. 472; National Advisory Committee for Aeronautics: Washington, DC, USA, 1933.
- Otray, J.E.; Lissaman, P. Leading-edge slat design by a semi-inverse technique. J. Aircr. 1972, 9, 143–149. [Google Scholar] [CrossRef]
- Smith, A.M.O. High lift aerodynamics. J. Aircr. 1975, 12, 501–530. [Google Scholar] [CrossRef]
- Malik, M.; Lin, R. Transition prediction on the slat of a high-lift system. J. Aircr. 2004, 41, 1384–1392. [Google Scholar] [CrossRef]
- Williams, A.L. A new and less complex alternative to the Handley Page slat. J. Aircr. 1986, 23, 200–206. [Google Scholar] [CrossRef]
- Renukumar, B.; Bramkamp, F.; Hesse, M.; Ballmann, J. Effect of flap and slat riggings on 2-D high-lift aerodynamics. J. Aircr. 2006, 43, 1259–1271. [Google Scholar] [CrossRef]
- Maddah, S.R.; Bruun, H.H. An investigation of flow fields over multi-element aerofoils. ASME J. Fluid Eng. 2002, 124, 154–165. [Google Scholar] [CrossRef]
- Genc, M.S.; Kaynak, U.; Lock, G.D. Flow over an aerofoil without and with a leading-edge slat at a transitional Reynolds number. Proc. Inst. Mech. Eng. Part G J. Aerosp. Eng. 2009, 223, 217–231. [Google Scholar] [CrossRef]
- Traub, L.W.; Freienmuth, E.O. Effect of streamwise attachment gap on aerodynamic characteristics of gurney flaps. J. Aircr. 2011, 48, 348–352. [Google Scholar] [CrossRef]
- Drela, M.; Youngren, H. AVL Aerodynamic Analysis. Available online: http://web.mit.edu/drela/Public/web/avl/ (accessed on 1 July 2016).
- Drela, M.; Youngren, H. XFOIL Subsonic Airfoil Development System. Available online: http://web.mit.edu/drela/Public/web/xfoil/ (accessed on 3 July 2016).
Figure 1.
Rendering showing wind tunnel model construction, model sting installation (inset), side plate installation, airfoil profile and slat variable definitions.
Figure 1.
Rendering showing wind tunnel model construction, model sting installation (inset), side plate installation, airfoil profile and slat variable definitions.
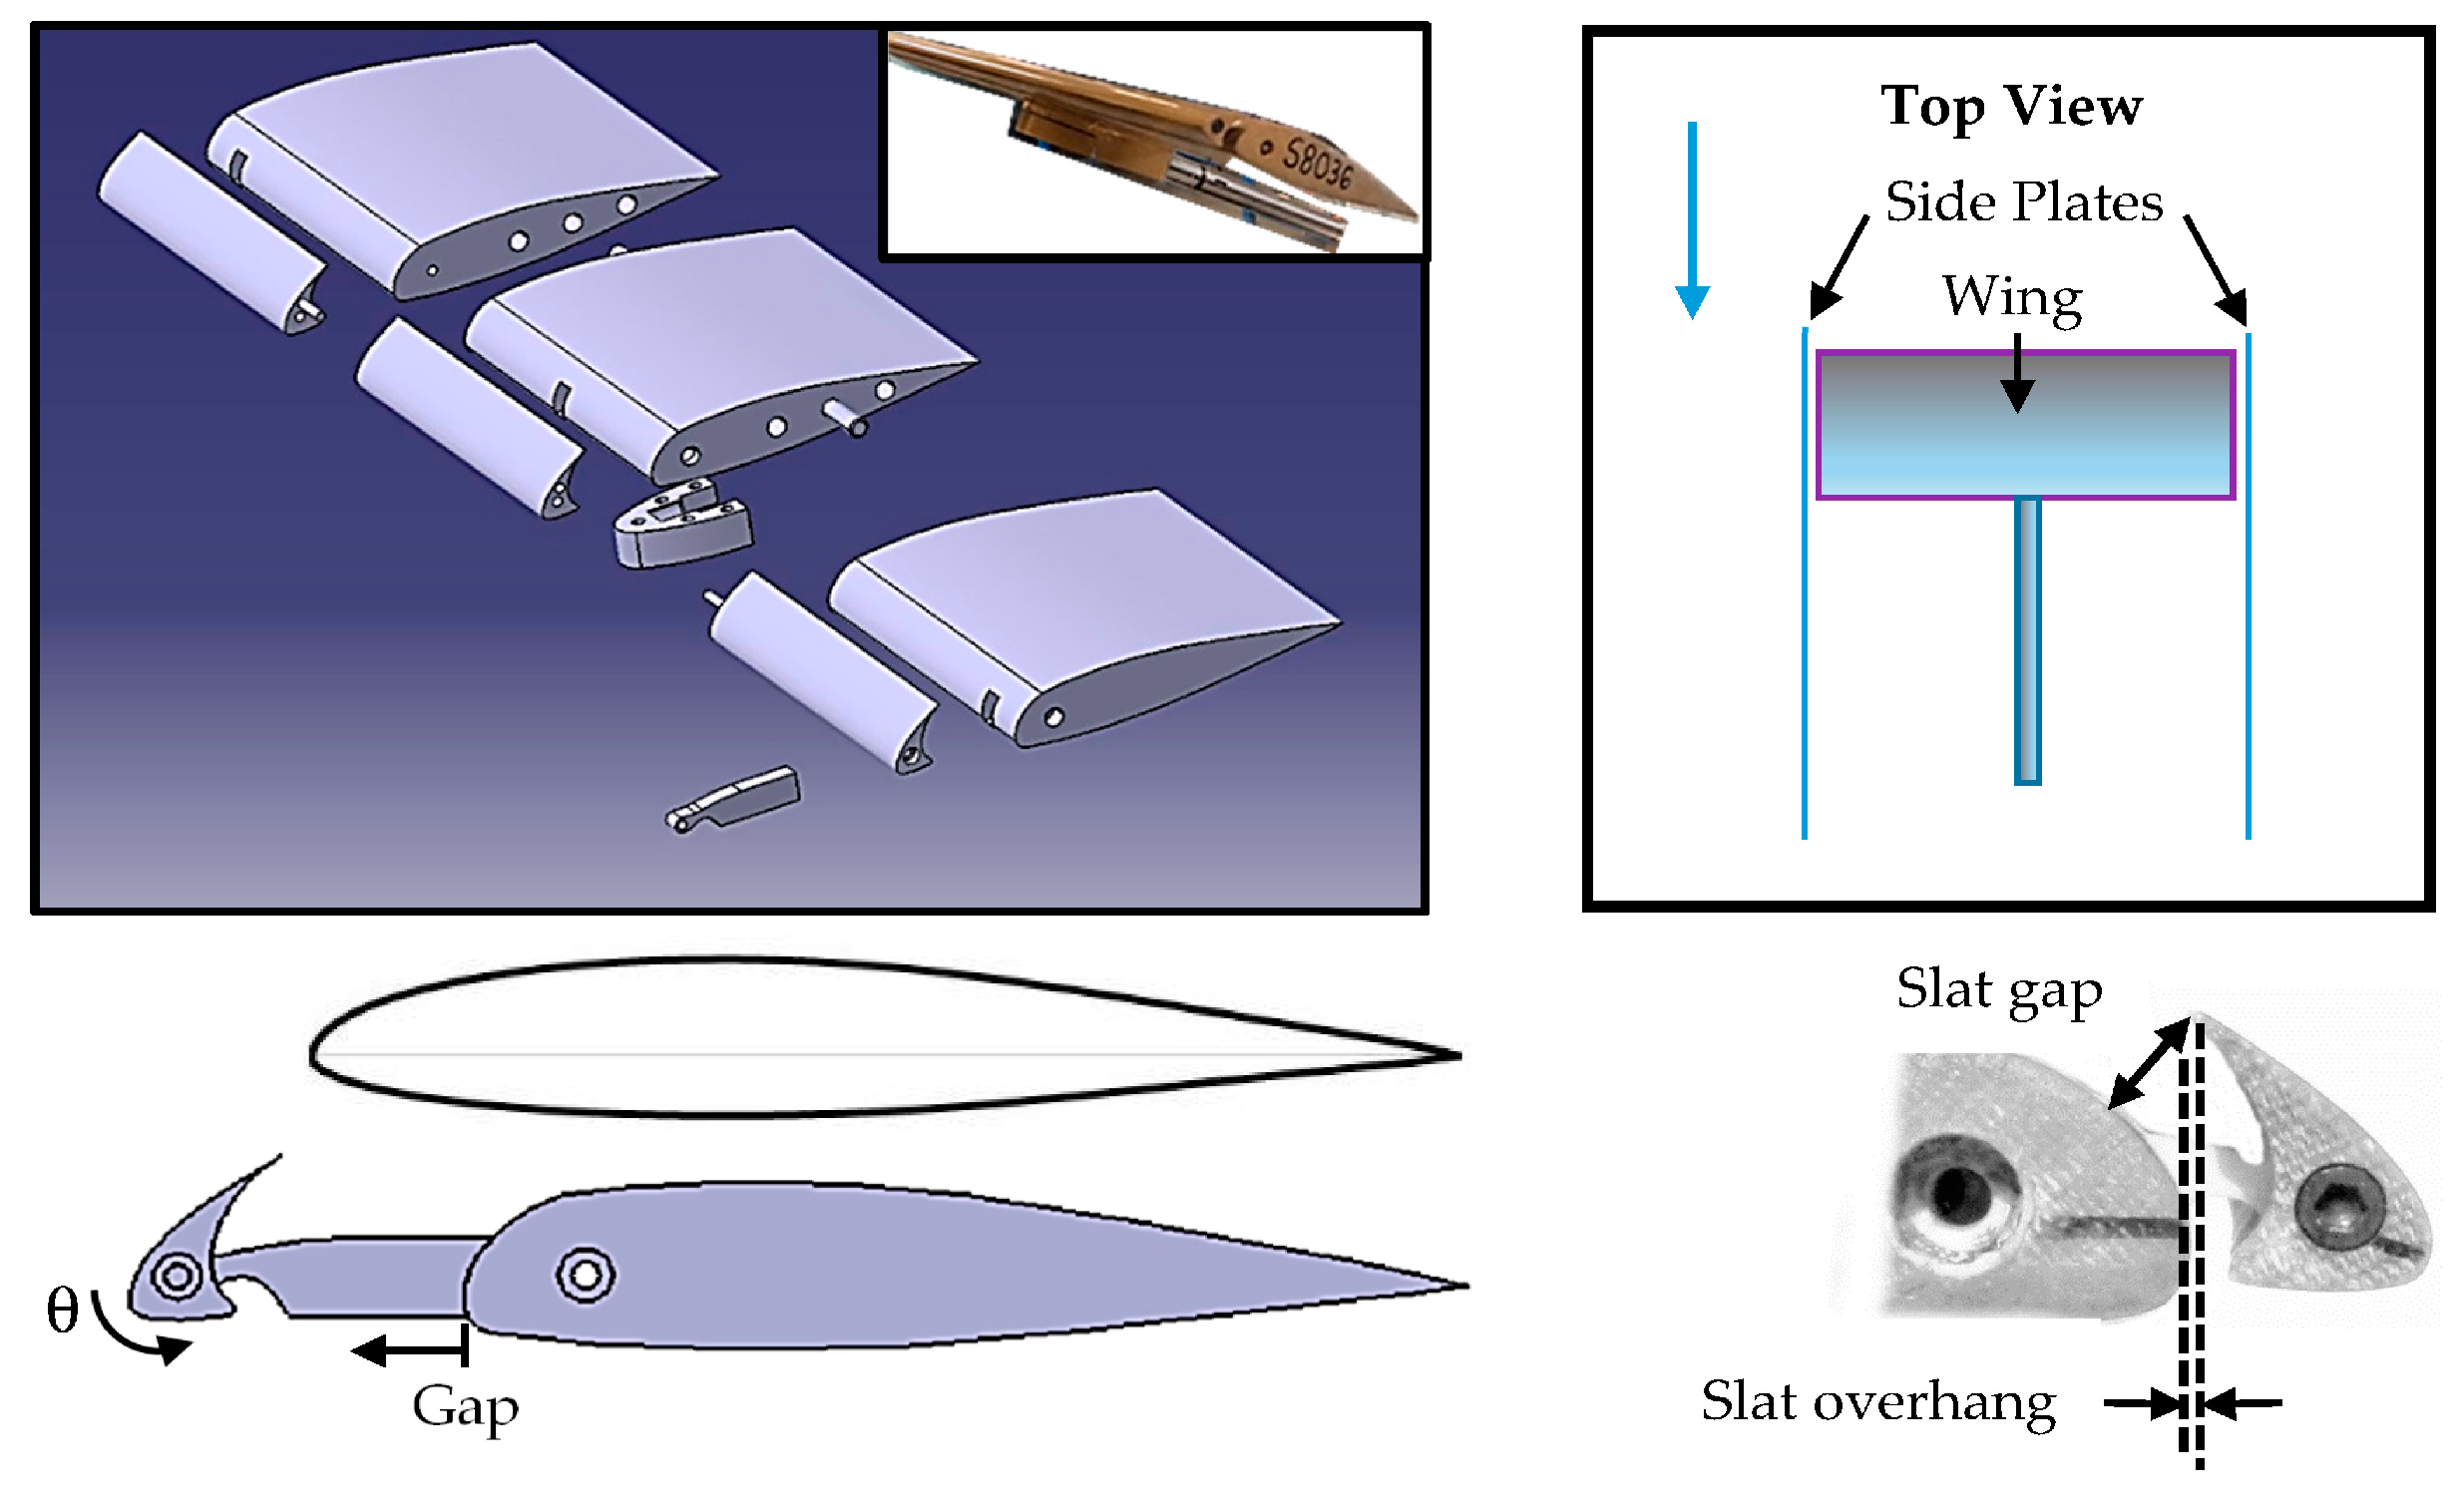
Figure 2.
Effect of slat gap and angle on the (a) measured lift coefficient and (b) drag coefficient, error bars are shown in green.
Figure 2.
Effect of slat gap and angle on the (a) measured lift coefficient and (b) drag coefficient, error bars are shown in green.

Figure 3.
Effect of slat gap and angle on (a) the lift increment relative to the clean wing and (b) the maximum lift coefficient.
Figure 3.
Effect of slat gap and angle on (a) the lift increment relative to the clean wing and (b) the maximum lift coefficient.

Figure 4.
Effect of angle of attack and slat deployment (G5R0 geometry) on surface skin friction patterns. Flow is from top to bottom. Ruler divisions are one-quarter chord.
Figure 4.
Effect of angle of attack and slat deployment (G5R0 geometry) on surface skin friction patterns. Flow is from top to bottom. Ruler divisions are one-quarter chord.
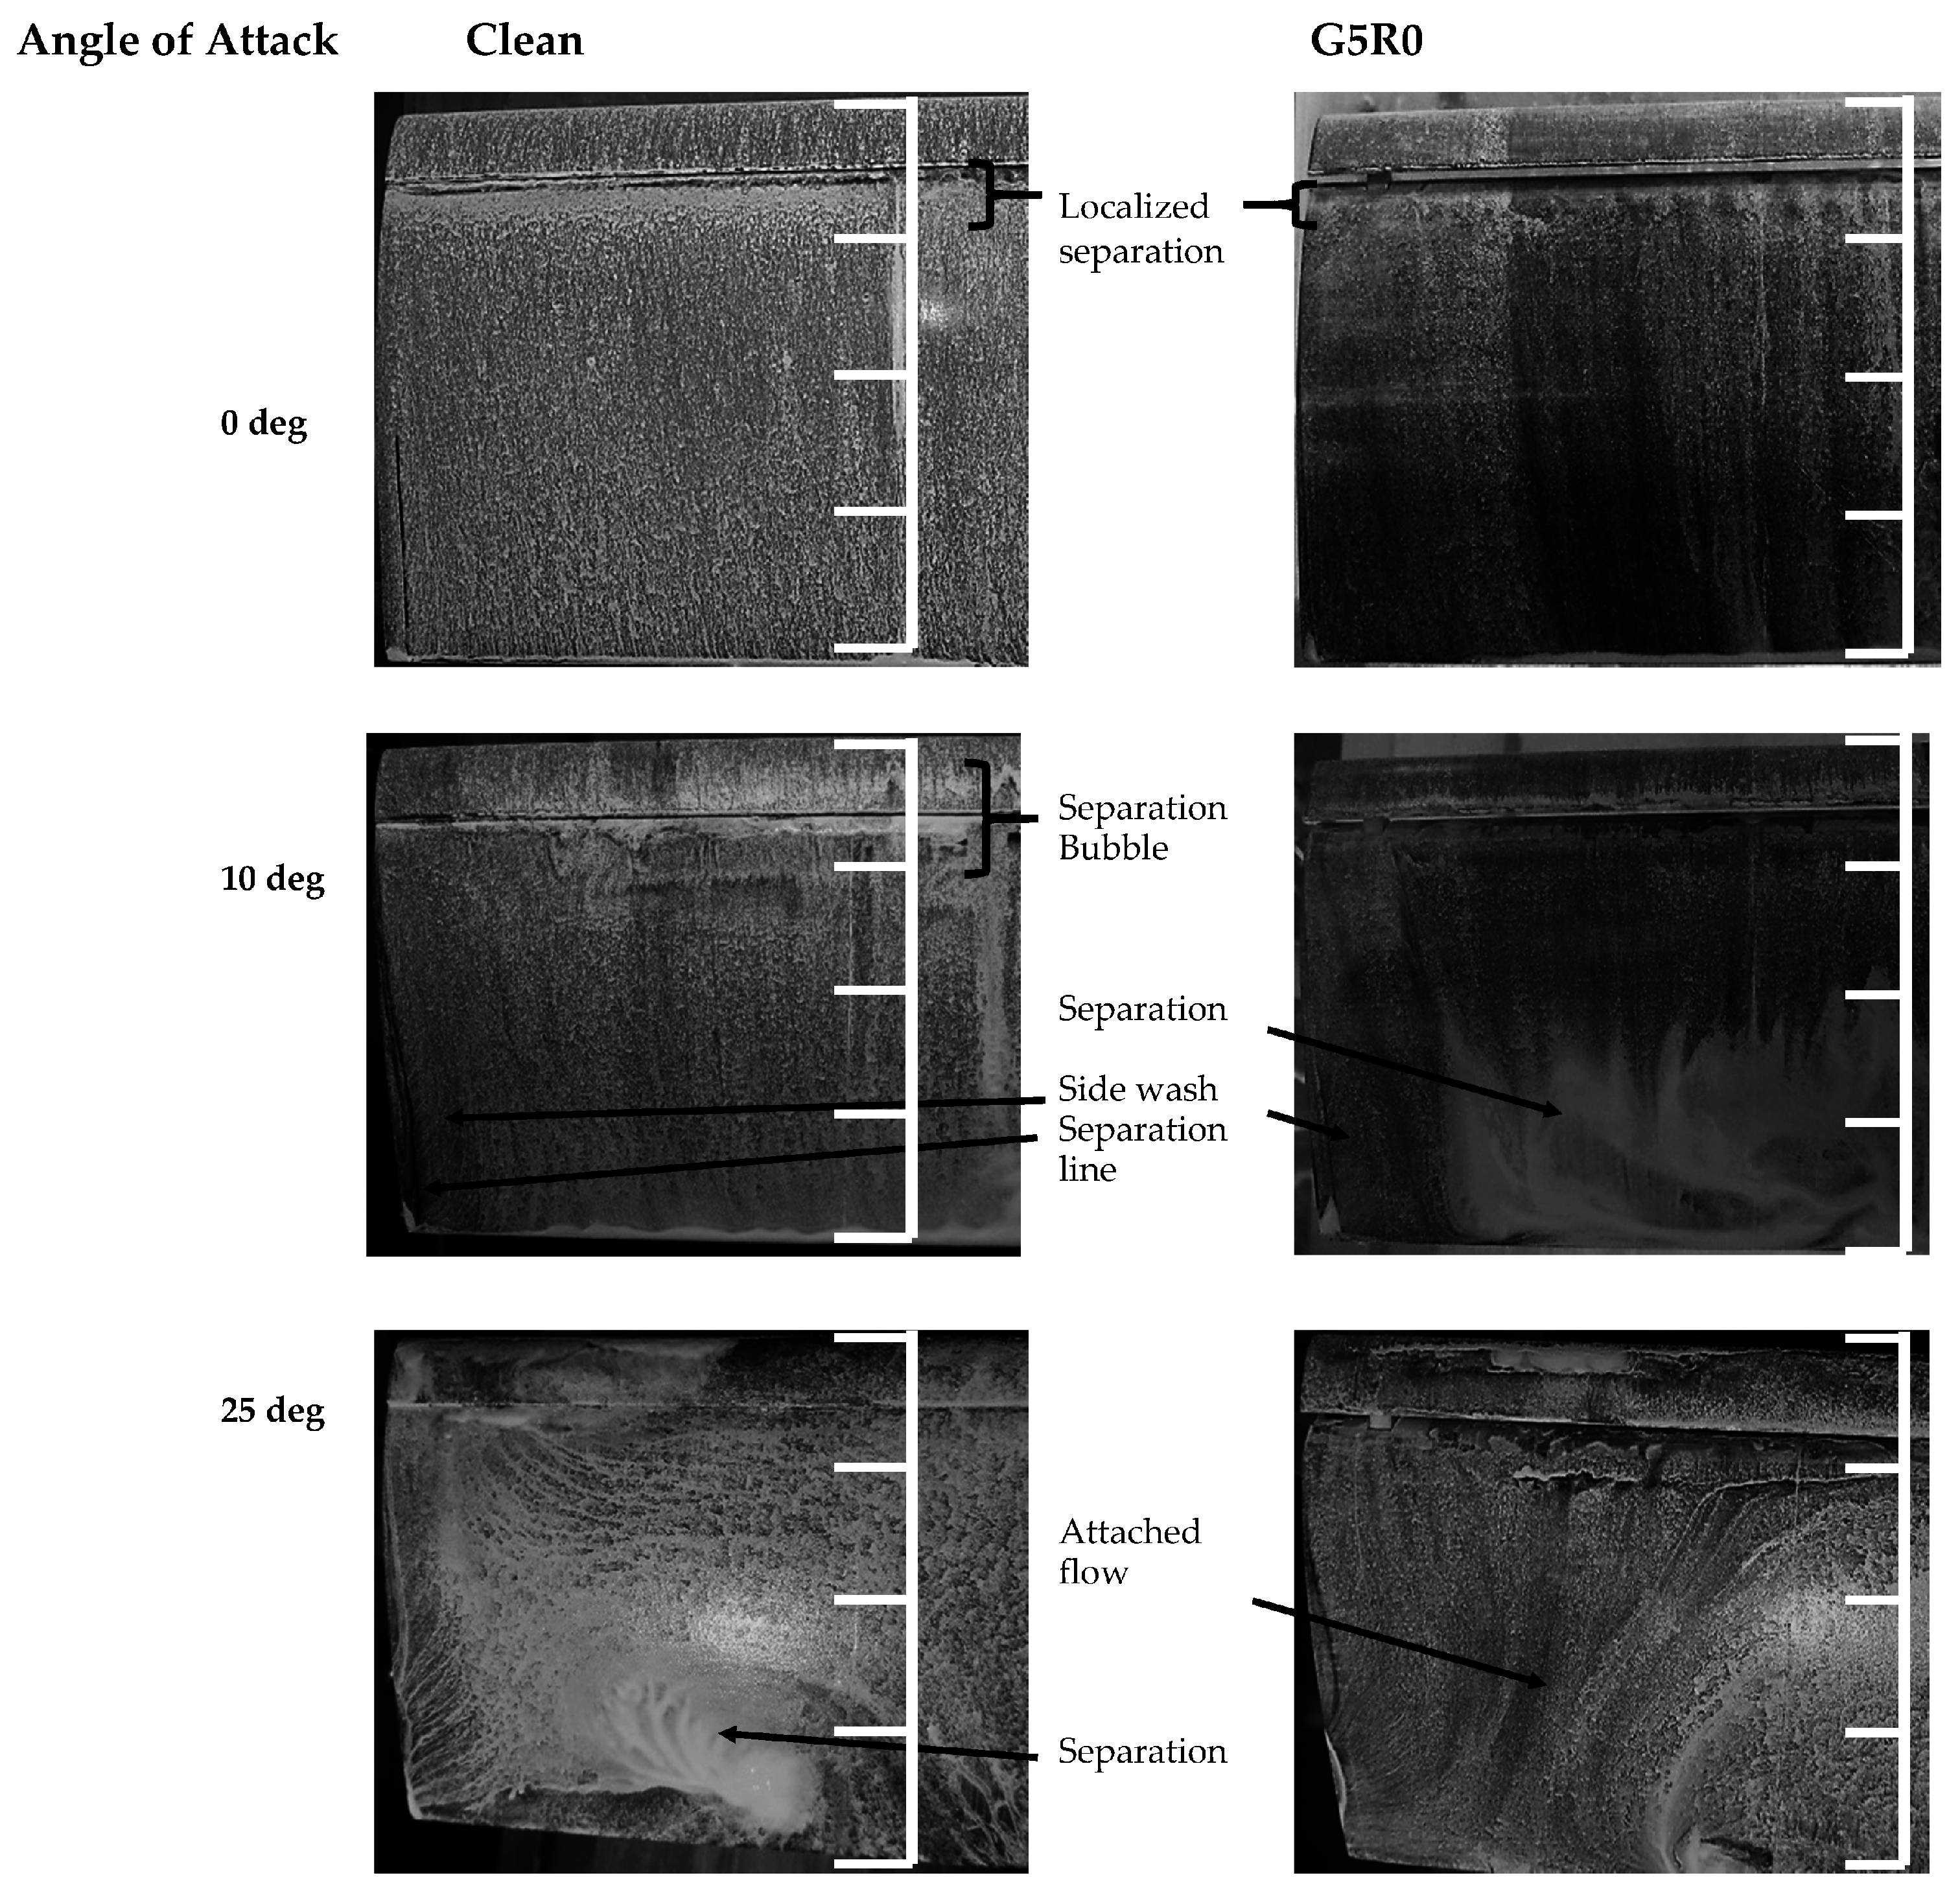
Figure 5.
Effect of angle of attack and slat deployment (G10R0 and G10R10 geometry) on surface skin friction patterns. Flow is from top to bottom.
Figure 5.
Effect of angle of attack and slat deployment (G10R0 and G10R10 geometry) on surface skin friction patterns. Flow is from top to bottom.

Figure 6.
Effect of slat gap and angle on pitching moment coefficient.
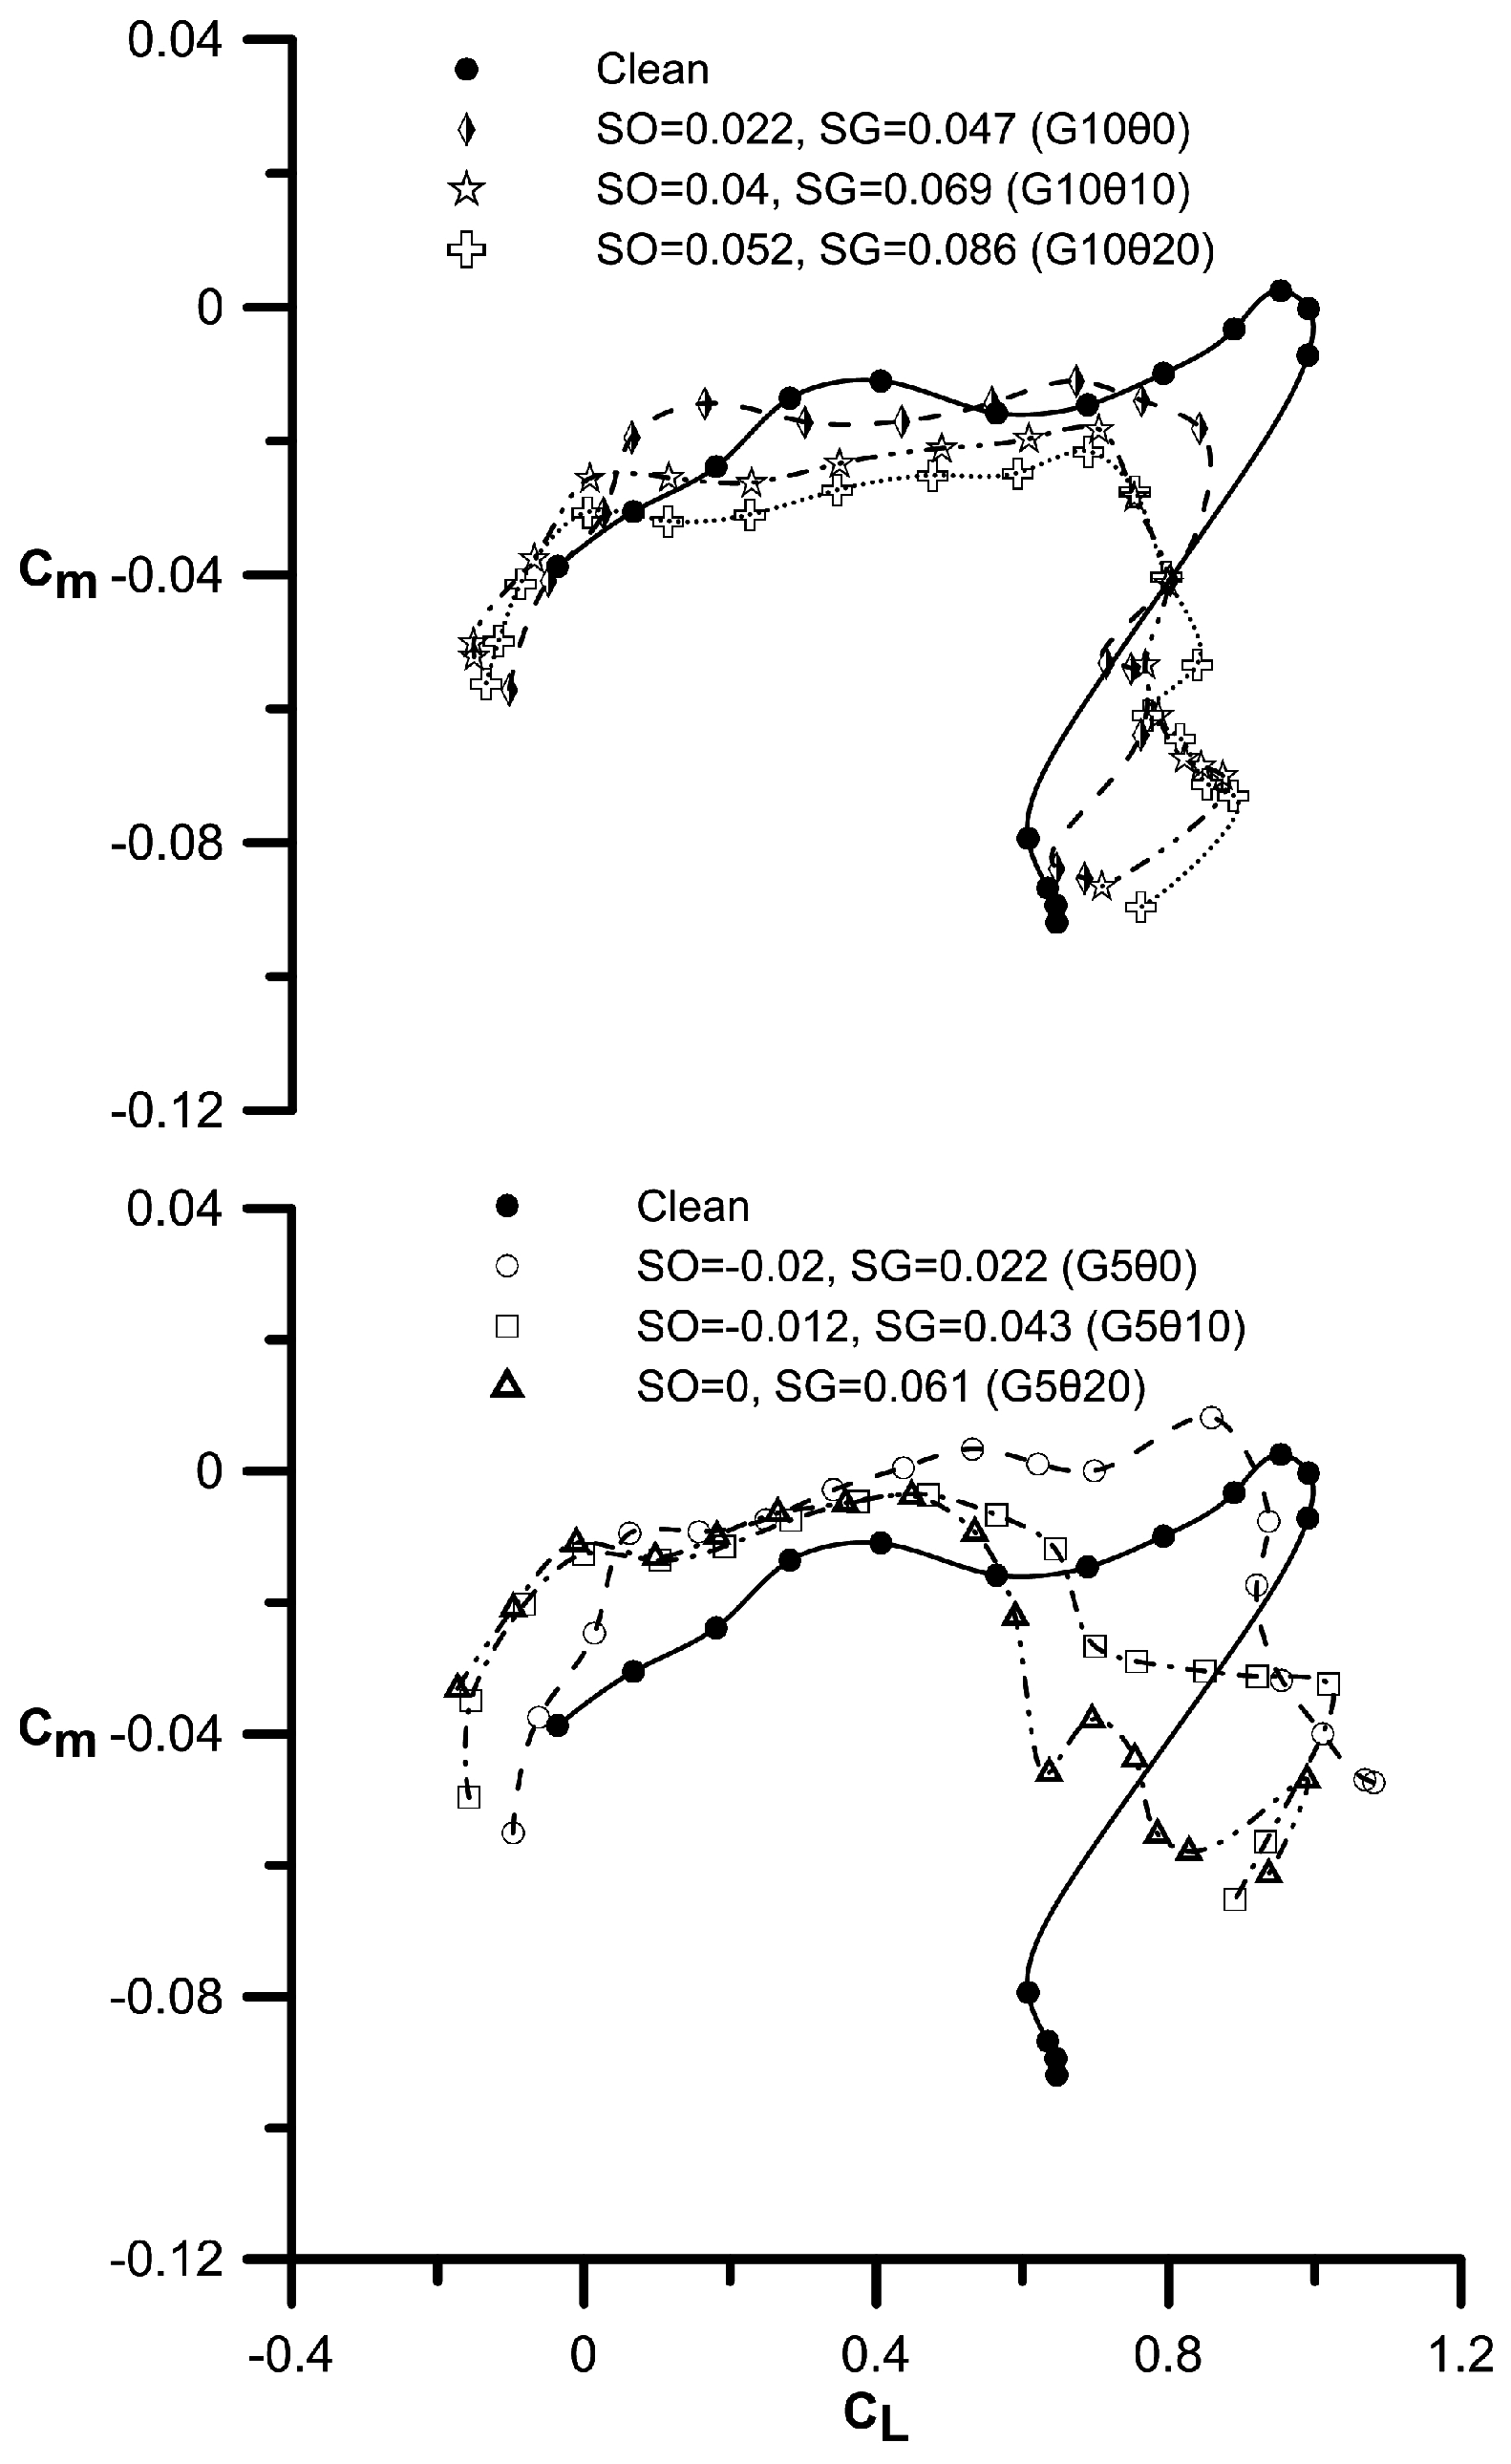
Figure 7.
Effect of slat gap and angle on the (a) measured lift coefficient and (b) profile drag coefficient with side plates installed.
Figure 7.
Effect of slat gap and angle on the (a) measured lift coefficient and (b) profile drag coefficient with side plates installed.

| Gap (mm) | θ (°) | SO (Slat Overhang) * | SG (Slat Gap) * |
|---|---|---|---|
| 5 | 0 | −0.02 | 0.022 |
| 5 | 10 | −0.012 | 0.043 |
| 5 | 20 | 0 | 0.061 |
| 10 | 0 | 0.022 | 0.047 |
| 10 | 10 | 0.04 | 0.069 |
| 10 | 20 | 0.052 | 0.086 |
* Non-dimensionalized by chord.
© 2016 by the authors; licensee MDPI, Basel, Switzerland. This article is an open access article distributed under the terms and conditions of the Creative Commons Attribution (CC-BY) license (http://creativecommons.org/licenses/by/4.0/).
Share and Cite
MDPI and ACS Style
Traub, L.W.; Kaula, M.P. Effect of Leading-Edge Slats at Low Reynolds Numbers. Aerospace 2016, 3, 39. https://doi.org/10.3390/aerospace3040039
AMA Style
Traub LW, Kaula MP. Effect of Leading-Edge Slats at Low Reynolds Numbers. Aerospace. 2016; 3(4):39. https://doi.org/10.3390/aerospace3040039
Chicago/Turabian StyleTraub, Lance W., and Mashaan P. Kaula. 2016. "Effect of Leading-Edge Slats at Low Reynolds Numbers" Aerospace 3, no. 4: 39. https://doi.org/10.3390/aerospace3040039
Note that from the first issue of 2016, this journal uses article numbers instead of page numbers. See further details here.