
CFD Study of a New Annular Lift Fan Configuration with High Lift Efficiency


UAV Research Institute, Northwestern Polytechnical University, 127 West Youyi Road, Xi’an 710072, China
*
Author to whom correspondence should be addressed.
Aerospace 2017, 4(1), 13; https://doi.org/10.3390/aerospace4010013
Submission received: 2 February 2017
/
Revised: 25 February 2017
/
Accepted: 27 February 2017
/
Published: 3 March 2017
Abstract
:A new annular lift fan configuration that has very high lift efficiency is explored by using a numerical scheme. The inlet lip radius and diffuser angle are maximized by semicircle duct walls and the location of the lift fan is moved from the throat to the diffuser area to maximize the diffusion effect of the ducted fan. The improved lift fan achieves the figure of merit of 0.772 and the power loading of 9.03 lbs/hp without ground effect, very close to the theoretical limit. Under the ground effect, the figure of merit reaches 0.822 with the power loading of 9.62 lbs/hp. The improved lift efficiency deteriorates the transition characteristics with higher momentum drag and pitching moment. However, with the aid of jet thrusts directly providing part of the lift during transition, the peak of momentum drag and pitching moment can be lowered. A total thrust to weight ratio of 0.7 is enough for all of the requirements in transition and in hover and for the maximum speed of 0.75 Mach in cruise flight.
1. Introduction
Vertical flight eliminates the requirement for a long runway to take off and land and provides the convenience to hover in the air. The most efficient ways to hover so far are helicopter rotors and ducted fans, as shown in Figure 1. The rotors of helicopters have a long blade length and thus a large disc area and low disc loading to ensure high lift efficiency. The power loadings of helicopters are usually 5–8 lbs/hp at disc loading of 8–14 lbs/ft2 [1]. The tiltrotors have relatively shorter blades and higher disc loading and thus lower lift efficiency (Figure 1). The ducted fans, although with similar or higher disc loading than the tiltrotors, are more lift efficient because the ducts provide part of lift (Figure 1). The higher disc loading thrust, such as the lift fan used in the F-35 B lightning II (JSF) and the vectored jet of the AV-8A Harrier, are very inefficient in hover mode (Figure 1).
A large annular lift fan for vertical takeoff and landing (VTOL) aircraft with low disc loading was proposed in previous studies [2,3,4] (Figure 2). The annular lift fan has an outer radius of 7 m with annular fan area of 75.3 m2. With the large fan area, after the optimization of parameters for hovering efficiency [3], the figure of merit (FM) of 0.733 with power loading of 7.4 lbs/hp was achieved at disc loading of 28.37 lbs/ft2 (based on the fan area), as shown with the lower red star in Figure 1. This efficiency is higher than that of the Chrysler VZ-6 ducted fans in Figure 1 probably because the ducts of the VZ-6 were not optimized with larger smooth inlet lips. In the present study, the lift efficiency of the annular lift fan is further optimized to reach 9.05 lbs/hp, as shown with the upper red star in Figure 1, very close to the theoretical limit.
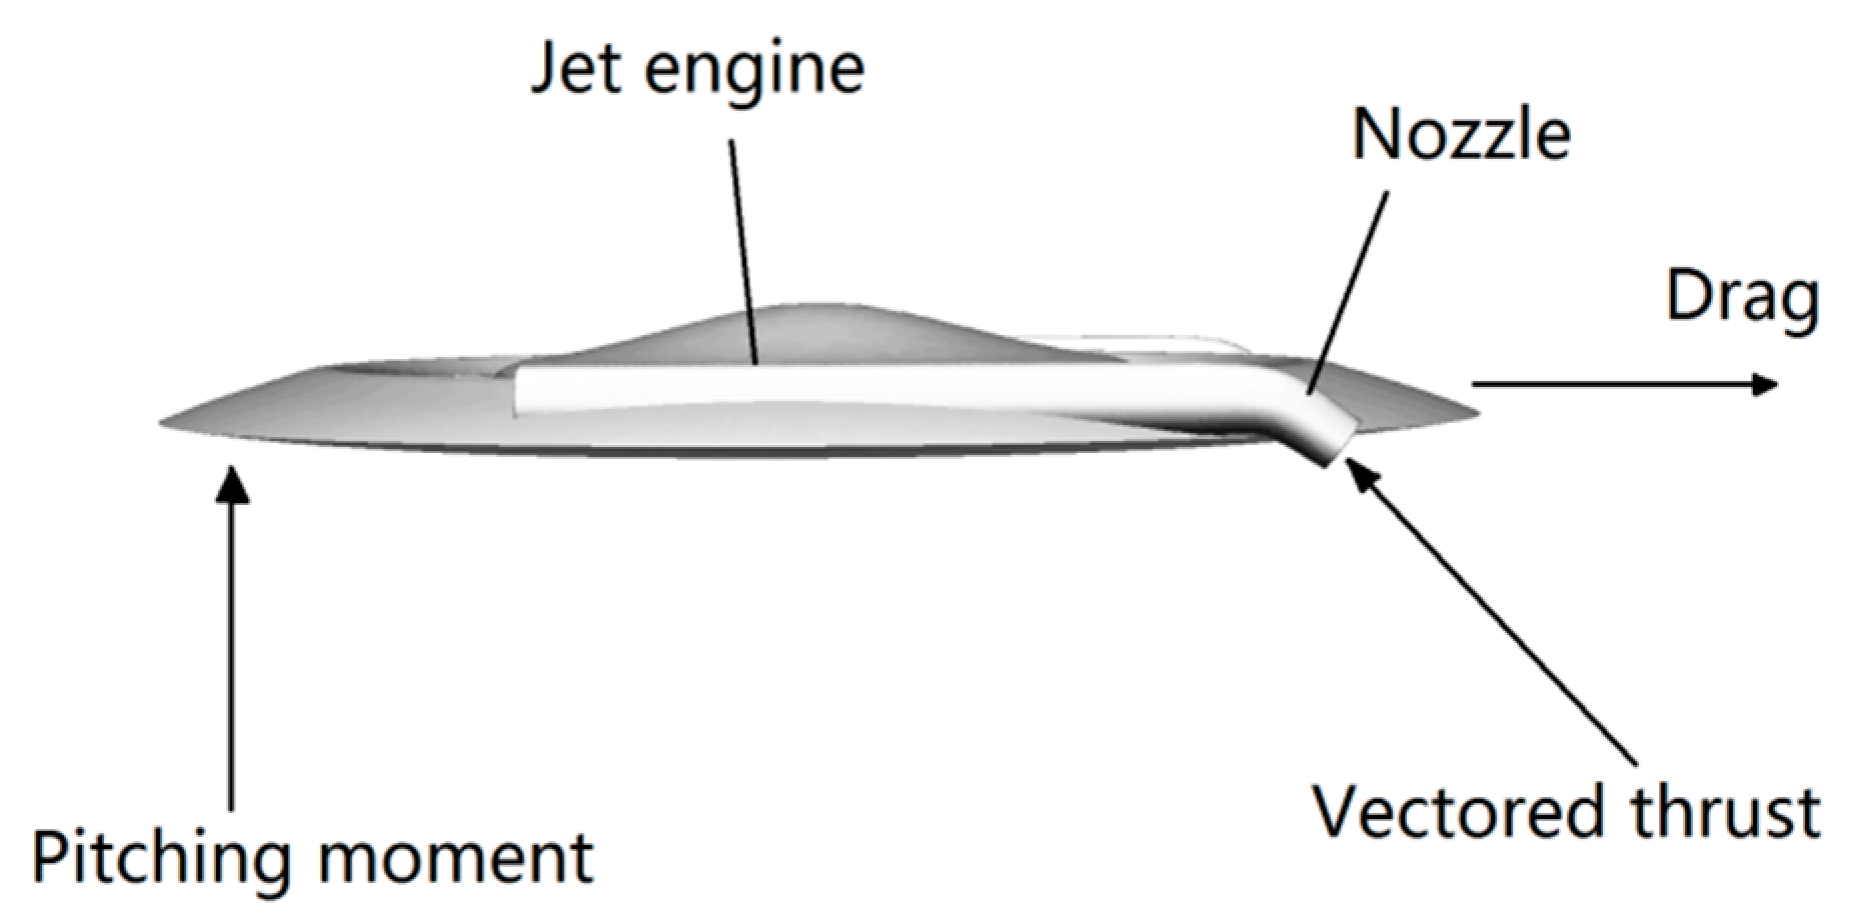
For an aircraft with annular lift fan as shown in Figure 2, the lift fan is mechanical or pneumatic coupled with the jet engines incorporated in the outer wing during VTOL. The lift fan is estimated as able to augment the jet thrusts five times, i.e., the jet thrust to weight ratio of 0.2 is enough to lift the aircraft. After transition from VTOL to cruise flight, the annular duct of the lift fan will be closed off by a diaphragm, shutter or louvers mounted at the top and bottom of the duct to form a smooth part of the ring wing for aerodynamic flight. During hover and transition, the attitude of aircraft can be maneuvered by thrust vectoring of the two jet engines. During cruise flight, the lift fan stops working and the maximum speed is determined by the thrusts of the forward jet engines.
In the present investigation, the configuration of the lift fan was further optimized for lift efficiency. The results of new configuration were compared with the original optimized one in the previous study [3] and the mechanism of lift increase was analyzed. The transition characteristics of the new configuration were also studied.
The lift fan was first implemented in the jet powered experimental aircraft Ryan GE XV-5 in 1960s [6]. Many experimental investigations have been conducted [7,8,9]. The lift fan also has been successfully applied in the F-35B [10]. Compared to conventional VTOL aircrafts, lift fan aircraft fly faster and require minimum ground preparation [11,12,13]. The primary drawback of lift fans in VTOL aircraft is the additional dead weight when the lift fan is not used in cruise flight. In the present study, the maximum thickness of the fan blades can be reduced to only 2% of the chord length, thus decreasing the dead weight of the fan.
The transition from VTOL to aerodynamic cruise flight is very important for the success of VTOL vehicles [4]. To achieve smooth transition with lower peak of momentum drag and nose-up pitching moment, a strategy to start forward flight from a large negative angle of attack (AOA) of −21° was recommended in the previous studies [2,4]. In the present study, the strategy to start from a negative AOA is no longer necessary, reducing the complexity of control of aircraft attitude in transition.
2. Geometry and Computational Mesh
2.1. Geometry
The diameter of the aircraft is 18 m with the widths of outer wing and annular duct of 2 m and a depth of duct of 1 m. The weight is set 10.433 tons with fan disc loading of 28.37 lbs/ft2. The lift fan set is composed of a single-stage inner fan and outer fan (Figure 2 and Figure 3) [3,4], which are separated and mechanically coupled by the gears in the ring baffle and counter rotate at the same speed to eliminate torque. A very thin airfoil with a flat surface and a cambered surface with the maximum thickness at the position about of 15%–20% of the chord from the leading edge was used (Figure 4a). The clearance gap between the fan tip and the duct is eliminated because the fan is supposed to be tip driven by the jet engines incorporated in the outer wing. The clearance gap is very critical for the performance of the annular duct. A very small gap may cause separation of flow from the duct walls and reduce the diffusion effect. As the both ends of the fan blades are fixed, the thin multiple blades are strong enough to carry the weight of aircraft.
On the basis of the previous work [3] to optimize the lift fan parameters for hovering efficiency, in the present study, the duct walls were changed to semicircle to maximize the inlet lip radius and the diffuser angle, and the location of the fan was lowered from the throat to the diffuser area as shown in Figure 3. The other parameters of the fan were further optimized from this point, and it was found that the blade thickness of 2% of chord length and pitch angle of 30° yielded to higher lift efficiency. The small thickness of 2% is optimal for lift efficiency and the reduction of weight of the lift fan. Thicker blades can be used for aeroelastic and manufacturing considerations, but the lift efficiency will be lowered. Then, the lengths of inner and outer fan blades were adjusted to 1.5 m (r = 6.5–5 m) and 0.5 m (r = 7.1–6.6 m) to eliminate the yawing torque. The transition simulations were also performed with this newly optimized configuration. The comparison of duct configuration with the original one can be seen in Figure 3. The original duct configuration is also an arc with inlet lip radius of 0.6 m and a small diffusor angle. The new semicircle duct walls have a radius of 0.5 m.
2.2. Computational Mesh
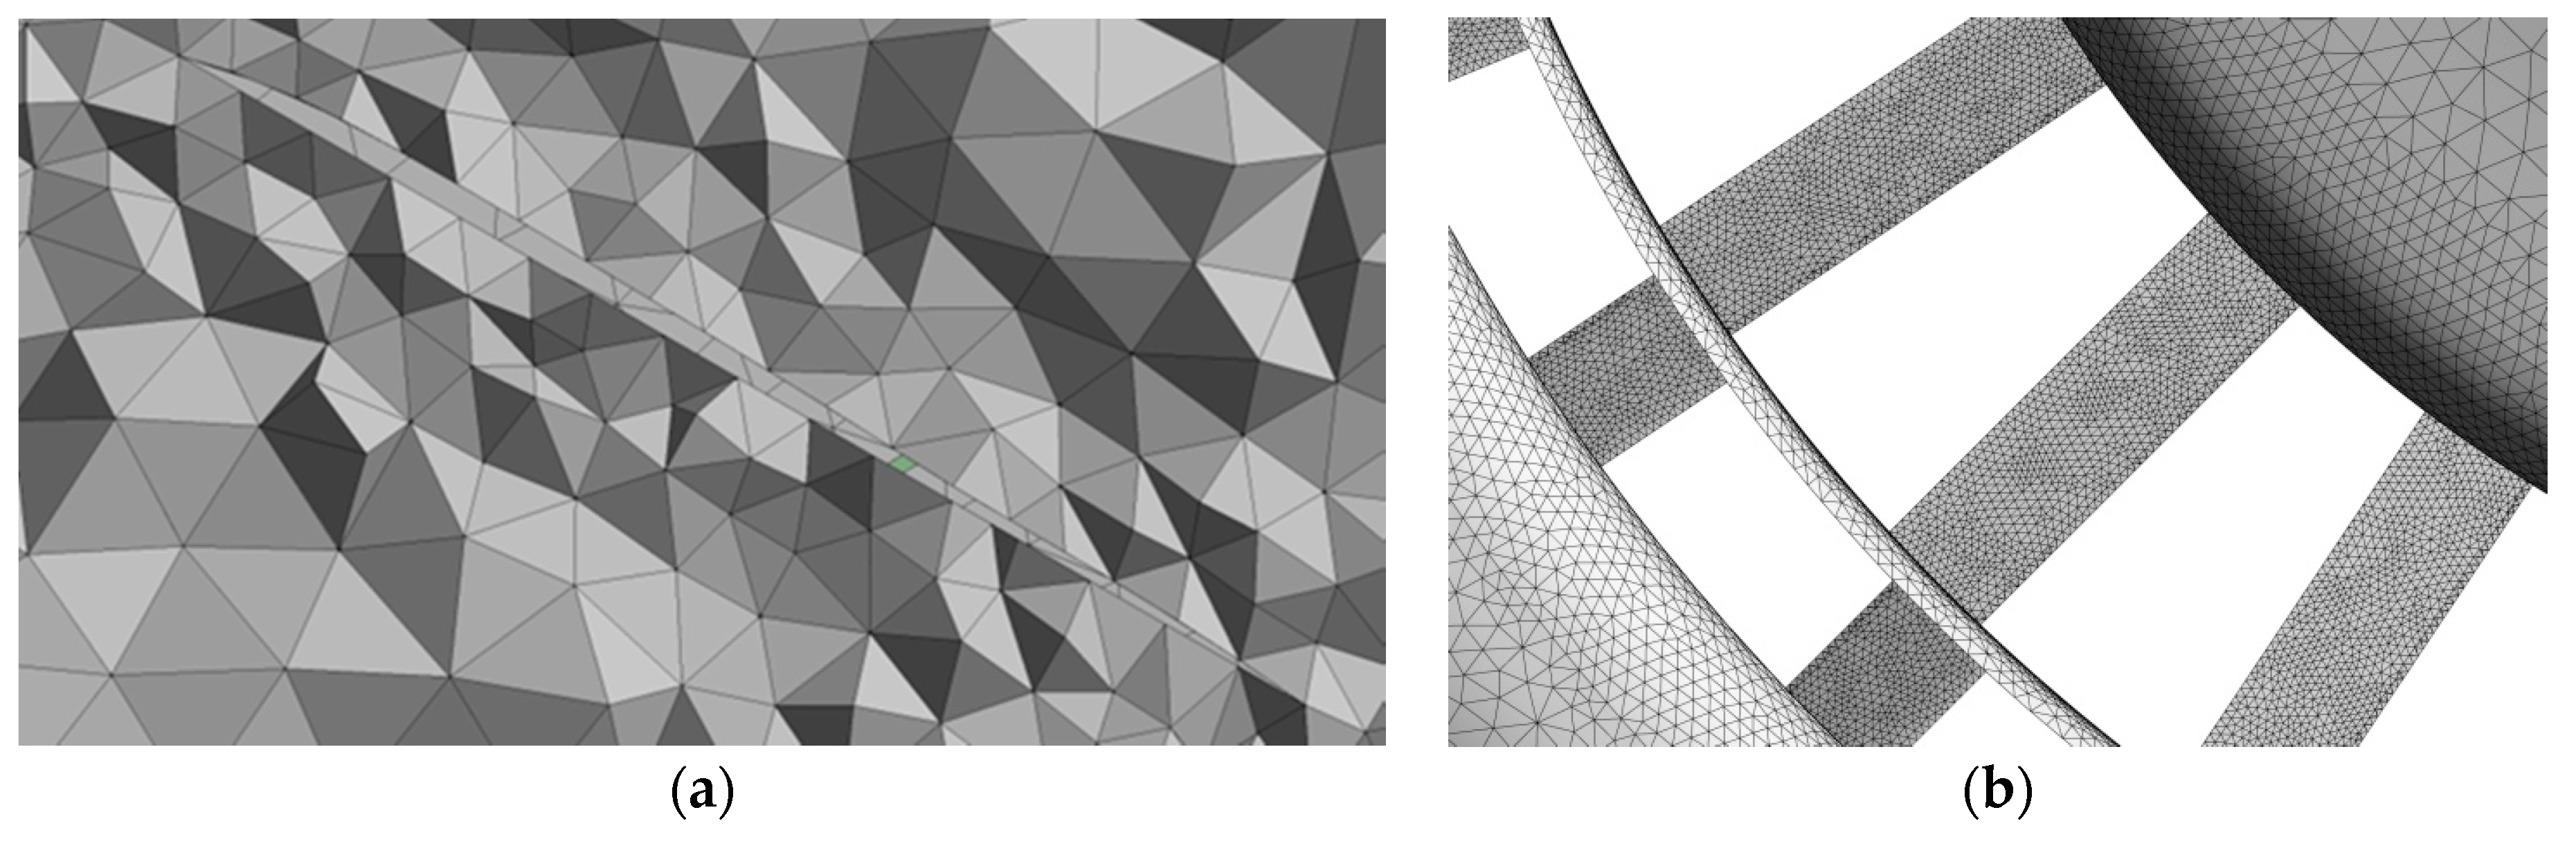
The unstructured mesh technique was used in the study (Figure 4). CFD methods based on unstructured grids have an advantage of easily handling complex geometries and can improve the solution accuracy by refining cells locally as required [14]. The unstructured meshes in this study were created using ANSYS Meshing 17.0 (ANSYS, Inc., Canonsburg, PA, USA).
The tetrahedral volume meshes were created in a 20R × 20R × 15R flow field. R is the radius of the aircraft. The upper boundary is located at 3R above the aircraft and the lower boundary is 12R under the aircraft to reduce the disturbances reflected from the outflow boundary. A dimension sensitivity study was carried out to make sure that the dimension was big enough so that the simulation results would not change with the computational fluid domain (data not shown). The flow field was divided into three volumes in which the two small blocks were dedicated to the rotating fans in multiple reference frames or sliding meshes.
Mesh sensitivity study was carried out with three cases considered (Table 1). The result showed that the difference between medium and fine grids was small, so all simulations were performed with a medium grid of 5.2 M elements. The results were also insensitive to different boundary layers of y+ = ~1 or 30~300. According to the numerical model validation studies, the simulation results were better without the boundary layers in hover and transition mode, indicating that the flows are primarily turbulent and momentum drag is dominant. Therefore, the meshes without boundary layers were used for all simulations.
3. Boundary Condition and Simulation Setup
CFD simulations were performed using ANSYS Fluent 17.0, which has been extensively used in various studies [15,16,17,18,19]. The 3D Reynolds-averaged Navier–Stokes (RANS) equations for the mean flow quantities were solved.
A pressure-based solver type with absolute velocity formulation, the Green–Gauss node based gradient option and steady approach were used in the analyses of hover mode. The shear stress transport (SST) k-ω turbulence model developed by Menter [20,21] was selected. The semi-implicit method for pressure linked equations (SIMPLE) scheme was used to resolve the pressure–velocity coupling with the second order discretization for the pressure equation, the third order monotonic upstream-centered scheme for conservation laws (MUSCL) for the momentum, turbulent kinetic energy and turbulent dissipation rate [22]. Multiple reference frames were used for the fan fluid zone and the stationary zone. Pressure-inlet and pressure-outlet boundary conditions were applied over the top and bottom surfaces of the computational domain.
For transition study, unsteady calculations (URANS) were performed. The areas surrounding the fans were designated as sliding mesh. Sliding interfaces separated the rotating domain from the stationary domain. The initial data for the unsteady run were obtained from steady calculations. Velocity-inlet and pressure-outlet conditions were imposed over the front and rear surfaces of the computational domain to simulate a freestream flow.
4. Numerical Model Validation
The numerical model validation of hovering efficiency was performed on a conventional circular ducted fan used in VTOL unmanned aerial vehicles (UAVs) [3,23,24]. No boundary layers were resolved. The simulation results showed very good agreement with the experimental data in the figure of merit and thrust [3].
5. Results
5.1. Hovering Efficiency
On the basis of optimization of parameters for hovering efficiency in the previous study [2,3], we further improved the annular duct walls to a complete half circle to maximize the inlet lip radius and the diffuser expansion angle. Therefore, the maximum inlet lip radius was 0.5 m, half of the duct thickness, and the final theoretical diffuser expansion angle was 180°. This was not a usual ducted fan with a Venturi type of duct. The diffusion factor σ value greatly increased, with more lift generated from the outer wing and less thrust directly from the fans, and the separations of flows from the duct walls happened very late (Table 2, Figure 5). The figure of merit (FM) and power loading increased as the power decreased (Table 2). Inspired by the results, we further moved the location of fans lower from the throat of the duct to the diffuser area as shown in Figure 4b, and the hovering performance was improved again. The σ value increased to 1.31, which means that only 38% of total lift comes directly from the fan thrusts and three fifths of lift comes from the duct, fuselage, and outer wing. We then found from this point that 2% blade thickness and a 30° pitch angle gave better results than the original 4% thickness and 27° pitch angle. A zero thickness of blades was also investigated, but the results were not better. Finally, the highest power loading achieved was 9.05 lbs/hp with a figure of merit of 0.772 without ground effect as shown in Table 2. When the aircraft was close to the ground with the distance of 10 m (approximately the radius of the aircraft), the figure of merit and power loading continued to increase (Table 2).
According to the momentum theory of ducted fan in hover mode [2,11,12], duct diffusion ratio:
where V1 is the velocity under the fan, and V2 is the far wake velocity; Ttotal is the total thrust, and Tfan is the thrust directly from the fan. For a helicopter rotor, σ = 0.5. For a typical ducted fan, σ is about 1. Higher σ value leads to lower direct fan thrust.
The figure of merit was calculated as follows:
where Pideal is the induced power, A is the annular fan area; σ is the duct diffusion ratio; ρ is the density of air, ρ = 1.225 kg/m3; rF together is the moment of fan, and ω (rad/s) and n (rpm) are the rotational speed.
Therefore, higher σ value reduces the ideal power. If the actual power remains the same, the figure of merit may decrease. Usually, higher σ value also reduces the actual power, with the FM increased.
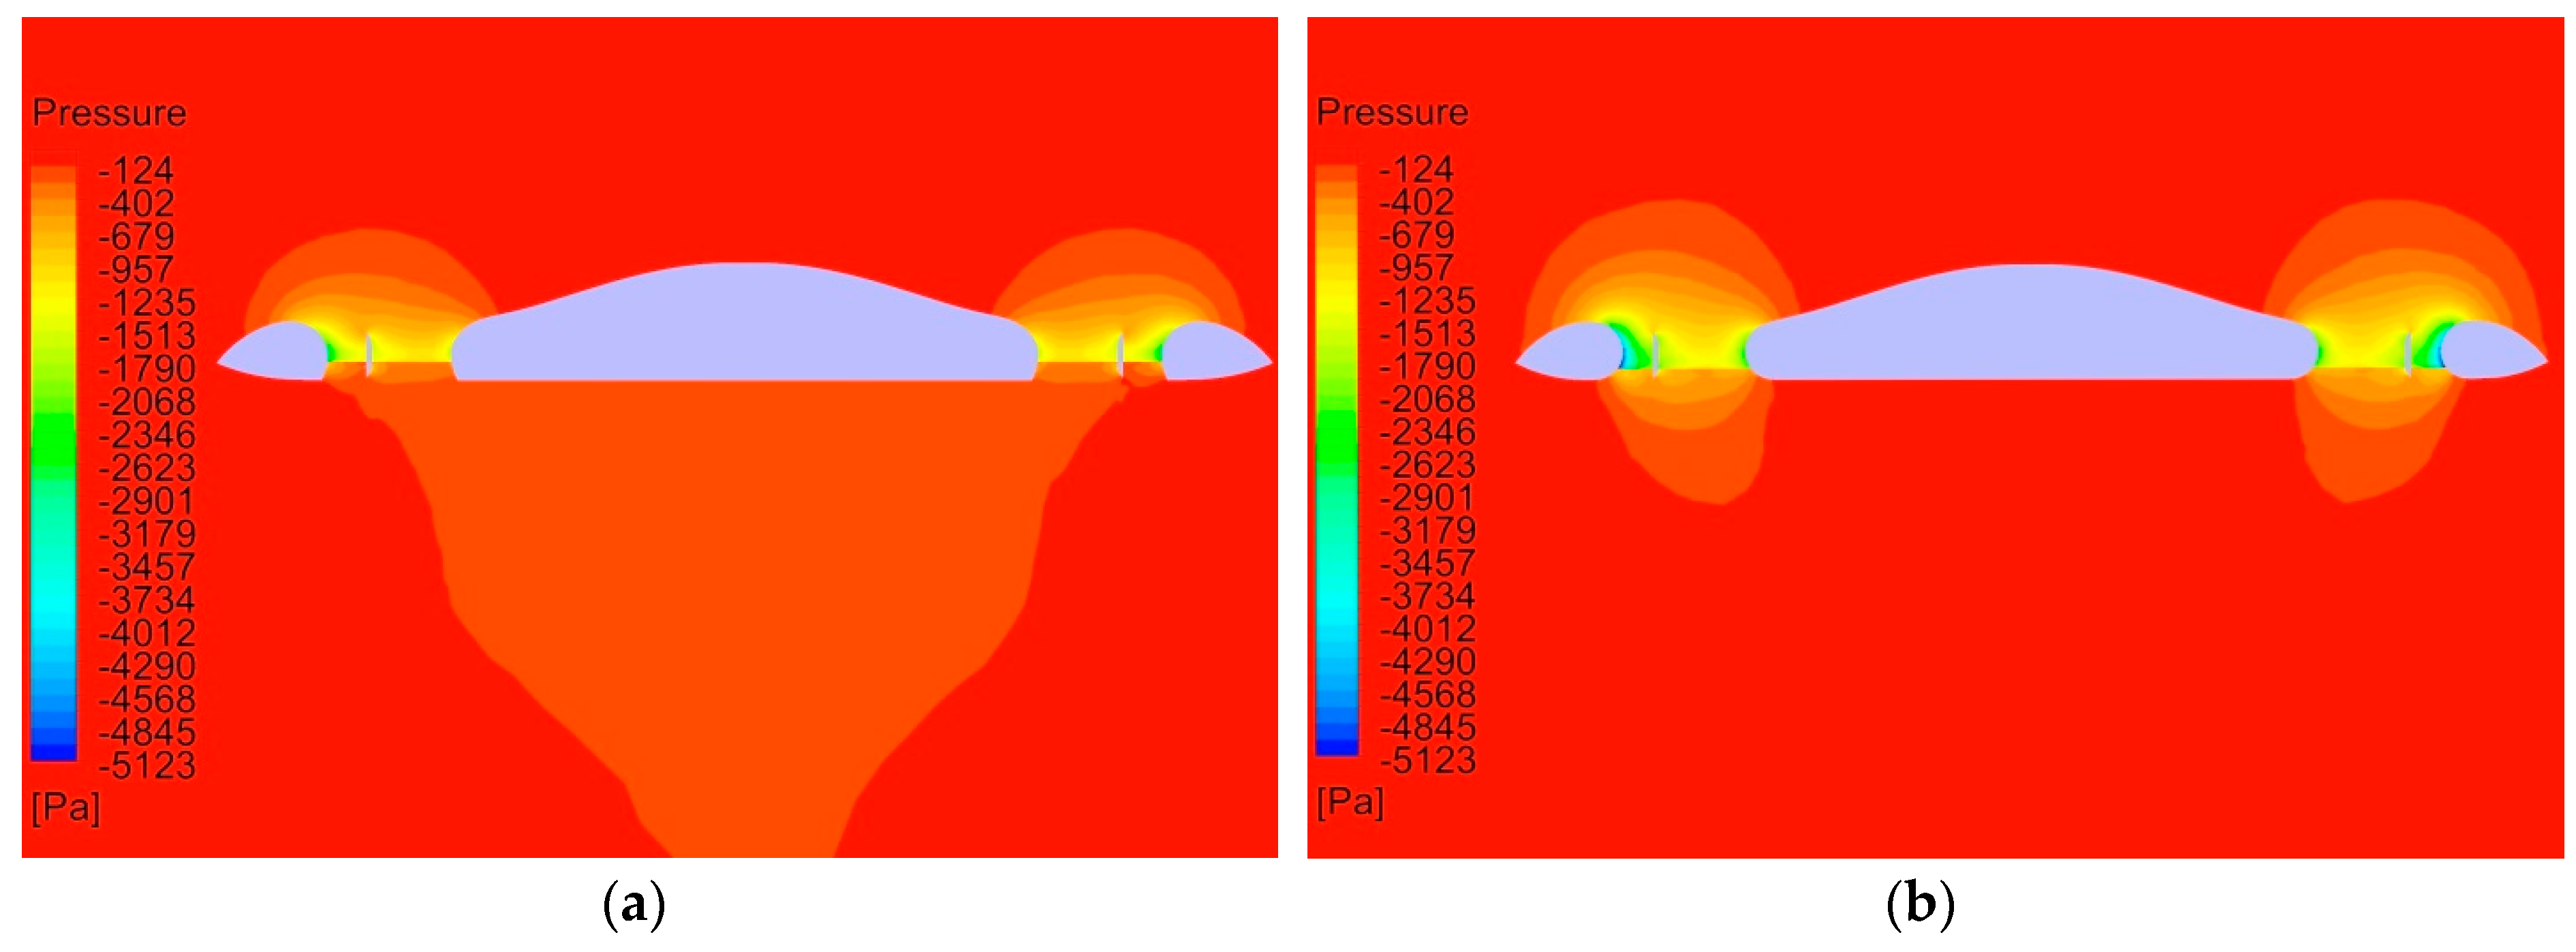
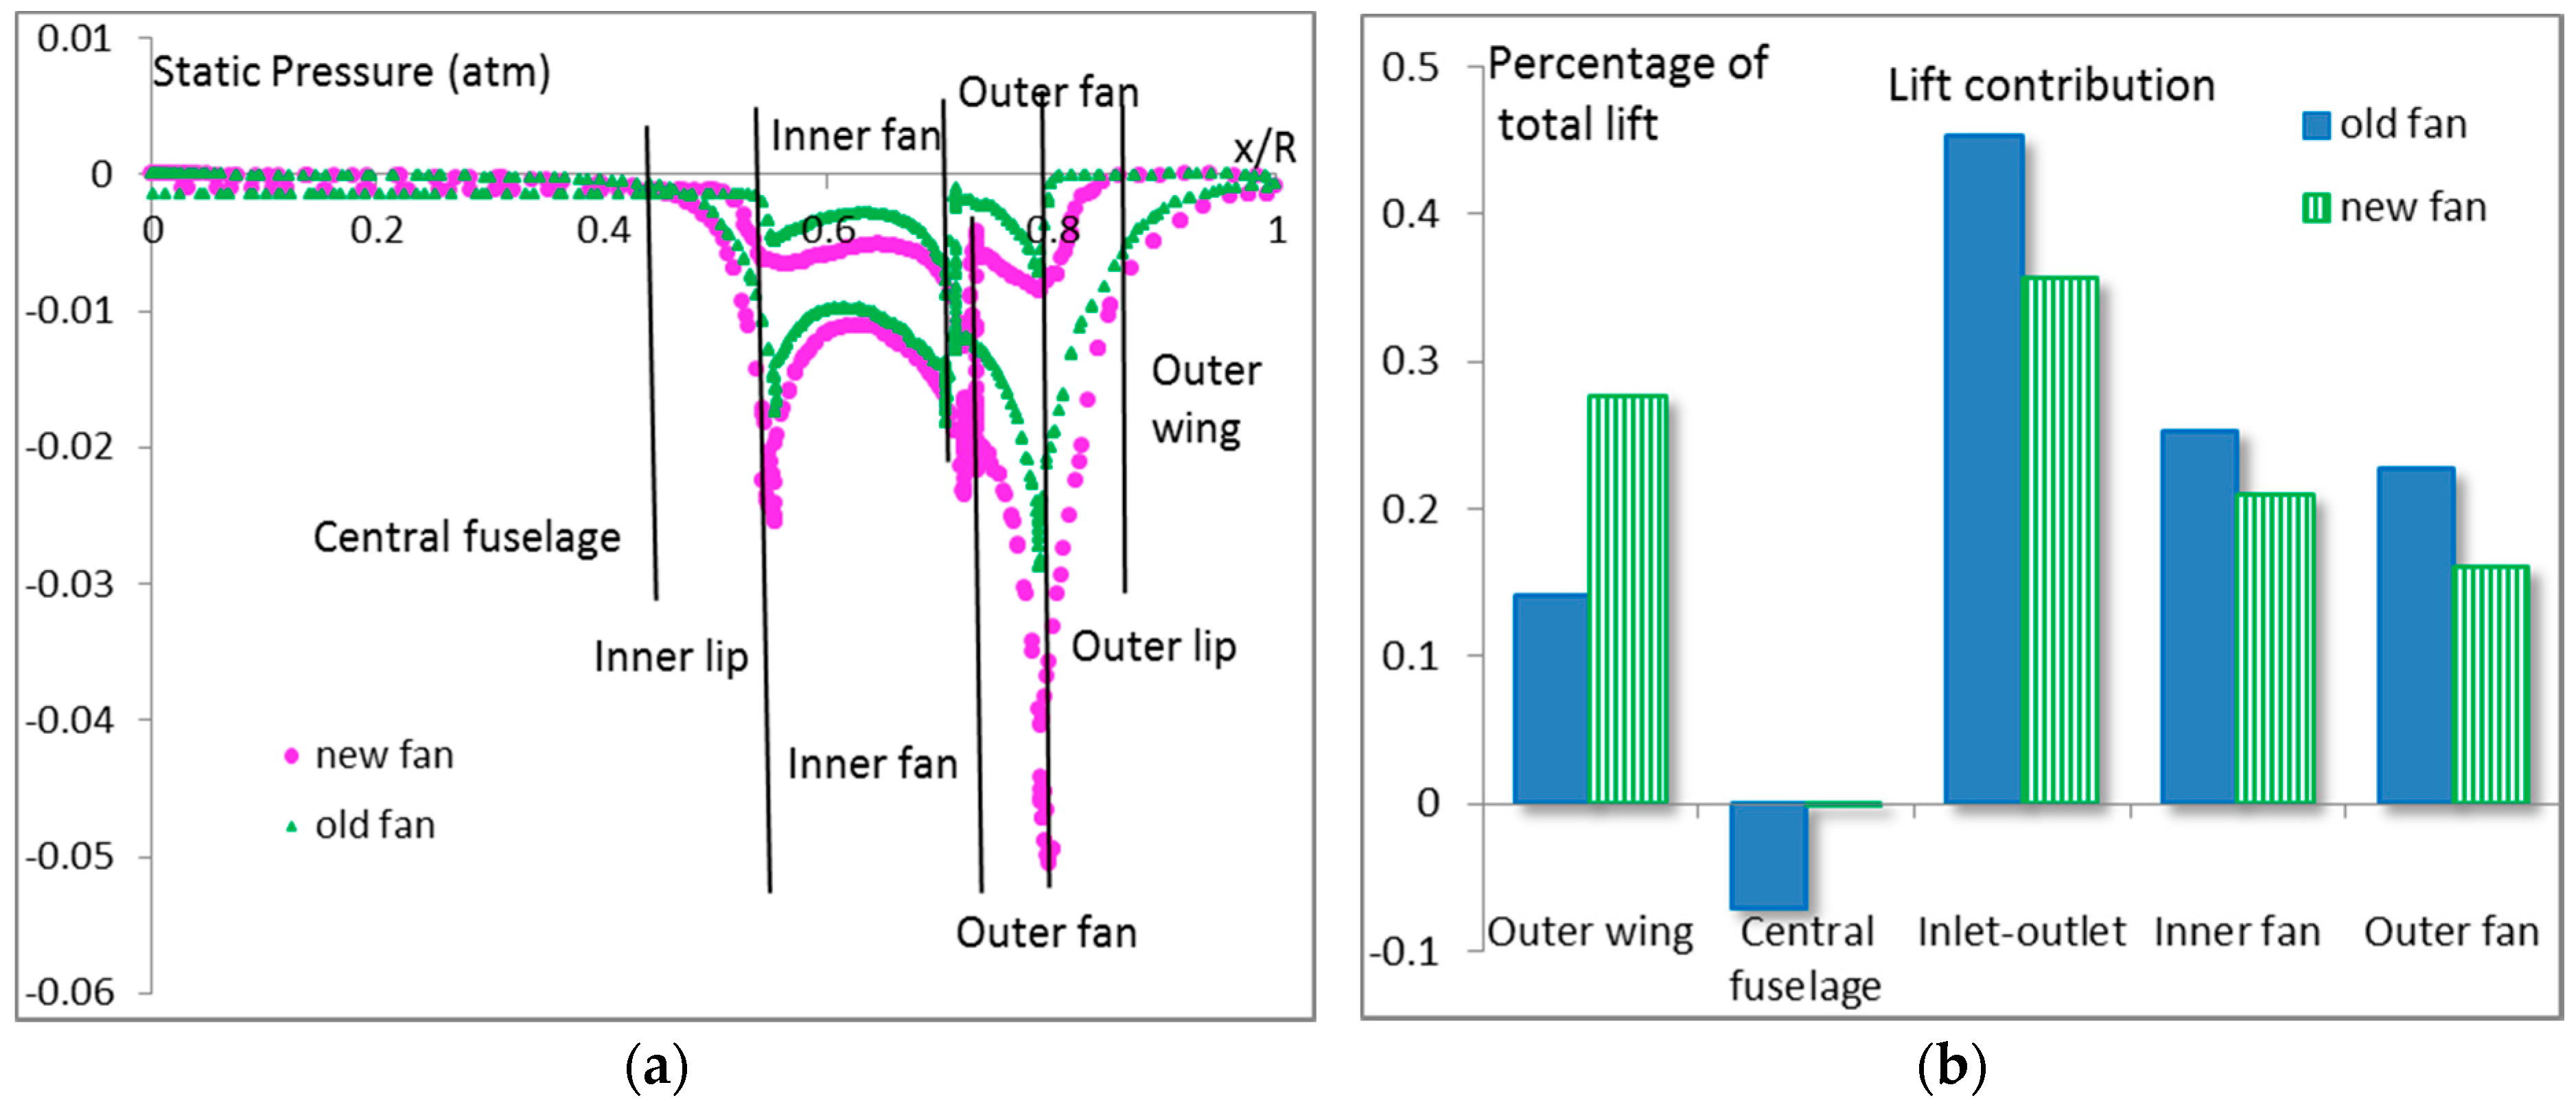
The reasons why the semicircle duct walls and the lower position of fans in the diffuser area promoted lift efficiency are probably due to lower pressure in the annular duct and lower thrusts directly from the fans. As shown in Figure 6, when compared with the original fans, as the diffusion ratio σ increased, the downstream flow from the duct became much more diffused. The pressure in the duct became lower, while the pressure beneath the central fuselage became higher (Figure 6). It is clear in Figure 7 that the pressures on the upper and lower surfaces of the fans and the duct walls are much lower in the new fan configuration.
The low pressure in the duct resulted in low pressure on the top surface of the outer wing (Figure 7a). As shown in Figure 7b, compared with the original fan, less lifts came from the fans and duct walls (inlet–outlet), but more from the outer wing and less lift loss from the central fuselage. The lift from the outer wing almost doubled due to the lower pressure on the upper surface of outer wing. The negative lift beneath the central fuselage due to the low pressure was almost eliminated because of the increased pressure beneath the fuselage (Figure 6 and Figure 7). When the lifts directly from the fans decreased, if the lift to drag ratio did not change, the drags on the fan blades also decreased, thus leading to lower actual power and higher FM and power loading.
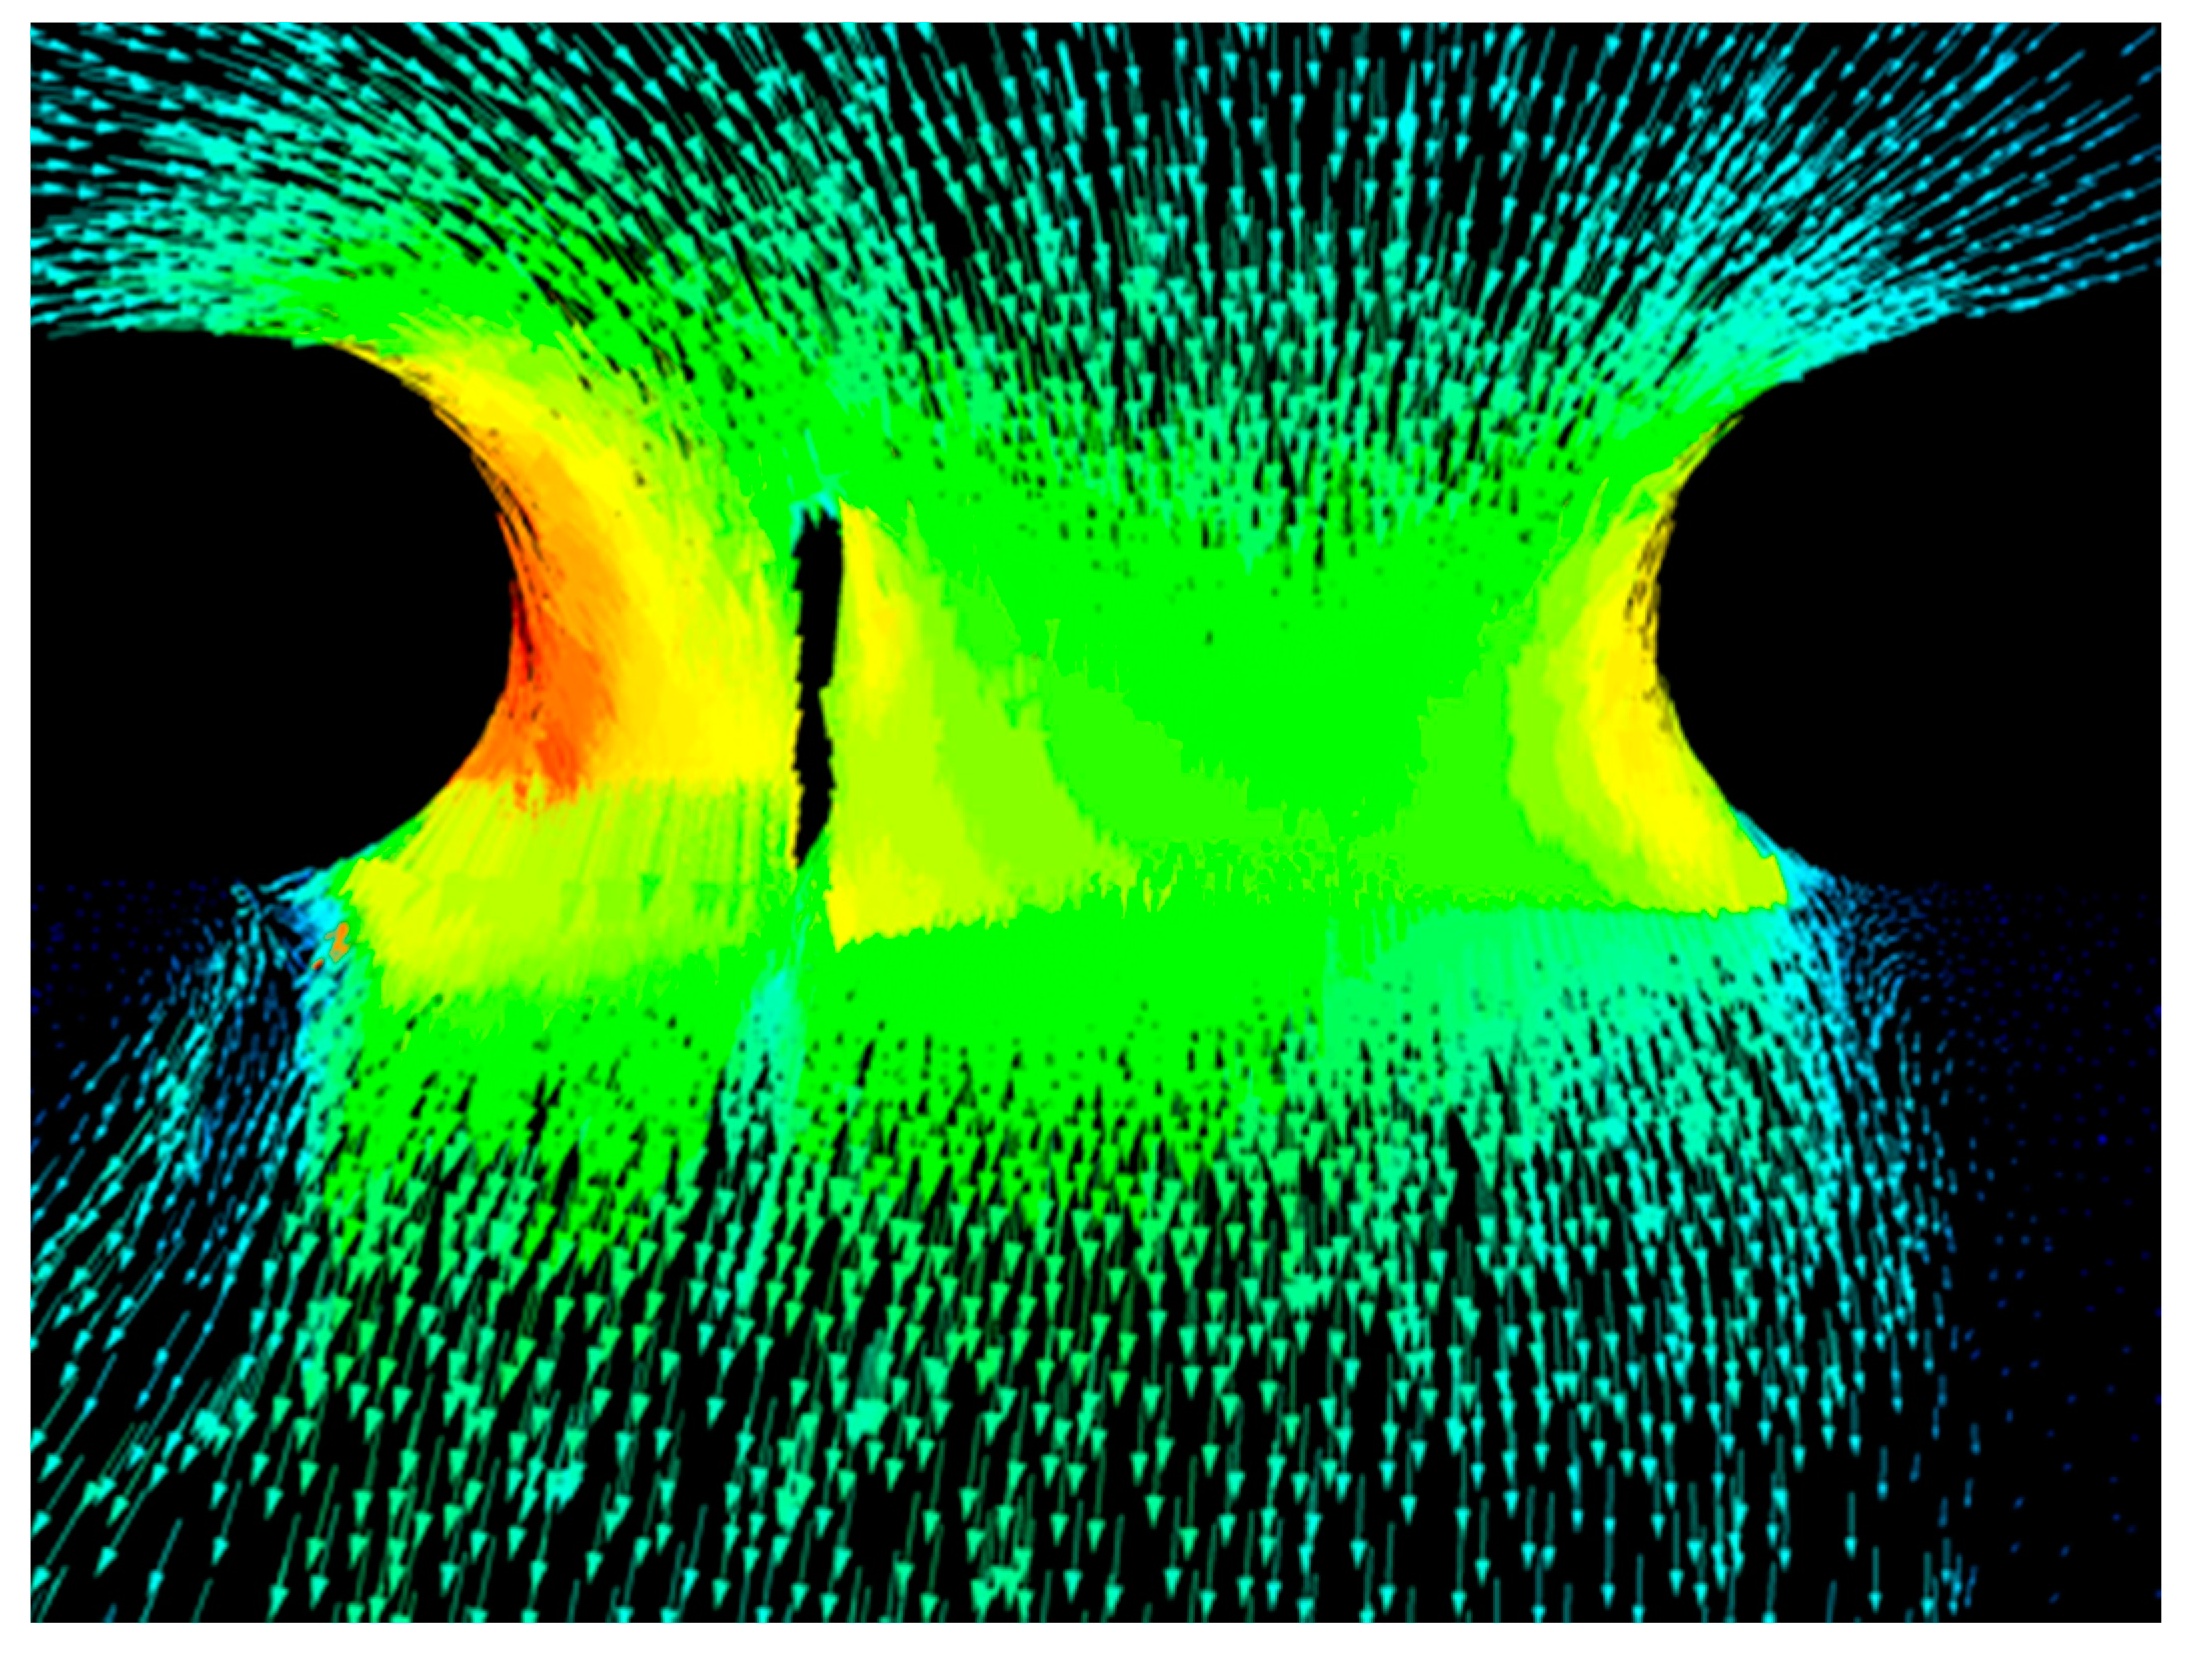
The key is the low pressure in the duct induced by the greater diffuser expansion effect. As shown in Figure 8, the separation of flow from the duct walls happened very late, with the actual final diffuser angle at about 80° for the outer duct wall and 60° for the inner duct wall, by the average of 70°, much larger than the conventional optimum diffuser angle of 10° [12]. The actual large diffuser expansion angle produced a much diffused downstream flow with a big diffusion ratio σ. As the inlet lip radius and outlet diffuser angle have been maximized by the semicircle duct walls and the other parameters have also been optimized, the lift efficiency probably has achieved the highest level.
The results were unexpected. In traditional ducted fans or shrouded rotors, the fans or rotors are usually placed at the narrowest throat position and the diffuser angle cannot be too large to avoid flow separation from the duct or shroud wall. In an investigation on a micro air vehicle (MAV) scale shrouded rotor by varying the diffuser expansion angle, diffuser length, inlet lip radius, and blade tip clearance, the results show that a small diffuser angle of 10° is more efficient than 20° or 0° [12].
The advantage of the lower location of fans at the diffuser area only happened in the perfect semicircle duct walls. For the original fan configuration, although even most of the area of the duct walls was part of a circle, the lower location of fans did not result in higher lift efficiency. In order to explore the reason, a conventional Venturi type of the ducted fan was simulated as shown in Figure 9. The separation happened early at the inner wall of the duct even at a small diffuser angle. The lower location of the fan in the diffuser area did not improve the separation and diffusion. As shown in Table 3, the power loading and σ value of the fan at the throat are higher than that of the fan at the diffuser. This explains why most ducted fans are located at the throat.
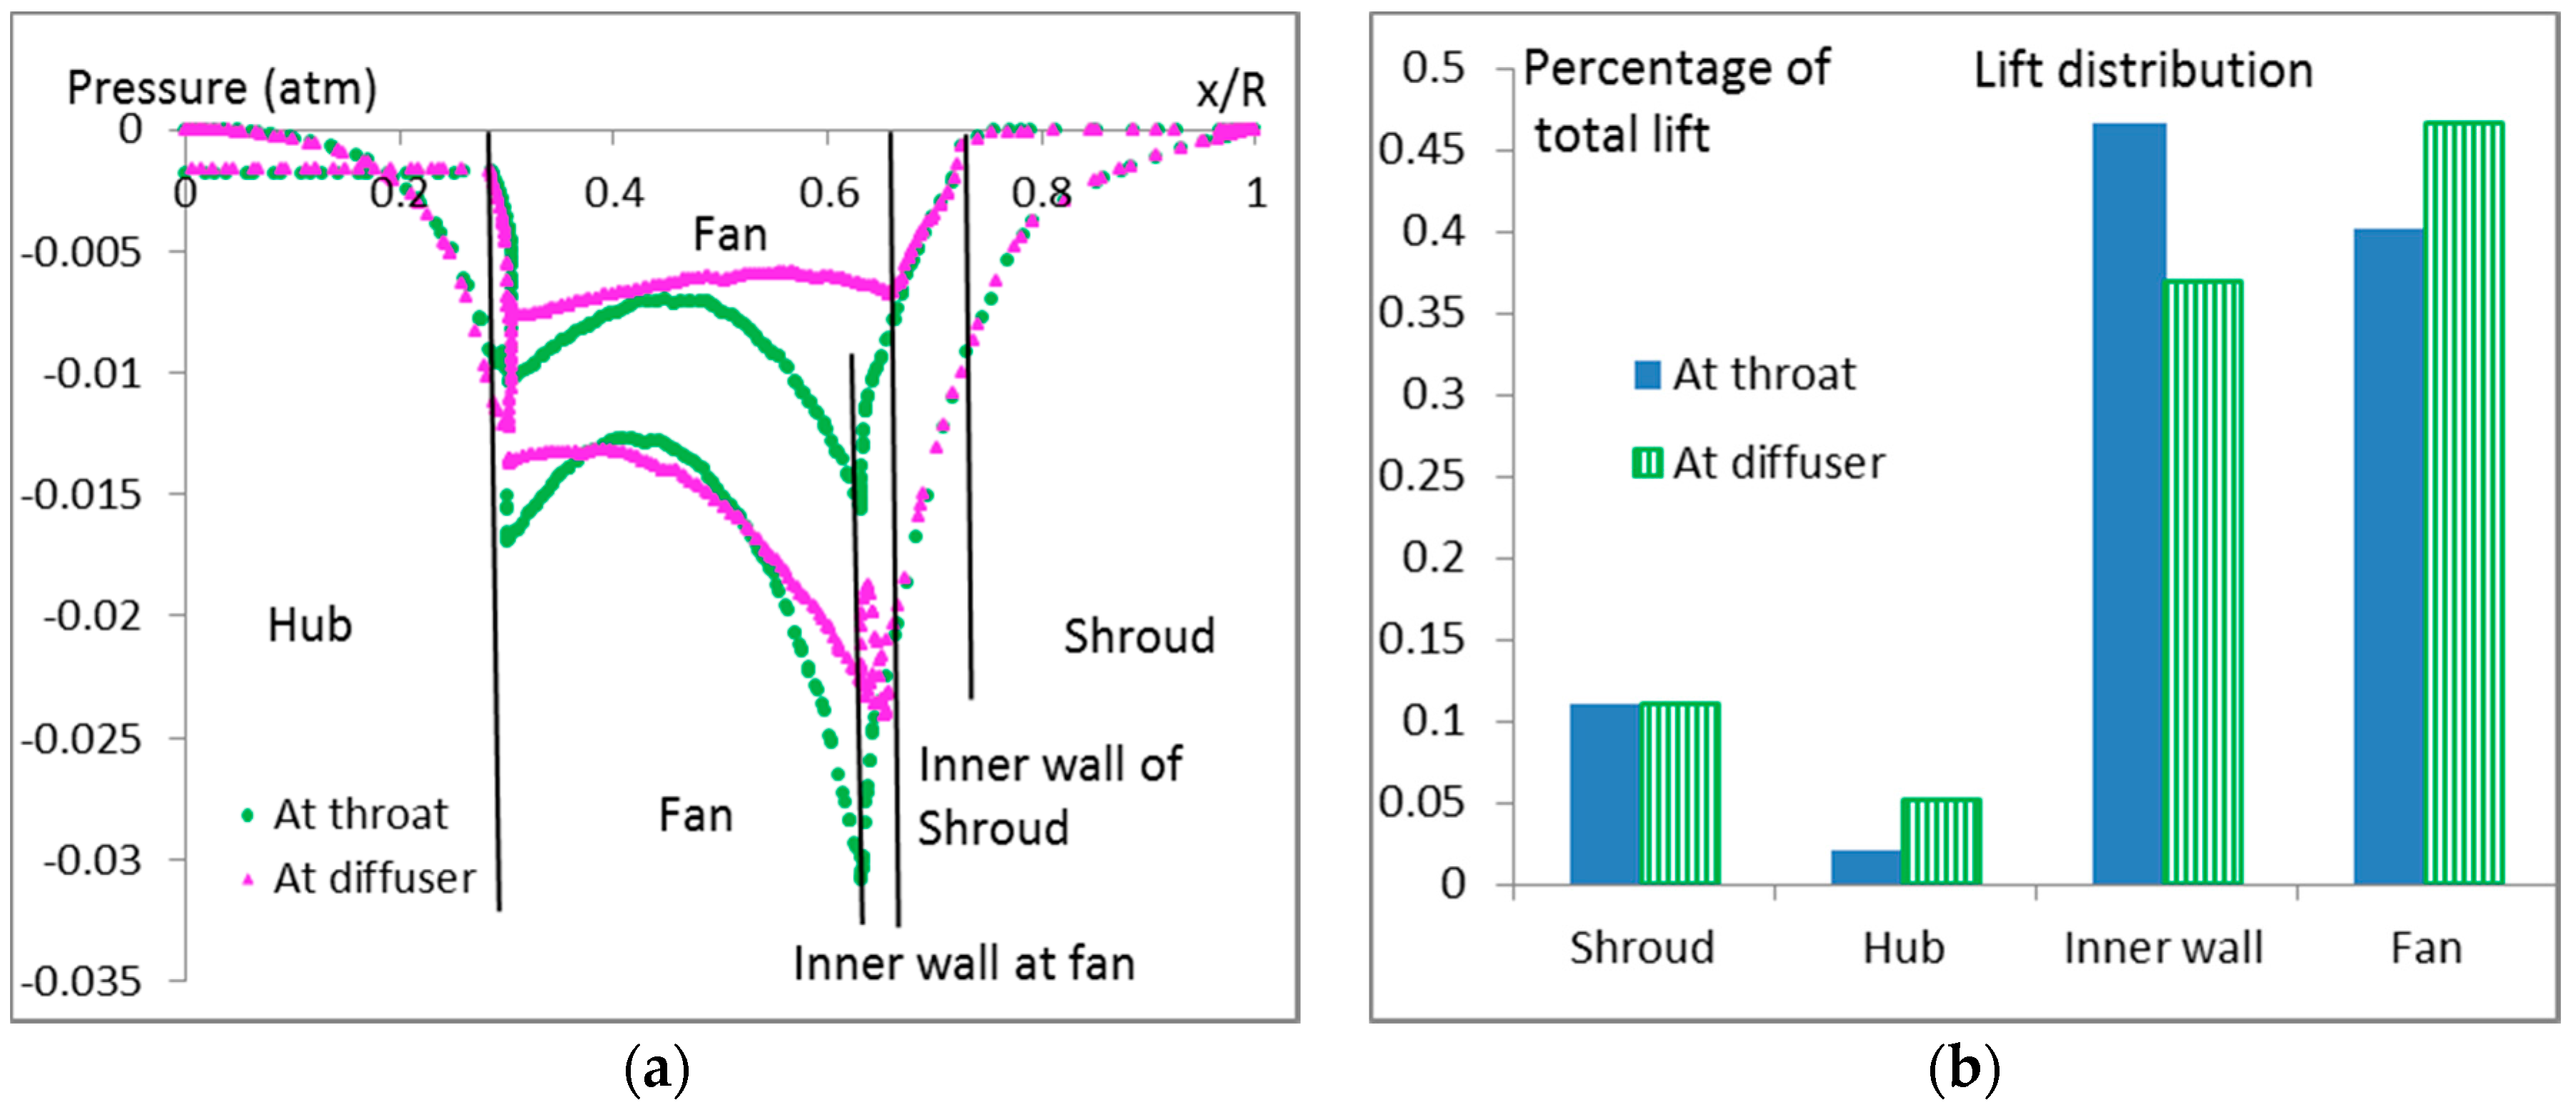
It can be seen from Figure 10 that, when the fan was moved to the diffuser area, the average pressure in the duct and on the surfaces of fan blades did not become lower and the pressure differences between the upper and lower surfaces of blades became even greater, leading to higher direct fan lift, which increased the drag on fan blades and the actual power. The pressure on the top surface of the shroud was not decreased to yield more lift (Figure 10). The early separation of flow from the hub (Figure 9) reduced the diffuser expansion effect while lower fan location could not improve it.
Therefore, only semicircle duct walls could prevent the flow from early separation and generate a strong diffusion effect, which made the pressure in the duct and on the upper surface of the outer wing very low, leading to less required fan lift and power. The value of σ reached the maximum with the semicircle duct walls because no diffuser angle can be greater than 180°.
For a conventional circular ducted fan with a ball hub and a semicircle duct wall, the separation of flow from the hub happens easily with a low diffusion ratio. Therefore, the semicircle duct walls only work for annular ducted fans with a very large hub.
5.2. Transition Characteristics
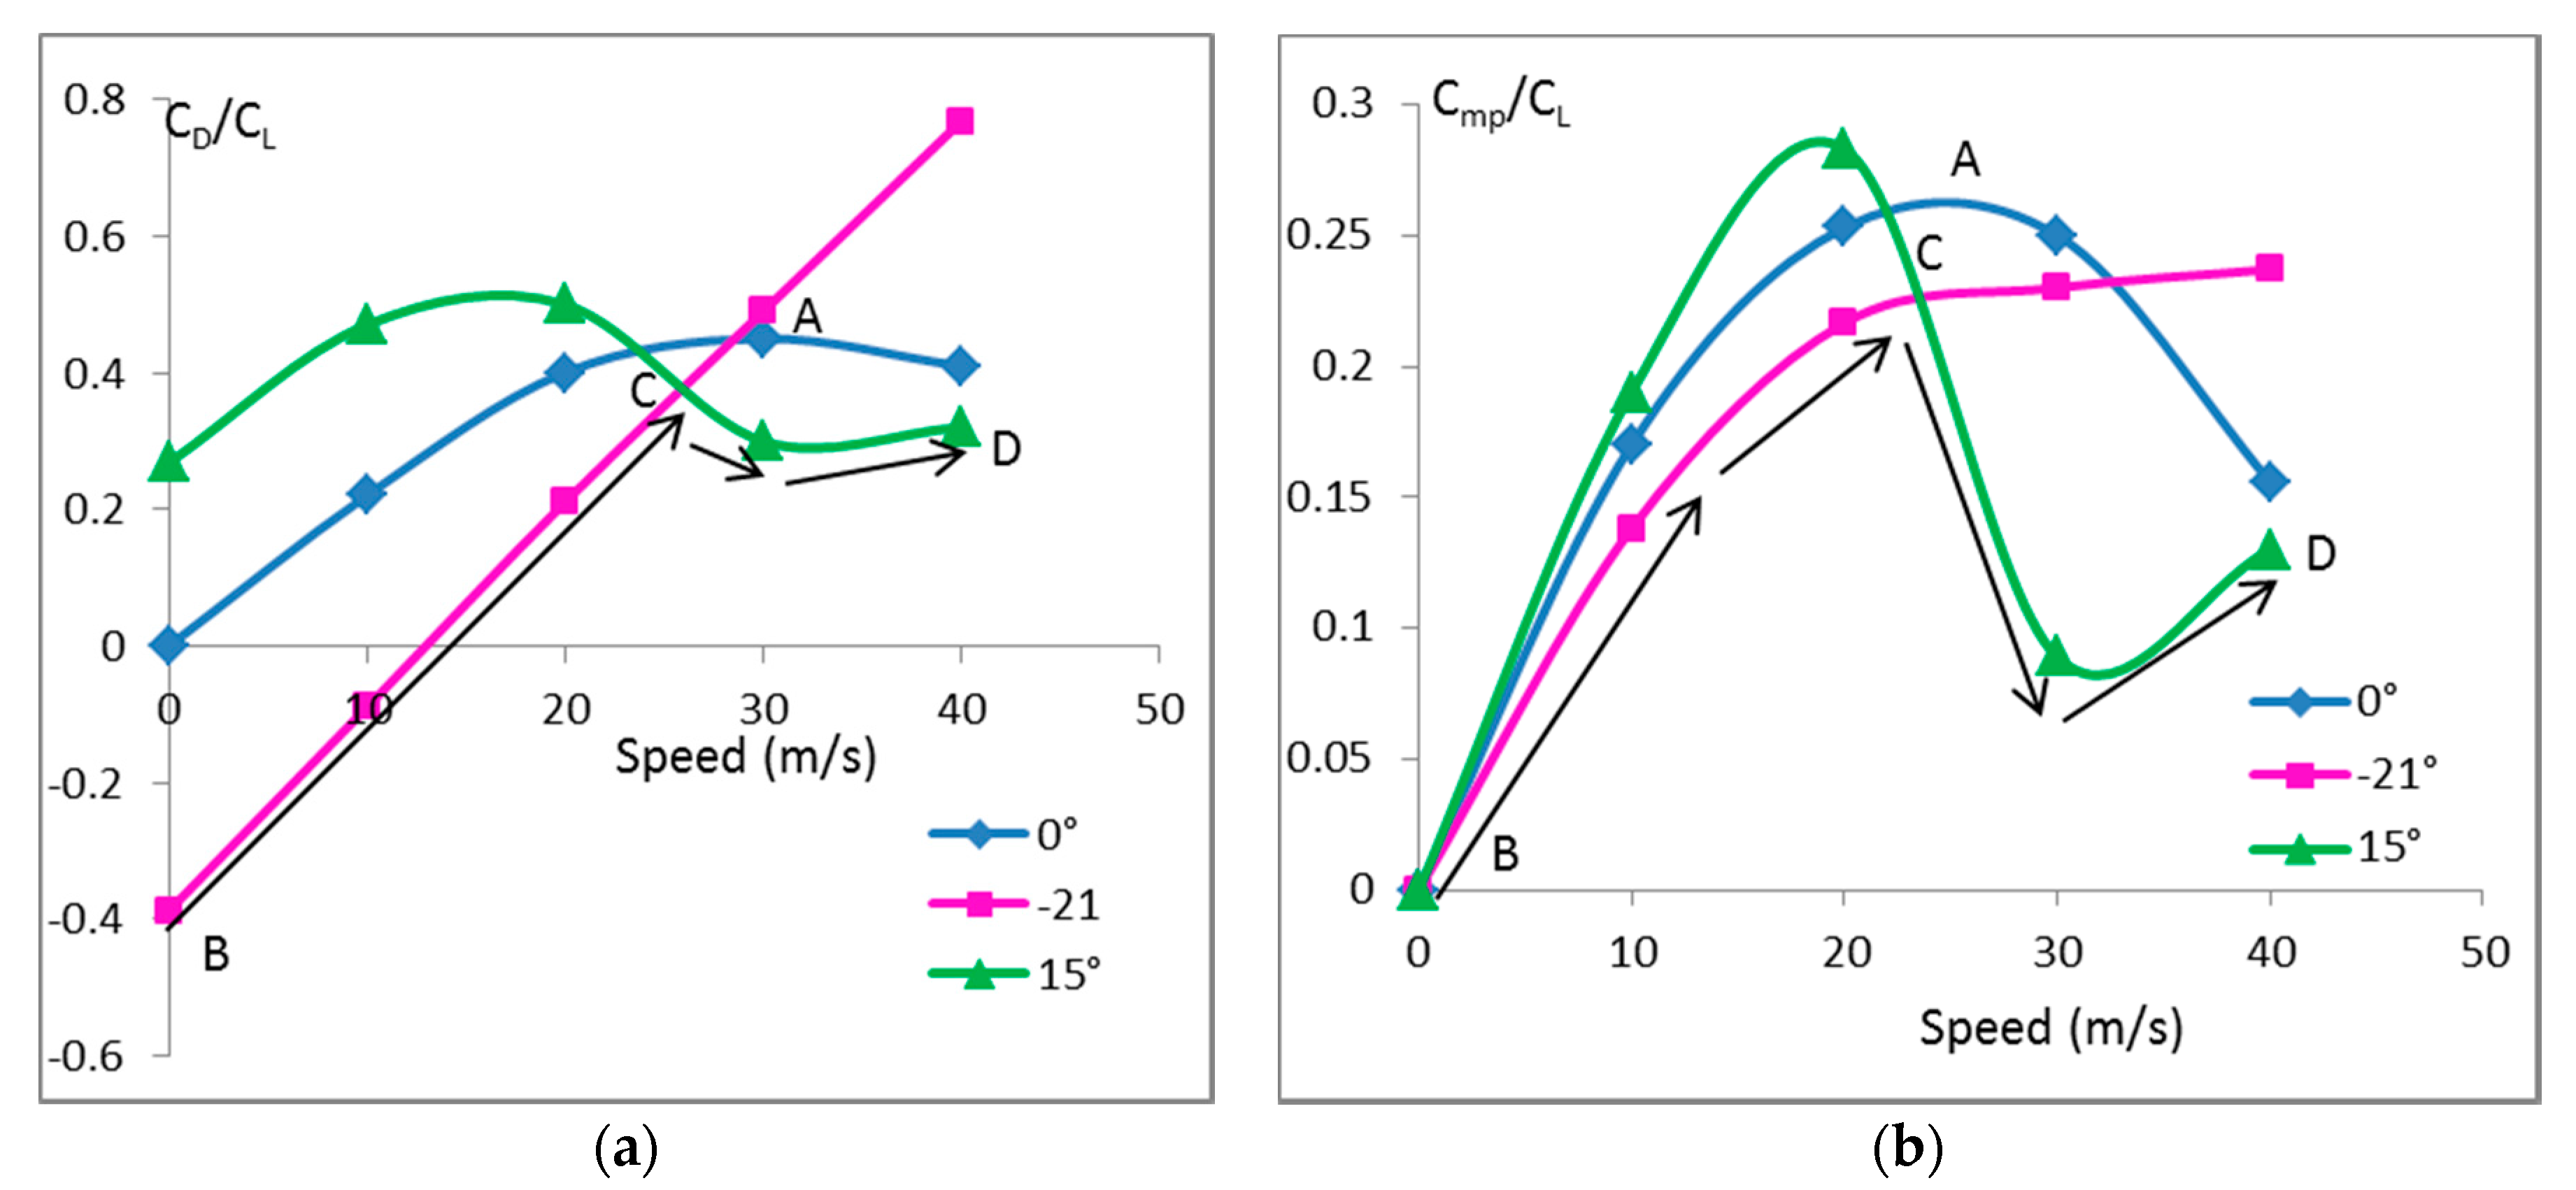
After the improvement of hovering efficiency, the transition characteristics of the new fan configuration were investigated. The drag, pitching moment and rolling moment were measured during the transition simulations while the rotational speeds of fans were adjusted to maintain the lift equal to the weight. The coefficients were calculated on the total lift, drag and moment, including the aerodynamic forces and forces generated by the lift fans. The reference area is the total disc area of diameter of 18 m. The results showed that the characteristics were deteriorated (Figure 11). The yawing moment remained small after being eliminated by the counter rotating fans in hover mode and is not shown in Figure 11. The momentum drag and nose up pitching moment increased significantly at all angles of attack, with the maximum drag increased from an original 0.397 [4] to 0.45 at AOA of 0° (Figure 11a, Spot A). Even with the recommended strategy to start transition from AOA of −21° along the arrows from B to C to D in Figure 11, the peak of drag also increased from an original 0.29 [4] to 0.38 (Spot C, Figure 11a) at the forward speed of about 25 m/s. The peak of pitching moment also increased from 0.155 [4] to 0.22 (Spot C, Figure 11b), which needs upward thrusts from the jet nozzles of 0.55 of the aircraft weight to be eliminated (Figure 12), much higher than the original 0.39. The total requirement for extra thrusts is 0.67 of the aircraft weight in transition.
The deterioration of transition characteristics is consistent with the phenomenon in helicopter design that high lift efficiency usually reduces the maximum forward speed of helicopter (“Whatever helps forward flight hurts hover, and whatever helps hover hurts forward flight.”) [1].
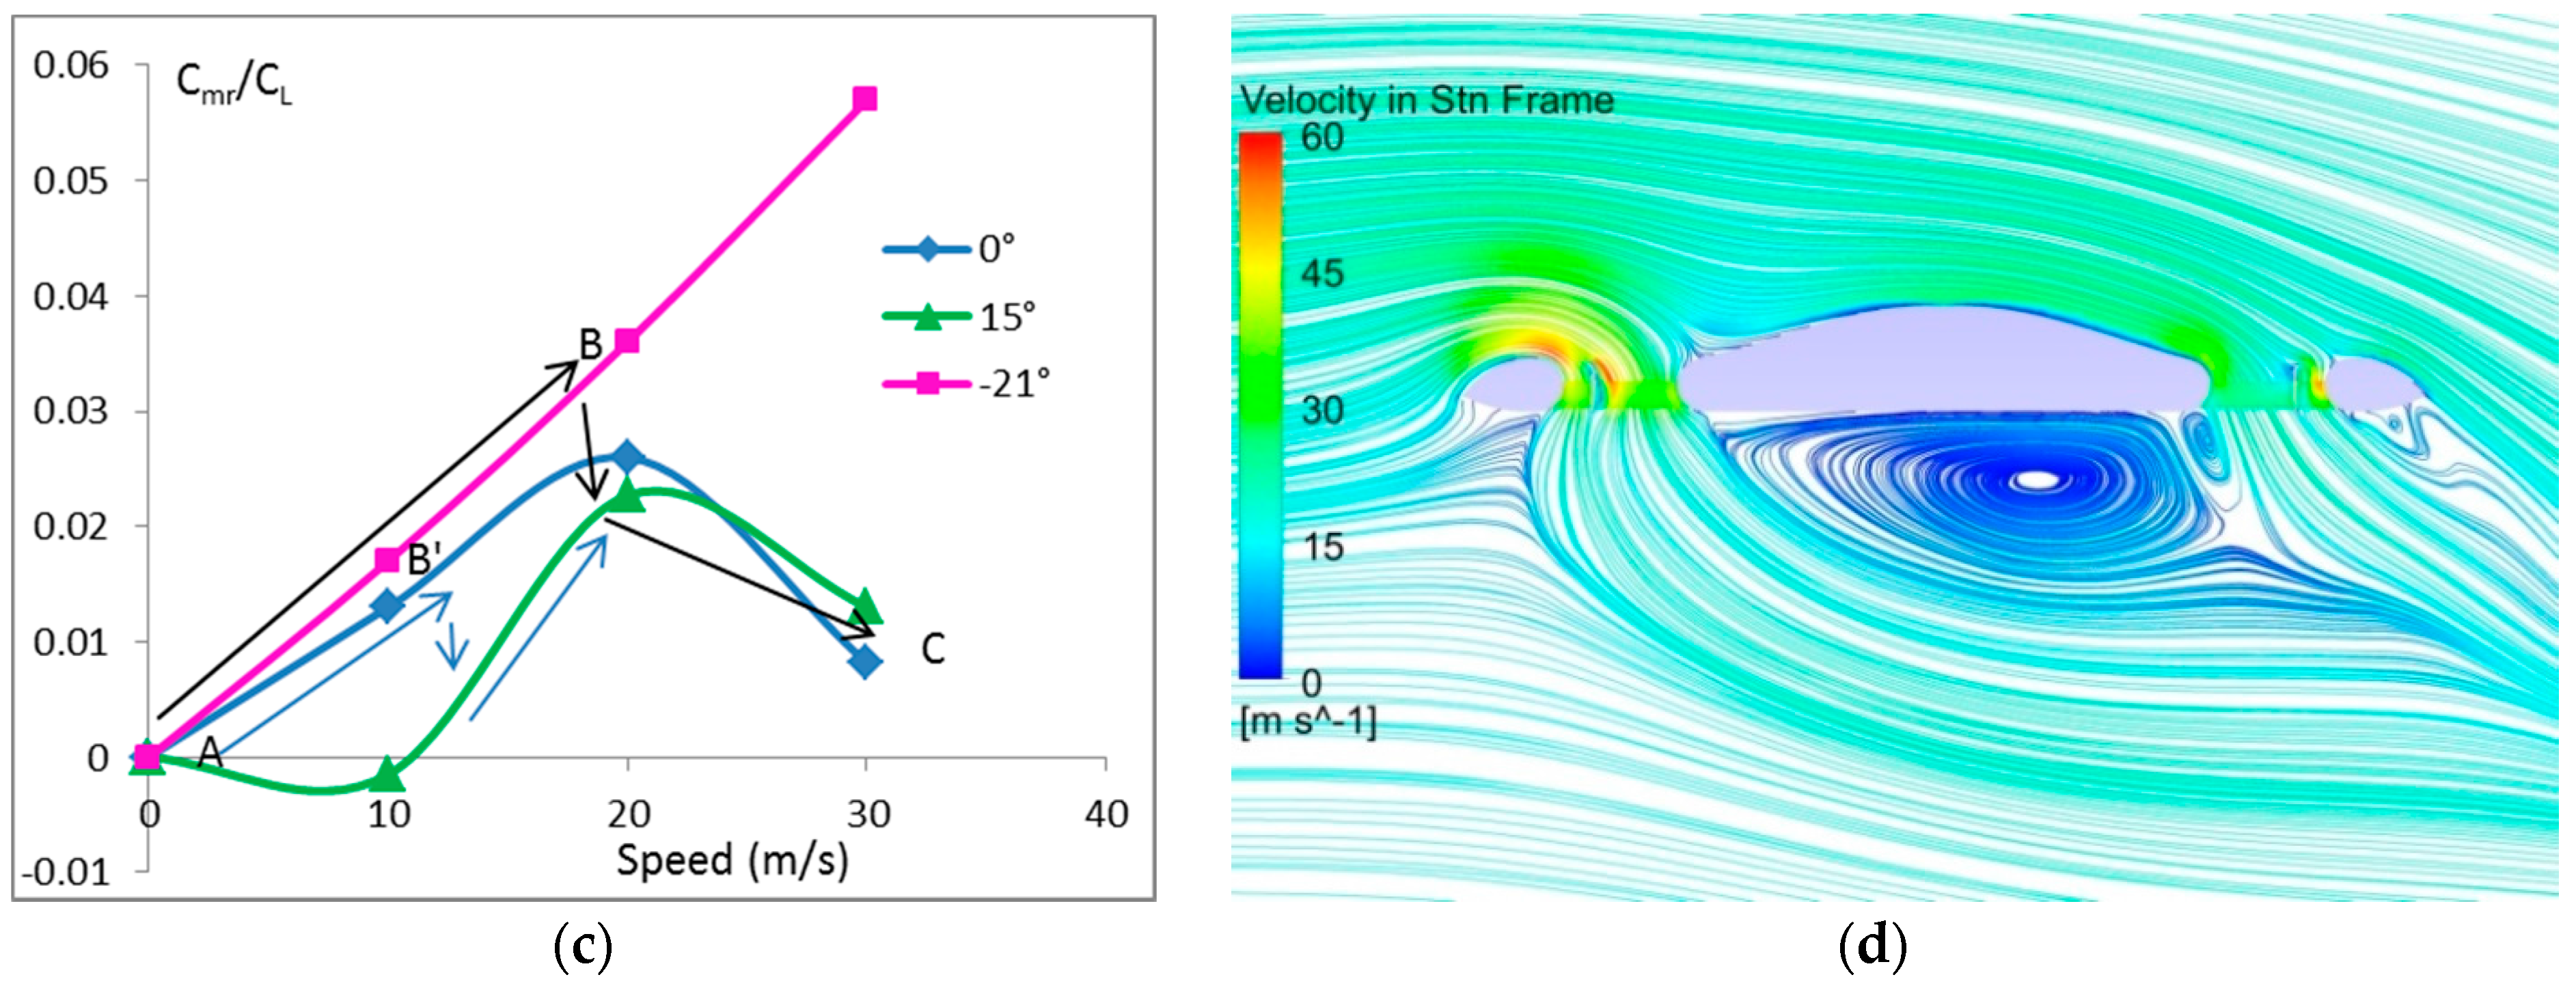
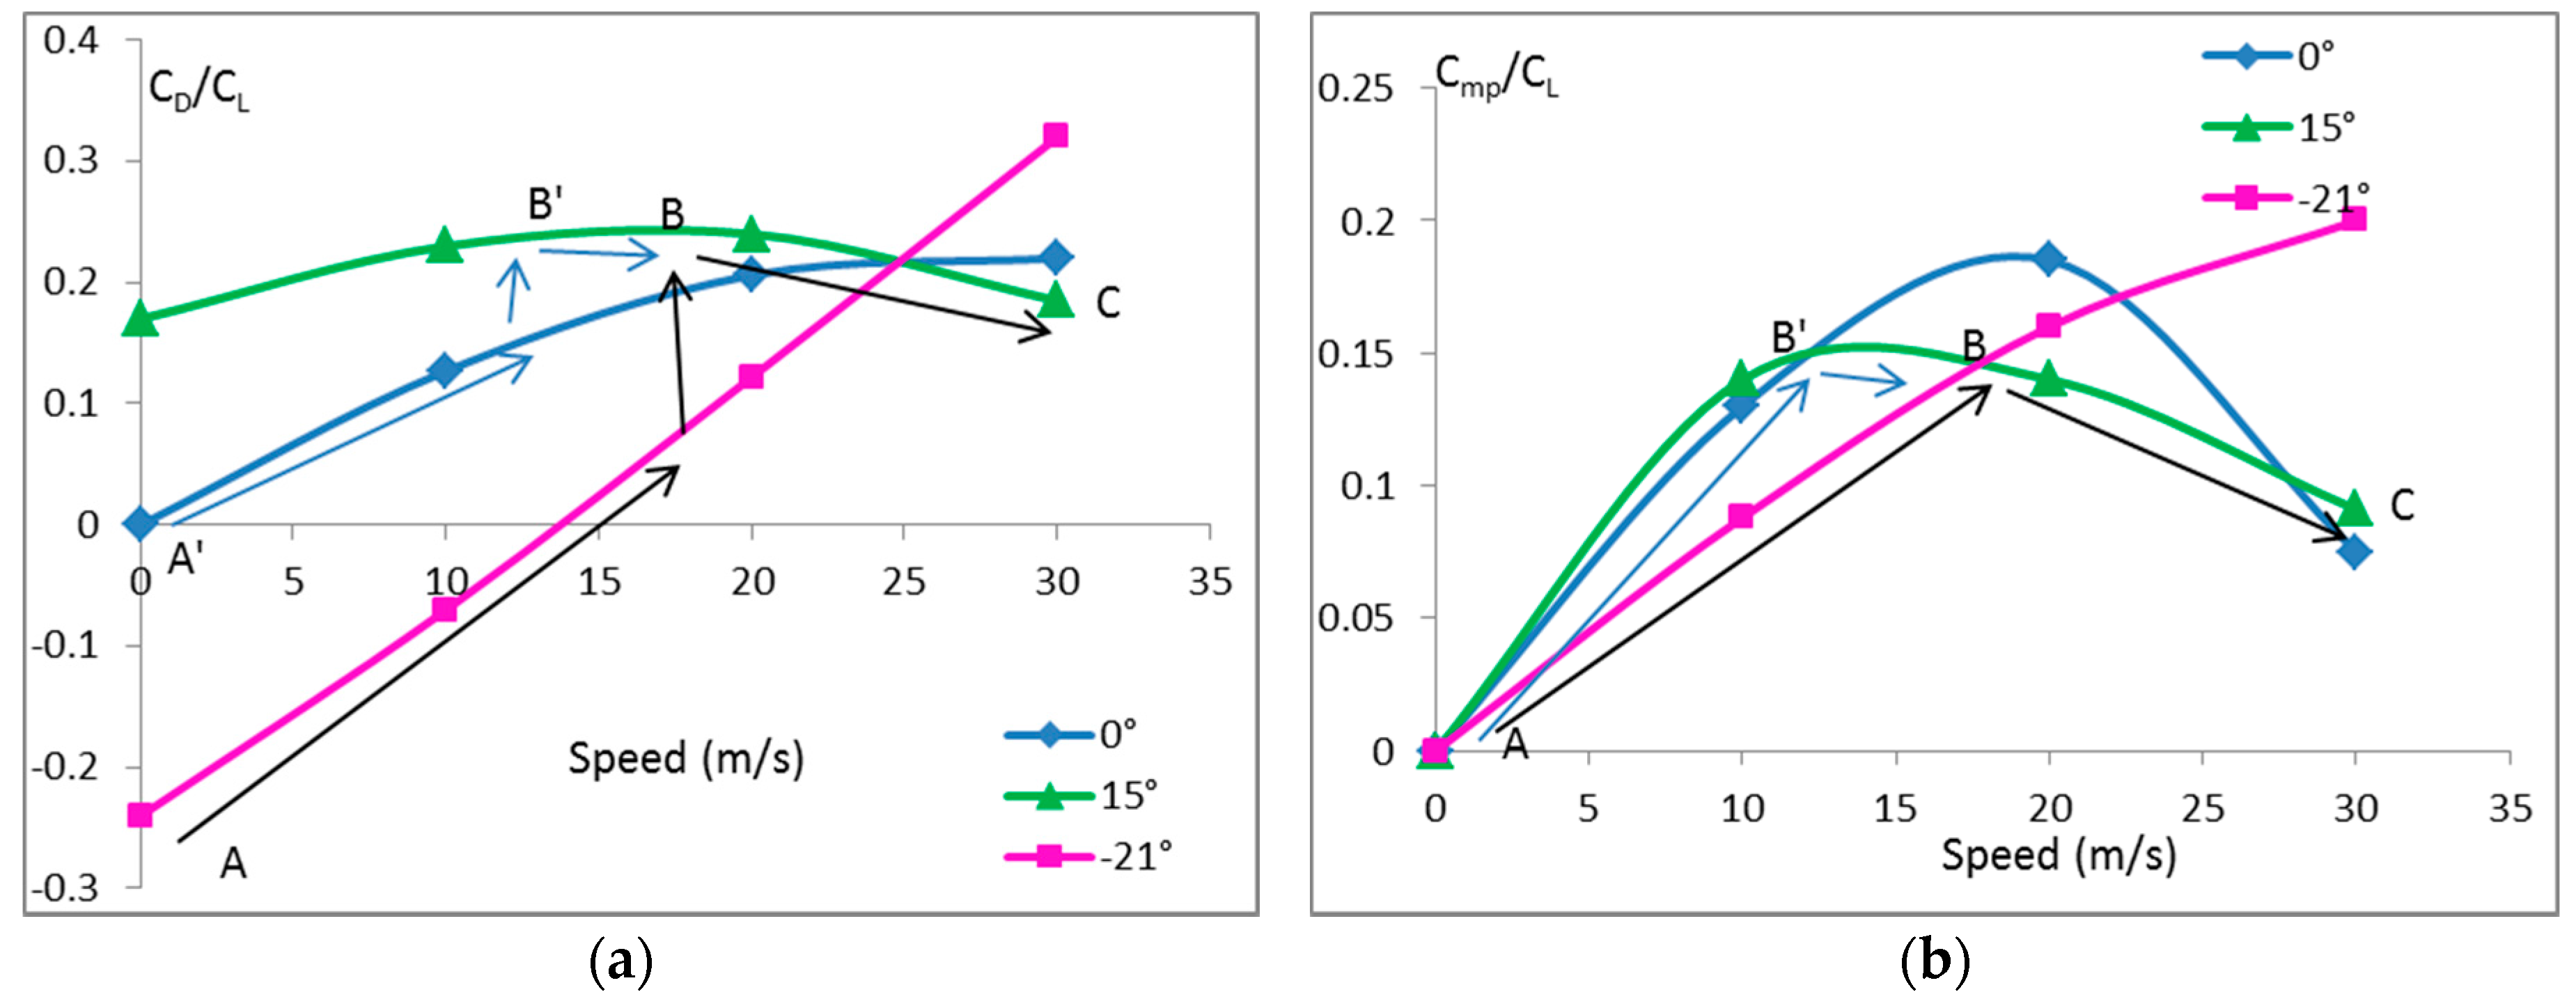
However, as the jet engines have to provide upward thrusts to eliminate the nose up pitching moment during the transition (Figure 12), the lift fan only needs to provide part of the total lift at the same time. When the jet engines provided upward thrusts of 0.37 of the aircraft weight during the transition, the transition characteristics were improved as shown in Figure 13. The rotational speeds of fans were adjusted to maintain the lift equal to 0.63 of the aircraft weight during the transition. The lift, drag and moment coefficients were calculated on the total lift, including the aerodynamic lift and those generated by the lift fans. As shown in Figure 13, the starting transition from AOA of −21° still reduced the peak of drag and pitching moment (black arrows), but the advantage become quite small compared to starting transition directly from 0° (blue arrows). Therefore, starting from −21° is not very necessary. Starting the transition directly from 0° reduces the complexity of attitude control.
As shown in Figure 13a, with the aid of jet lift, the peak of momentum drag was significantly reduced from 0.38 to 0.25 at spot Bʹ. The peak of pitching moment was also reduced from 0.22 to 0.15, which needs upward thrusts of 0.39 of the aircraft weight to be eliminated. The peak of rolling moment was only 0.023 (Figure 13c, Spot Bʹ), which needs differential upward thrusts of 0.057 of aircraft weight to be eliminated. When the aircraft reaches the speed of 30 m/s, it can close the duct to start aerodynamic flight at AOA of 15° with 30% of the lift directly from the vectored jet thrusts.
The transition procedure should be like the following along the arrows from Aʹ or A to Bʹ to C (Figure 13): at first, the aircraft rises from the ground and hovers in the air; then, the forward jet thrusts push the aircraft to speed up; after it reaches the speed of about 5 m/s and the nose up pitching moment becomes significant, the nozzles of jet engines turn downward to eliminate the pitching torque and provide part of the lift; when the speed reaches 12 m/s, then the attitude of aircraft is changed to AOA of 15°; the duct will be closed to start aerodynamic flight after the speed reaches 30 m/s. With the maximum upward thrust of 0.39 and forward thrust of 0.25 at spot Bʹ, total extra thrusts of 0.5 of the aircraft weight are enough for a successful transition. As the rotational speeds of the lift fans were lowered during the transition with the aid of jet lift (Table 4), the power required by the lift fan at Spot Bʹ was also low (<0.2 of the aircraft weight). Thus, a total thrust to weight ratio of 0.7 would be enough for all the requirements, including the maximum cruise speed of 0.75 Mach based on aerodynamic drag prediction [2,4]. With the adjusted strategy to perform transition, the requirements of thrust to weight ratio remain the same as the original configuration, but with lift efficiency increased in hover mode.
The transition mode is the most inefficient period in a full flight with low forward speed and high power. However, since the transition phase only occupies a very short period of time with the speed up from 0 to 40 m/s, this is acceptable. The high efficiency in both hover and cruise flight ensures the high efficiency of the whole flight process. Since low speed patrol (0–40 m/s) is very inefficient for the annular lift fan aircraft due to the high momentum drag and pitching moment, this job should be done by helicopters.
6. Conclusions
The configuration of the annular lift fan was further optimized using the ANSYS Fluent 17.0 software in the present study to achieve probably the highest lift efficiency. The inlet lip radius and diffuser angle were maximized by applying complete semicircle duct walls. The location of the lift fan was moved from the throat to the diffuser area. A thinner blade of 2% thickness of the chord length was used. The results showed that the diffusion ratio σ was greatly increased and the pressures inside the duct and on the top surface of the outer wing were greatly decreased. The lowered pressures increased the lift from the outer wing, thus reducing the required thrust directly from the lift fan, leading to lower power and higher lift efficiency. The highest lift efficiency achieved was FM of 0.772 with power loading of 9.03 lbs/hp without ground effect, very close to the theoretical limit (Figure 1). When the distance to the ground was 10 m, the figure of merit reached 0.822 with power loading of 9.62 lbs/hp.
The effect of lower fan location in the duct only worked with the semicircle duct walls. For conventional Venturi type of duct walls, lower position did not improve lift efficiency. This explains why fans are usually located at the throat position. The reason is that the conventional ducted fan at a lower location could not generate lower pressure in the duct and on the top surface of the shroud because the diffusion effect of conventional duct is not strong enough. The half circle duct walls probably generate the strongest diffusion effect. This is a new discovery about annular ducted fans.
The transition characteristics of the new configuration of the lift fan were deteriorated with higher momentum drag and pitching moment, compared with the original one. This is because of the contradiction of hover and forward flight. The deteriorated characteristics require extra jet thrusts of 0.67 of the aircraft weight to overcome the drag and eliminate the pitching torque. The transition characteristics can be improved with the vectored jet thrusts providing 37% of the lift during the transition, since upward thrusts of 0.39 of the aircraft weight at the nozzles are needed to eliminate the nose up pitching moment. With the aid of upward jet thrusts, the peak of momentum drag, pitching moment, and the transition speed to aerodynamic flight were lowered. The maximum extra thrusts required for the transition became 0.5 of the aircraft weight, the same as the original configuration.
With the new strategy, the negative −21° AOA start-up is unnecessary. The aircraft can directly start transition from 0° and change the attitude to 15° when the speed reaches 15 m/s, and then close the duct at the speed of 30 m/s to begin aerodynamic flight. The new strategy reduces the complexity of control of attitude in transition.
The new configuration of annular lift fan has the highest lift efficiency and acceptable transition characteristics, and has great potential for future VTOL transportation.
Author Contributions
Yun Jiang proposed the ideas, performed the CFD simulation and wrote the manuscript. Bo Zhang analyzed the data and provided software support.
Conflicts of Interest
The authors declare no conflict of interest.
References
- Prouty, R. Helicopter Aerodynamics Volume II; Eagle Eye Solutions, LLC.: Lebanon, OH, USA, 2009; pp. 3–4. [Google Scholar]
- Jiang, Y.; Zhang, B.; Huang, T. CFD study of an annular-ducted fan lift system for VTOL aircraft. Aerospace 2015, 2, 555–580. [Google Scholar] [CrossRef]
- Jiang, Y.; Zhang, B. Numerical optimization of hovering efficiency of an annular lift fan aircraft. Aerospace 2016, 3, 35. [Google Scholar] [CrossRef]
- Jiang, Y.; Zhang, B. Numerical study of transition of an annular lift fan aircraft. Aerospace 2016, 3, 30. [Google Scholar] [CrossRef]
- Leishman, G.J. Principle of Helicopter Aerodynamics; Cambridge University Press: New York, NY, USA, 2002; p. 65. [Google Scholar]
- Thouault, N.; Breitsamter, C.; Adams, N.A. Numerical and experimental analysis of a generic Fan-in-wing configuration. J. Aircr. 2009, 46, 656–666. [Google Scholar] [CrossRef]
- Diedrich, J.H. Summary of Model VTOL Lift Fan Tests Conducted at NASA Lewis Research Center; NASA TM X-71778; NASA Lewis Research Center: Cleveland, OH, USA, 1 Januray 1975.
- Hickey, D.H.; Kirk, J.V. Survey of Lift-Fan Aerodynamic Technology; NASA CR-177615; NASA Ames Research Center: Moffett Field, CA, USA, 1 September 1993.
- Prezedpelski, Z.J. Lift Fan Technology Studies; NASA Cr-761; National Aeronautics and Space Administration: Washington, DC, USA, 1967.
- Bevilaqua, P.M. Genesis of the F-35 joint strike fighter. J. Aircr. 2009, 46, 1825–1836. [Google Scholar] [CrossRef]
- Dyer, K.G. Aerodynamic Study of a Small, Ducted VTOL Aerial Vehicle. Master’s Thesis, Massachusetts Institute of Technology, Cambridge, MA, USA, 2002; pp. 31–49. [Google Scholar]
- Pereira, J.I. Hover and Wind-Tunnel Testing of Shrouded Rotor for Improved Micro Air Vehicle Design. Ph.D. Dissertation, Department of Aerospace Engineering, University of Maryland, College Park, MD, USA, 2008. [Google Scholar]
- Asmus, F.J. Design and development of the tip turbine lift fan. Ann. N. Y. Acad. Sci. 1963, 107, 147–176. [Google Scholar] [CrossRef]
- Xu, H.Y.; Ye, Z.Y.; Shi, A.M. Numerical study of propeller slipstream based on unstructured overset grids. J. Aircr. 2012, 49, 384–389. [Google Scholar] [CrossRef]
- Blocken, B.; Defraeye, T.; Koninckx, E.; Carmekiet, J.; Hespel, P. CFD simulations of the aerodynamic drag of two drafting cyclists. Comput. Fluids 2013, 71, 435–445. [Google Scholar] [CrossRef]
- Malipeddi, A.K.; Mahmoudnejad, N.; Hoffmann, K.A. Numerical analysis of effects of leading-edge protuberances on aircraft wing performance. J. Aircr. 2012, 49, 1336–1344. [Google Scholar] [CrossRef]
- Qu, Q.; Lu, Z.; Liu, P.; Agarwal, R.K. Numerical study of aerodynamics of a Wing-in-Ground-Effect craft. J. Aircr. 2014, 51, 913–924. [Google Scholar] [CrossRef]
- Al-Garni, A.Z.; Saeed, F.; Al-Garni, A.M. Experimental and numerical investigation of 65 degree Delta and 65/40 degree double-delta wings. J. Aircr. 2008, 45, 71–75. [Google Scholar] [CrossRef]
- Liu, Z.; Albertani, R.; Moschetta, J.M.; Thipyopas, C.; Xu, M. Experimental and computational evaluation of small microcoaxial rotor in hover. J. Aircr. 2011, 48, 220–228. [Google Scholar] [CrossRef]
- Menter, F.R. Zonal two equation k–ω turbulence models for aerodynamic flows. AIAA Pap. 1993, 93, 2906. [Google Scholar] [CrossRef]
- Menter, F.R. Two-equation eddy-viscosity turbulence models for engineering applications. AIAA J. 1994, 32, 1598–1605. [Google Scholar] [CrossRef]
- Simioni, N.; Ponza, R.; Benini, E. Numerical assessment of pneumatic devices on the wing/fuselage junction of a tiltrotor. J. Aircr. 2013, 50, 752–763. [Google Scholar] [CrossRef]
- Akturk, A.; Camci, C. Tip clearance investigation of a ducted fan used in VTOL Unmaned Aerial Vehicles—Part I: Baseline experiments and computational validation. J. Turbomach. 2014, 136, 021004. [Google Scholar] [CrossRef]
- Akturk, A.; Camci, C. Tip clearance investigation of a ducted fan used in VTOL Unmaned Aerial Vehicles—Part II: Novel treatments via computational design and their experimental verification. J. Turbomach. 2014, 136, 021005. [Google Scholar] [CrossRef]
Figure 1.
Disk loading vs. power loading for VTOL (vertical takeoff and landing) aircraft (original work by S. Paul Dev of D-STAR Engineering Corp., Shelton, CT, USA, reproduced with permission; verified and modified by the data from other sources [1,5]).
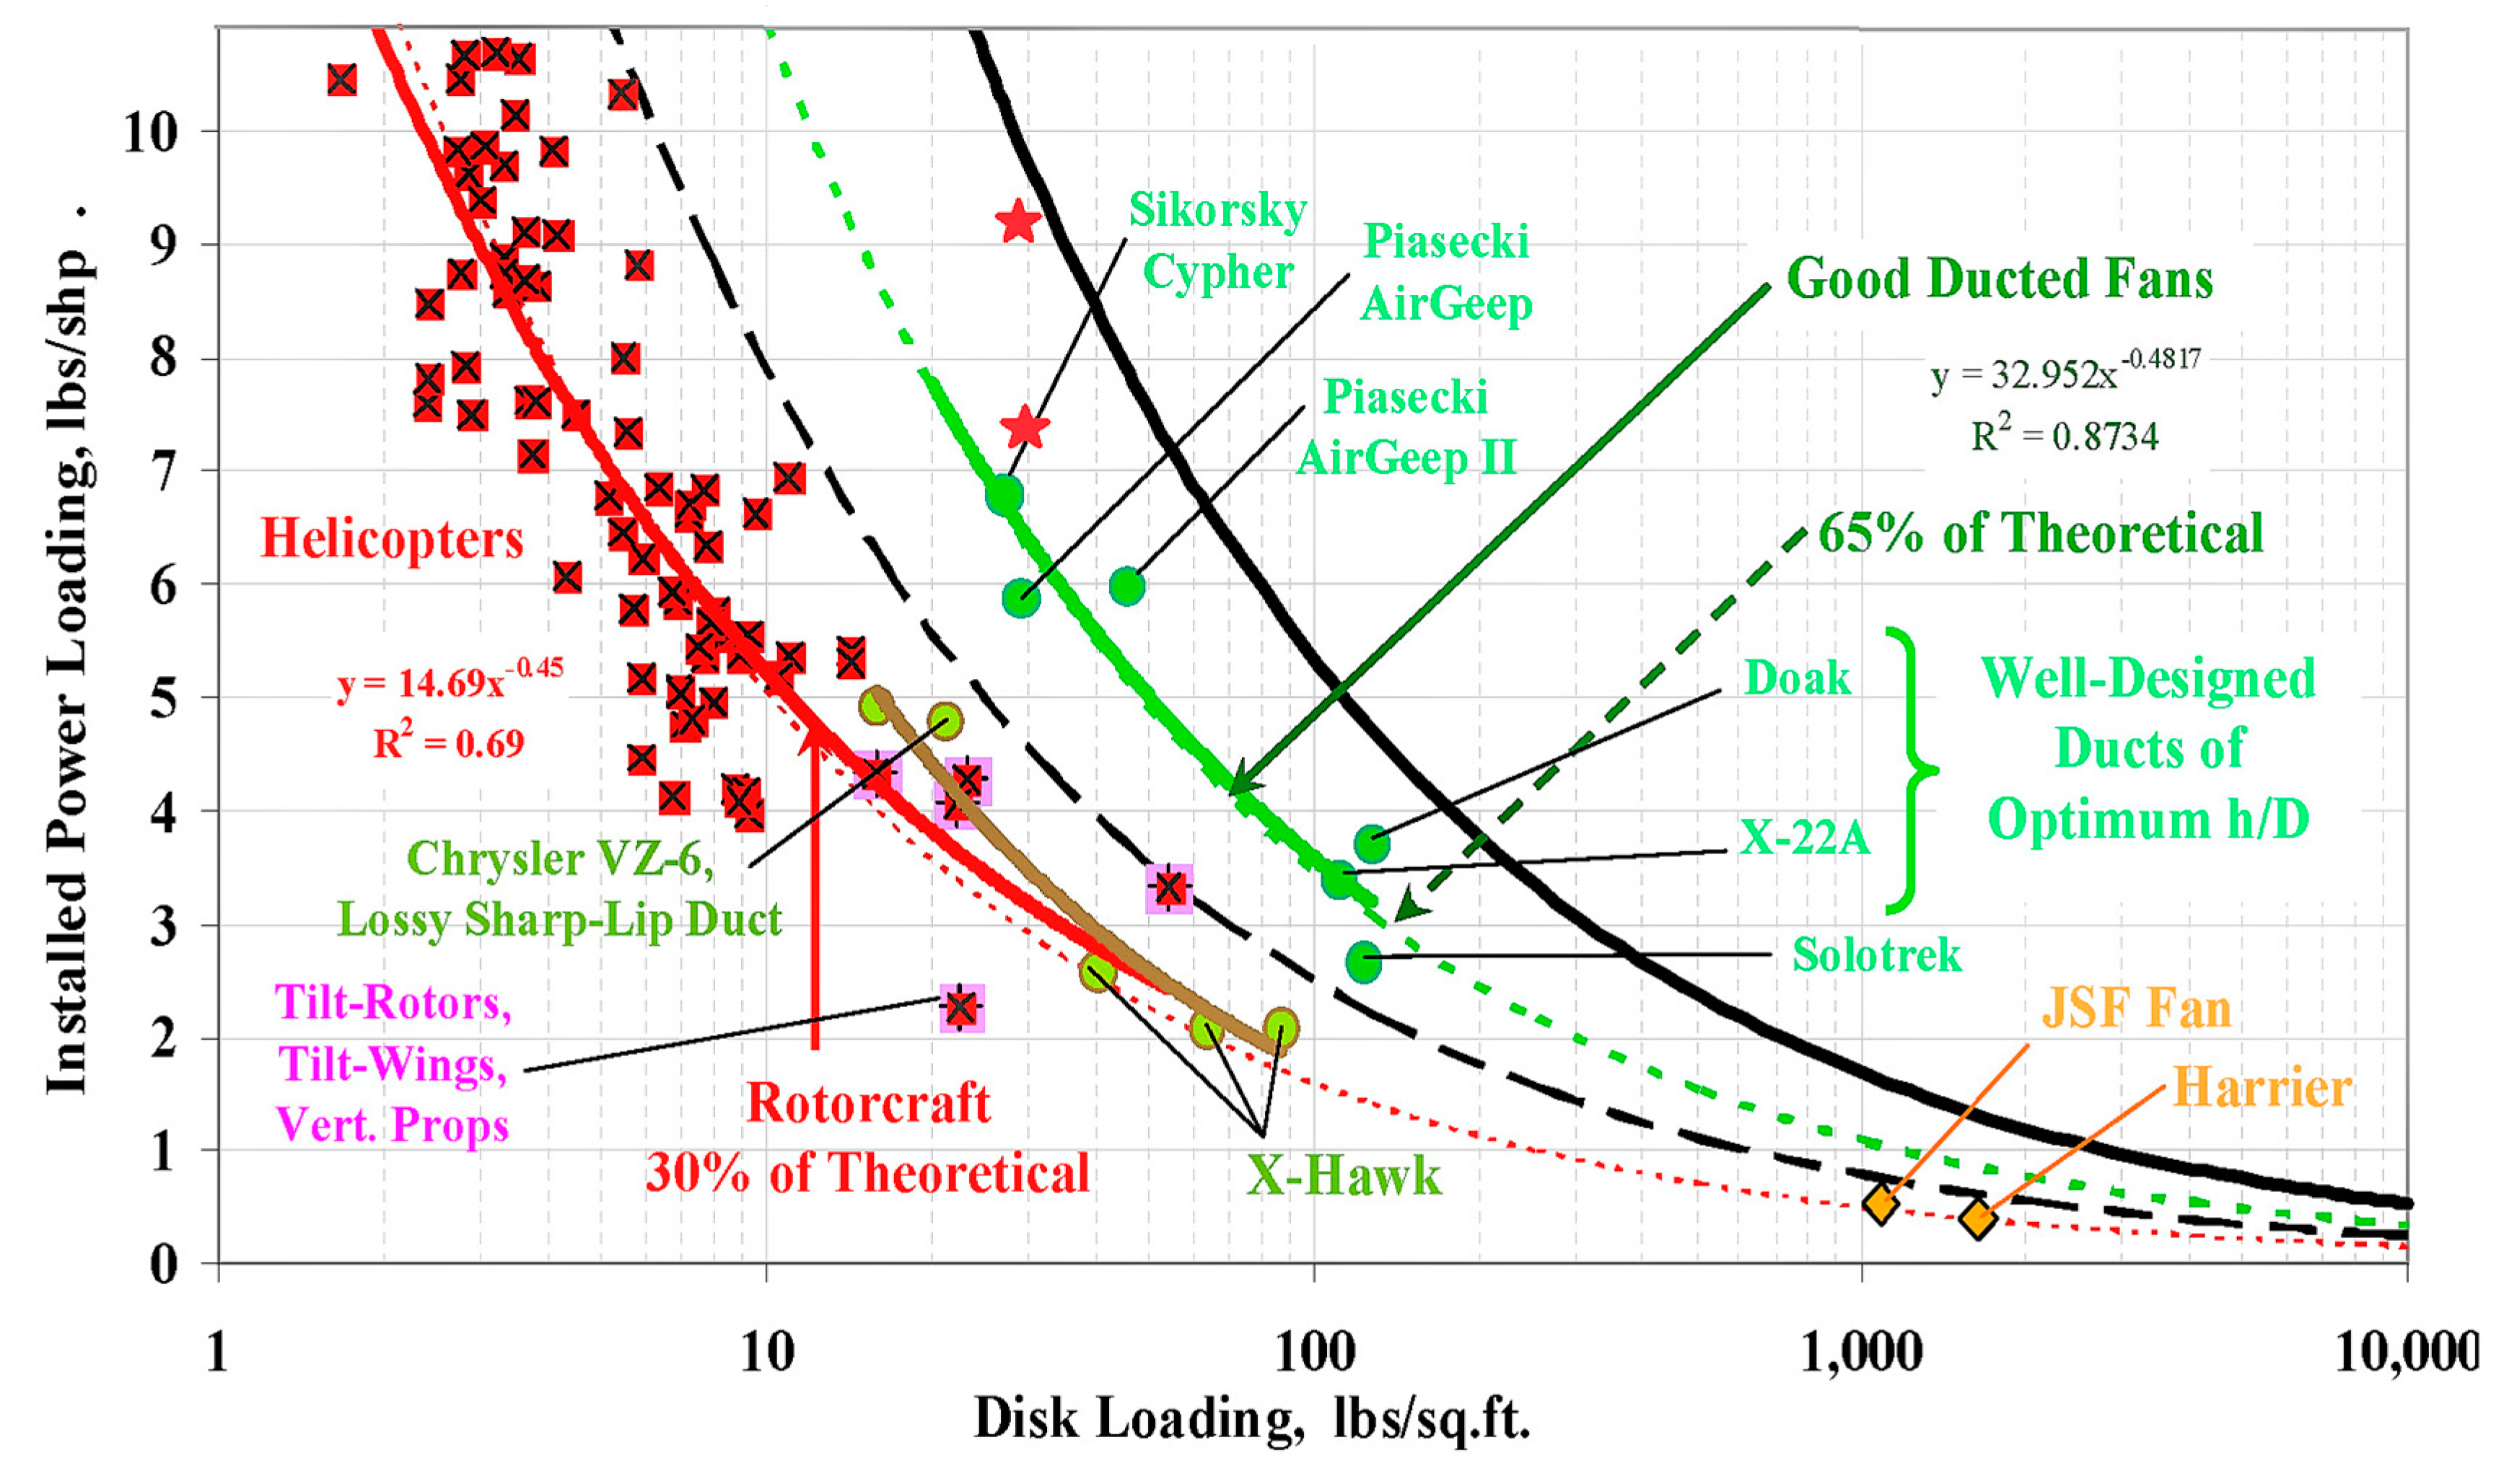
Figure 2.
Annular lift fan aircraft [2,3,4]: Single-stage lift fan with an inner fan and an outer fan coupled by the gears in the baffle.
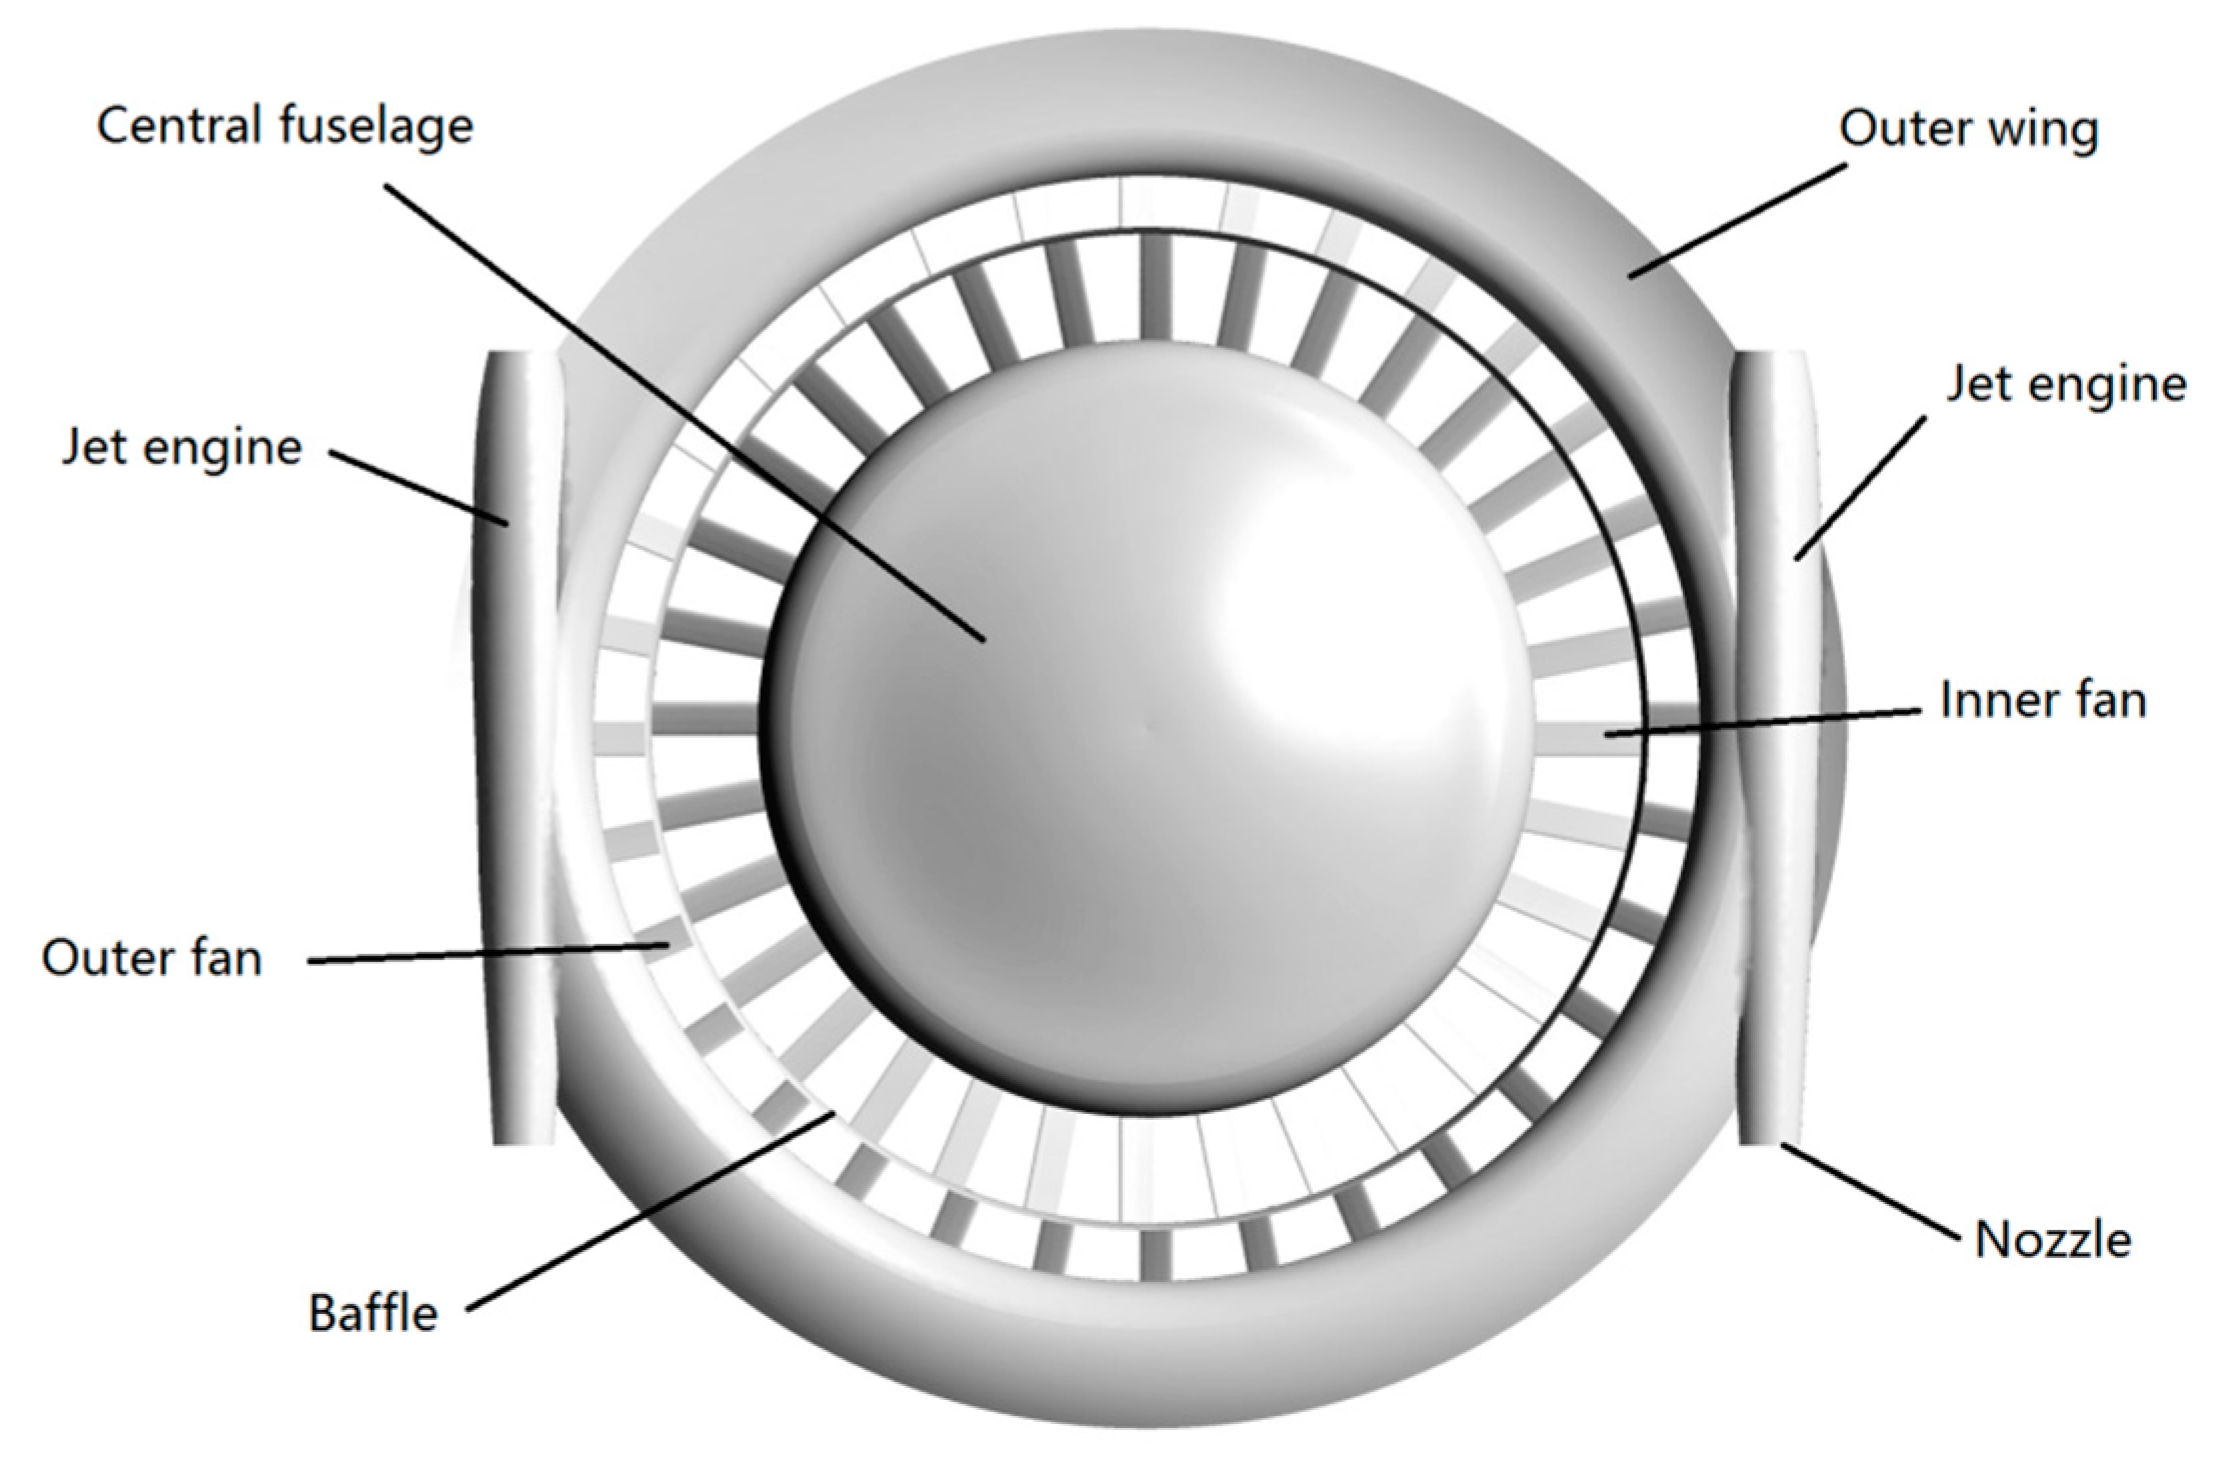
Figure 3.
Transparent lateral view to show the duct inside structure and the shape of duct walls and the fan location. (a) The original configuration with arc duct walls; (b) The new configuration with semicircular duct walls.
Figure 3.
Transparent lateral view to show the duct inside structure and the shape of duct walls and the fan location. (a) The original configuration with arc duct walls; (b) The new configuration with semicircular duct walls.
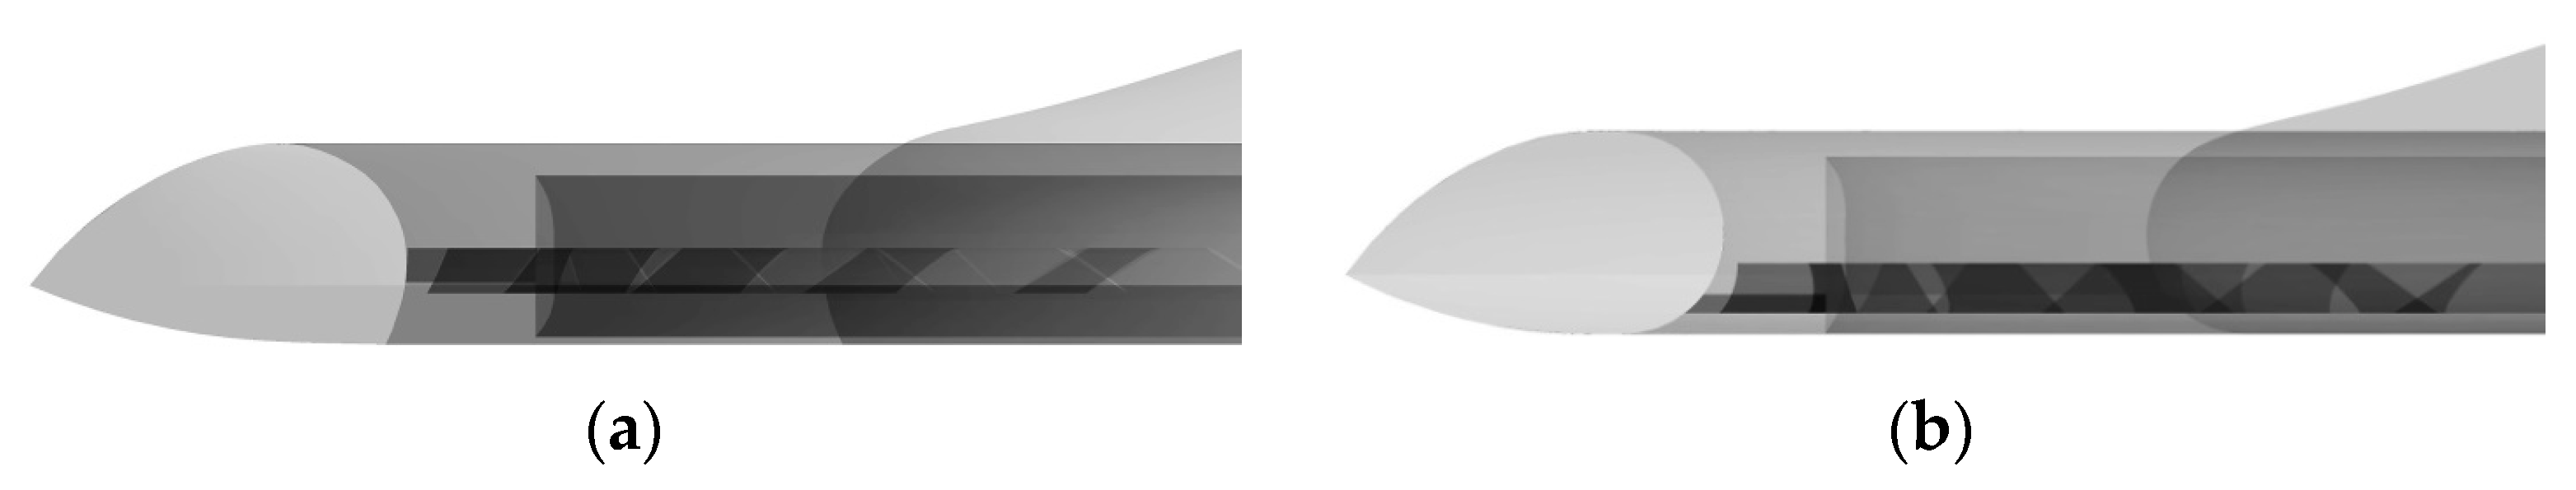
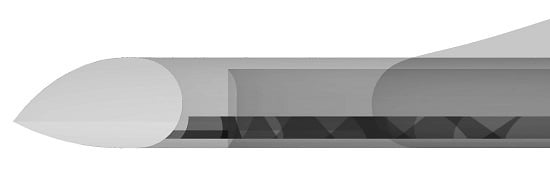
Figure 4.
(a) Cross section mesh in the duct to show the geometry of blades; (b) Surface mesh of the aircraft.
Figure 4.
(a) Cross section mesh in the duct to show the geometry of blades; (b) Surface mesh of the aircraft.

Figure 5.
Velocity contour in the central plane of aircraft to show the diffusion of downstream flow. (a) Original fan; (b) New fan configuration.
Figure 5.
Velocity contour in the central plane of aircraft to show the diffusion of downstream flow. (a) Original fan; (b) New fan configuration.
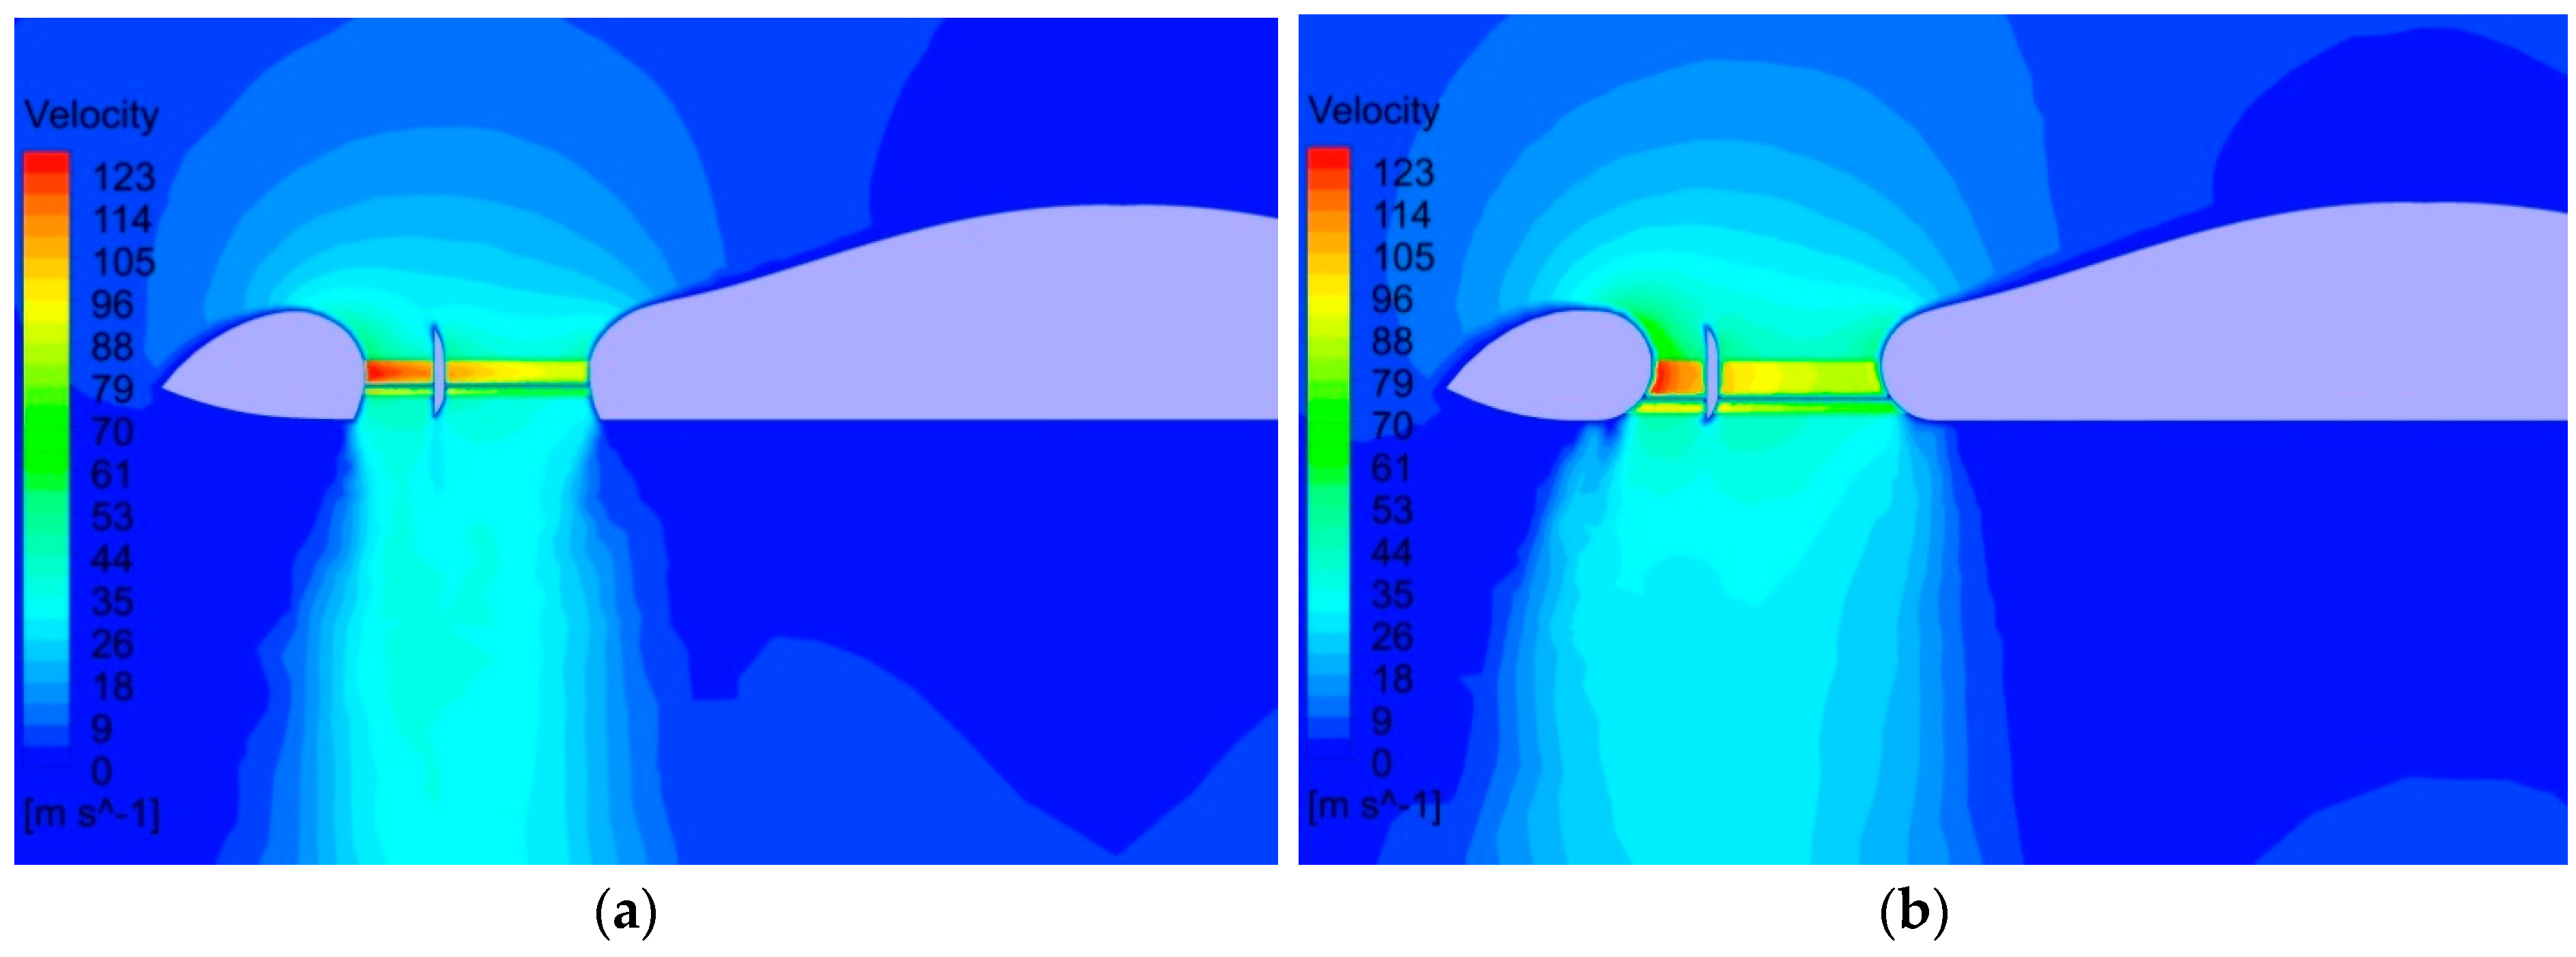
Figure 6.
Static pressure contour in the central plane of aircraft. (a) Original fan configuration; (b) New fan configuration.
Figure 6.
Static pressure contour in the central plane of aircraft. (a) Original fan configuration; (b) New fan configuration.

Figure 7.
(a) Static pressure distribution on the surfaces of the aircraft in the central plane; (b) Lift distribution.
Figure 7.
(a) Static pressure distribution on the surfaces of the aircraft in the central plane; (b) Lift distribution.

Figure 8.
Velocity vector in the central plane of the aircraft to show the actual diffusion angle at the outlet of the annular duct; left is the outer duct wall, right is the inner duct wall, and in the middle is the baffle. The colors mean the magnitude of velocity. Red means high velocity and blue means low.

Figure 9.
Velocity contour in the central plane of aircraft. (a) Fan at the throat; (b) Fan at the diffuser.
Figure 9.
Velocity contour in the central plane of aircraft. (a) Fan at the throat; (b) Fan at the diffuser.
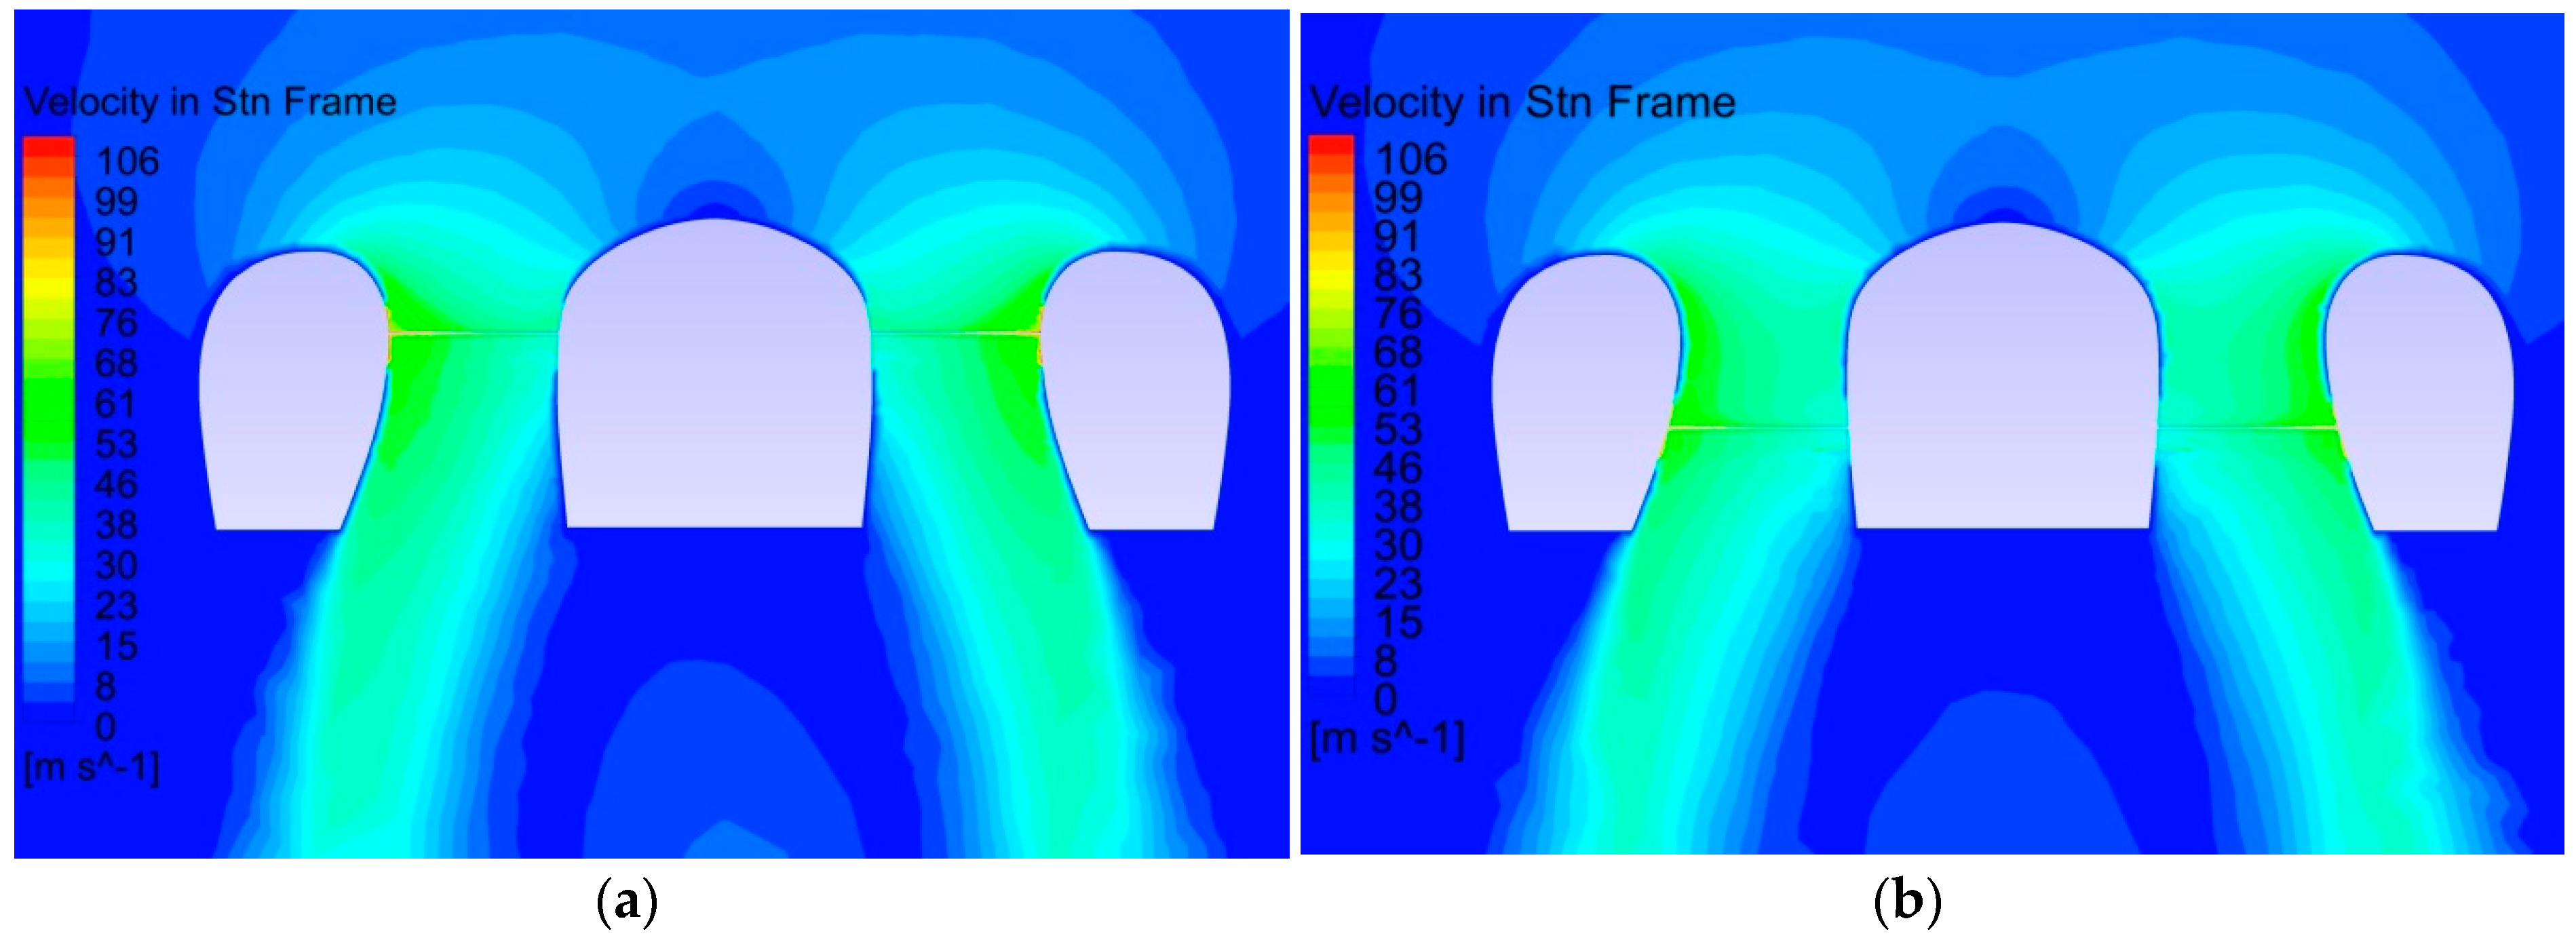
Figure 10.
(a) Static pressure distribution on the surfaces of the aircraft in the central plane; (b) Lift distribution.
Figure 10.
(a) Static pressure distribution on the surfaces of the aircraft in the central plane; (b) Lift distribution.

Figure 11.
Computed time-averaged drag and pitching moment coefficient to lift coefficient ratio at different angles of attack in transition mode. The arrows indicate the recommended strategy to increase drag and pitching moment in transition. (a) Drag to lift ratio; (b) Pitching moment to lift ratio.

Figure 12.
Thrust vectoring for attitude control and to eliminate the pitching torque.

Figure 13.
Computed time-averaged drag and moment coefficients to lift coefficient ratio at different angles of attack in transition mode. (a) Drag; (b) Pitching moment; (c) Rolling moment; (d) Surface streamlines in the central plane at the speed of 20 m/s.
Figure 13.
Computed time-averaged drag and moment coefficients to lift coefficient ratio at different angles of attack in transition mode. (a) Drag; (b) Pitching moment; (c) Rolling moment; (d) Surface streamlines in the central plane at the speed of 20 m/s.


| Parameters | Coarse Grid | Medium Grid | Fine Grid |
|---|---|---|---|
| Element number | 2.5 M | 5.2 M | 9.8 M |
| FM | 0.756 | 0.772 | 0.778 |
| CD/CL | 0.463 | 0.455 | 0.452 |
| Results | Original | Semicircle Duct Walls | Lower Fan | 2% and 30° | Ground Effect |
|---|---|---|---|---|---|
| FM | 0.733 | 0.735 | 0.763 | 0.772 | 0.822 |
| Diffusion ratio σ | 1.03 | 1.15 | 1.31 | 1.38 | 1.32 |
| Power loading (lbs/hp) | 7.46 | 7.92 | 8.77 | 9.03 | 9.62 |
| Power (kw) | 2293 | 2160 | 1948 | 1893 | 1777 |
| Fan speed (rpm) | 137 | 138 | 135 | 128 | 118 |
| Fan Location | σ | Power (kw) | Fan Speed (rpm) | Lift (kg) | Power Loading (lbs/hp) |
|---|---|---|---|---|---|
| Fan at Throat | 1.25 | 2370 | 204 | 9920 | 6.85 |
| Fan at Diffuser | 1.02 | 2467 | 175 | 9920 | 6.59 |
| AOAForward Speed | 0 m/s | 10 m/s | 20 m/s | 30 m/s |
|---|---|---|---|---|
| 0° | 97 | 91 | 82 | 53 |
| 15° | 102 | 87 | 65 | 42 |
| −21° | 105 | 98 | 99 | 105 |
© 2017 by the authors. Licensee MDPI, Basel, Switzerland. This article is an open access article distributed under the terms and conditions of the Creative Commons Attribution (CC BY) license ( http://creativecommons.org/licenses/by/4.0/).
Share and Cite
MDPI and ACS Style
Jiang, Y.; Zhang, B. CFD Study of a New Annular Lift Fan Configuration with High Lift Efficiency. Aerospace 2017, 4, 13. https://doi.org/10.3390/aerospace4010013
AMA Style
Jiang Y, Zhang B. CFD Study of a New Annular Lift Fan Configuration with High Lift Efficiency. Aerospace. 2017; 4(1):13. https://doi.org/10.3390/aerospace4010013
Chicago/Turabian StyleJiang, Yun, and Bo Zhang. 2017. "CFD Study of a New Annular Lift Fan Configuration with High Lift Efficiency" Aerospace 4, no. 1: 13. https://doi.org/10.3390/aerospace4010013
Note that from the first issue of 2016, this journal uses article numbers instead of page numbers. See further details here.