Design, Development and Testing of Shape Shifting Wing Model

Department of Engineering and Math, Sheffield Hallam University, Howard Street, Sheffield S1 1WB, UK
*
Author to whom correspondence should be addressed.
†
These authors contributed equally to this work.
Aerospace 2017, 4(4), 52; https://doi.org/10.3390/aerospace4040052
Submission received: 19 August 2017
/
Revised: 20 October 2017
/
Accepted: 30 October 2017
/
Published: 1 November 2017
(This article belongs to the Special Issue Adaptive/Smart Structures and Multifunctional Materials in Aerospace)
Abstract
:The design and development of morphing (shape shifting) aircraft wings—an innovative technology that has the potential to increase the aerodynamic efficiency and reduce noise signatures of aircrafts—was carried out. This research was focused on reducing lift-induced drag at the flaps of the aerofoil and to improve the design to achieve the optimum aerodynamic efficiency. Simulation revealed a 10.8% coefficient of lift increase for the initial morphing wing and 15.4% for the optimized morphing wing as compared to conventional wing design. At angles of attack of 0, 5, 10 and 15 degrees, the optimized wing has an increase in lift-to-drag ratio of 18.3%, 10.5%, 10.6% and 4% respectively when compared with the conventional wing. Simulations also showed that there is a significant improvement on pressure distribution over the lower surface of the morphing wing aerofoil. The increase in flow smoothness and reduction in vortex size reduced pressure drag along the trailing edge of the wing as a result an increase in pressure on the lower surface was experienced. A morphing wing reduced the size of the vortices and therefore the noise levels measured were reduced by up to 50%.
1. Introduction
The aircraft industries are constantly looking for newer and more innovative ways to increase aerodynamic efficiency to reduce fuel consumption. In recent years, this has become more challenging as conventional aircraft configurations have been pushed to the very limit of aerodynamic efficiency. This implies that non-conventional technology and design needs to be developed [1] to have a substantial effect of increasing aerodynamic efficiency.
In recent years “morphing” has received great interest [2,3,4,5]. Morphing implies the change of shape of aircraft structures tailored to optimize aircraft performance. This is because conventional aircraft design is a compromise to meet various flight conditions—for example a design to optimize take-off is not necessarily compatible with the optimal design for cruise mission. The definition of wing morphing is the continuous smooth and flexible change of the wing shape in order to maximize aerodynamic efficiency. A comprehensive review on morphing technologies was conducted by Rodriguez [4]. Two morphing aircraft structure concepts were developed through DARPA funding. The first concept was developed by Lockheed Martin in which the structure has the ability to reduce the wing area while transitioning from loiter to high speed Mach number [6] and the second concept—the NextGen MFX-1 aircraft—is based on flexible skin [7], which provides the capability for the wings to change shapes tailored to the specific mission profile. Wing morphing can be accomplished in multitude of directions, one direction is changing the wing spar and this has been demonstrated by the university of Maryland development of pneumatic telescopic spar for a UAV [8]. The other direction is the change of camber of the wing, this could improve the flying performance of the aircraft including the lift and drag capabilities mainly during take-off and landing manoeuver [9,10,11,12,13,14].
In the past, a number of approaches have been proposed for sealing the gaps between high lift devices and the wing—a brief overview of these approaches is provided in order to demonstrate the complexities of the proposed designs and the challenges associated with their implementations, which highlights the urgent need for innovative solutions to address this problem. Kunz [15] patented a mechanical device consisting of additional flap connected to the main flap via a sliding interface. Diller and Miller [16] later on, patented mechanical/compliant transition to cover the span-wise and end-chord partial dislocations between the flap and wing. Their design is somehow cumbersome due to compliant Silicone elastomer skins that are reinforced by sliding mechanical rod acting to support the variable length of skin transitions. Caton et al. [17] patented a similar design of two short rods sliding into the elastomer skin as compared to the mechanical one rod mechanism of Diller and Miller. This design change meant the addition of a component to cover the joints which makes the design even more complicated. In 2013, Boeing [18] introduced the concept of multiple ribs that slide in and out of a spanwise rod embedded within the wing—the main feature of the covered elastomer skin sliding ribs is to cover the changing transition length dislocations between the flap and the wing. The patented design introduced the ribs rotating tip concept to extend the rib trailing edge length. Another concept was introduced by NASA Langley in 2012 [19], of wedge elastomer skin to bridge the span-wise gap between the flap and wing. This concept was tested [20] and noise reduction of 3 dB or higher for deflected flap was measured and aerodynamic efficiency enhancement were verified but not quantified in wind tunnel tests. Furthermore, recent advances in designing and proposing solutions based on an active camber morphing—the Fish Bone Active Camber (FishBAC) [21]—concept showed promising results in wind tunnel tests [22] of increased lift-to-drag ratio, making it a good candidate for pairing with other end transition morphing concepts. The FishBAC concept was extended [23] to introduce material structures to seal the gaps created at the end of an active control morphing surface. A Morphing Elastically LofteD (MELD) transition was introduced [23], which is capable of bending and twisting to perform smooth continuous deformation between connection ends of the active morphing camber surface and the fixed wing structure. Initially morphing structures were implemented on military aircrafts, however in recent years the focus has shifted towards small aircrafts such as UAVs [24], this is due to lower aerodynamic loads which makes the development and implementation processes more efficient and diverse. Also, the time line for new product introduction is shorter, due to less rigor certification procedures and fewer testing. A review study [24] discussed actuation systems categorized by the actuation method and implemented on airofoil wing morphing using conventional (lumped) actuators, SMA-like actuators and PZT actuators to induce camber change and thus provide lift augmentation.
This paper explores the design and development of a new type of wing technology called shape shifting or morphing aircraft wings. Morphing aircraft wings are based on the dynamics of a bird wing, fundamentally ensuring that flow remains smooth and disruption is minimized. This is accomplished by eliminating the surface dislocations between the wing and the flaps, reducing and delaying the formation of vortices caused by lift-induced drag. These benefits will further increase aircraft performance by reducing take-off distances, landing distances, increasing climb rates, increasing stability and reducing the overall noise generated by the airframe. In addition, the increase in lift can also lead to a reduction in wing size, which implies a reduction in overall weight and a further reduction in fuel consumption.
2. Current Sophisticated Morphing Wing Technology
Morphing wing technology had received renewed attention during recent years due to material and actuation systems rapid development. Few papers published primarily focused on mechanical structures and dielectric smart polymers. These are experimental and have a predicted timeline of 50 years until integration—currently the only company in the testing phase is Flexsys and their compliant control surfaces are designed in conjunction with NASA and the US Air Force, however, their research is not published publicly. Currently the only competition for morphing wing technology is a company called Flexsys, they are developing a compliant control surface. Flexsys compliant control surfaces works with a combination of monolithic joint-less mechanisms and flexible material to achieve a flap which changes the camber of the wing rather than a mechanical flap. Flexsys claim their compliant control surface can achieve a 2% reduction in drag when retrofitted and up to 12% with a complete trailing edge redesign, as well as an increase in lift by 14% [25].
2.1. Mechanical Monolithic Joint-Less Mechanism
Monolithic joint-less structures for morphing wings are designs [26,27] that uses materials elastic properties to create a function, such as actuation or deflection. A monolithic joint-less mechanism [3] are designed so that the structure doesn’t have any joints and loads are equally distributed throughout the entire structure [26]. This load distribution ensures that no single joint experiences excessive loading, which leads to failure. This structure allows large deflections while minimizing strain. The main advantages to this type of structure are, minimal assembly required, high reliability on repeated action, no joints, therefore no need for lubrication and no friction, can be designed using any resilient material, cyclic fatigue resistant [26]. Issues that can arise with this technology are improper design and external loads. Should the structure not be designed correctly loading may not be distributed equally across the entire structure leading to failure from excessive loading or fatigue. The structure also needs to be designed to ensure it can withstand the external loads experienced throughout flight; these can be considerably high which might lead to sudden unexpected failure [27].
2.2. Rib Based Morphing Trailing Edge
The rib based morphing trailing edge design is a complex multi-component structural addition to the ribs already installed in an aircraft wing. It consists of four blocks connected to each other by a rotating joint along the camber line; each block is also attached to a link rod. The blocks are capable of rotating upwards and downward, this allows the blocks to act as a flap control surface [28]. When the blocks are assembled and attached onto the wings ribs an elastomer skin is attached along the entire trailing edge, covering the blocks. This achieves a smooth surface and allows the structure to deform without causing any breaks in the surface of the wing [28]. The advantages of this design are that each rib has a degree of freedom, therefore any block that is stopped from moving causes the trailing edge to not change shape. Should the actuator move then all the blocks will move, causing a change in wing shape. In addition, this design also solves external loading issues as the block assembly is directly attached onto the wings internal main structure, which means loads, will be transferred to wing.
2.3. Dielectric Smart Polymer Morphing Wing
Smart polymer, specifically dielectric smart polymer, is a material that changes shape. These are also known as electroactive smart polymers and they work by passing an electric current though them, this creates an actuation force in the form of material deformation [29]. The advantages of using dielectric smart polymers is that they are very light weight and can have relatively large strains during actuation, they also have very fast response times and large actuation forces [29]. The disadvantage of dielectric smart polymers is that they act as a capacitor when a current is run through them; therefore, they need to be properly insulated to ensure safe operation [29].
2.4. Transition Regions
To ensure morphing wings aerodynamic performance, transition regions are implemented between the wing and the flap to ensure smooth flow. Transition regions designs ensure no gaps are created when the flap moves, preventing high pressure air flow towards a low-pressure region. In addition to creating a smoother flow over the wing, transition regions also reduce the size, and delay the formation, of vortices on the flaps, which reduces noise, drag and increases lift.
3. Concept Analysis
Both design concepts shown in Table 1, are excellent choices for a morphing wing, each offer their own advantages and disadvantages but neither of them are equal. The decision on which, is chosen is based on which has the highest score for each of the different subcategories.
The dielectric smart polymer design offers a lot of benefits but its primary disadvantage is relatively more complex to assemble and install. This implies that it would require a long installation time as well as special training to install and maintain properly, this increases costs related to its operation. Another issue with the dielectric smart polymers is, related to safety concerns which require strict and proper fuel storage insulation. The main advantage of this design is the reduction of aircraft weight by eliminating the requirement for mechanical flaps and actuators.
The elastomer skin design is simple but can achieve the same effects as the dielectric smart polymer design. The elastomer skin design would be slightly heavier than the smart polymer design because it would still require the mechanical flap structure. This is counteracted by the low costs, ease of maintenance, ease of installation and overall safety. Installing an elastomer design only requires the wing to be covered in an elastomer skin which is attached using an adhesive. Maintenance would be as simple as visual inspections for cracking and then complete replacement of the skin when the material has reached its fatigue limit.
When considering safety, the elastomer skin design is superior because if failure occurs then there is still a working flap to generate lift. If the smart polymer fails due to damage or loss of an electric current then the aircraft won’t have any working high lift devices.
Based on the above discussion elastomer skin design had been pursued.
4. Initial Experimental Analysis
4.1. Wind Tunnel Testing
Wind tunnel testing was carried out on two of the three models, the conventional NACA 009 wing and the optimized morphing wing. All wings have the same span and chord as well as the same flap dimensions: Wing Span—0.3 m, Aerofoil Chord—0.15 m, Flap Span—0.172 m, Flap Chord—0.055 m, Flap Angle—25° (remains the same throughout testing), Wing rotated at a point of 26.7% of chord (thickest point along the chord) to accommodate the fixture bar. This was also applied to CFD simulation. AF100 low speed open loop wind tunnel (TecQuipment Ltd., www.tecquipment.com) equipped with 3 components balance connected to a separate display unit to measure the forces acting on the model was utilized. The wind tunnel test section dimensions, Length = 0.6 m, Width = 0.3 m and Height = 0.3 m.
Aerofoil NACA 009 was selected primarily to reduce profile drag as much as possible, as this study is concentrating on vortices being generated by the deployment of flaps. There were also costing and simulation issues to consider, being self-funded cost had to be kept down for 3D printing models. The simulation was carried out on Ansys academic, therefore there was a limitation of 512,000 cells for meshing. It was noted that cambered aerofoils required a higher cell count, which limited mesh refinement.
The models were 3D printed using the University printing facility rapid prototyping machine and then sanded down to remove the rough surface created during the 3D printing process. Once the model is finished, a 12 mm steel bar is installed at the aerodynamic centre, 40 mm from the leading edge. The finished models are shown in Figure 1. Strict fabrication procedures where implemented to ensure productions did meet the print specifications shown in Figure A1.
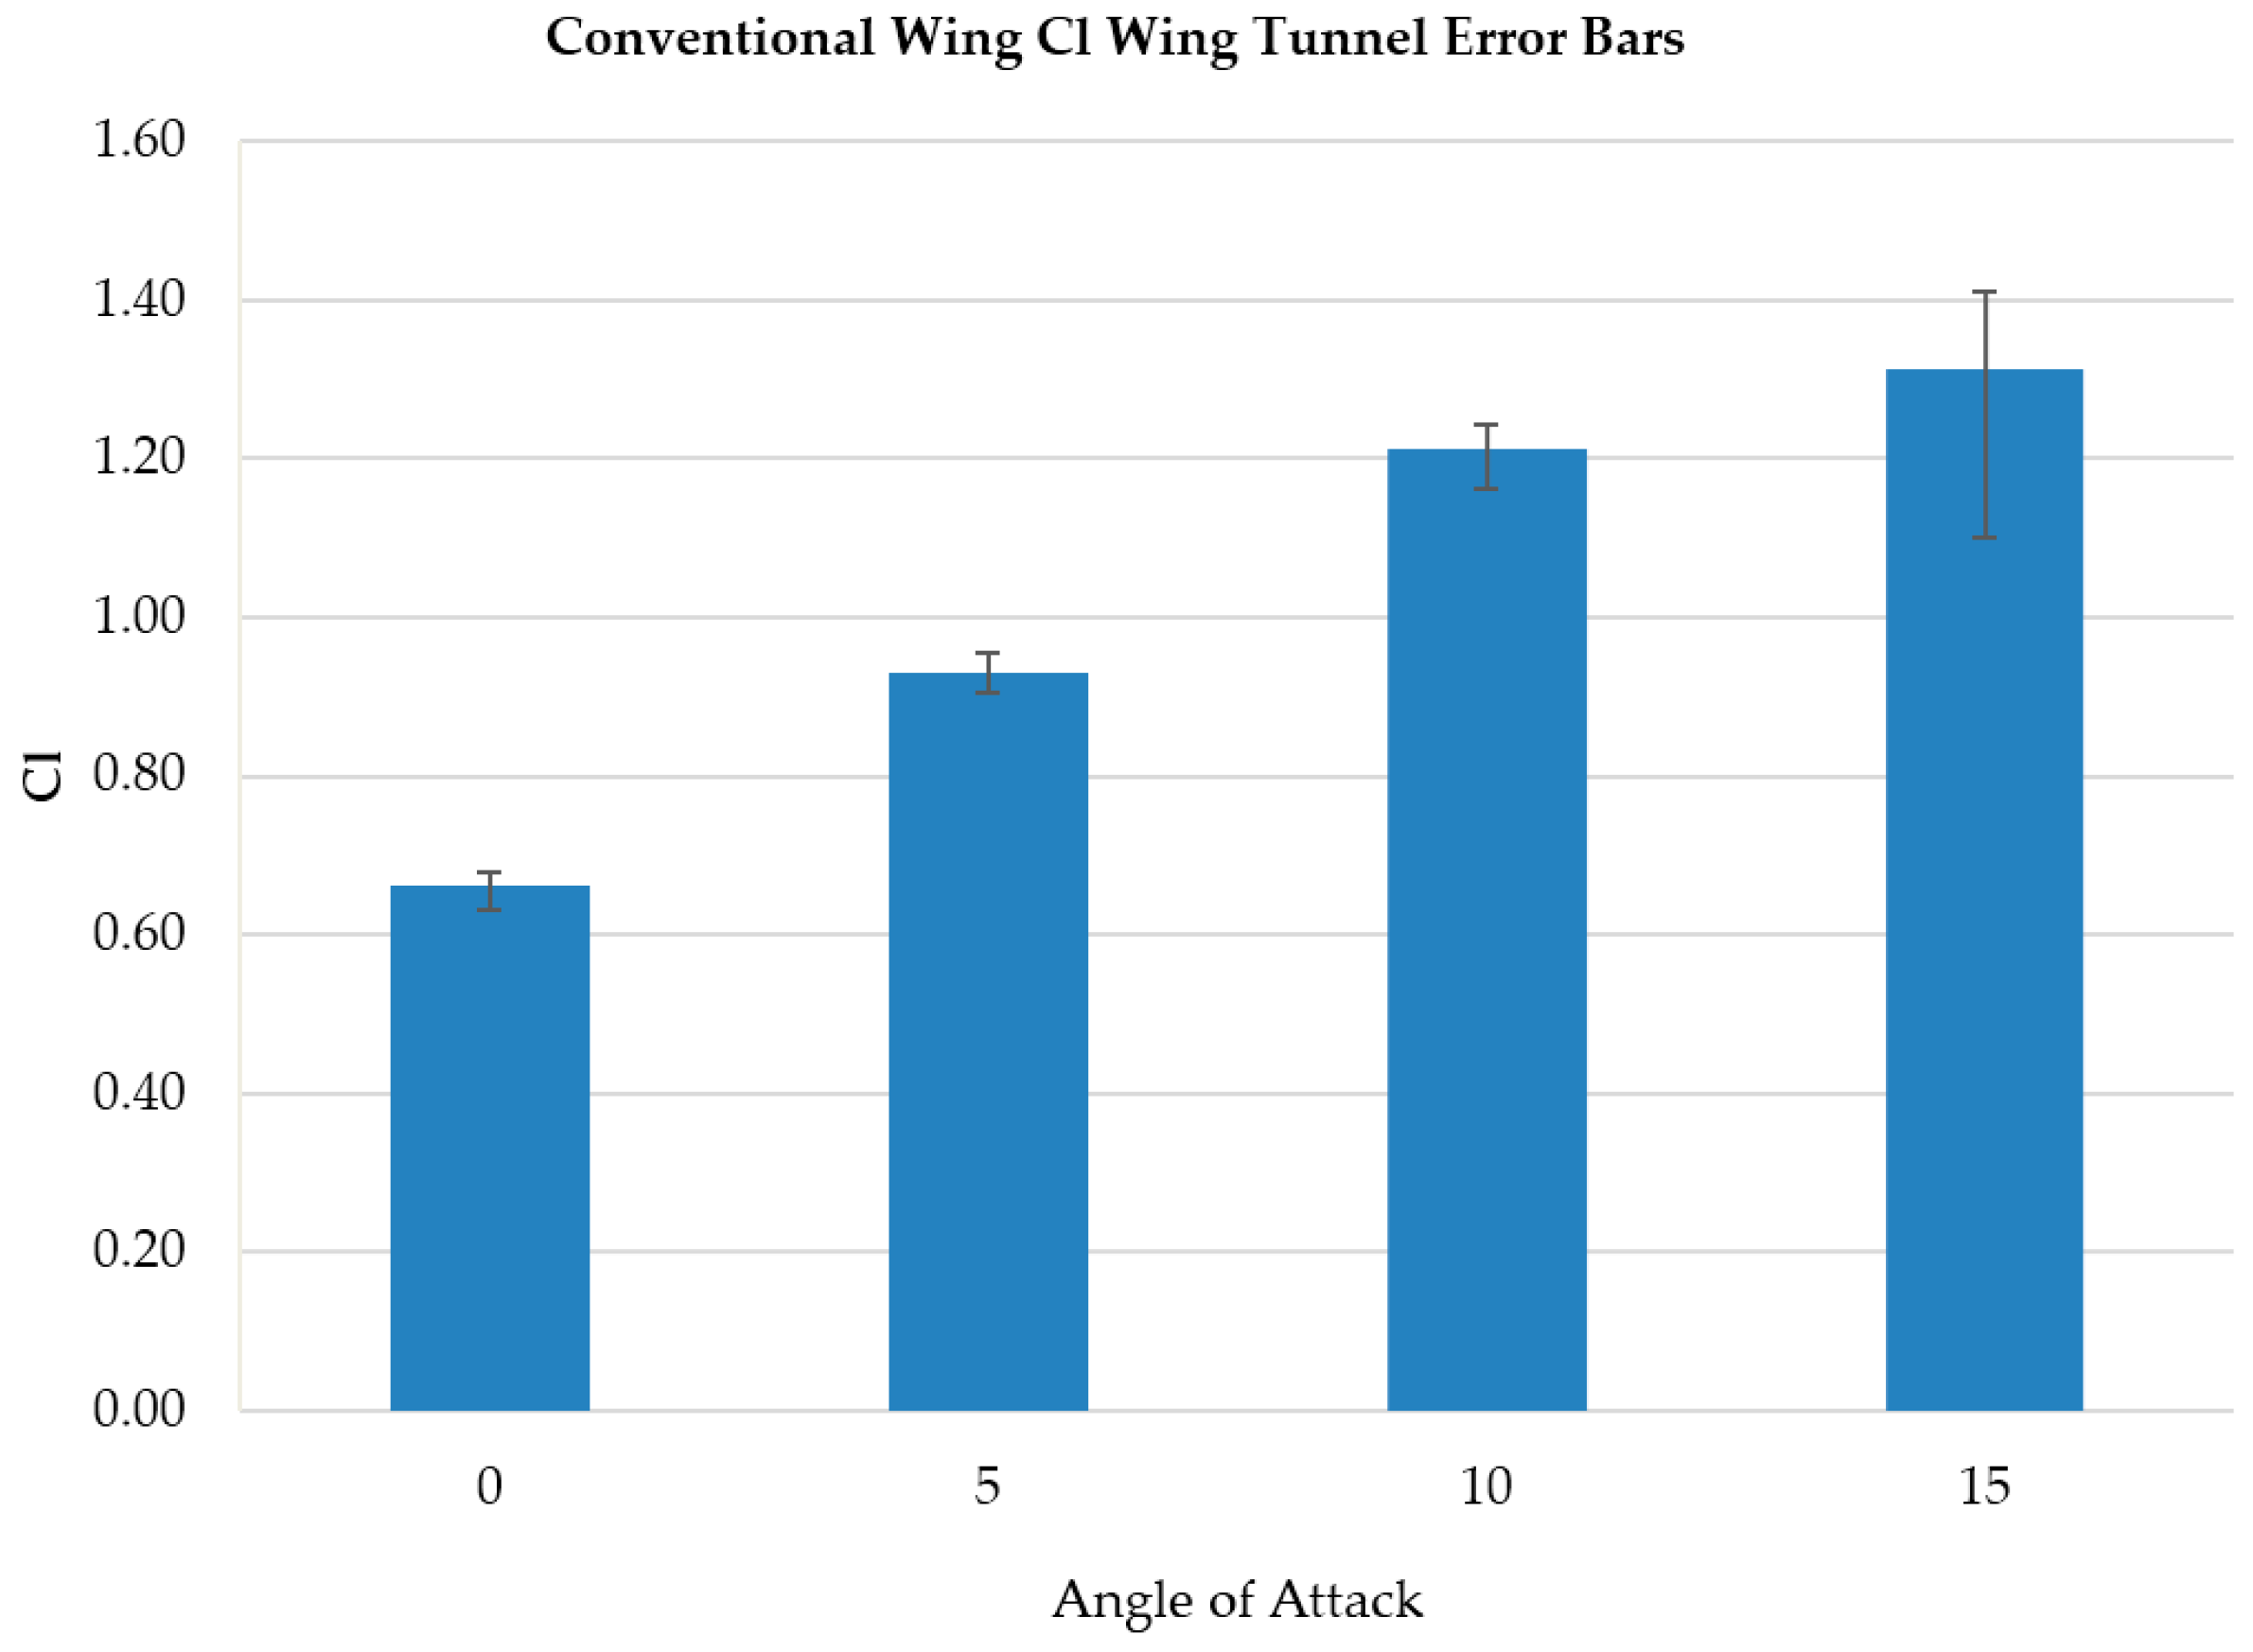
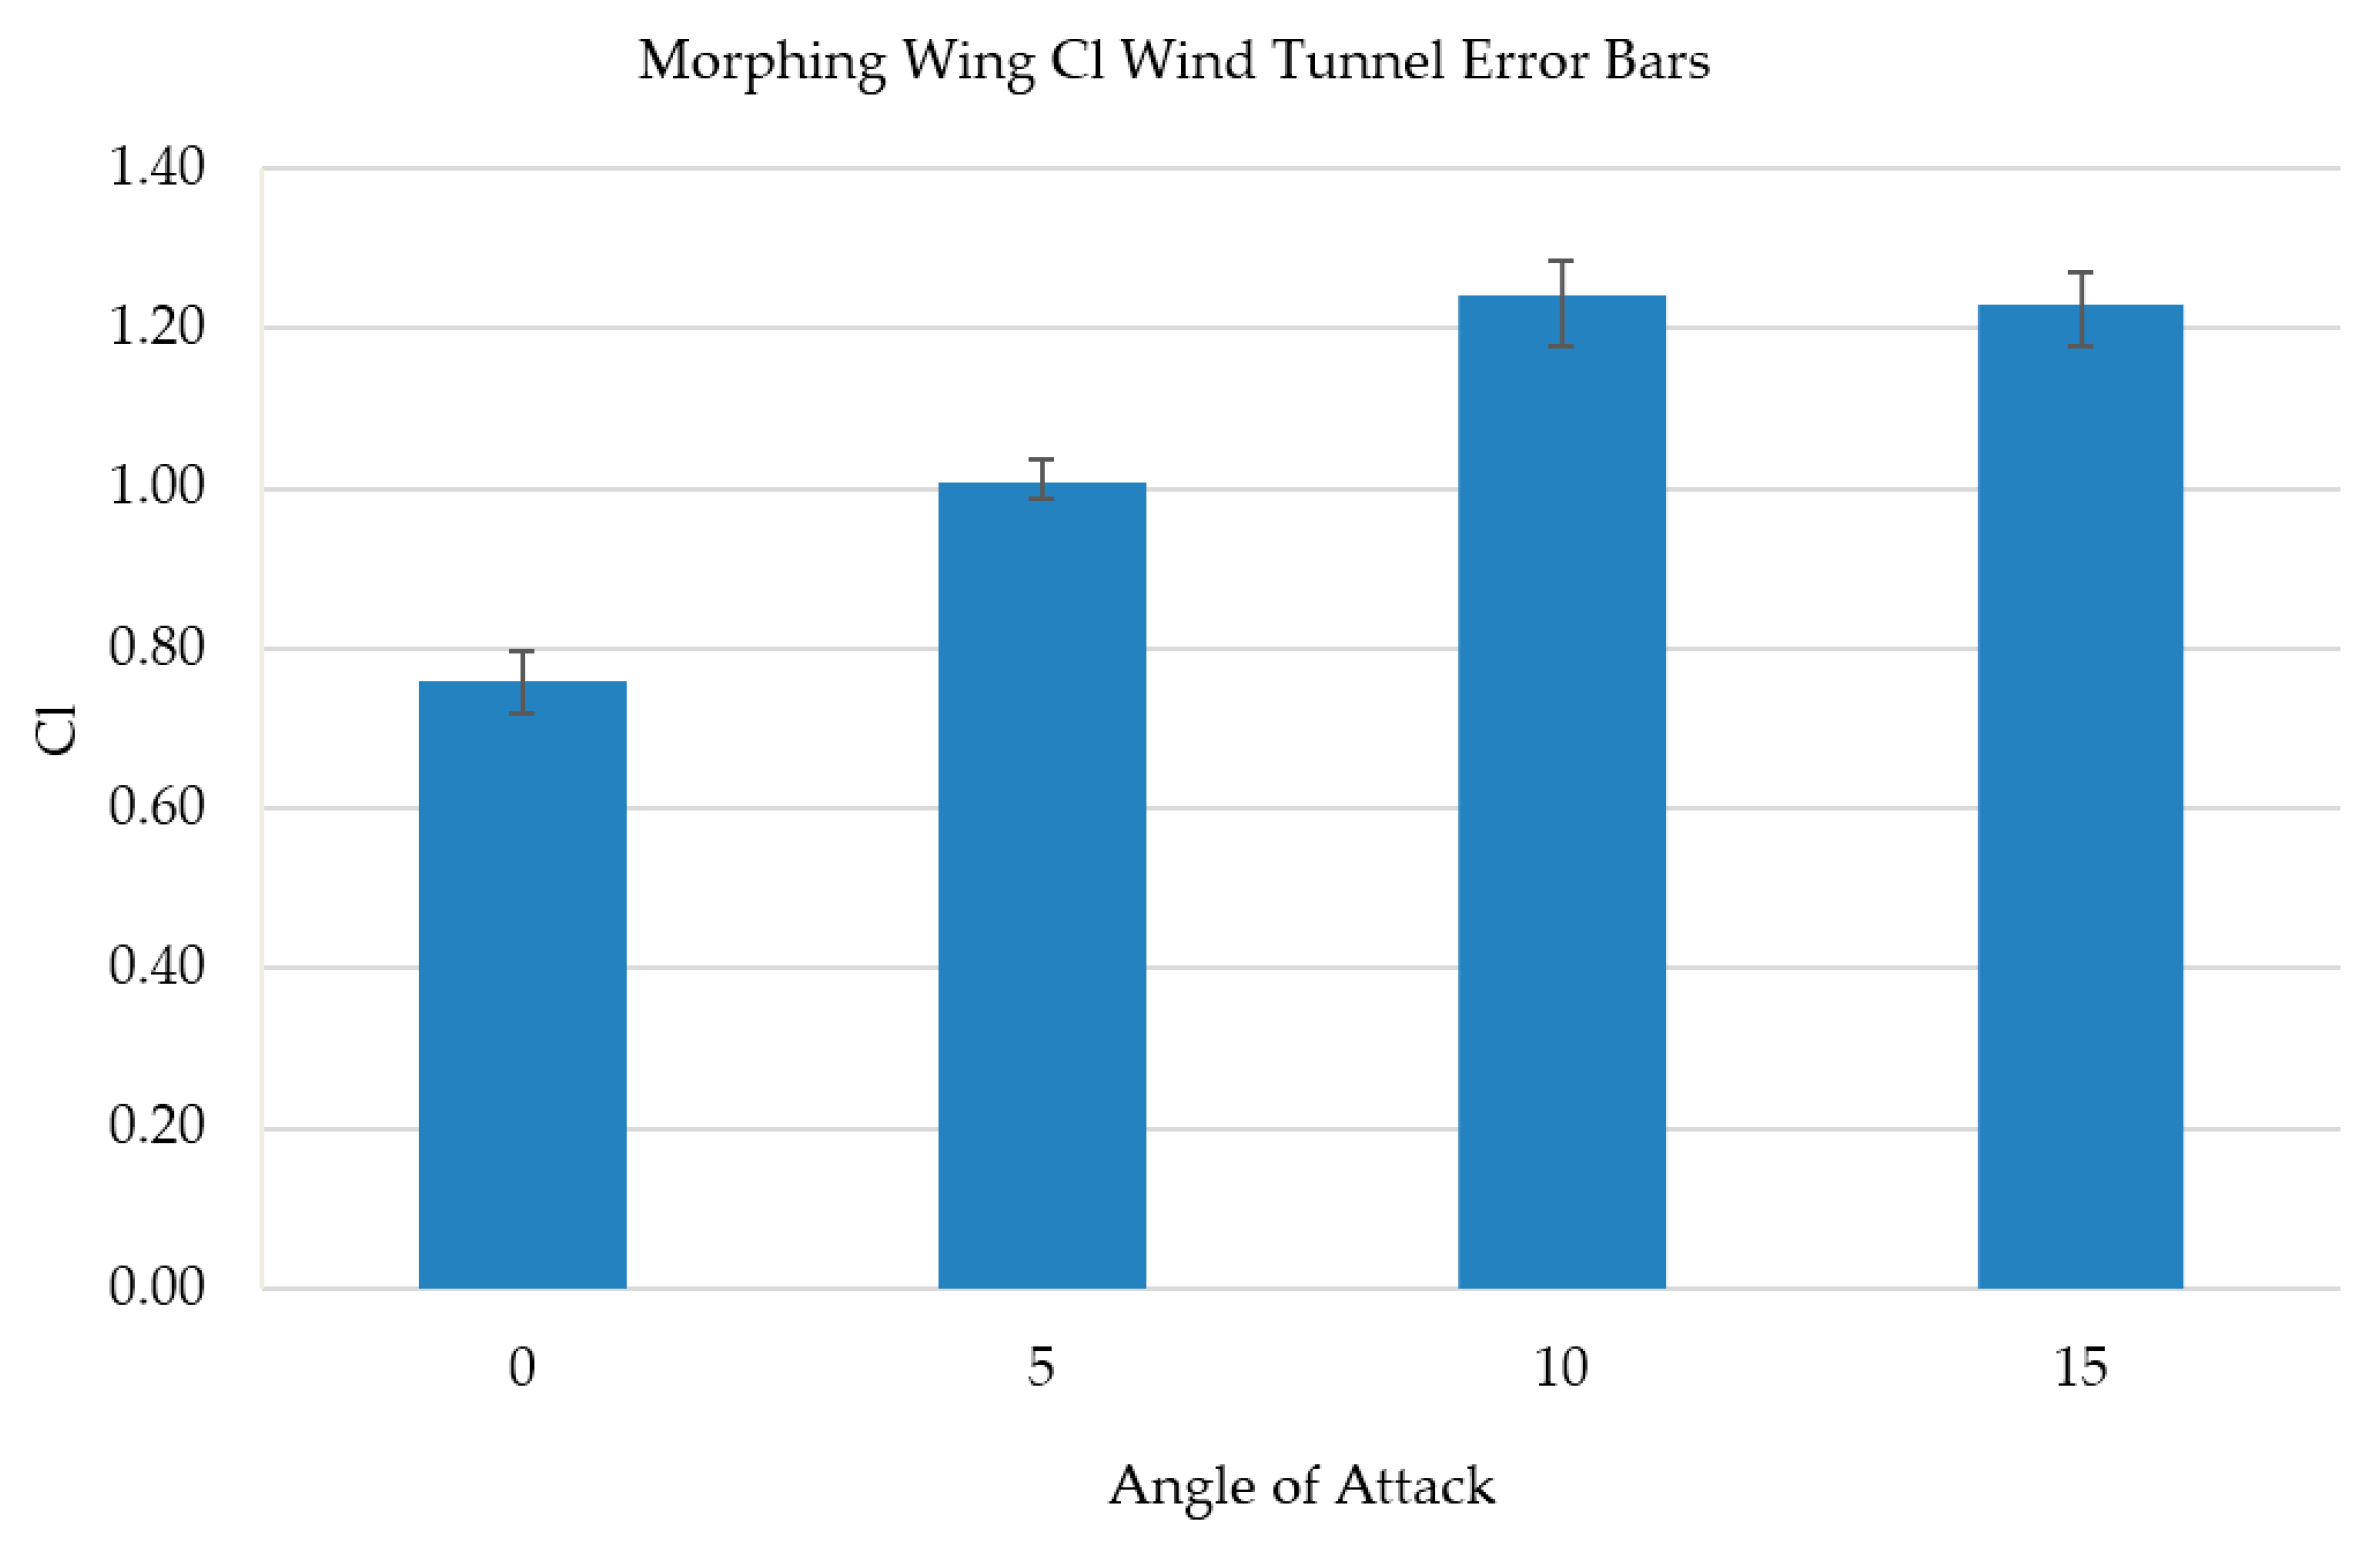
Each model was installed in the wind tunnel test section and tested at 0, 5, 10, 15 and 20 degrees angle of attack with a wind speed of 25 m/s. The data was collected at set intervals every 0.5 s for 20 s at all degrees of angles of attack, this provides a large amount of data which can then be analysed to ensure accurate results. Lift and drag data was then used to derive coefficient of lift and drag. Figure 2 shows the difference in coefficient of lift between the optimized morphing wing and the conventional wing. The optimized morphing wing has an increase in coefficient of lift by 14.8%, 8.4%, 4% and 2.6% at 0, 5, 10 and 15 degrees angle of attack respectively.
4.2. Wind Tunnel Results Discussion
Wind tunnel tests showed that both the initial morphing wing and the optimized wing have significant improvements over conventional wing. Although further improvement from the initial morphing wing is minor and would cause an increase in overall cost and complexity for the design.
The wind tunnel data confirmed that the morphing wing design has the potential to increase the lift generated, by up to 14.8% at 0 degrees angle of attack.
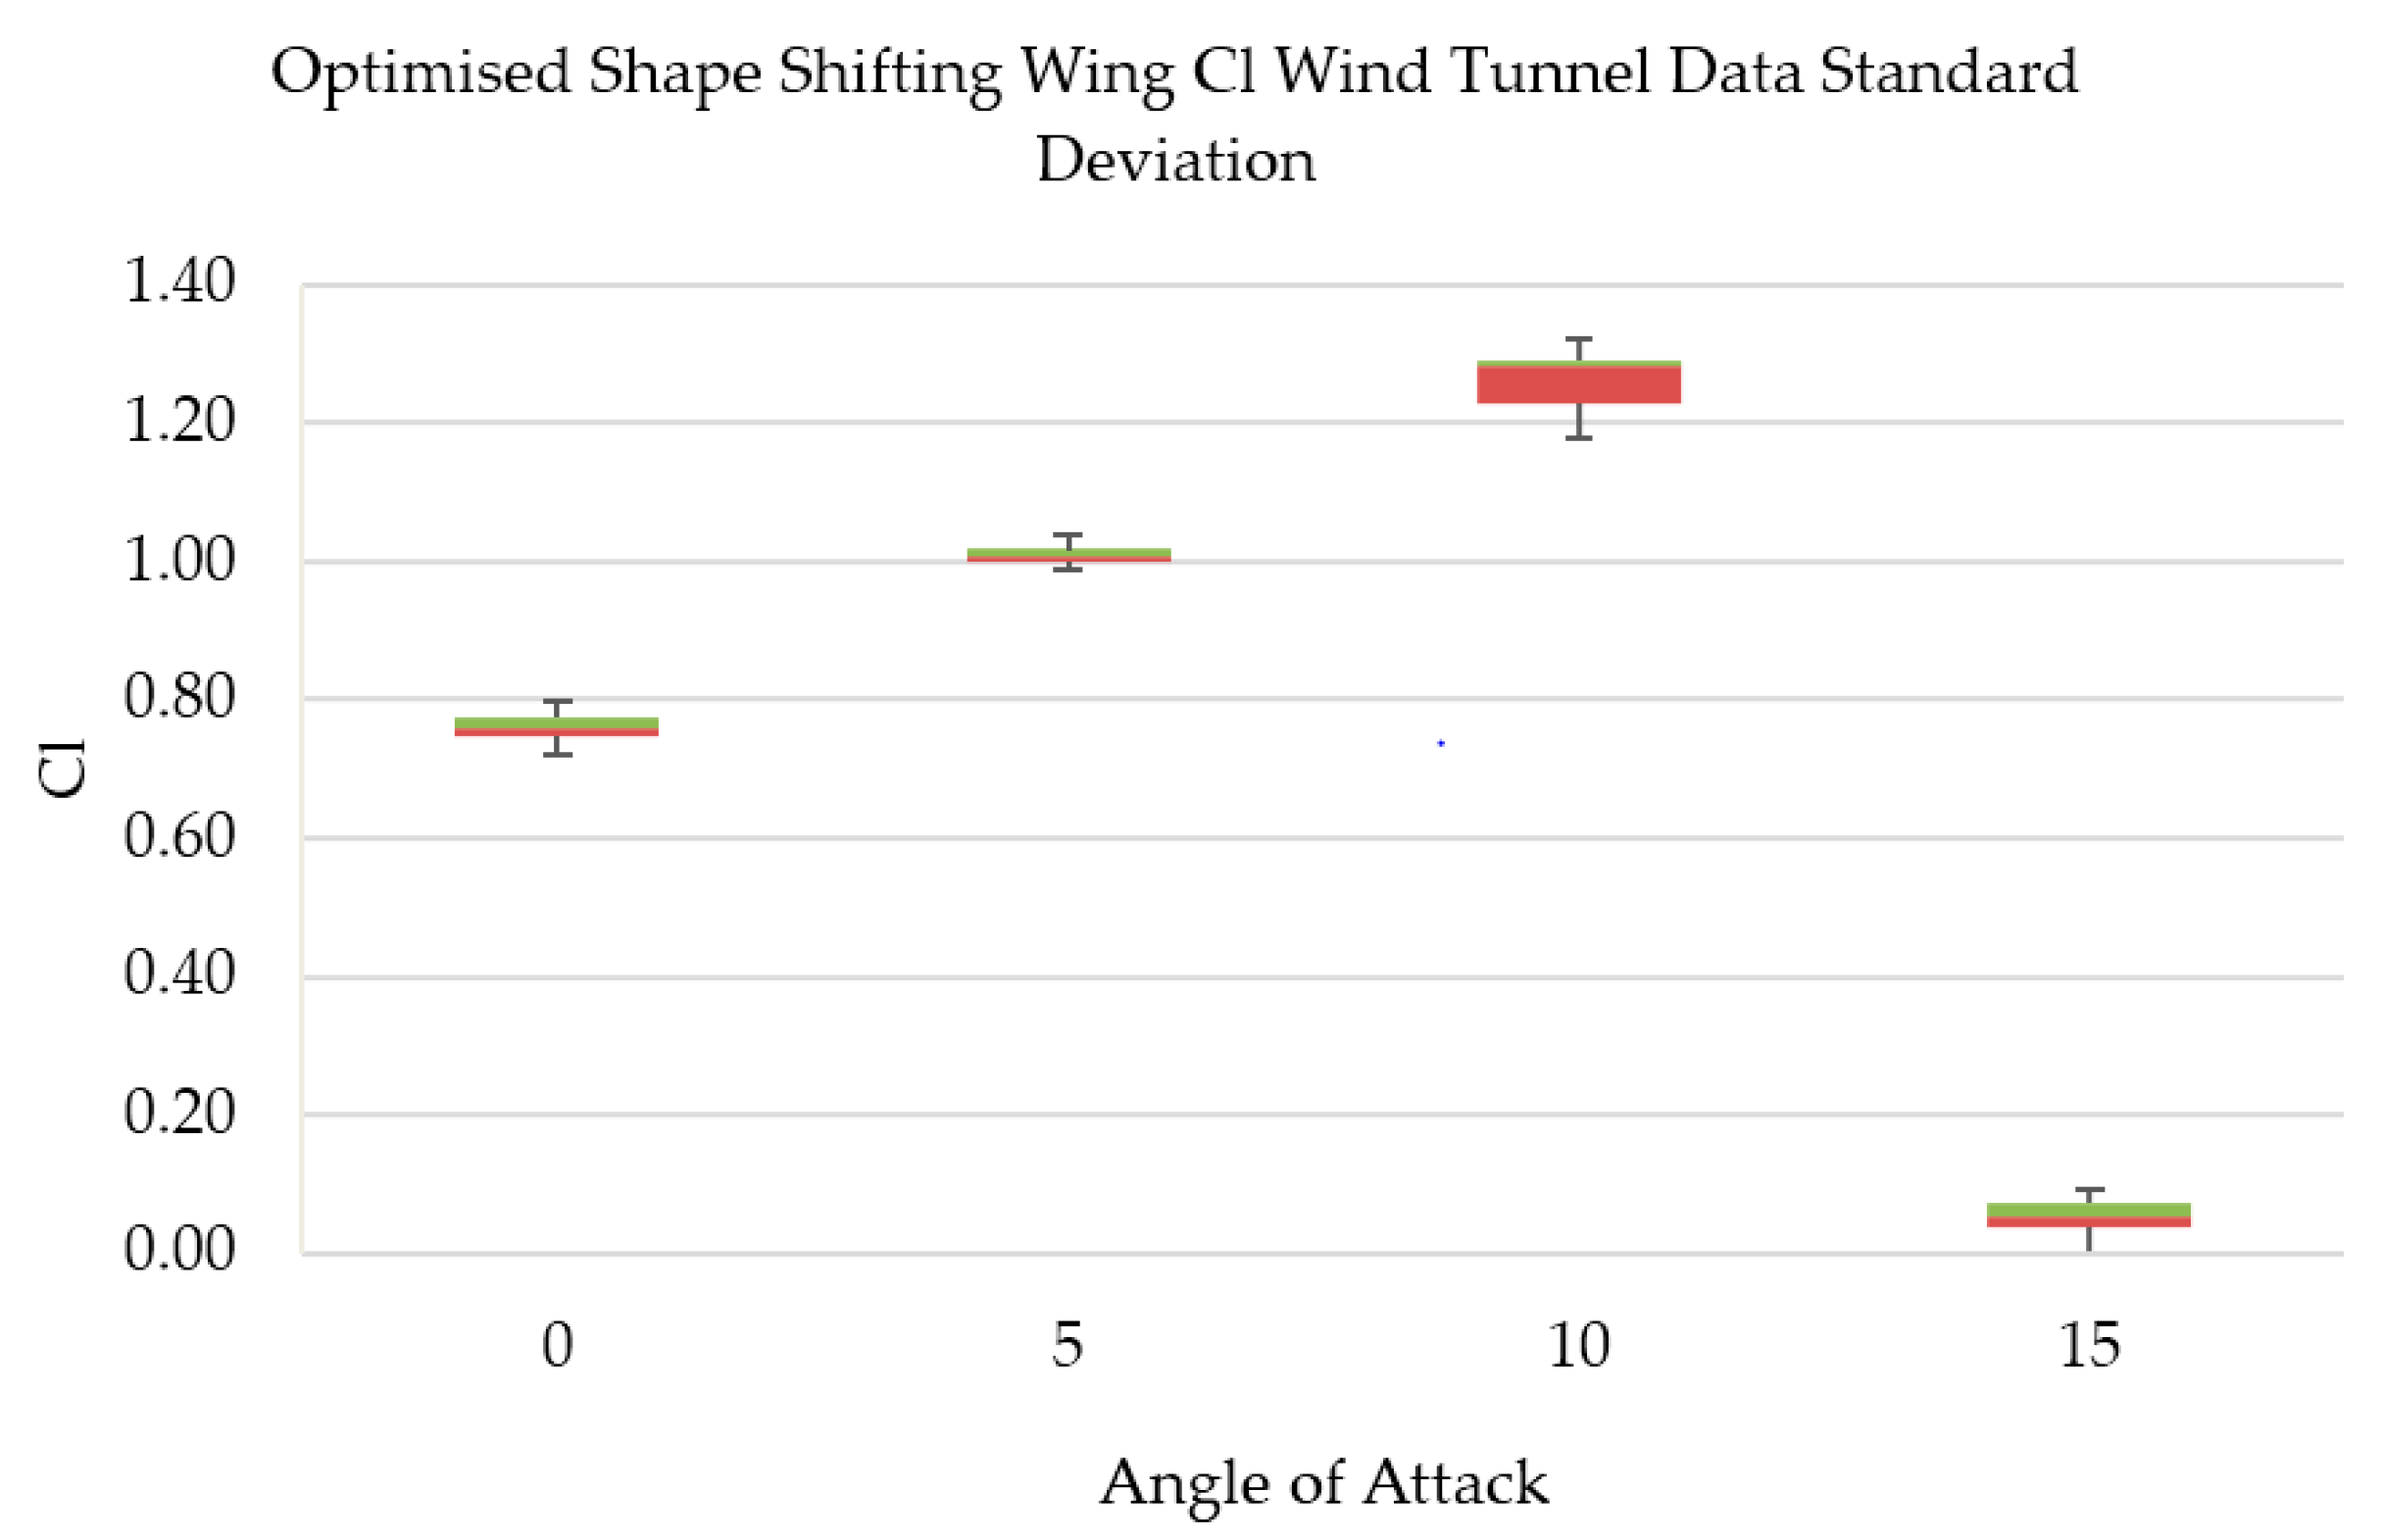
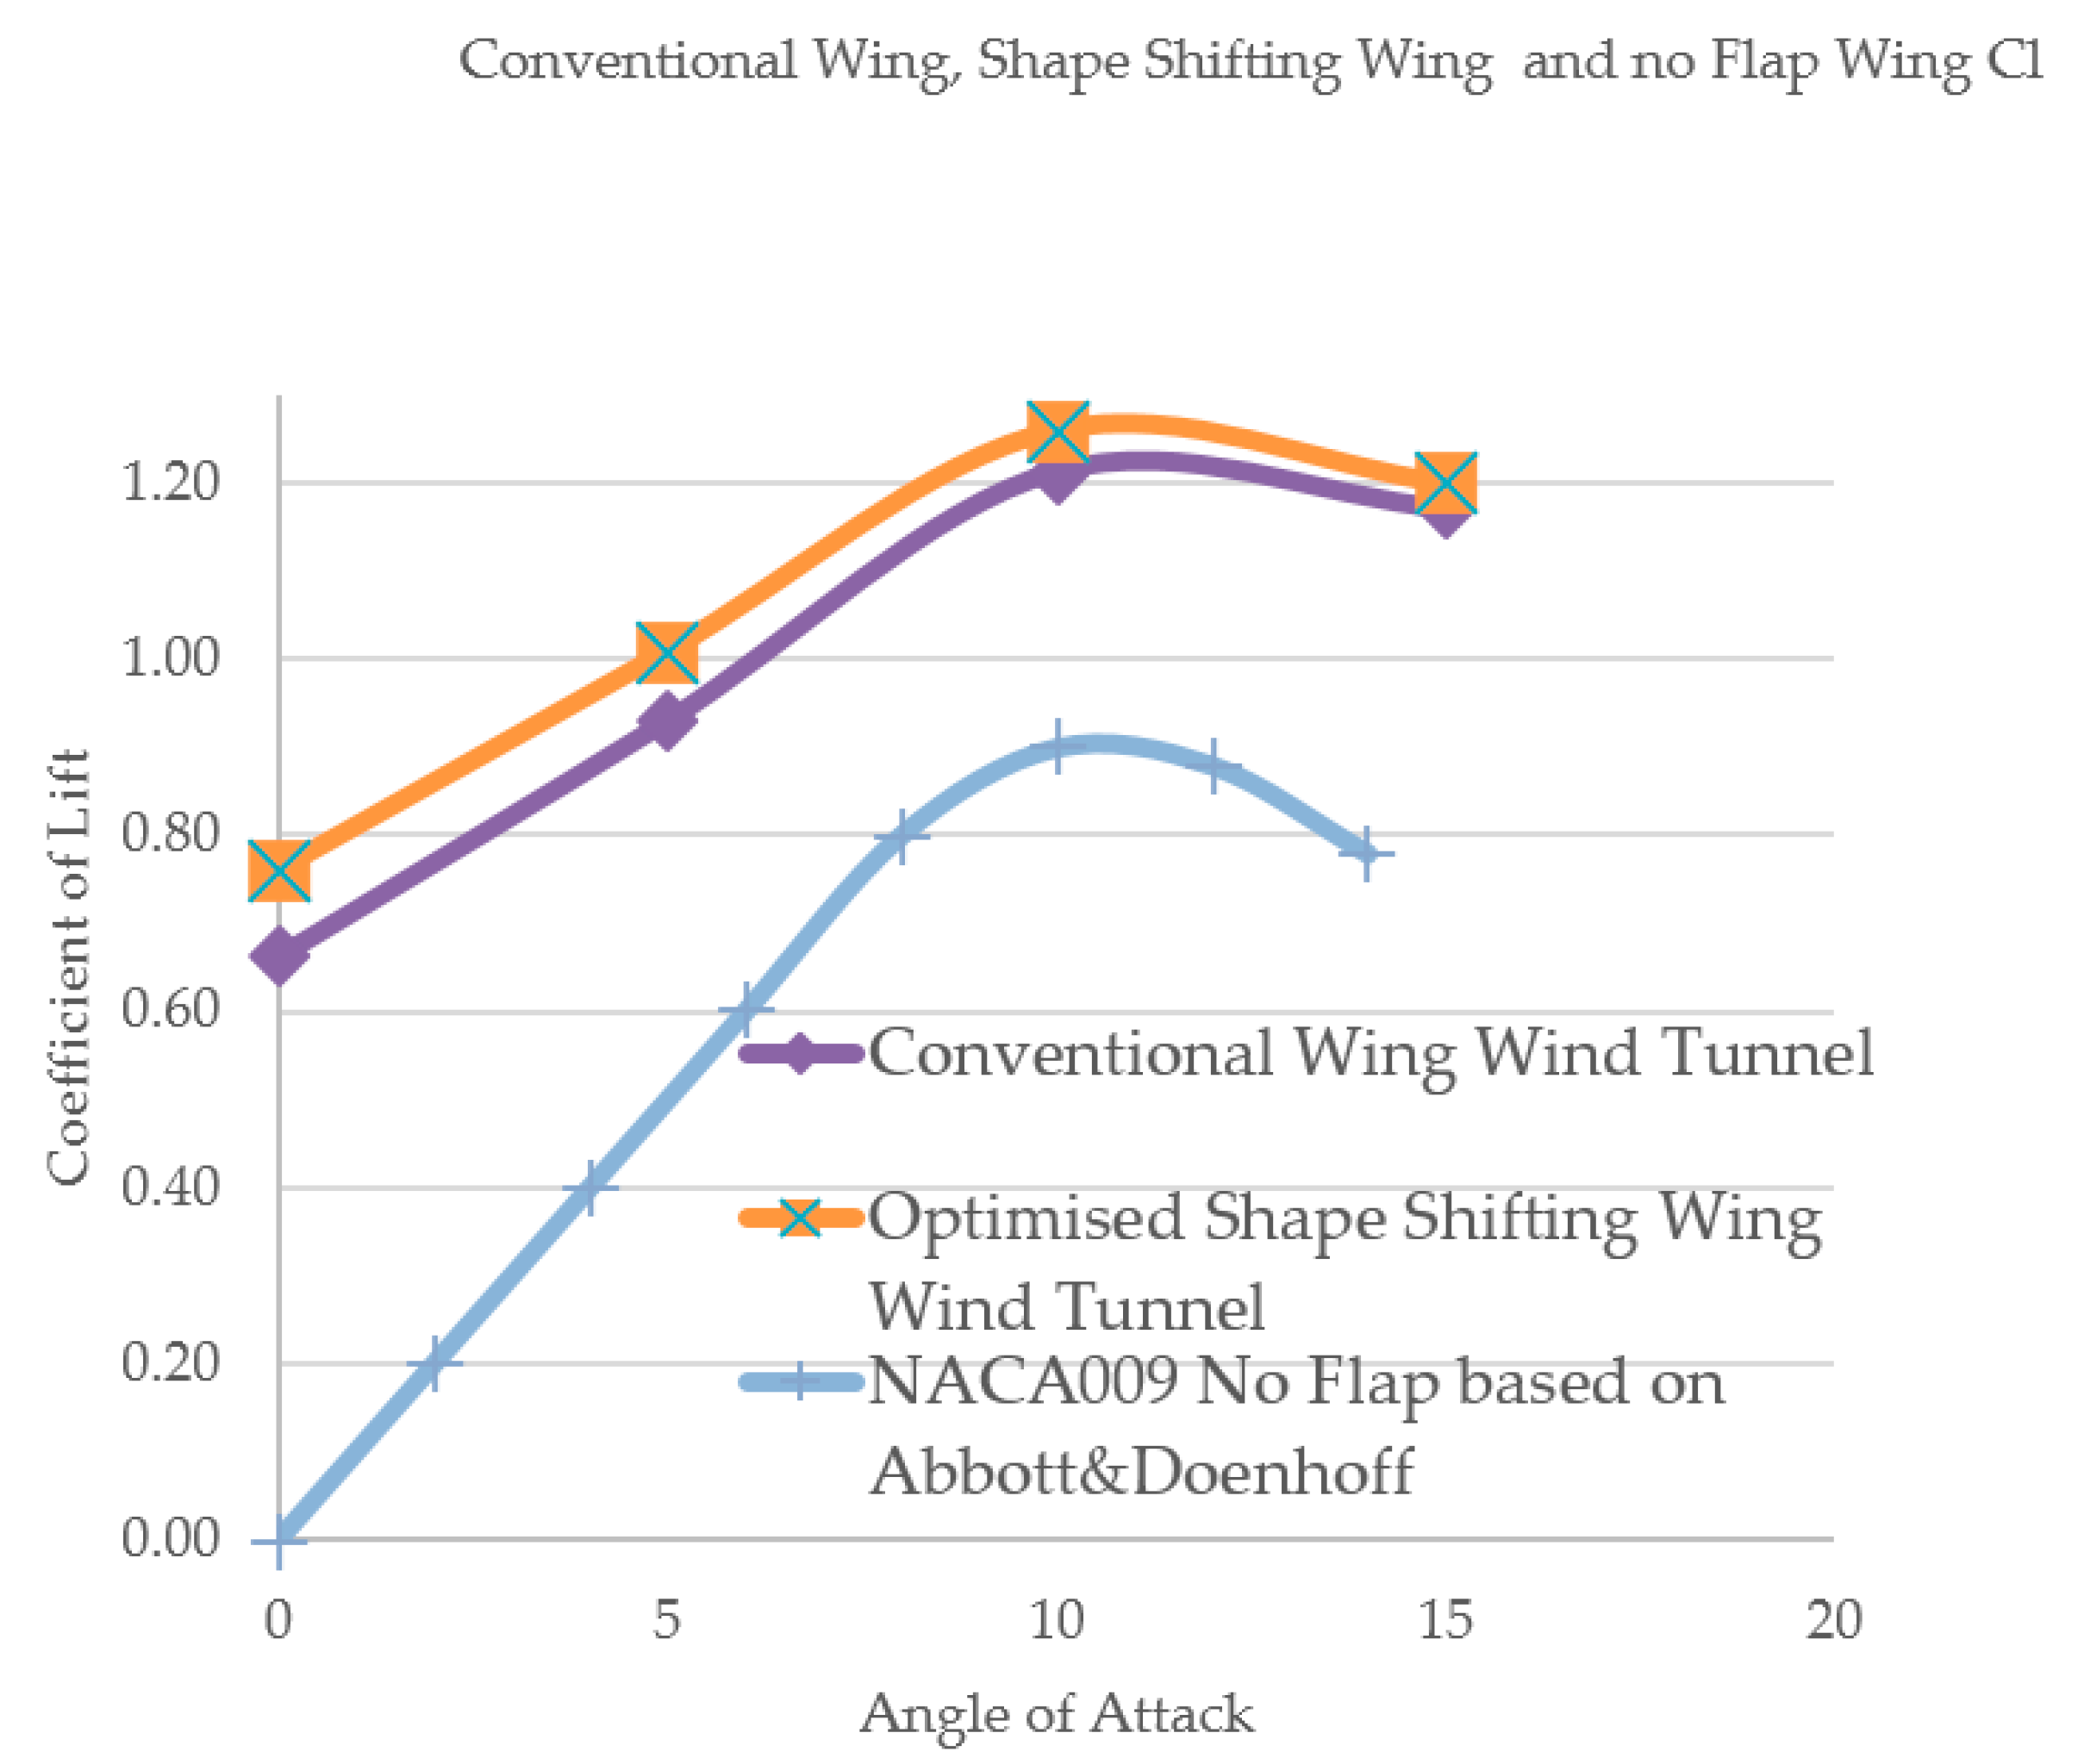
Figure 3, Figure 4, Figure 5 and Figure 6 show standard deviation for all the coefficient of lift and drag data collected during the tests at the wind tunnel, including the interquartile range (indicated by green and brown). The green and brown boxes indicate the difference between the 75th and 25th percentile or the middle 50% of the data’s standard deviation, the maximum and minimum is also shown by the upper and lower whiskers respectively. The experimental data was compared to NACA 009 profile wing with no flap and the above results (with 25 degrees flap deflection) look reasonable see Figure A2 in the Appendix A.
5. Ansys-Fluent Numerical and Experimental Analysis
Ansys-Fluent simulation was carried out at 0, 5, 10 and 15 degrees angle of attack, at 25 m/s.
5.1. Ansys Solver Set-Up
Solver—Each wing was used in Ansys fluent with pressure based, steady state simulations.
Flow Domain—The flow domains geometry is shown in Figure 11, at the leading edge of the aerofoil is a 1 m radius circle which is revolved, then extruded 1.5 m. This allows the formation of vortices while staying within the software’s cell limit. The flow domains details are highlighted in Figure 12.
Turbulence Models—The turbulence models & boundary conditions for all simulations are as follows:
- Energy—On.
- Viscous—K-epsilon, Realizable & Non-equilibrium Wall Functions.
- Boundary Conditions—Turbulent Intensity 5% & Turbulent viscosity ratio 10.
The turbulence models for the wing sections were selected based on information collected from (Ansys, 2006, ANSYS Inc., Canonsburg, PA, USA). Realizable k-epsilon was selected because of the possibility of increased accuracy on RNG k-epsilon. It was also selected because of its high accuracy for high boundary layer separation and large vortices.
5.2. Conventional Wing Ansys Simulation
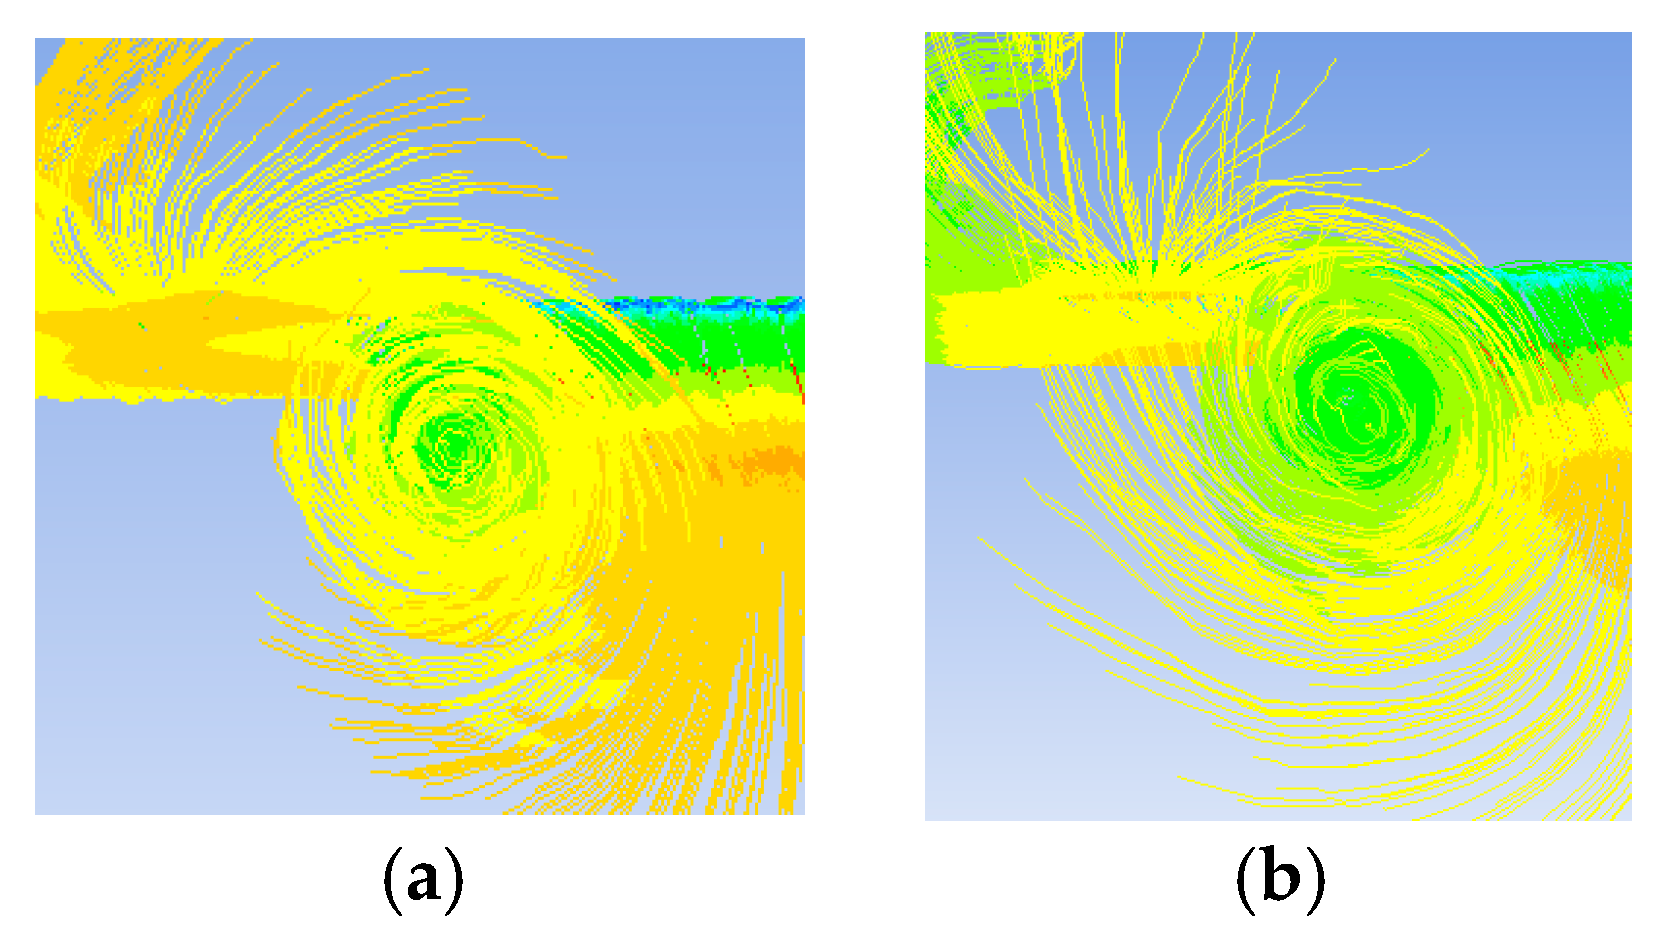
Figure 13 shows the pressure coefficients of the flow over the conventional aerofoil, the pressure of the flow around the flap, vortices and in the vortices wake is slightly lower than the rest of the wings wake. The lift-induced drag reduced the pressure of the wing causing an increase in pressure drag; this can be seen in Figure 13 as there is a significant pressure difference between the vortices generated and the rest of the wings wake. The pressure coefficient in the centre of the vortices is considerably lower than rest of the wake, shown in Figure 14. This creates pressure drag on the wing, by pushing the flap downward reducing the overall lift production. In addition, as the angle of attack is increased the vortex size and intensity were further increased. This was corroborated by Figure 15. Figure 15, illustrates vortices generated for conventional wing with an angle of attack of 0 and 5 degrees respectively, showing a larger vortex being generated by the flap of the wing. This had demonstrated that Ansys is simulating correctly the flow field and therefore ensuring accurate results are being produced for further simulation.
5.3. Initial Morphing Wing Ansys Simulation
Figure 16 shows the coefficient of lift data generated by Ansys, a significant increase in coefficient of lift when comparing the initial morphing wing and conventional wing.
The simulation data shows that at 0, 5, 10 and 15 degrees’ angle of attack, there is an increase in lift by 10.8%, 4.3%, 3.4% and 1% respectively. Figure 17 is a Cd versus Cl graph. The data shows that the initial morphing wing is more aerodynamically efficient than the conventional wing. The initial morphing wing at 0, 5, 10 and 15 degrees angle of attack produces 10.8%, 4.3%, 3.4% and 1% more lift respectively, as well as a maximum of 2.5% reduction in drag. Figure 18 shows the lift-to-drag ratio, or glide ratio, this graph shows a wings ability to glide during flight. A higher glide ratio means the aircraft will be able to travel further distance without losing as much altitude.
The initial morphing wing has a significantly higher glide ratio than the conventional wing, especially at low angles of attack. This implies less engine power will be required during flight to maintain altitude and therefore less fuel consumption. At 0, 5, 10 and 15 degrees angle of attack the initial morphing wing has an increase in glide ratio of 13.6%, 5.3%, 5.8% and 3.1% respectively.
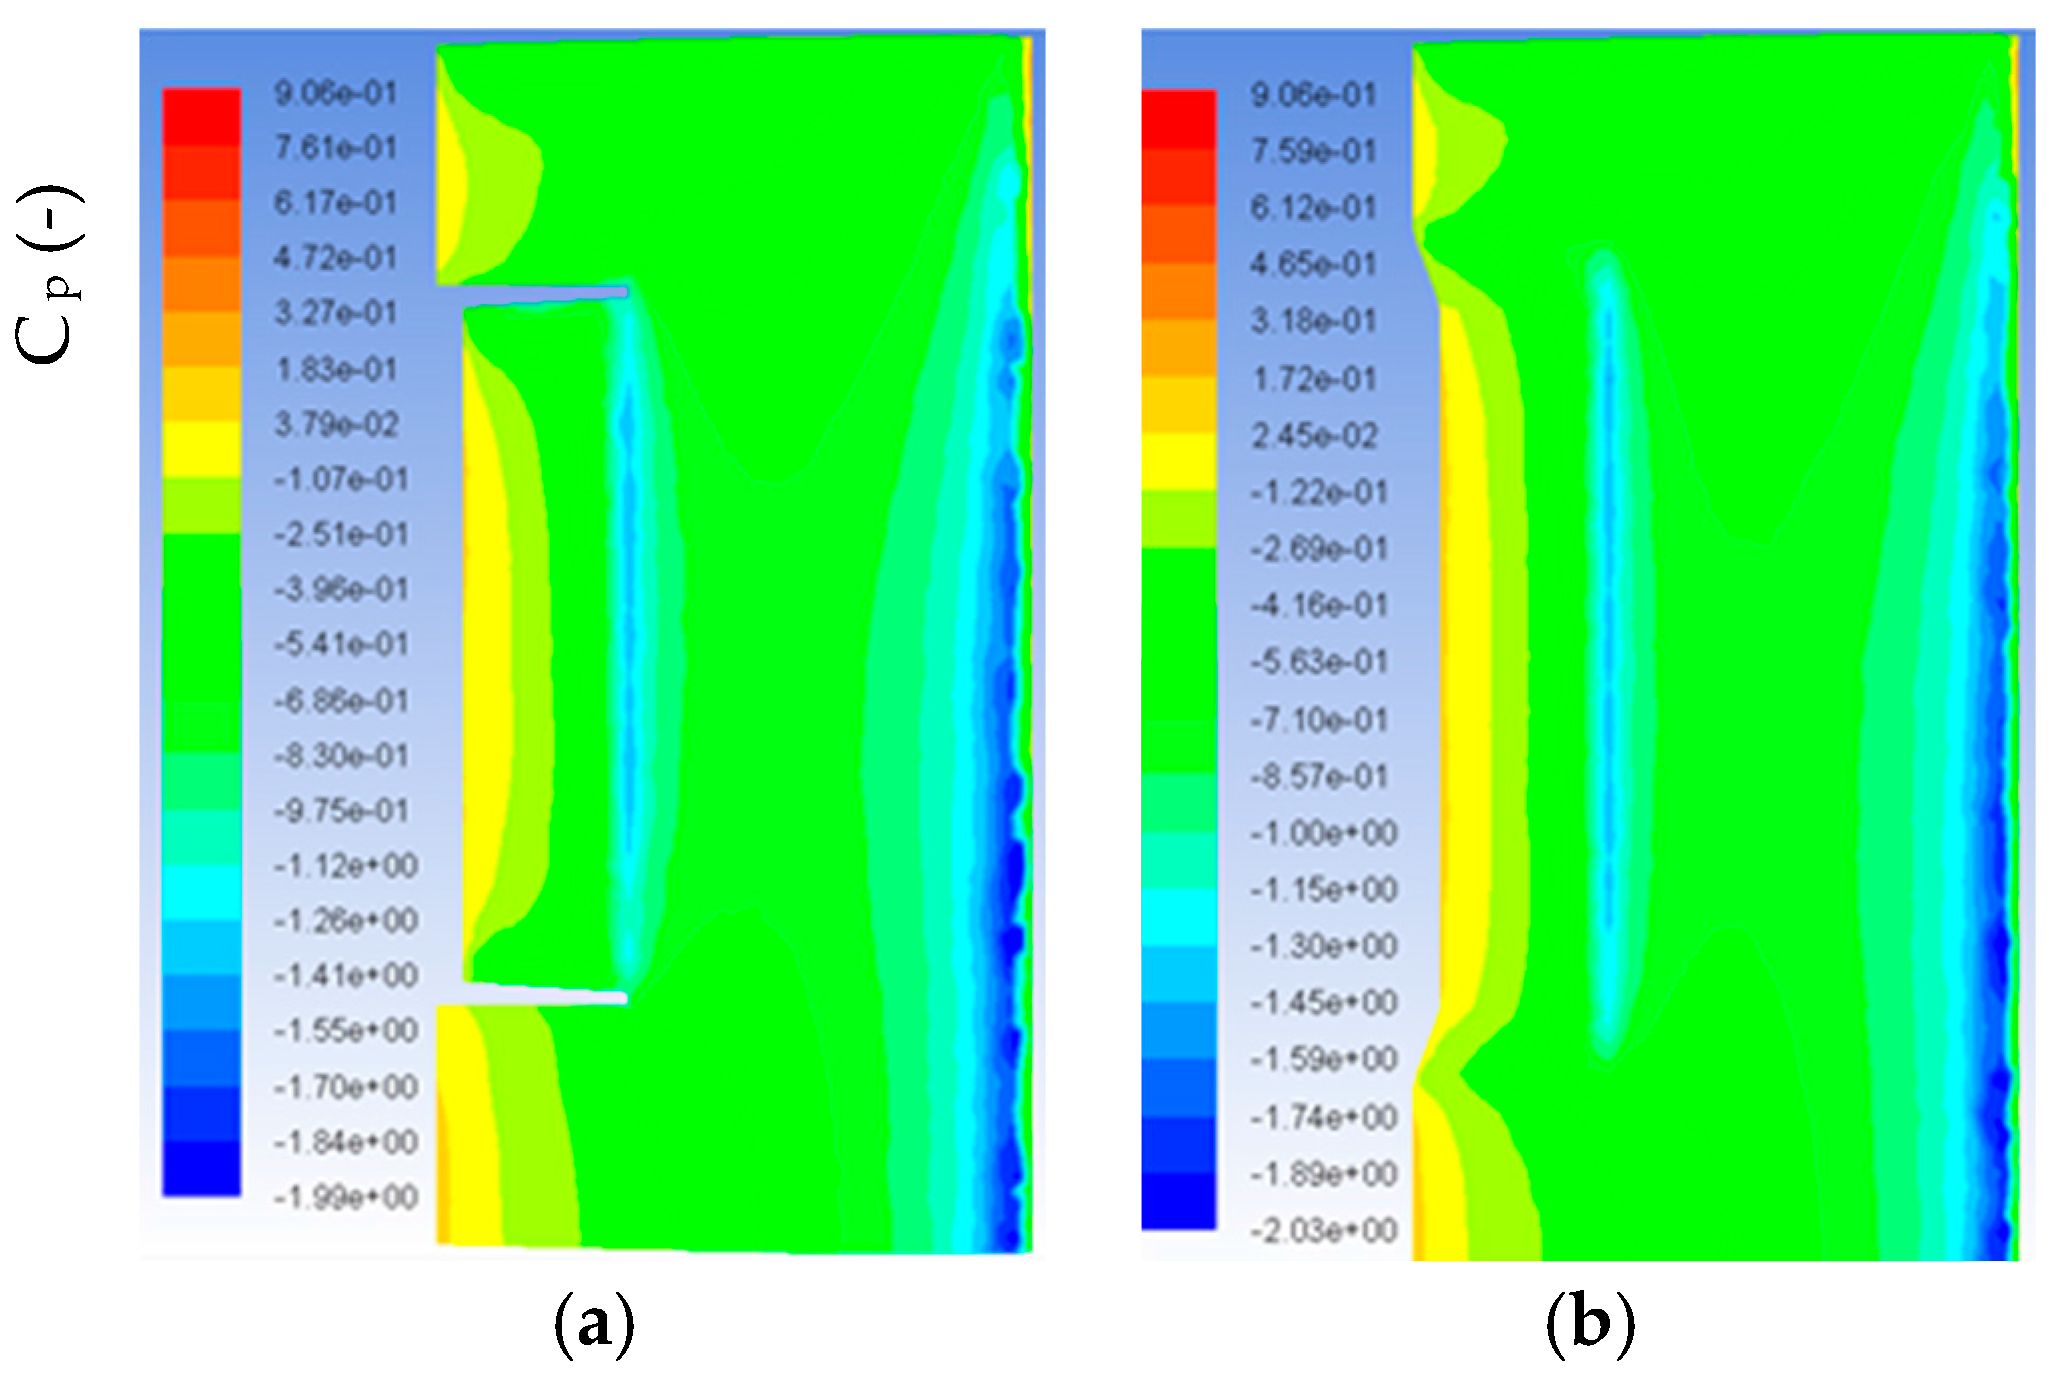
Figure 19 shows the pressure coefficients over the lower side of the conventional wing and initial morphing wing respectively. The conventional wings pressure at the flap is slightly lower and became suddenly lower at the flap dislocation from the wing surface. This is because of lift-induced drag, which results in sudden pressure drop and therefore increases in pressure drag as well as reduction in lift production.
The initial morphing wing in Figure 19 doesn’t suffer from this, because there is no gap between the flap and the wing surface, the pressure distribution is enhanced along the lower surface of the wing. The pressure on the lower surface of the initial morphing wing is also slightly higher as compared to the conventional wing. The elimination of the gaps between flap and wing surface caused the pressure along the bottom of the morphing wing to increase and pressure distribution enhancement was experienced over the wings surface. Therefore, aerodynamic performance as compared to conventional wing was enhanced due to lift increase and a reduction in pressure drag along the wing.
5.4. Optimized Morphing Wing Simulation
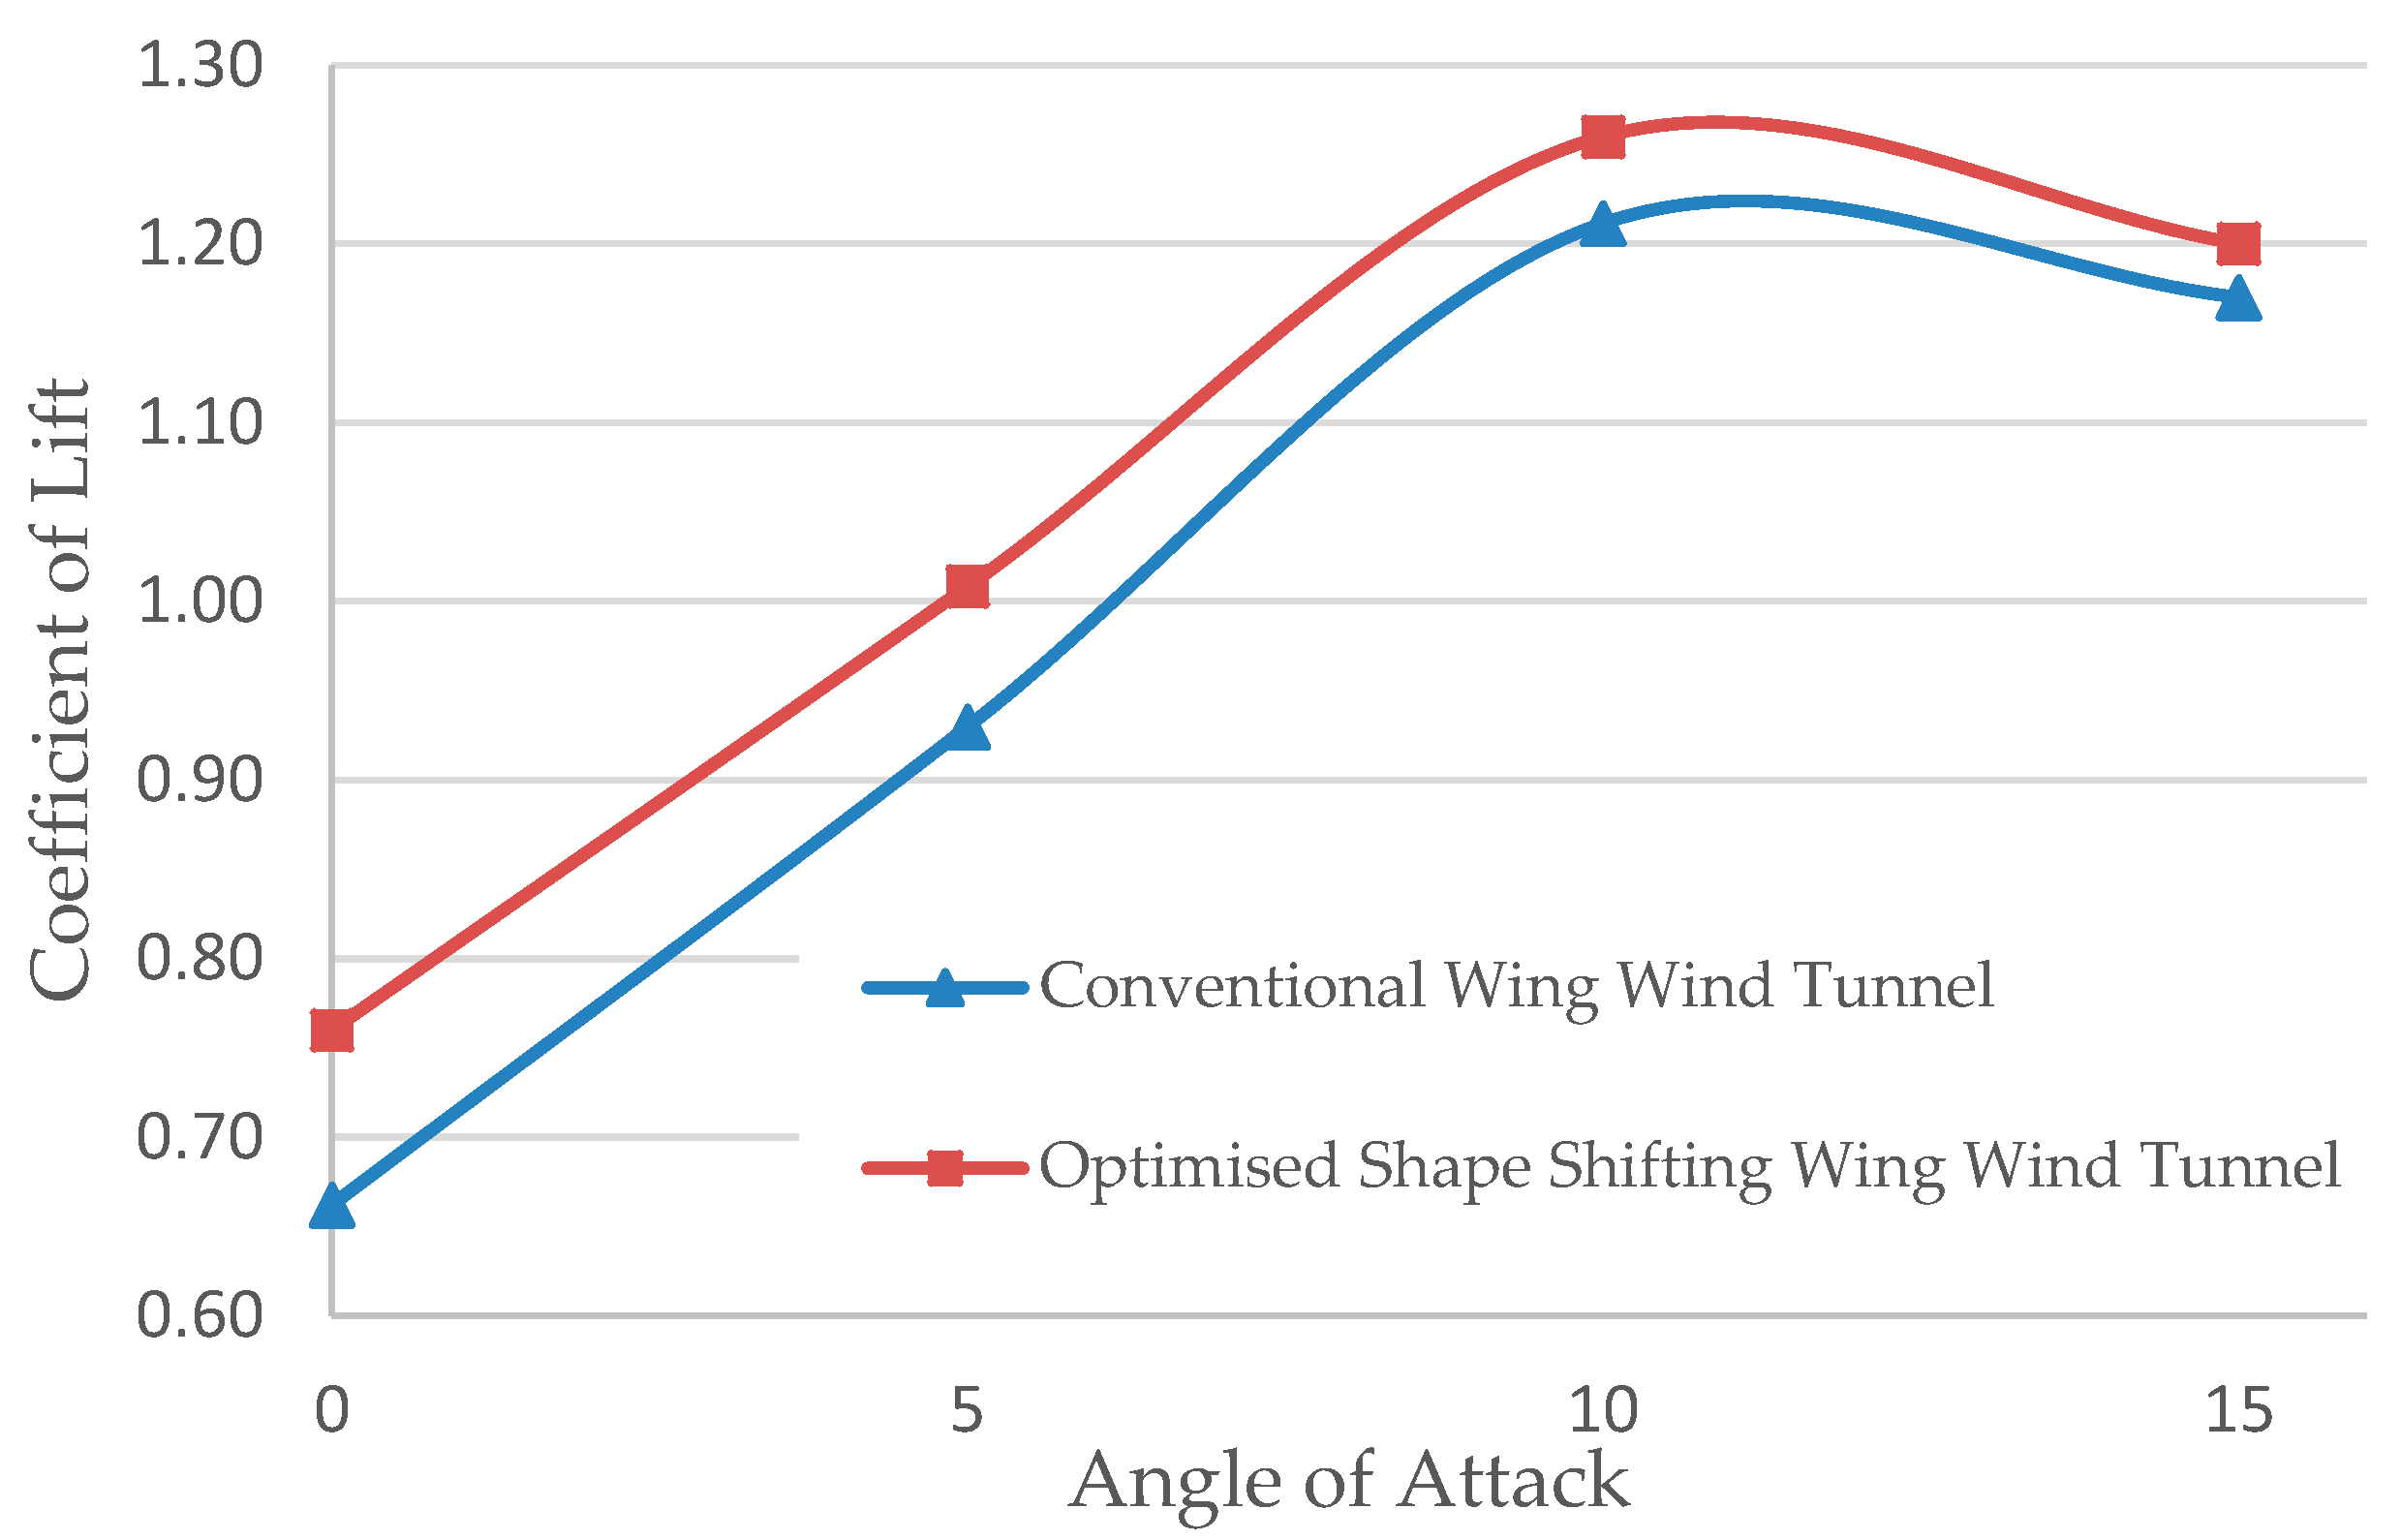
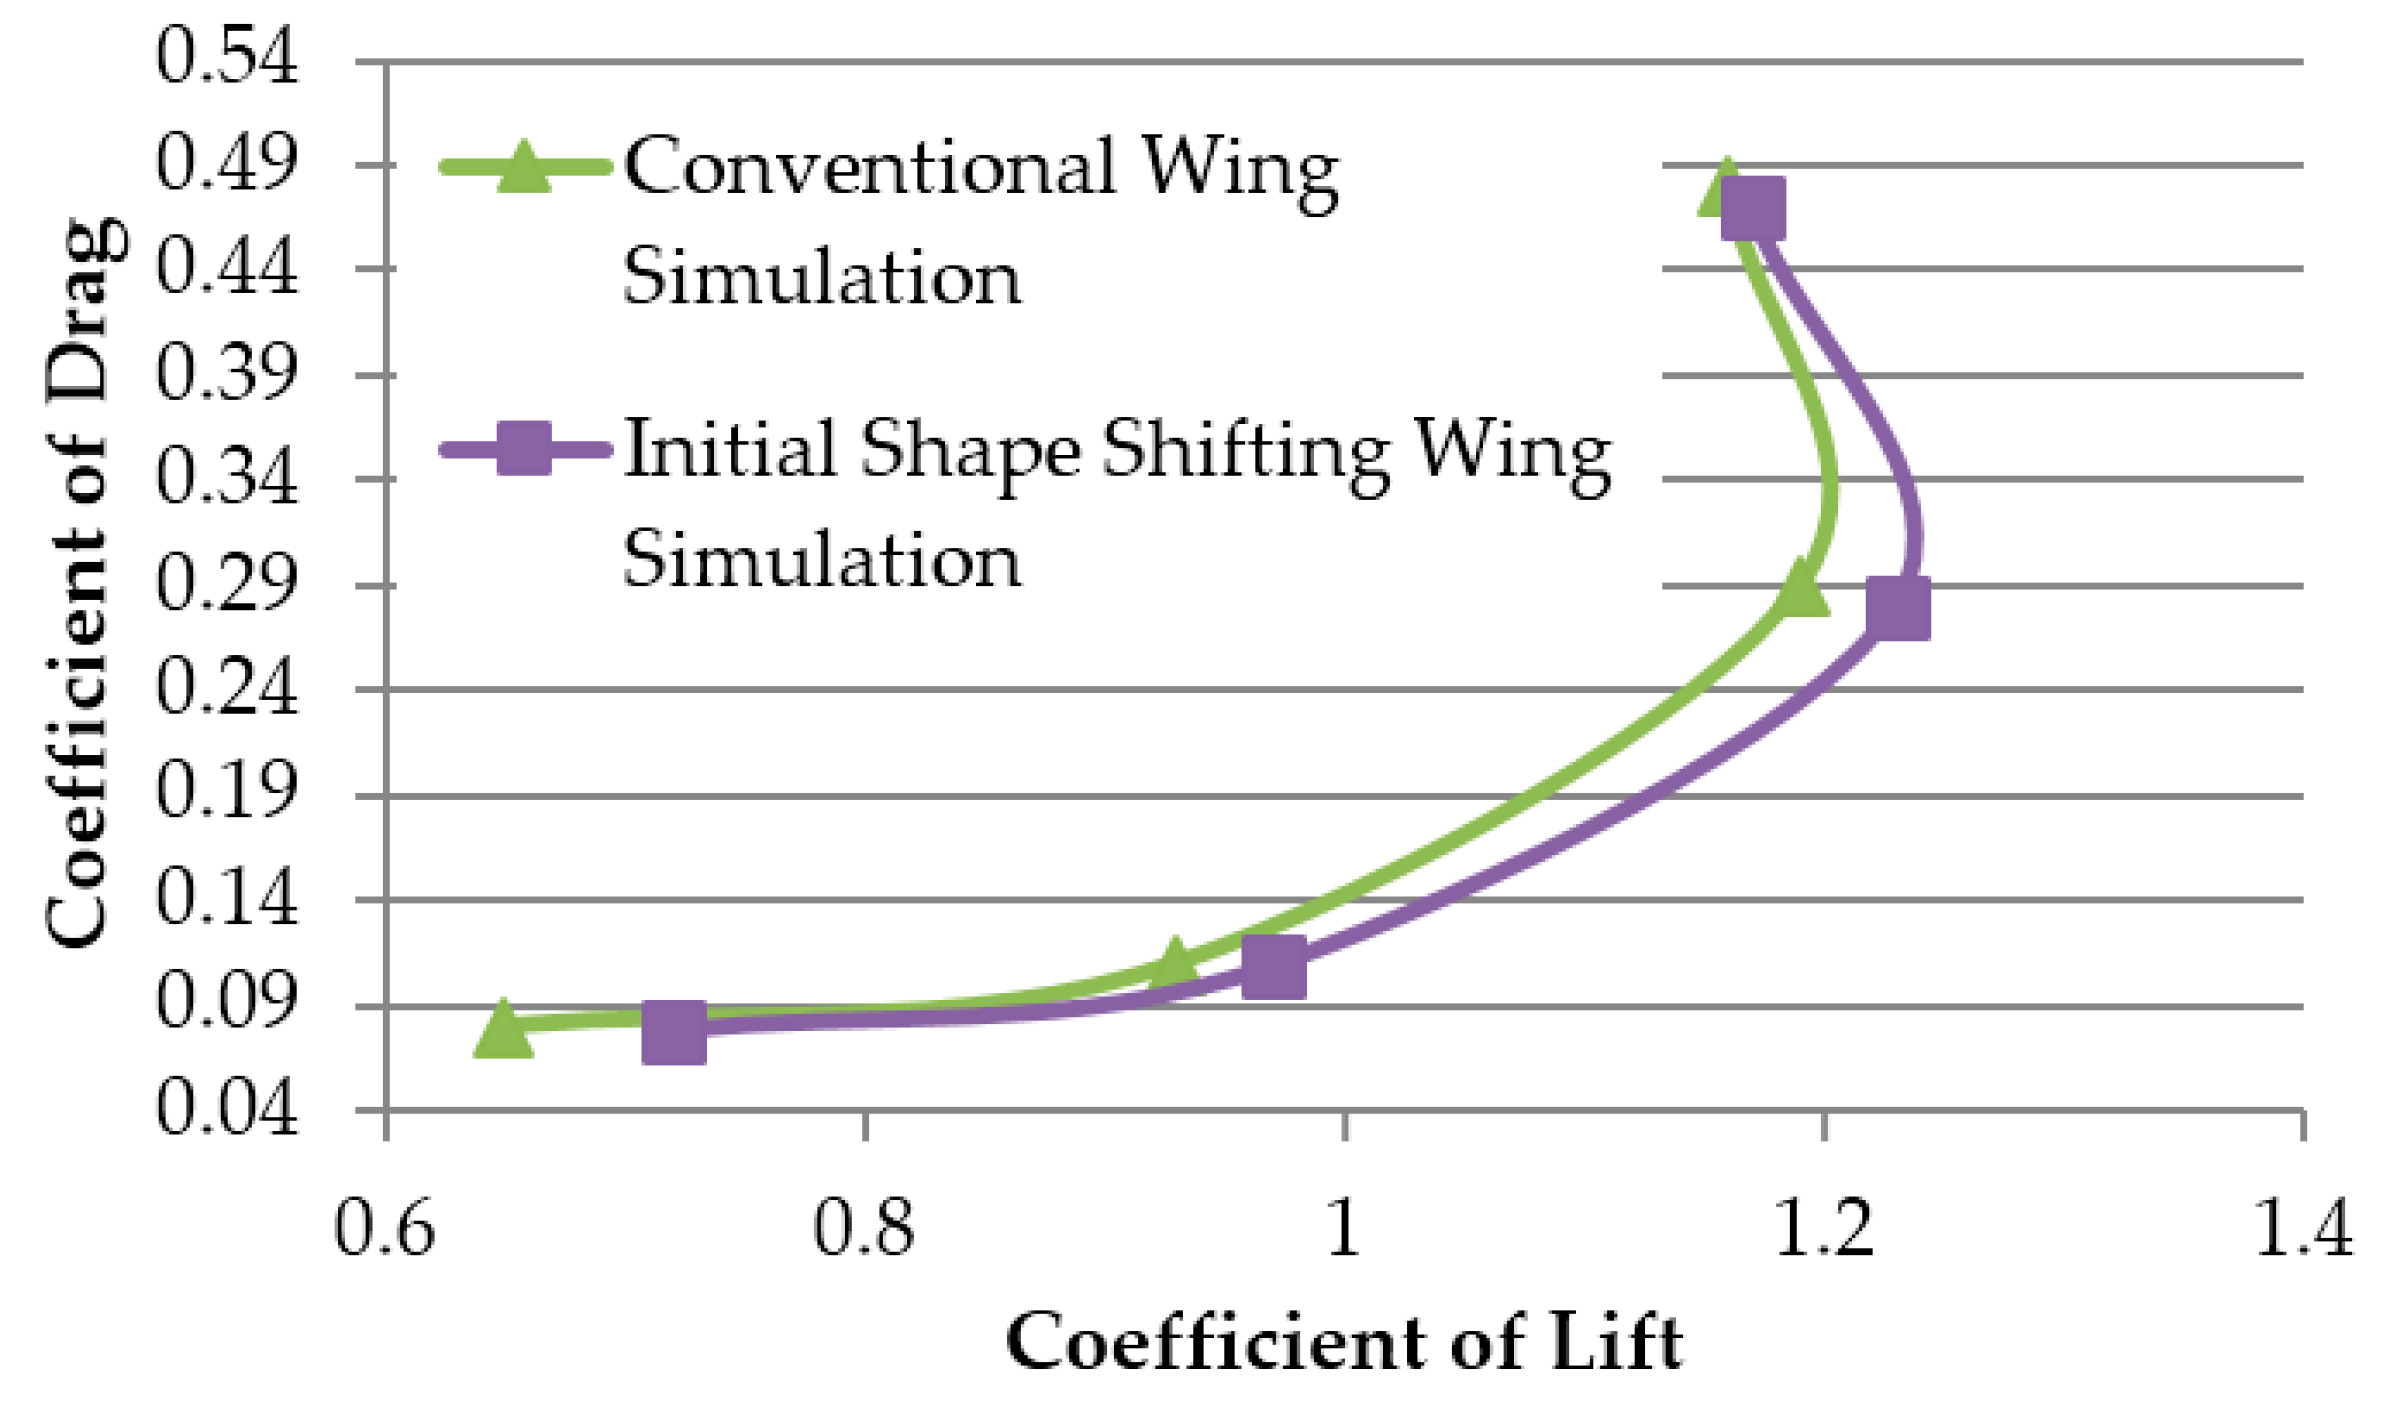
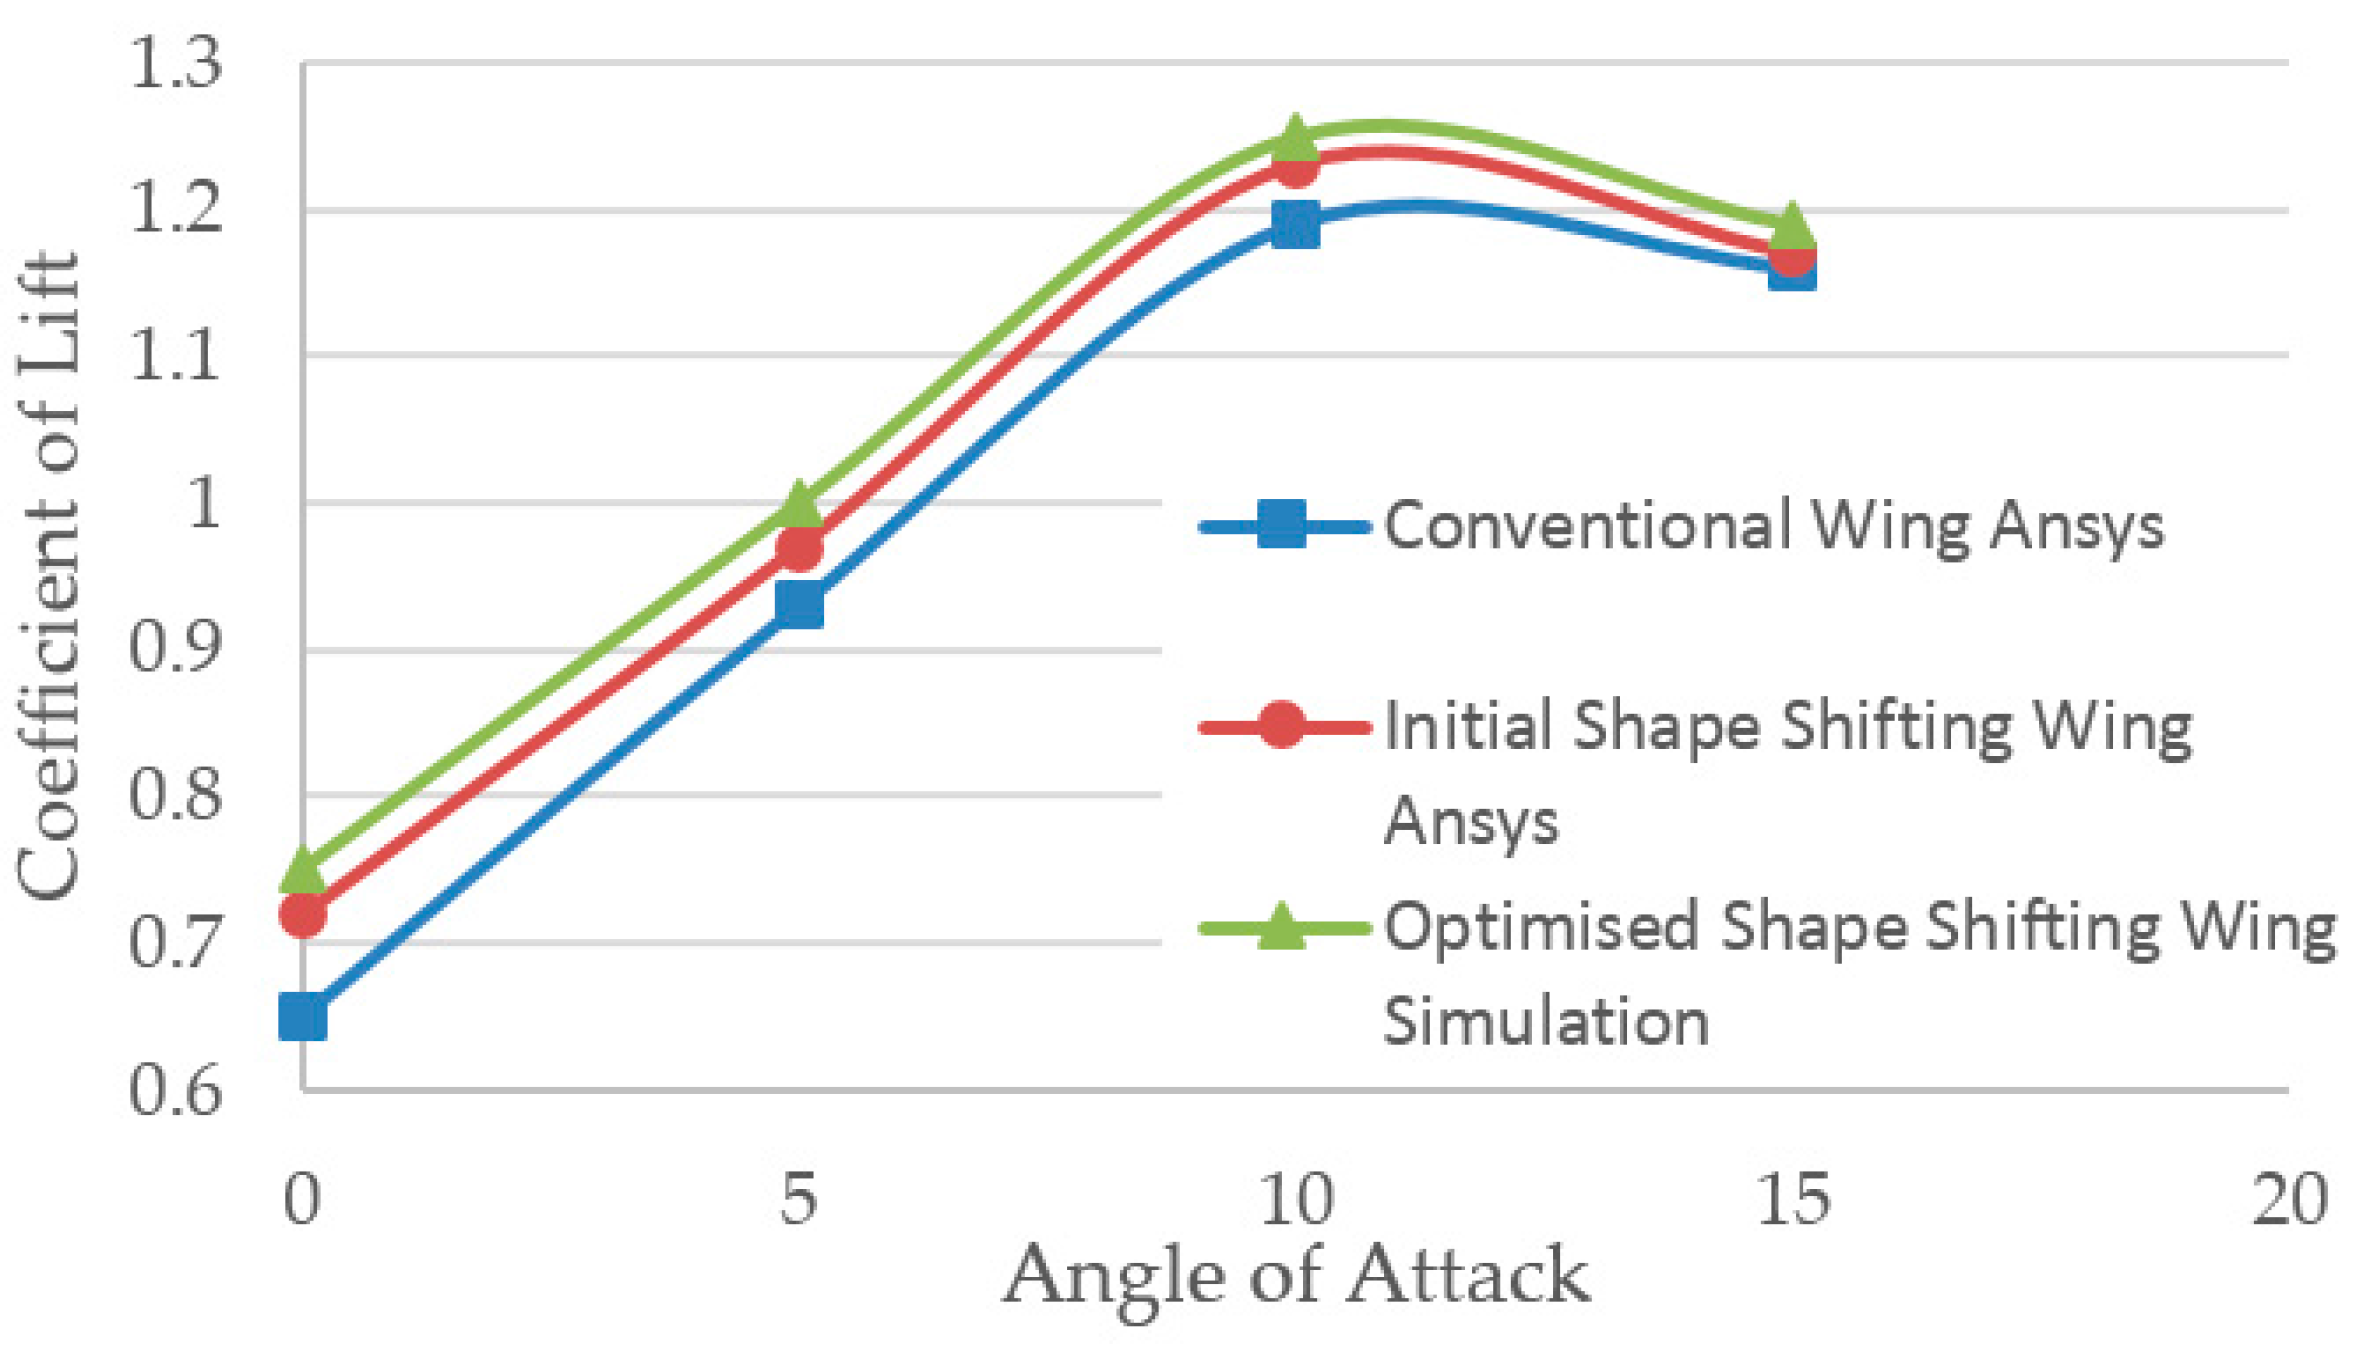
Figure 20 shows the coefficients of lift for all the wings, each design has a significant increase in coefficient of lift, the highest being the optimized morphing wing. Overall at 0, 5, 10 and 15 degrees angle of attack the optimized morphing wing have an increase in lift by 15.4%, 7.5%, 5% and 1.8% respectively when compared to the conventional wing. At 0, 5, 10 and 15 degrees the optimized wing has an increase of 4.6%, 3.2%, 1.7% and 0.9% respectively, when compared to the initial shape shifting wing.
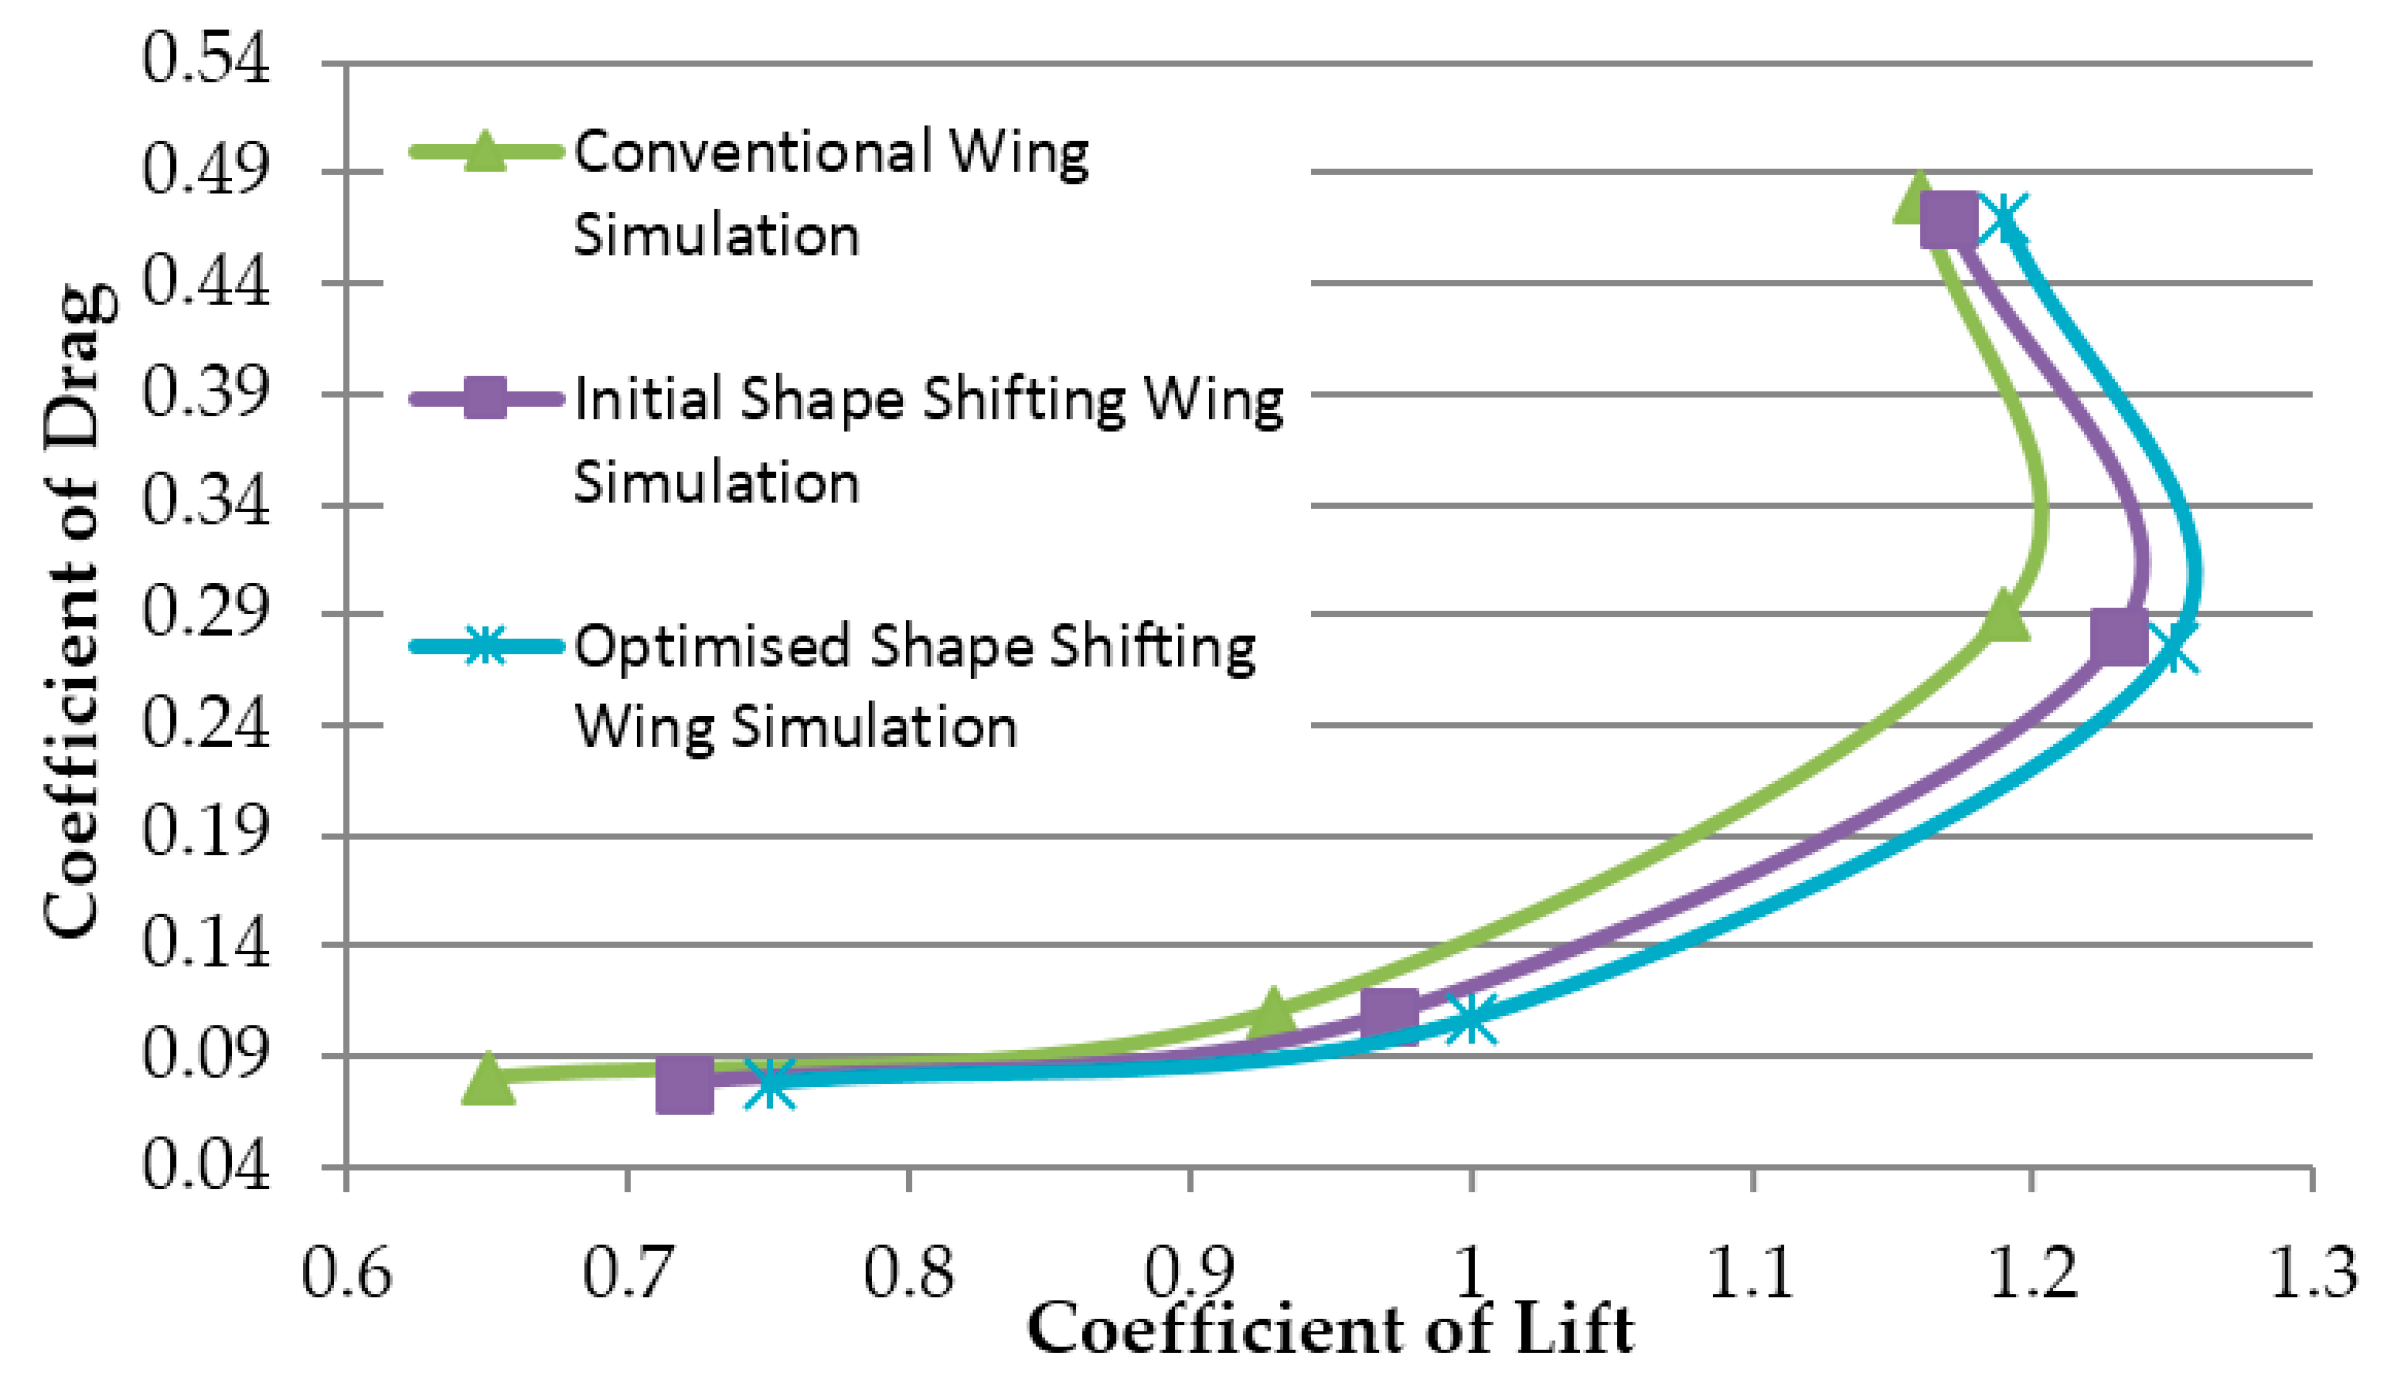
Figure 21 shows an efficiency graph for all three wing designs, using coefficient of drag over coefficient of lift. Lift production for each of the morphing wings was enhanced compared with conventional wing, while producing less drag. Conventional wing to the optimized morphing wing comparison revealed up to 5% drag reduction was experienced by the optimized morphing wing dependent on angle of attack. The optimized morphing wing to the initial shape shifting wing comparison showed drag reduction by up to 2.7%. Figure 22 illustrates lift-to-drag ratio or glide ratio highest magnitude increase is evident for the optimized morphing wing. At angles of attack of 0, 5, 10 and 15 degrees the optimized wing has an increase in lift-to-drag ratio of 18.3%, 10.5%, 10.6% and 4% respectively, compared with the conventional wing. While the optimized wing compared with the initial morphing wing has an increase of 4.7%, 5.3%, 4.8% and 0.9% at 0, 5, 10 and 15 degrees respectively.
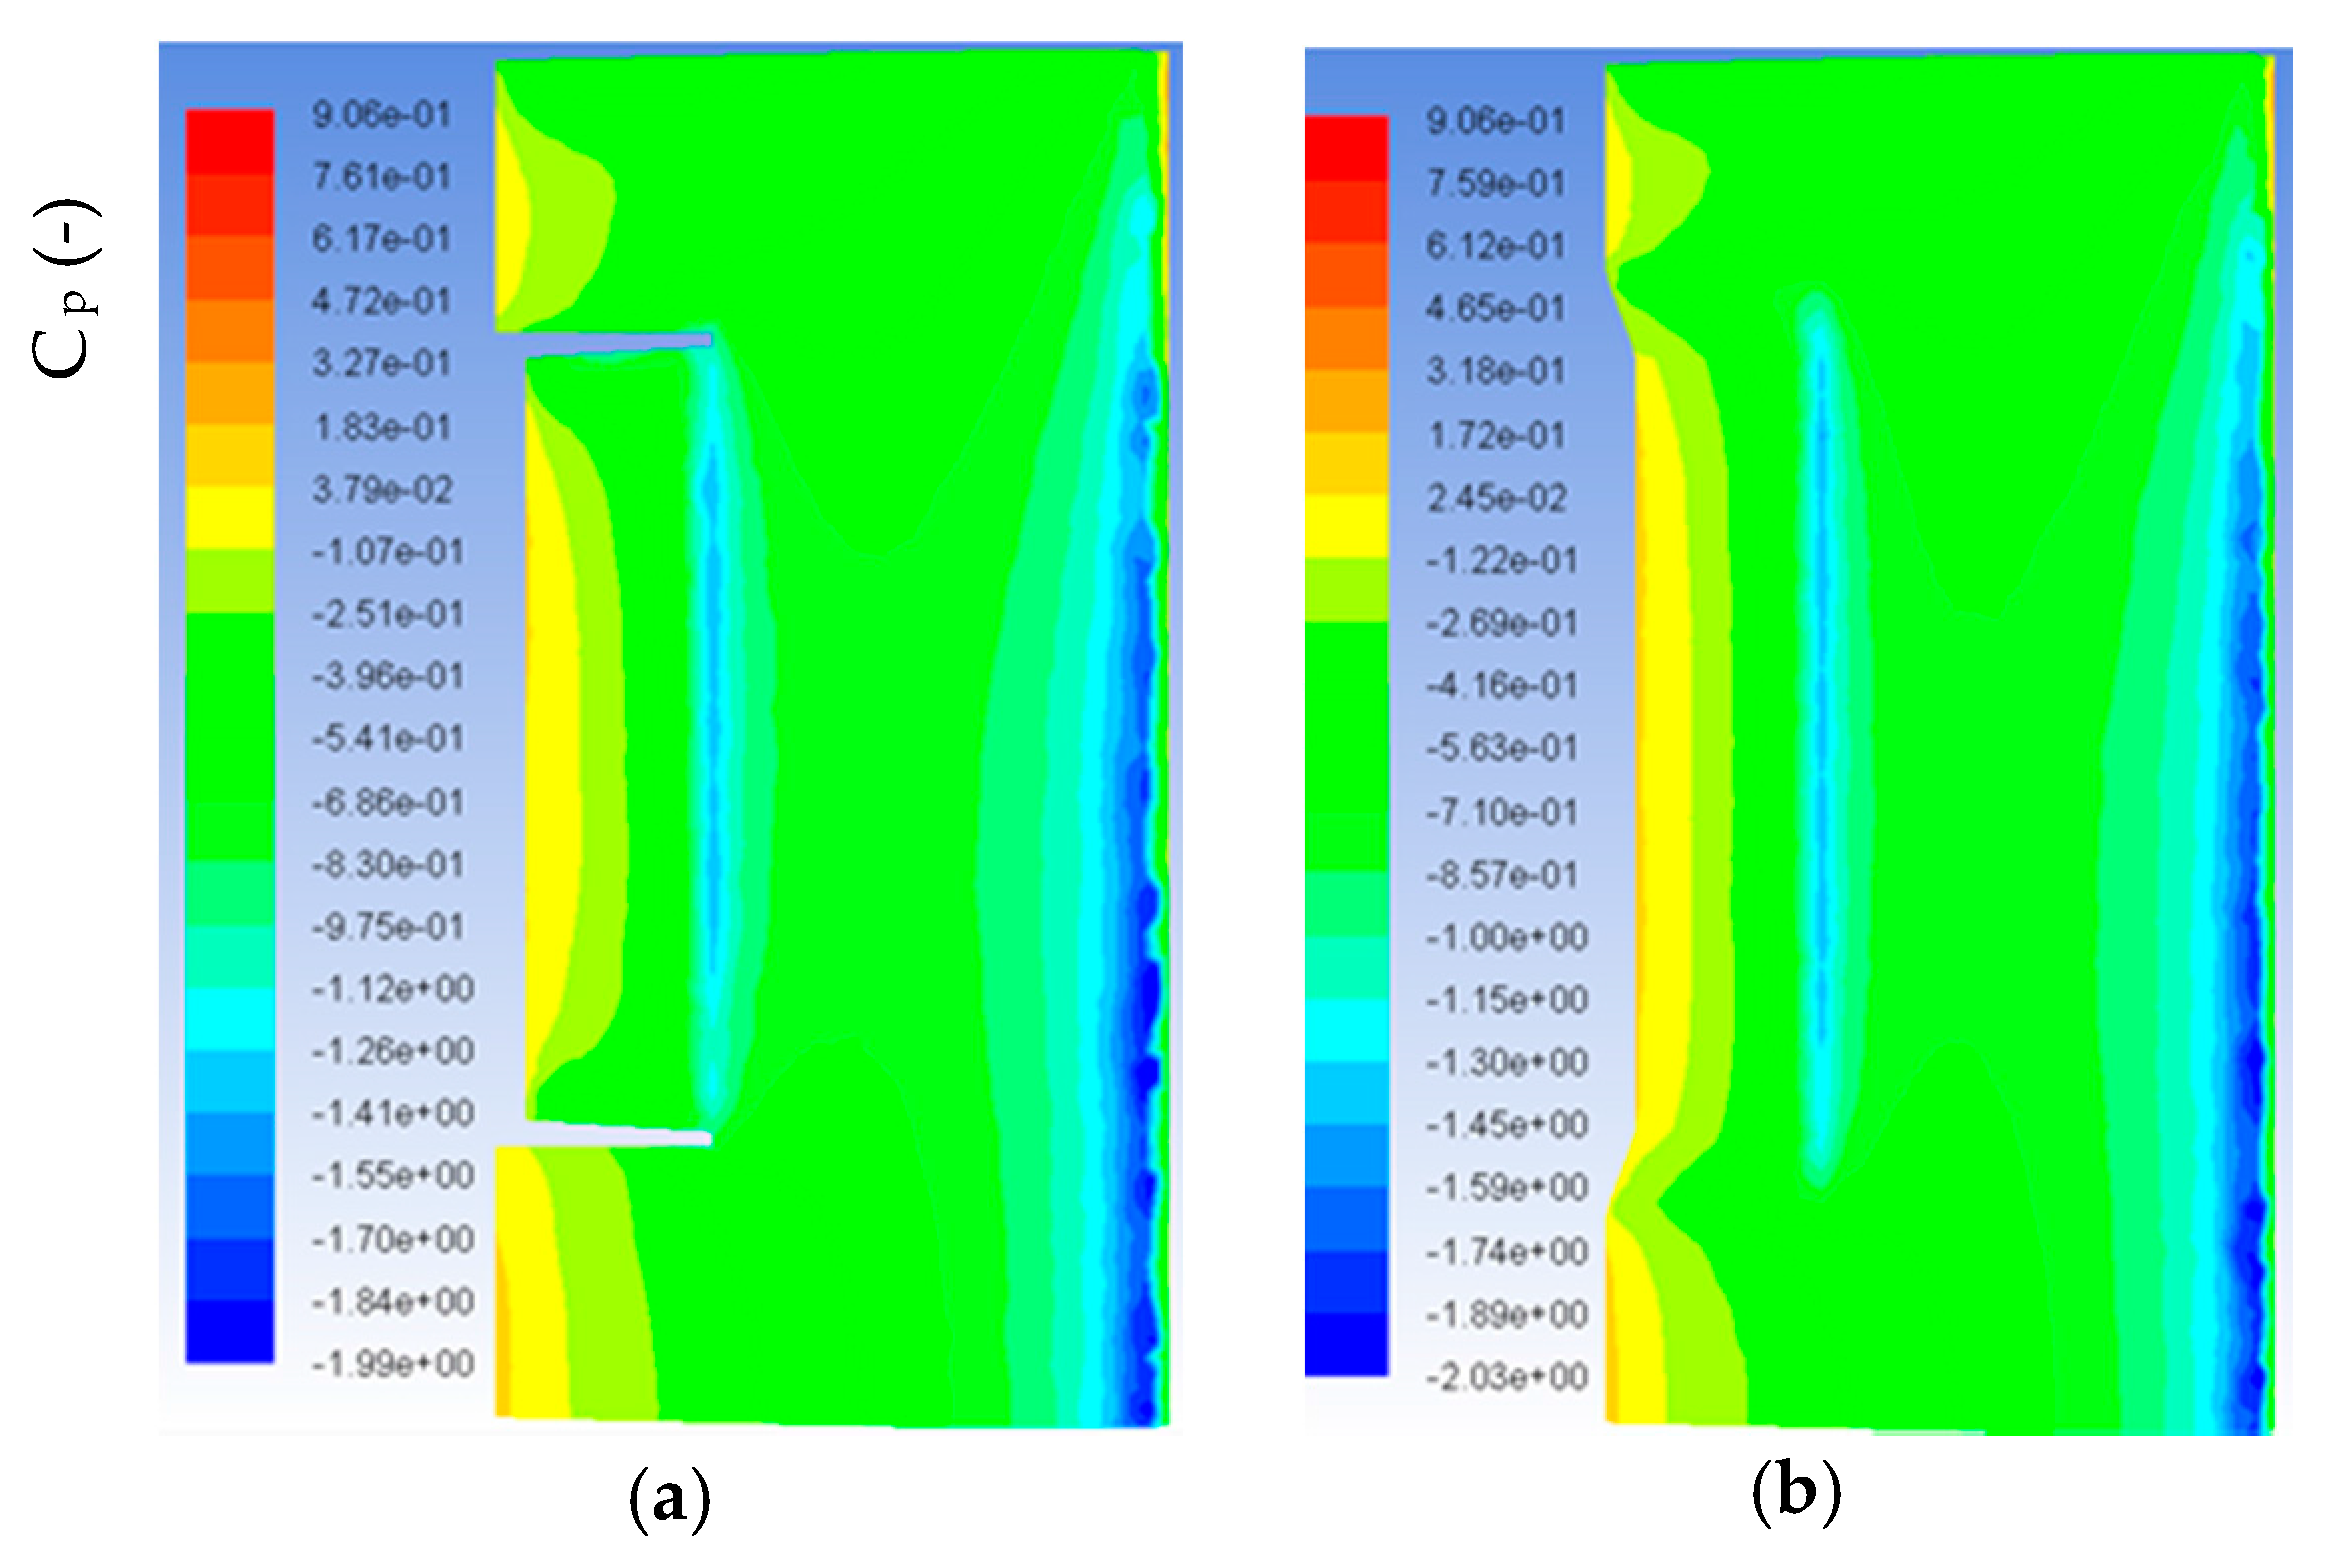
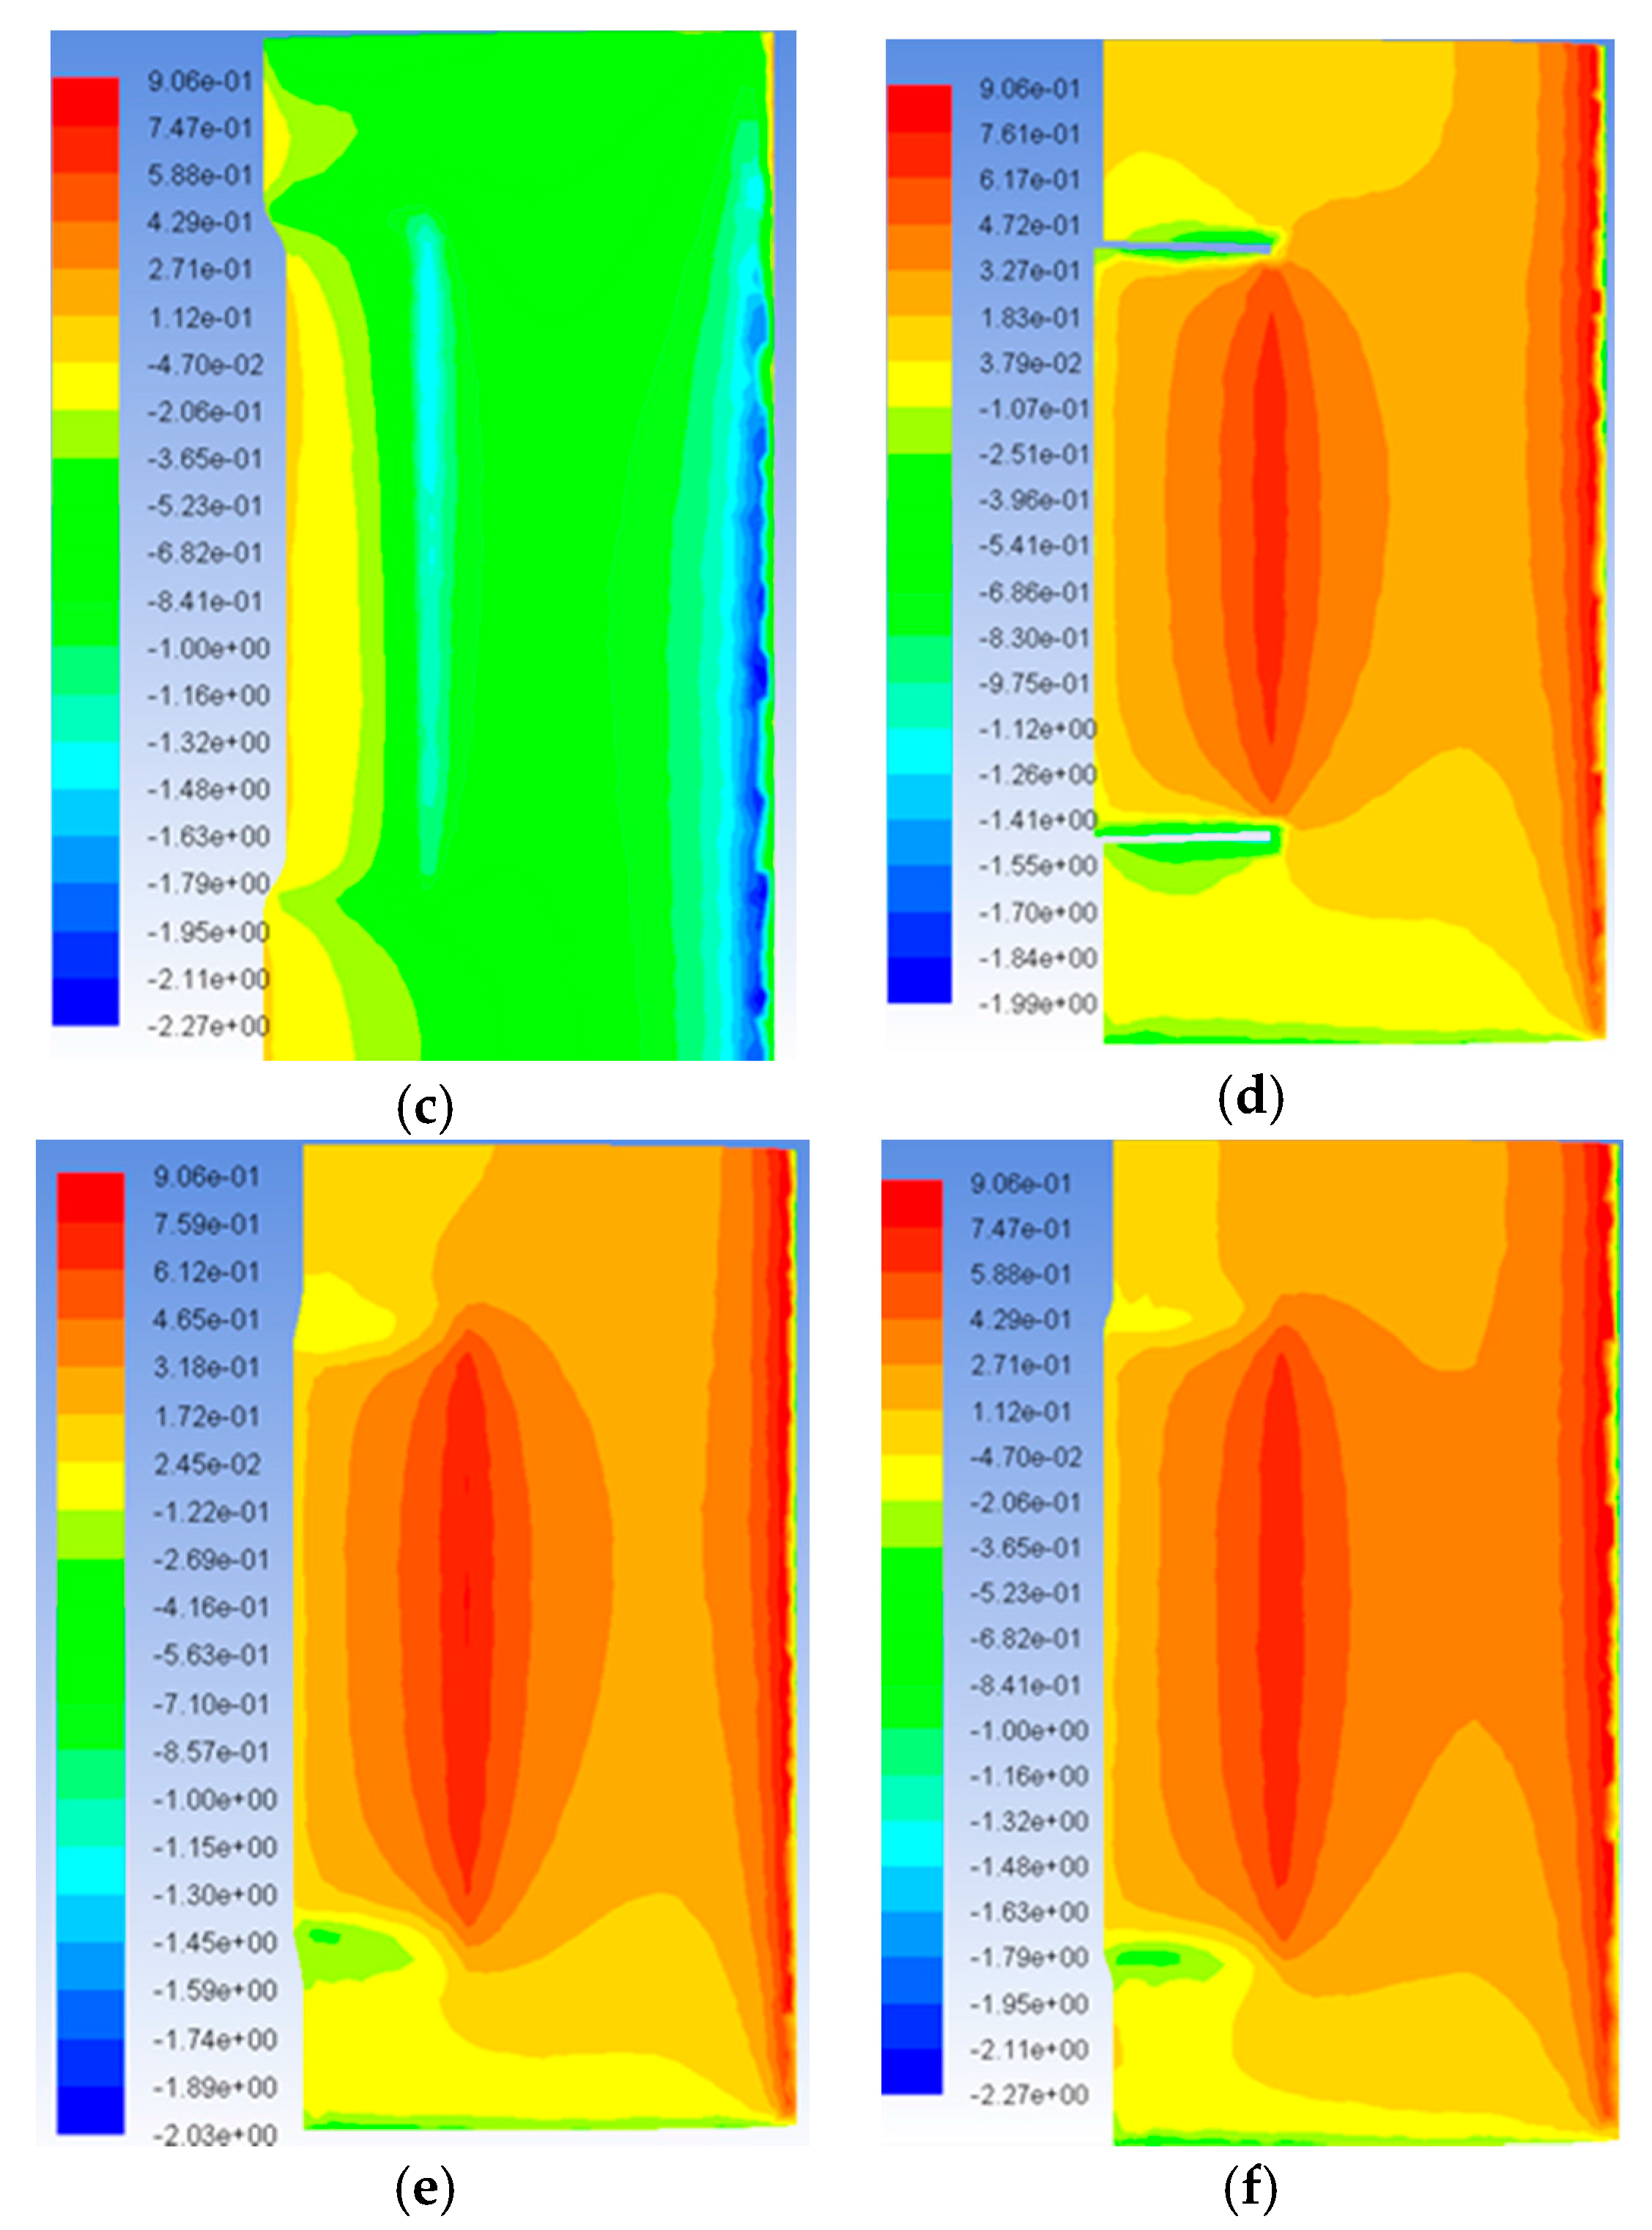
Figure 23 shows the evolution of pressure distribution along the lower surface of each of the wing configurations. Each wing has a different maximum pressure coefficient on its lower surface, 0.75 for the conventional wing, 0.904 for the initial morphing wing and 0.906 for the optimized morphing wing. This shows that the optimized wing experienced a much higher pressure along its lower surface than the conventional wing and the initial morphing wing.
Comparison pressure evaluation of the lower surface of the optimized wing with the initial and conventional wing indicated significant differences in the overall pressure distribution. At the trailing edge of the wing (left side), low pressure areas are significantly reduced, as well as much higher pressure at the leading edge (right side). The increase in pressure created higher lift which was experienced by the optimized wing, as well as the increase in flow smoothness due to the curvature of the transition regions. Furthermore, pressure drag is significantly reduced on the optimized wing because of regions with extremely low pressure on the conventional wing are almost eliminated.
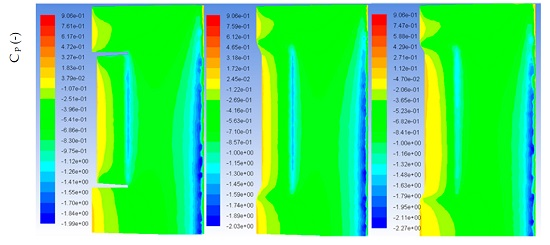
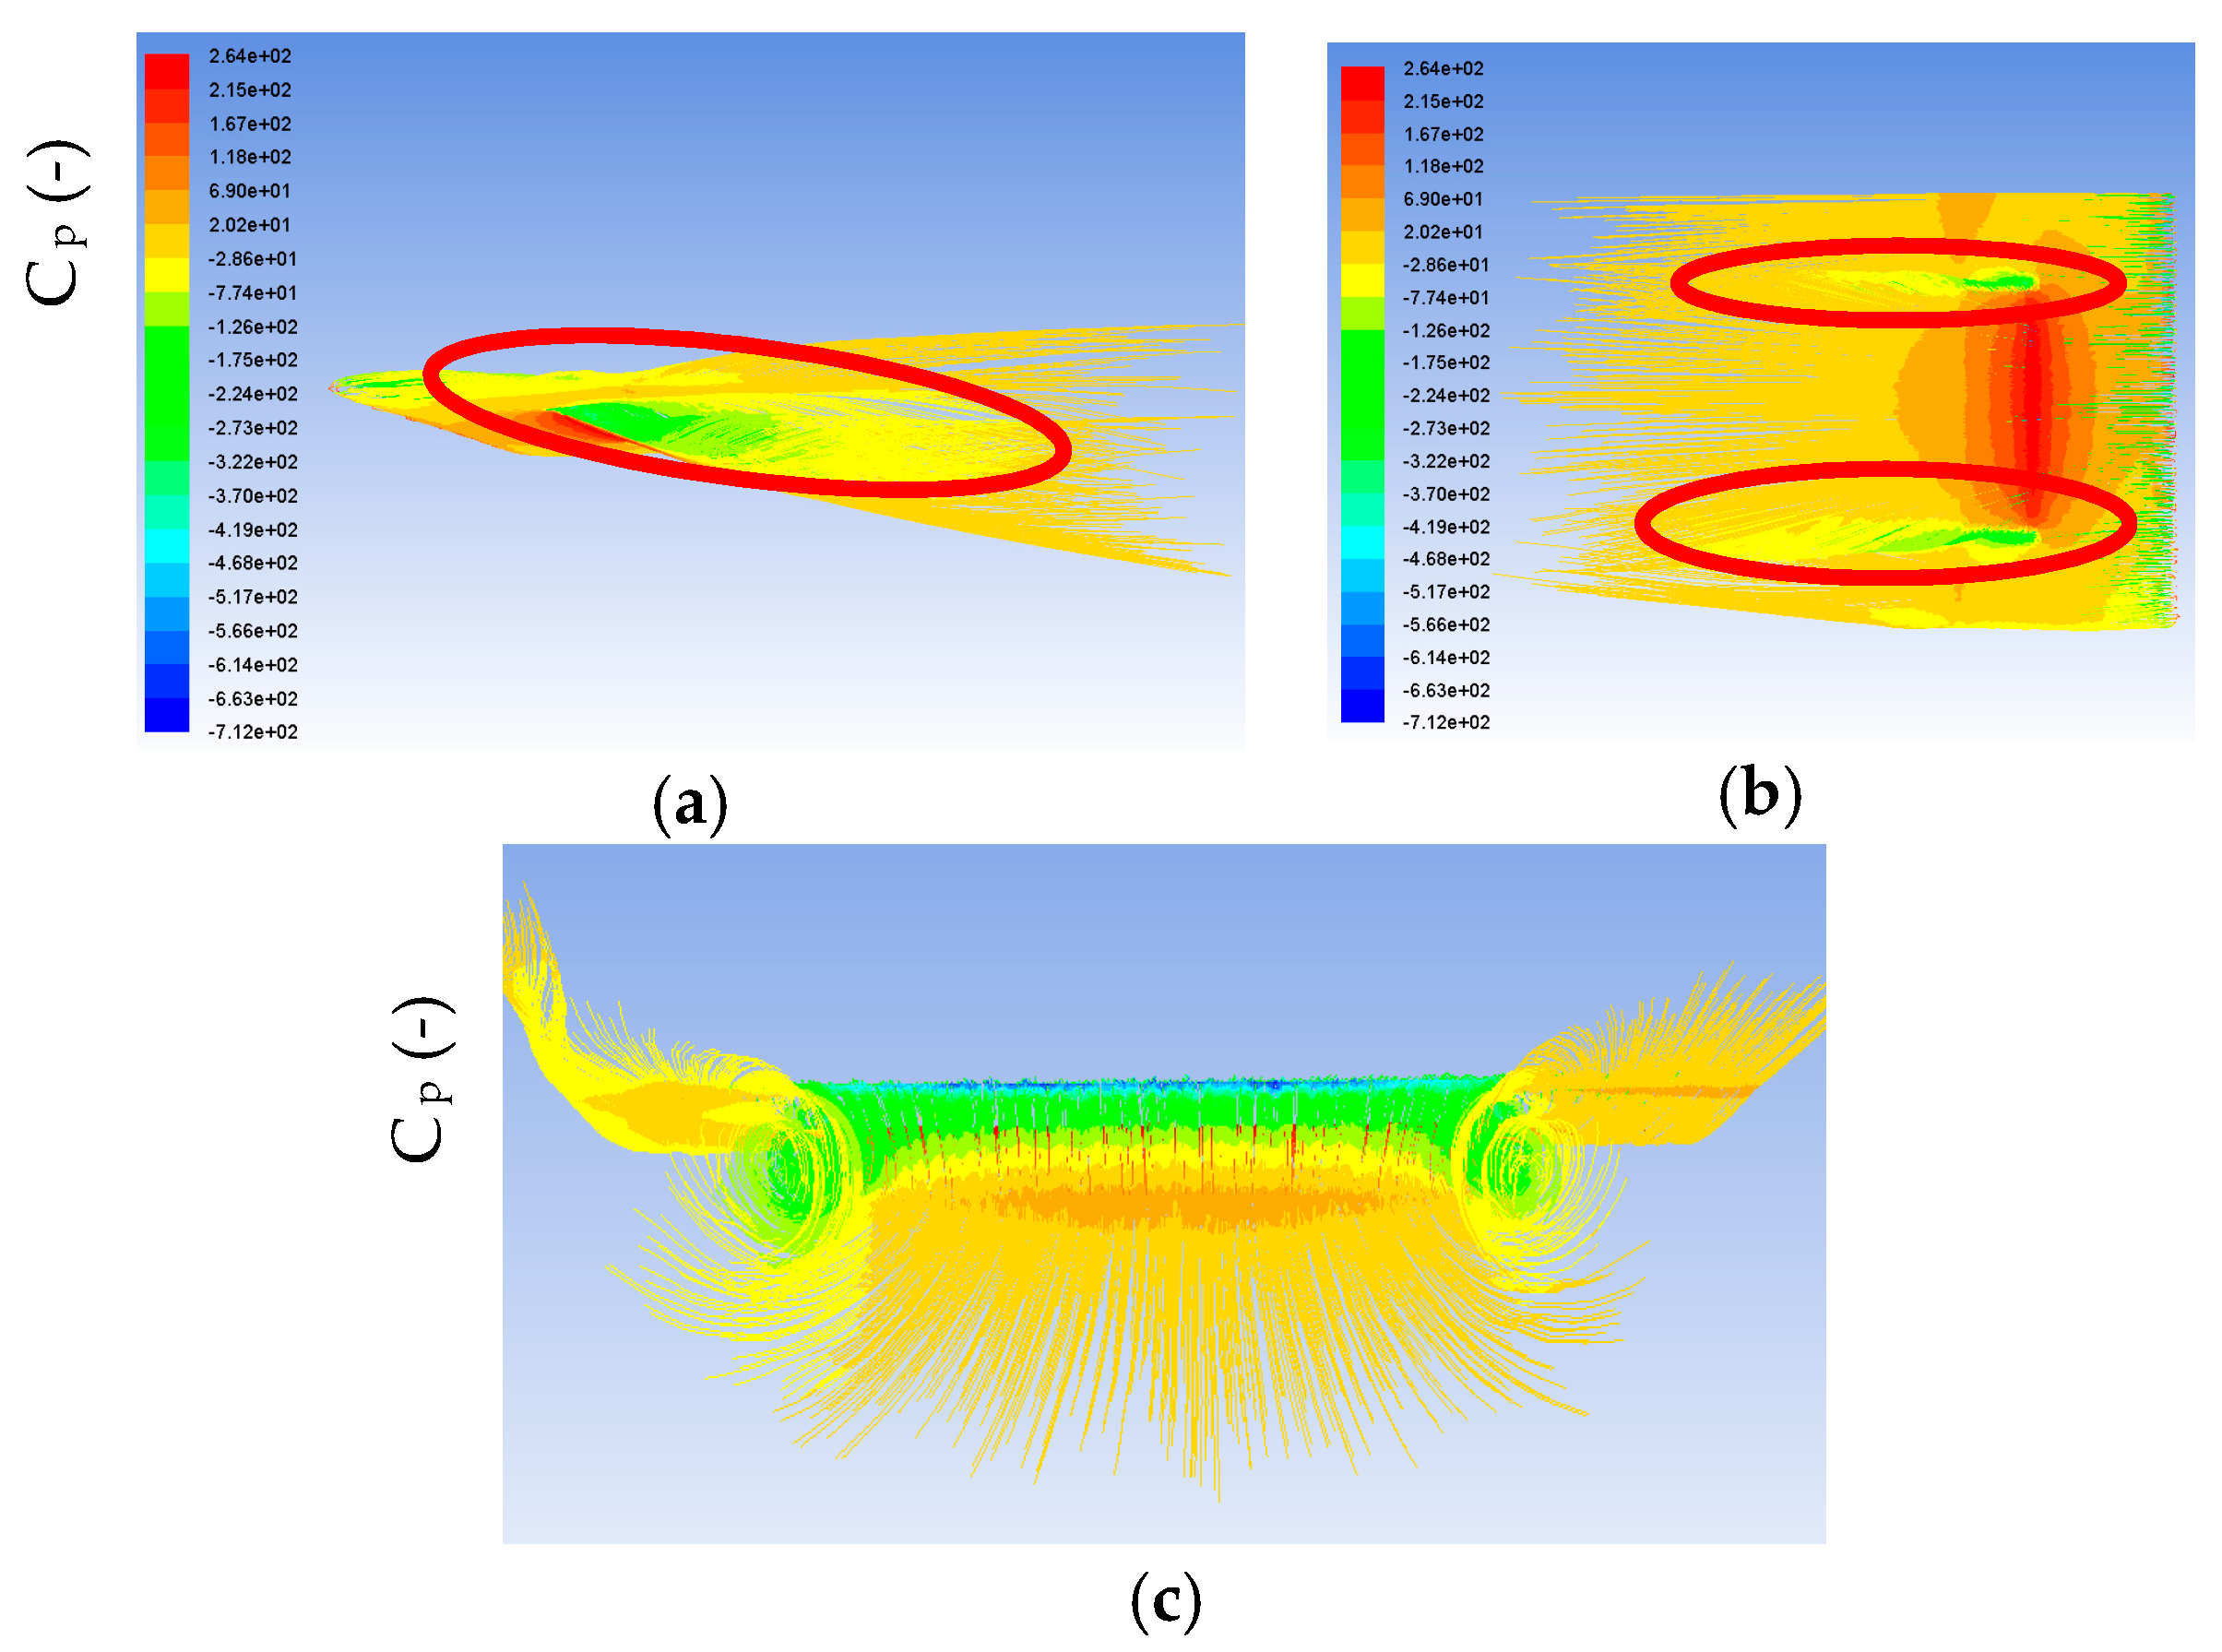
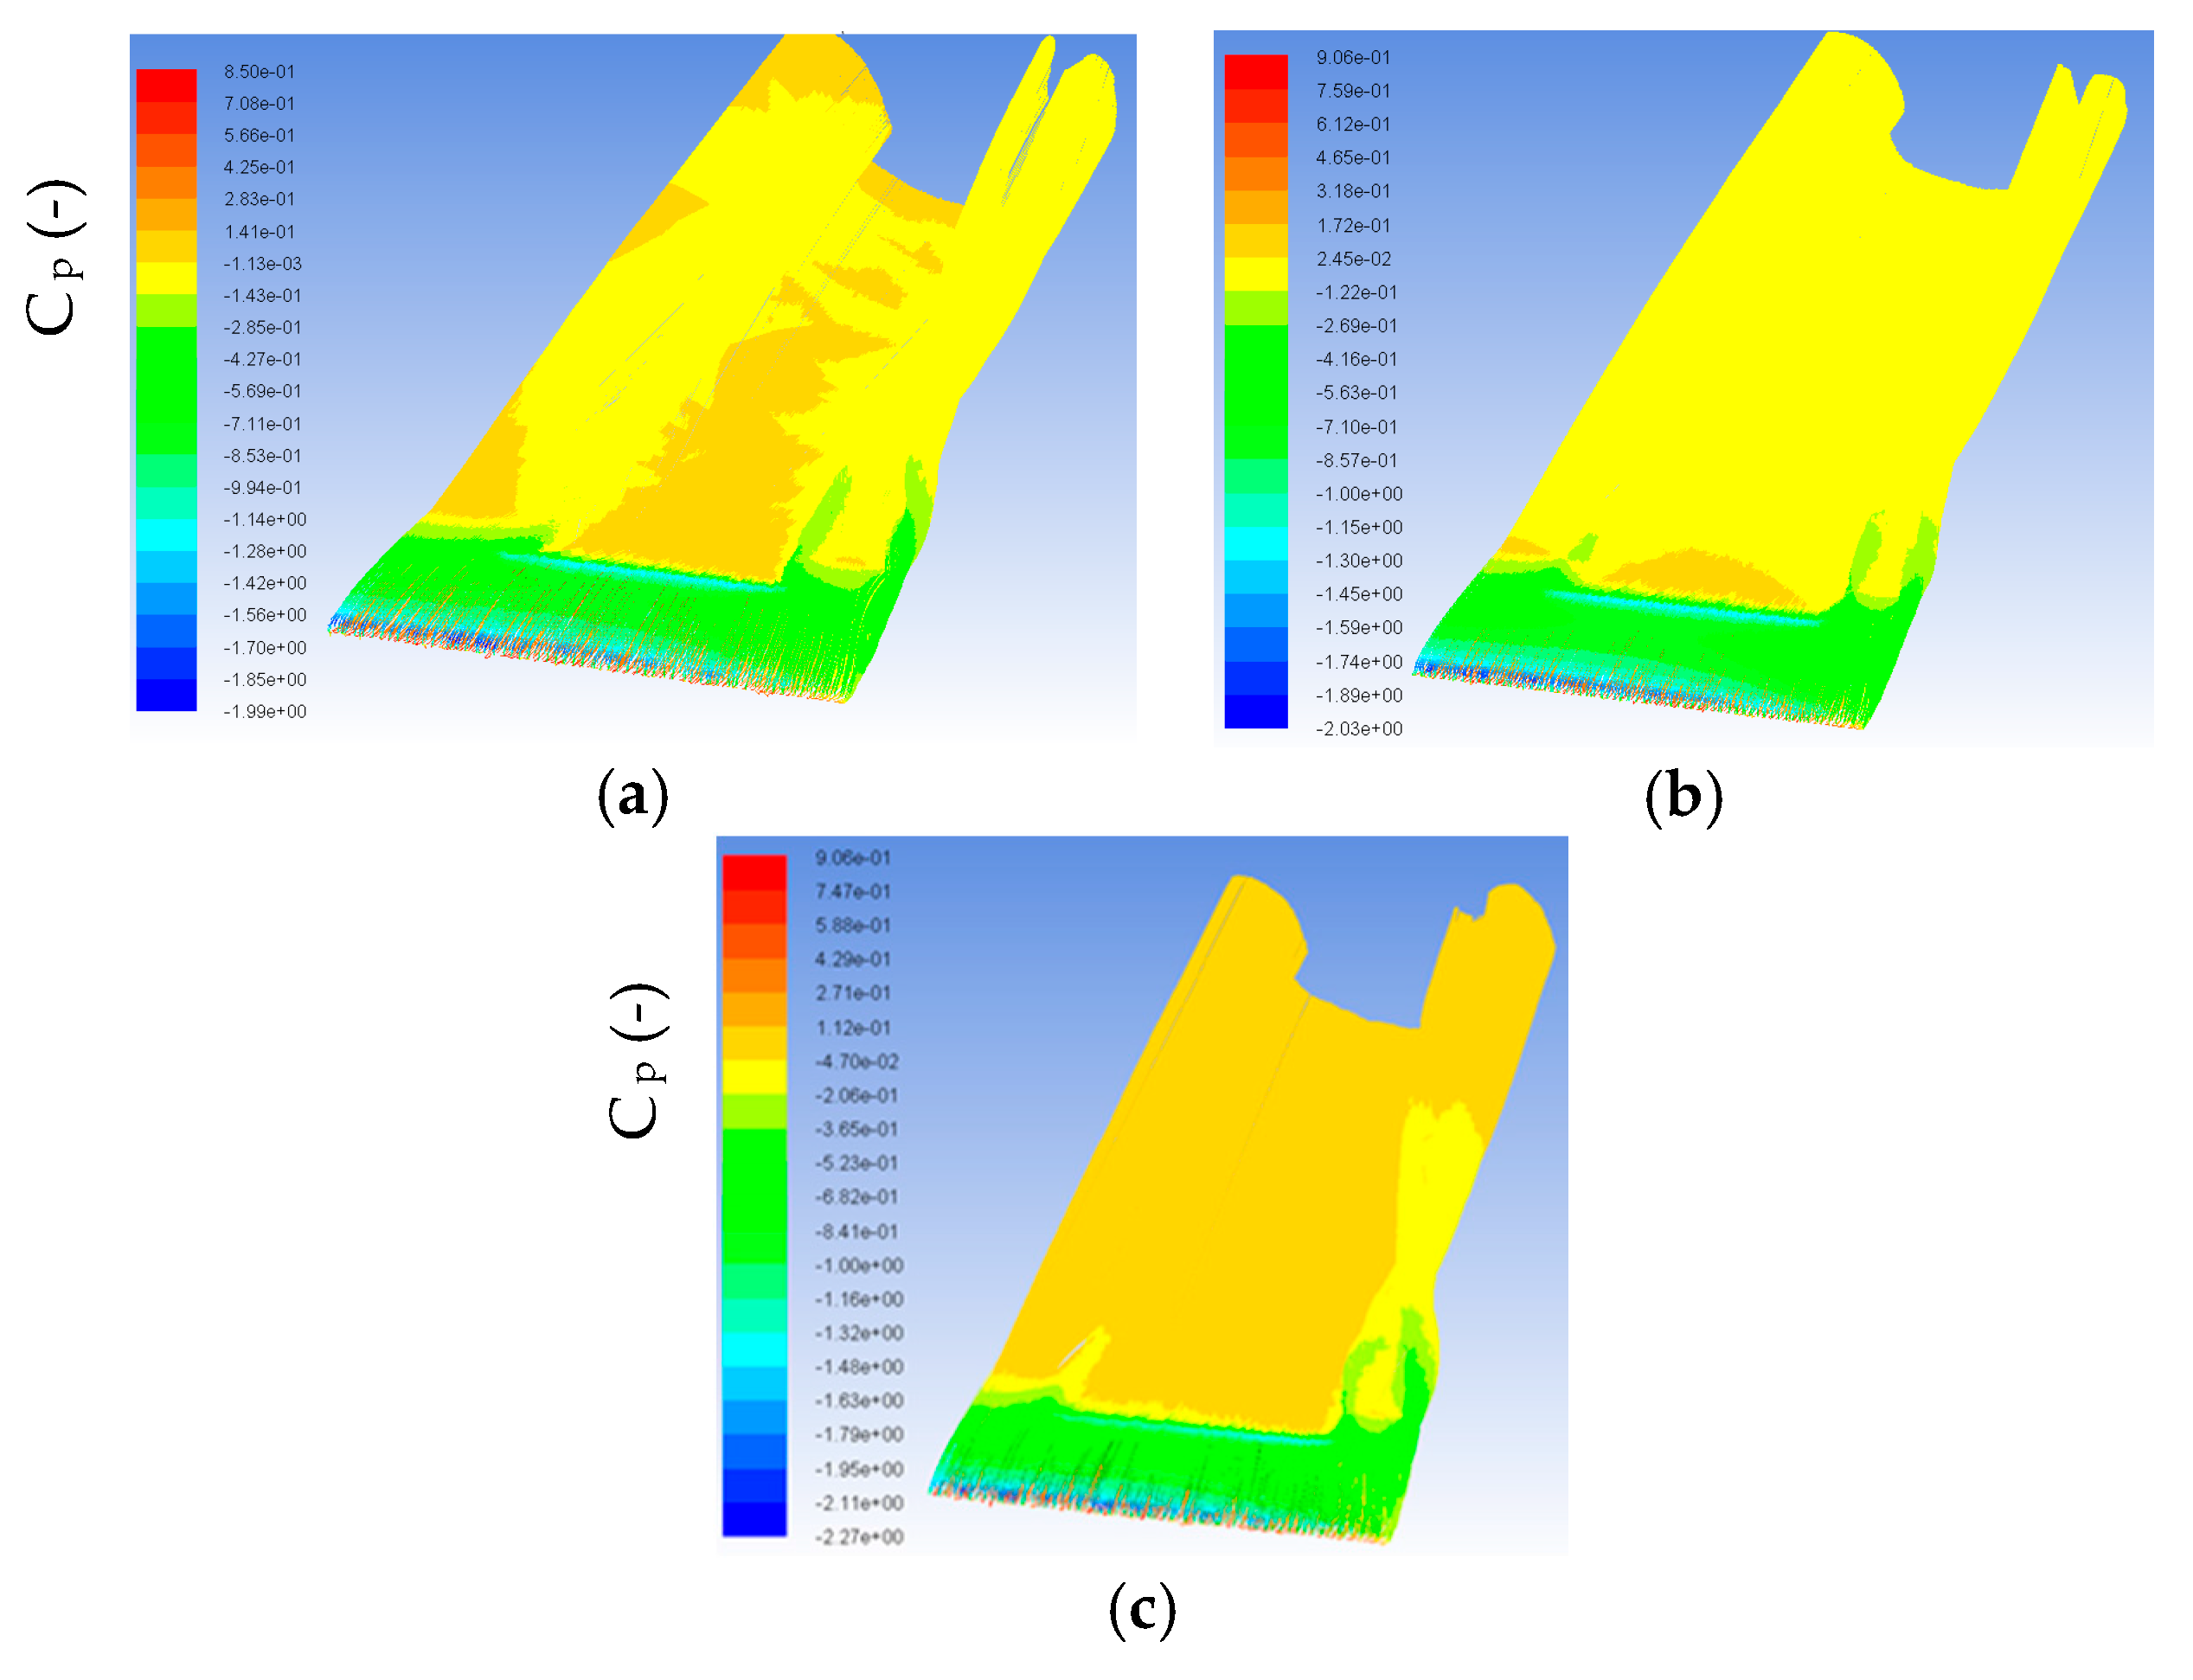
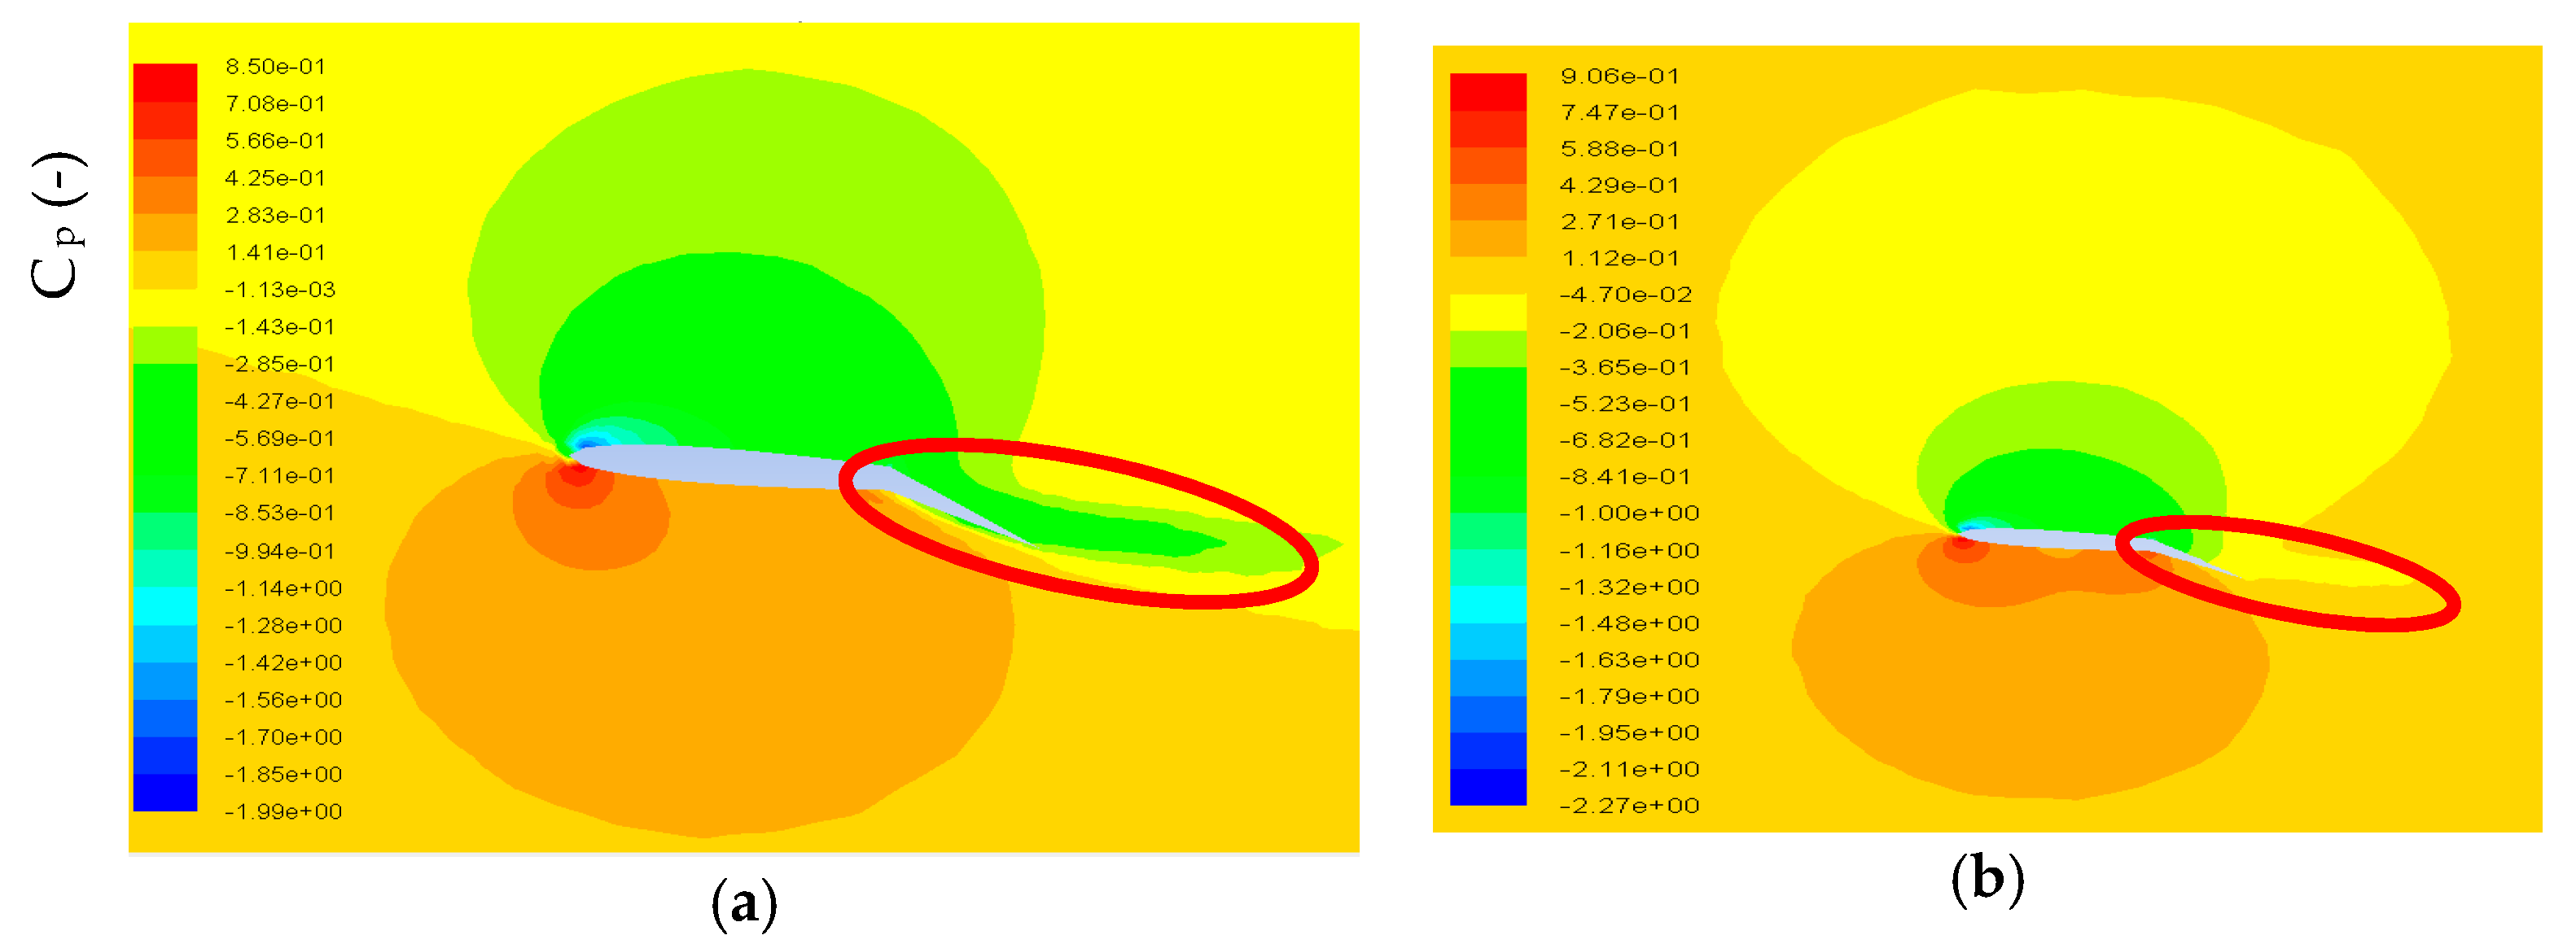
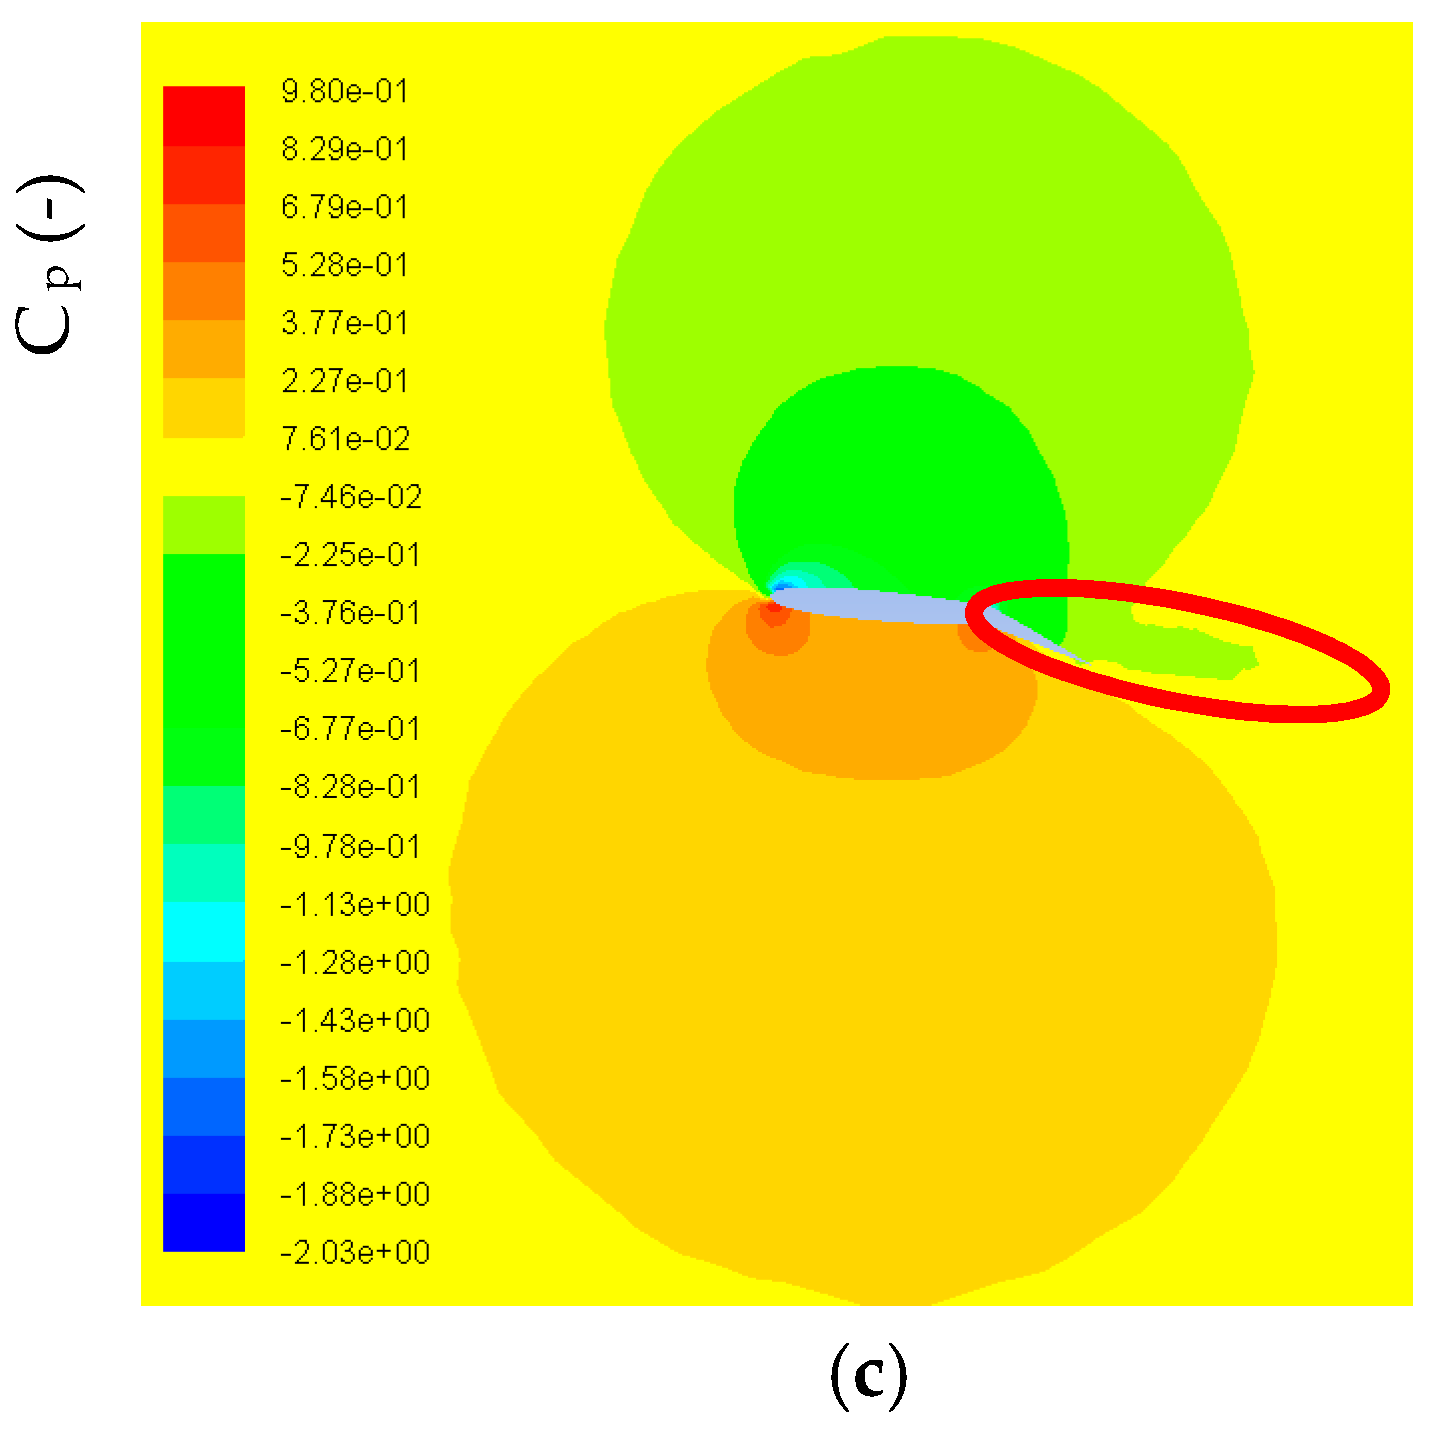
Upper surfaces comparison of the conventional, initial morphing and optimized morphing wings are illustrated in Figure 24. The pressure along the trailing edge of the wing (left side) increased significantly, due to vortex size reduction as well as a delay in the vortex formation. This effect reduced the pressure drag and caused significant changes to the pressure in the wake of the wing. The conventional wing (top left, Figure 24a) is compared to a morphing wing (top right and bottom middle, Figure 24b,c), the morphing wings experienced less chaotic behaviour and the pressure is more equalized resulting in less drag. One of the major benefits of the optimized wing is that the increased curvatures on the flap transition regions allowed smoother flow to occur, which reduced the pressure drag, vortex size and caused a delayed formation of the vortices on the wing. Figure 25 shows the pressure coefficients above and below the surface of the wings, the red circles indicate the pressure of the vortex which is being generated by the flaps. The conventional wings vortex (top left, Figure 25a) is significantly lower in pressure and much larger in size than the morphing wings (top right and bottom centre, Figure 25b,c), the optimized shape shifting wing has the highest-pressure vortex and therefore an overall higher wing wake pressure and reduced pressure drag.
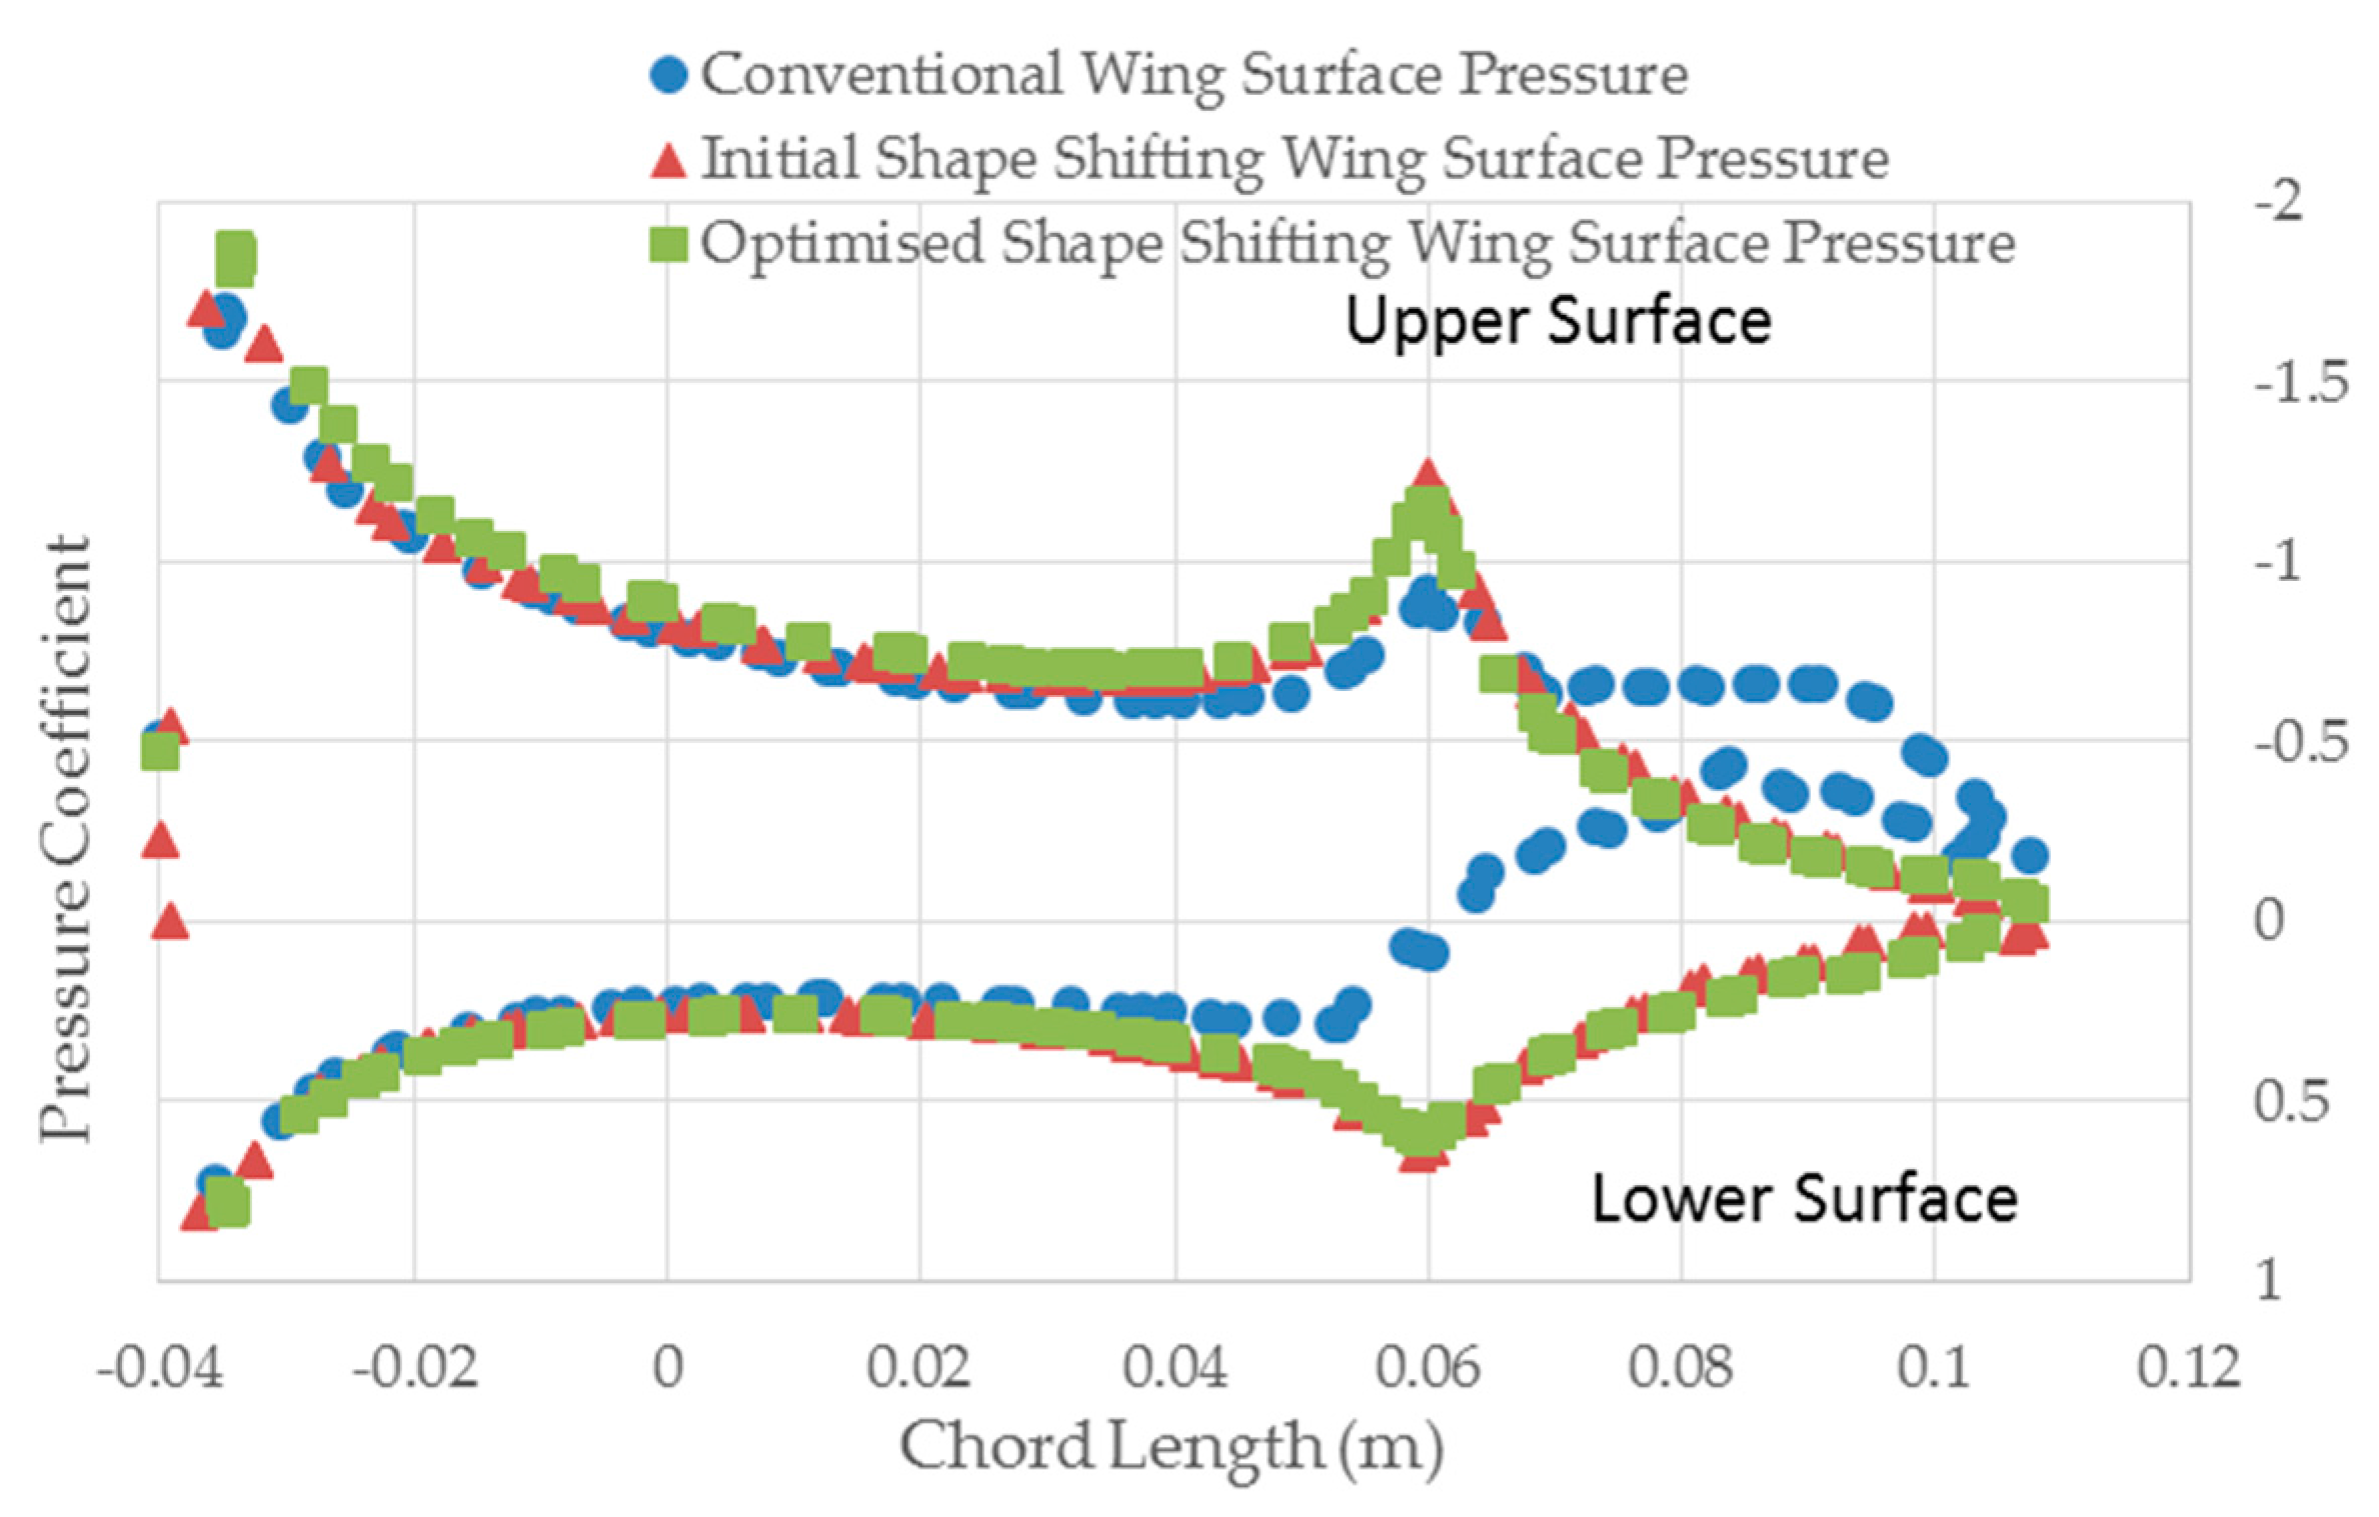
Figure 26 shows the pressure distribution along the upper and lower surface of each wing at the location where vortices are generated on the flap. The conventional wing experienced a significant drop in pressure on both the top and bottom surface of the wing as flow approached the trailing edge (chord length = 0.04 to 0.11 m). This is due to the large vortex that is generated at this location, it resulted the pressure to drop which consequently increased pressure drag. Comparison between the conventional wing to the initial and optimized morphing wing, revealed a major difference between the upper and lower surface pressures. With the morphing wings, as the flow approached the trailing it increased instead, this is because of the reduction in vortex size and delay in formation.
From Figure 26 there is a clear evidence of differences in pressure behaviour, the conventional wing is much more chaotic than the morphing wings which further support the main explanation for the efficiency increase.
5.5. Wind Tunnel Testing and Simulation Comparison (Validation)
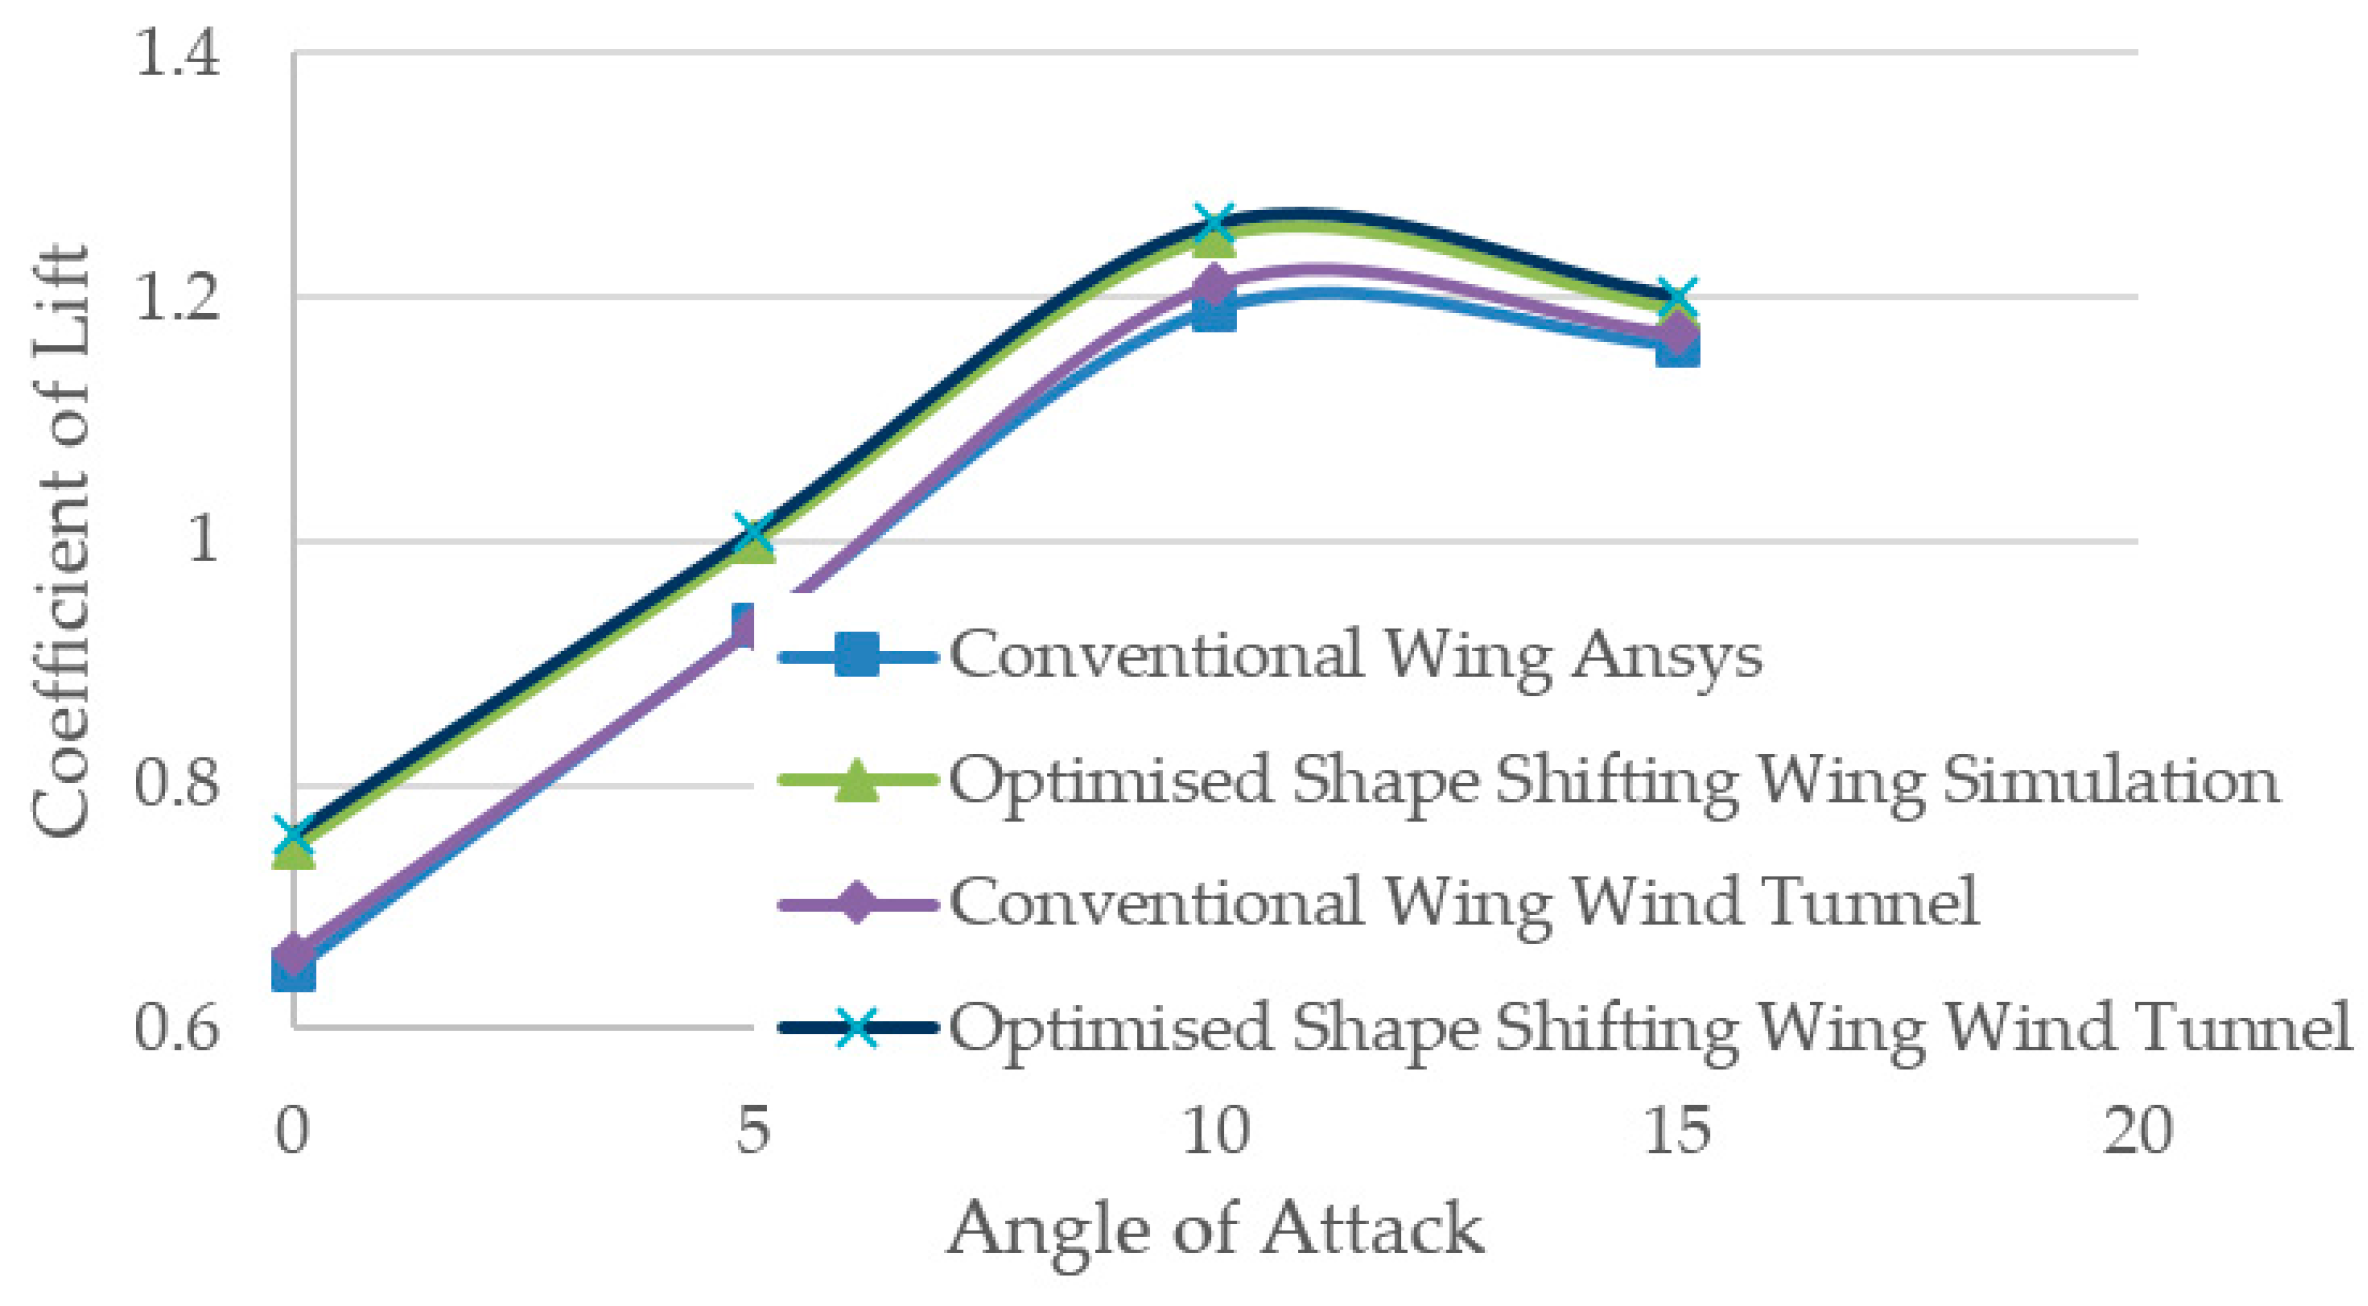
Figure 27, illustrates the coefficient of lift versus angle of attack for wind tunnel and simulation data. It is observed that the results are very similar. For the conventional wing at 0, 5, 10 and 15 degrees Angle of Attack (AOA), the percentage differences between the simulation and wind tunnel tests are 1.87%, 0.04%, 1.8% and 0.86% respectively for coefficient of lift. Therefore, results obtained from Ansys simulation are accurate within 1.87% of the wind tunnel tests. For the optimized wing the percentage difference between the simulation and wind tunnel tests is 1.3%, 0.8%, 0.8% and 0.8% respectively. This implies the optimized wing is accurate within 1.3%.
Figure 28 shows the coefficient of drag data for both simulation and experimental data for the conventional wing and optimized morphing wing. At 0, 5, 10 and 15 degrees angle of attack the percentage difference between simulation and measured data for the conventional wing is 1.04%, 6.75%, 1.43% and 4.19% respectively. For the optimised wing the percentage difference is 0.49%, 3.91%, 1.24% and 2.08% respectively. Based on this, the drag data is accurate within 6.75%. Based on the data shown in Figure 18 and Figure 19 it can be determined that the data produced from Ansys is accurate to real world conditions by 1.87% for coefficient of lift and 6.75% for coefficient of drag.
5.6. Ansys and Wind Tunnel Results Discussion
The simulation results showed the morphing wings have a significant increase in aerodynamic efficiency compared to the conventional wing. The most efficient wing design was the optimized morphing wing, which because of increased flow smoothness allowed for higher pressure distribution over a larger area of the lower wing surface. This resulted in higher lift production and reduced pressure drag.
The initial and optimized morphing wing also had the effect of reducing the size and delaying the formation of vortices in the wake of the wing, which reduced pressure drag. This occurred because the vortices are no longer generated on the flap and the pressure drop at the points where the flaps would usually dislocate from the wing surface is no longer available; this can be seen in Figure 24.
6. Noise
One source of aircraft noise is generated by turbulent flow over the airframe. A considerable noise signature is generated when an aircraft flaps are deployed, this is due to violent disruption of airflow and the creation of turbulence. Therefore, if lift-induced drag vortices are reduced by the morphing wing then noise is reduced. To test this, noise level readings were taken during wind tunnel tests to determine any noise level reductions.
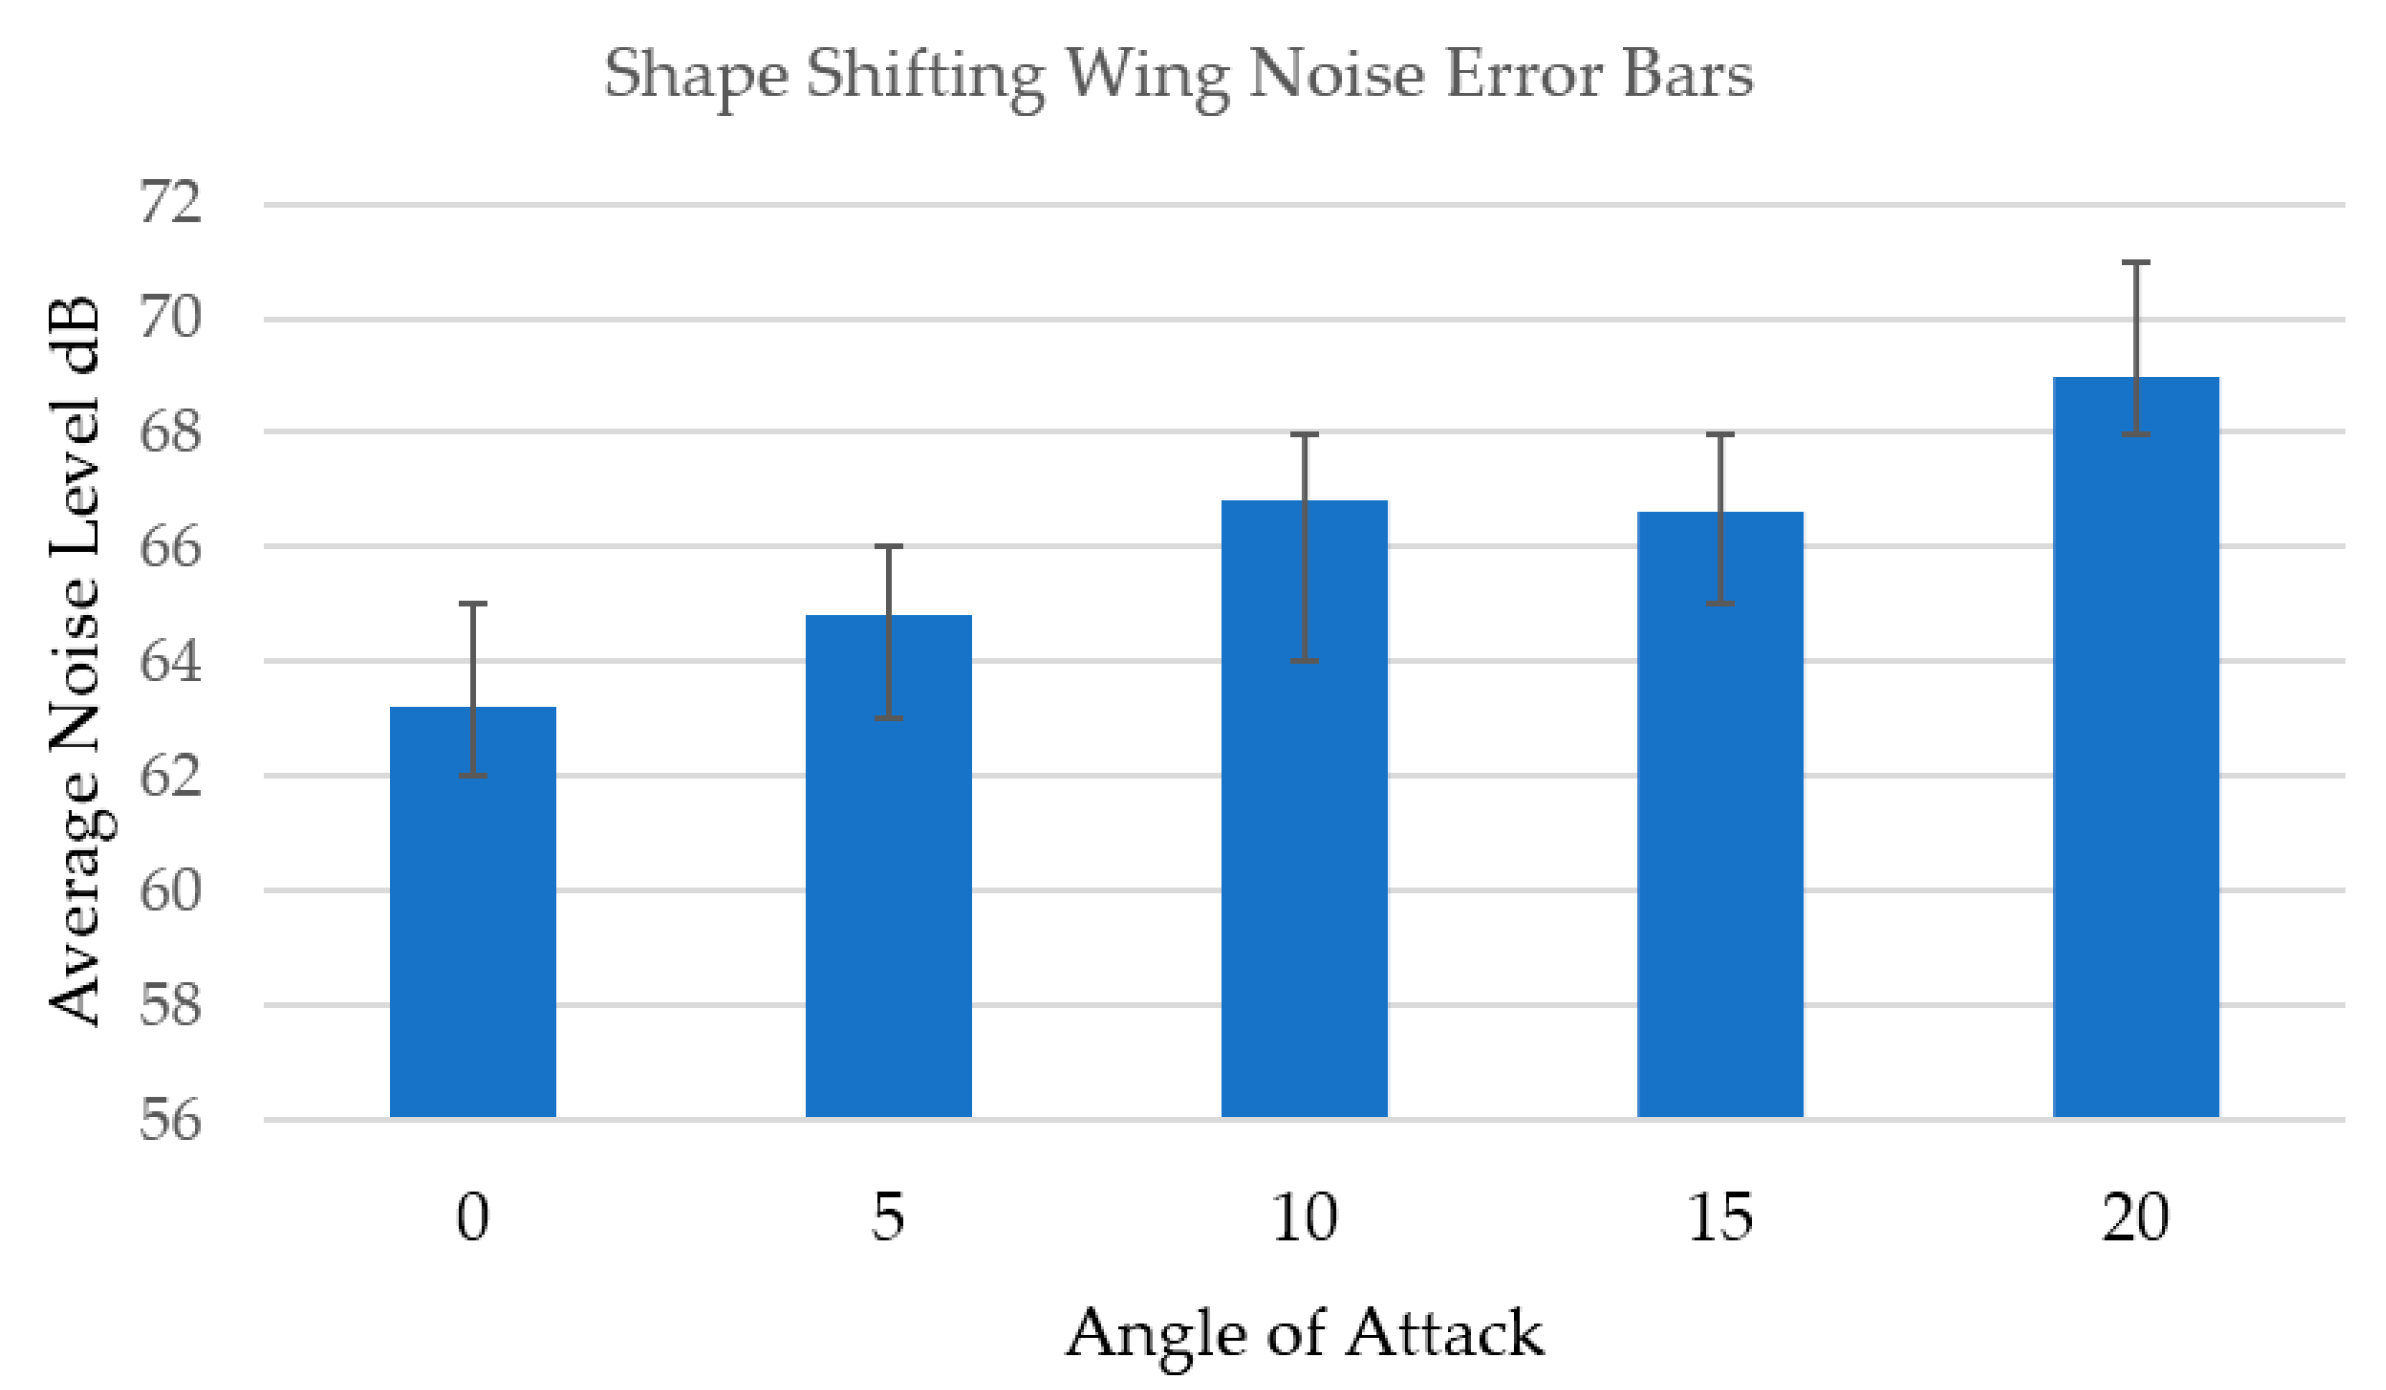
Each wing has a noise level reading taken at 0, 5, 10, 15 and 20 degrees angle of attack. Based on the measured data shown in Table 2 and Equation (1) after performing baseline wind tunnel noise level correction, the sound pressure level produced by the wing only was obtained. The actual noise levels of the wing as a function of AOA are shown in Figure 29.
where: P1 = Sound pressure Pa (What the microphone detects), P0 = Reference Pressure (Threshold of hearing 2 × 10⁻⁵ Pa).
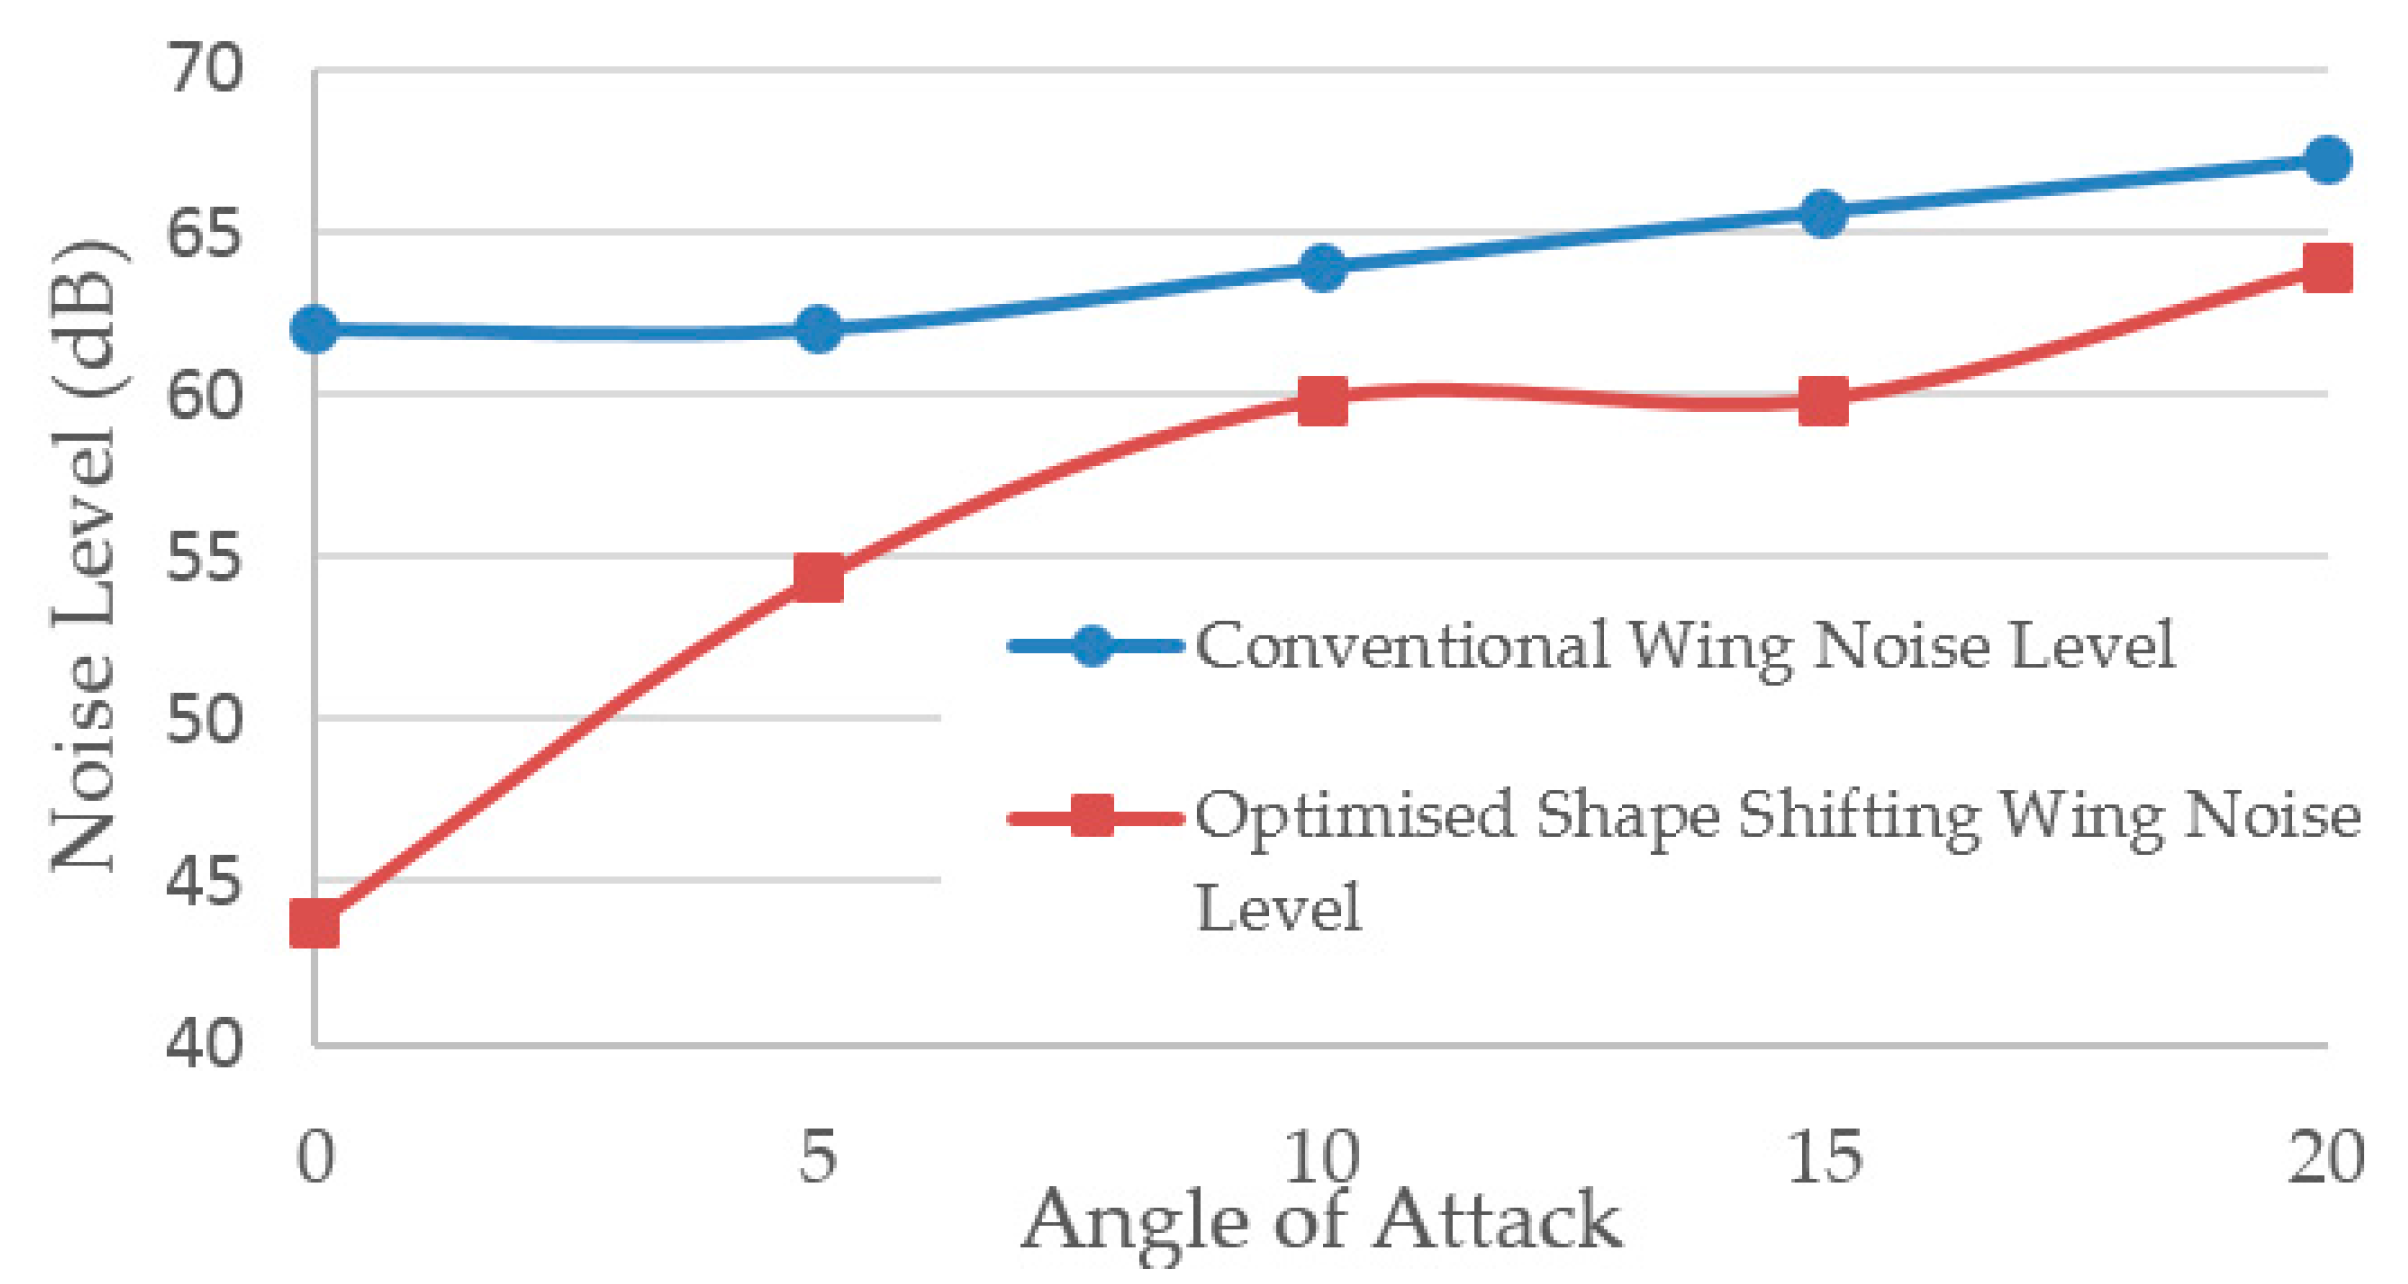
Figure 29 shows there is a significant drop in noise level for the optimized wing, up to 40% dependent on angle of attack. Although this data will not be 100% accurate because the wind tunnel never maintains at constant speed so the noise level varies. The actual noise reduction value will be between 30% and 40% less than the conventional wing value.
The noise was measured off the wing section using a sound level meter; it was placed inside the wind tunnel 10 cm behind the wings trailing edge and 10 cm above. As the wind tunnel does not maintain a set speed, multiple decibel readings were taken and an average of the data was used for each angle of attack.
The Figure 30, Figure 31, Figure 32 and Figure 33 show the standard deviation and error bar charts for the data collected from wing noise. The wind tunnel does not maintain a set speed therefore noise is not constant, five decibel readings were taken per angle of attack shown to gain an average noise level.
The figures below show standard deviation for noise data collected during tests conducted at the wind tunnel, including the interquartile range (indicated by green and brown). The green and brown boxes indicate the difference between the 75th and 25th percentile or the middle 50% of the data’s standard deviation, the maximum and minimum is also shown by the upper and lower whiskers respectively.
7. Conclusions
The main objective of this paper was to design and develop a morphing wing technology based on implementation of transition regions between the wing and the flap, which was simpler than the current sophisticated technology, ideally reducing the timescale for operational use. To achieve this, wing models were created and tested through CFD simulation to determine the aerodynamic performance of the wing. Also, wind tunnel tests were carried out to measure lift and drag coefficients and to determine noise level reduction compared to conventional wing.
Simulation was carried out on Ansys Fluent for each of the models. Simulation revealed a 10.8% coefficient of lift increase for the initial morphing wing and 15.4% for the optimized morphing wing as compared to conventional wing design. At angles of attack of 0, 5, 10 and 15 degrees the optimized wing has an increase in lift-to-drag ratio of 18.3%, 10.5%, 10.6% and 4% respectively when compared with the conventional wing. Simulations also showed that there is a significant improvement on pressure distribution over the lower surface of the morphing wing aerofoil. The increase in flow smoothness and reduction in vortex size reduced pressure drag along the trailing edge of the wing which caused an increase in pressure on the lower surface. A morphing wing reduced the size of the vortices and therefore the noise levels of the morphing wings based on data collected, was reduced by up to 50%.
Acknowledgments
The research was self-funded. The authors would also like to thank ANSYS, Inc. for the possibility to use their software.
Author Contributions
Dean Ninian designed the experiments; performed the experiments; and analysed the data; Dean Ninian and Sam Dakka wrote the paper. The research was performed in the frame work of Dean Ninian’s Engineering Degree under the supervision and direction of Sam Dakka.
Conflicts of Interest
The authors declare no conflict of interests.
Abbreviations
The following abbreviations are used in this manuscript:
| P1 | sound pressure, Pa |
| P0 | reference pressure (threshold of hearing 2 × 10⁻⁵ Pa), Pa |
| Cp | Pressure Coefficient |
| dB | Noise Level, decibels |
| AOA | Angle of Attack |
| NACA | National Advisory Committee on Aeronautics |
| DARPA | The Defense Advanced Research Projects Agency |
| UAV | Unmanned Air Vehicle |
| SMA | Shape Memory Alloy |
| PZT | Piezoelectric Transducer |
| CFD | Computational Fluid Dynamics |
| RNG | Re-Normalization Group |
Appendix A
Figure A1.
(a) Conventional aerofoil with flap, units in mm; (b) Initial shape shifting wing design with flap, units in mm.
Figure A1.
(a) Conventional aerofoil with flap, units in mm; (b) Initial shape shifting wing design with flap, units in mm.
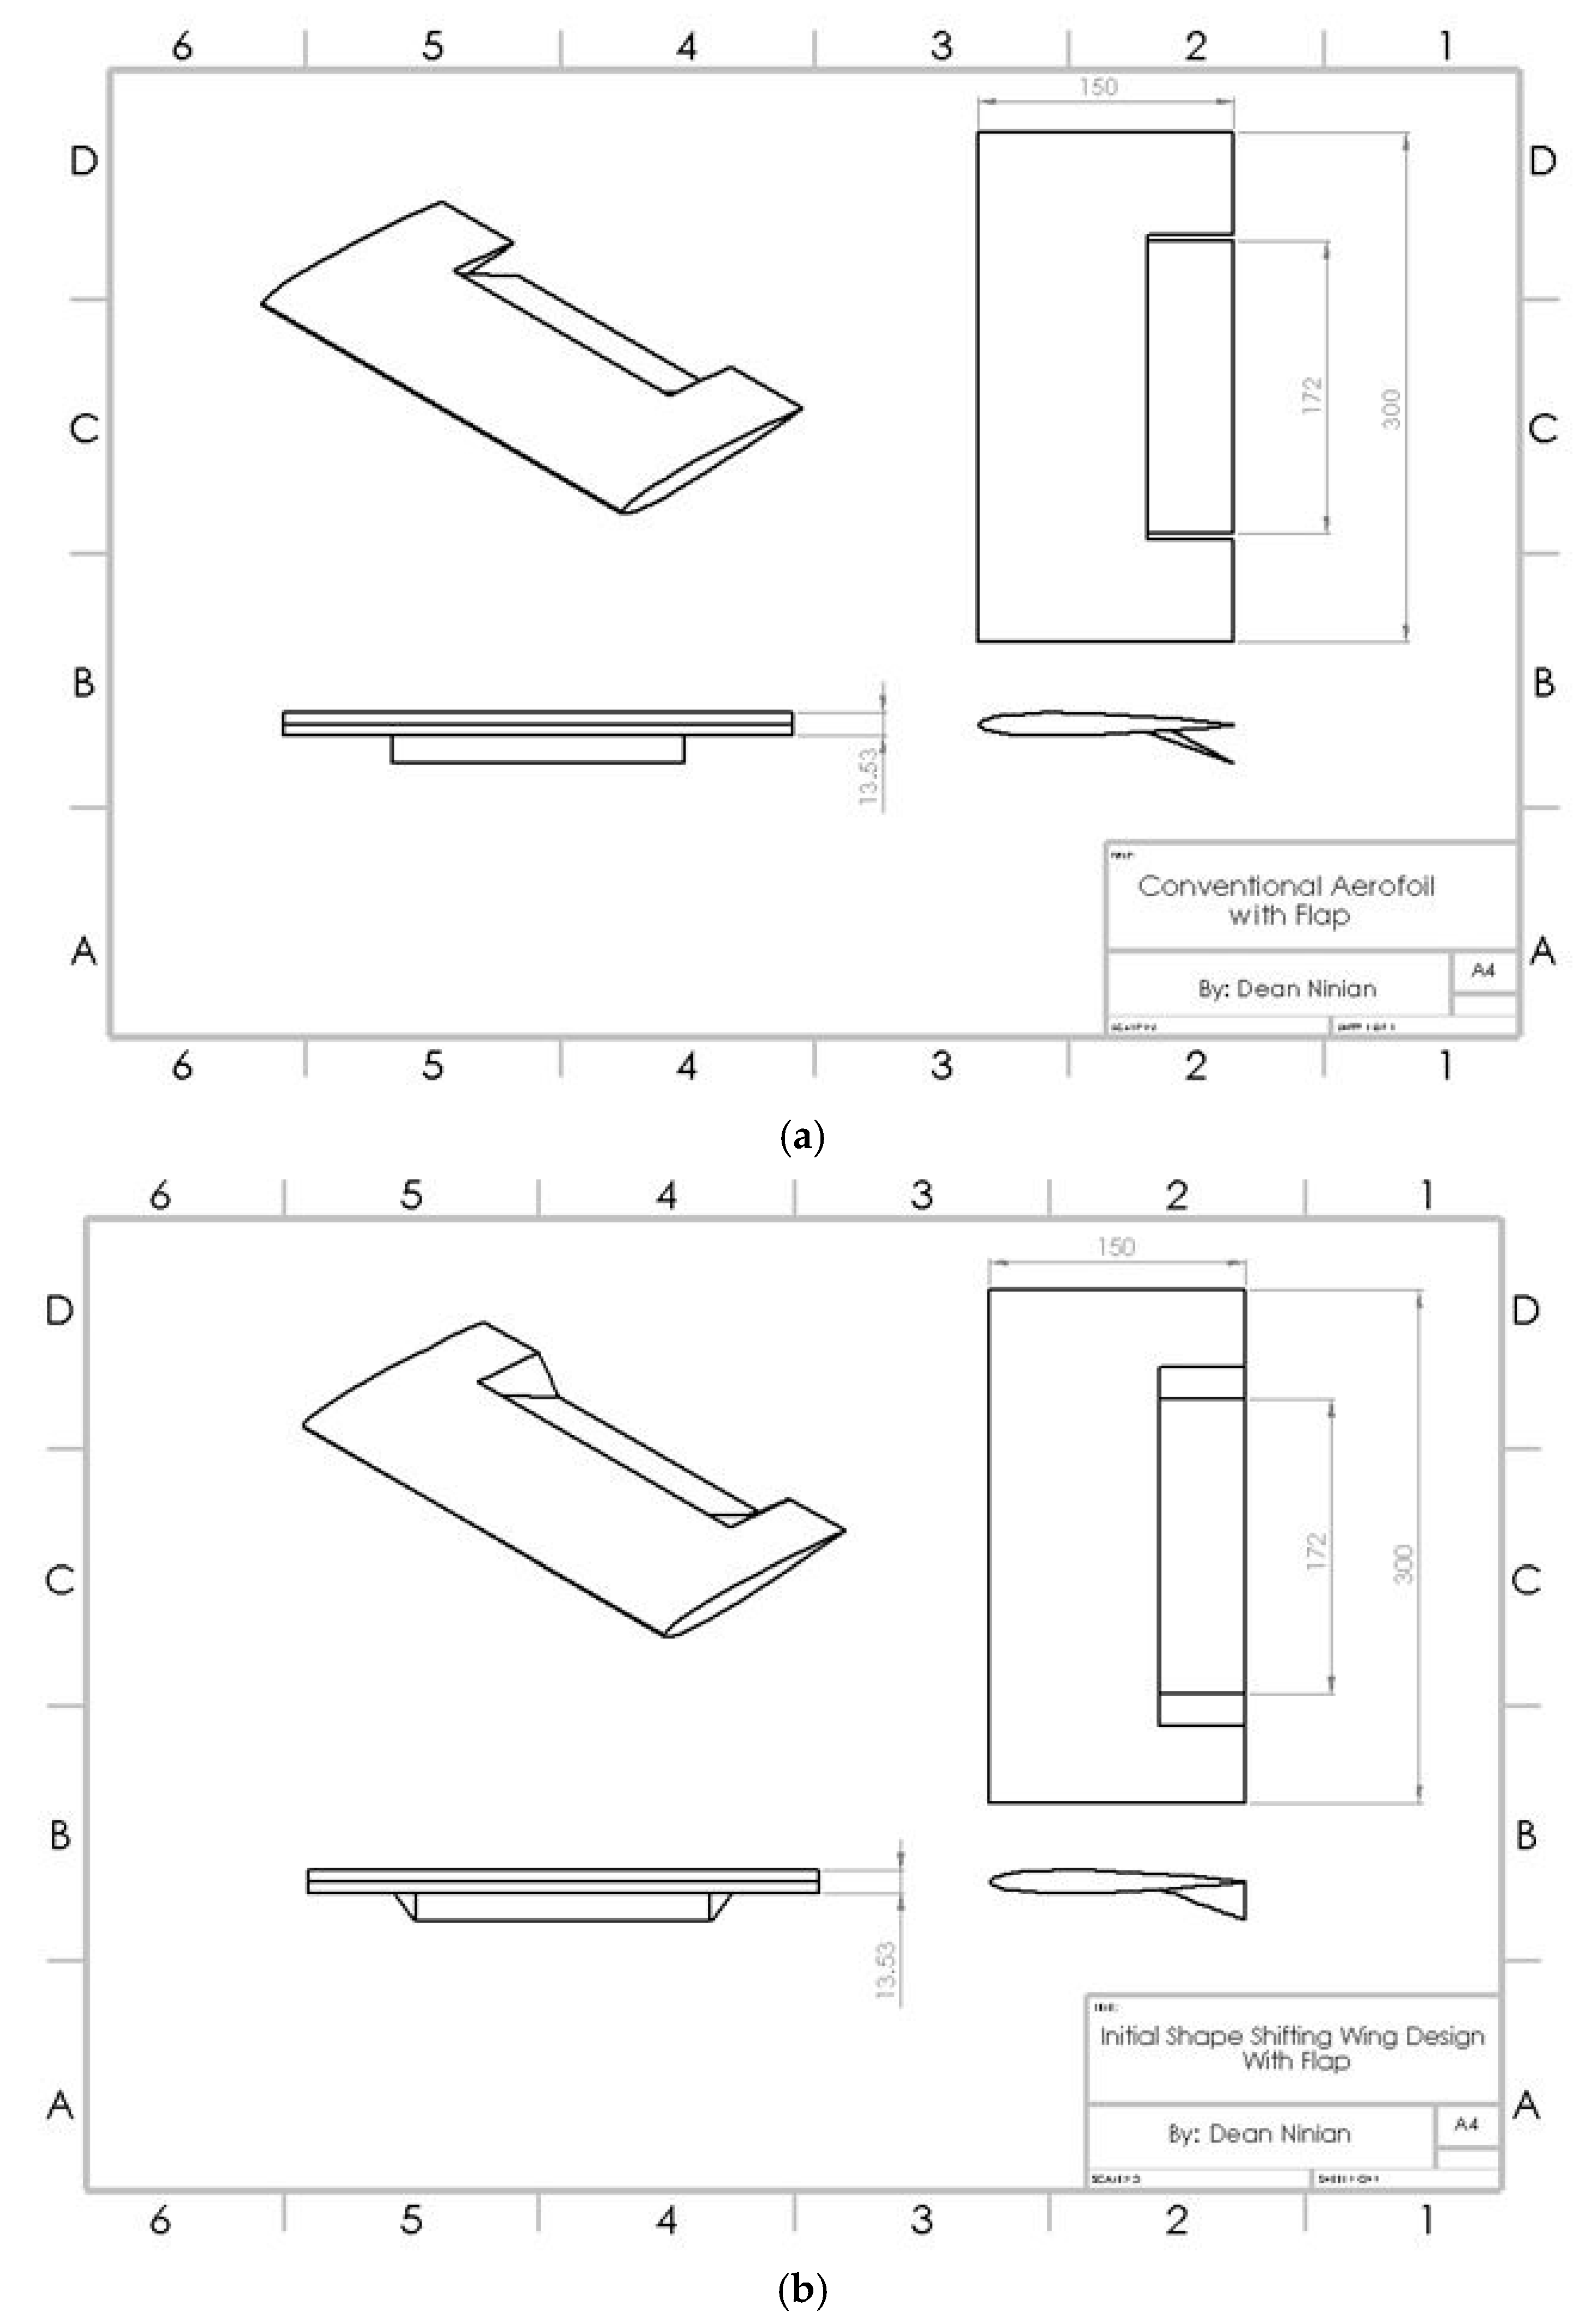
Figure A2.
Conventional aerofoil with flap, Initial shape shifting wing design with flap and NACA009 with no flap [30].
Figure A2.
Conventional aerofoil with flap, Initial shape shifting wing design with flap and NACA009 with no flap [30].

References
- Group of Personalities Report; Advisory Council for Aeronautics Research in Europe; Office for Official Publ. of the European Communities. European Aeronautics: A Vision for 2020. In Proceedings of the Society’s Needs and Winning Global Leadership, Luxembourg, 14 January 2001. [Google Scholar]
- Weisshaar, T.A. Morphing Aircraft Systems: Historical Perspectives and Future Challenges. J. Aircr. 2013, 50, 337–353. [Google Scholar] [CrossRef]
- Vasista, S.; Tong, L.; Wong, K.C. Realization of Morphing Wings: A Multidisciplinary Challenge. J. Aircr. 2012, 49, 11–28. [Google Scholar] [CrossRef]
- Rodriguez, A.R. Morphing Aircraft Technology Survey. In Proceedings of the 45th AIAA Aerospace Sciences Meeting and Exhibit, Reno, NV, USA, 8–11 January 2007. [Google Scholar]
- Moorhouse, D.; Sanders, B.; von Spakovsky, M.; Butt, J. Benefits and Design Challenges of Adaptive Structures for Morphing Aircraft. Aeronaut. J. 2006, 110, 157–162. [Google Scholar] [CrossRef]
- Ivanco, T.G.; Scott, R.C.; Love, M.H.; Zink, S.; Weisshaar, T.A. Validation of the Lockheed Martin Morphing Concept with Wind Tunnel testing. In Proceedings of the 48th AIAA/ASME/ASCE/AHS/ASC Structures, Structural Dynamics and Materials Conference, Honolulu, HI, USA, 23–26 April 2007. [Google Scholar]
- Flanagan, J.S.; Strutzenberg, R.C.; Myers, R.B.; Rodrian, J.E. Development and Flight Testing of a Morphing Aircraft, the NextGen MFX-1. In Proceedings of the 48th AIAA/ASME/ASCE/AHS/ASC Structures, Structural Dynamics and Materials Conference, Honolulu, HI, USA, 23–26 April 2007. [Google Scholar]
- Samuel, J.B.; Pines, D. Design and Testing of a Pneumatic Telescopic Wing for Unmanned Aerial Vehicles. J. Aircr. 2007, 44, 1088–1099. [Google Scholar] [CrossRef]
- Yokozeki, T.; Sugiura, A.; Hirano, Y. Development of Variable Camber Morphing Airfoil Using Corrugated Structure. J. Aircr. 2014, 51, 1023–1029. [Google Scholar] [CrossRef]
- Beguin, B.; Breitsamter, C.; Adams, N. Aerodynamic Investigations of a Morphing Membrane Wing. AIAA J. 2012, 50, 2588–2599. [Google Scholar] [CrossRef]
- Beguin, B. Development and Analysis of an Elasto-Flexible Morphing Wing. Ph.D. Thesis, Chair of Aerodynamics and Fluid Mechanics, Technische Universität München, Munich, Germany, 2014. [Google Scholar]
- Stanford, B.; Viieru, D.; Albertani, R.; Shyy, W.; Ifju, P. A Numerical and Experimental Investigation of Flexible Micro Air Vehicle Wing Deformation. In Proceedings of the 44th AIAA Aerospace Sciences Meeting and Exhibit, Reno, NV, USA, 9–12 January 2006. [Google Scholar]
- Hu, H.; Tamai, M.; Murphy, J.T. Flexible-Membrane Airfoils at Low Reynolds Numbers. J. Aircr. 2008, 45, 1767–1778. [Google Scholar] [CrossRef]
- Ifju, P.; Jenkins, D.; Ettinger, S.; Lian, Y.; Shyy, W.; Waszak, R.M. Flexible-Wing-Based Micro Air Vehicles. In Proceedings of the Confederation of European Aerospace Societies Aerodynamics Conference, Cambridge, UK, 10–12 June 2002. [Google Scholar]
- Kunz, R. Apparatus for Closing an Air Gap between a Flap and an Aircraft. U.S. Patent No. US4471925A, 18 September 1984. [Google Scholar]
- Diller, J.B.; Miller, N.F. Elastomeric Transition for Aircraft Control Surface. U.S. Patent No. US6145791A, 14 November 2000. [Google Scholar]
- Caton, J.H.; Hobey, M.J.; Groeneveld, J.D.; Jacobs, J.H.; Wille, R.H.; Brase, L.O., Jr. Control Surface for an Aircraft. U.S. Patent No. US6349903B2, 26 February 2002. [Google Scholar]
- Etling, K.A. Morphing Control Surface Transition. U.S. Patent No. US8342447B2, 1 January 2013. [Google Scholar]
- Khorrami, M.R.; Lockard, D.P.; Moore, J.B.; Su, J.; Turner, T.L.; Lin, J.C.; Taminger, K.M.; Kahng, S.K.; Verden, S.A. Elastically Deformable Side-Edge Link for Trailing-Edge Flap Aeroacoustic Noise Reduction. U.S. Patent No. US8695925B2, 15 April 2014. [Google Scholar]
- Khorrami, M.R.; Humphreys, W.M.; Lockard, D.P.; Ravetta, P.A. Aeroacoustic evaluation of flap and landing gear noise reduction concepts. In Proceedings of the 20th AIAA Aviation and Aeronautics Forum and Exposition, Atlanta, GA, USA, 16–20 June 2014. [Google Scholar]
- Woods, B.K.S.; Friswell, M.I. Preliminary investigation of a fishbone active cam-ber concept. In Proceedings of the ASME 2012 Conference on Smart Mate-Rials, Adaptive Structures and Intelligent Systems, Stone Mountain, GA, USA, 19–21 September 2012; pp. 555–563. [Google Scholar]
- Woods, B.K.S.; Bilgen, O.; Friswell, M.I. Wind tunnel testing of the Fish Bone Active Camber morphing concept. J. Intell. Mater. Syst. Struct. 2014, 25, 722–785. [Google Scholar] [CrossRef]
- Woods, B.K.S.; Parsons, L.; Coles, A.B.; Finchamb, J.H.S.; Friswell, M.I. Morphing elastically lofted transition for active camber control surfaces. Aerosp. Sci. Technol. 2015, 55, 439–448. [Google Scholar] [CrossRef]
- Barbarino, S.; Bilgen, O.; Ajaj, R.M.; Friswel, M.I.; Inman, D.J. A Review of Aircraft Morphing. J. Intell. Mater. Syst. Struc. 2011, 22, 823–876. [Google Scholar] [CrossRef]
- Norris, G. FlexSys and Aviation Partners Display Morphing Wing. 2016. Available online: http://aviationweek.com/MorphingWing (accessed on 28 July 2017).
- Kota, S.; Osborn, R.; Ervin, G.; Maric, D.; Flick, P.; Paul, D. Mission Adaptive Compliant Wing—Design, Fabrication and Flight Test. NATO OTAN 2006, 1–18. [Google Scholar]
- Shili, L.; Wenjie, G.; Shujun, L. Optimal Design of Compliant Trailing Edge for Shape Changing. Chin. J. Aeronaut. 2008, 21, 187–192. [Google Scholar] [CrossRef]
- Schorsch, O.; Lühring, A.; Nagel, C.; Pecora, R.; Dimino, I. Polymer Based Morphing Skin for Adaptive Wings. In Proceedings of the 7th ECCOMAS Thematic Conference on Smart Structures and Materials, Ponta Delgada, Portugal, 3–6 June 2015; pp. 2–15. [Google Scholar]
- Belluco, P. EAP—ElectroActive Polymers. 2007. Available online: http://home.deib.polimi.it/gini/introEAP.pdf (accessed on 28 October 2016).
- Abbott, I.H.; Doenhoff, A.E. Thoery of Wing Sections: Including a Summary of Airfoil Data; Dover Publictaions: Mineola, NY, USA, 1959. [Google Scholar]
Figure 1.
(a) The finished 3D printed conventional wing aerofoil model; (b) The finished 3D printed optimized morphing aerofoil model.
Figure 1.
(a) The finished 3D printed conventional wing aerofoil model; (b) The finished 3D printed optimized morphing aerofoil model.
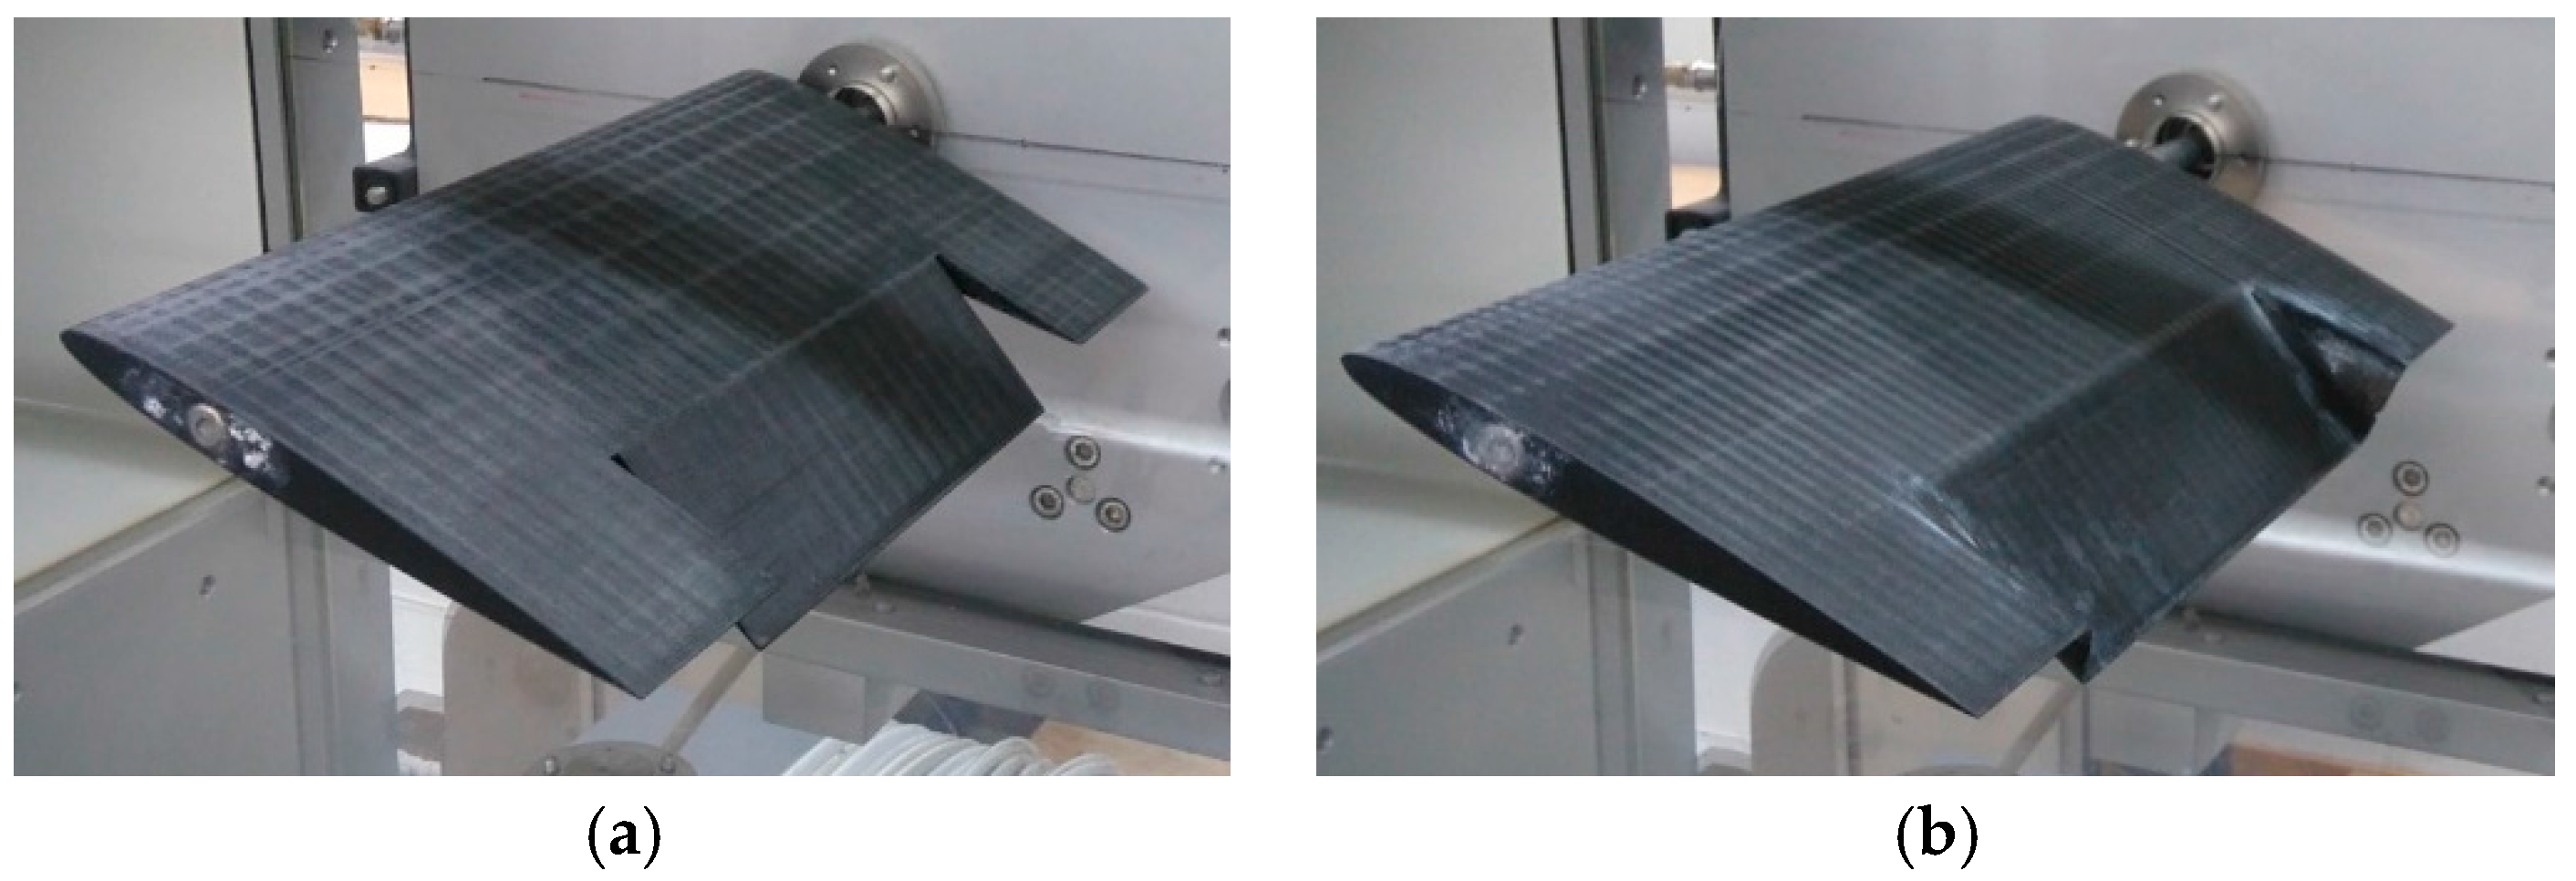
Figure 2.
The coefficient of lift on the conventional wing and optimized morphing wing as angle of attack increases.
Figure 2.
The coefficient of lift on the conventional wing and optimized morphing wing as angle of attack increases.

Figure 3.
Conventional wing lift coefficient wind tunnel data standard deviation.
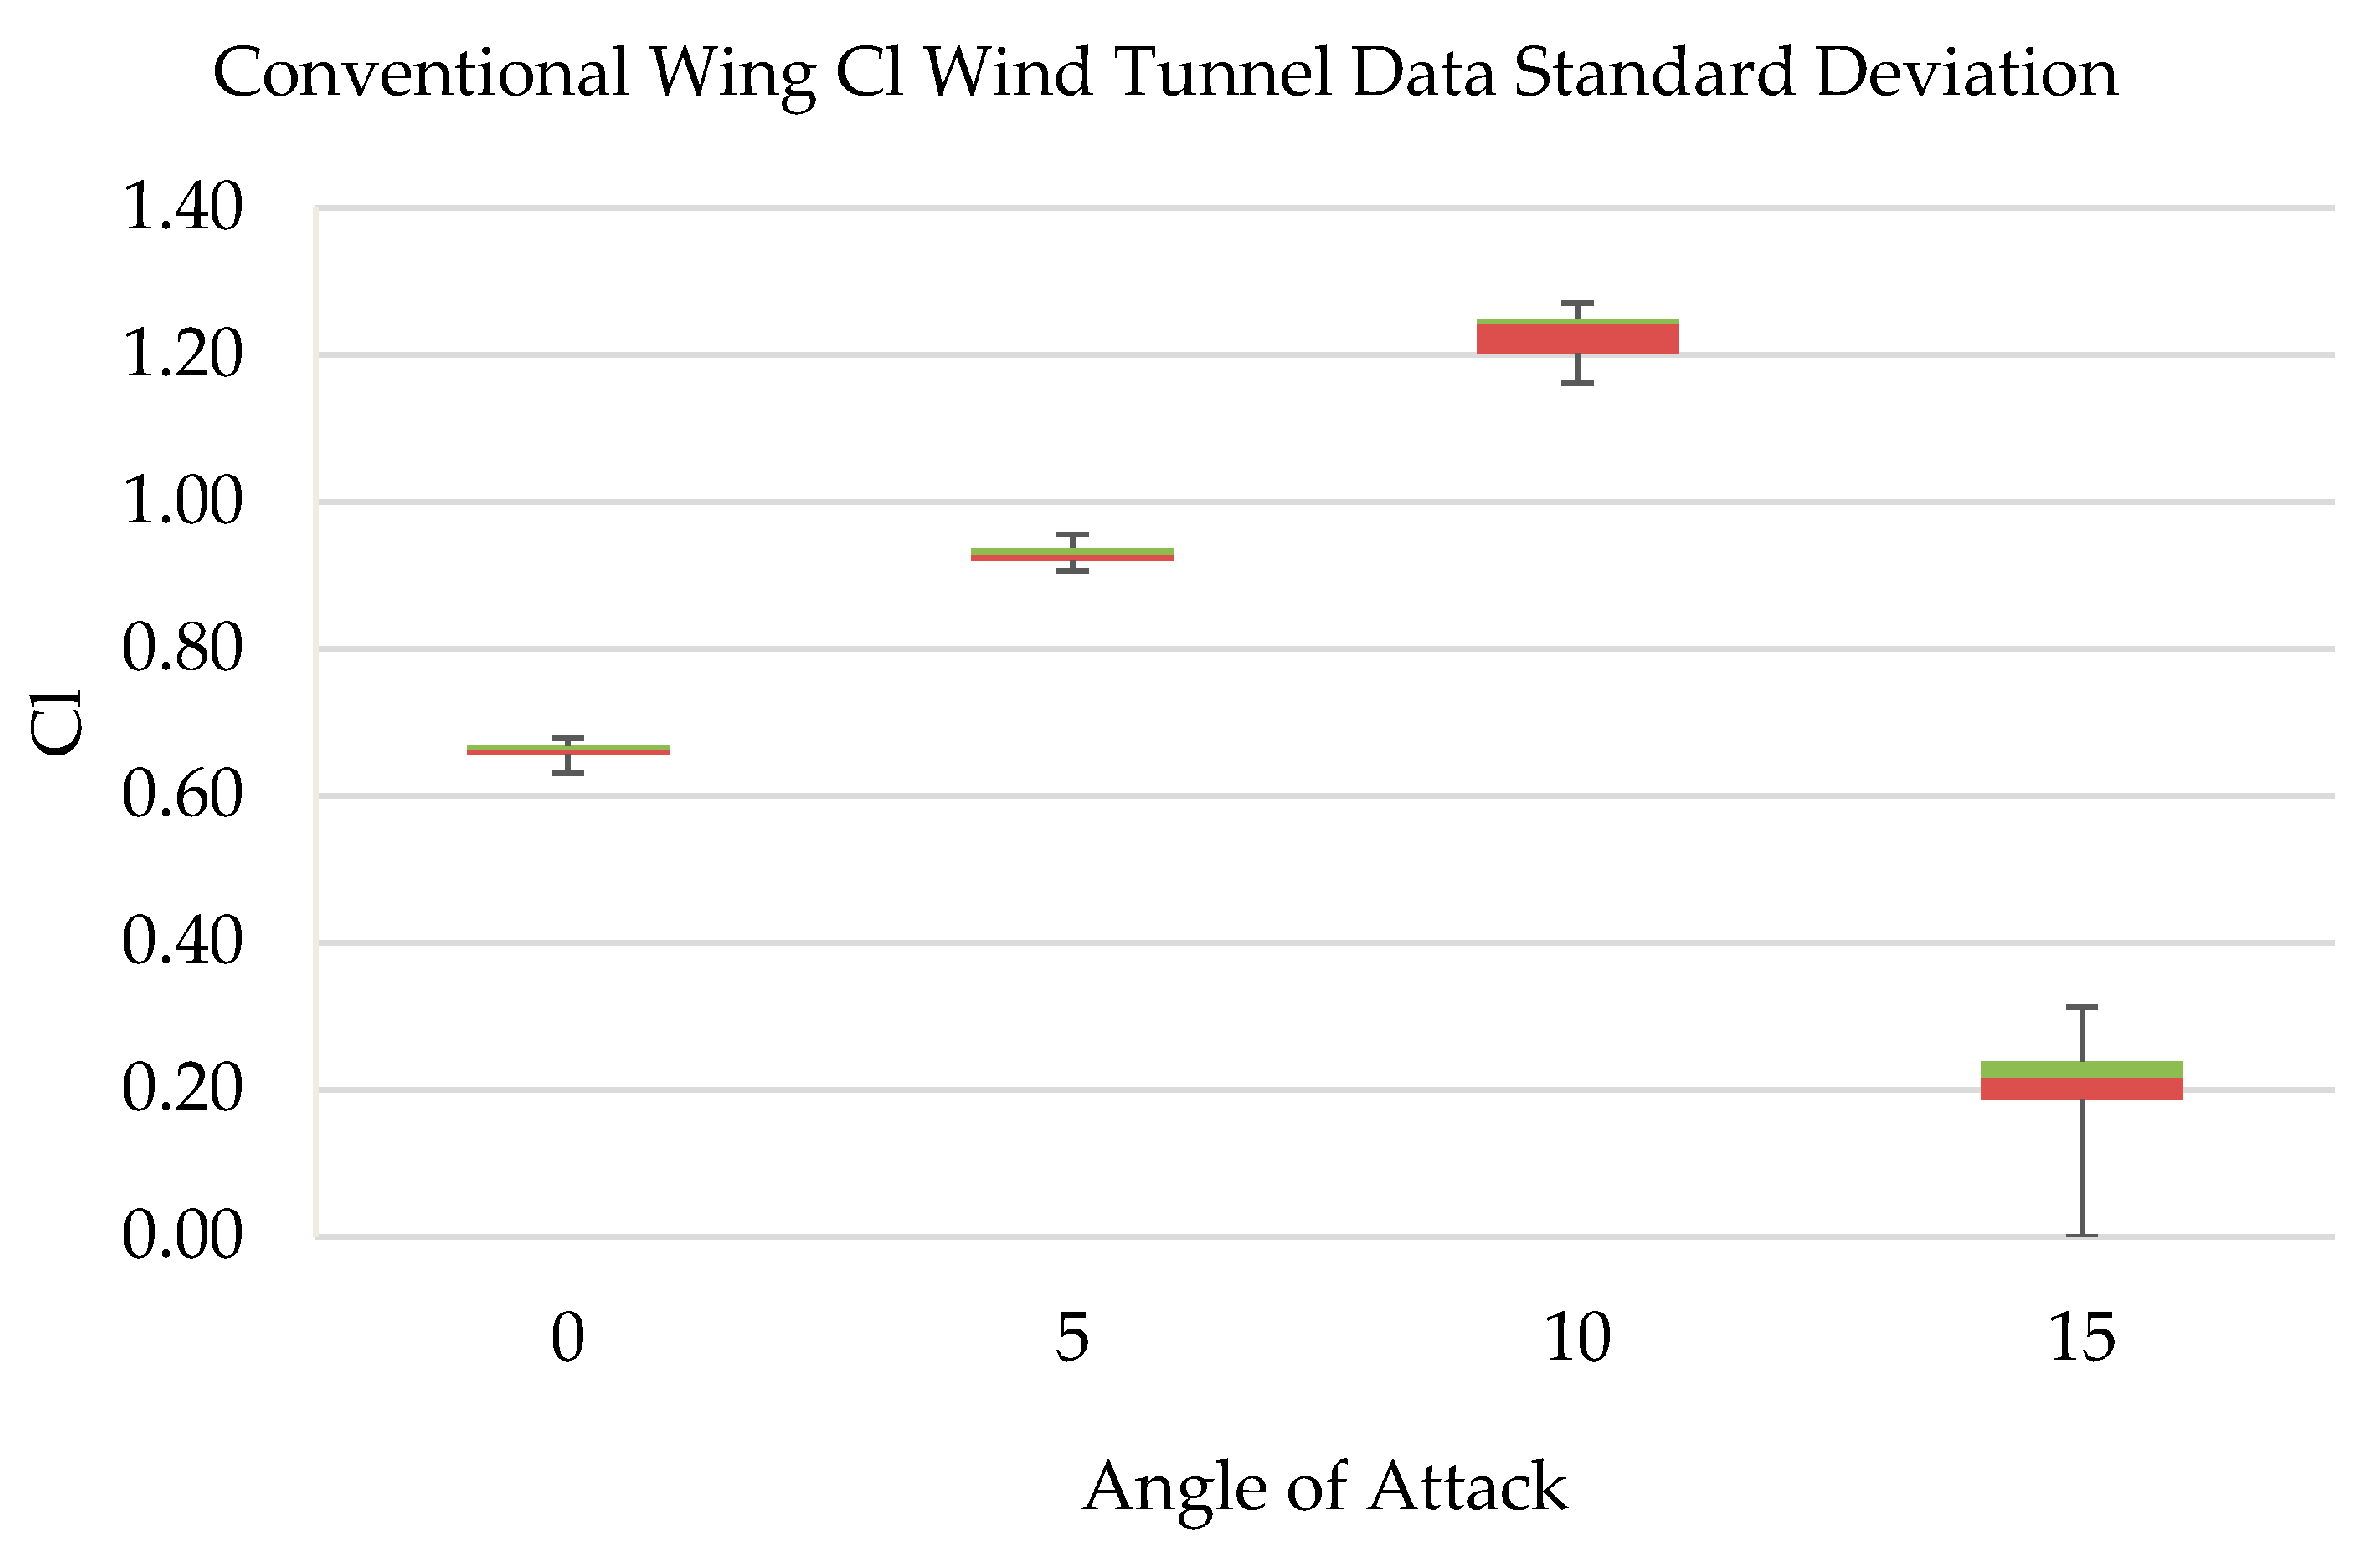
Figure 4.
Conventional wing drag coefficient wind tunnel data standard deviation.
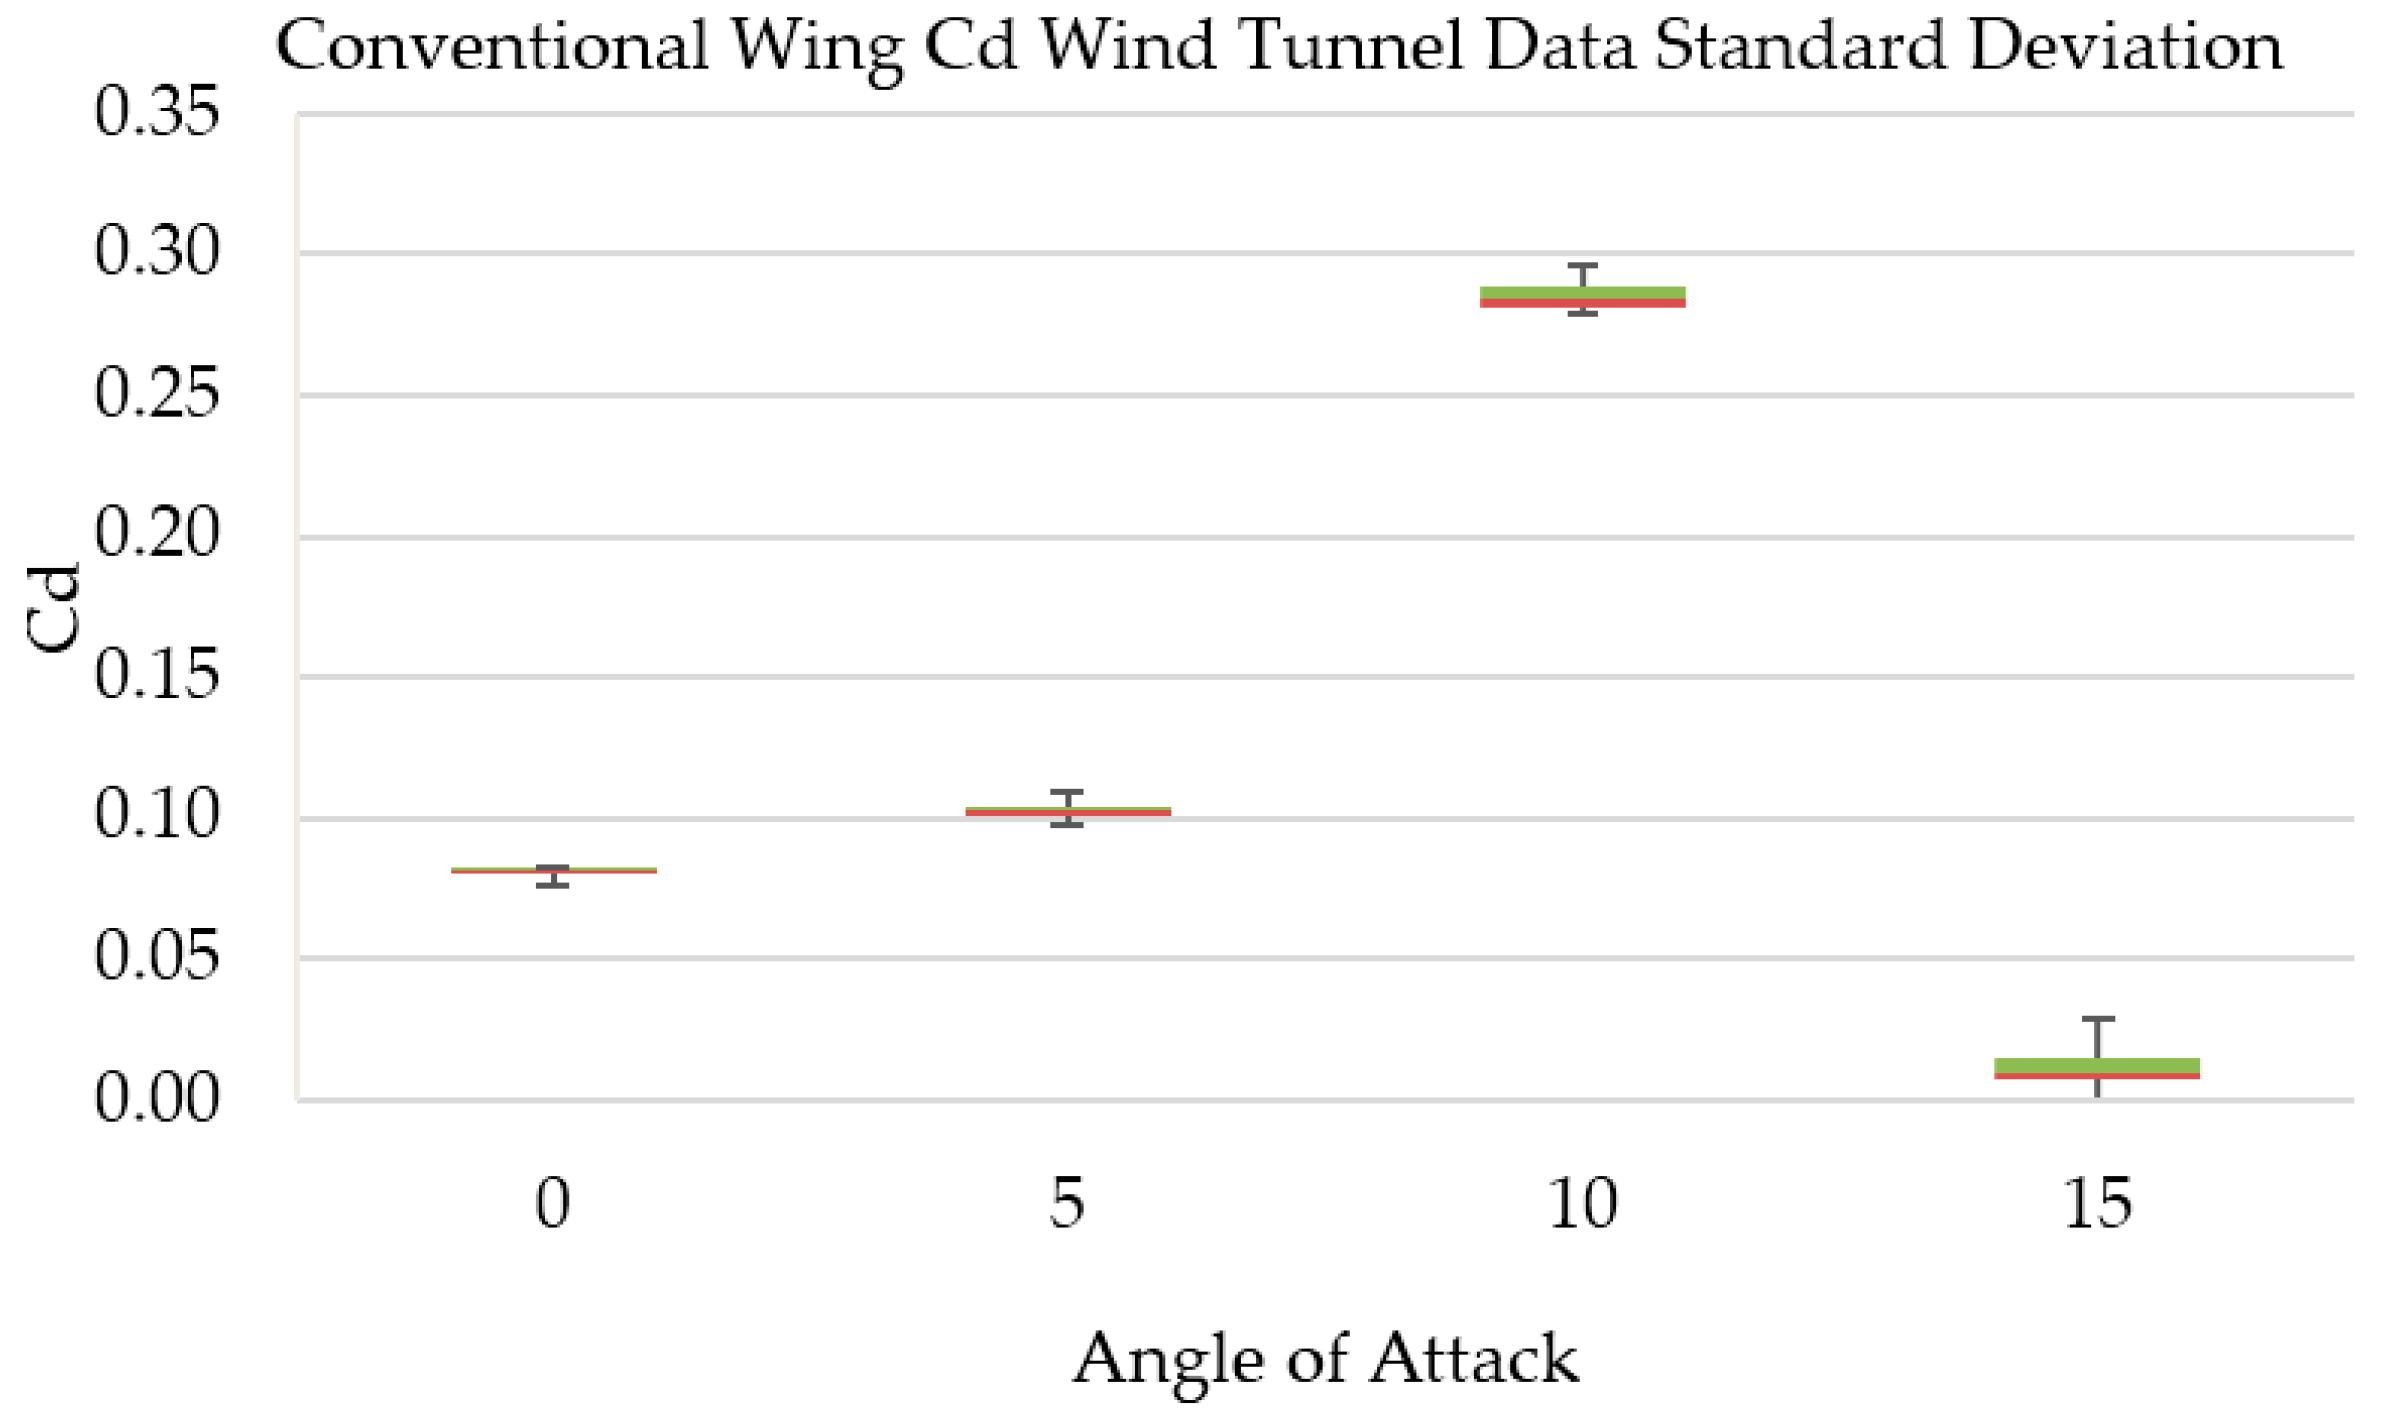
Figure 5.
Optimized wing lift coefficient wind tunnel data standard deviation.

Figure 6.
Optimized wing drag coefficient wind tunnel data standard deviation.
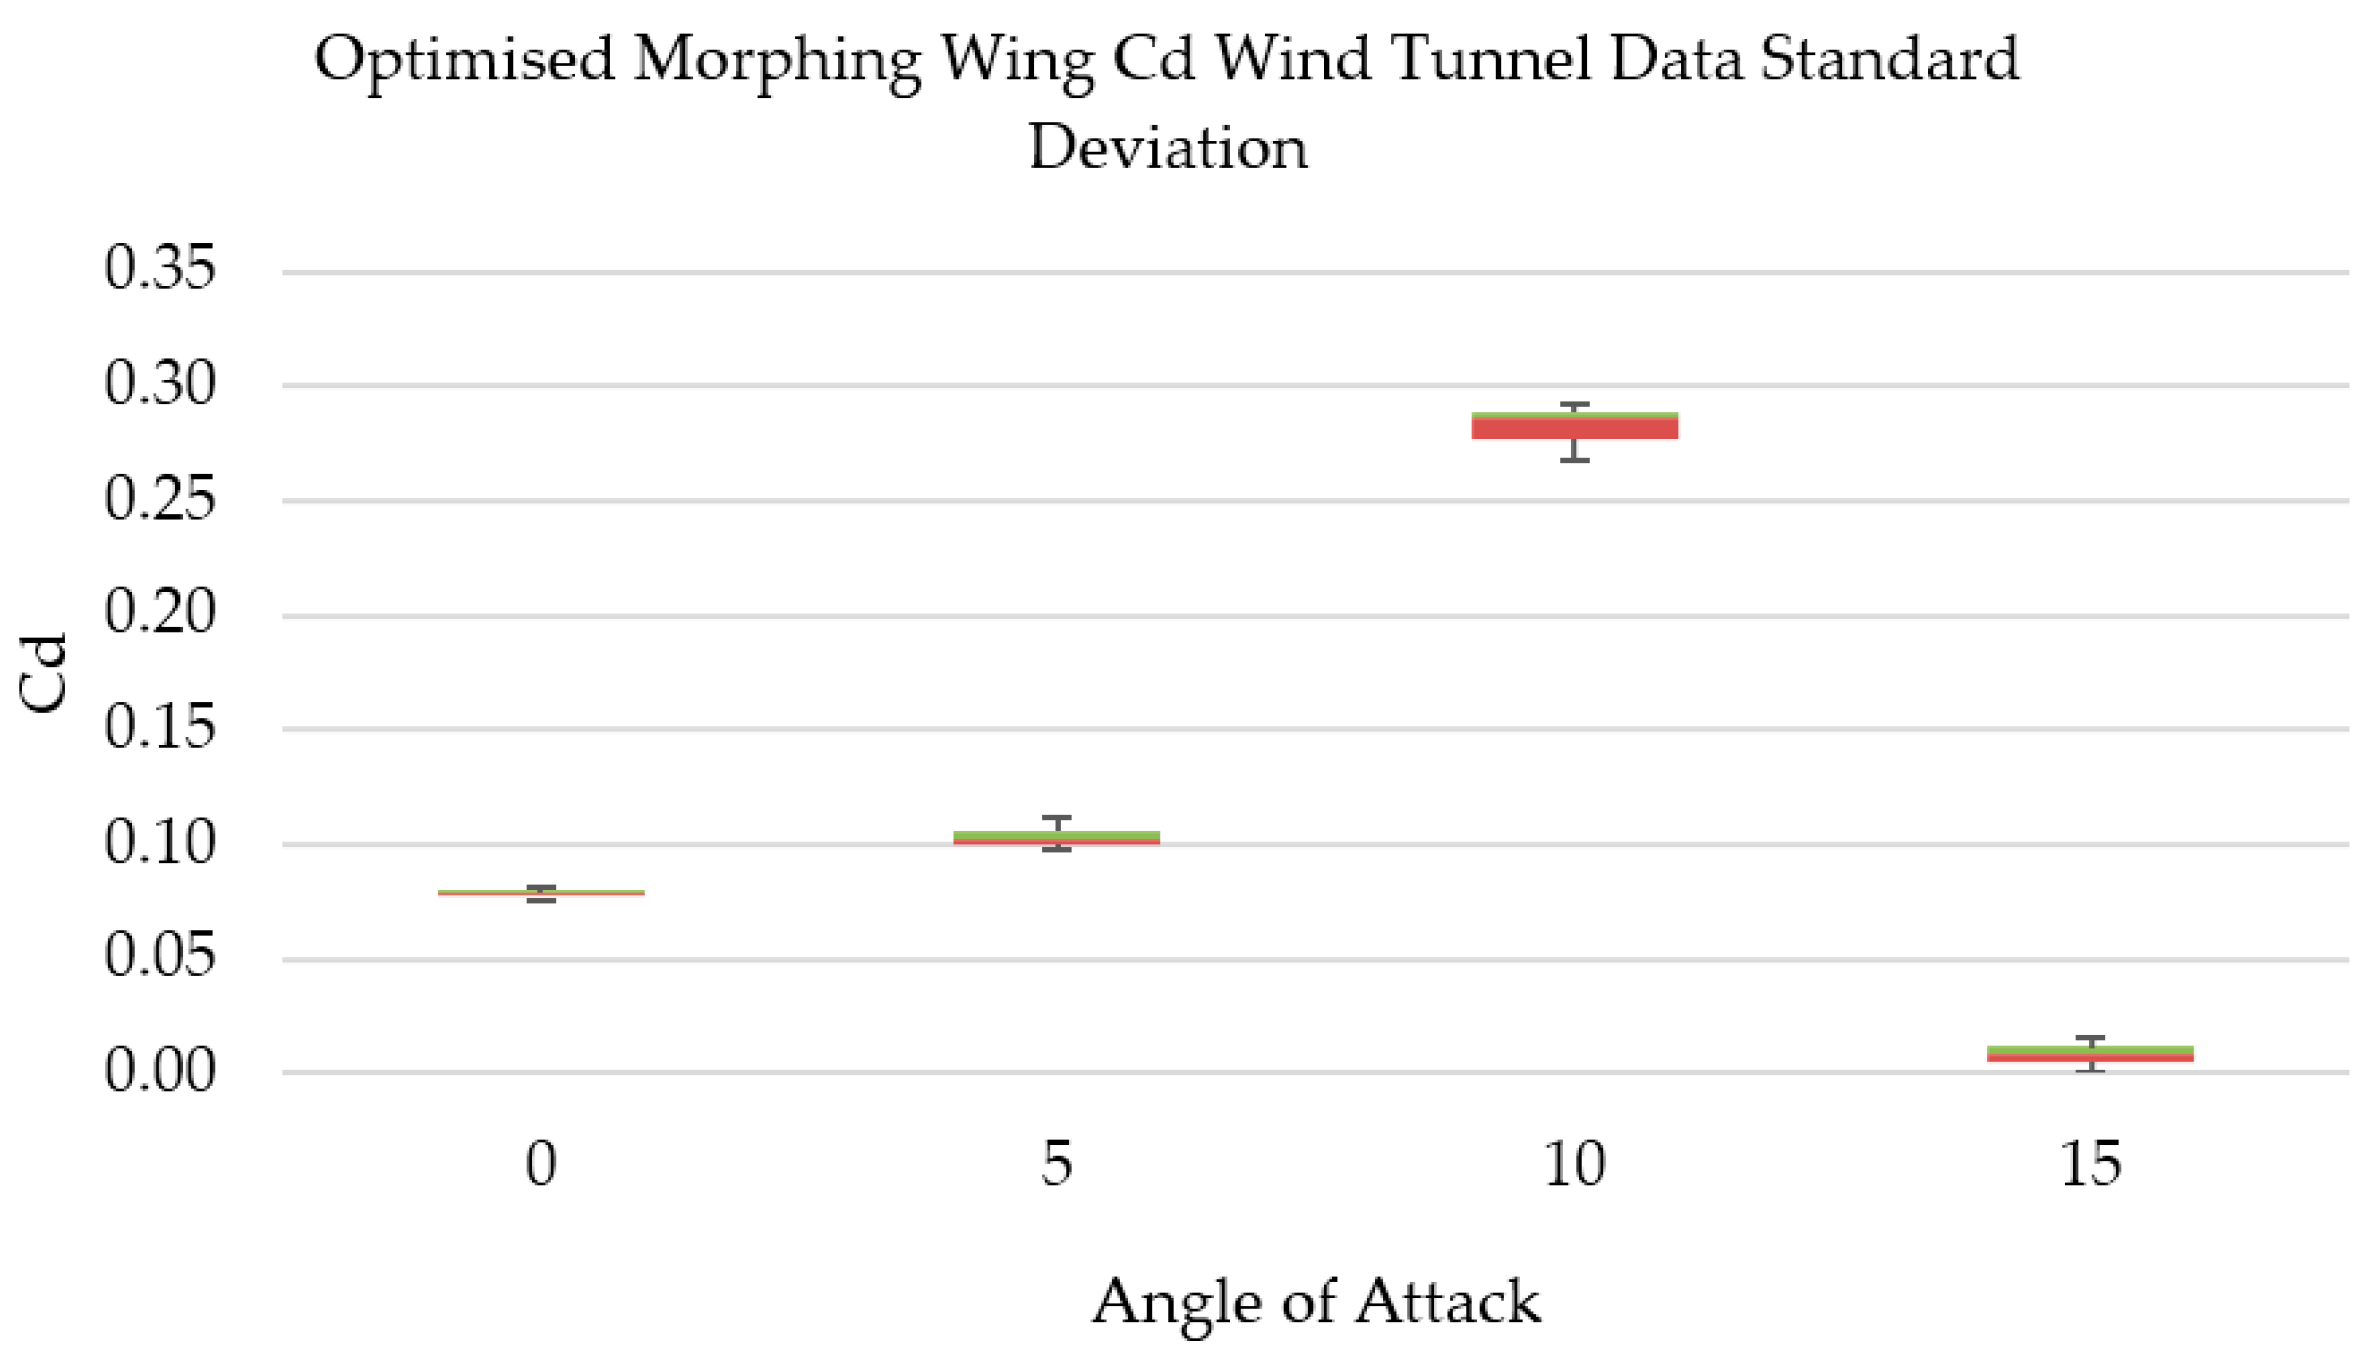
Figure 7.
Conventional wing lift coefficient wind tunnel error bars.

Figure 8.
Conventional wing drag coefficient wind tunnel error bars.
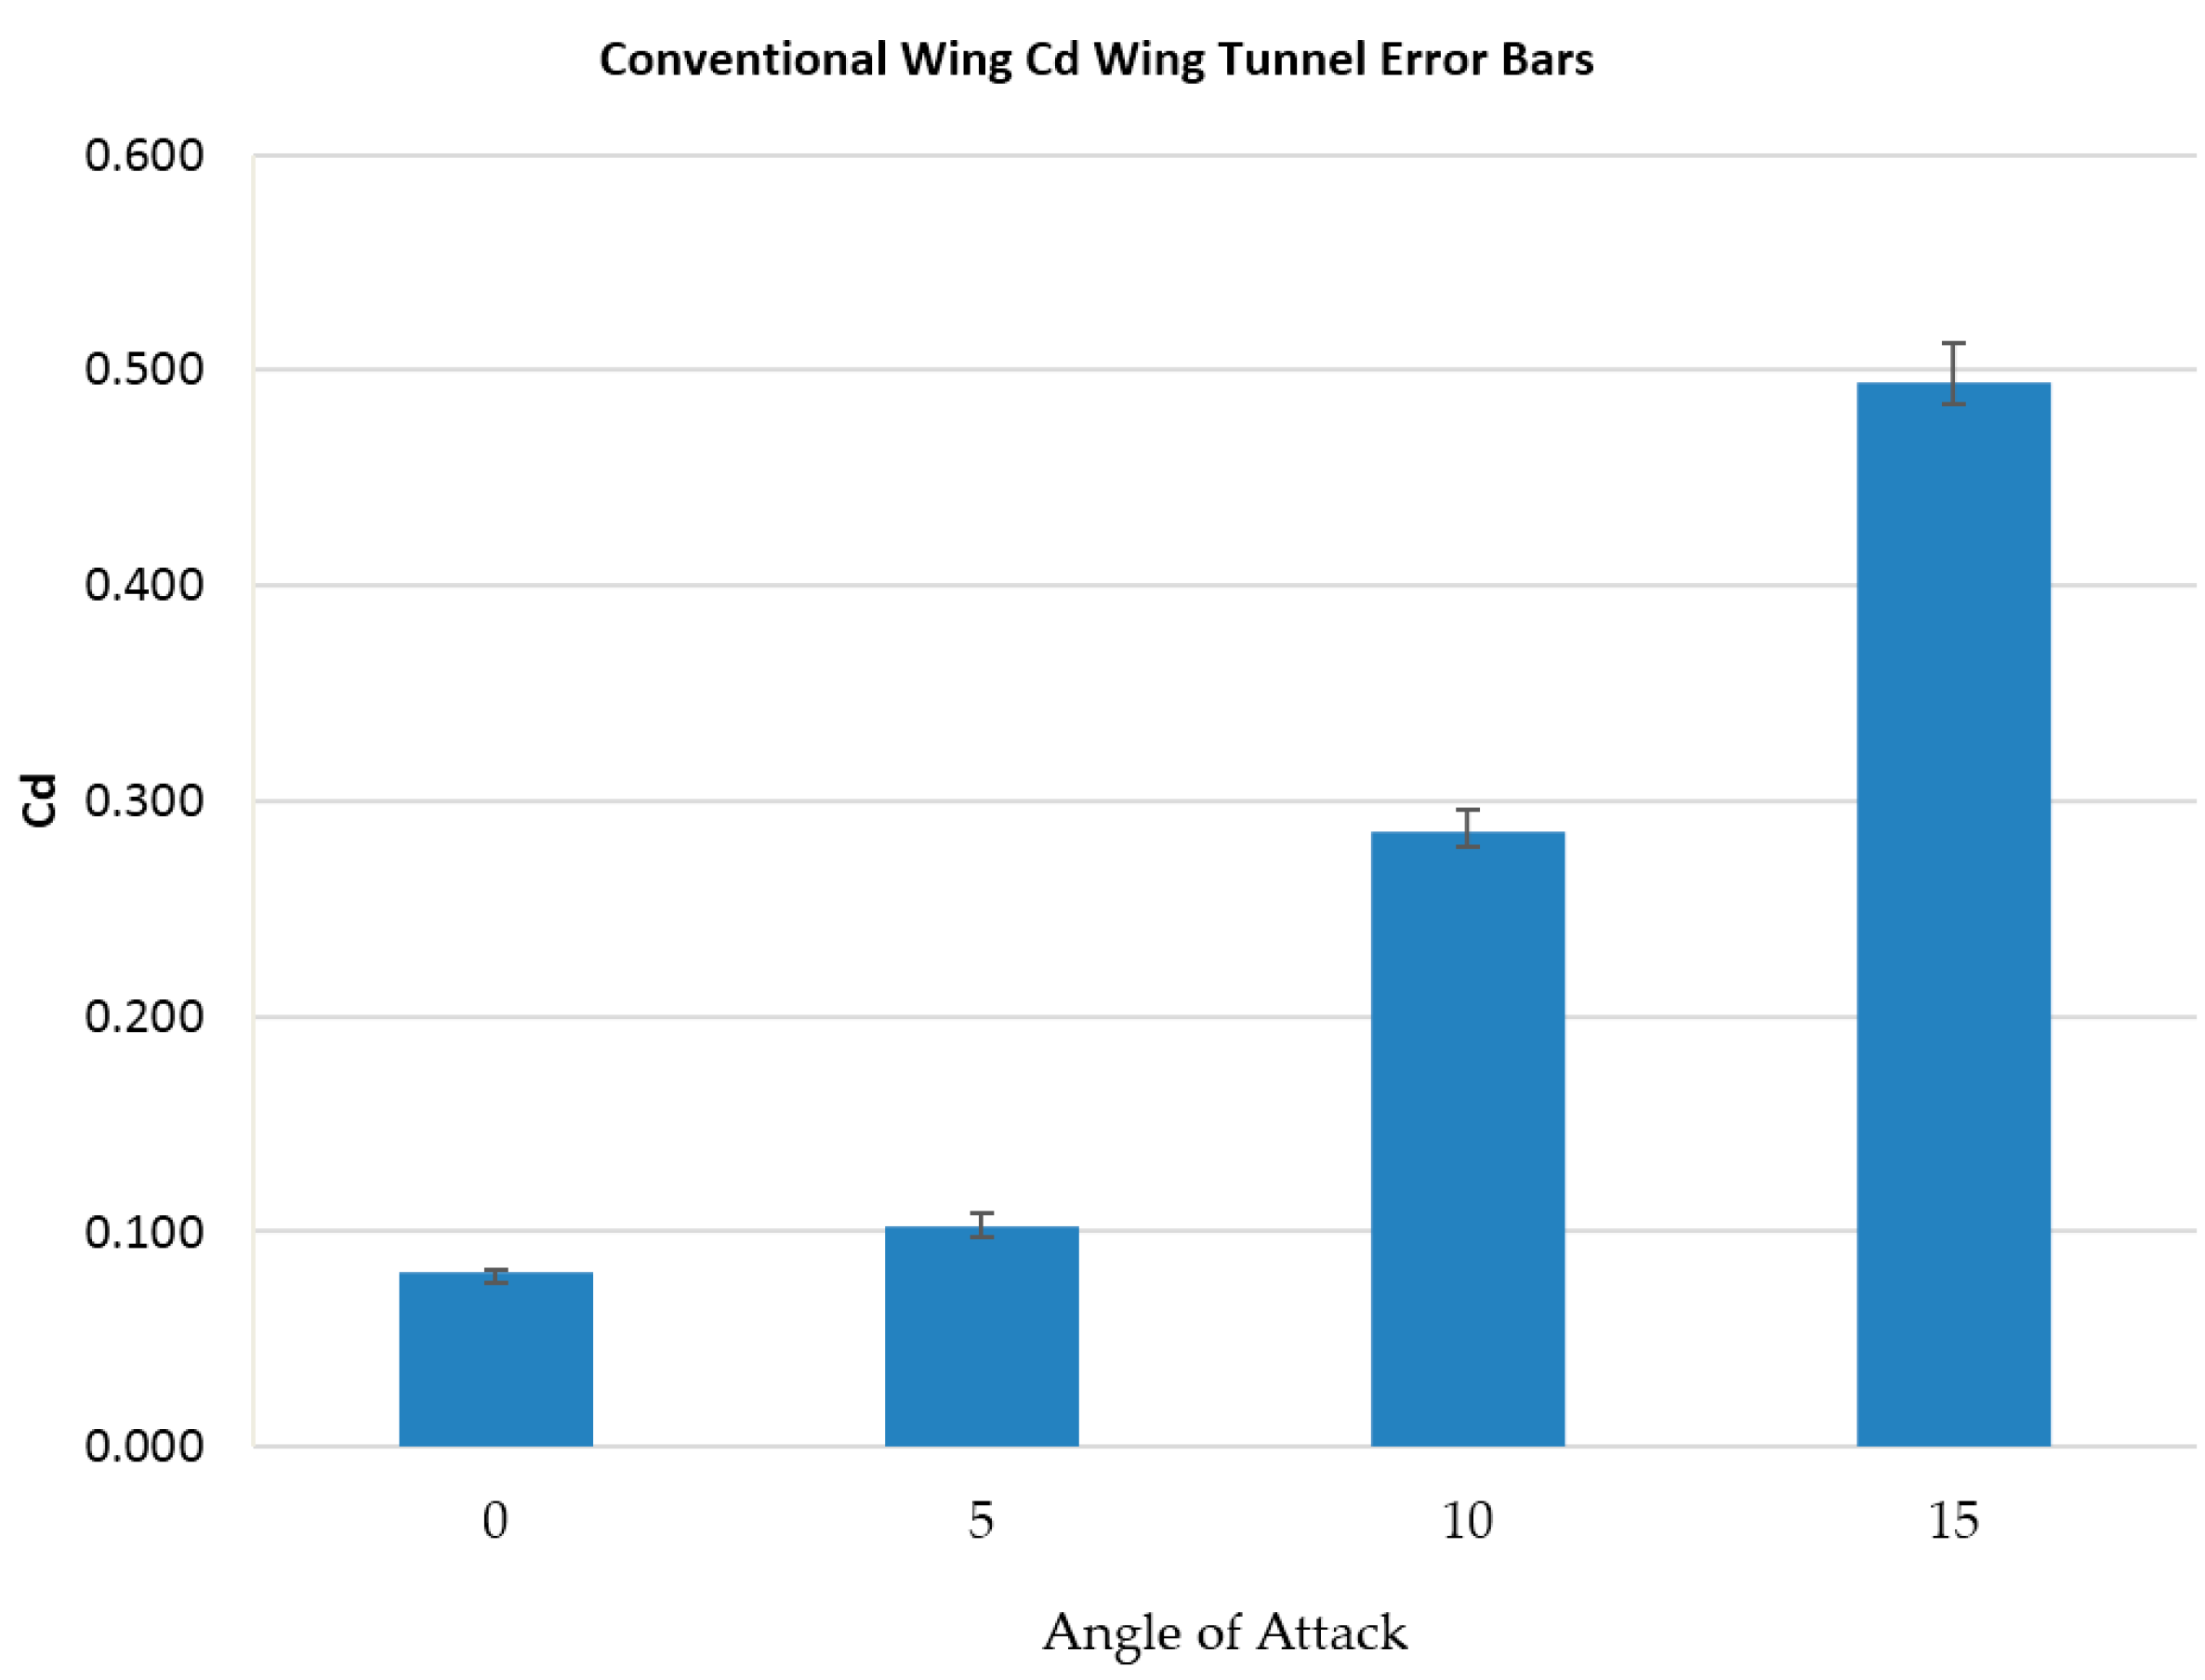
Figure 9.
Morphing wing lift coefficient wind tunnel error bars.

Figure 10.
Morphing wing drag coefficient wind tunnel error bars.
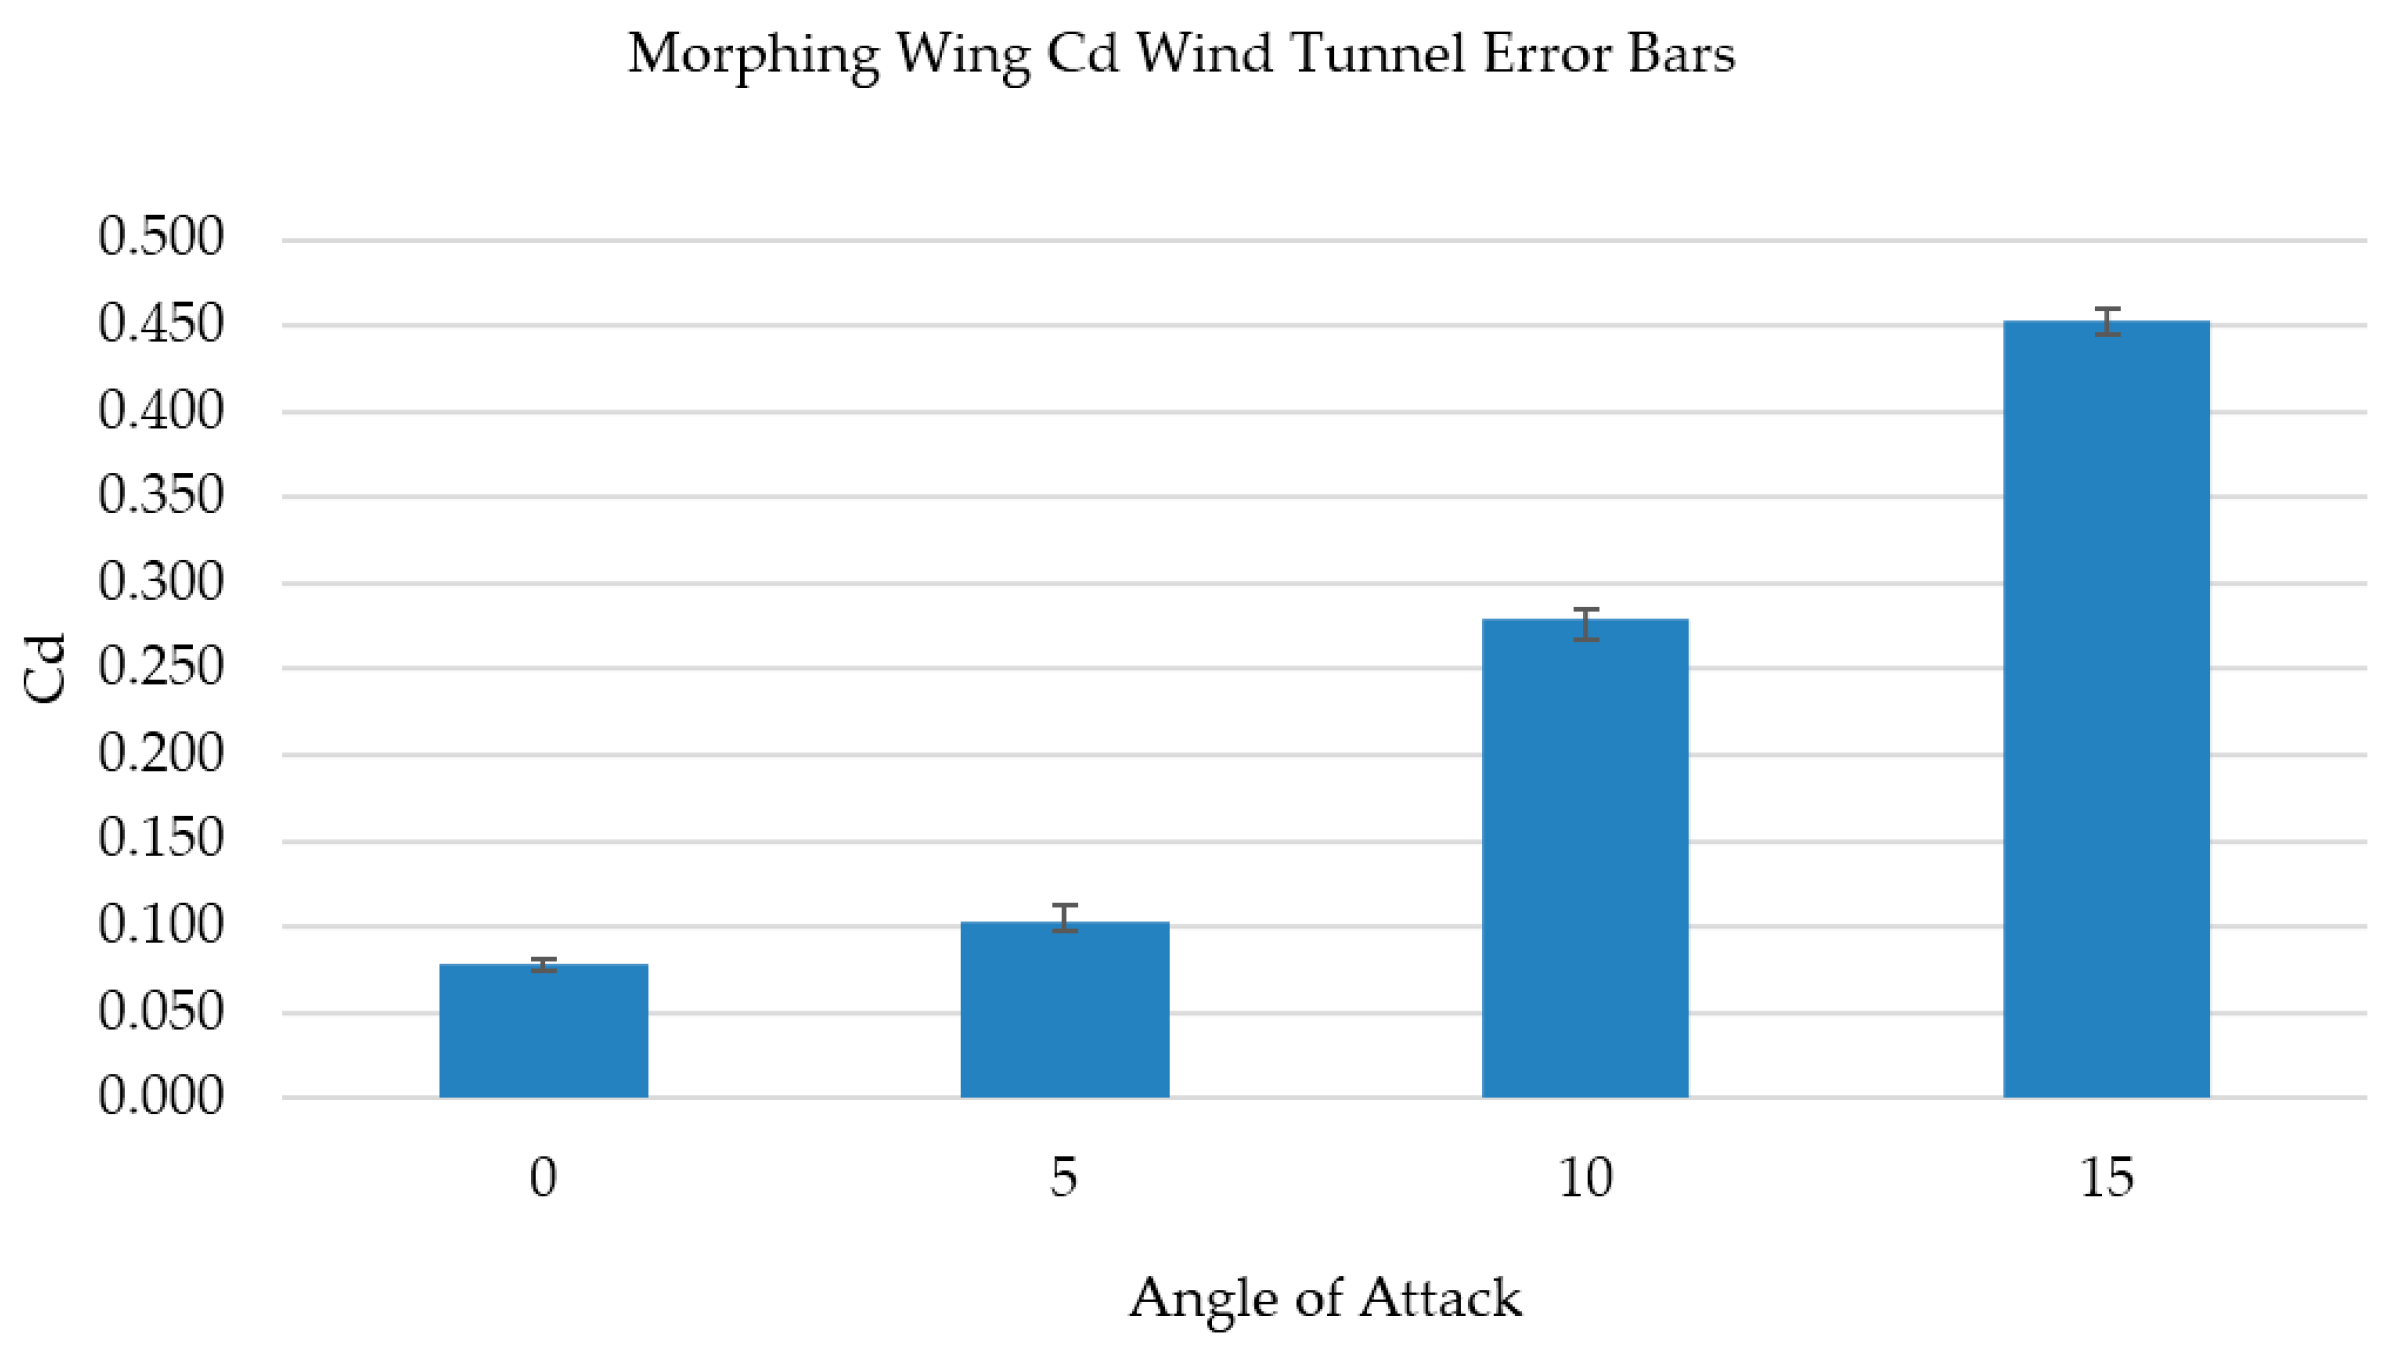
Figure 11.
The flow domains geometry.
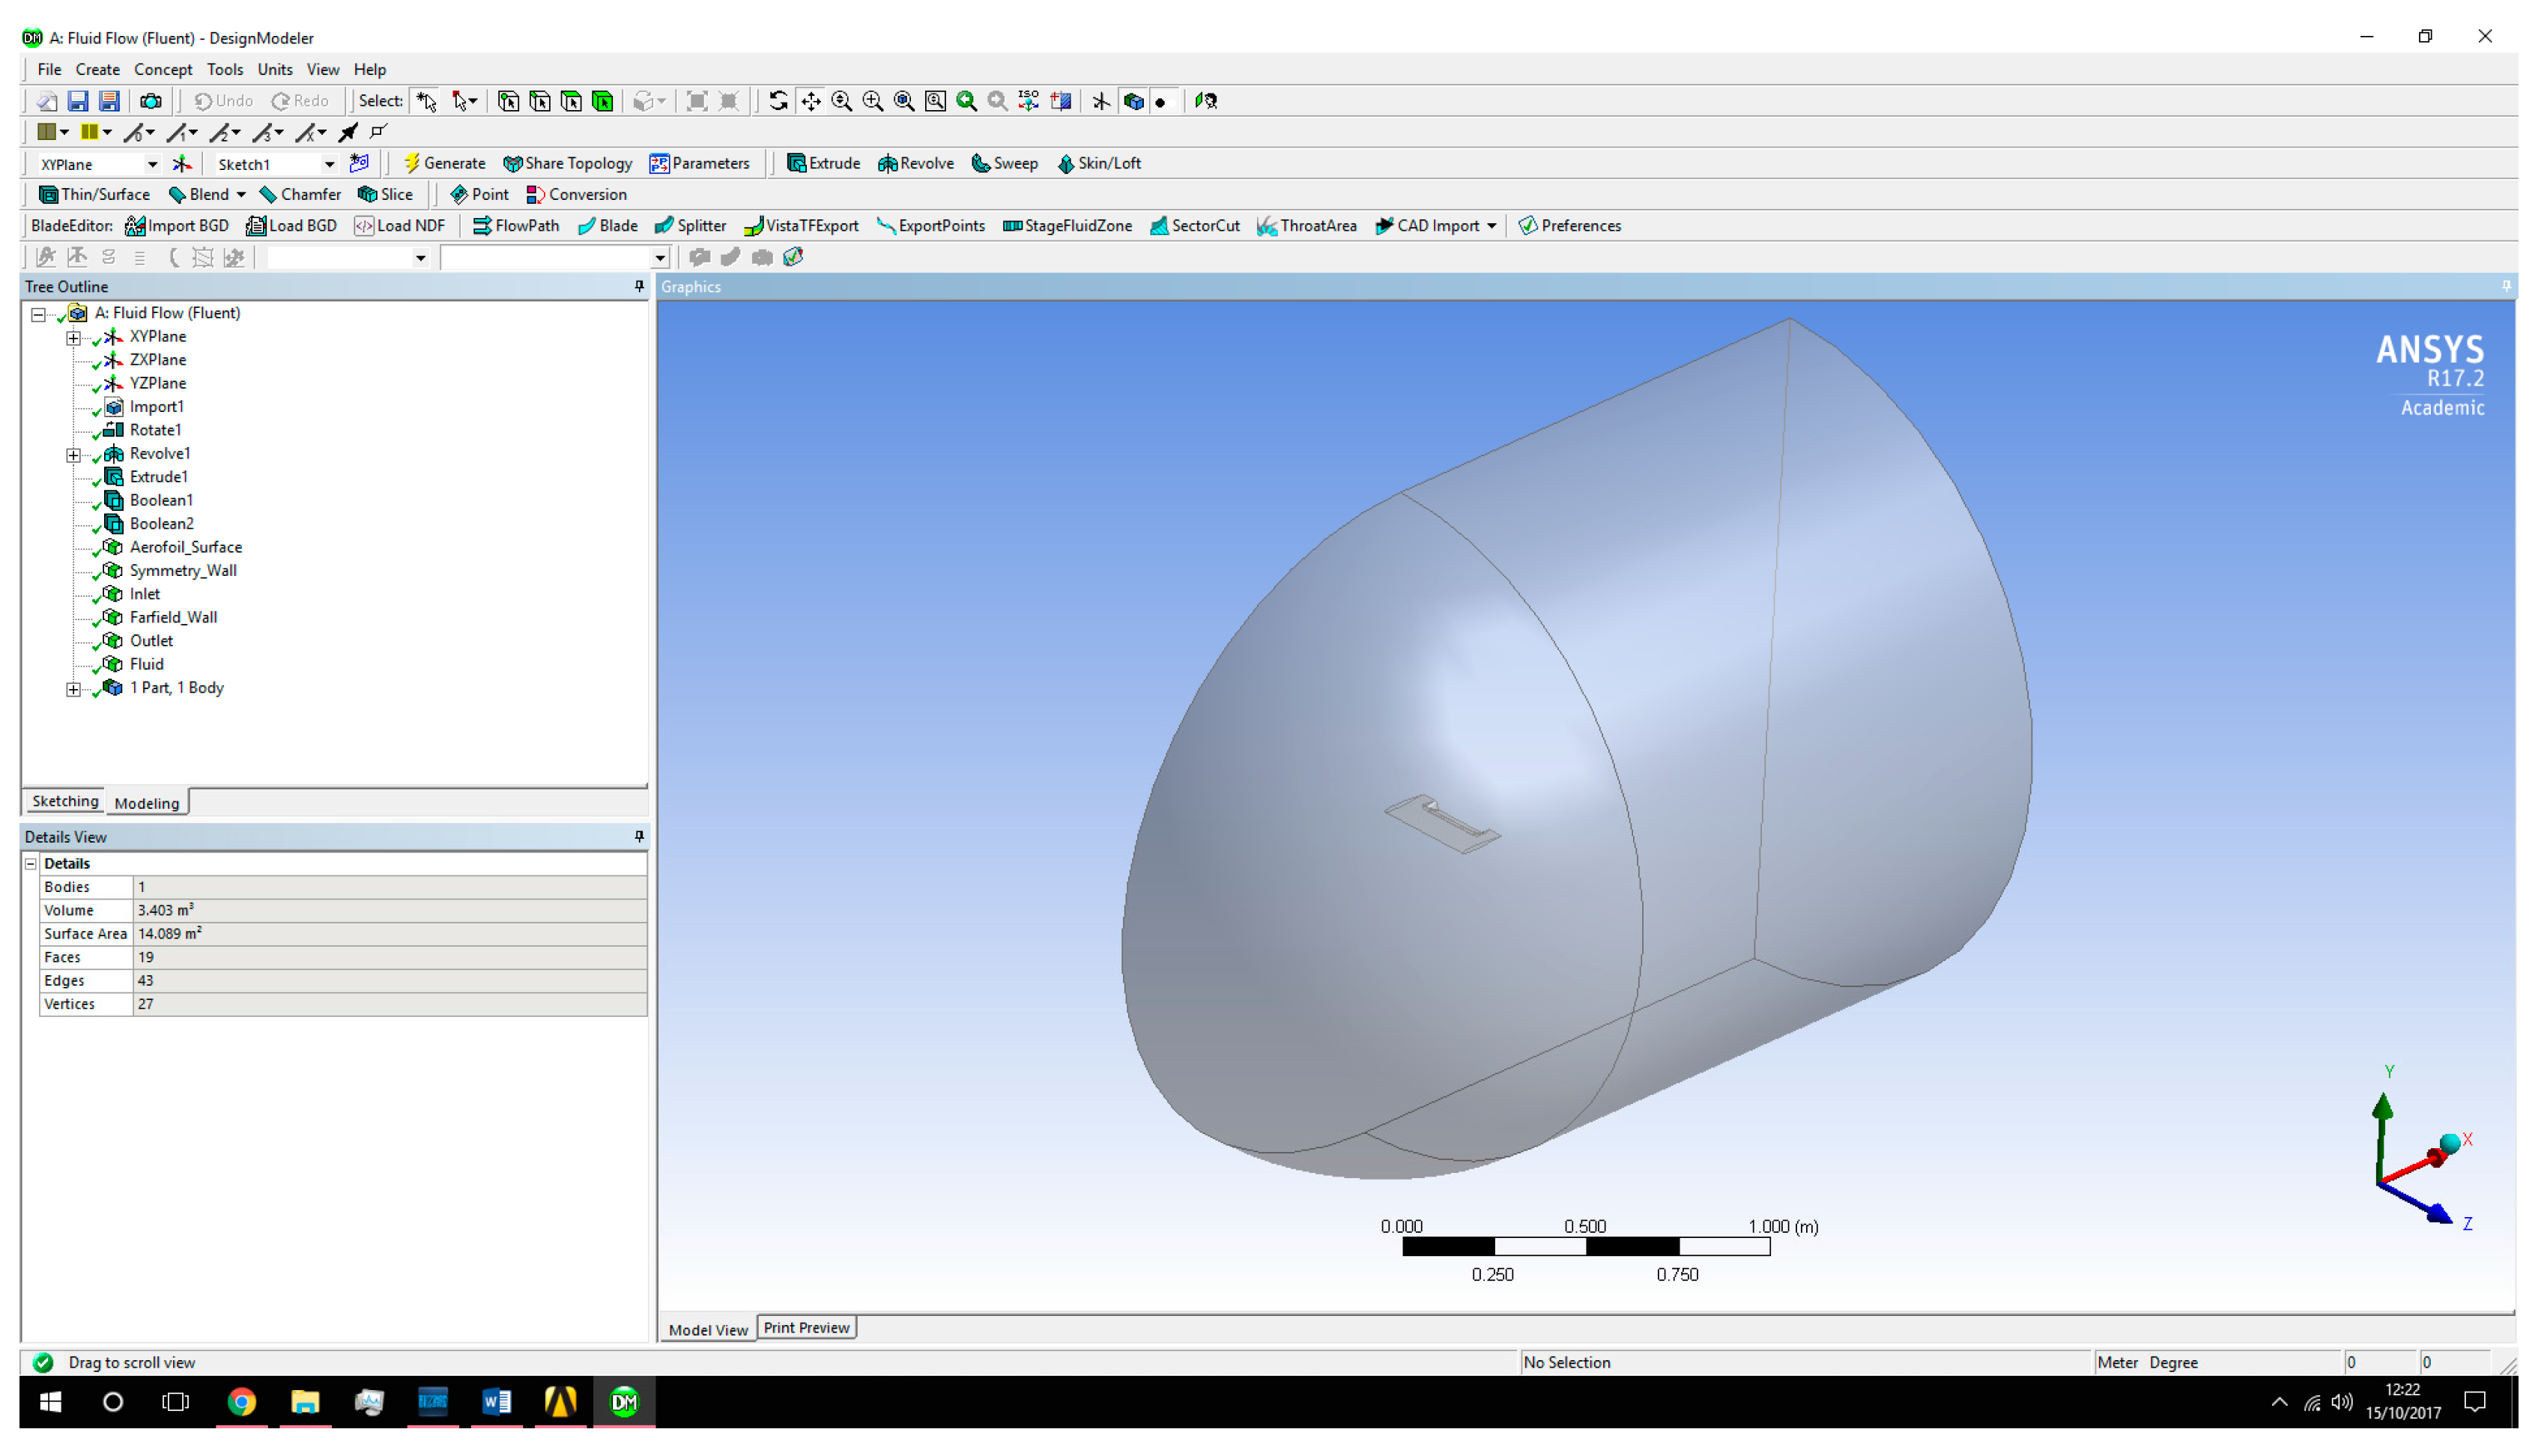
Figure 12.
Details of the flow domains sketch.

Figure 13.
The pressure coefficients of the flow over a conventional wing aerofoil, vortices indicated in red circle, 0-degree angle of attack (a) Side view; (b) Top view; (c) Rear View.
Figure 13.
The pressure coefficients of the flow over a conventional wing aerofoil, vortices indicated in red circle, 0-degree angle of attack (a) Side view; (b) Top view; (c) Rear View.

Figure 14.
The low-pressure coefficient at the centre of the vortices at 0-degree angle of attack.

Figure 15.
Images showing the vortex size for the conventional wing (a) at 0 degrees’ angle of attack (b) at 5 degrees’ angle of attack.
Figure 15.
Images showing the vortex size for the conventional wing (a) at 0 degrees’ angle of attack (b) at 5 degrees’ angle of attack.

Figure 16.
A graph showing the coefficient of lift results generated from Ansys for the conventional wing and initial morphing wing.
Figure 16.
A graph showing the coefficient of lift results generated from Ansys for the conventional wing and initial morphing wing.
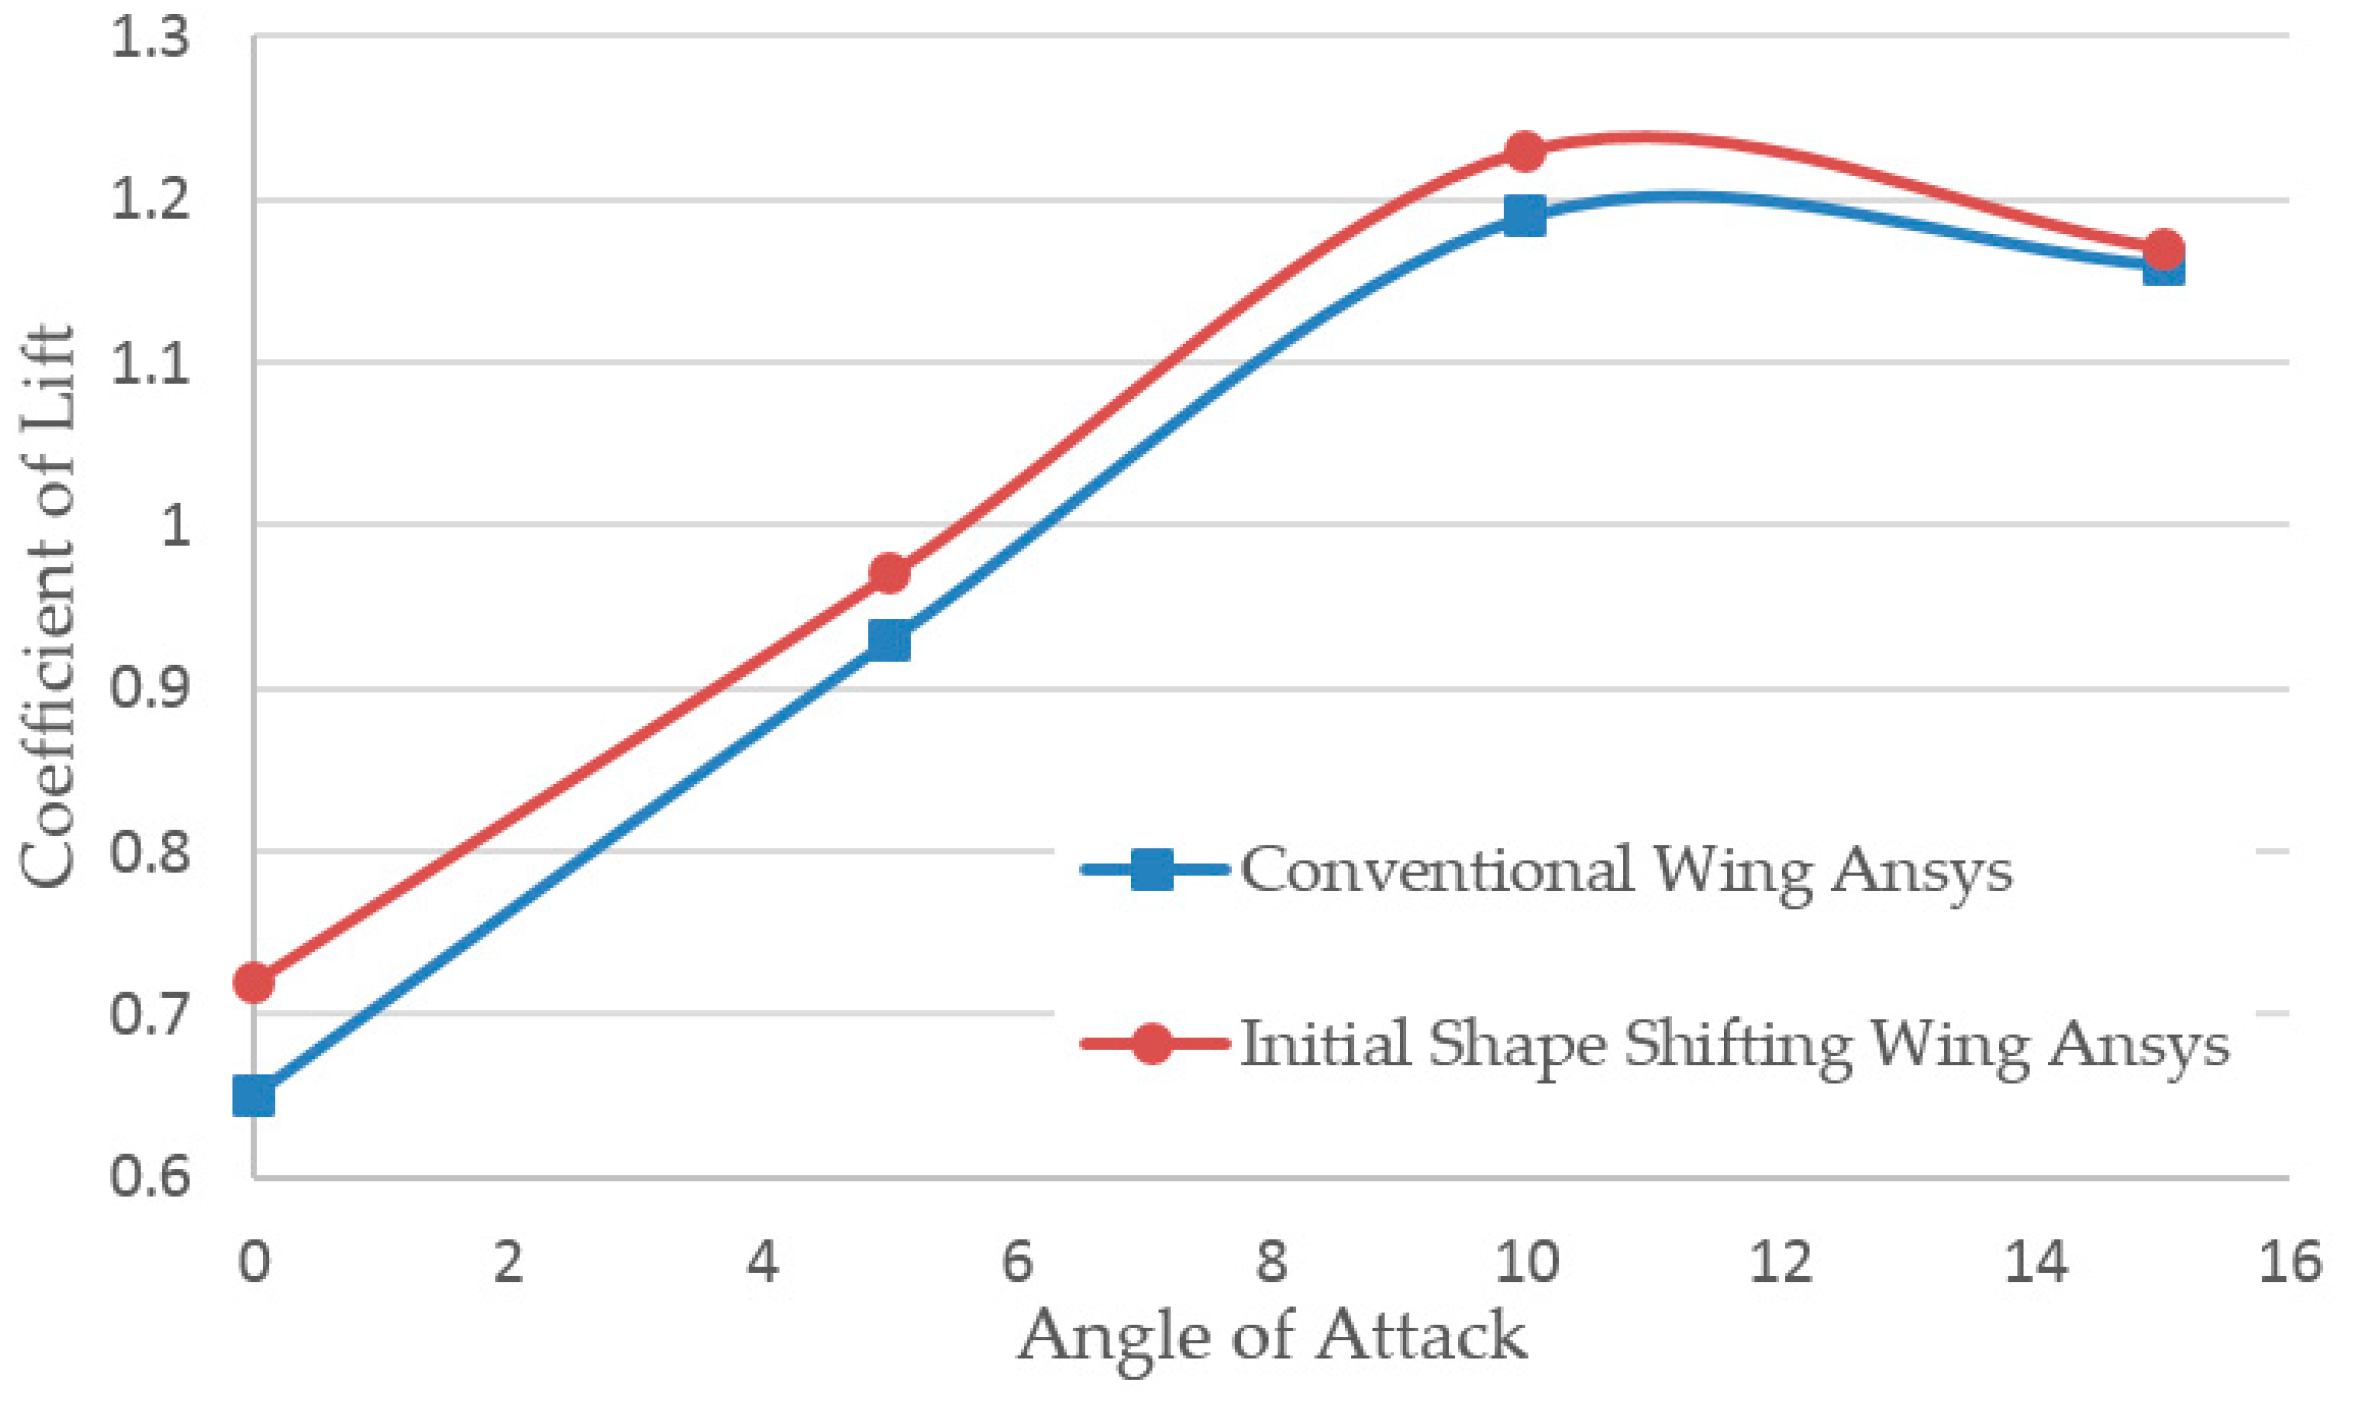
Figure 17.
A graph showing Coefficient of drag versus coefficient of lift for the initial morphing and conventional wing.
Figure 17.
A graph showing Coefficient of drag versus coefficient of lift for the initial morphing and conventional wing.

Figure 18.
A graph showing Lift/drag otherwise known as the glide ratio for the conventional wing and initial morphing wing.
Figure 18.
A graph showing Lift/drag otherwise known as the glide ratio for the conventional wing and initial morphing wing.
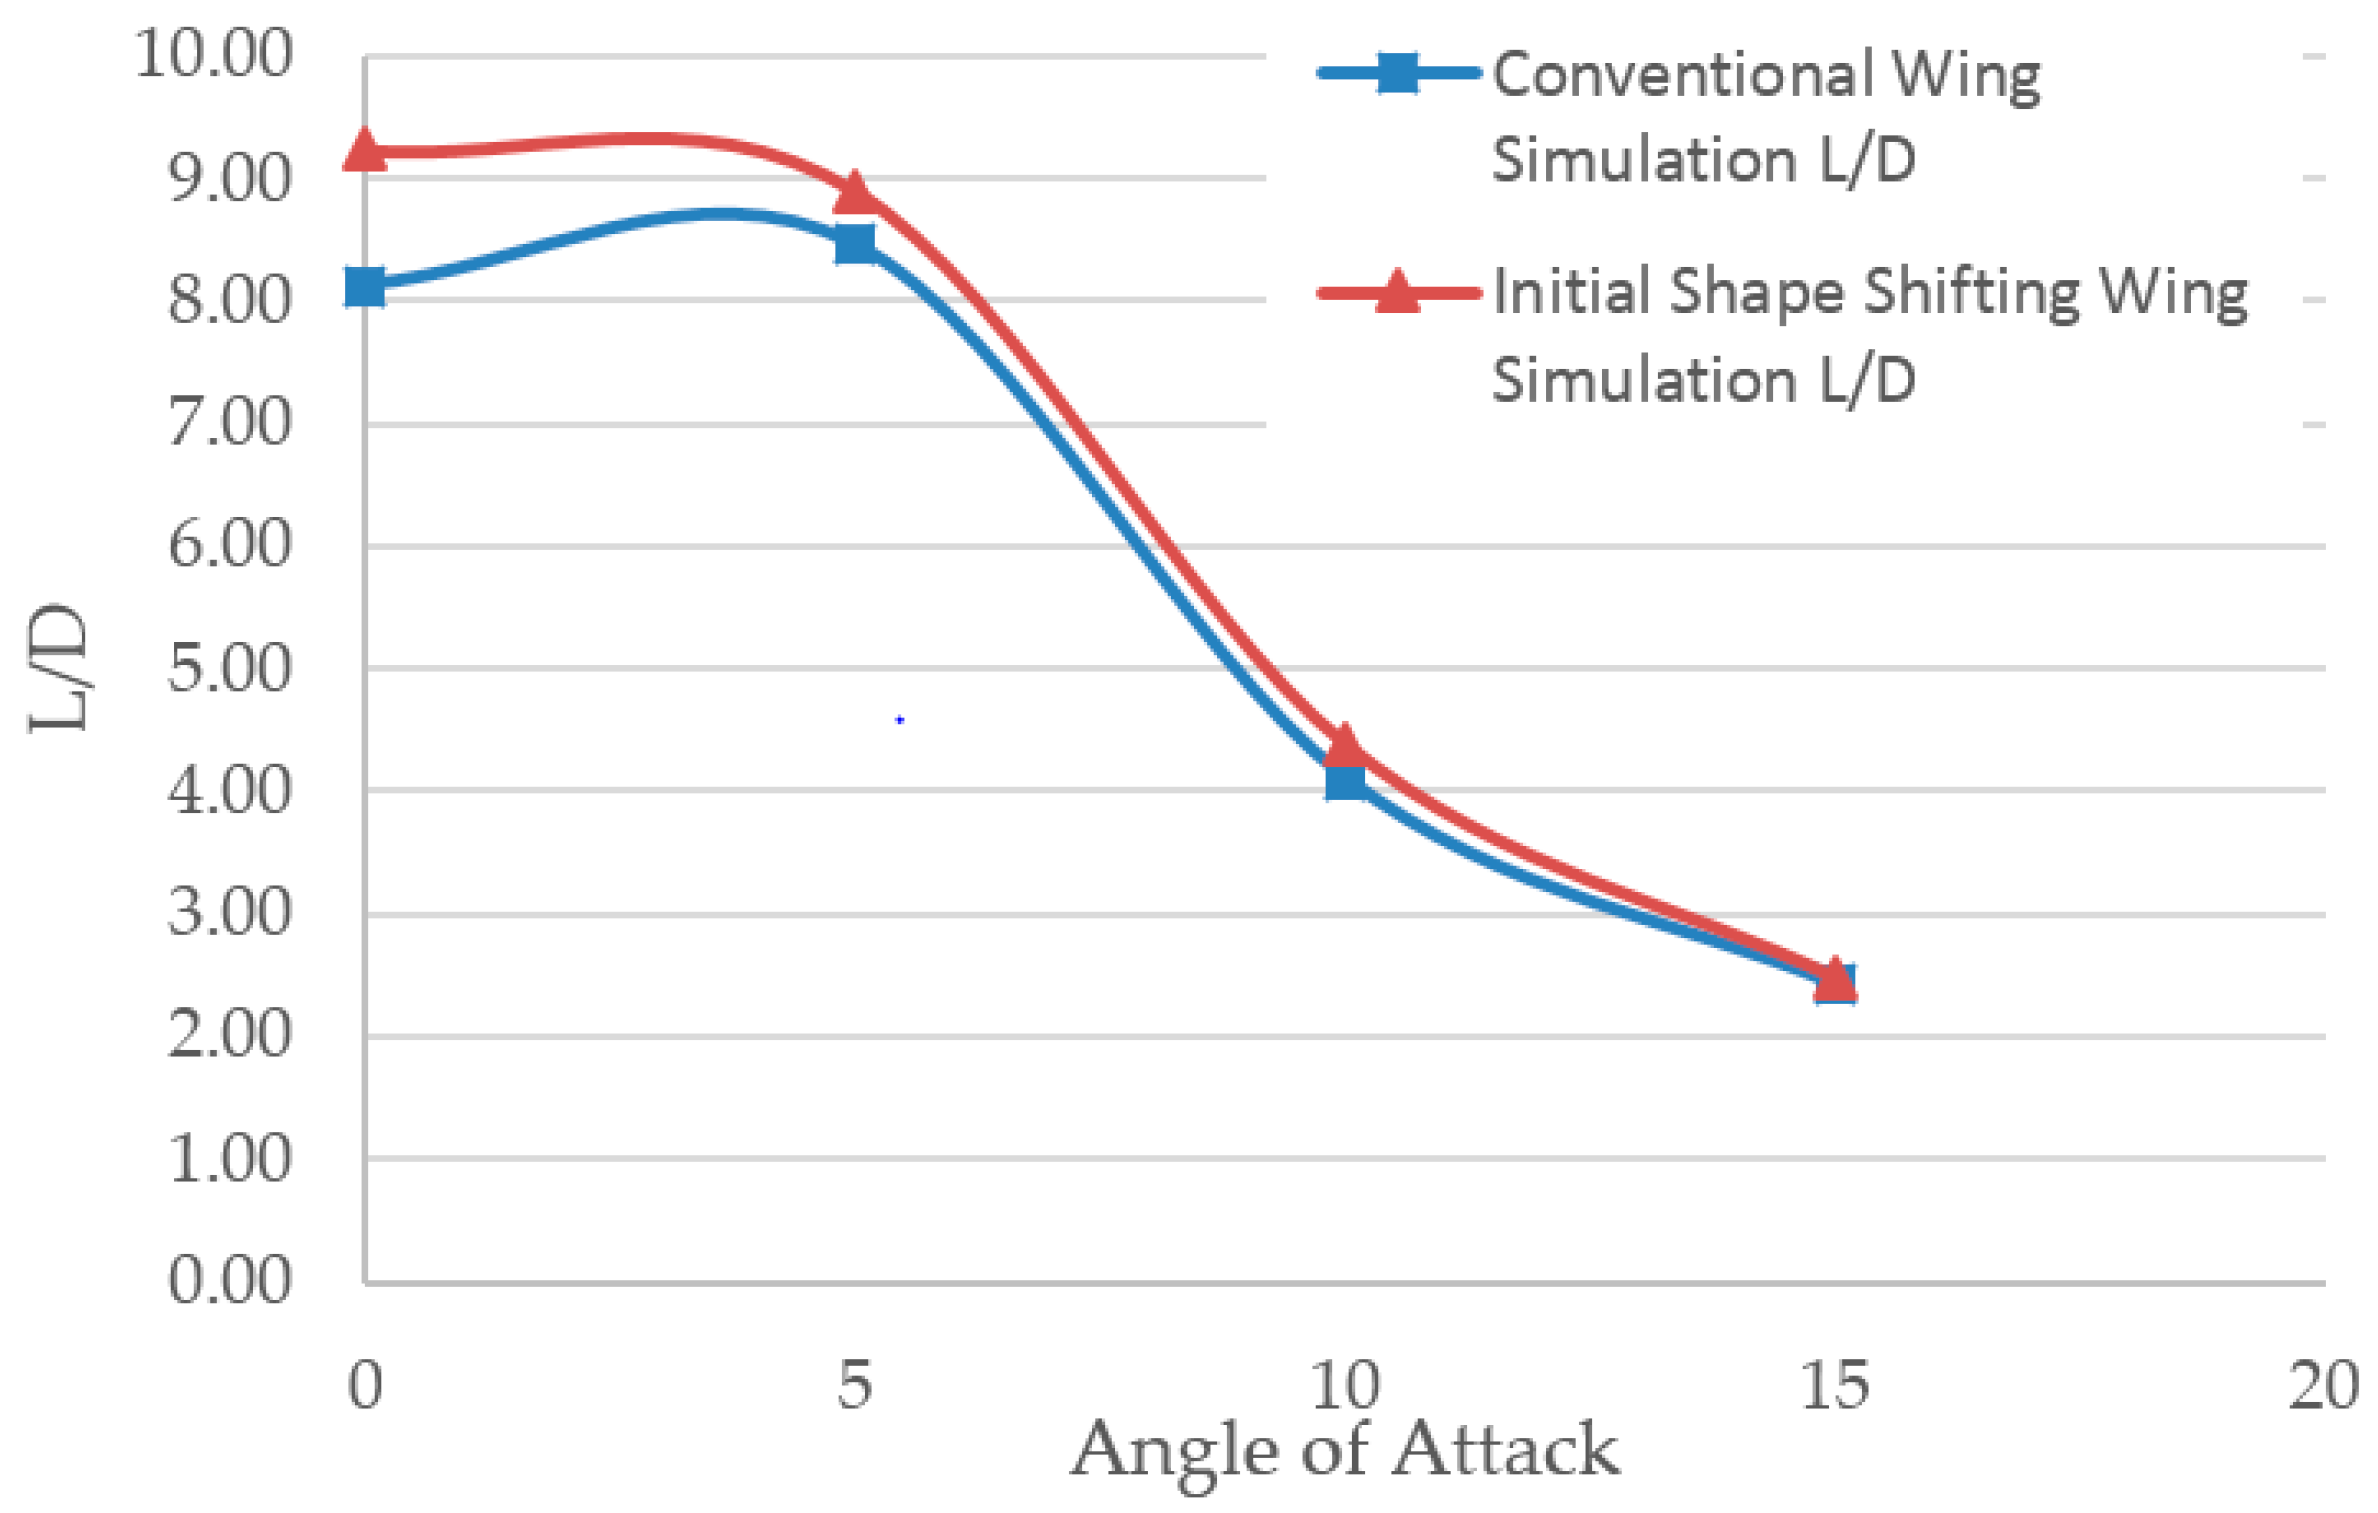
Figure 19.
The pressure coefficient (a) Conventional wing upper surface; (b) Initial morphing Wing Upper Surface; (c) Conventional wing lower surface; (d) Initial morphing Wing lower Surface.
Figure 19.
The pressure coefficient (a) Conventional wing upper surface; (b) Initial morphing Wing Upper Surface; (c) Conventional wing lower surface; (d) Initial morphing Wing lower Surface.

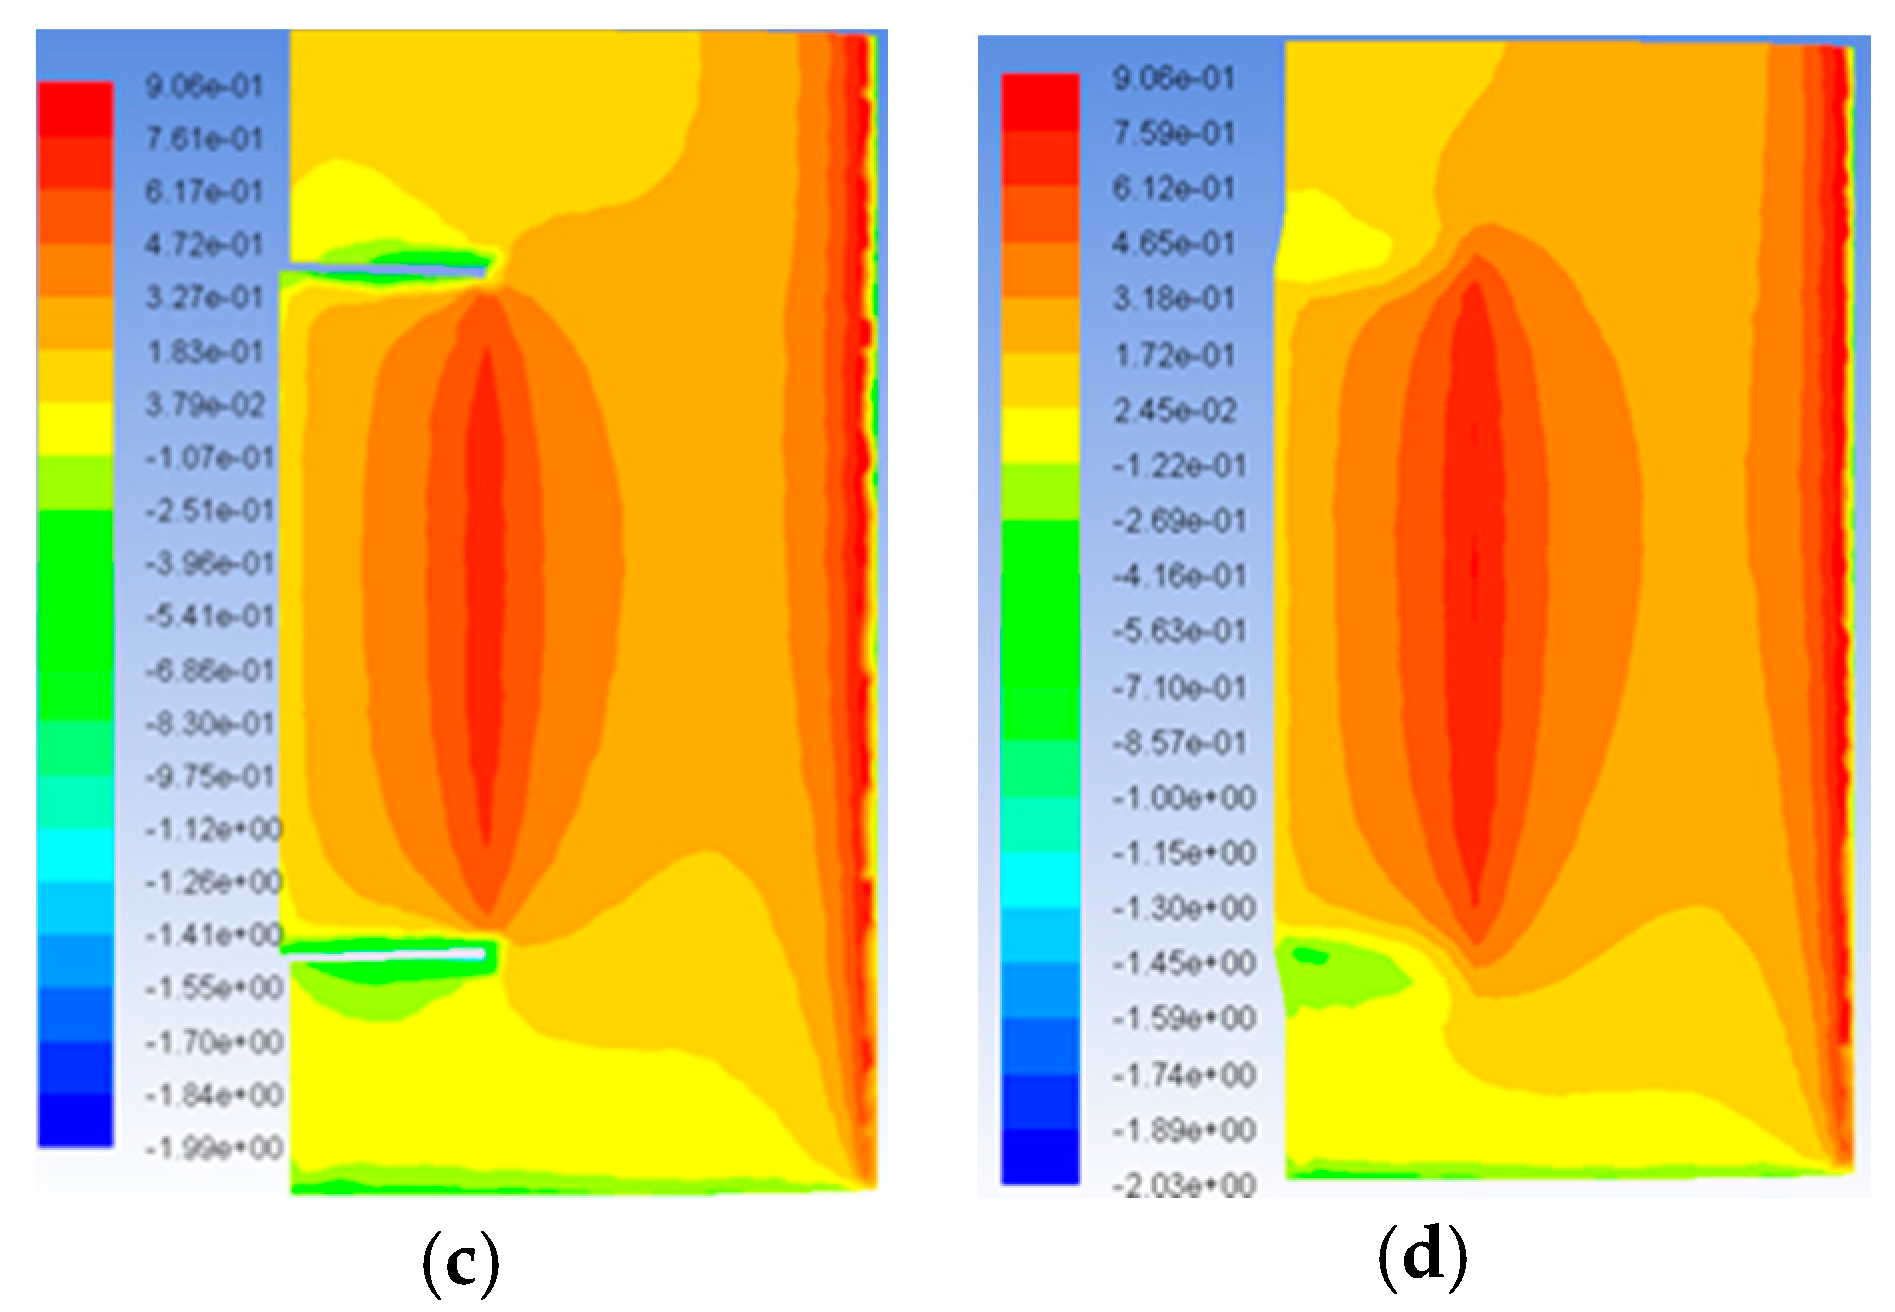
Figure 20.
A graph showing coefficient of lift for the conventional wing, initial morphing wing and optimized morphing wing.
Figure 20.
A graph showing coefficient of lift for the conventional wing, initial morphing wing and optimized morphing wing.

Figure 21.
A graph showing the wing efficiency using coefficient of drag over coefficient of lift for each of the wings.
Figure 21.
A graph showing the wing efficiency using coefficient of drag over coefficient of lift for each of the wings.

Figure 22.
A graph showing lift-to-drag ratios or glide ratios for all three wings.
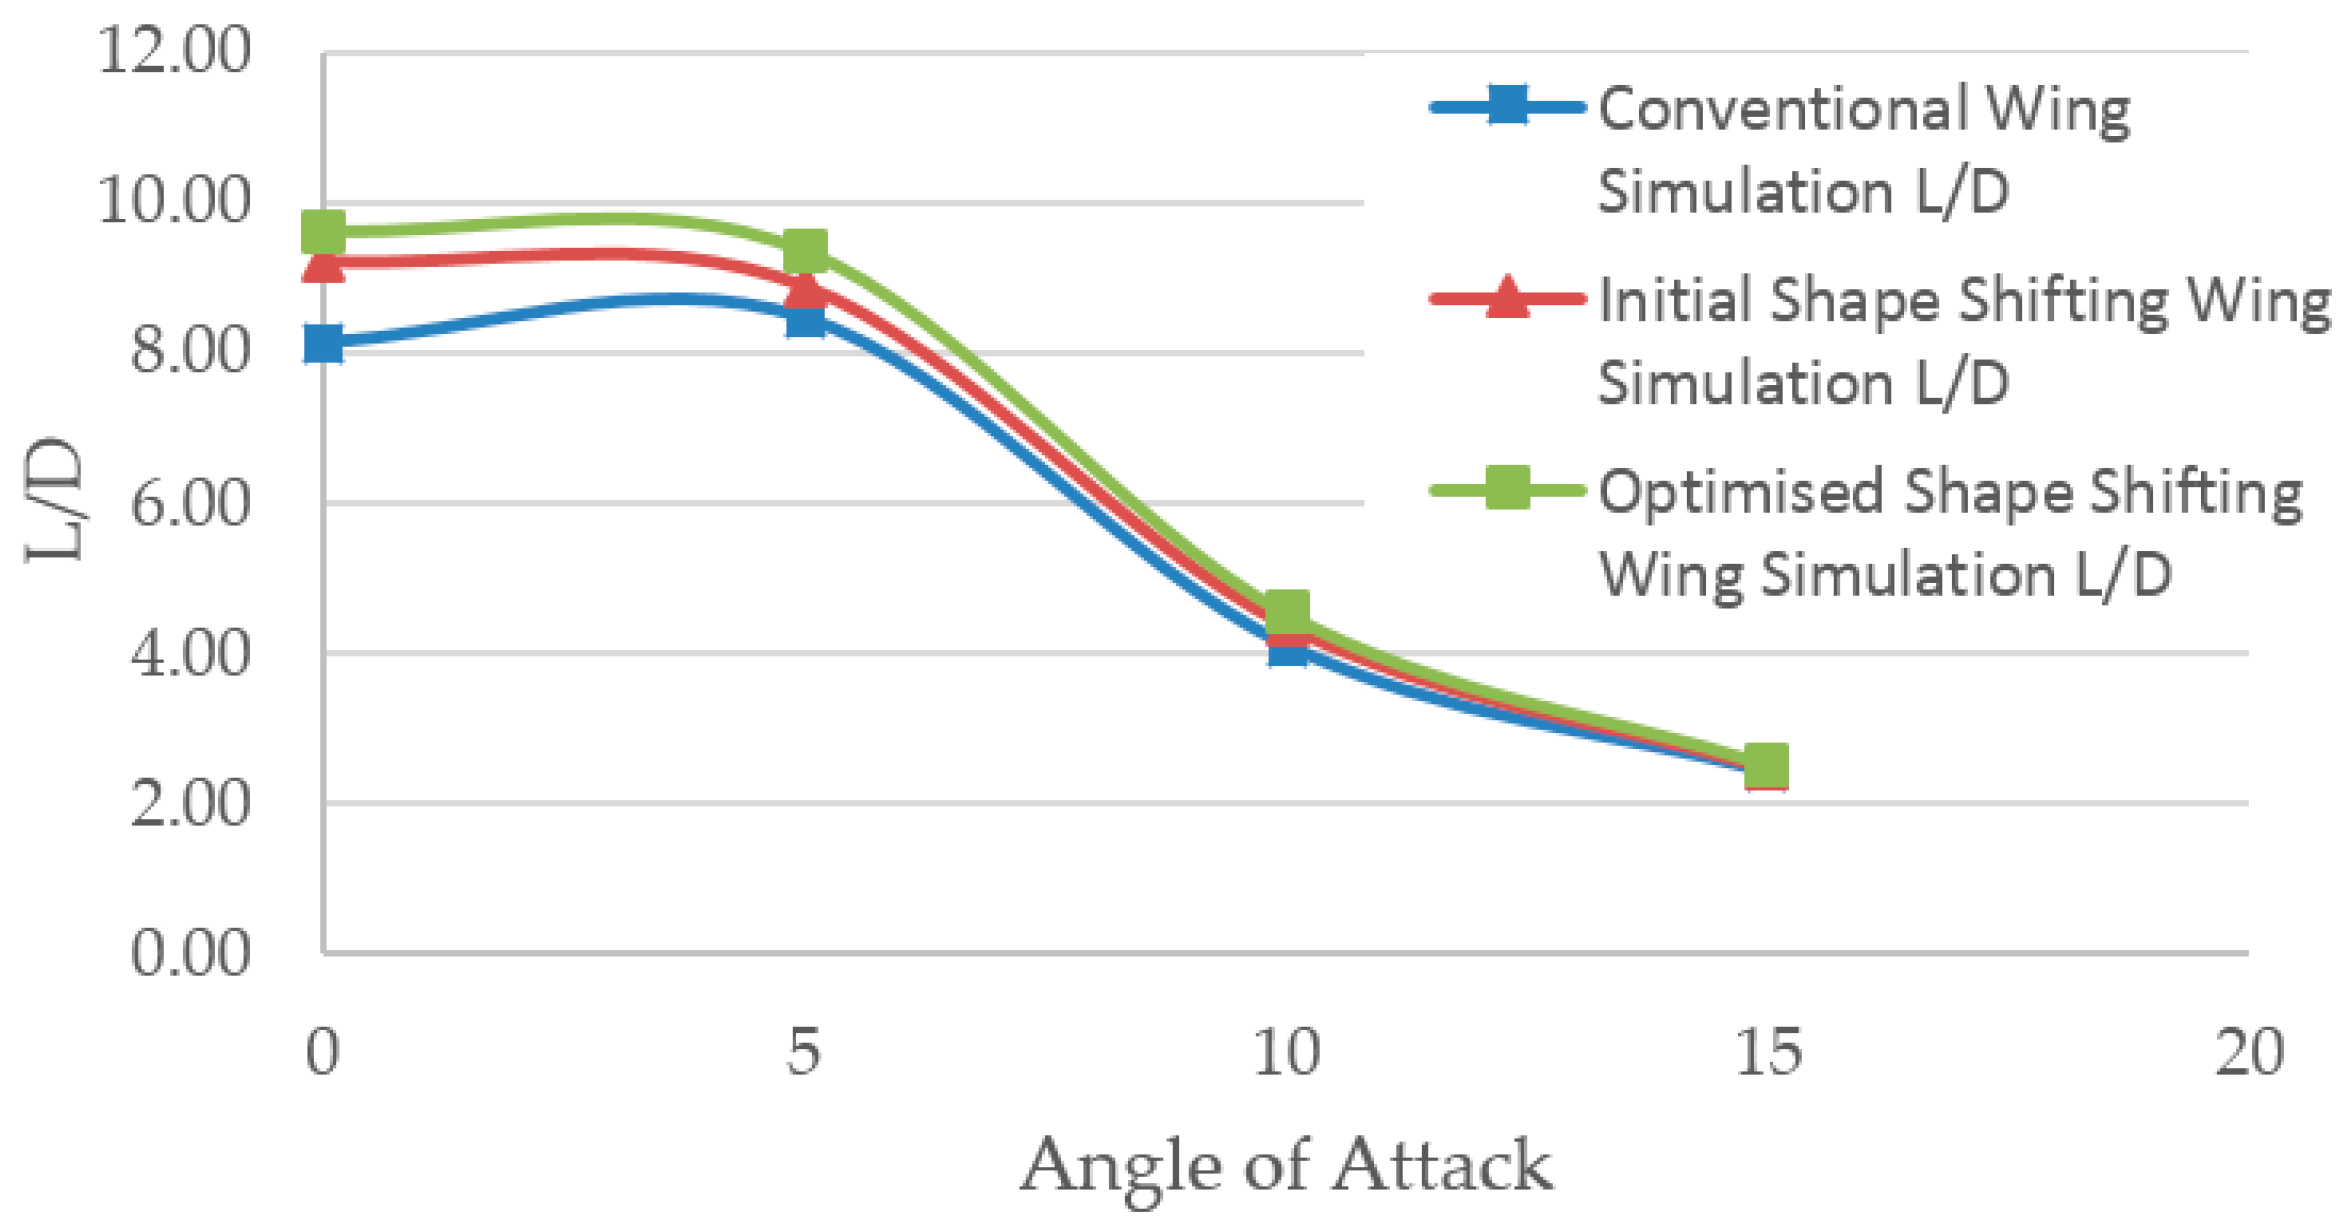
Figure 23.
The pressure coefficient distribution (a) along the upper surface of the conventional wing; (b) along the upper surface of the initial morphing wing; (c) along the upper surface of optimized morphing wing; (d) along the lower surface of the conventional wing; (e) along the lower surface of the initial morphing wing; (f) along the lower surface of optimized morphing wing.


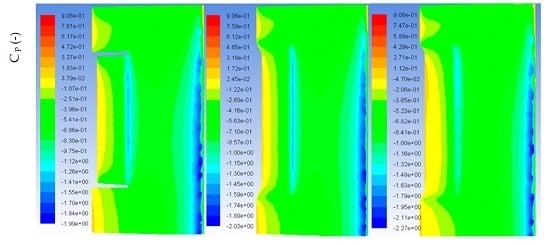
Figure 24.
Images showing pressure coefficient for the flow over (a) the conventional wing; (b) Initial morphing wing; (c) optimized morphing wing all at 5 degrees’ angle of attack.
Figure 24.
Images showing pressure coefficient for the flow over (a) the conventional wing; (b) Initial morphing wing; (c) optimized morphing wing all at 5 degrees’ angle of attack.

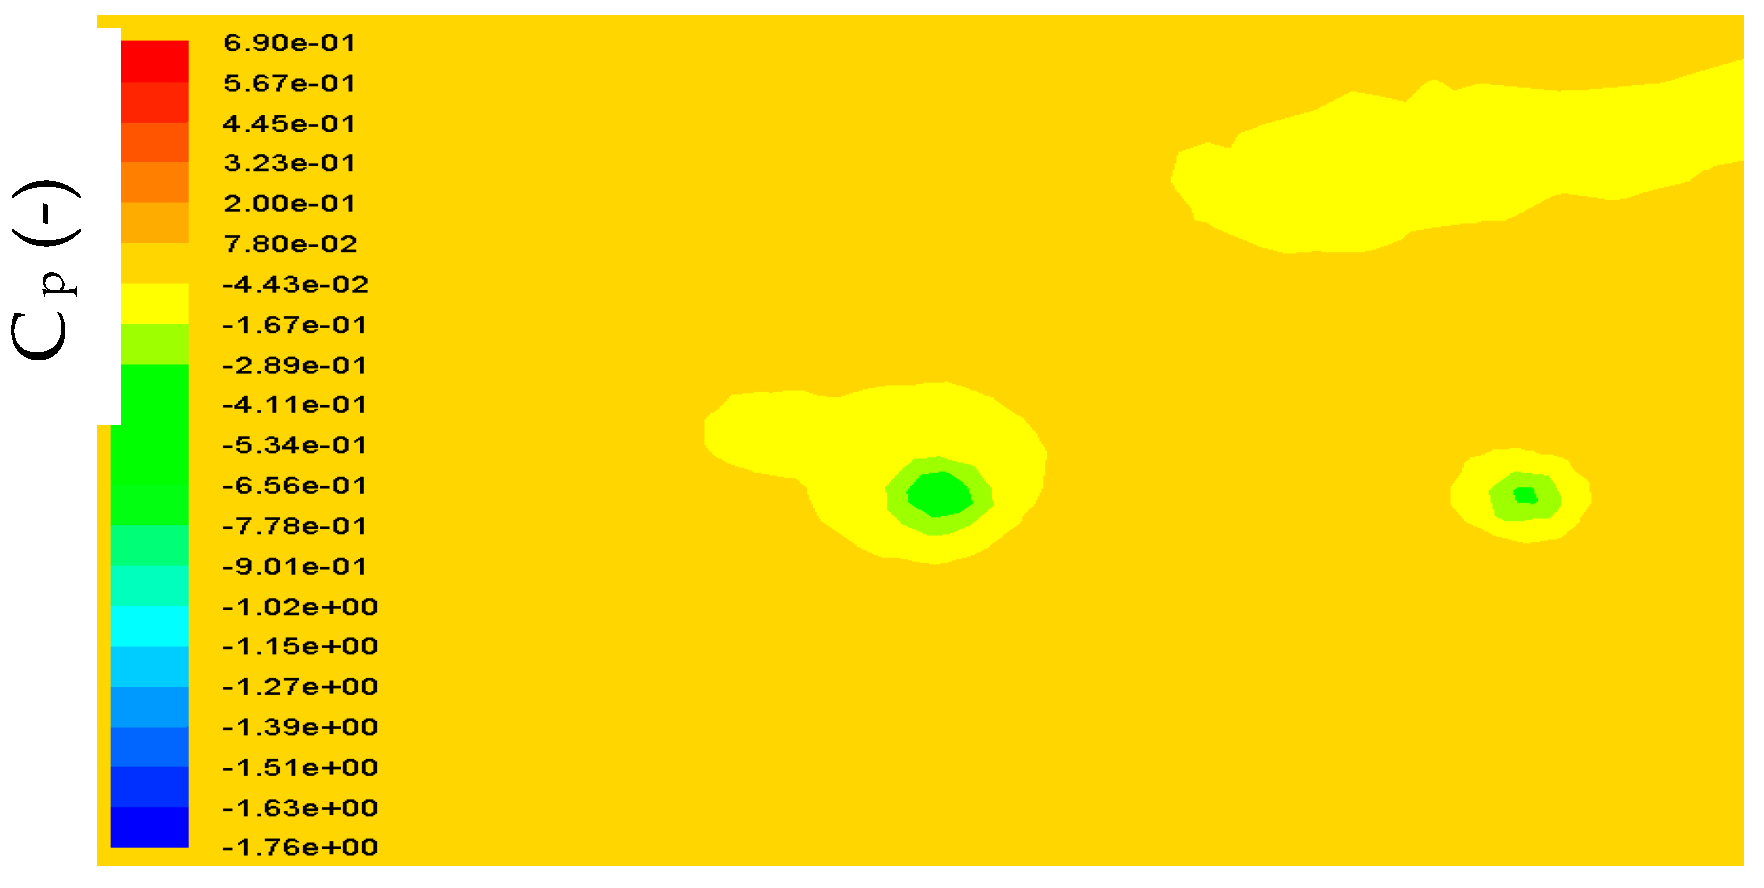
Figure 25.
Images showing pressure cut plots at the location where vortices are generated on each wings flap at 5 degrees’ angle of attack (a) the conventional wing; (b) Initial morphing wing; (c) optimized morphing wing.
Figure 25.
Images showing pressure cut plots at the location where vortices are generated on each wings flap at 5 degrees’ angle of attack (a) the conventional wing; (b) Initial morphing wing; (c) optimized morphing wing.


Figure 26.
A graph showing the pressure distribution along each wing at the location where vortices are generated on the flap at 5 degrees’ angle of attack.
Figure 26.
A graph showing the pressure distribution along each wing at the location where vortices are generated on the flap at 5 degrees’ angle of attack.

Figure 27.
A graph showing coefficients of lift for Ansys simulation and wind tunnel testing.

Figure 28.
A graph showing coefficient of drag for wind tunnel testing and Ansys Simulation.
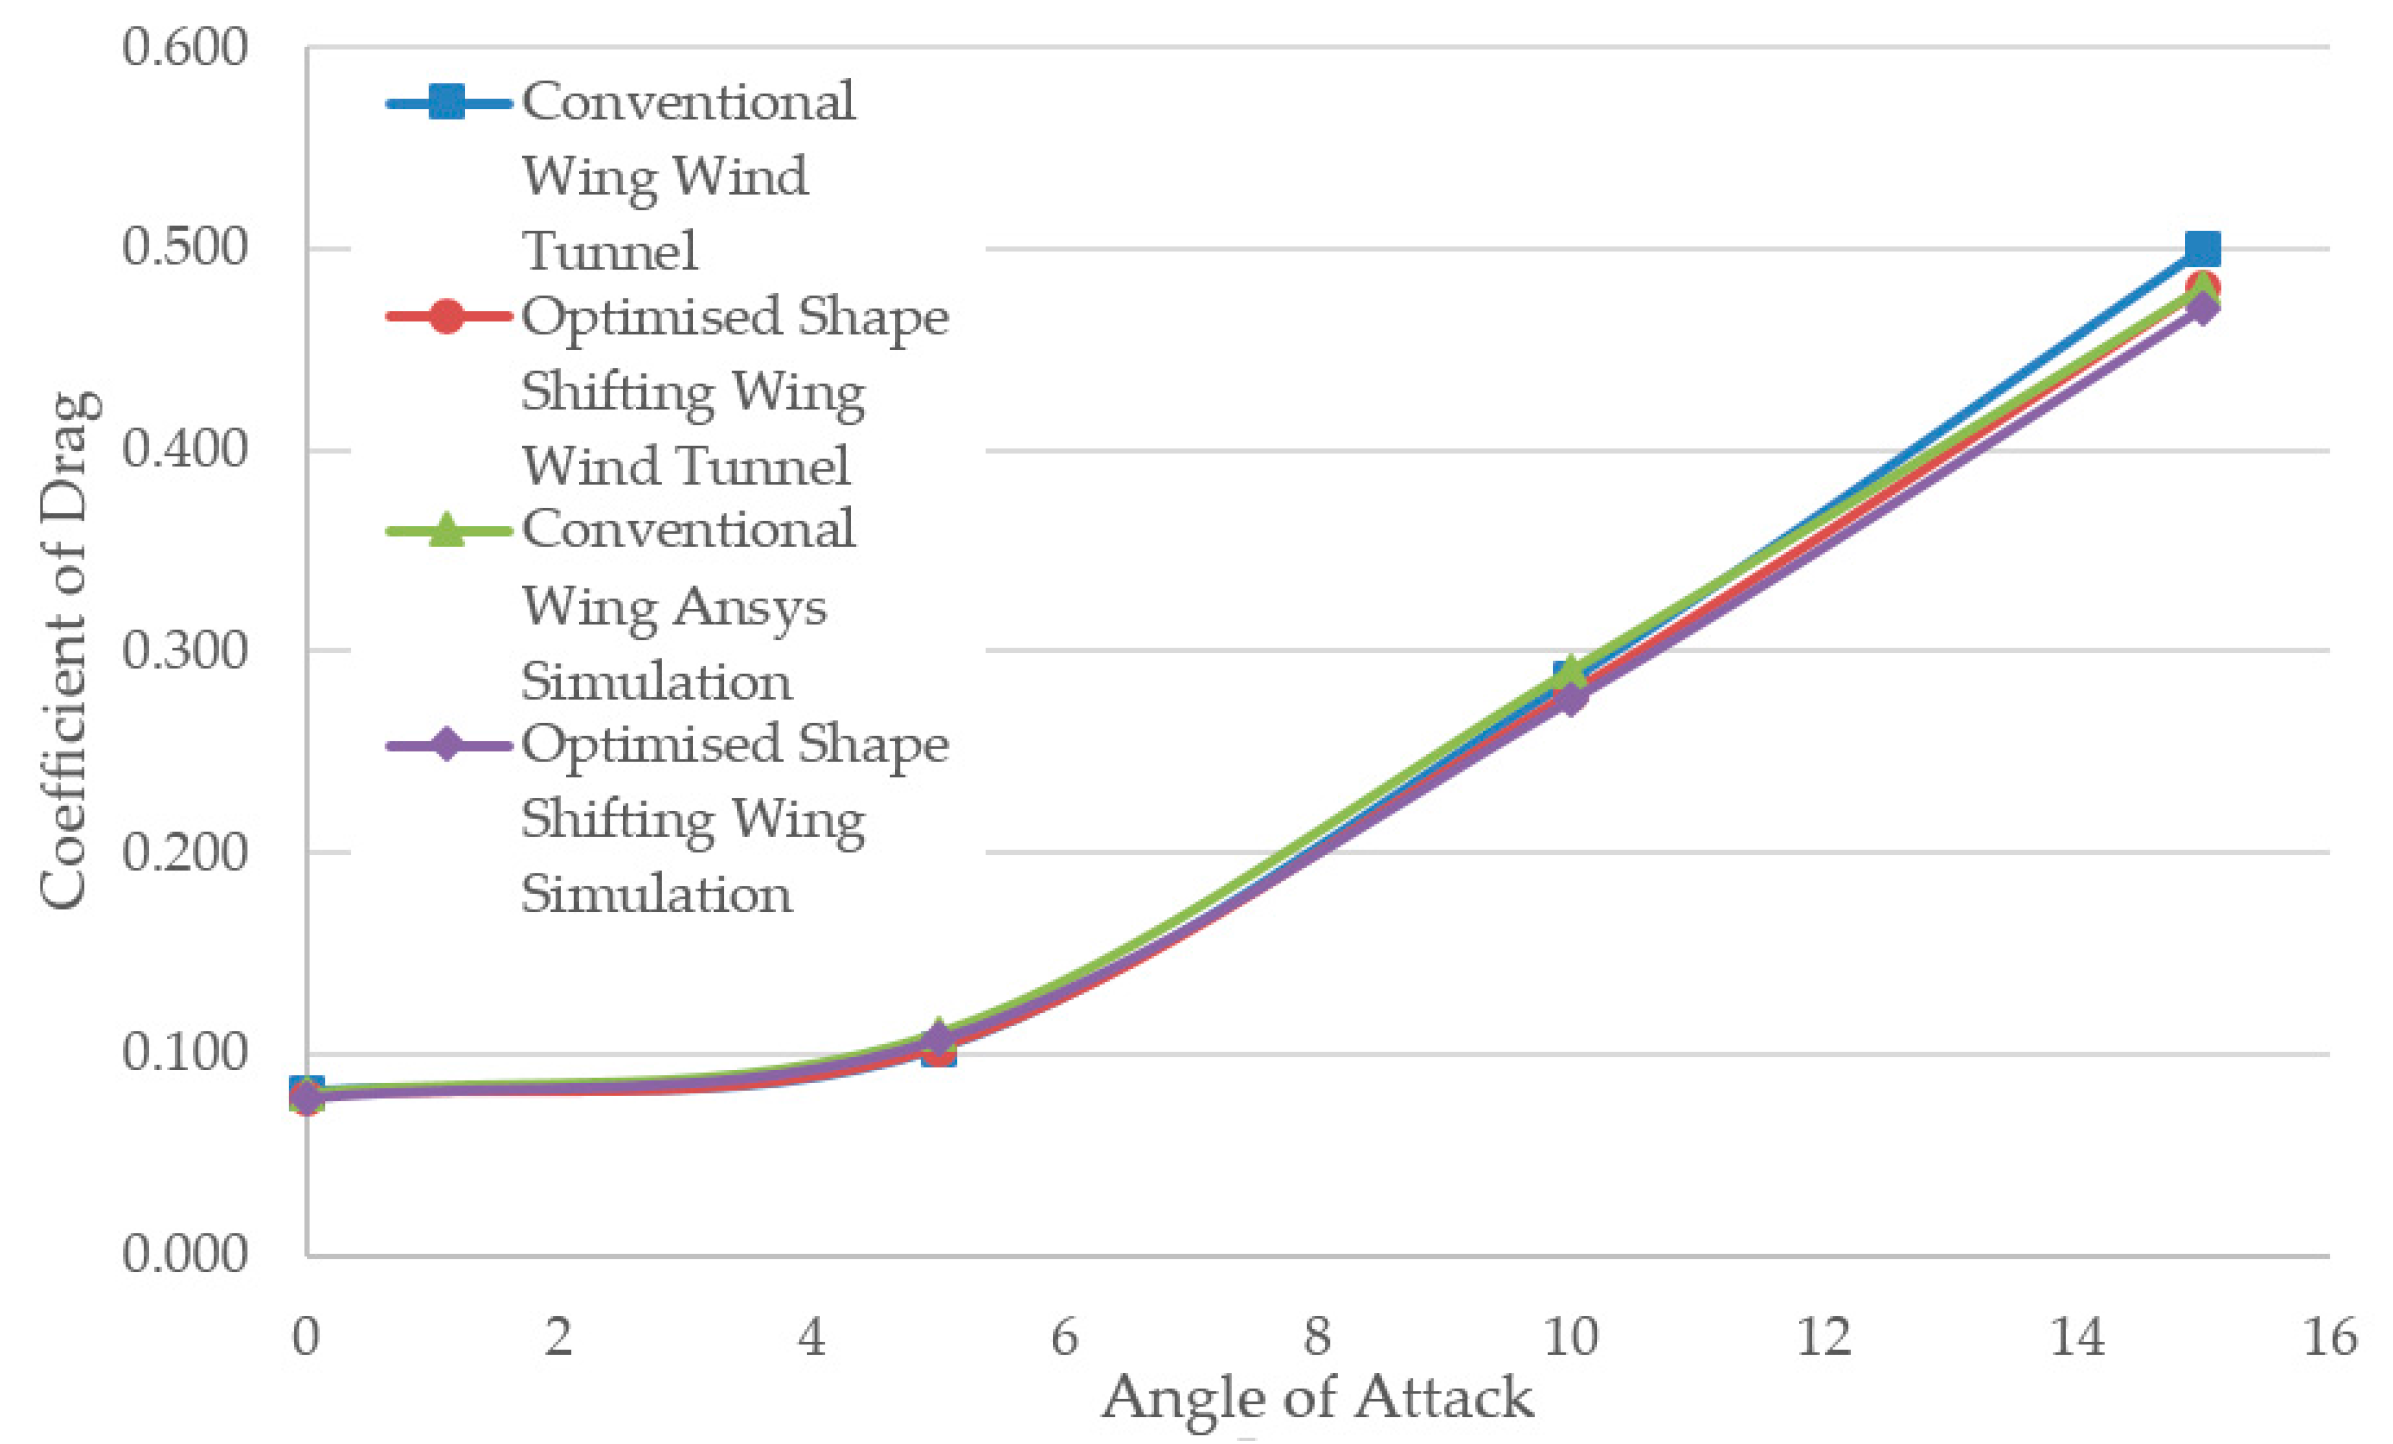
Figure 29.
A graph showing the difference in noise level between the conventional wing and optimised morphing wing.
Figure 29.
A graph showing the difference in noise level between the conventional wing and optimised morphing wing.

Figure 30.
A graph showing the standard deviation of noise level for the conventional wing.
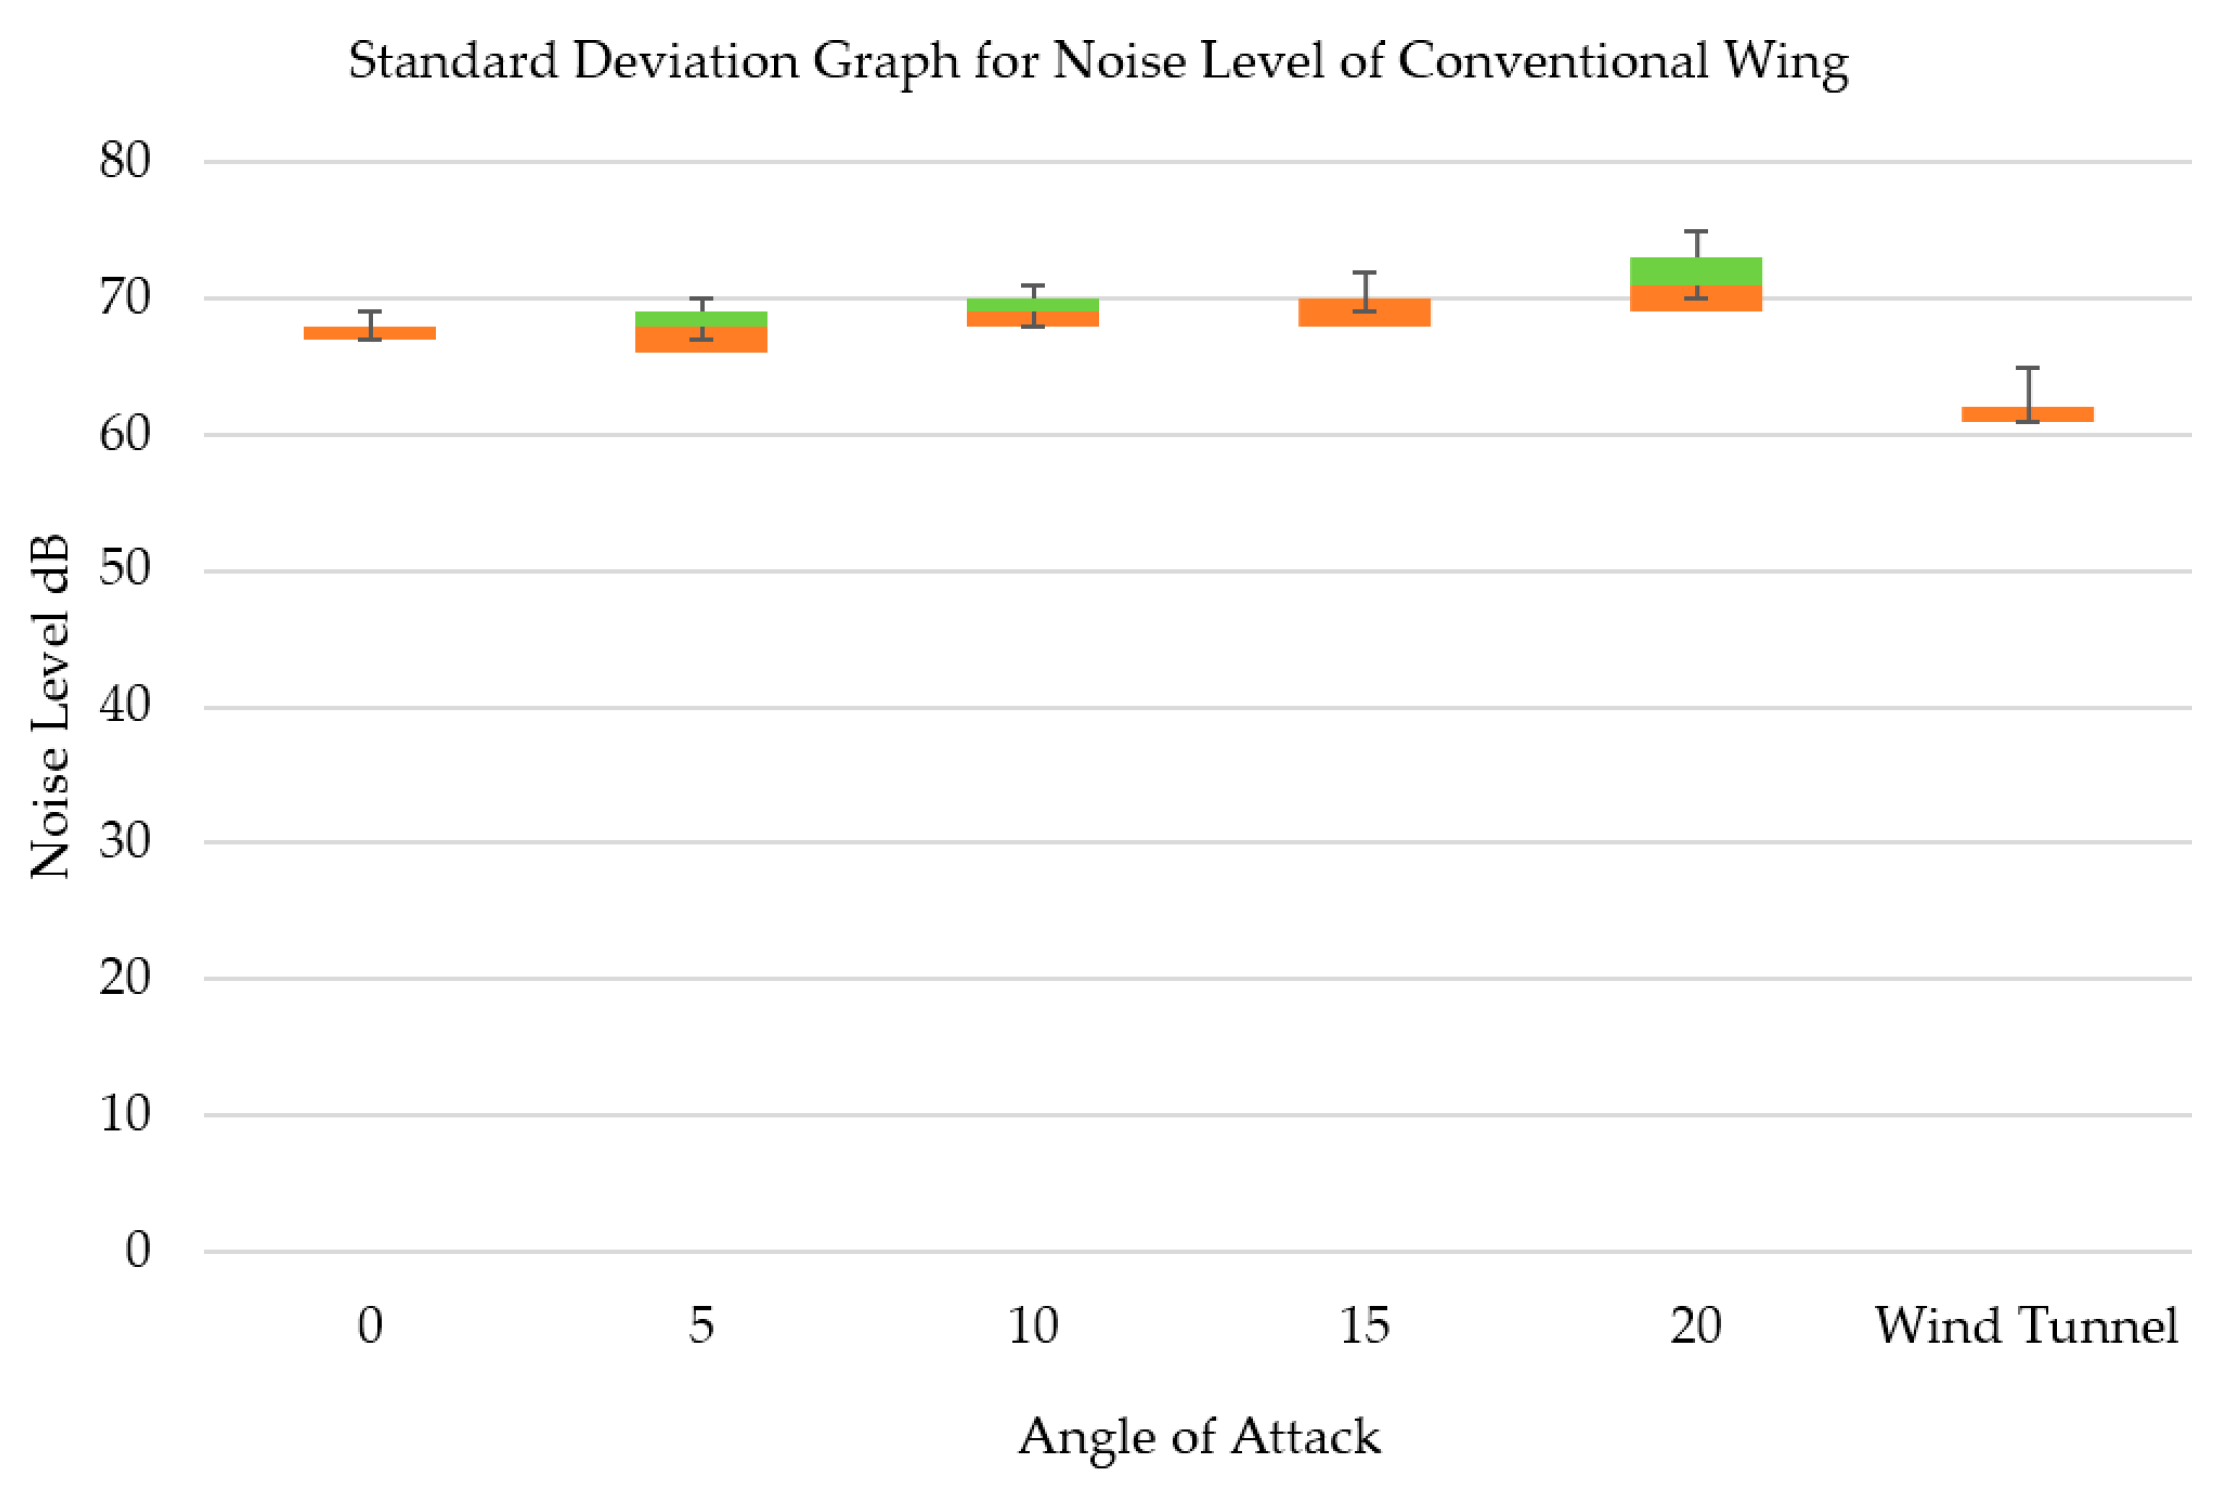
Figure 31.
A graph showing the standard deviation of noise level for the shape shifting wing.
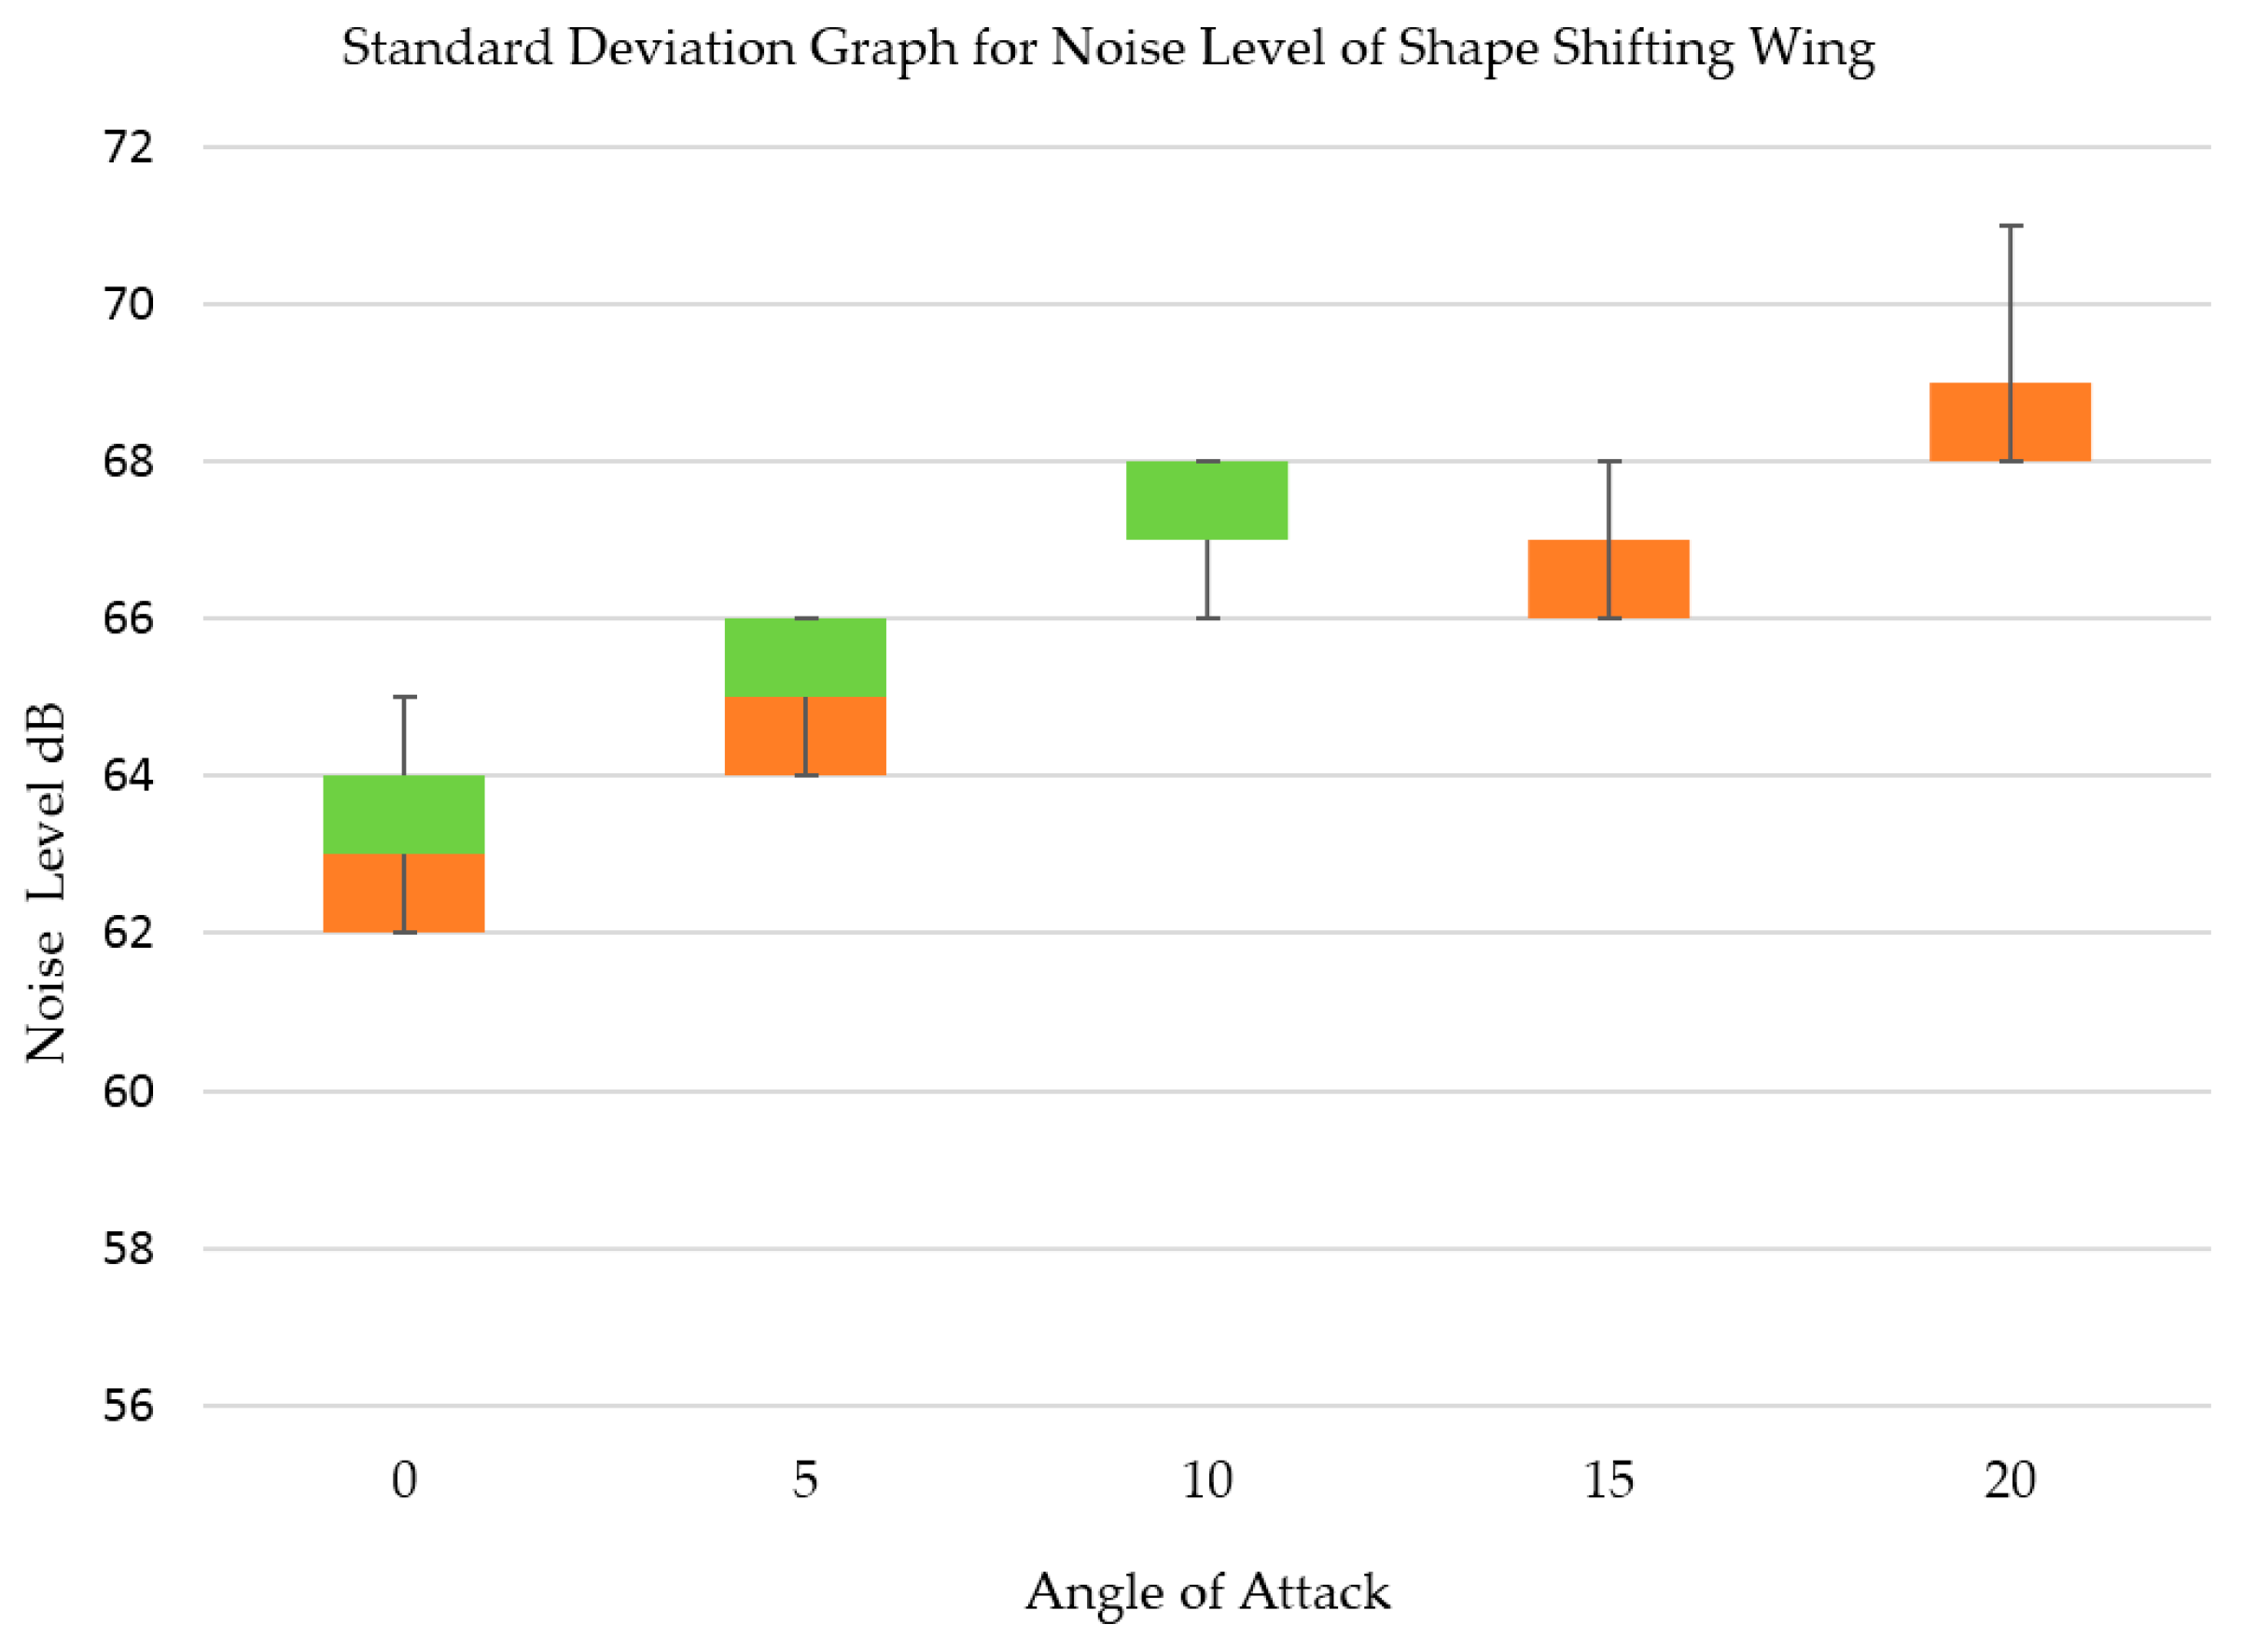
Figure 32.
Conventional wing noise error bars.
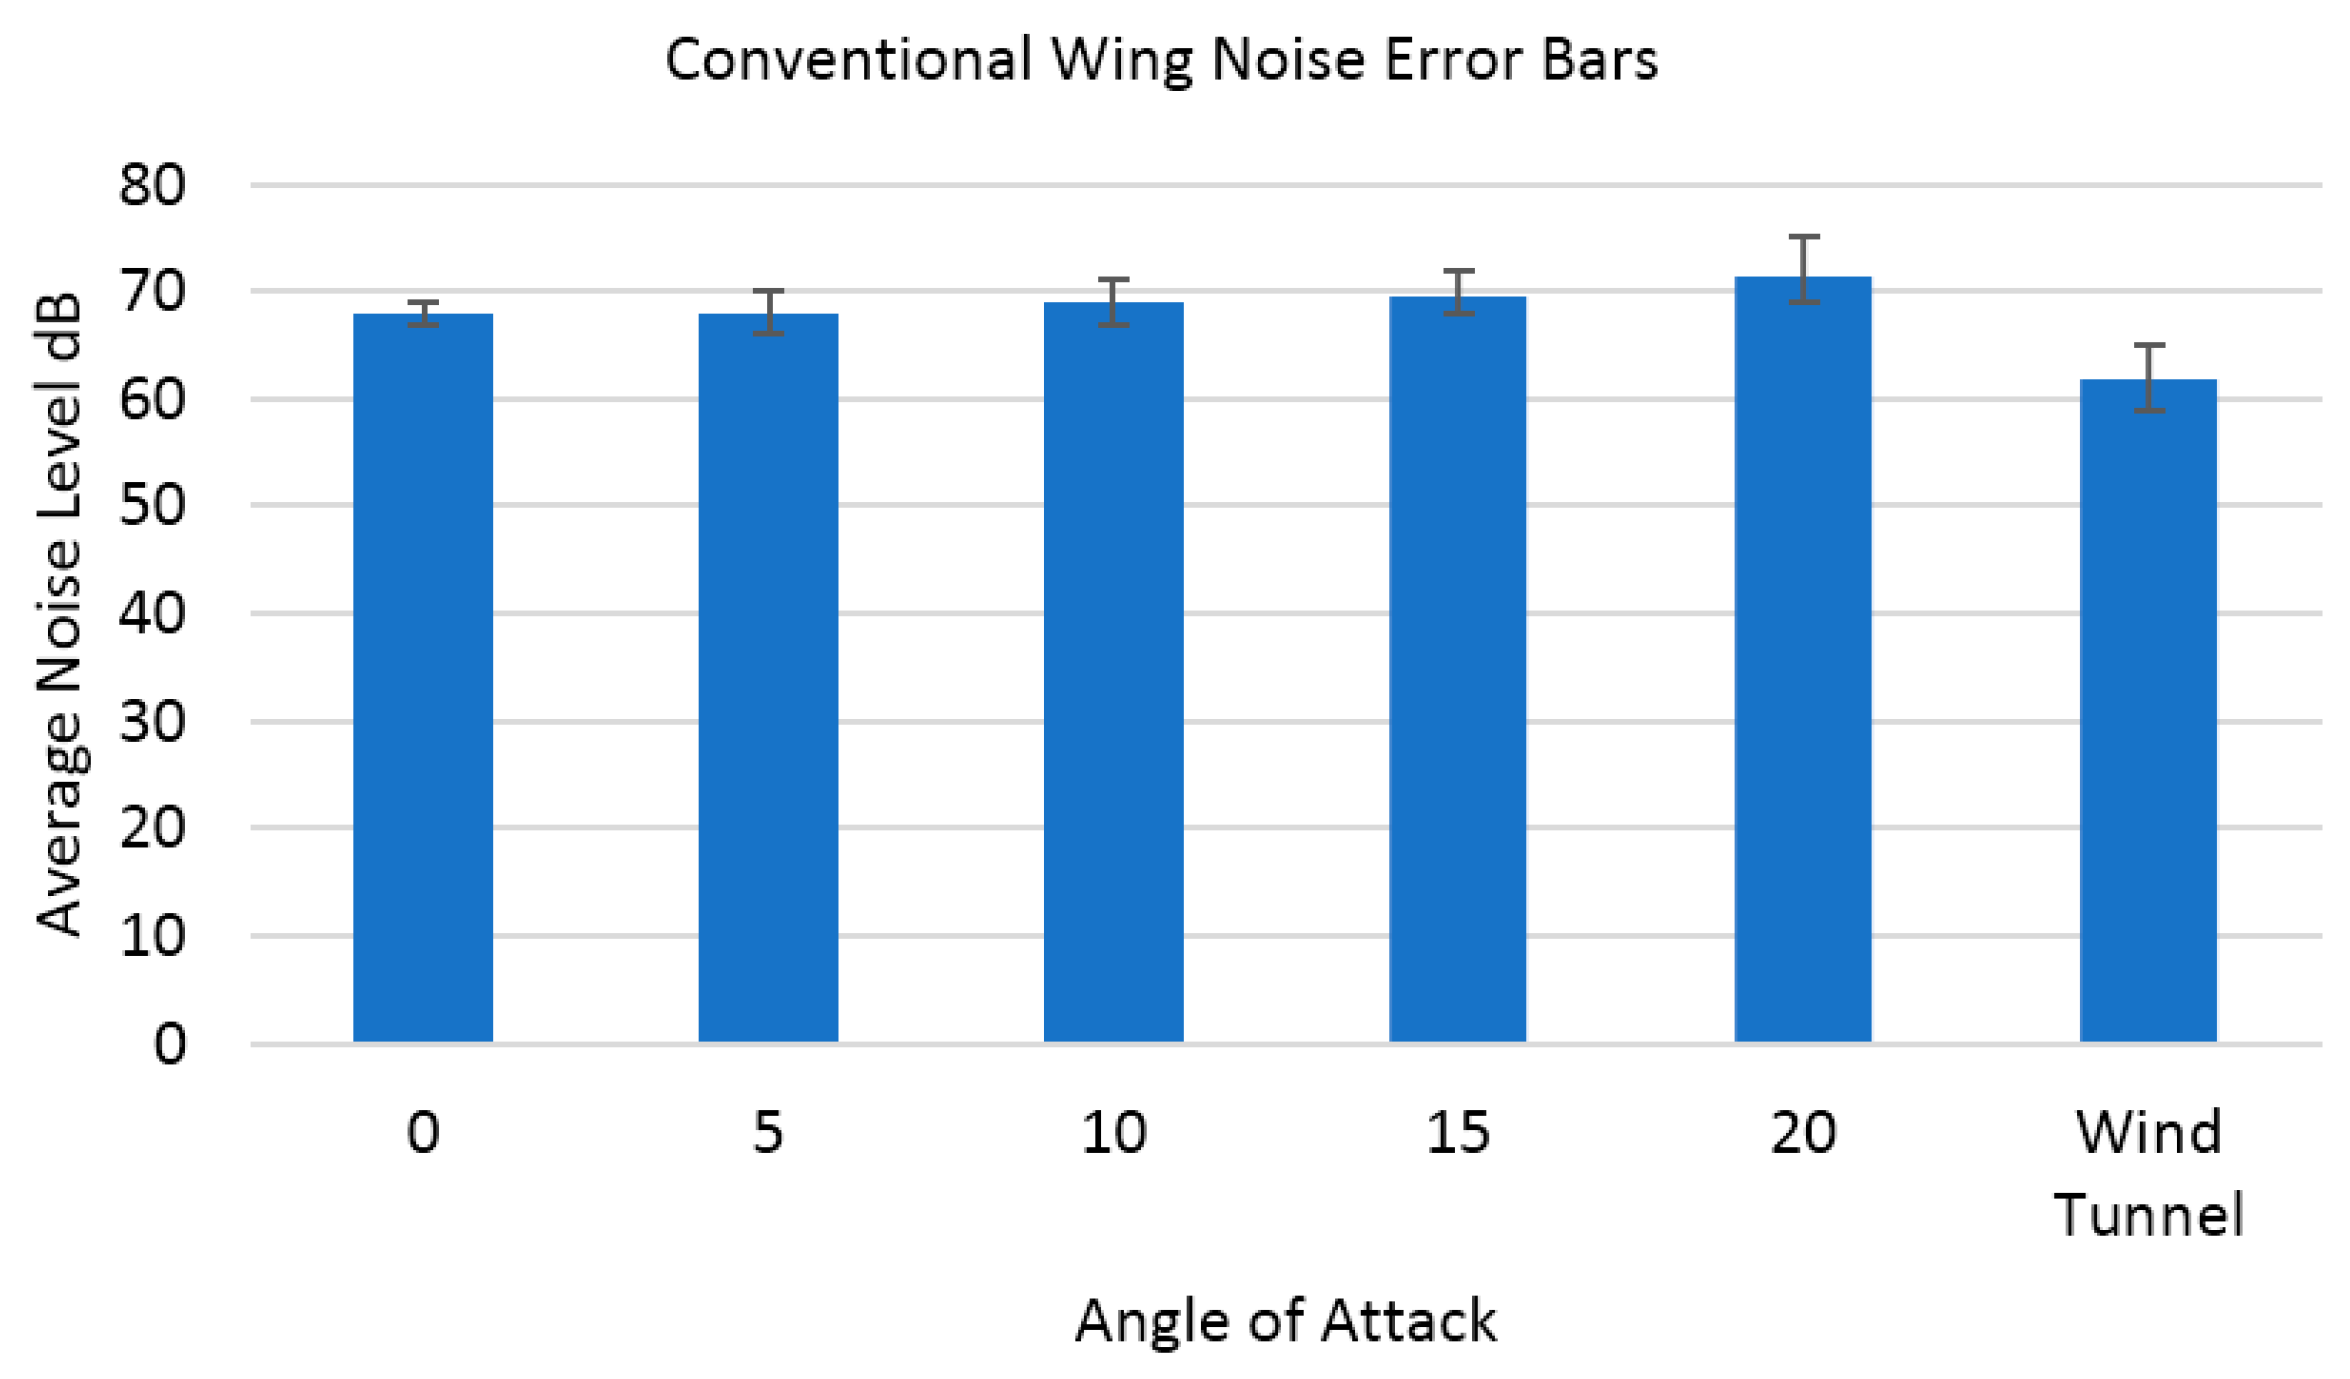
Figure 33.
Shape shifting wing noise error bars.

Table 1.
Concept design analysis.
| Concept Feature | Dielectric Smart Polymer | Elastomer Skin |
|---|---|---|
| Cost | 2 | 5 |
| Maintainability | 5 | 5 |
| Performance | 5 | 3 |
| Installation Ease | 2 | 5 |
| Ease of assembly | 2 | 3 |
| Weight | 5 | 4 |
| Environment Resistance | 5 | 3 |
| Safety | 3 | 3 |
| TOTAL | 29 | 31 |
Table 2.
Noise levels produced by the conventional wing and morphing wing at different angles of attack.
Table 2.
Noise levels produced by the conventional wing and morphing wing at different angles of attack.
| Angle of Attack (AOA) | Conventional Wing Noise Level | Shape Shifting Wing Noise Level | Wind Tunnel Noise Level (All AOA) |
|---|---|---|---|
| 0 | 68 dB | 63 dB | 62 dB |
| 5 | 68 dB | 65 dB | |
| 10 | 69 dB | 67 dB | |
| 15 | 70 dB | 67 dB | |
| 20 | 71 dB | 69 dB |
© 2017 by the authors. Licensee MDPI, Basel, Switzerland. This article is an open access article distributed under the terms and conditions of the Creative Commons Attribution (CC BY) license (http://creativecommons.org/licenses/by/4.0/).
Share and Cite
MDPI and ACS Style
Ninian, D.; Dakka, S.M. Design, Development and Testing of Shape Shifting Wing Model. Aerospace 2017, 4, 52. https://doi.org/10.3390/aerospace4040052
AMA Style
Ninian D, Dakka SM. Design, Development and Testing of Shape Shifting Wing Model. Aerospace. 2017; 4(4):52. https://doi.org/10.3390/aerospace4040052
Chicago/Turabian StyleNinian, Dean, and Sam M. Dakka. 2017. "Design, Development and Testing of Shape Shifting Wing Model" Aerospace 4, no. 4: 52. https://doi.org/10.3390/aerospace4040052
Note that from the first issue of 2016, this journal uses article numbers instead of page numbers. See further details here.