The Impact of Volute Aspect Ratio on the Performance of a Mixed Flow Turbine

1
Turbocharger Research Institute, University of Huddersfield, Huddersfield HD1 3DH, UK
2
BorgWarner Turbo Systems, Bradford BD4 6SE, UK
*
Author to whom correspondence should be addressed.
Aerospace 2017, 4(4), 56; https://doi.org/10.3390/aerospace4040056
Submission received: 27 October 2017
/
Revised: 16 November 2017
/
Accepted: 20 November 2017
/
Published: 23 November 2017
(This article belongs to the Special Issue Feature Papers in Aerospace)
Abstract
:Current trends in the automotive industry towards engine downsizing mean turbocharging now plays a vital role in engine performance. A turbocharger increases charge air density using a turbine to extract waste energy from the exhaust gas to drive a compressor. Most turbocharger applications employ a radial inflow turbine. However, mixed flow turbines can offer non-zero blade angles, reducing leading edge (LE) separation at low velocity ratios. The current paper investigates the performance of a mixed flow turbine with three different volute aspect ratio (AR) designs (AR = 0.5, 1 and 2). With constant A/r (ratio of volute area to centroid radius), the AR = 0.5 volute design produced a 4.3% increase in cycle averaged mass flow parameter (MFP) compared to the AR = 2 design. For the purpose of performance comparison, it was necessary to manipulate the volute A/r’s to ensure constant MFP for aerodynamic similarity. With the volute A/r’s manipulated to ensure constant MFP for aerodynamic similarity, the maximum variation of cycle averaged normalized efficiency measured between the designs was 1.47%. Purely in the rotor region, the variation in normalized cycle averaged efficiency was 1%. The smallest tested volute aspect ratio showed a significant increase in volute loss while the ARs of 1 and 2 showed similar levels of loss. The smallest AR volute showed significant secondary flow development in the volute. The resulting variation in LE incidence was found to vary as a result.
1. Introduction
Due to environmental concerns, engine downsizing has become increasingly important in the automotive industry to reduce engine emissions. To enable the downsized engines to produce the required power output turbochargers are commonly implemented.
Turbochargers use a turbine to extract, otherwise wasted, energy from the exhaust gas to drive a compressor and hence increase cylinder inlet pressure and density. Due to the nature of the reciprocating engine, turbocharger turbines operate in a highly pulsating environment and are required to operate efficiently over the resulting wide range of conditions. Commonly, radial turbines are used. However, mixed flow turbines are also a desirable option due to their reduced inertia and ability to achieve non-zero blade angles without violating radial stacking of the blade fibers which would result in excessive blade stresses [1]. The definition of a mixed flow turbine is given in Figure 1 and the resulting blade angle is defined in Equation (1).
where is the blade LE angle (see Figure 2), is the LE camber angle and is the flow cone angle. It should be noted that the definition of camber angle is positive in the direction of wheel rotation. In Figure 1 the wheel contains negative camber, giving rise to a negative blade angle, effectively a swept back configuration.
To ensure that blades are not over stressed, they must always be stacked radially. For a radial flow wheel, this forces the blade angle to be zero. For a mixed flow wheel, the axial component of flow allows the flow angle to be manipulated by adding camber whilst maintaining radial stacking. This can alleviate excessive leading edge (LE) incidence angles that can arise during operation.
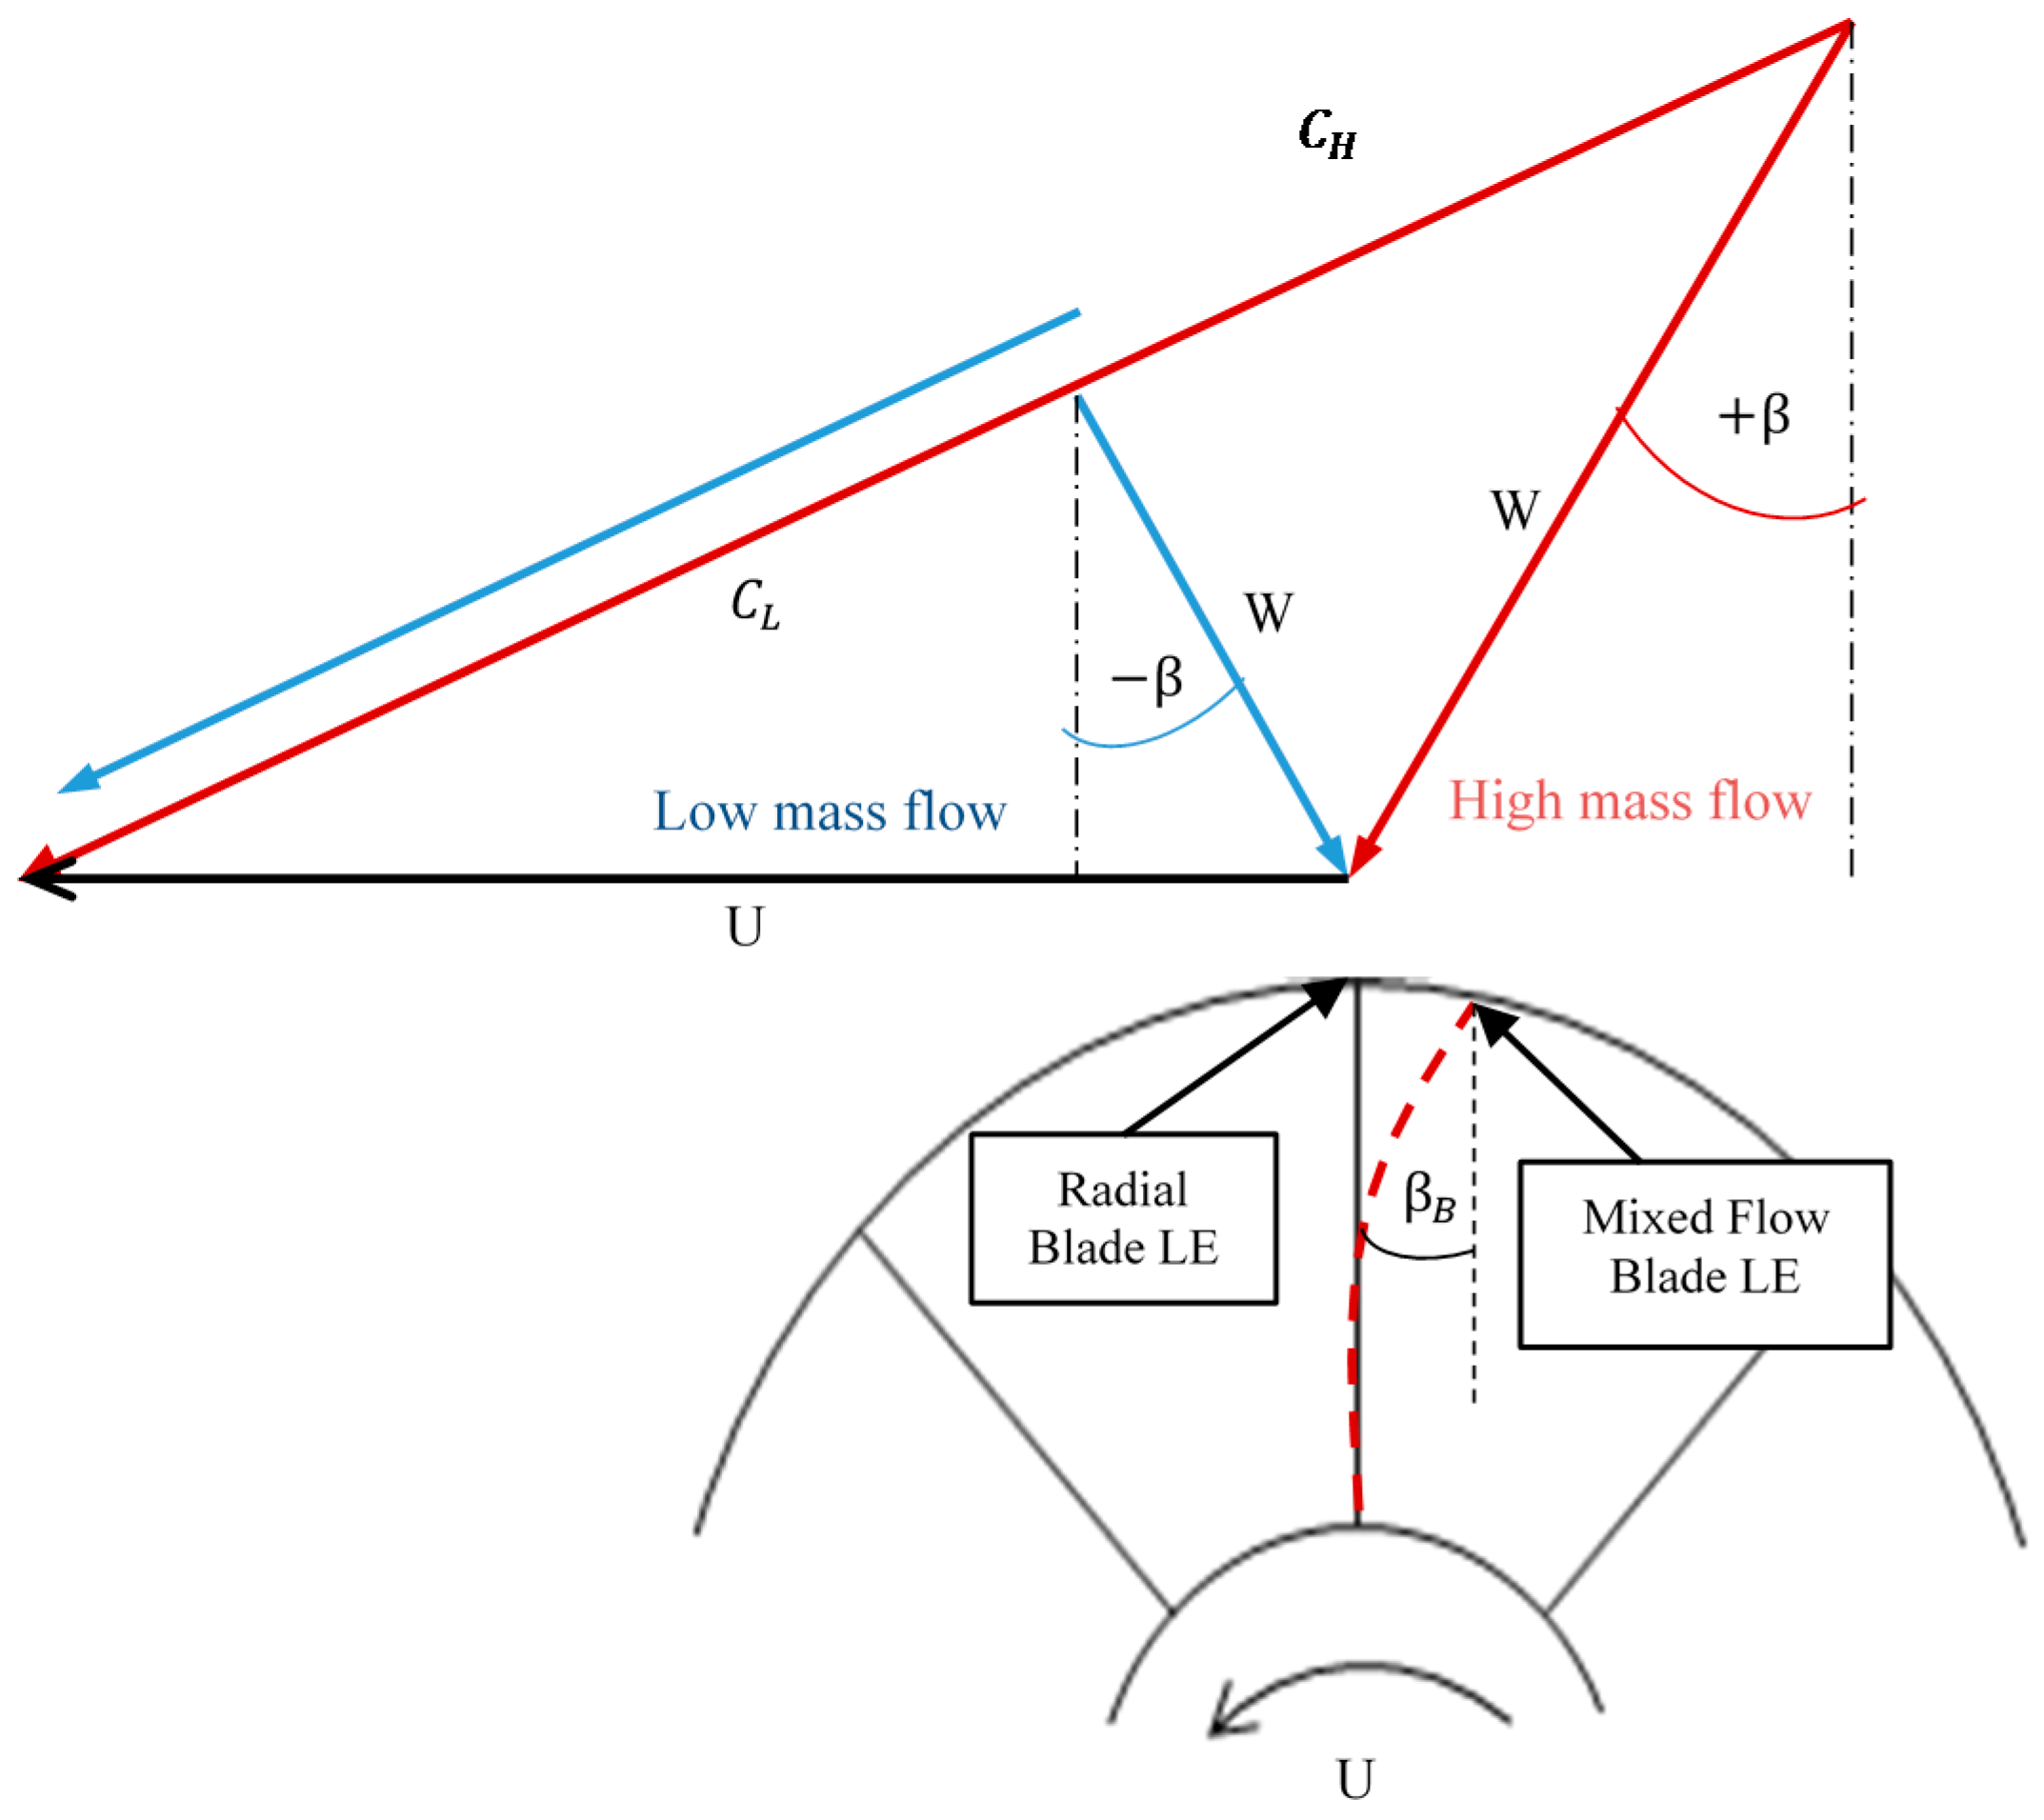
Figure 2 shows the impact of the highly pulsating flows on inlet flow angle,, of the blade. Both radial and mixed flow turbine blades are shown to highlight the impact of introducing a non-zero blade angle. and represent the absolute velocity of gas leaving the volute at high and low flow rates respectively. is the LE blade velocity. W is then the relative flow component and β the resulting flow angle.
The maximum energy in the exhaust pulse is available at the peak pressure ratio running point; this corresponds to the minimum velocity ratios ) and highly positive inlet relative flow angles ). The velocity ratio is defined as the ratio of blade LE velocity to the velocity equivalent of an isentropic enthalpy drop over the turbine. The introduction of a non-zero blade angle can reduce incidence at this high energy running point as shown in Figure 2. LE incidence is defined in Equation (2).
The unsteady environment created due to the inlet pulsations introduces a significant challenge for designers to ensure the turbine can operate effectively over a wide range of operation. The operation of mixed flow turbines under such flows has been assessed by numerous authors [2,3,4]. Understanding the performance implication of such flows is essential to improve future designs. As the rotor is fed by the volute which is tasked with the job of directing and accelerating the flow in to the rotor, the volute design can significantly impact stage performance.
Abidat et al. [5] studied the impact of blade incidence on the performance of a mixed flow turbine. The authors design two rotors, one with constant blade angle the other with constant incidence. The constant incidence LE was produced assuming constant meridional inlet flow and that the circumferential velocity was given by the free vortex equation. It was observed that the peak efficiency achieved was greatest for the constant blade angle design. However, the authors concluded that the simple assumptions made about the upstream flow were questionable based on the analysis. Furthermore, the axial length of the two investigated rotors was not constant and therefore the impact of flow diffusion on performance could have been a contributing factor to the performance differences measured.
The variation in flows at the LE of a mixed flow turbine was investigated by Karamanis et al. [3] using laser Doppler anemometry (LDA). The authors obtained distributions of the velocity components over the rotor LE span at two steady state running points. The steady state velocity distributions showed complex flow patterns at the LE. However, a lack of knowledge of the volute flow physics enabled only limited conclusions to be drawn with respect to the causes of such distributions. Furthermore, under pulsating flow the velocity measurements were limited to only the LE mid span and therefore the flow distribution over the span was not investigated. Rajoo and Martinez-Botas [1] concluded that the poorly guided flow into the rotor shown in [3] and that shown in the computational work by Palfreyman and Martinez-Botas [6], demonstrates that nozzleless volutes are not adequate in directing rotor inlet flow. However, due to the added expense of nozzle guide vanes and the potential limitation to the range of operation associated with guide vanes [7], vaneless volutes are still widely used.
The variation in LE flows is of particular interest in mixed flow applications, as not only does the variation effect the relative flow angle but it can also effect the extent of the mixed flow effect achieved. Furthermore, the extra freedom to adapt the rotor LE in both the average and spanwise sense could potentially result in improved incidence distributions through both volute and rotor optimization.
The impact of rotor inlet flow conditions were investigated by Morrison et al. [8] for a mixed flow rotor. The authors analyzed rotor flows and LE incidence angles created over a range of inlet conditions. The blade geometry in this study remained constant and the performance was investigated as inflow conditions were manipulated. The authors showed that manipulation of the spanwise variation at the blade LE can lead to performance improvements. However, no volute was implemented and no discussion on practical flow guidance to achieve spanwise flow variation was included.
The effect of volute cross sectional shape was studied by Yang et al. [9]. Two asymmetrical housings of different aspect ratios were studied. The authors observed that the change in housing design resulted in significant variations in volute secondary flow structures and stage performance. A breakdown of the efficiencies of the turbine components showed that the rotor was the leading contributor to the performance variations observed. This was attributed to the change in rotor inlet conditions in the two designs. The authors concluded that a better understanding of the impact of volute flows on rotor performance is required.
A similar study was conducted by [10]. In this case asymmetrical housing designs were once again used with four variants. However, whereas the study in [11] was conducted on a radial turbine, a mixed flow rotor design was investigated by [10]. The authors observed clear vortex generation in each housing design and concluded that the volute can be occupied by one or more vortices and that the volute volume is critical in decreasing the number of vortices. While both of these studies show complex secondary flow structures no explanation for their formation was provided. Furthermore, the asymmetry of the volute introduced added complexity to the flow physics.
Cerdoun and Ghenaiet [12] completed an investigation into volute secondary flows in a twin entry volute. The authors observed secondary flows that were attributed to a Dean-type effect within the volute. The Dean number through the pulse was calculated and the vortex development visualized. The authors found that the secondary flows result in variation in LE incidence at around 180° from the tongue.
The development of volute secondary flows in a circular cross sectioned volute was investigated by Lee et al. [13] under both steady state and pulsating flow conditions for a radial turbine. The authors found Dean-like vortex development in the volute and a significant variation in volute outflow conditions as a result. However, this study was limited to only one pulse frequency and only the volute absolute flow angles were investigated around the volute circumference.
The current work aims to build on the analysis of secondary flows within the volute by comparing three volute aspect ratio symmetrical designs. The secondary flows within the volute are studied and explained in terms of the Dean effect and their development through the volute investigated. The impact of volute design on rotor inlet variation is investigated in detail to gain better insight into the impact of volute design on rotor performance.
2. Turbine Design
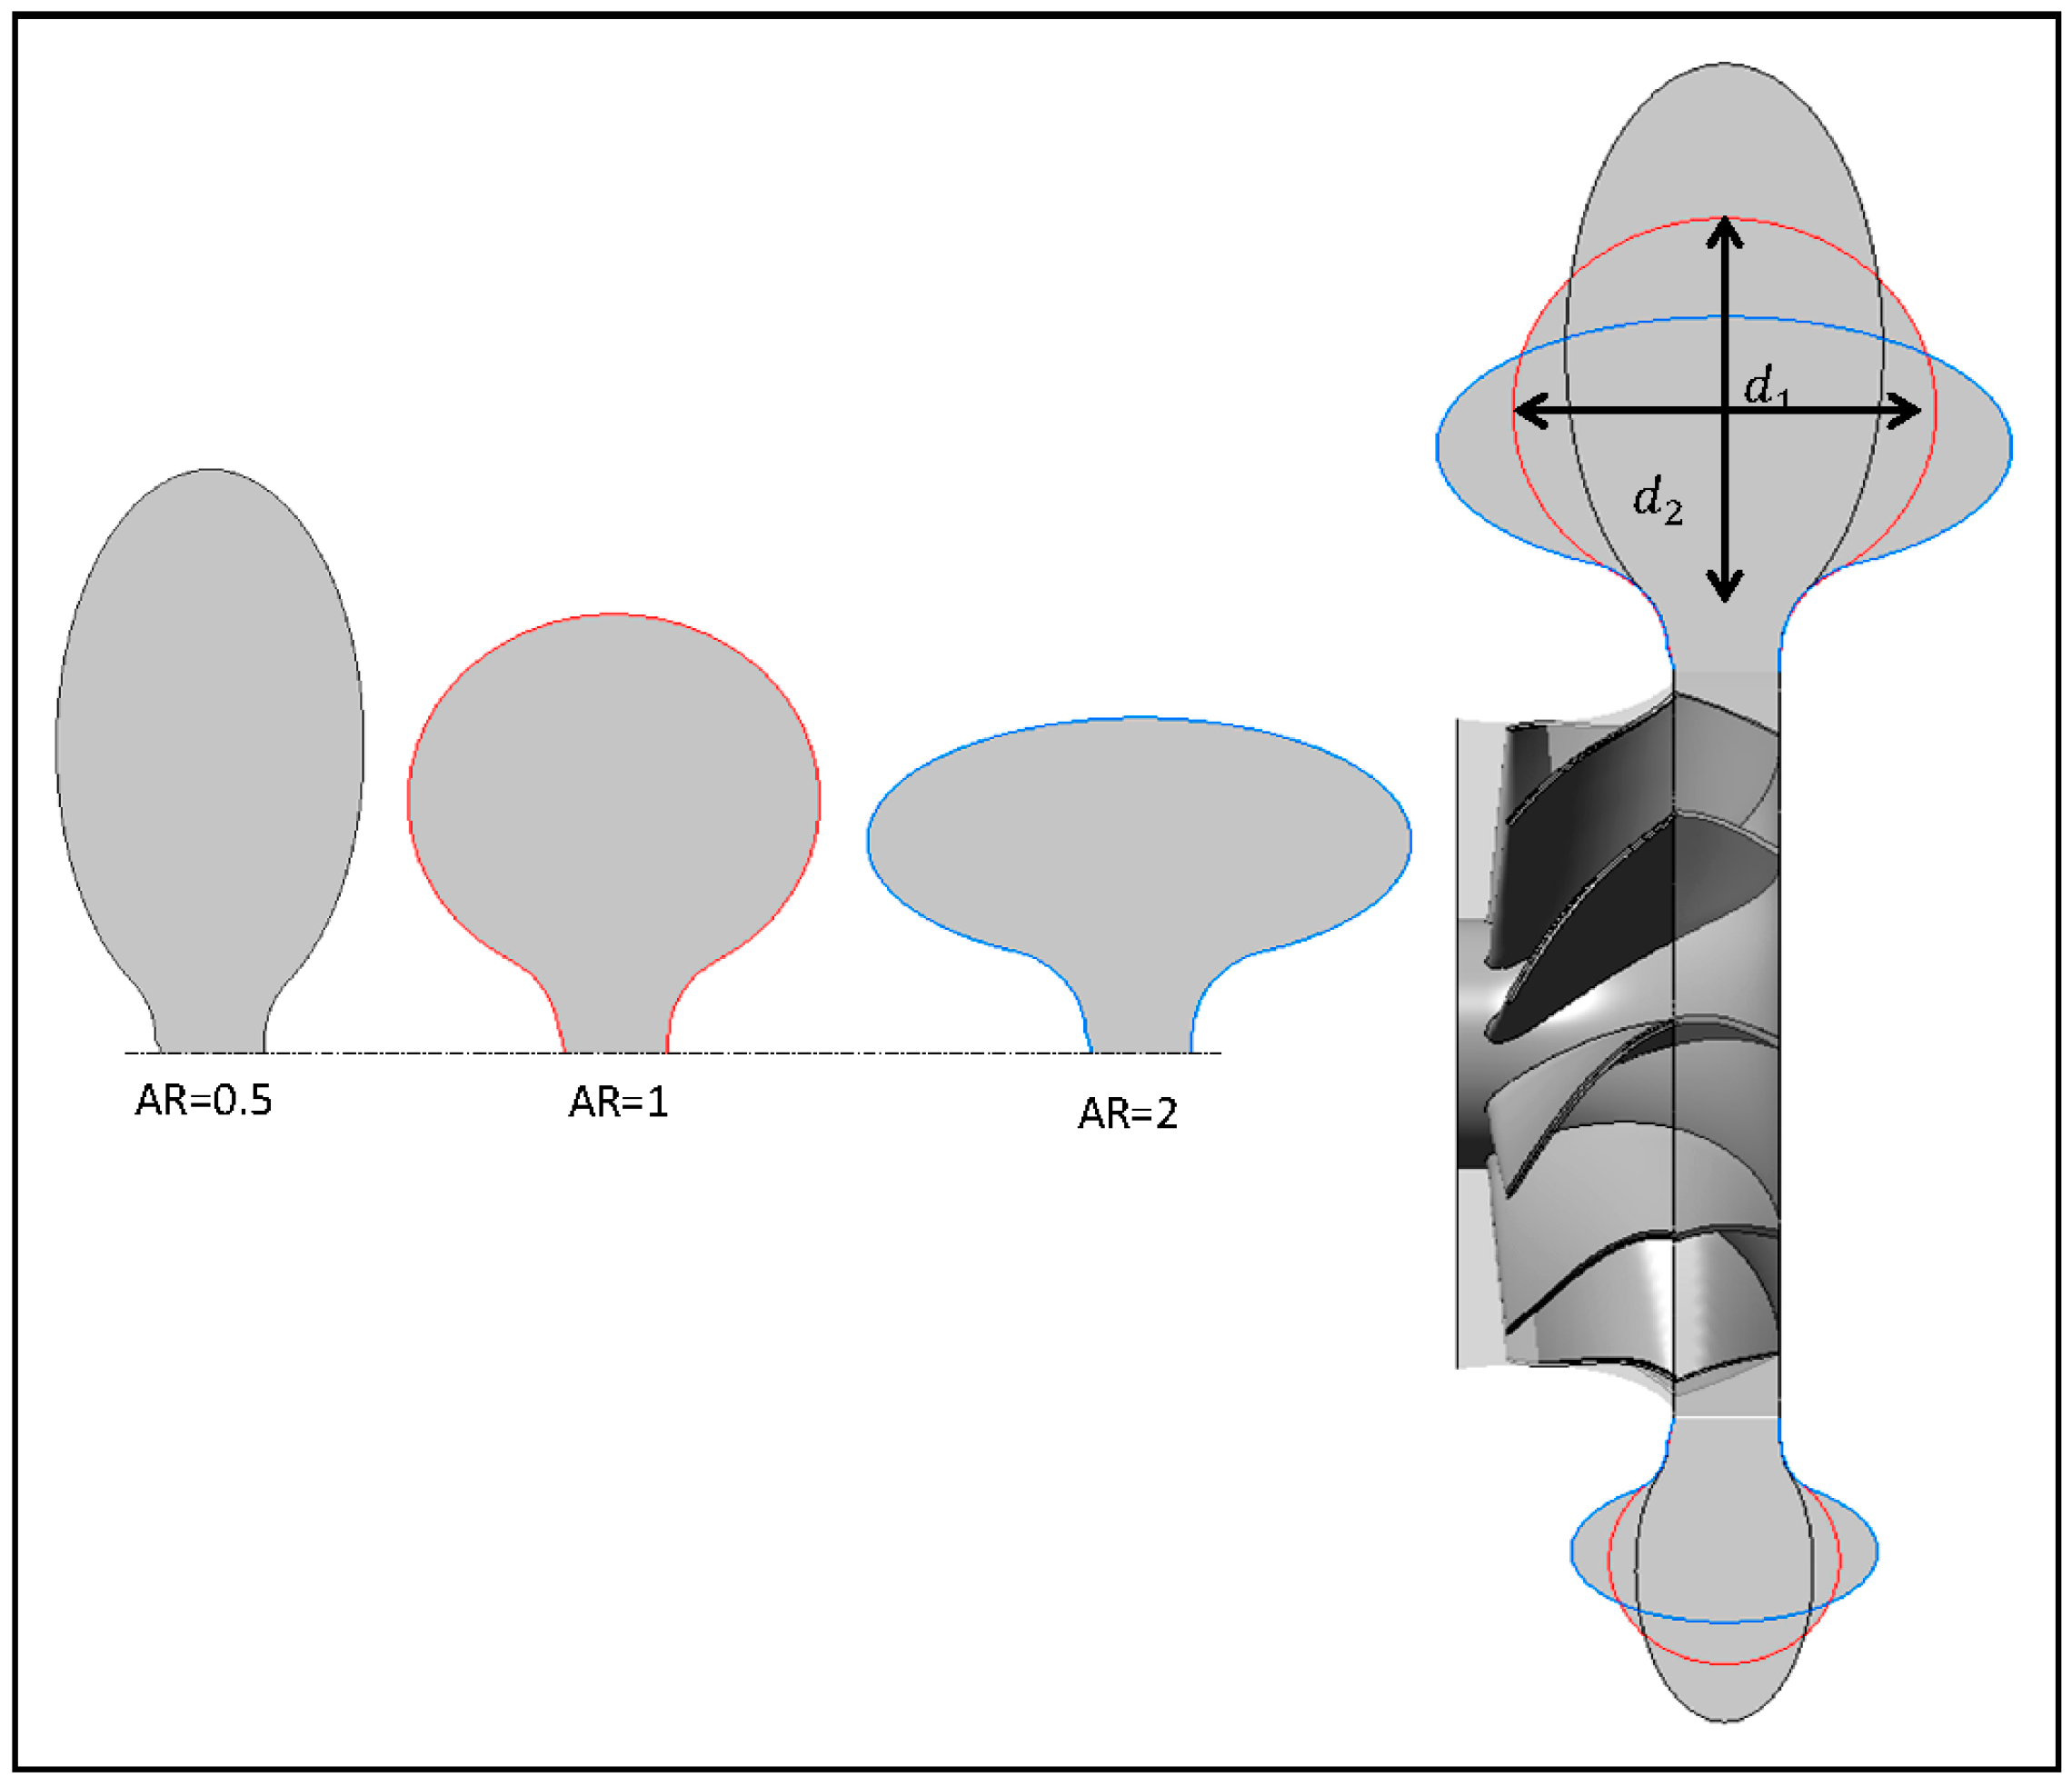
Turbine design is often a compromise between performance and packaging requirements. In this study three turbine volute designs with varying aspect ratio were designed and analyzed. The three volute designs are presented in Figure 3. The volute aspect ratio is defined as:
where AR is aspect ratio, is the horizontal diameter and is the vertical diameter. The three tested volutes have aspect ratios of 0.5, 1 and 2. The volute A/r is defined as the ratio of volute cross sectional area to the volute centroid radius.
3. Computational Approach
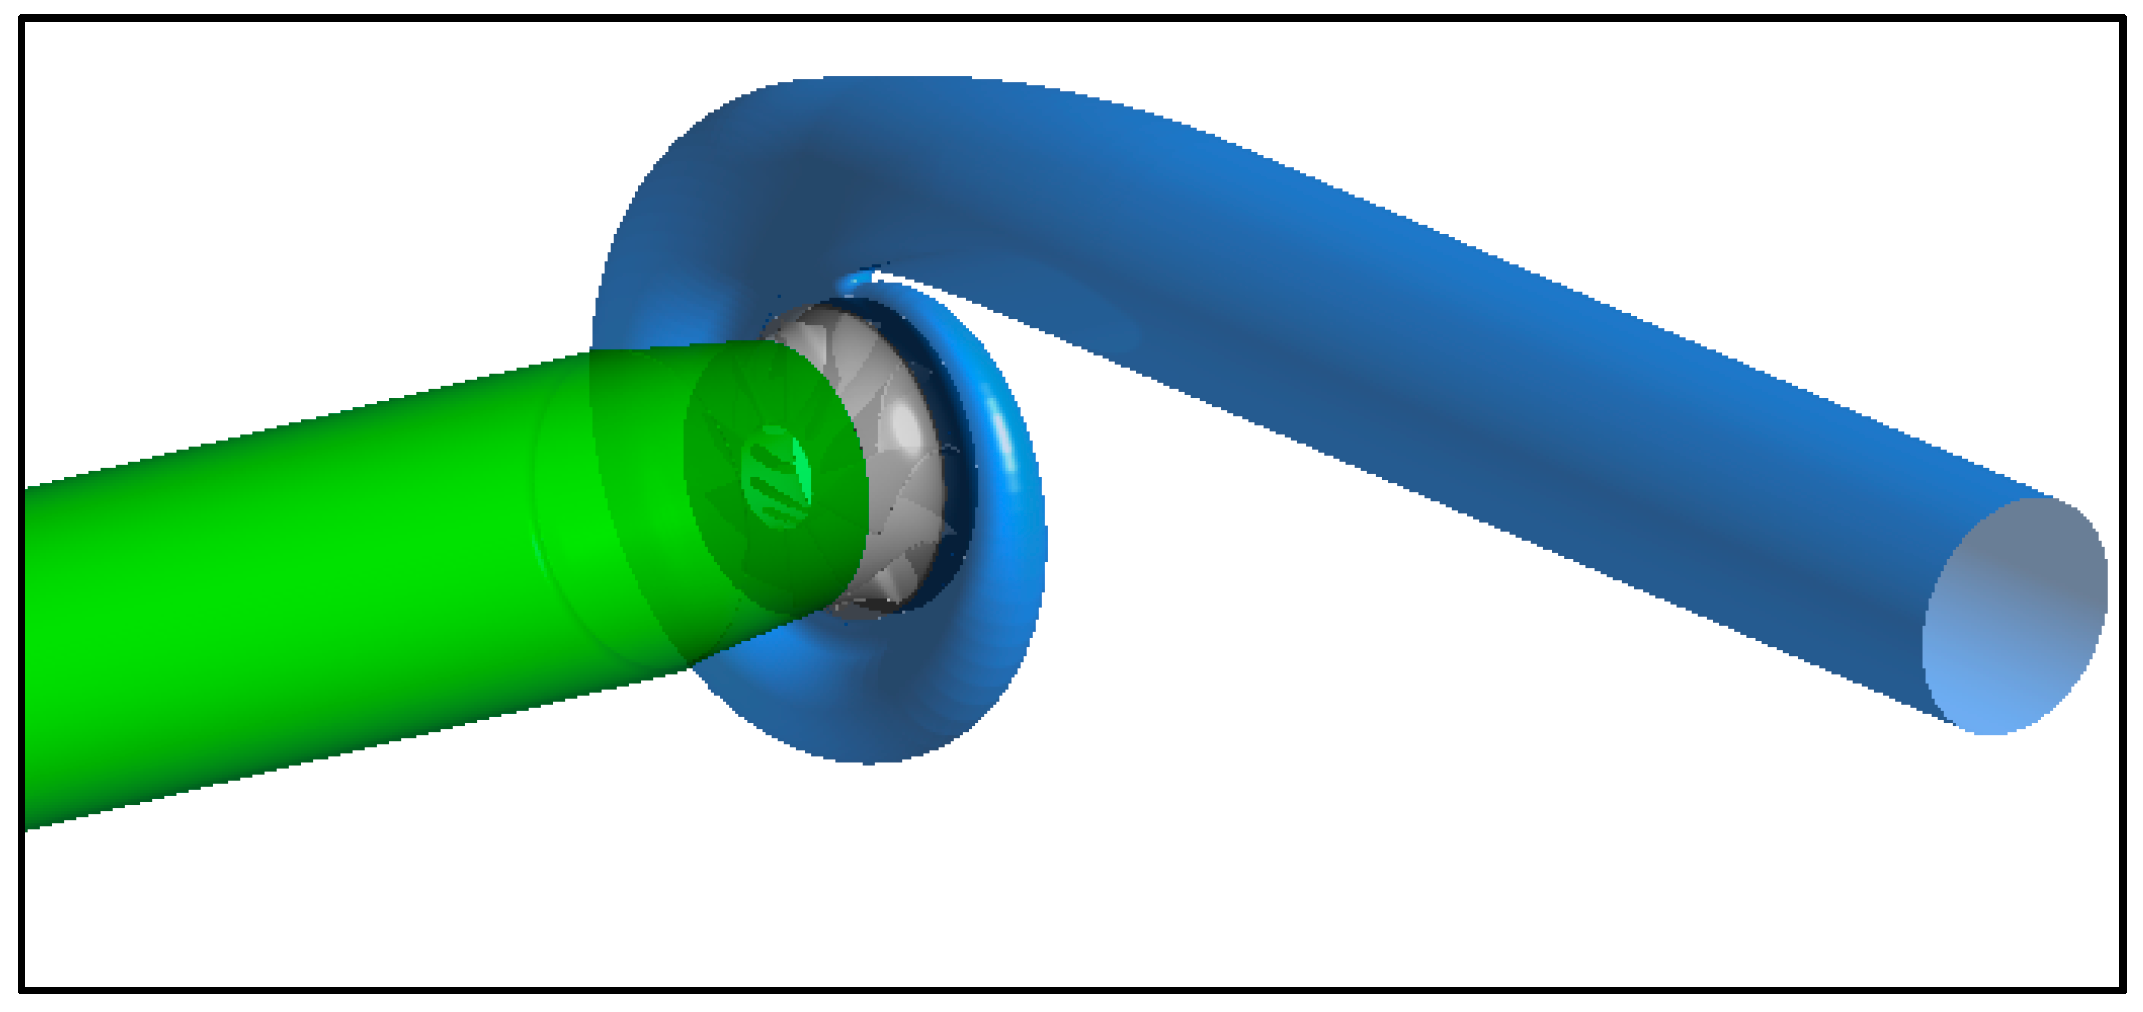
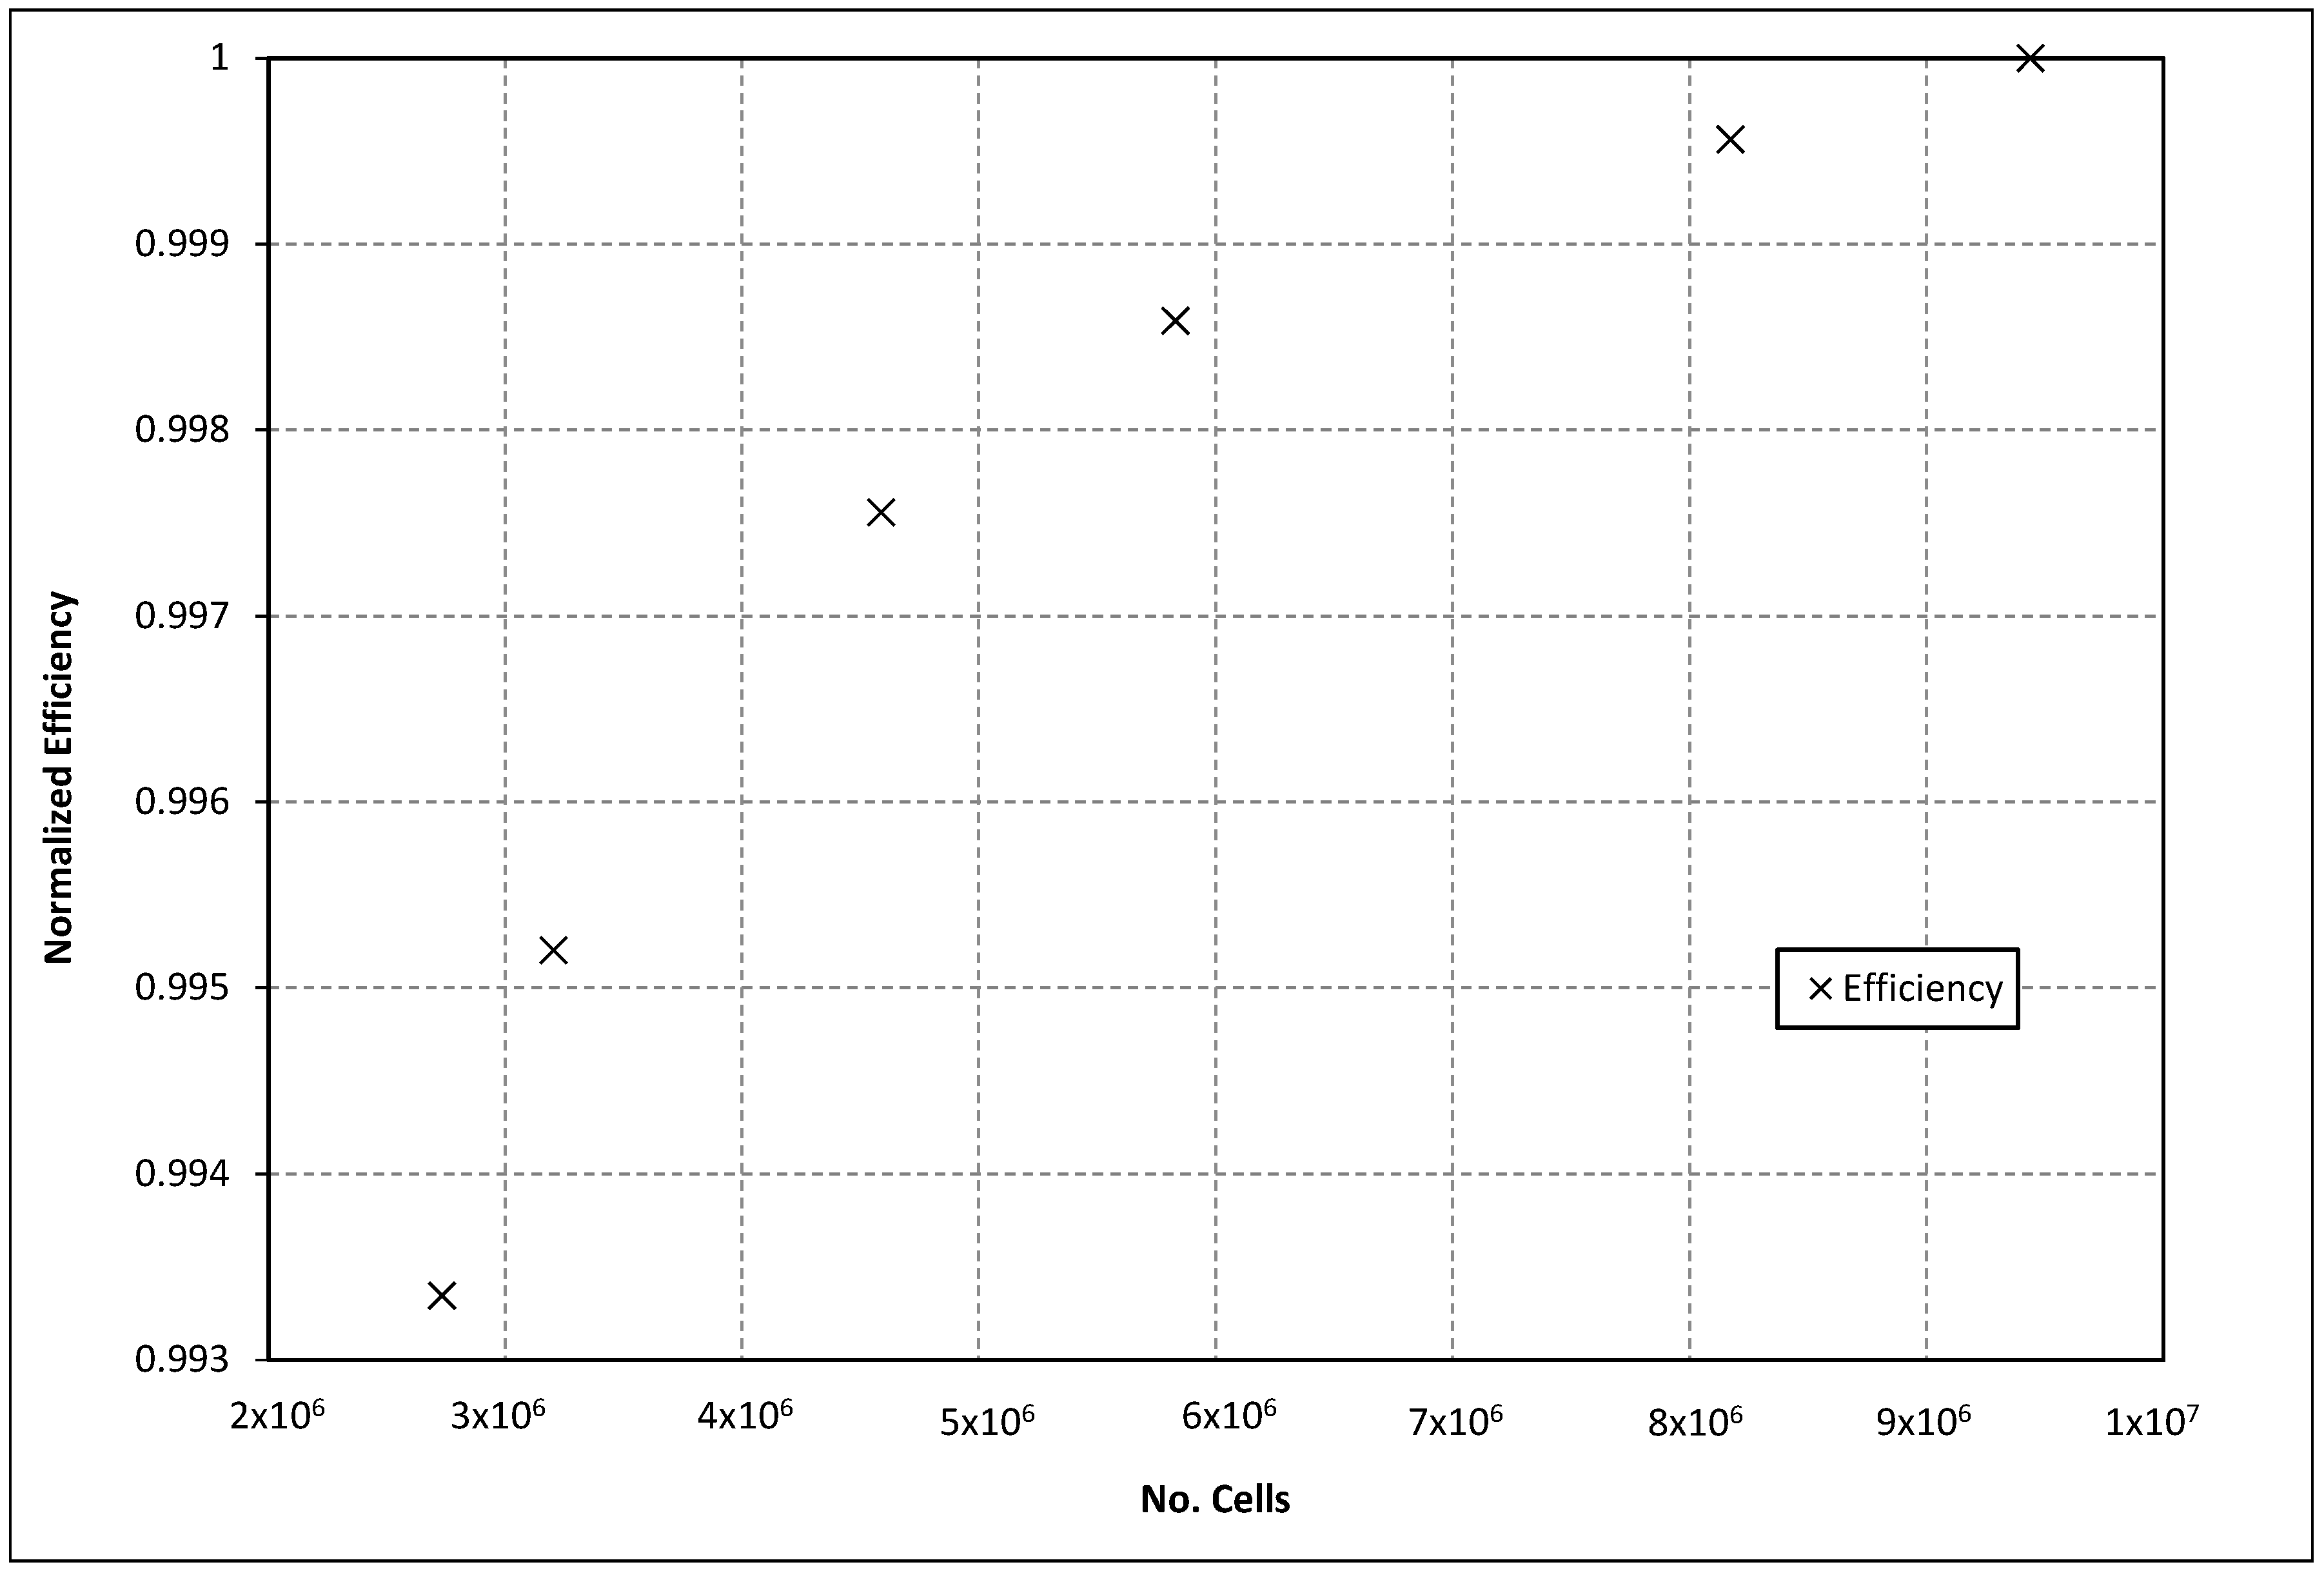
Figure 4 shows the computational domain which consists of three regions: the volute, the rotor and the outlet. A full domain specific mesh study was completed, similar to that recommended by Galindo et al. [14]. The mesh study results for both the volute and rotor domains are presented in Figure 5 and Figure 6 respectively. The rotor mesh independence plot shows an under damped trend for both stage efficiency and mass flow. Beyond a mesh size of 3.5 million cells, the mesh shows good levels of convergence with less than 0.4% variation in efficiency and less than 0.2% in mass flow.
The volute mesh shows a standard convergence trend as the values tend towards an asymptote. Refinement of the mesh beyond 6 million cells yielded an improvement of less than 0.15% in efficiency. Furthermore, qualitative analysis of the flow structures showed the prediction of consistent flow structures beyond this point.
The volute and outlet region domains used an unstructured tetrahedral mesh developed in ICEM CFD (computational fluid dynamics) [15]. The rotor region uses a structured hexahedral mesh completed in ANSYS TurboGrid [15]. All CFD simulations were completed in ANSYS CFX 17 [15] using the frozen rotor approach to account for the turbine rotation as used by a number of authors [16,17,18]. Yang et al. [19] used the same computational approach to study the performance of a vaneless mixed flow turbine and showed good agreement with experimental results under both steady state and pulsating flows. The only discrepancy between experimental and computational results noted in [17] was the magnitude of the hysteresis loop formed. This was attributed to the impact of the volute tongue on the flow distribution that is not accurately modelled with the frozen rotor method. Yang et al. [19] compared the frozen rotor and sliding mesh method in detail. The authors found that the circumferential variations in rotor inlet conditions and rotor torque were well predicted by the frozen rotor method. Discrepancies between the two methods were only seen in a detailed study of the passage secondary flows downstream of the LE. This was due to the difference in time scales of the secondary flow development and that of the rotation of the wheel. Furthermore, analysis of secondary flows in the rotor passage away from the volute tongue showed no noticeable differences in flow development.
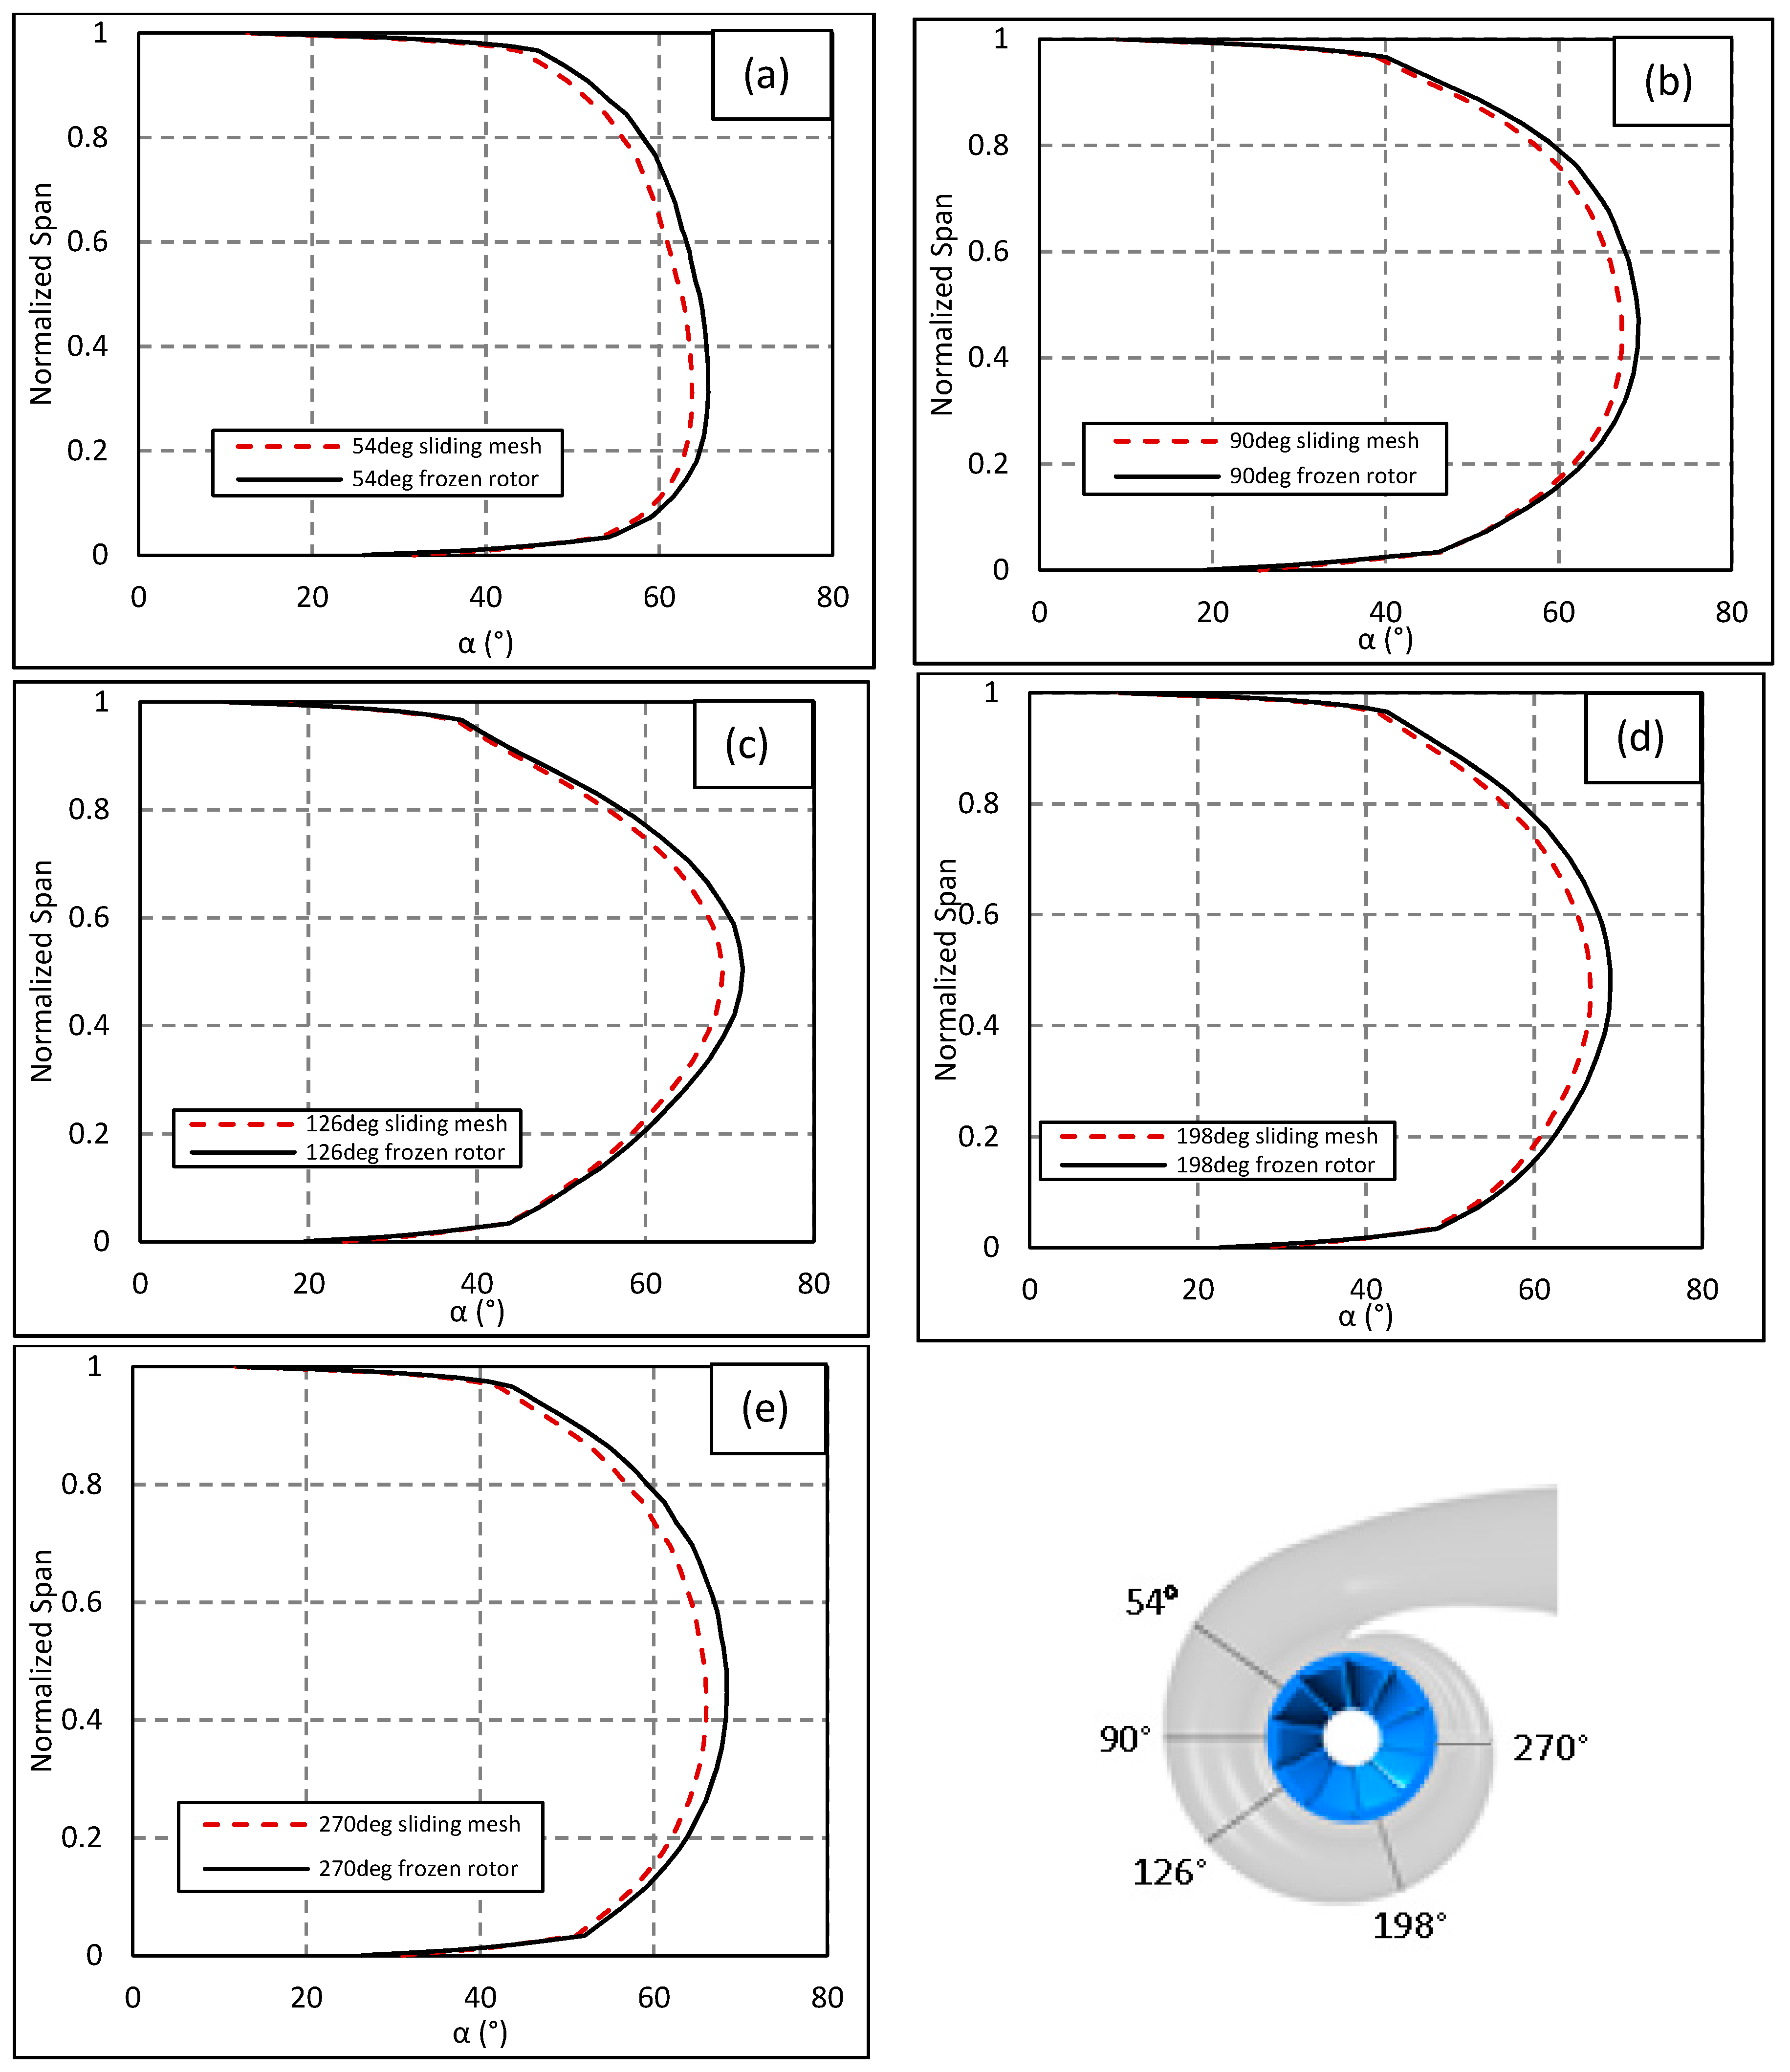
The geometry studied in the current investigation is that of a vaneless mixed flow turbine (no stator guide vanes). Therefore, the only circumferential non-uniformity present was that of the volute tongue. The impact of the frozen rotor approach was assessed, as it was deemed necessary to validate the capability of the frozen rotor approach to predict the volute exit flows. The frozen rotor method was compared with that of the sliding mesh approach under non-pulsating flows. The time step size in the sliding mesh simulations was equivalent to 4° of rotor rotation and the results were averaged over multiple rotations. Figure 7 presents the absolute flow angles at the volute exit at five circumferential locations. In both cases the trends in absolute flow angle are in agreement and the variation around the volute circumference matches. However, the frozen rotor approach consistently overpredicts the peak absolute flow angle by approximately 2°.
As the variation between the two approaches was small and the frozen rotor method was found to be capable of predicting the volute exit flow conditions, the frozen rotor approach was used throughout this study.
The Shear Stress Transport (SST) model is commonly used in radial and mixed flow turbine studies [8,16,17]. While the model has been validated by a number of authors and its accuracy proven over a number of years, the true turbulence is not modelled in the Unsteady Reynold Averaged Navier-Stoke (URANS) approach. Alternatively, Hellstrom et al. [20] completed Large Eddy Simulations (LES) to resolve the true large-scale turbulence while small scale turbulence is modelled. However, such an approach requires large computational resources and simulations require large run times.
To better capture the flow physics, the Shear Stress Transport Scale-Adaptive Simulation (SST-SAS) method is employed in this work. This approach numerically solves the flow using the URANS approach but detects the resolved unsteady structures and adjusts them producing LES like results in the unsteady regions. This modelling approach can therefore result in more accurate predictions in highly unsteady separated or vorticial regions. Full details of the turbulence computation can be found in [21].
To accurately capture the flow present, the volute mesh was highly refined. The volute refinement was done both from a quantitative and qualitative perspective ensuring that the volute losses and volute flow structures were captured to a high degree of accuracy. The resulting volute and inlet duct meshes for the three tested housings consisted of approximately 10 million cells each.
Computational Validation
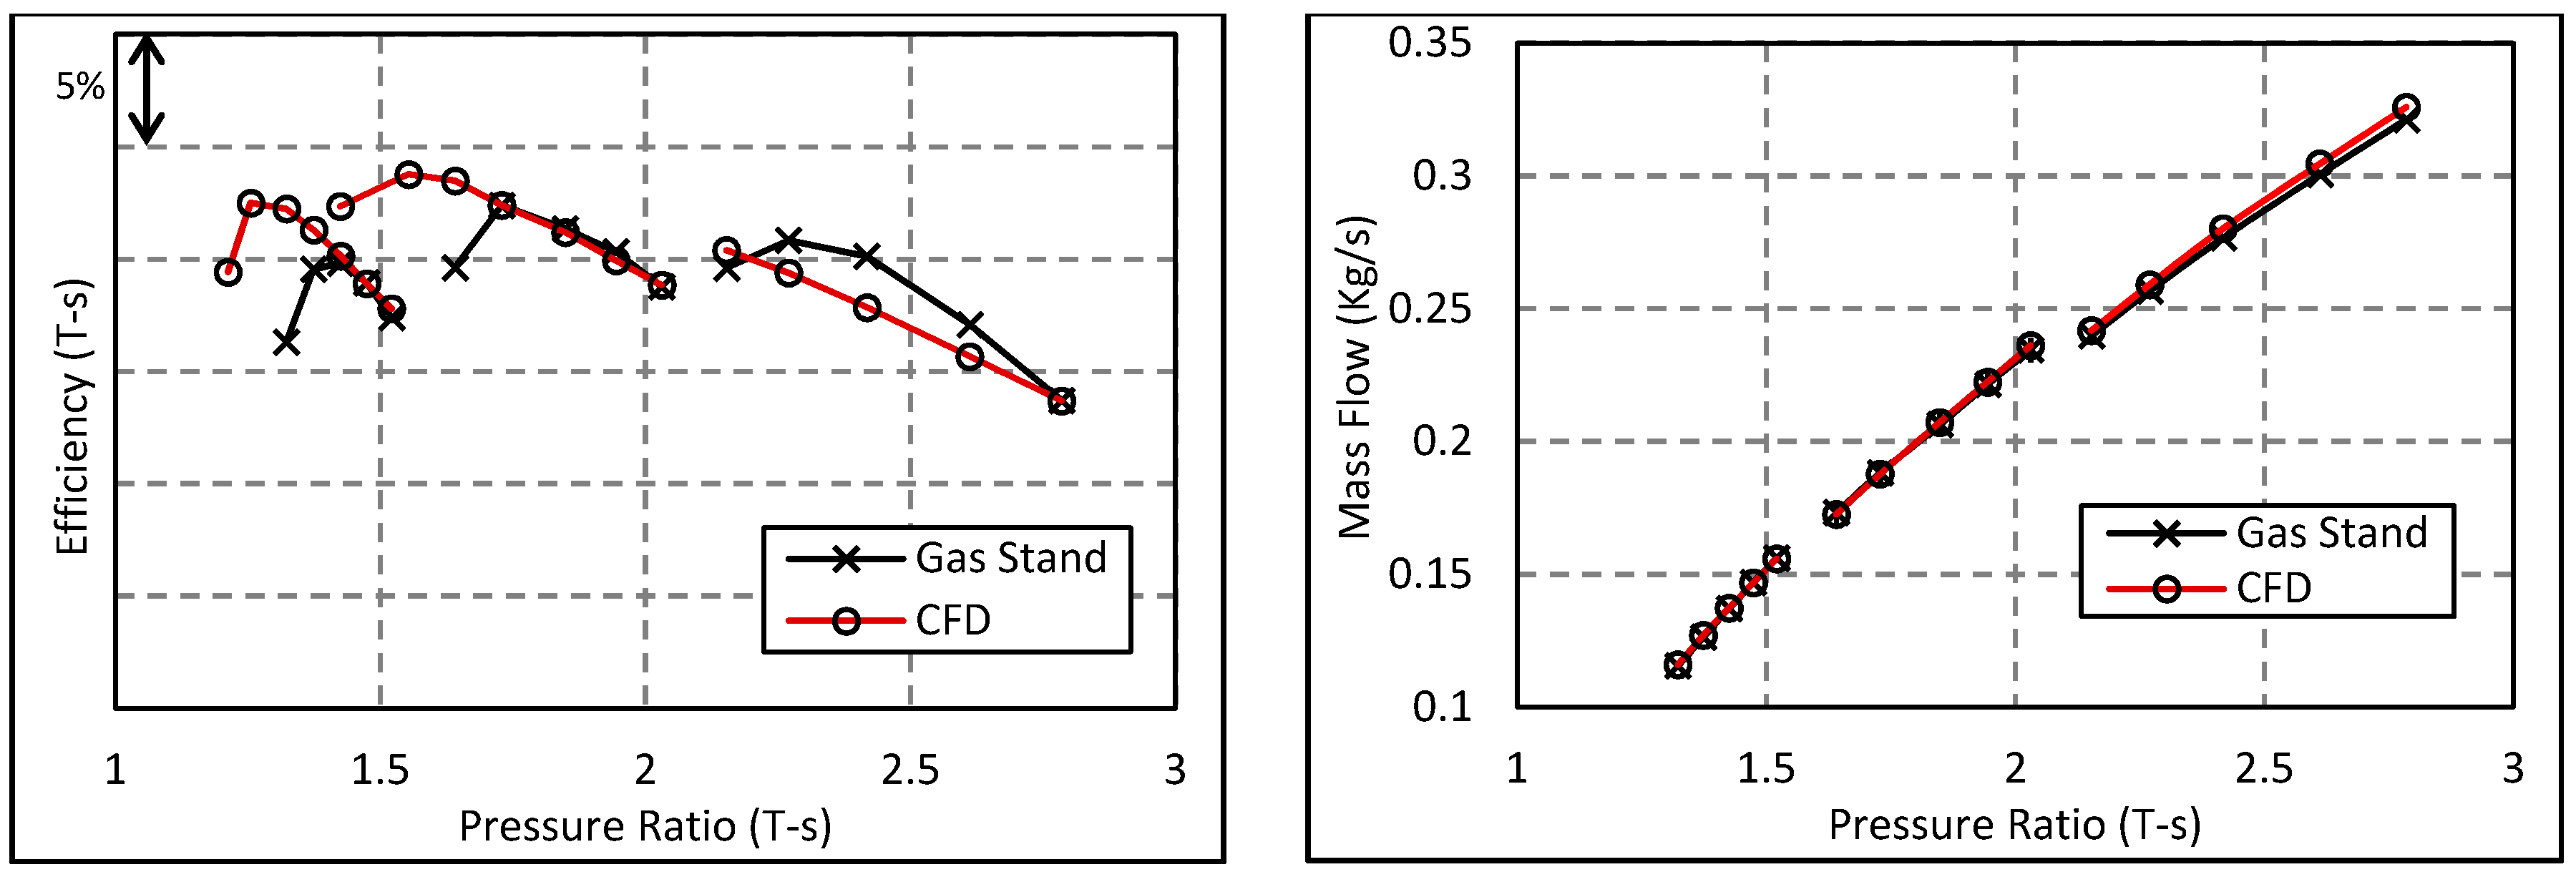
The computational approach used in the current work was validated against steady state gas stand tests to assess the accuracy of the CFD method. This was done at turbine speeds of 70, 90 and 110 krpm to assess accuracy over a wide range of turbine operation. The boundary conditions applied in the computations were total pressure and temperature at the inlet and static pressure at the outlet. The aim of the validation was to assess the ability of the computational model to predict the performance trends of the mixed flow turbine. Figure 8 presents the validation of efficiency and mass flow for the mixed flow rotor in this study at three turbine speeds.
The predicted turbine mass flow shows good agreement with that measured by gas stand testing over a wide range of pressure ratios. The CFD starts to show slightly higher mass flow values on the 110 krpm speed line only. The turbine efficiency characteristics are also well predicted by the CFD model. However, the CFD does consistently overpredict the maximum efficiency achieved. The predicted peak efficiency was also found to occur at lower pressure ratios than that measured on gas stand. The CFD also predicted that the efficiency drop would occur at lower pressure ratios than the measured result and hence gave an extended speed line range.
The discrepancies in absolute efficiency values measured could be the result of the adiabatic assumption applied in the computational work. While the gas stand pipe work is insulated to reduce the impact of thermal losses, inevitably losses still occur where the rig is not fully insulated. Furthermore, experimental measurement of the turbine outlet pressure—where the flow contains a large swirling component—is extremely difficult, leading to further discrepancies.
Despite the variation in absolute measured efficiency, the characteristics of turbine performance are accurately captured over the range of operations. As stated by [22], CFD methods are capable of replicating the performance trends of the turbine but deviation in the absolute values should be expected due to a number of assumptions in the CFD set-up, including smooth surfaces, rotation strategy and the adiabatic assumption. The impact of the adiabatic assumption was assessed by [23] and the authors showed a significant improvement in gas stand map replication under cold flow condition where thermal losses were minimized. Hence these assumptions can account for the discrepancies in the absolute values of the gas stand and CFD data. The accurate replication of the turbine performance trends provides a level of confidence in the computational approach used throughout this study.
4. Results and Discussion
4.1. Impact of Volute Ascpect Ratio on MFP
Initial analysis of volute aspect ratio was completed at constant volute A/r. The volute A/r determines the rotor inlet flow angle and the swallowing capacity of the stage. Therefore, maintaining A/r is expected to maintain Mass Flow Parameter (MFP) and therefore ensure aerodynamic similarity.
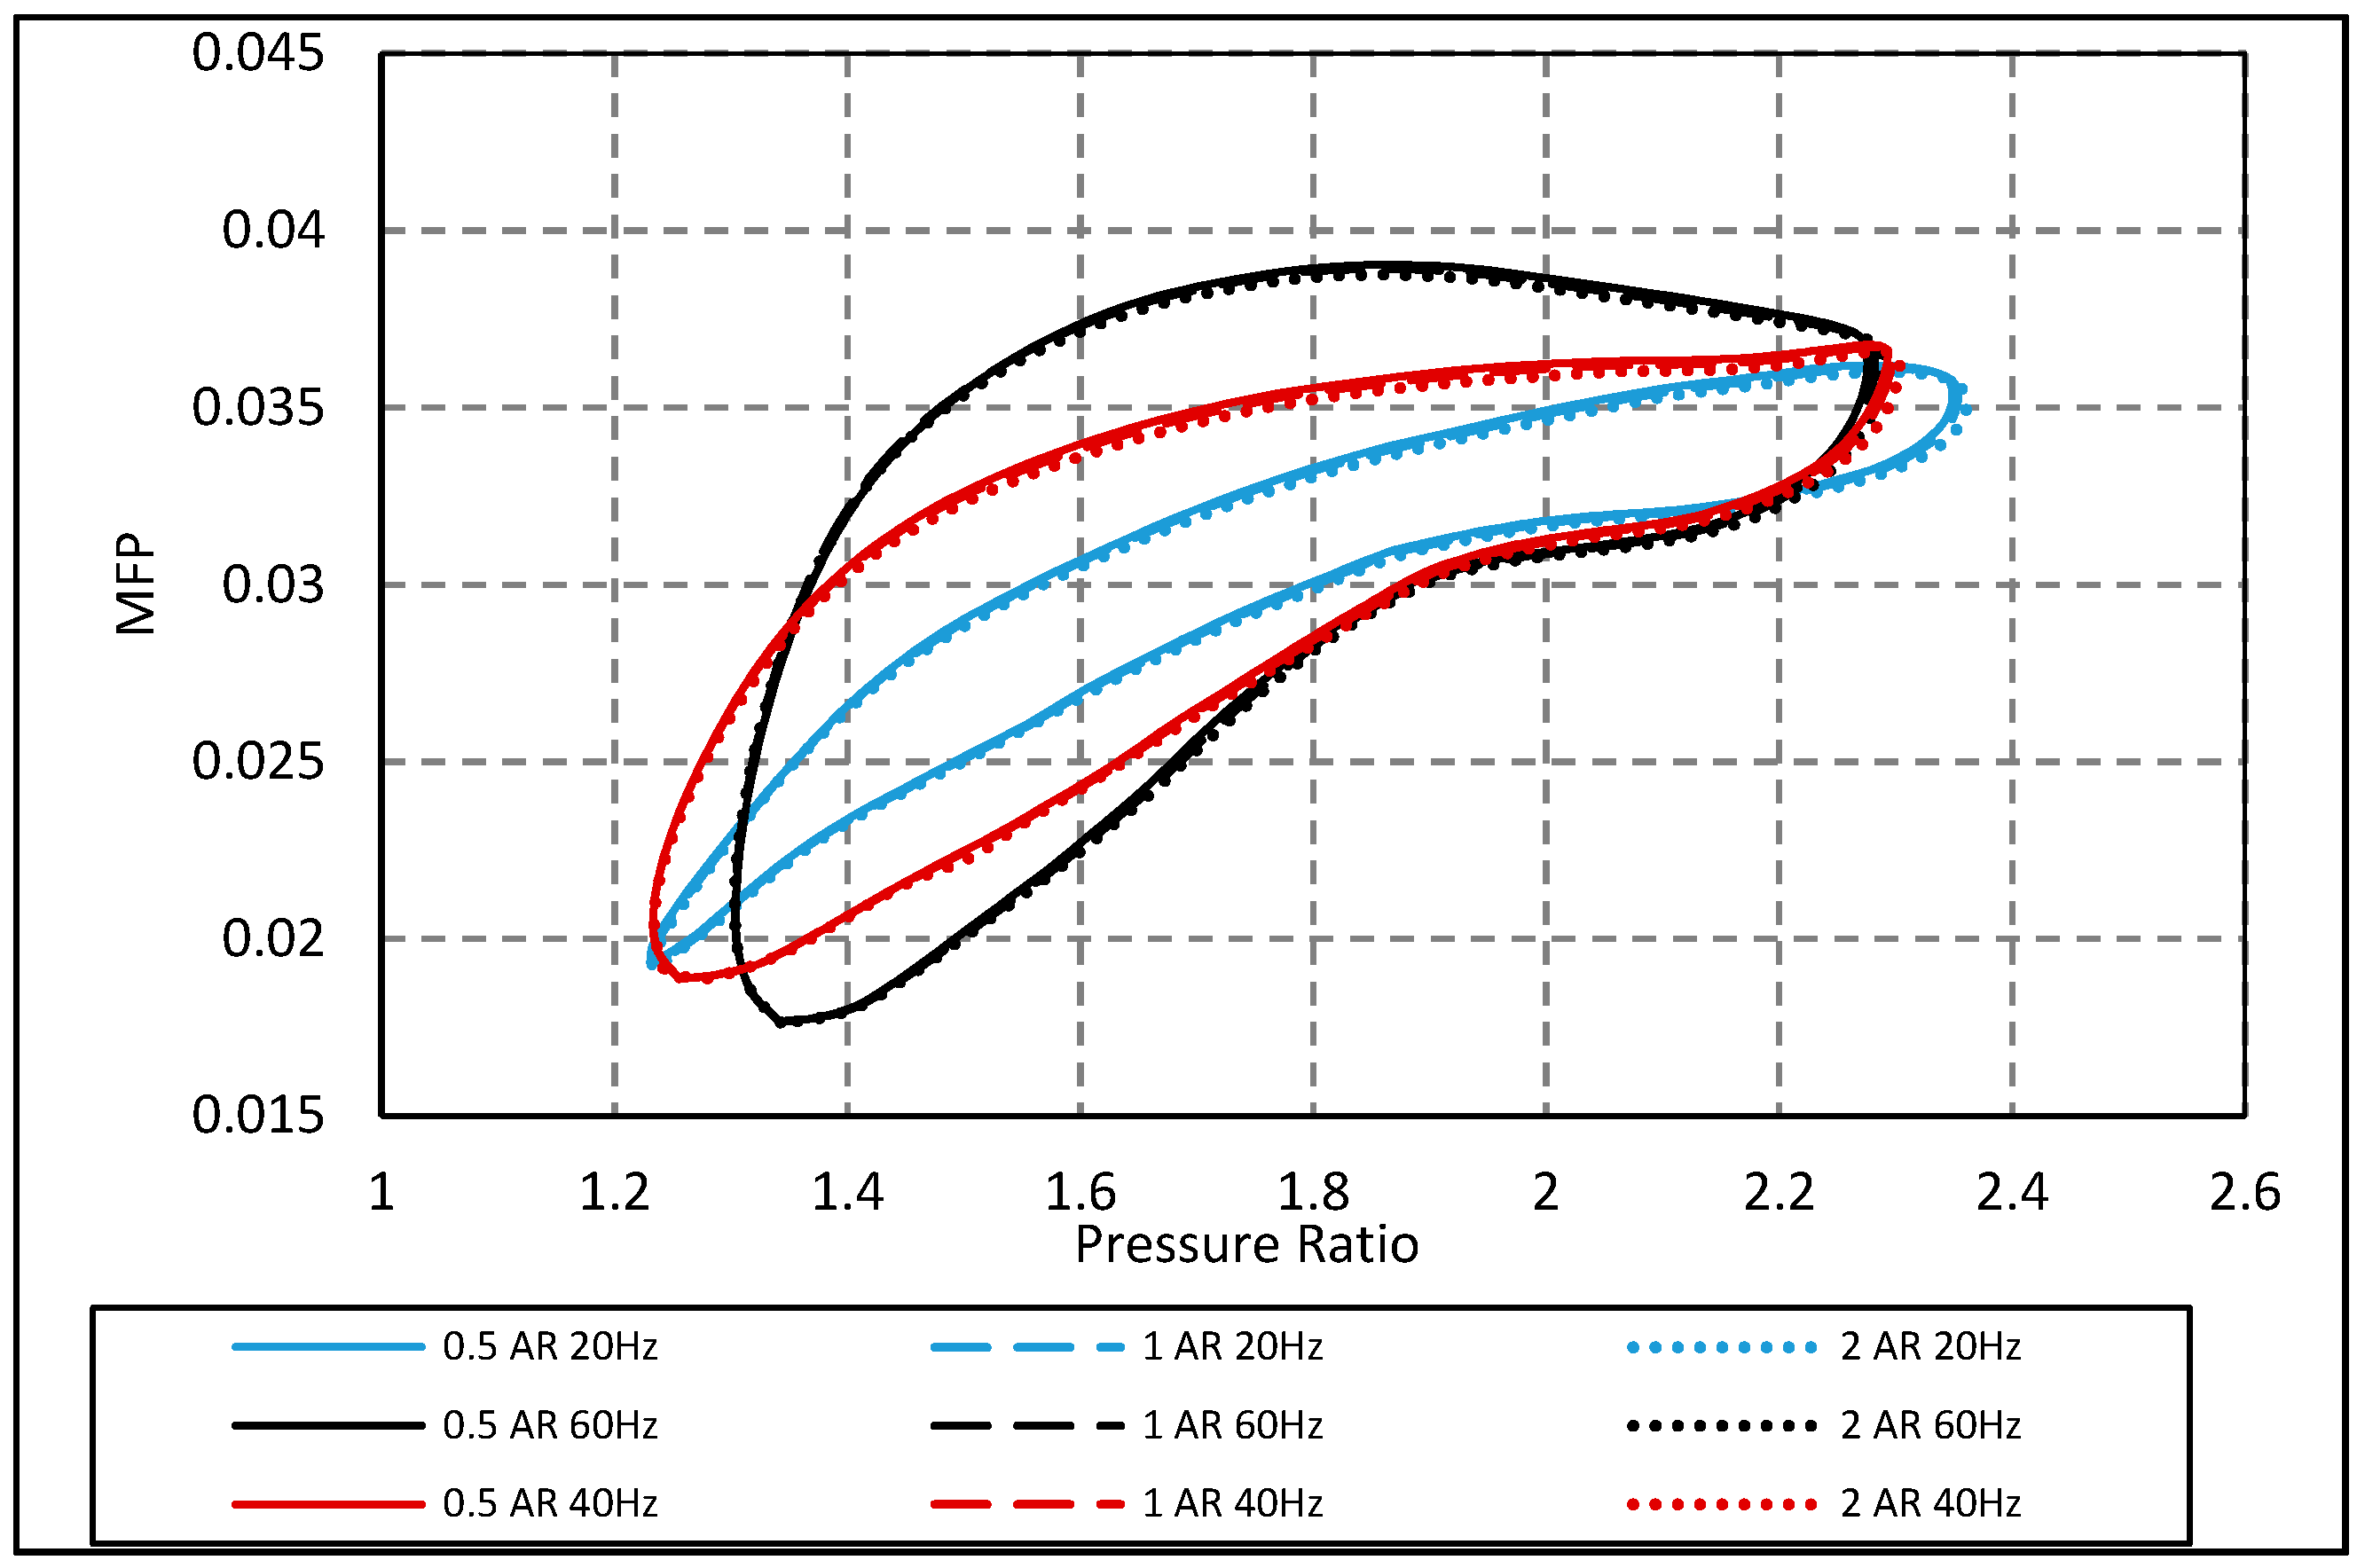
Presented in Figure 9 are the hysteresis loops for all three volute aspect ratios at 20, 40 and 60 Hz pulse frequencies. It is clear that maintaining volute A/r did not ensure a constant MFP and that the volute aspect ratio has a significant impact on stage performance. At all three tested frequencies the MFP of the volute reduces with increasing aspect ratio. The maximum variation in cycle averaged MFP between the three designs at constant A/r was 4.3% under the 60 Hz pulse frequency. This impact of volute aspect ratio is important as volute cross sectional shape is often compromised due to packaging requirements of the turbocharger. If the volute cross section shape is altered for such a design, ensuring constant A/r alone will therefore not ensure a constant MFP. A similar effect was observed by Yang et al. [9]. The variation observed in that study was approximately 2%. Despite the discrepancy in MFP of the two volute designs the authors still compared them in terms of performance.
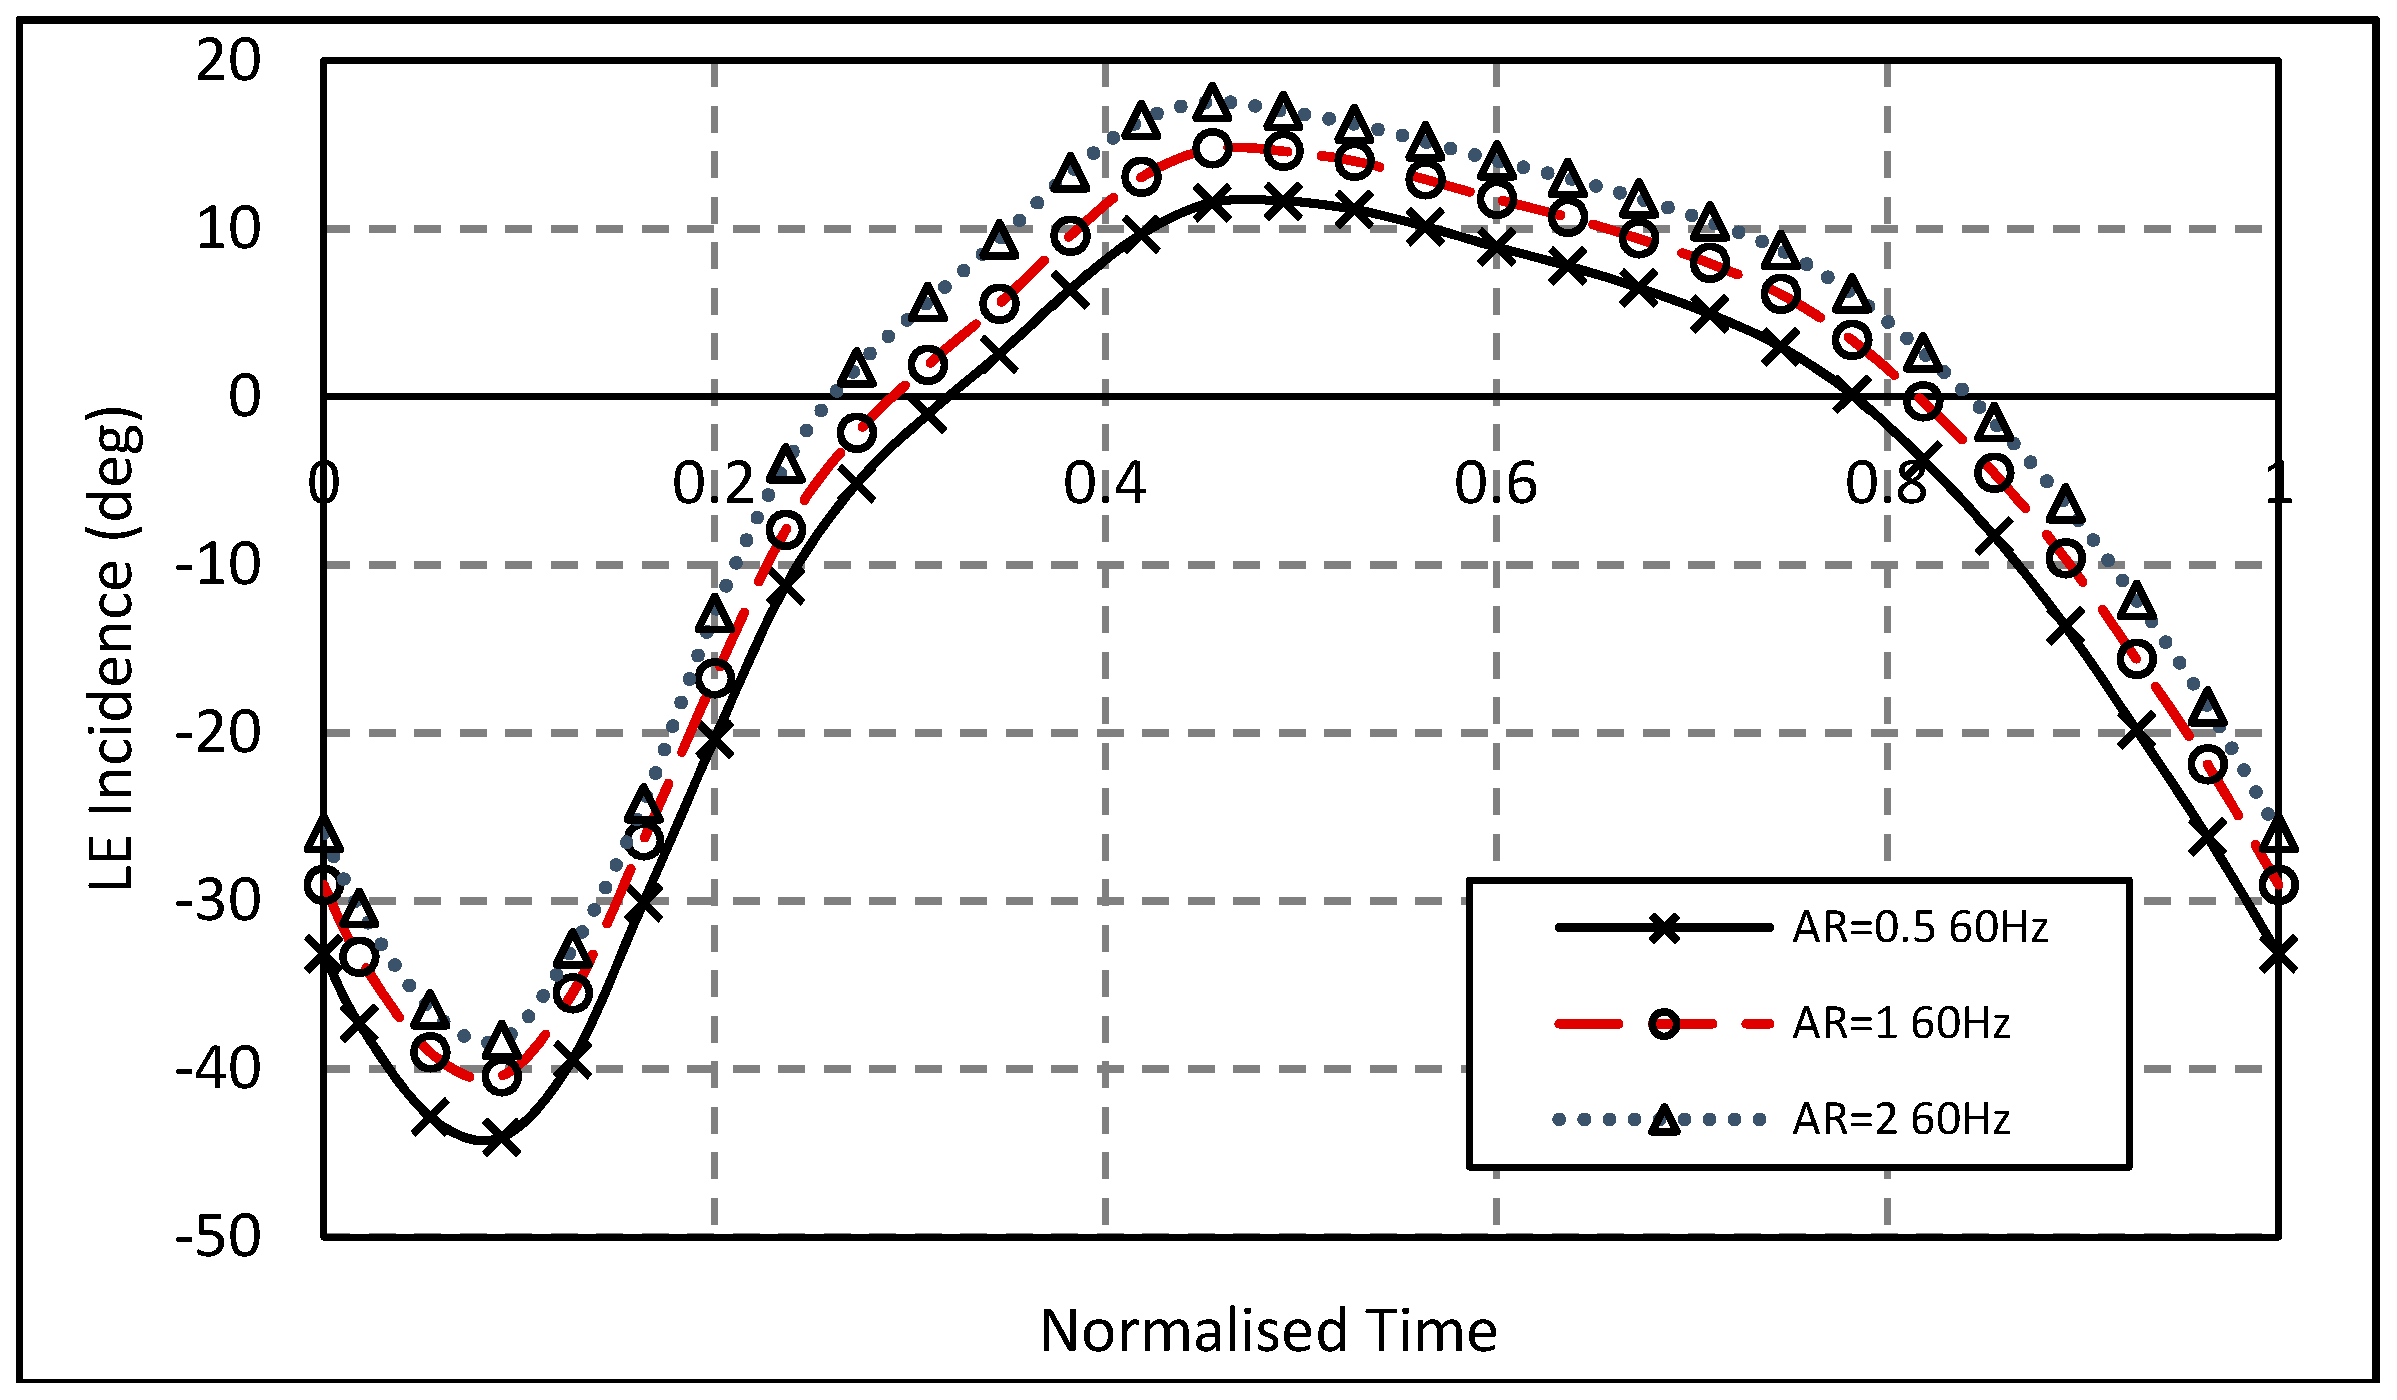
Figure 10 presents the variation in LE incidence throughout the pulse for each of the volute aspect ratios at 60 Hz pulse frequency. It can be seen that increasing the volute aspect ratio increases the mean incidence throughout the pulse. The variation between the three designs is approximately 6°. This observation, along with that of varying MFP with aspect ratio, indicates that reducing volute aspect ratio gives the same effect as increasing A/r and vice versa. More specifically, it is believed that increasing the centroid radius reduces the radial flow component of velocity due to less flow guidance from the volute outer wall.
4.2. Aspect Ratio Effect with Constant MFP
To ensure aerodynamic similarity between the designs, thereby giving a fair comparison of design performance, stage MFP must be matched. To achieve this the volute A/r’s were modified. Figure 11 shows A/r as a function of the azimuth angle for each volute design. The A/r ratio of the AR = 1 and AR = 2 volutes was increased slightly to enable constant MFP.
The resulting MFP hysteresis loops are presented in Figure 12 for the three designs at the three tested pulse frequencies. The resulting cycle averaged MFP varied by less than 0.5% between all three housing designs. The designs were judged to be aerodynamically similar for the purpose of analyzing turbine performance.
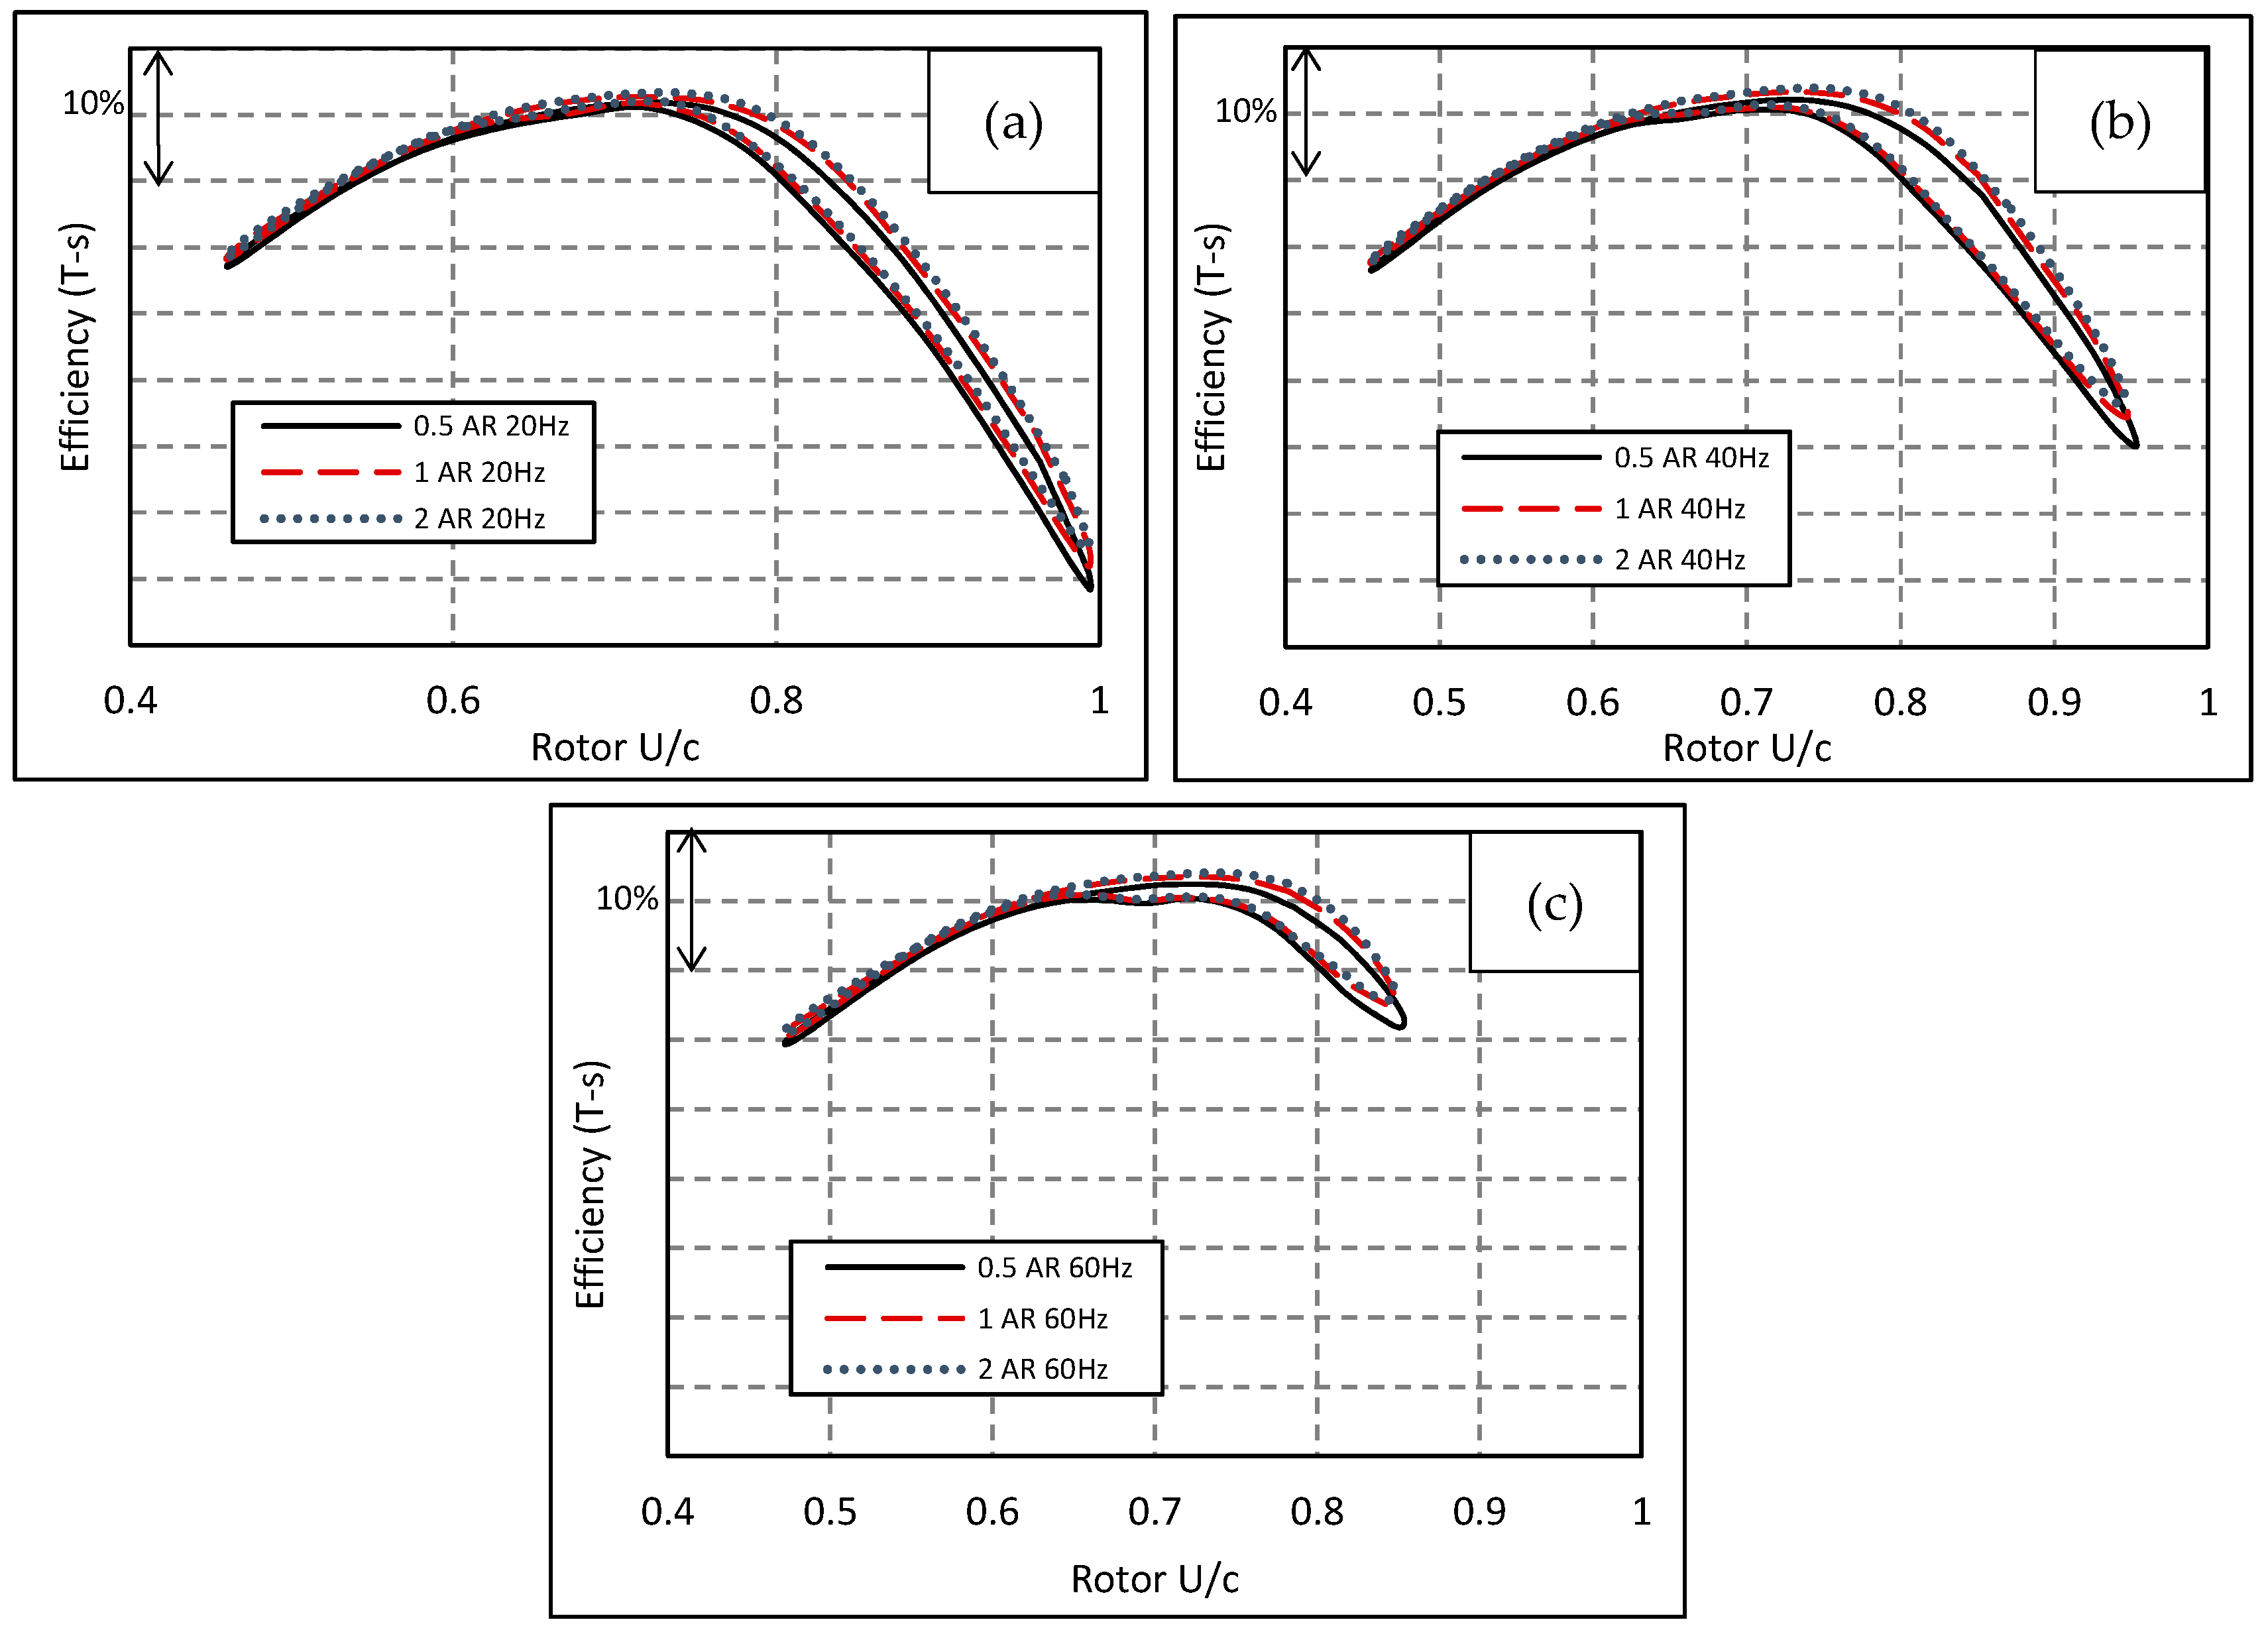
The rotor efficiencies achieved over the pulse cycle for each configuration at the three tested pulse frequencies are presented in Figure 13. A clear reduction in the range of rotor operating velocity ratios with increasing frequency can be observed. This range reduction almost exclusively happens at the high end of the spectrum. The maximum achieved at 60 Hz was only 0.851 as apposed to 0.994 at 20 Hz. The range of rotor efficiency measured also reduced with increasing frequency.
The variation in rotor efficiency between the tested designs is small, but at all frequencies the volute AR = 0.5 design was less efficient across the range of operation. However, the AR = 0.5 design gave a greater maximum rotor than the other two designs at all frequencies. This can be attributed to a greater volute loss occurring in the smallest AR design resulting in a lower pressure ratio acting over the rotor. The efficiency of the AR = 1 and AR = 2 are similar over the range of rotor operation at all tested frequencies.
Table 1 presents the cycle averaged efficiencies for each design under the three tested pulse frequencies. The cycle averaged rotor performance of the largest aspect ratio design was consistently the greatest. The maximum improvement of 1.04% over the AR = 0.5 design occurred at 20 Hz pulse frequency. Increasing volute AR also resulted in an increase in cycle averaged stage efficiency with the greatest improvement over the AR = 0.5 design being 1.47%, again at 20 Hz pulse frequency. The larger improvement in stage efficiency between designs was the result of the volute total pressure loss being significantly greater in the AR = 0.5 design. The greatest difference in normalized volute loss coefficient between designs was 13.83%. In all cases the performance of the AR = 1 design showed performance levels similar to that of the AR = 2 design. The efficiency of the rotor at the minimum and maximum running points is also presented. Consistently, the variation in efficiency between the three aspect ratio designs is greatest at the maximum velocity ratio point. The largest variation at this running point was 7.59% at 20 Hz pulse frequency. At the minimum running point the maximum variation in performance was only 1.17%. As the maximum amount of pulse energy is available at the minimum running point, it is the performance here that has the largest contribution towards cycle averaged performance.
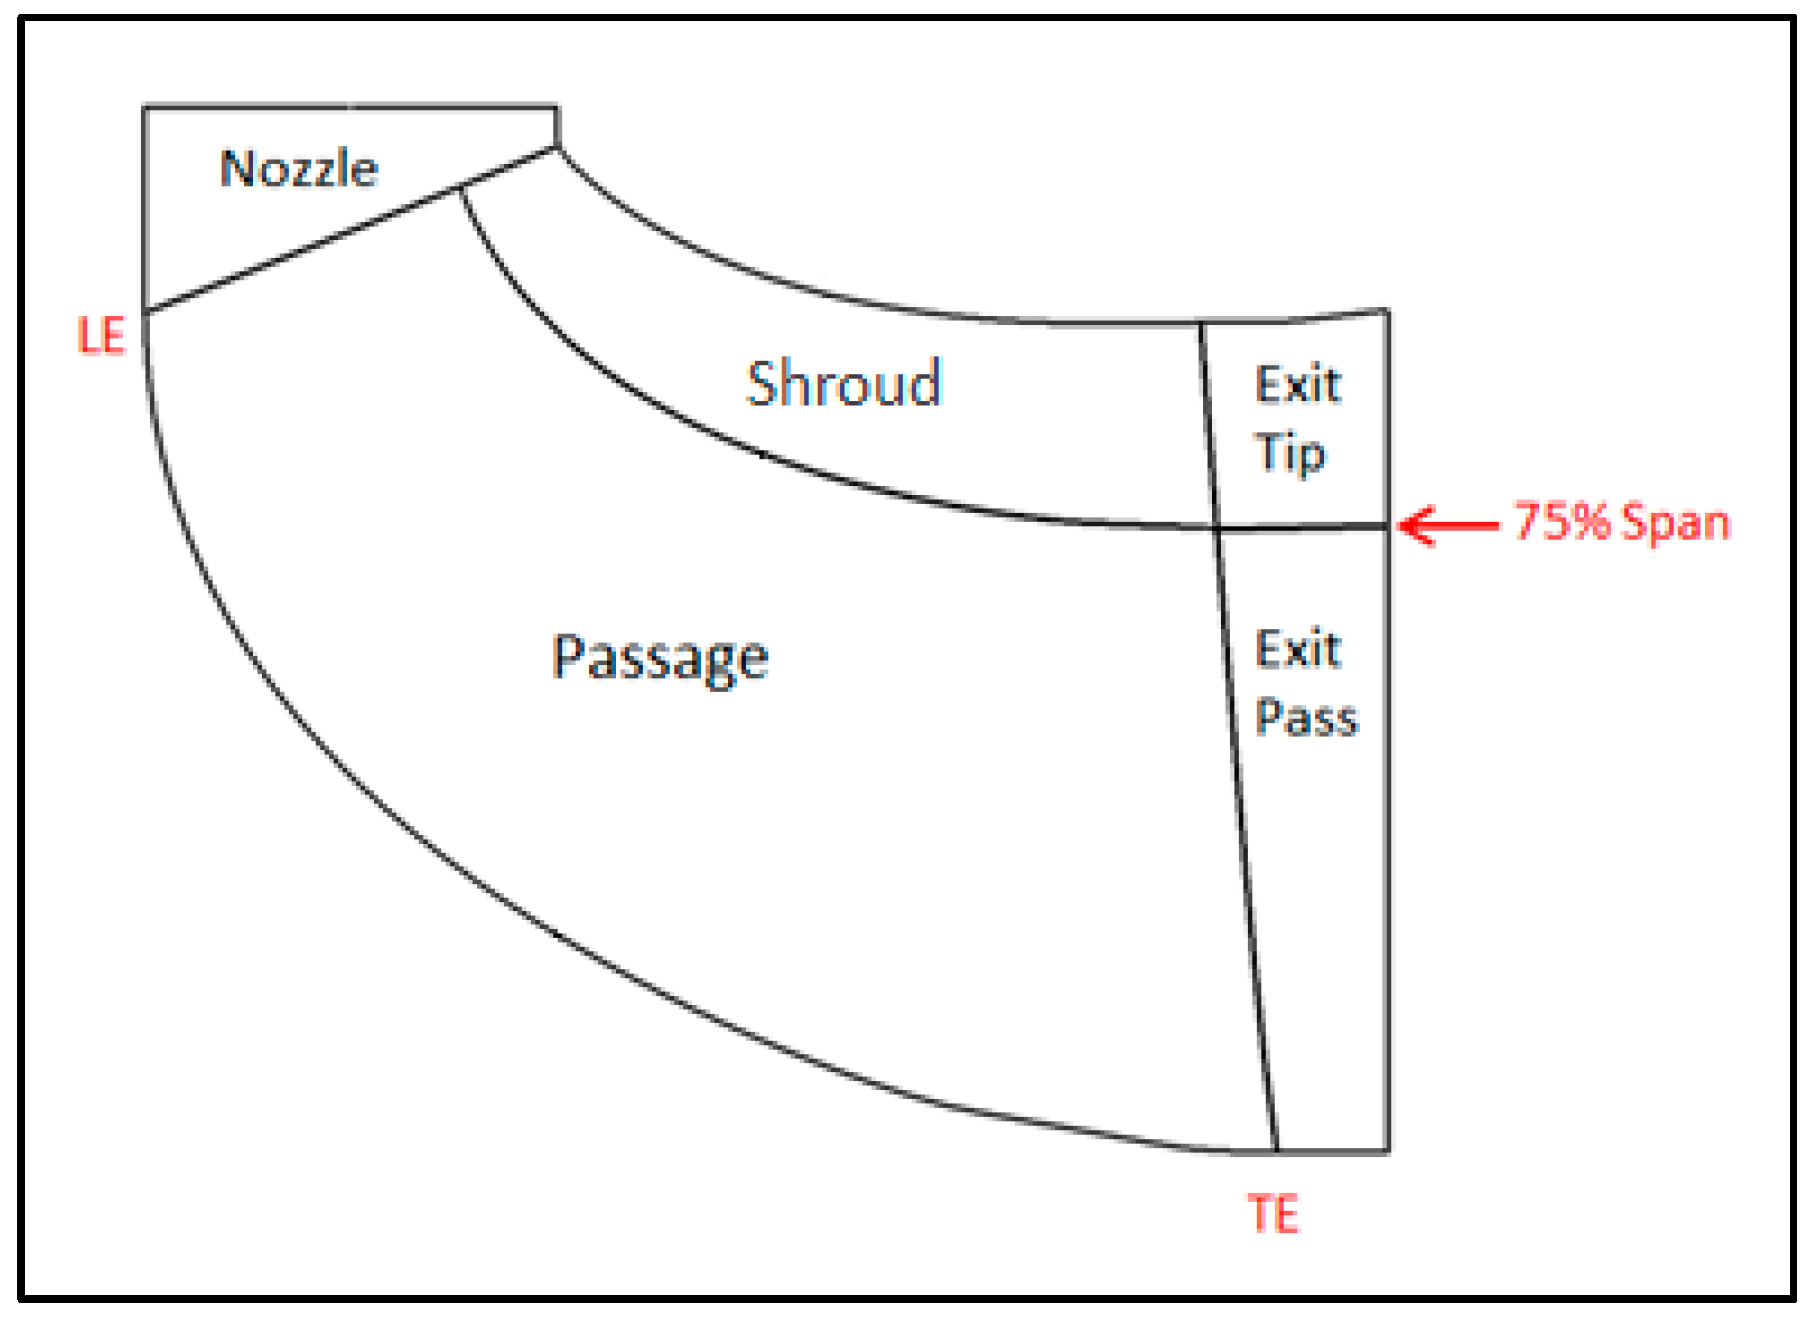
To understand the loss generation within the rotor, the passage can be broken down into regions of interest and the entropy generated in each region calculated. While the definition of the regions is somewhat arbitrary, the entropy generated within each region can be attributed to a dominant loss mechanism. The method used is similar to that implemented in both [24,25].
Figure 14 shows the control volumes created in the rotor passage. The entropy generation in each region is calculated from net entropy flux on the surfaces and summed over the control volumes.
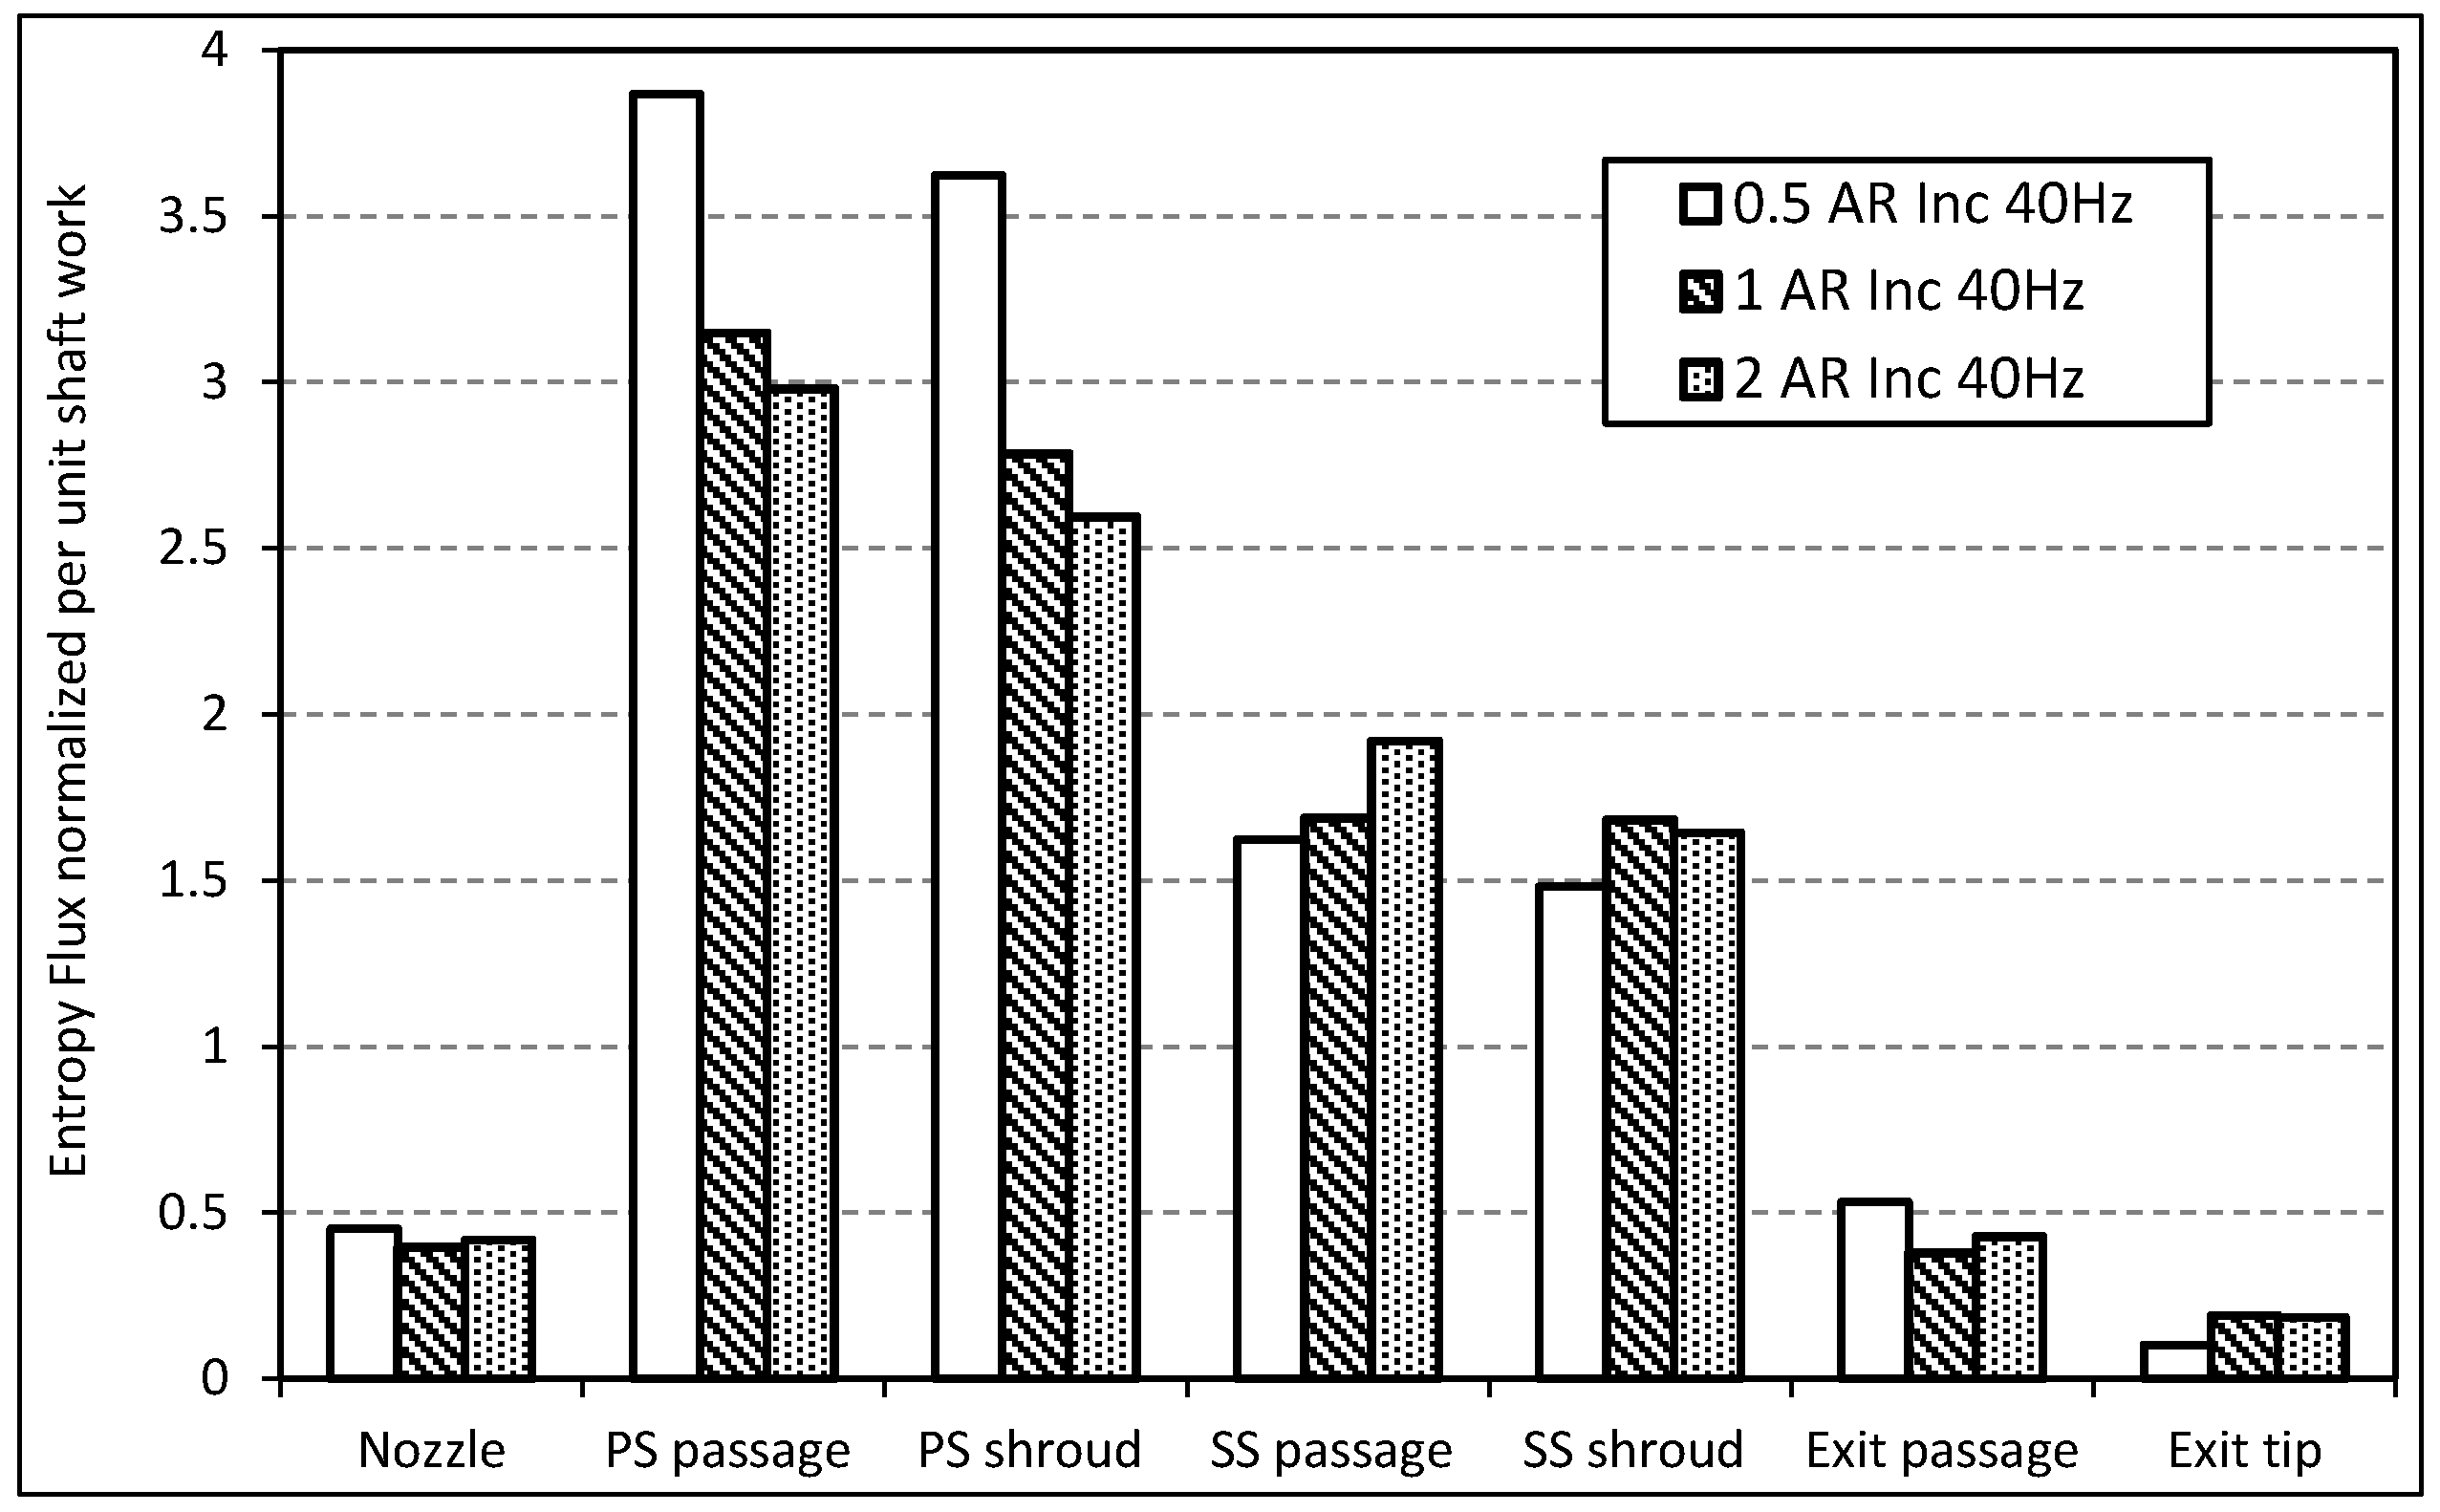
The resulting entropy generation is plotted in Figure 15 and Figure 16 at the minimum and maximum running points respectively.
Comparing the losses at the minimum incidence running point shows that the maximum losses occur in the pressure surface (PS) shroud and passage regions. This can be attributed to the high level of PS separation occurring at the highly negative incidence. At this running point the level of PS loss is much greater in the AR = 0.5 volute design. This result correlates with that presented in Table 1 which shows a large efficiency difference between the AR = 0.5 design and the other designs at this pulse point. The AR = 2 design shows a less significant improvement than the AR = 1 design.
At the maximum incidence running point, the major entropy generation occurs in the suction surface (SS) passage and shroud regions due to the LE losses associated with positive incidence. The variation between the three designs is smaller in this case. The most significant difference occurs in the SS shroud region where there are greater losses for the AR = 0.5 design. The main loss contribution in this region was shroud tip leakage.
4.3. Secondary Flow Structures
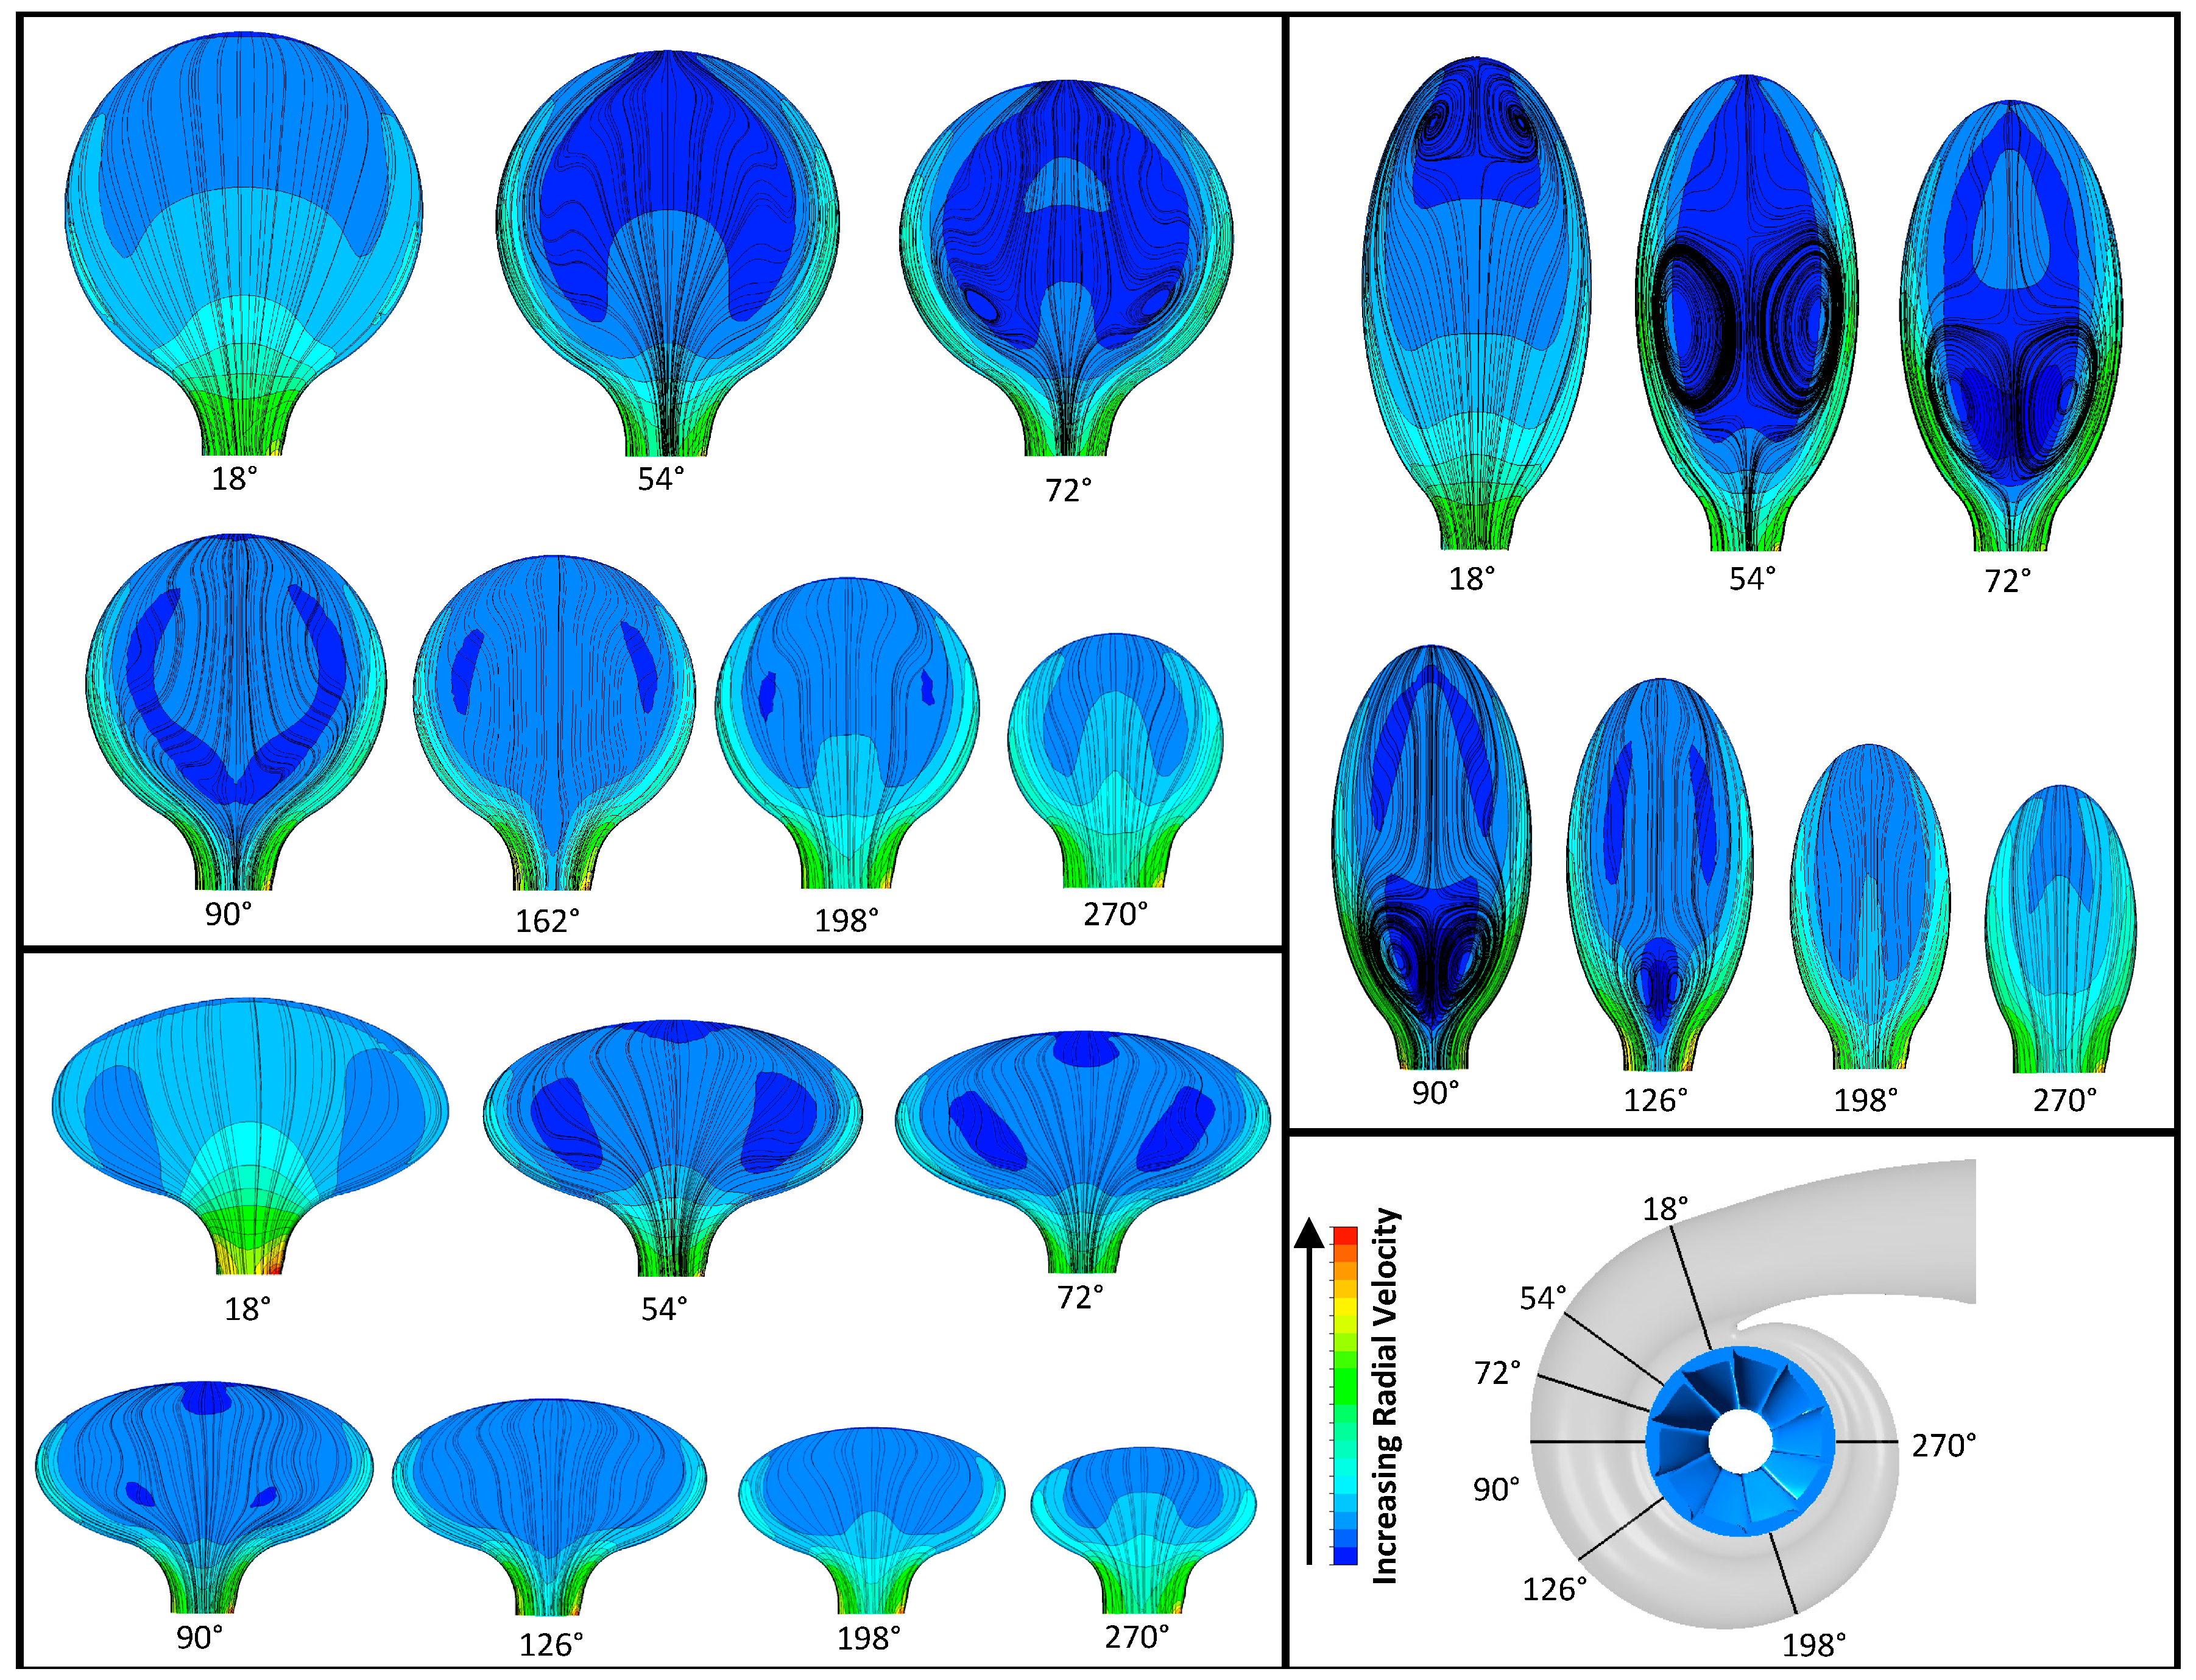
Understanding the impact of volute aspect ratio on turbine performance requires an understanding of the secondary flows within the volute passage. Figure 17 shows contours of radial velocity and streamlines at seven planes around the volute for each design, at the minimum incidence running point for the 40 Hz pulse. The angles of the planes are defined from the tongue in the direction of flow, as indicated in the figure. The planes are selected to sit directly between the blades to reduce the impact of blade proximity. The exception is the 72° plane which is included to show the peak secondary flow activity.
A turbine volute is an example of a complex pipe as both the radius of curvature and volute cross sectional area reduce with the azimuth angle. Also in the case of a turbine volute there is an added pressure force acting out of the volute and in to the rotor region which will resist flow reversal in the volute.
The development of the secondary flows within the volute can be attributed to the Dean effect. Dean vortices were first observed by Dean [26,27]. These flow structures occur when the flow encounters a bend, with the low inertia flow at the walls turning readily into the radial direction within the pipe. In contrast, the higher inertia flow in the bulk of the passage does not turn as readily resulting in the development of counter rotation vortices with flow moving radially downwards at the walls and upwards in the passage center. The Dean number, , is defined as the balance of forces responsible for the development of the Dean vortices in pipe bends given by:
where: is the pipe radius, is the radius of curvature of the pipe bend and is the Reynolds number based on the pipe hydraulic diameter and is given by:
where is dynamic viscosity, is density, u is bulk velocity and is the hydraulic diameter. The Reynolds number expresses the ratio of inertial to viscous forces. The remaining term in Equation (4), expresses the centripetal force acting on the fluid. Therefore the Dean number represents the impact of the inertia, viscous and centripetal forces acting on the fluid around the pipe bend [28].
Figure 17 shows that the AR = 0.5 volute results in a significant increase in the size of the counter rotating vortices present. The vortices can be seen high in the volute passage at 18° and increase in size and move down the plane up to the 72° position. Between the 72° and 126° positions the vortices continue to move radially inwards but decrease in size ahead of the volute outlet. Beyond this point the vortices no longer exist, even though clear variation in radial velocity across the plane still exists. In the AR = 1 design vortices are only visible at the 72° position and in the AR = 2 design no vortex development occurs. Despite the lack of coherent vortex structures, the streamlines in both the AR = 1 and AR = 2 volutes show deviations from ideal flow through the volute. The variation in radial velocity over the cross section is also evident in all cases with the velocity around the volute walls noticeably greater due to the Dean effect. In the AR = 0.5 case, the reduced volute width results in a greater shear between the wall and bulk passage flow and hence strong vortices develop. It should also be noted that increasing the volute AR also increases the wall curvature. Therefore, the flow close to the walls in the AR = 0.5 case is predominantly radial, whereas the wall flow in the AR = 2 case is only radial at the volute center, beyond this the flow turns axially with the passage walls. The change in wall velocity components can be expected to affect secondary flow development as well as vortex shape and orientation. The effect of this can be seen in the relative orientation of the vortices in the AR = 1 and AR = 0.5 cases. In the former, vortices are positioned at a tangent to the local wall curvature (approximately 40° from the vertical). In the latter, the vortices are orientated radially due to the reduced wall curvature.
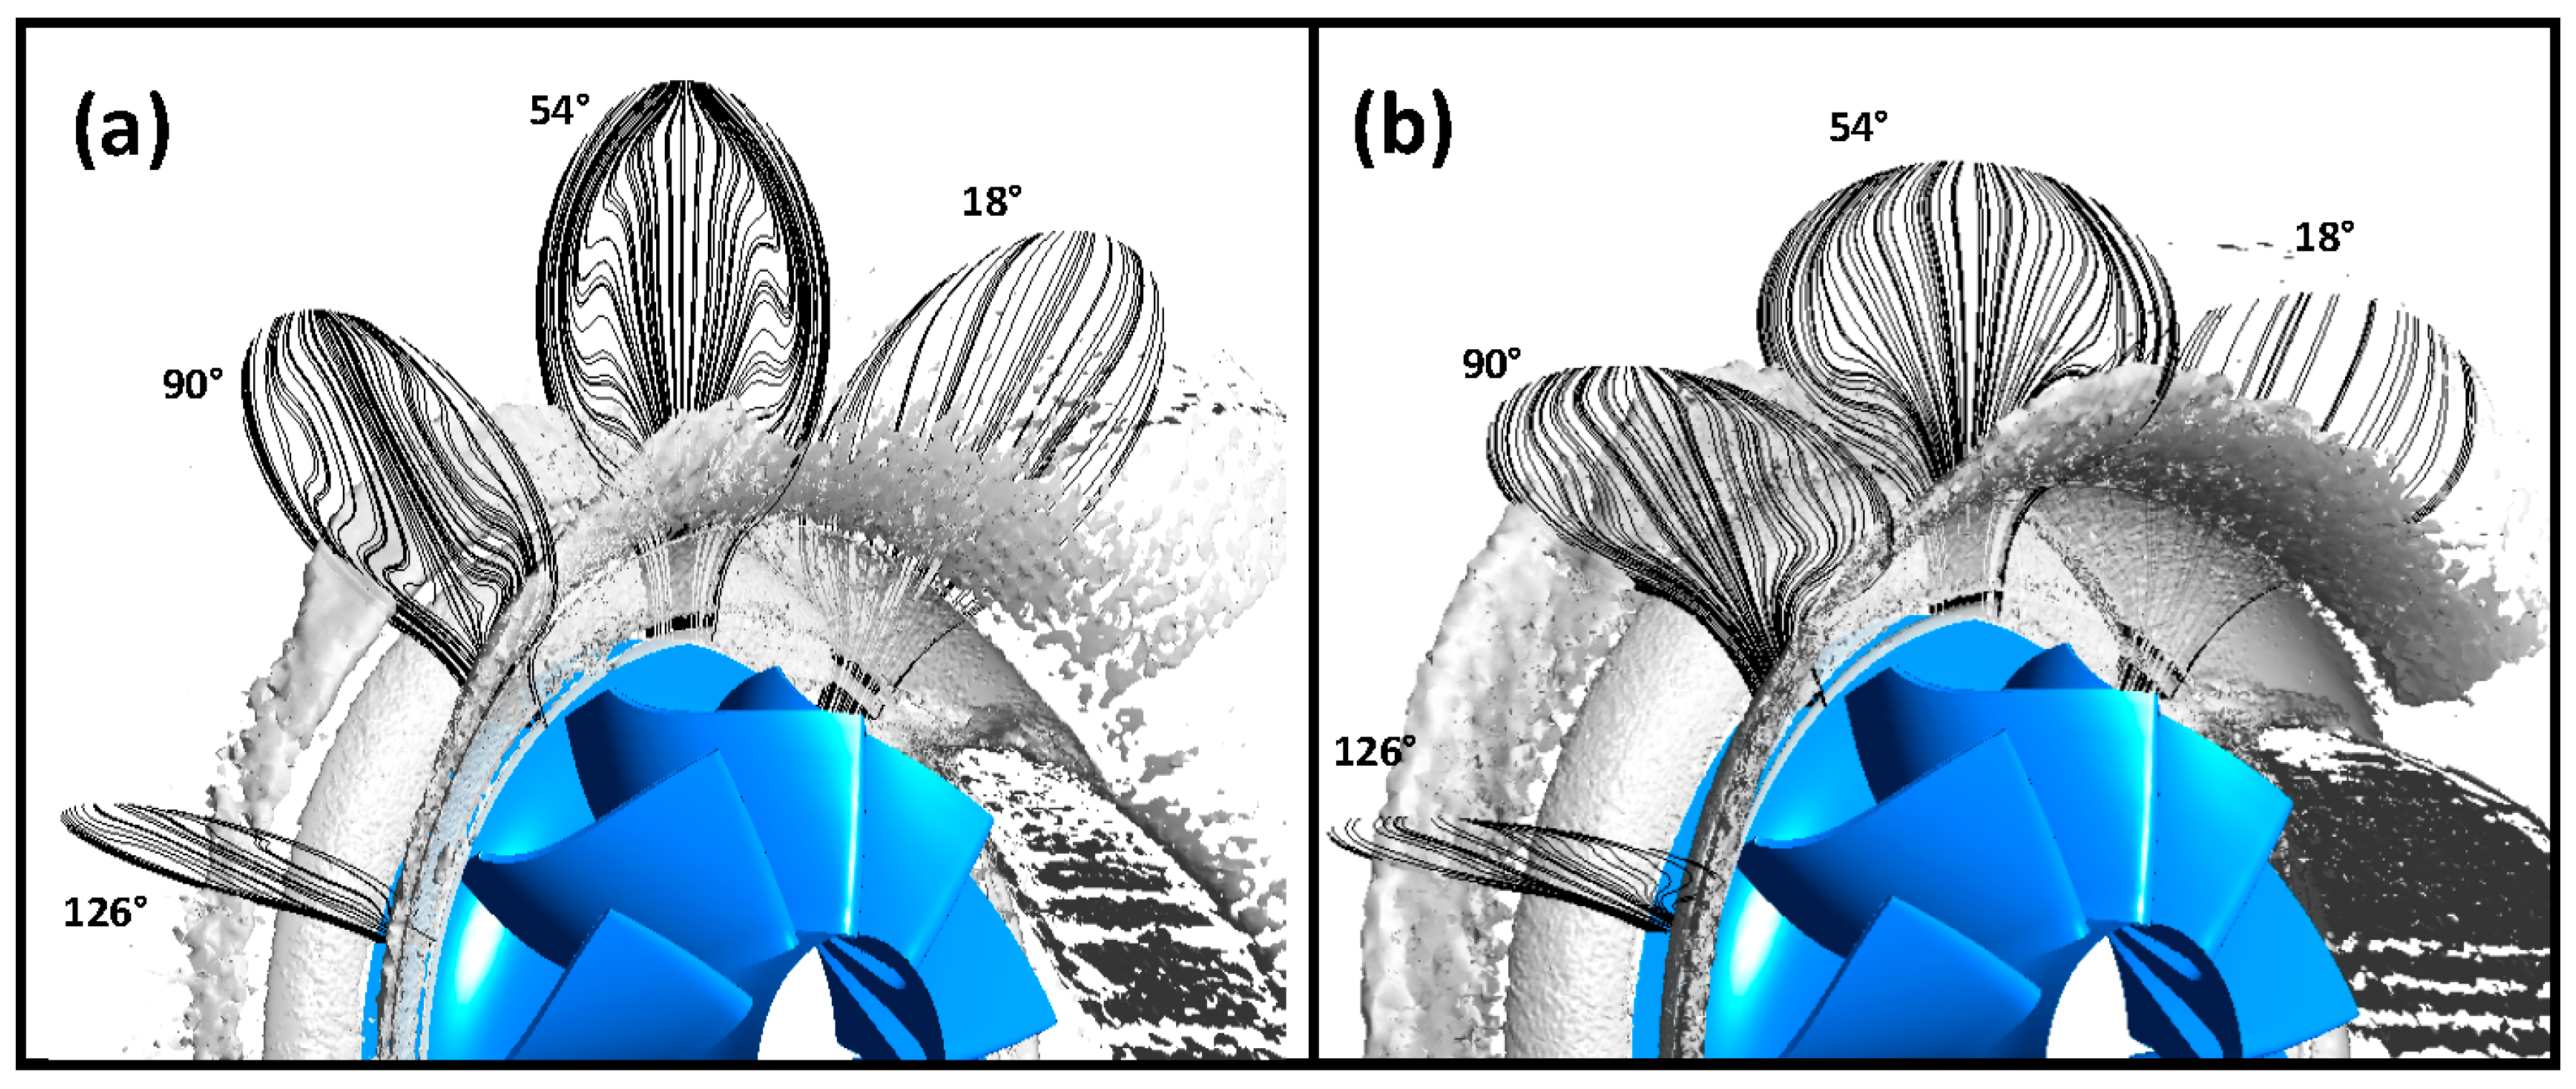
The development of the vortex core present in the housing of aspect ratio 0.5 is presented in Figure 18 using the lambda 2 criterion. This parameter shows the development of a vortex core and was used by Hellstrom and Fuchs [20] to show the development of vortices in the exhaust manifold ahead of a radial turbine. In the AR = 0.5 volute, particularly at the maximum velocity ratio running point, a clear vortex core can be seen to develop in Figure 18a. The planes depicting streamlines are labeled with their angle from the volute tongue. The vortex region starts at around the 54° position where the streamlines show strong secondary flows. With increasing azimuth angle, the vortex cores move radially inwards towards the rotor LE and in towards the passage center. Just beyond 126° the vortex core no longer exists. At the maximum incidence running point shown in Figure 18b, the vortex core is much less distinct. Although vorticity exists in the same area of the volute, no clear core is established. The streamlines also show a large reduction in vortex size.
Figure 19 shows the lack of clear vortex development in the AR = 1 and AR = 2 volutes at minimum incidence. In both cases, high levels of vorticity only exist close to the volute walls.
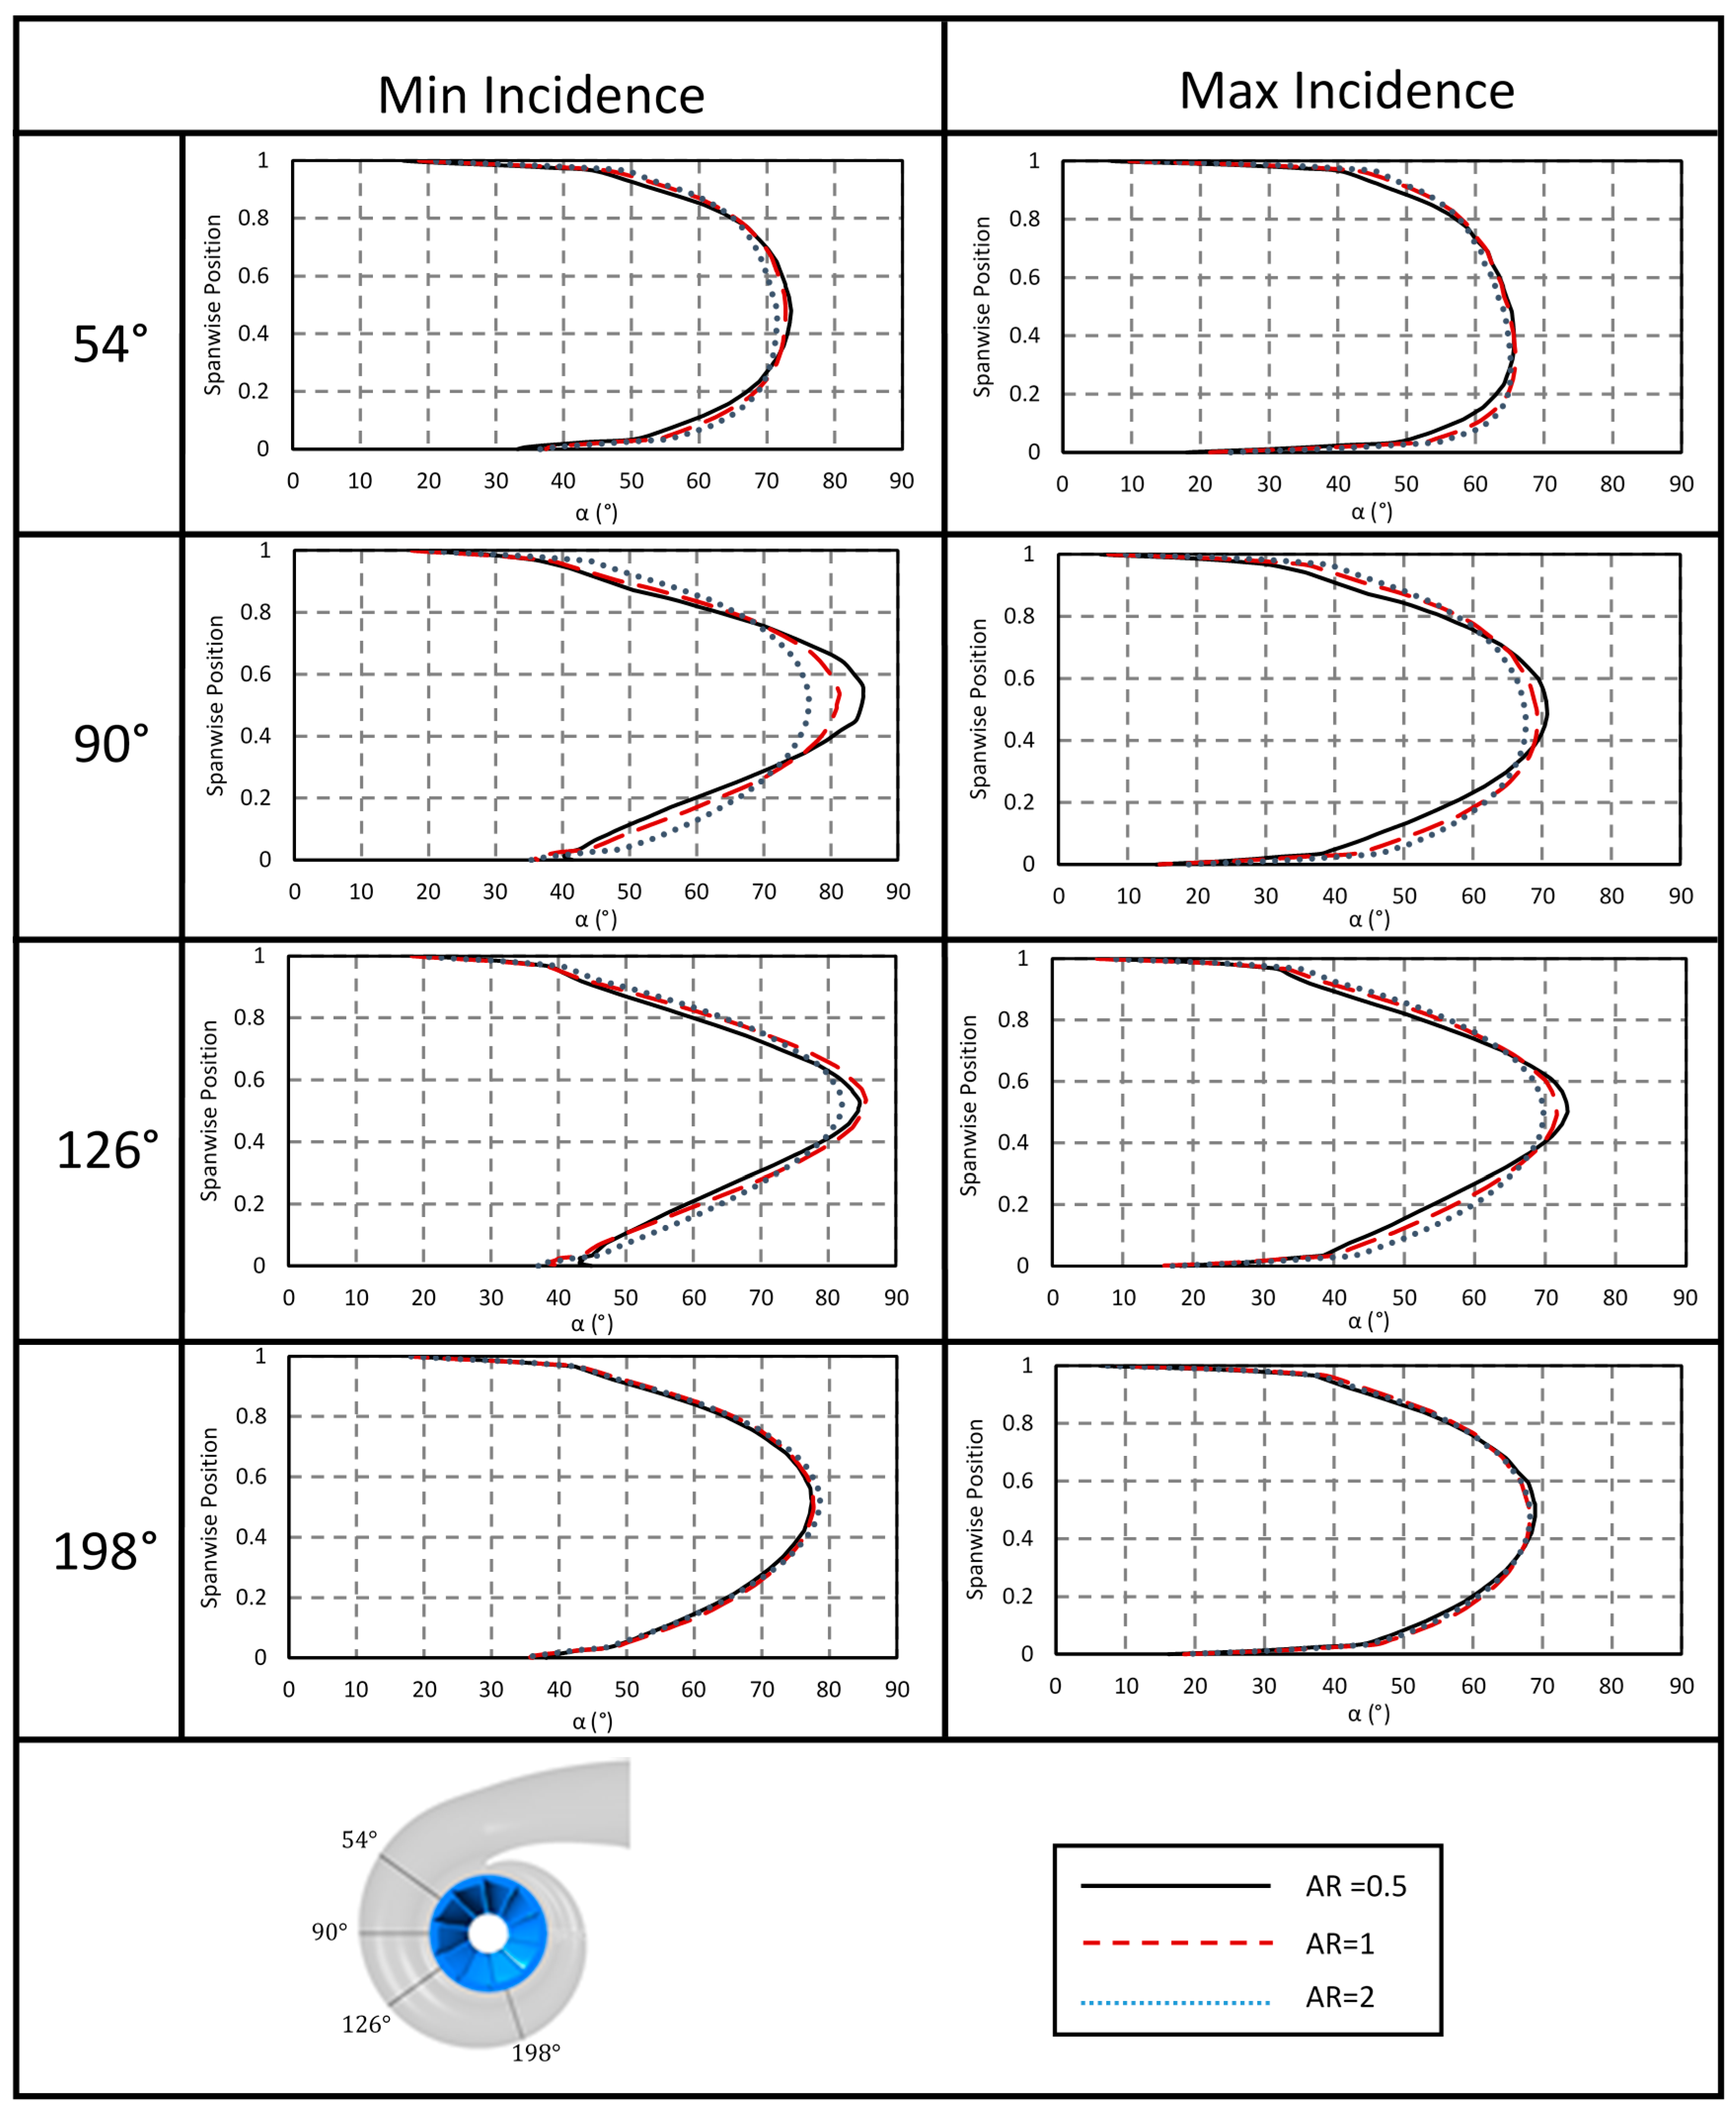
The spanwise distribution of absolute flow angle at the volute exit is presented in Figure 20 for each of the volute aspect ratios at the 54°, 90°, 126° and 162° positions at both minimum and maximum incidence running points. The distance across the span of the volute exit has been normalized with the wheel hub being defined as the start of the span. The first observation to be made is that the spanwise variation in absolute flow angle at the exit of the volute is significant at all azimuth angles presented in all designs. Secondly, the spanwise variation is greater at the minimum incidence running points, hence at the peak energy running points the variation in exit flow absolute angle over the span reduces. The vortex development at maximum incidence is also reduced as shown in Figure 18b for the AR = 0.5 design. Figure 20 also shows significant circumferential variation, with the absolute flow angle range peaking between the 90° and 126° positions reaching angles up to 85°. This position coincides with the angle at which the vortex core is close to the volute exit as shown in Figure 18. At these two angular positions, variation in the three designs can be observed, which is greatest at the 90° plane at minimum incidence. The variation at this point reaches approximately 8.5°. Beyond this position the variation reduces with all the housing designs resulting in similar distributions at the 162° plane. This very similar spanwise distribution for the three designs continues around the remainder of the volute.
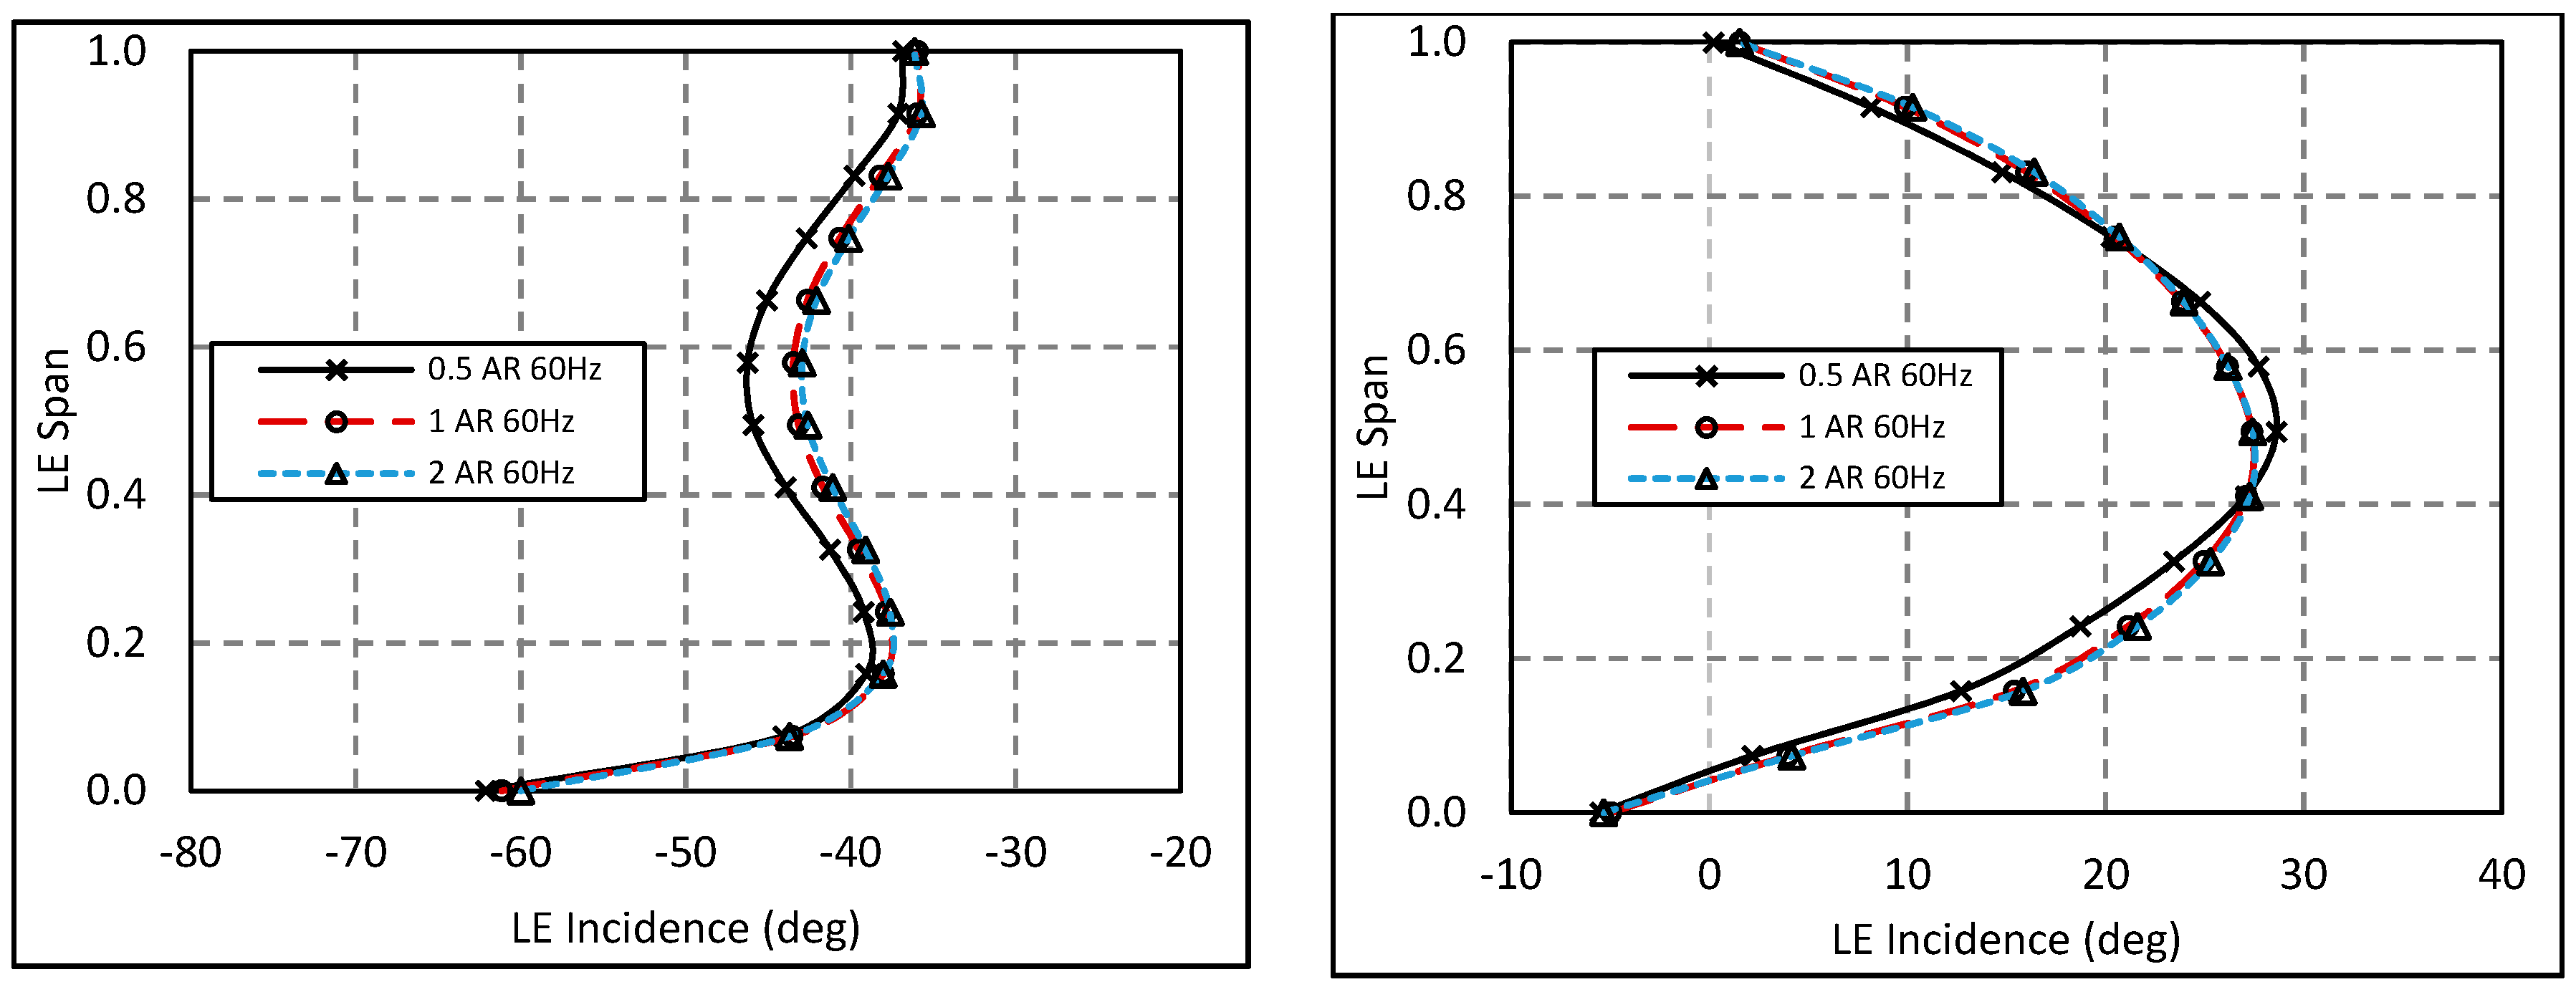
The impact of volute exit variation on circumferentially averaged rotor LE incidence is presented in Figure 21, Figure 22 and Figure 23 at both the minimum and maximum incidence points of the pulse. The incidence is calculated from the circumferentially mass averaged velocities at the LE. This is therefore the variation in incidence averaged around the rotor inlet and not at specific positions as shown in Figure 20.
At minimum incidence, the lowest flow angles are achieved at the rotor hub, increasing to a maximum between 15% and 20% span. Incidence reaches a local minima at the span center in the 60 Hz case, 60% span in the 40 Hz case and 70% in the 20 Hz case, before increasing again to a maximum at the shroud side. With increasing pulse frequency, a greater variation between the volute aspect ratio designs can be observed. In the 60 Hz case a variation of approximately 4° in incidence was observed at the passage center between the AR = 0.5 and the other two larger aspect ratio designs which show very similar incidence distributions at all frequencies. The notable variation in incidence between the frequencies can be attributed to the considerably different maximum rotor velocity ratio achieved under each tested pulse as shown in Figure 13.
At the maximum incidence point, a distribution with a parabolic shape is formed at all pulse frequencies with the maximum incidence achieved in the center of the LE. Between the tested frequencies, the distribution shows little variation; only under the 60 Hz pulse does the peak incidence achieved show a slight reduction. It was observed that the AR = 0.5 volute design consistently results in an increase in maximum incidence measured at the LE center of approximately 2°. Away from the center of the LE, the AR = 0.5 design achieved lower incidence angles by up to 3° when compared to the AR = 1 and AR = 2 designs which show very similar distribution at maximum incidence under all pulse frequencies. This variation in LE incidence results in a greater range of incidence in the AR = 0.5 case. However, the averaged incidence measure varies by less than 0.9° at all frequencies.
It should be noted that the change in LE axial flow component between the aspect ratio designs was negligible. Therefore, the change in incidence angle observed was not a result of changing blade angle but the result of relative flow angle variation.
5. Conclusions
Comparing the rotor efficiencies at different points within the pulse showed that the performance at the highest velocity ratio is impacted more significantly than that at minimum velocity ratios. However, at the high velocity ratio running points less pulse energy is available and therefore the cycle average performance sees a smaller improvement.
Analysis of the secondary flow structures shows interesting interactions of the central and wall bound flows. The result is the development of a strong vortex core in the smallest aspect ratio design. The process that results in such secondary flow structures developing is also taken to be the cause of the significant spanwise variation observed in all designs. While the vortices are not present in all volutes the spanwise variation persists although a small reduction is observed. While [12] stated that the volute passage contains one or more vortex, this work has shown, for a symmetrical volute design, that increasing the volute aspect removes vortex development completely.
The result of the study shows that volute aspect ratio can significantly impact the MFP of the stage with a variation of 4.3% observed when A/r was kept constant. However, aspect ratio was found to do little to improve the spanwise incidence distribution over the blade LE. The resulting change in stage efficiency observed was also small (1.47%) between the three designs. From a design perspective, this is an important result as it allows more freedom to designers to achieve package constraints, without a significant loss in stage efficiency as long as the housing is resized to ensure constant MFP. The limited effect of volute AR on the spanwise incidence distribution shows that even reducing volute secondary flows within the volute cannot reduce the severity of this variation. Alternatively, incorporating such spanwise variation in to the rotor design process could yield new spanwise blade distributions and further performance benefits.
Acknowledgments
The project is sponsored and supported by BorgWarner Turbo Systems and the Regional Growth Fund (RGF Grant Award 01.09.07.01/1789C).
Author Contributions
All authors contributed equally to execution and analysis of the work. Samuel P. Lee wrote this manuscript with the guidance of all other named authors.
Conflicts of Interest
The authors declare no conflict of interest.
Nomenclature
| AR | Aspect Ratio |
| A/r | Area Radius Ratio |
| Dean Number | |
| Absolute Velocity | |
| CFD | Computational Fluid Dynamics |
| d | Diameter |
| LE | Leading Edge |
| LES | Large Eddy Simulation |
| MFP | Mass Flow Parameter |
| Mass Flow | |
| Mass Flow Pulsation Number | |
| PR | Pressure Ratio |
| PS | Pressure Surface |
| Radius of Curvature | |
| Reynolds Number Based on Diameter | |
| SAS | Scaled Adaptive Simulation |
| SST | Shear Stress Transport |
| SS | Suction Surface |
| TE | Trailing Edge |
| Bulk Pipe Velocity | |
| Blade Speed | |
| Velocity Ratio | |
| URANS | Unsteady Reynolds Averaged Navier Stokes |
| Relative Velocity | |
| Greek Letters | |
| Relative Flow Angle | |
| Blade Angle | |
| Flow Cone Angle | |
| Blade Cone Angle | |
| Blade Camber Angle | |
| Density | |
| Dynamic Viscosity | |
| Subscripts | |
| T-T | Total to Total Pressure |
| T-s | Total to Static Pressure |
References
- Rajoo, S.; Martines-Botas, R. Mixed Flow Turbine Research: A Review. J. Turbomach. 2008, 130, 044001. [Google Scholar] [CrossRef]
- Abidat, M.; Hachemi, M.; Hamidou, M.K.; Baines, N.C. Predictions of the Steady and Non-Steady Performance of a Highly Loaded Mixed Flow Turbine; Institue of Mechanical Engineers: Westminster, UK, 1998. [Google Scholar]
- Karamanis, N.; Martinez-Botas, R.; Su, C. Mixed flow turbines: Inlet and exit flow under steady and pulsating conditions. J. Turbomach. 2001, 123, 359–371. [Google Scholar] [CrossRef]
- Palfreyman, D.; Martinez-Botas, R. The pulsating flow field in a mixed flow turbocharger turbine: An experimental and computational study. ASME J. Turbomach. 2004, 697–708. [Google Scholar] [CrossRef]
- Abidat, M.; Baines, N.; Firth, M. Design of a highly loaded mixed flow turbine. Proc. Inst. Mech. Eng. Part A J. Power Energy 1992, 206, 95–107. [Google Scholar] [CrossRef]
- Palfreyman, D.; Martinez-Botas, R. Numerical Study of the Internal Flow Field Characteristics in Mixed Flow Turbines; ASME: New York, NY, USA, 2002. [Google Scholar]
- Japikse, D.; Baines, N.C. Introduction to Turbomachinery; Oxford University Press: Oxford, UK, 1994. [Google Scholar]
- Morrison, R.; Spence, S.; Kim, S.; Filsinger, D.; Leonard, T. Investigation of the effects of flow conditions at rotor inlet on mixed flow turbine performance for automotive applications. In Proceedings of the International Turbocharging Seminar, Tianjin, China, 21–22 September 2016. [Google Scholar]
- Yang, M.; Martinez-Botas, R.; Rajoo, S.; Yokoyama, T.; Ibaraki, S. An investigation of volute cross-sectional shape on turbocharger turbine under pulsating conditions in internal combustion engine. Energy Convers. Manag. 2015, 105, 167–177. [Google Scholar] [CrossRef]
- Meghnine, M.A.; Hamidou, M.K.; Hamel, M. Influence of the volute cross-sectional shape on mixed inflow turbine performances. Adv. Mech. Eng. 2017, 9. [Google Scholar] [CrossRef]
- Yang, M.; Martinez-Botas, R.; Rajoo, S.; Yokoyama, T.; Ibaraki, S. Influence of Volute Cross-Sectional Shape of a Nozzleless Turbocharger under Pulsating Flow Condition. In Proceedings of the ASME Turbo Expo, Düsseldorf, Germany, 16–20 June 2014. [Google Scholar]
- Cerdoun, M.; Ghenaiet, A. Analyese of flow structures through radial turbine twin-entry volute under pulsatile flows. In Proceedings of the International Conference on Turbocharges and Turbocharging, London, UK, 17–18 May 2016; Institution of Mechanical Engineers: Westminster, UK, 2016. [Google Scholar]
- Lee, S.; Jupp, M.; Nickson, A. The influence of secondary flow structures in a turbocharger turbine housing in steady state and pulsating flow conditions. In Proceedings of the 2016 7th International Conference on Mechanical and Aerospace Engineering (ICMAE), London, UK, 18–22 July 2016; IEEE: Piscataway, NJ, USA, 2016. [Google Scholar]
- Galindo, J.; Hoyas, S.; Fajardo, P.; Navarro, R. Set-Up Analysis and Optimisation of CFD Simulations for Radial Turbines. Eng. Appl. Comput. Fluid Mech. 2013, 7, 441–460. [Google Scholar]
- ANSYS Workbench; ANSYS17.0; ANSYS, Inc.: Canonburg, PA, USA, 2017.
- Roclawski, H.; Gugau, M.; Langecker, F.; Böhle, M. Influence of Degree of Reaction on Turbine Performance for Pulsating Flow Conditions. In Proceedings of the ASME Turbo Expo 2014: Turbine Technical Conference and Exposition, Düsseldorf, Germany, 16–20 June 2014; American Society of Mechanical Engineers: New York, NY, USA, 2014. [Google Scholar]
- Yang, M.; Martinez-Botas, R.; Srithar, R.; Ibaraki, S.; Yokoyama, T.; Deng, K. Unsteady Behaviours of a Volute in Turbocharger Turbine under Pulsating Conditions. In Proceedings of the Global Power and Propulsion Forum, Zurich, Switzerland, 16–18 January 2017. [Google Scholar]
- Cerdoun, M.; Ghenaiet, A. Analyses of steady and unsteady flows in a turbocharger’s radial turbine. Proc. Inst. Mech. Eng. Part E J. Process Mech. Eng. 2015, 229, 130–145. [Google Scholar] [CrossRef]
- Yang, B.; Newton, P.; Martinez-Botas, R. Unsteady Evolution of Secondary Flows in A Mixed Turbine. In Proceedings of the Global Power and Propulsion Forum, Zurich, Switzerland, 16–18 January 2017. [Google Scholar]
- Hellstrom, F.; Fuchs, L. Numerical Computation of the Pulsatile Flow in a Turbocharger with Realistic Inflow Conditions from an Exhaust Manifold; ASME: New York, NY, USA, 2009. [Google Scholar]
- Menter, F.; Egorov, Y. A Scale-Adaptive Simulation Model Using Two-Equation Models. In Proceedings of the 43rd AIAA Aerospace Sciences Meeting and Exhibit, Reno, NV, USA, 10–13 January 2005. [Google Scholar]
- Simpson, A.T.; Spence, S.; Watterson, J.K. A comparison of the flow structures and losses within vaned and vaneless stators for radial turbines. J. Turbomach. 2009, 131, 031010. [Google Scholar] [CrossRef]
- Zimmermann, R.; Baar, R.; Enghardt, L.; Hakensson, S. Investigation on Pulsating Turbine Flow Radial Turbines. In Proceedings of the Aachen Colloquium Automobile and Engine Technology, Aachen, Germany, 5–7 October 2015. [Google Scholar]
- Newton, P.J. An Experimental and Computational Study of Pulsating Flow within a Double Entry Turbine with Different Nozzle Settings. Ph.D. Thesis, Imperial College London, London, UK, 2014. [Google Scholar]
- Lee, S.P.; Jupp, M.L.; Nickson, A.K.; Allport, J.M. Analysis of a tilted turbine housing volute design under pulsating inlet conditions. In Proceedings of the ASME Turbo Expo 2017: Turbomachinery Technical Conference and Exposition, Charlotte, NC, USA, 26–30 June 2017; American Society of Mechanical Engineers: New York, NY, USA, 2017. [Google Scholar]
- Dean, W.R. Note on the motion of fluid in a curved pipe. Lond. Edinb. Dubl. Phil. Mag. 1927, 4, 208–223. [Google Scholar] [CrossRef]
- Dean, W.R. The stream-line motion of fluid in a curved pipe (Second paper). Lond. Edinb. Dubl. Phil. Mag. 1928, 5, 673–695. [Google Scholar] [CrossRef]
- Kalpakli Vester, A. Vortices in Turbulent Curved Pipe Flow-Rocking, Rolling and Pulsating Motions; KTH Royal Institute of Technology: Stockholm, Sweden, 2014. [Google Scholar]
Figure 1.
Single blade shown on rotor hub defining flow cone angle (λflow) and blade cone angle () (left); blade camber angle () (center) and blade angle () (right).
Figure 1.
Single blade shown on rotor hub defining flow cone angle (λflow) and blade cone angle () (left); blade camber angle () (center) and blade angle () (right).
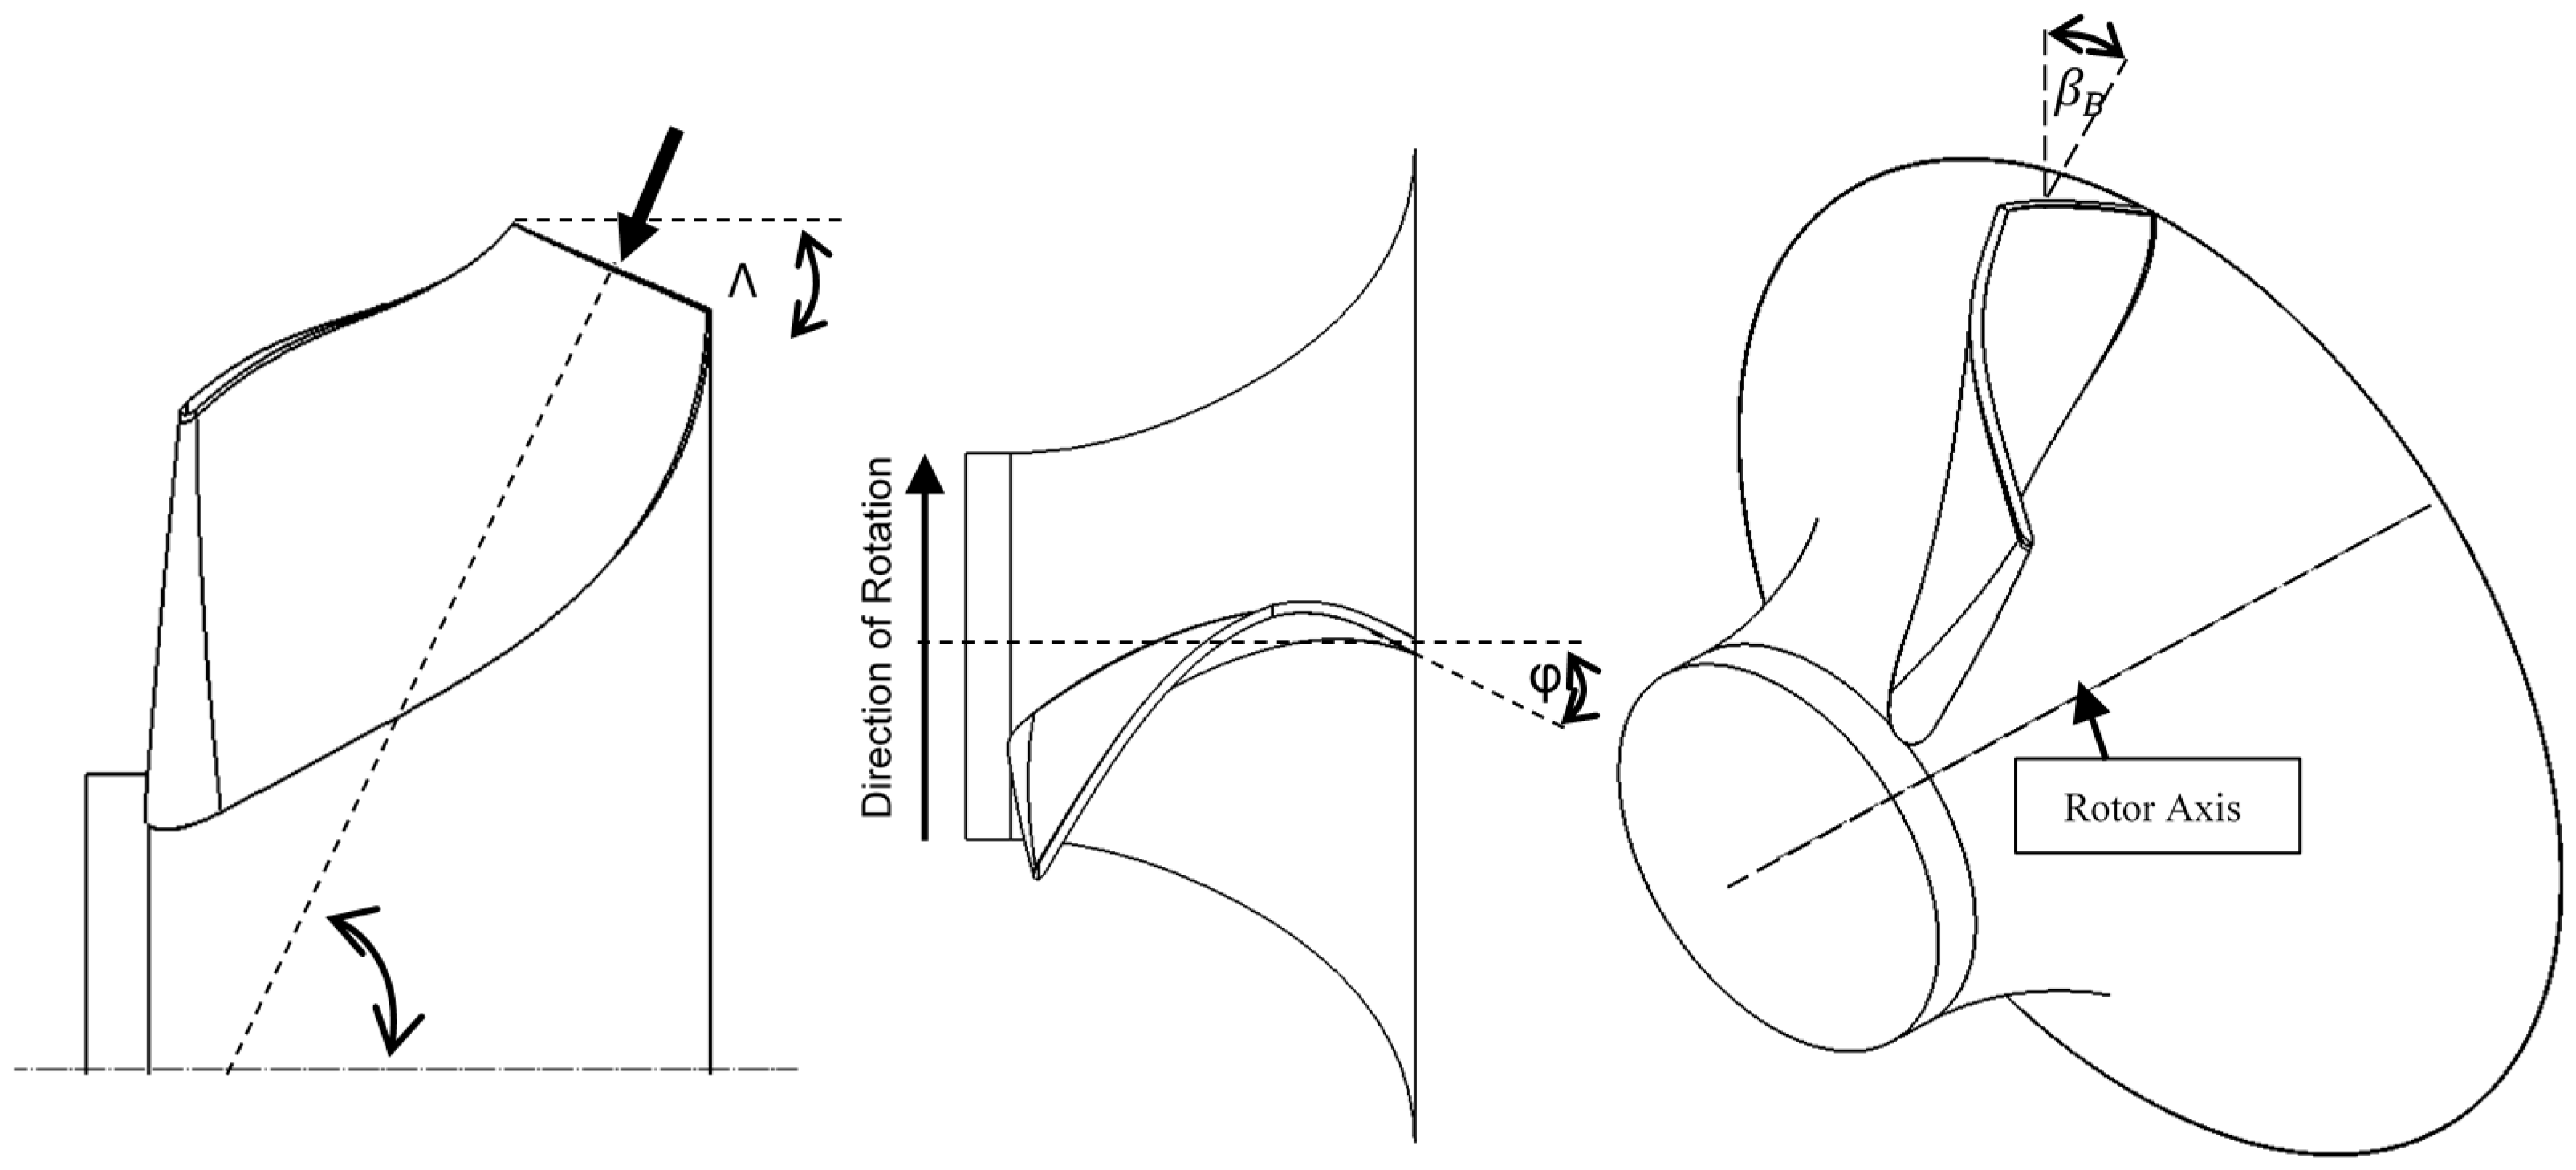
Figure 2.
Rotor inlet velocity triangles under pulsating flow.

Figure 3.
Aspect ratio designs: AR = 0.5, AR = 1 and AR = 2.

Figure 4.
Computational domain set-up.

Figure 5.
Rotor mesh study.
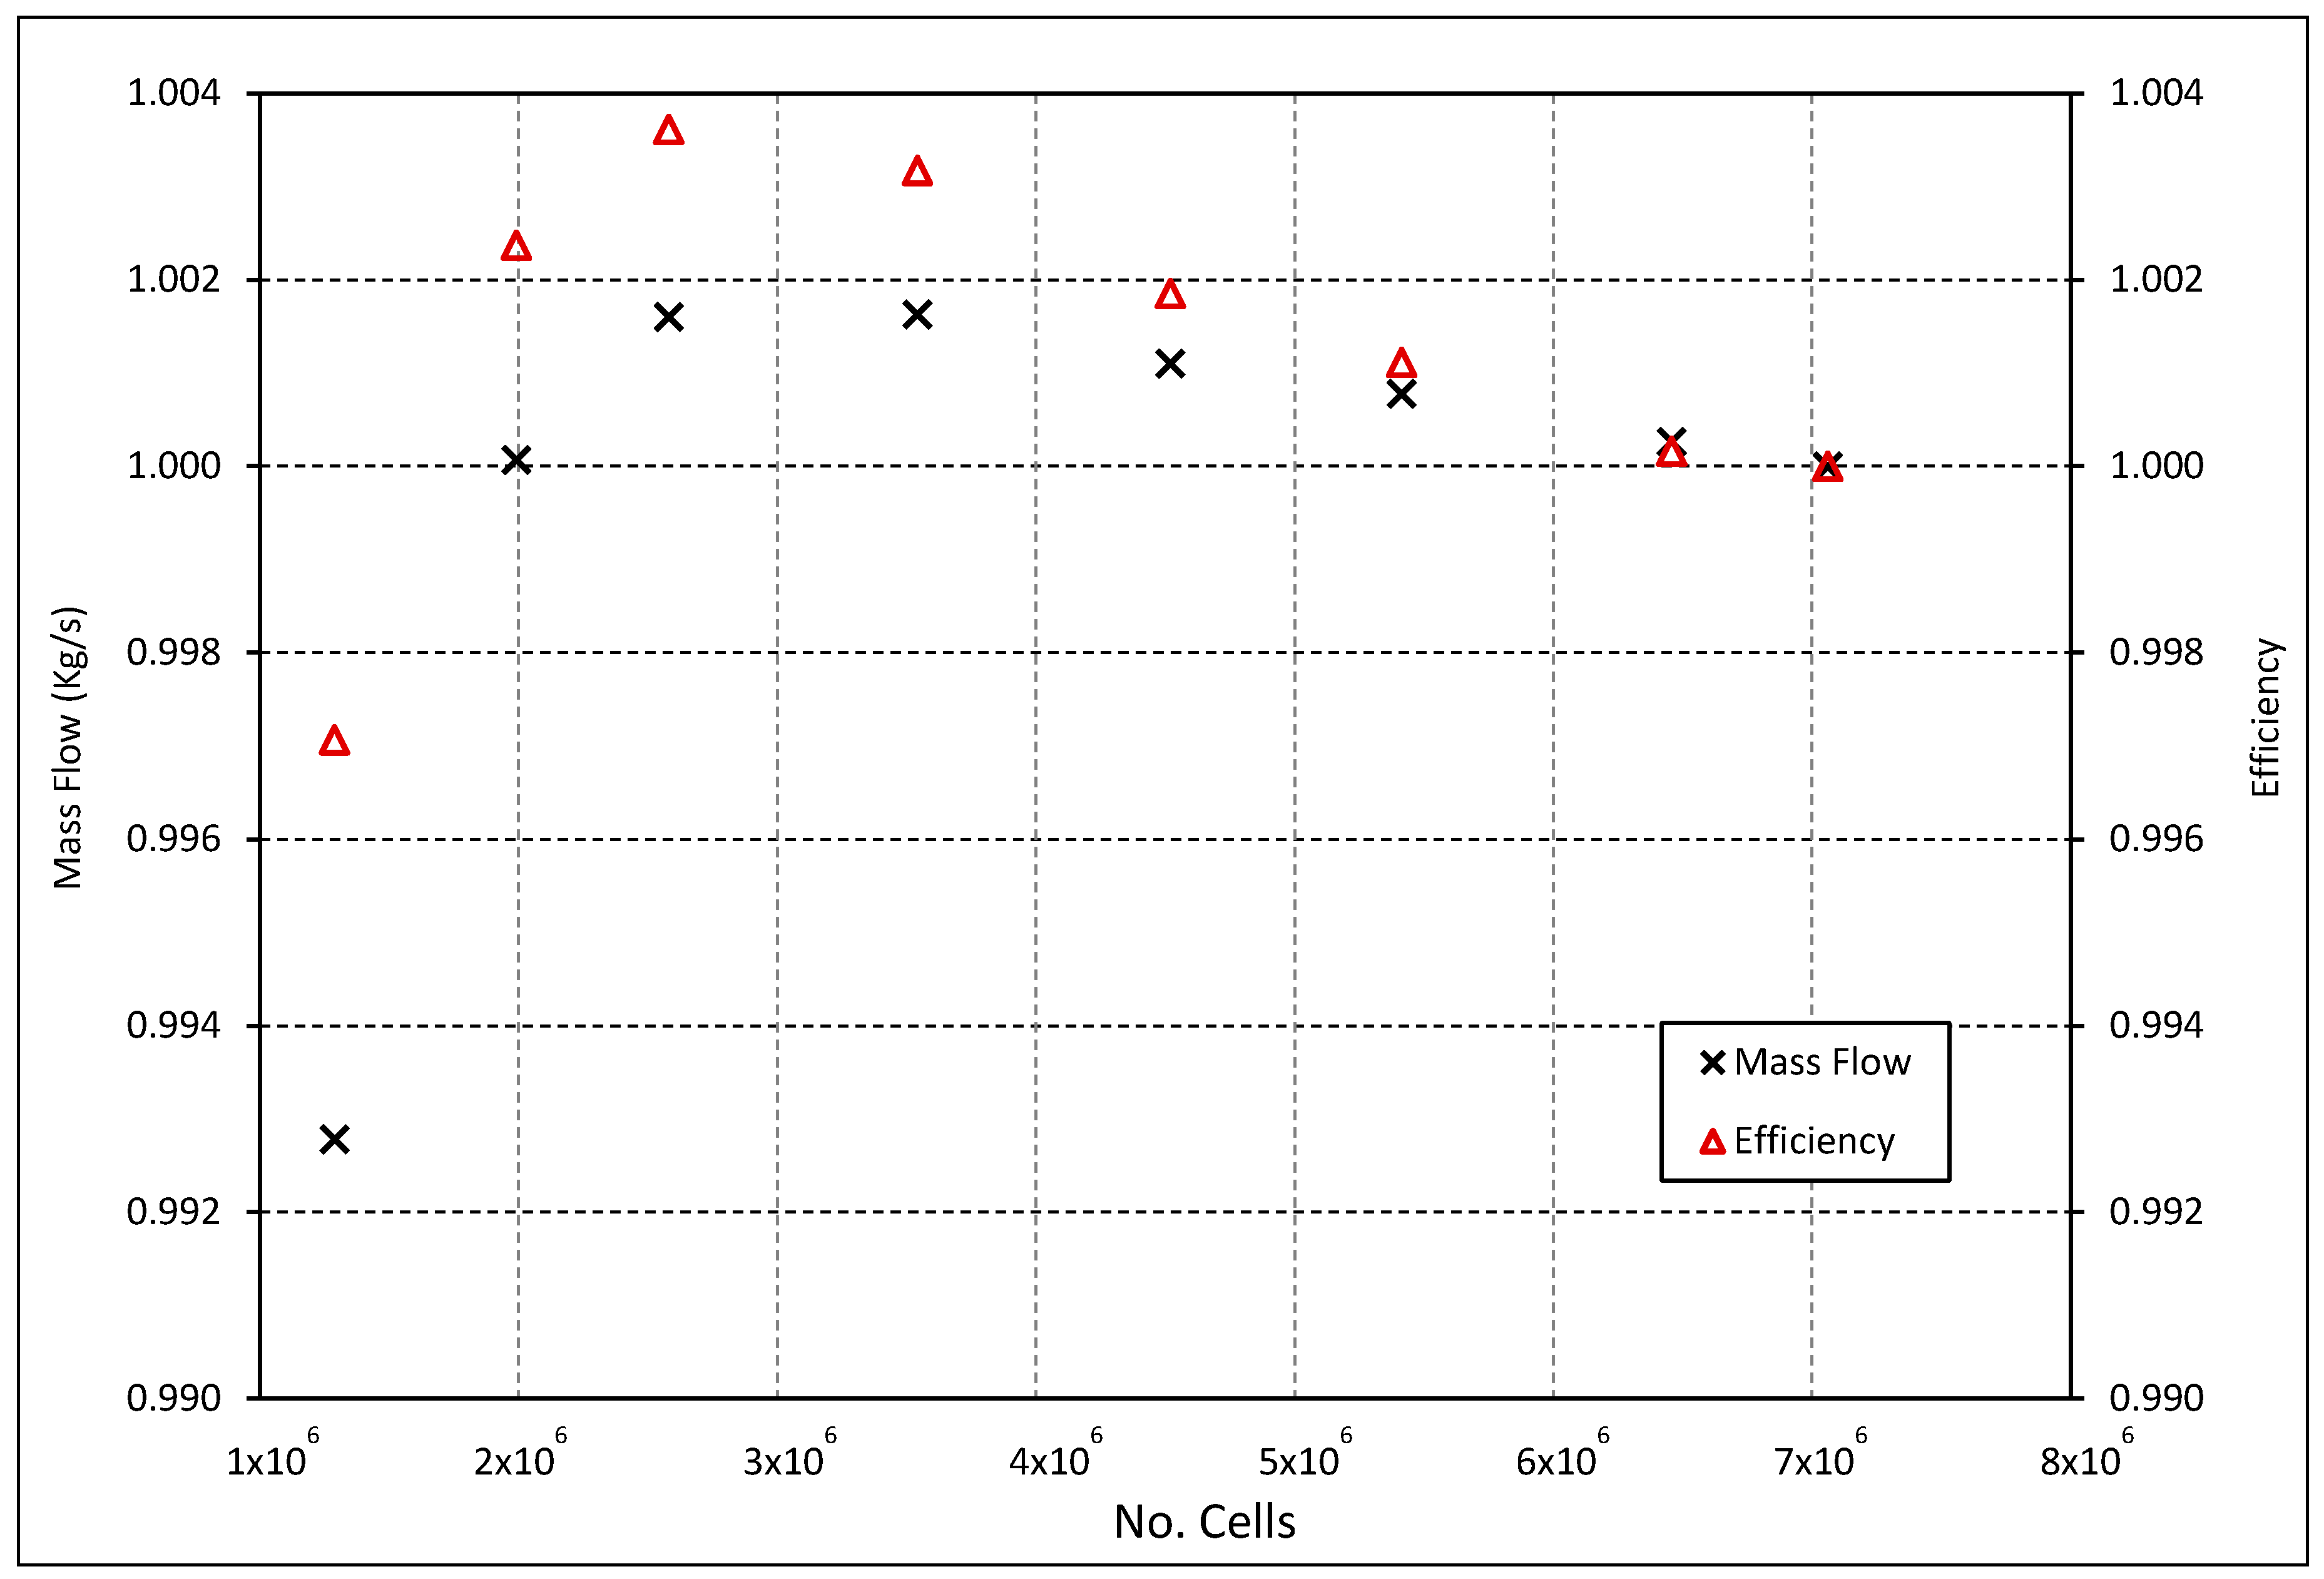
Figure 6.
Volute mesh study.

Figure 7.
Comparison of absolute flow angle at volute exit using the frozen rotor and sliding mesh approaches. (a) 54°; (b) 90°; (c) 126°; (d) 198° and (e) 270°.
Figure 7.
Comparison of absolute flow angle at volute exit using the frozen rotor and sliding mesh approaches. (a) 54°; (b) 90°; (c) 126°; (d) 198° and (e) 270°.

Figure 8.
Comparison of steady state computational and gas stand results. (Left) efficiency (T-s) and (Right) mass flow.
Figure 8.
Comparison of steady state computational and gas stand results. (Left) efficiency (T-s) and (Right) mass flow.

Figure 9.
Mass Flow Parameter (MFP) vs. pressure ratio for volute aspect ratio designs with constant A/r. (a) 20 Hz; (b) 40 Hz and (c) 60 Hz.
Figure 9.
Mass Flow Parameter (MFP) vs. pressure ratio for volute aspect ratio designs with constant A/r. (a) 20 Hz; (b) 40 Hz and (c) 60 Hz.
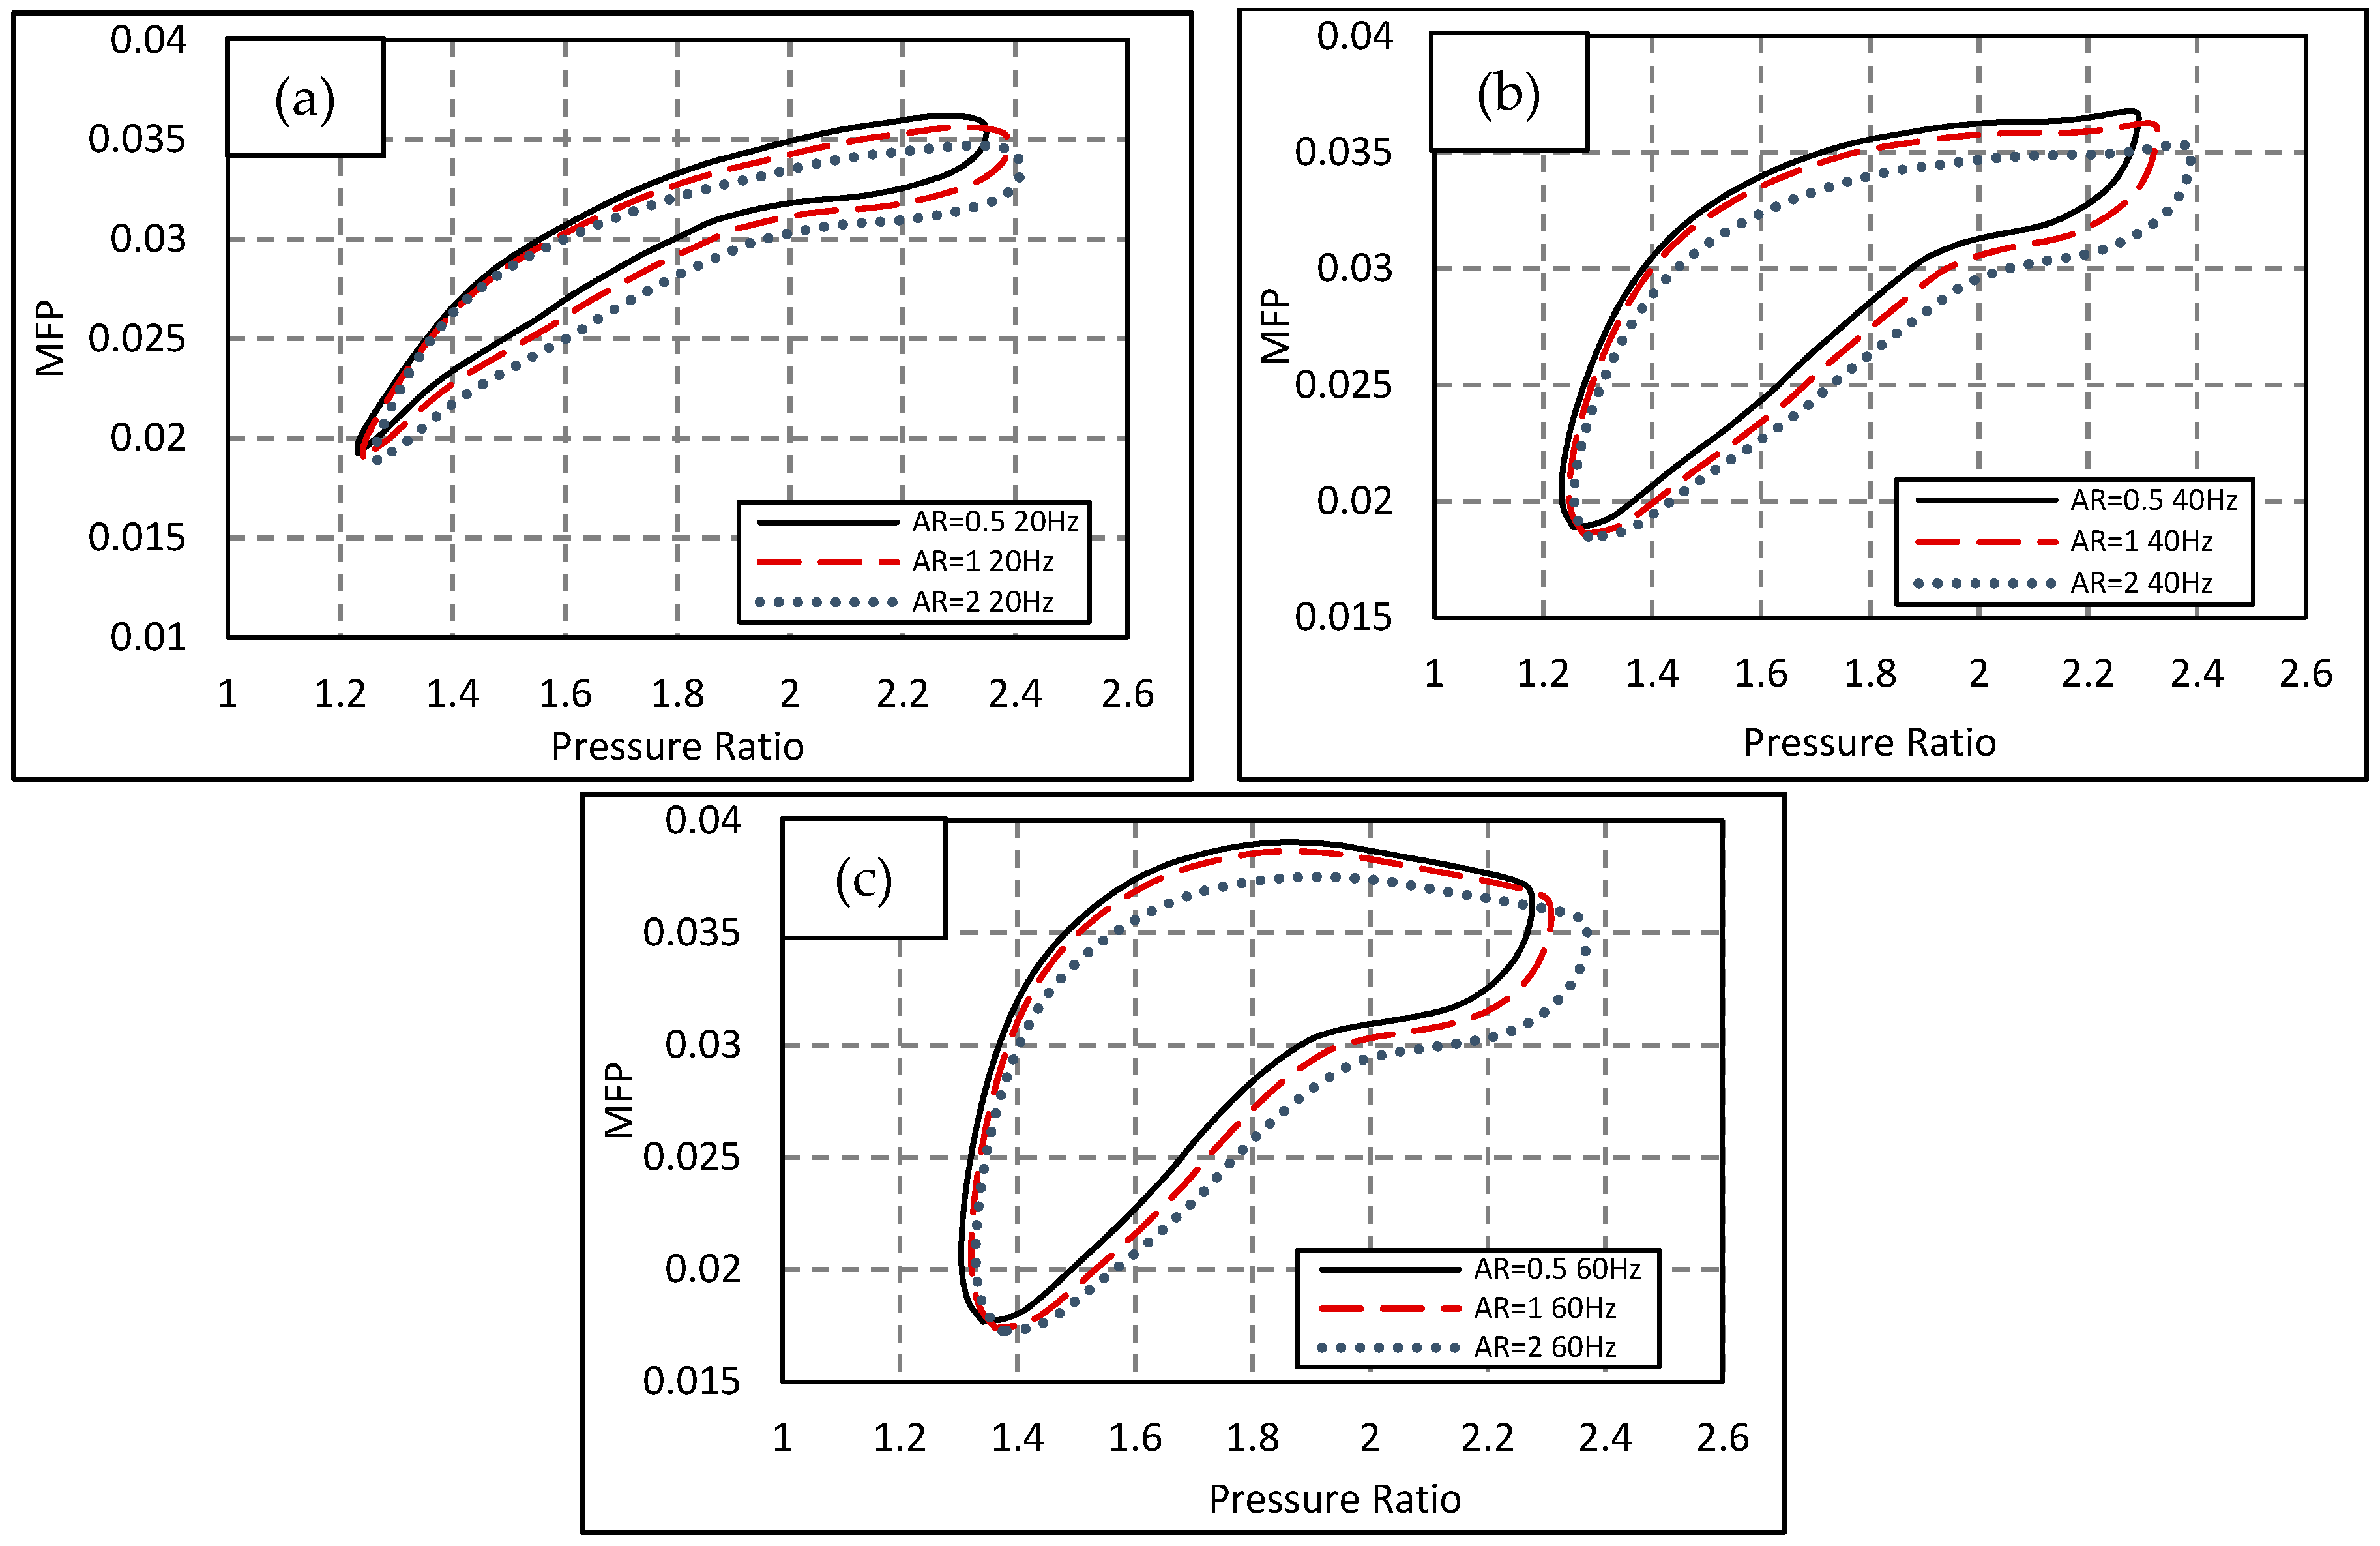
Figure 10.
Variation in leading edge (LE) incidence between designs at constant A/r.

Figure 11.
Volute A/r distributions to match MFP.
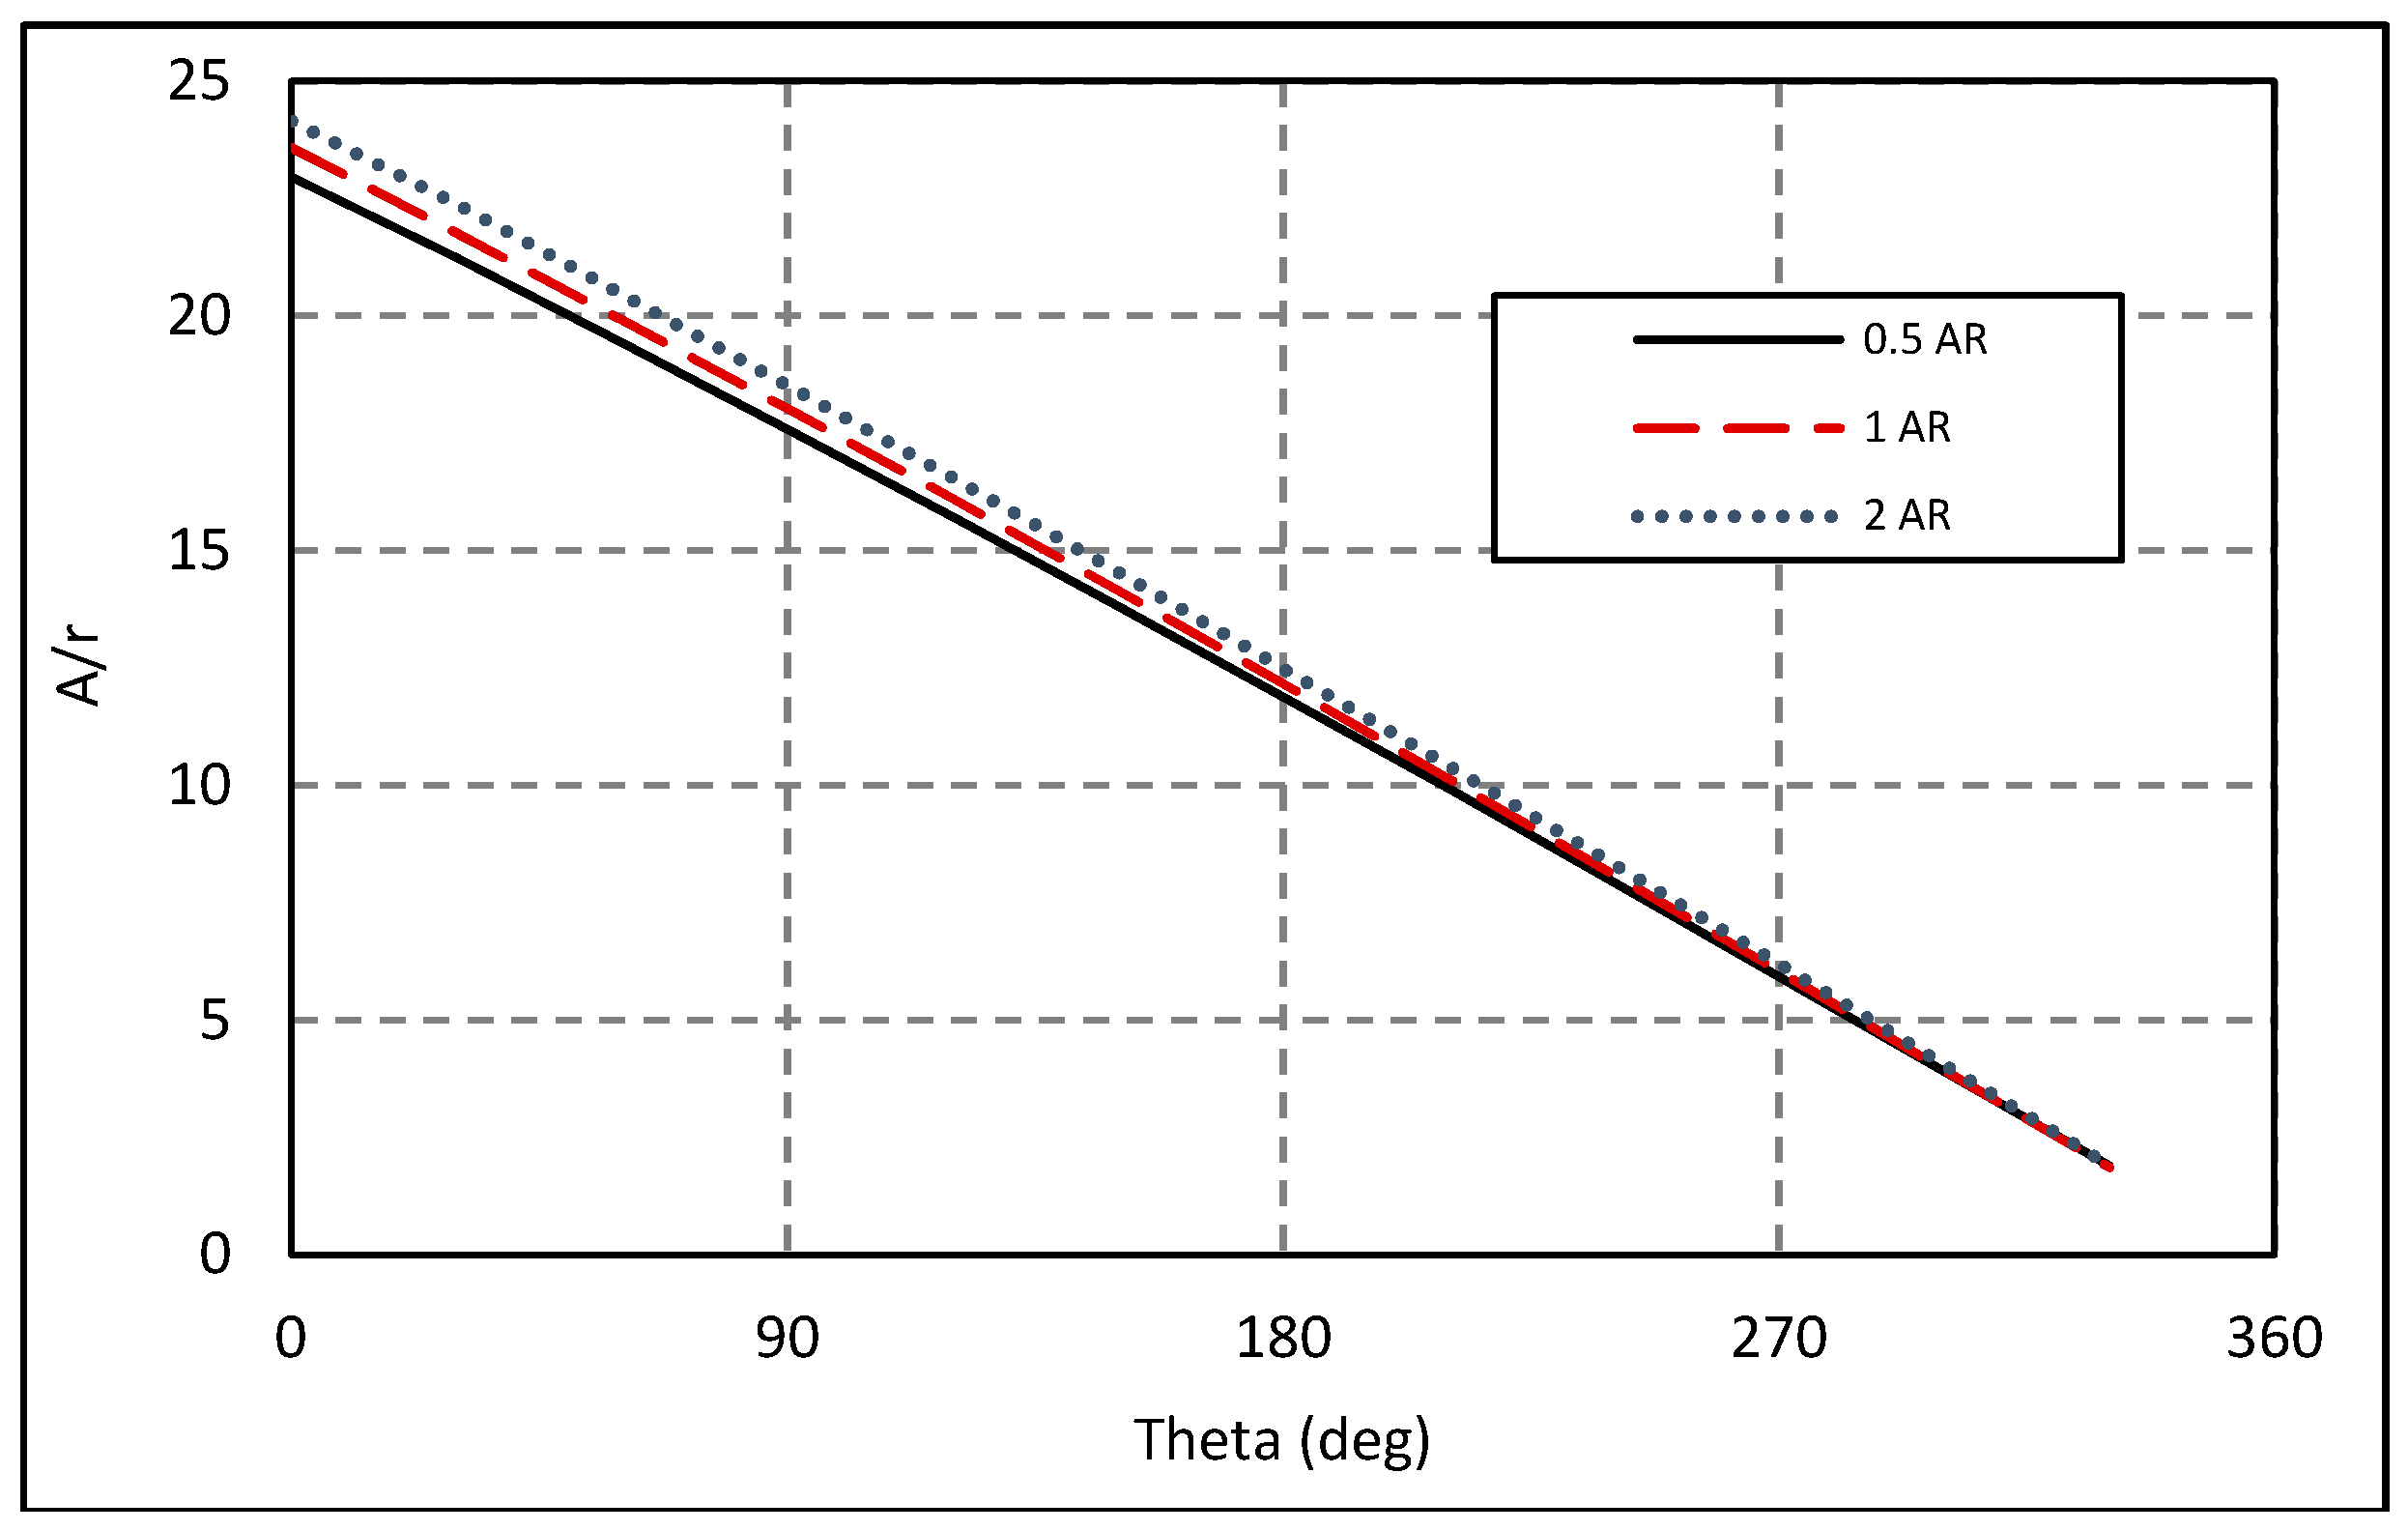
Figure 12.
MFP vs. pressure ratio for each of the volute aspect ratio designs with modified A/r distributions.
Figure 12.
MFP vs. pressure ratio for each of the volute aspect ratio designs with modified A/r distributions.

Figure 13.
Turbine rotor efficiency. (a) 20 Hz; (b) 40 Hz and (c) 60 Hz.

Figure 14.
Breakdown of passage into sections for loss analysis.

Figure 15.
Entropy generation in rotor passage at minimum incidence.

Figure 16.
Entropy generation in rotor passage at maximum incidence.
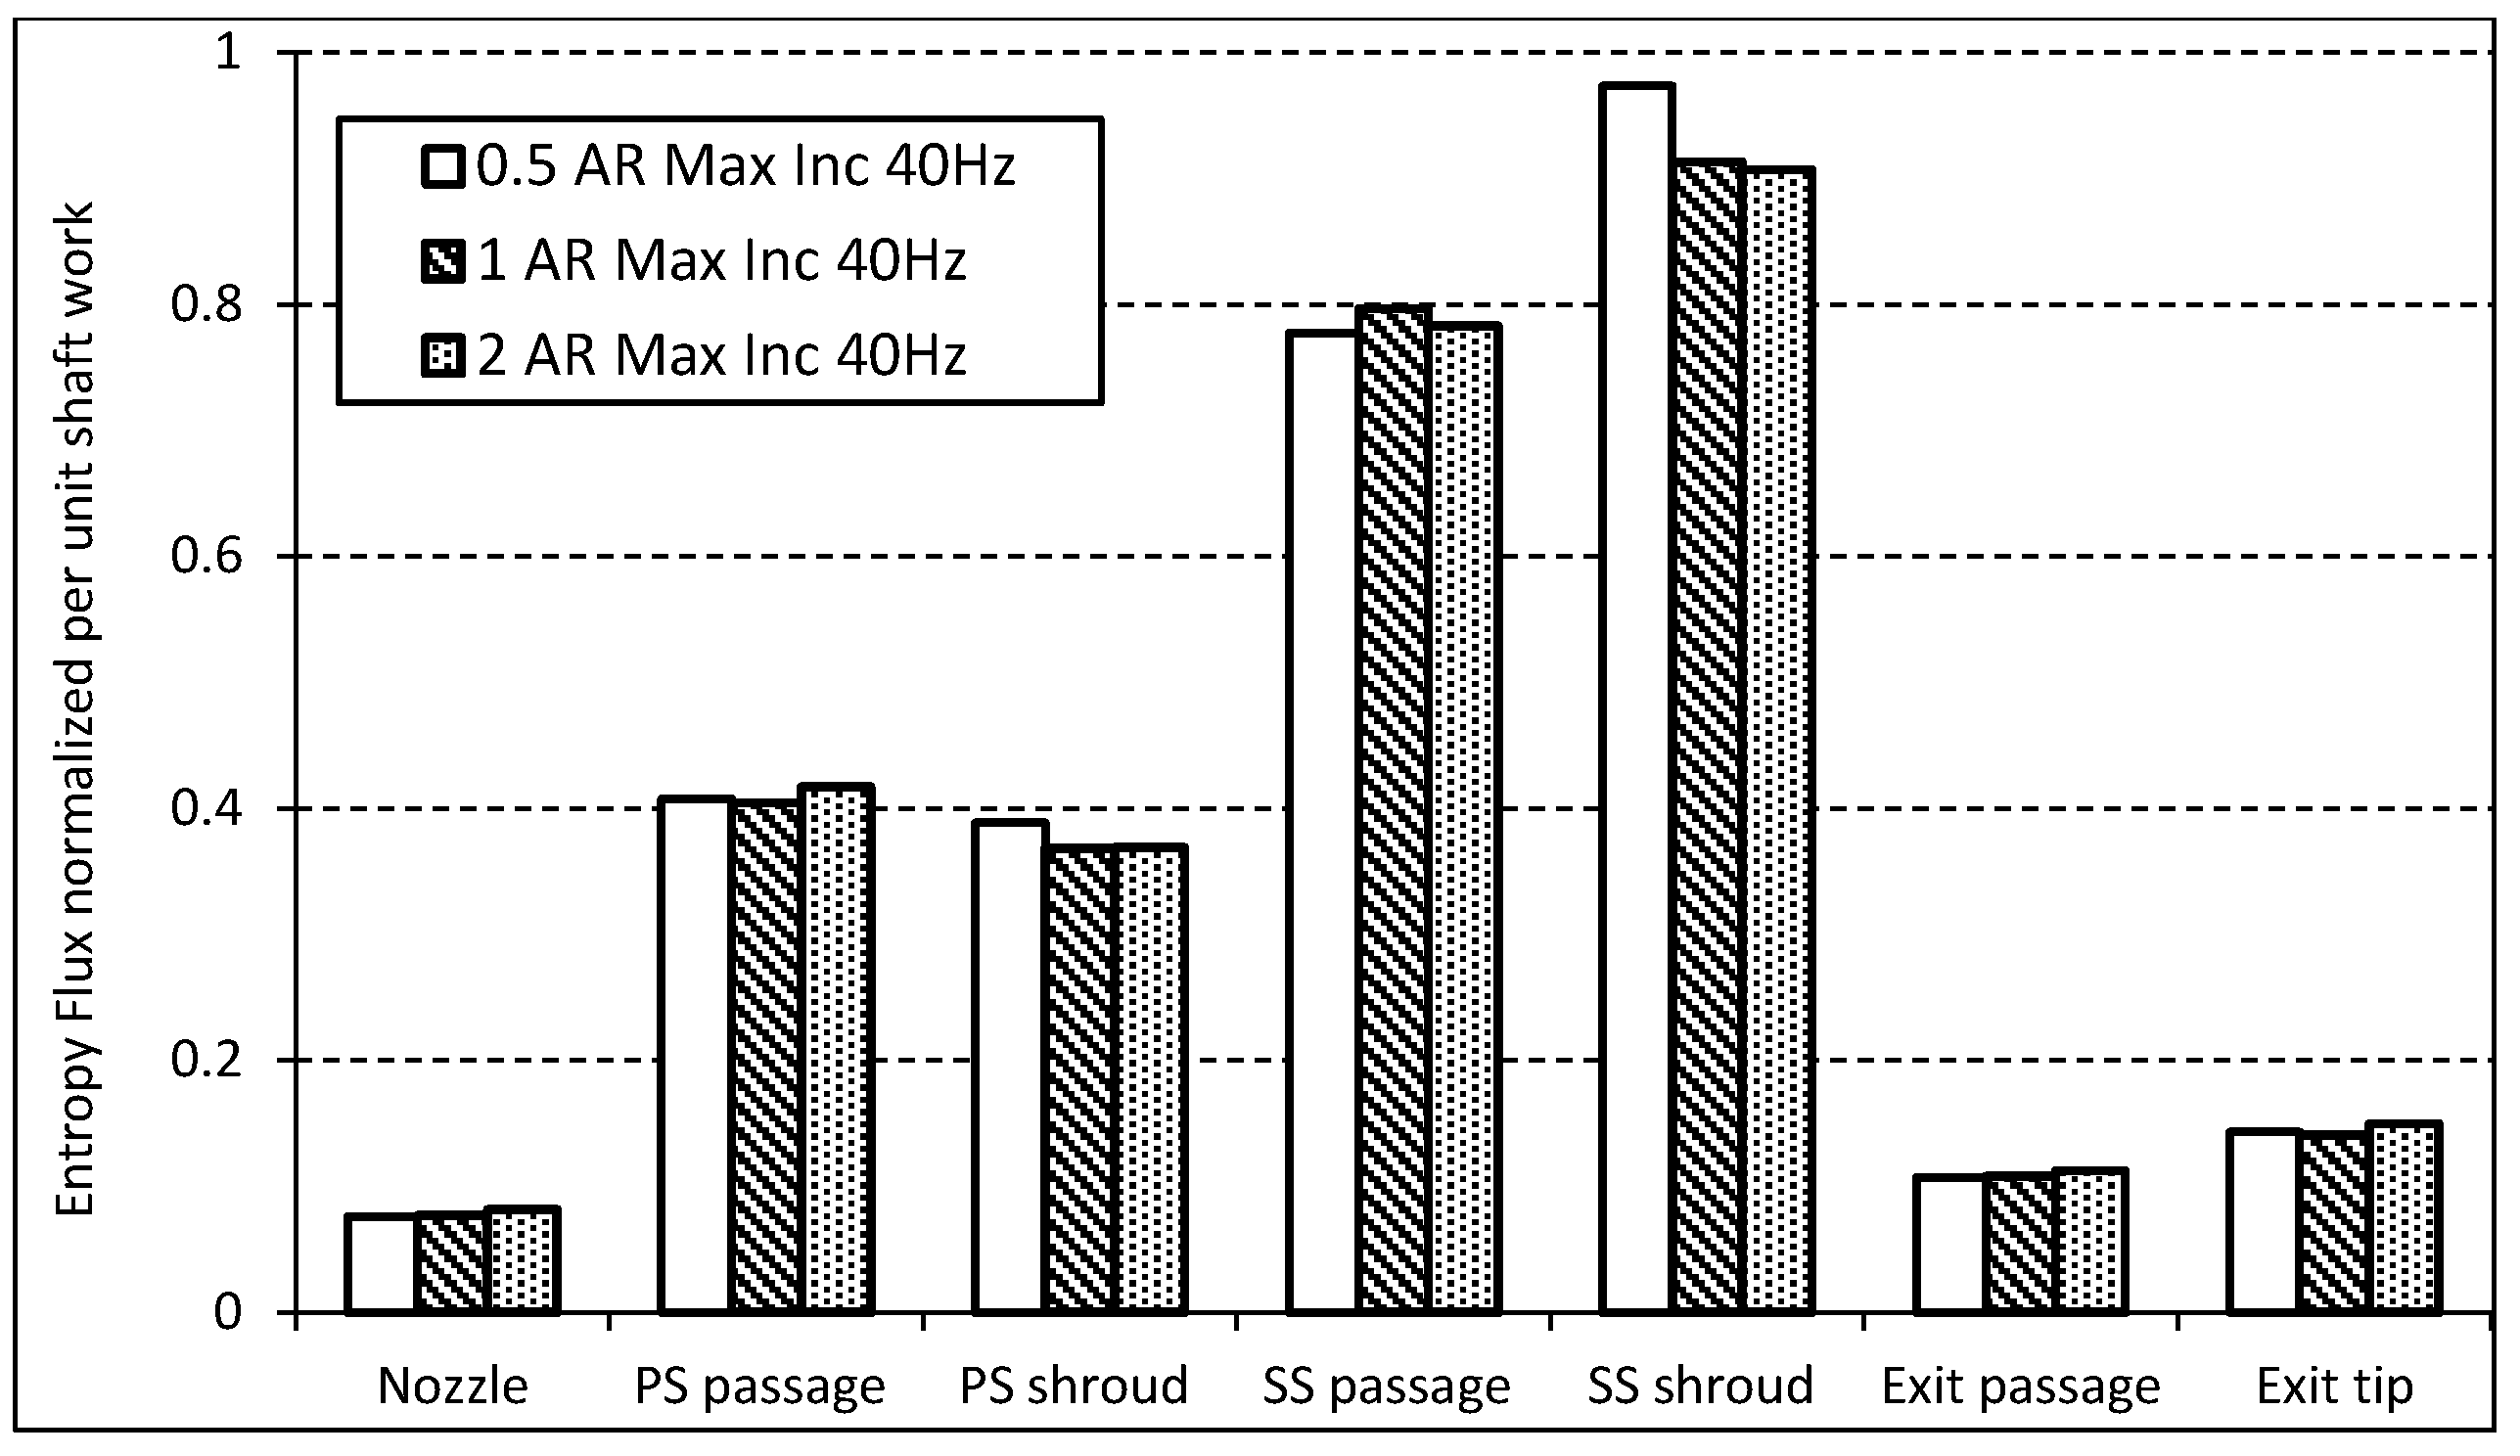
Figure 17.
Surface streamlines at planes around the turbine volute and contours of radial velocity at 40 Hz minimum incidence running point.
Figure 17.
Surface streamlines at planes around the turbine volute and contours of radial velocity at 40 Hz minimum incidence running point.

Figure 18.
Lambda 2 parameter to show the vortex core development around AR = 0.5 volute. (a) Minimum incidence angle; (b) Maximum incidence angle.
Figure 18.
Lambda 2 parameter to show the vortex core development around AR = 0.5 volute. (a) Minimum incidence angle; (b) Maximum incidence angle.
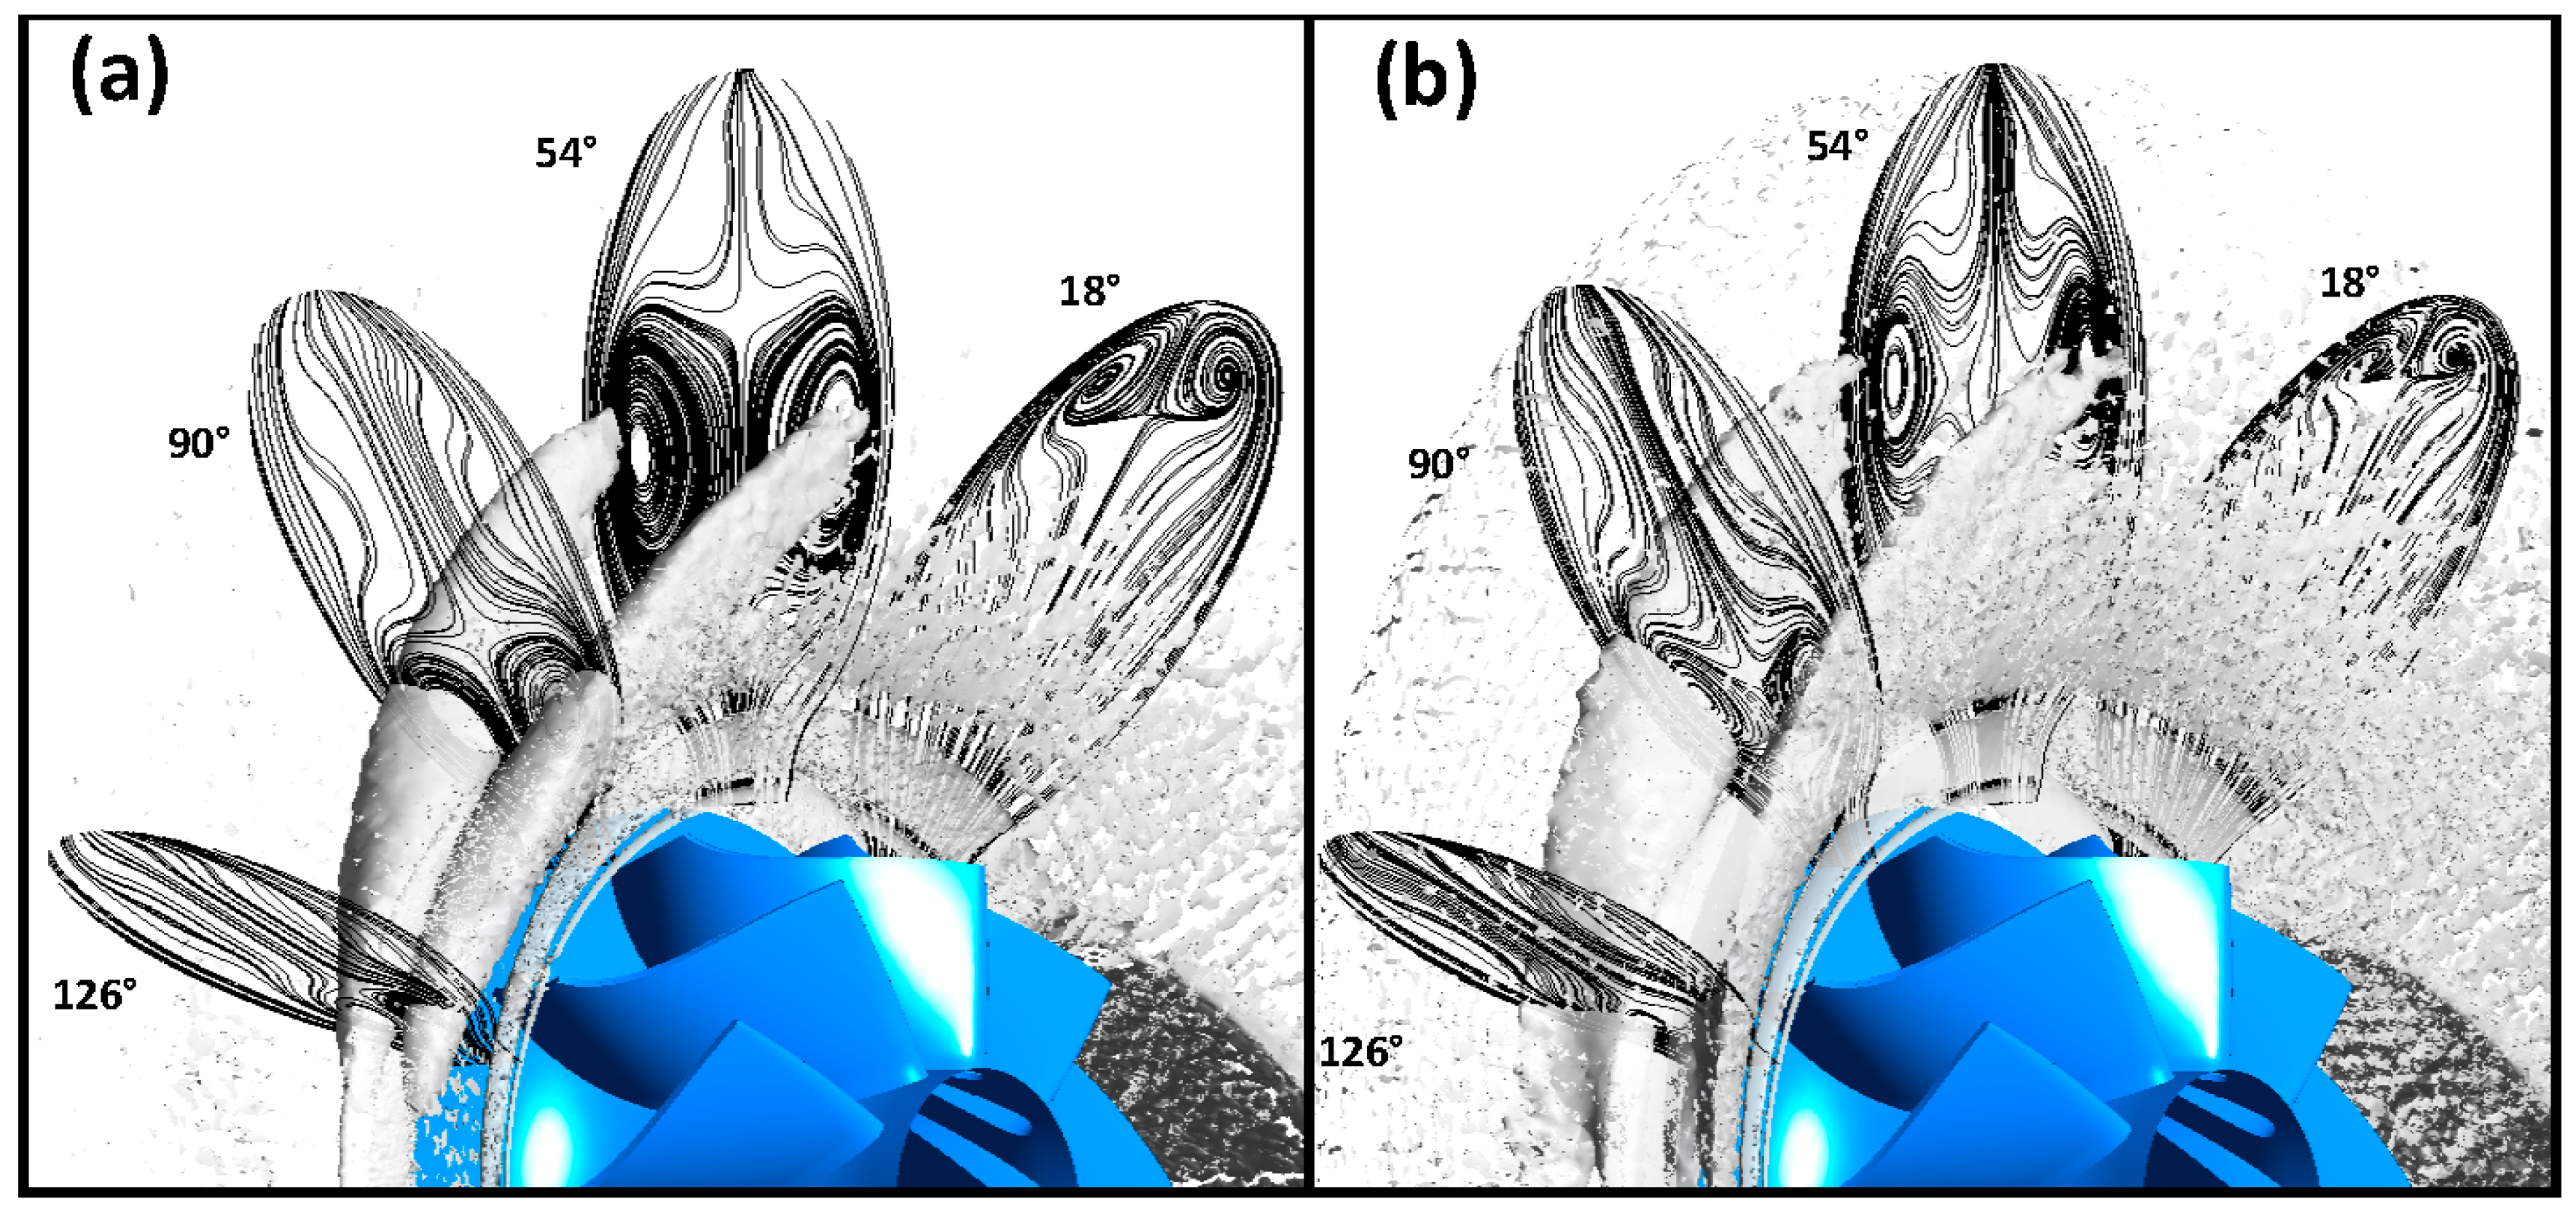
Figure 19.
Lambda 2 parameter to show vortex core development around volute at minimum incidence (a) AR = 1 and (b) AR = 2.
Figure 19.
Lambda 2 parameter to show vortex core development around volute at minimum incidence (a) AR = 1 and (b) AR = 2.

Figure 20.
Variation in absolute flow angle across the volute exit span at the minimum and maximum incidence running points.
Figure 20.
Variation in absolute flow angle across the volute exit span at the minimum and maximum incidence running points.

Figure 21.
LE incidence at 20 Hz frequency. (Left) Minimum incidence running point; (Right) Maximum incidence running point.
Figure 21.
LE incidence at 20 Hz frequency. (Left) Minimum incidence running point; (Right) Maximum incidence running point.
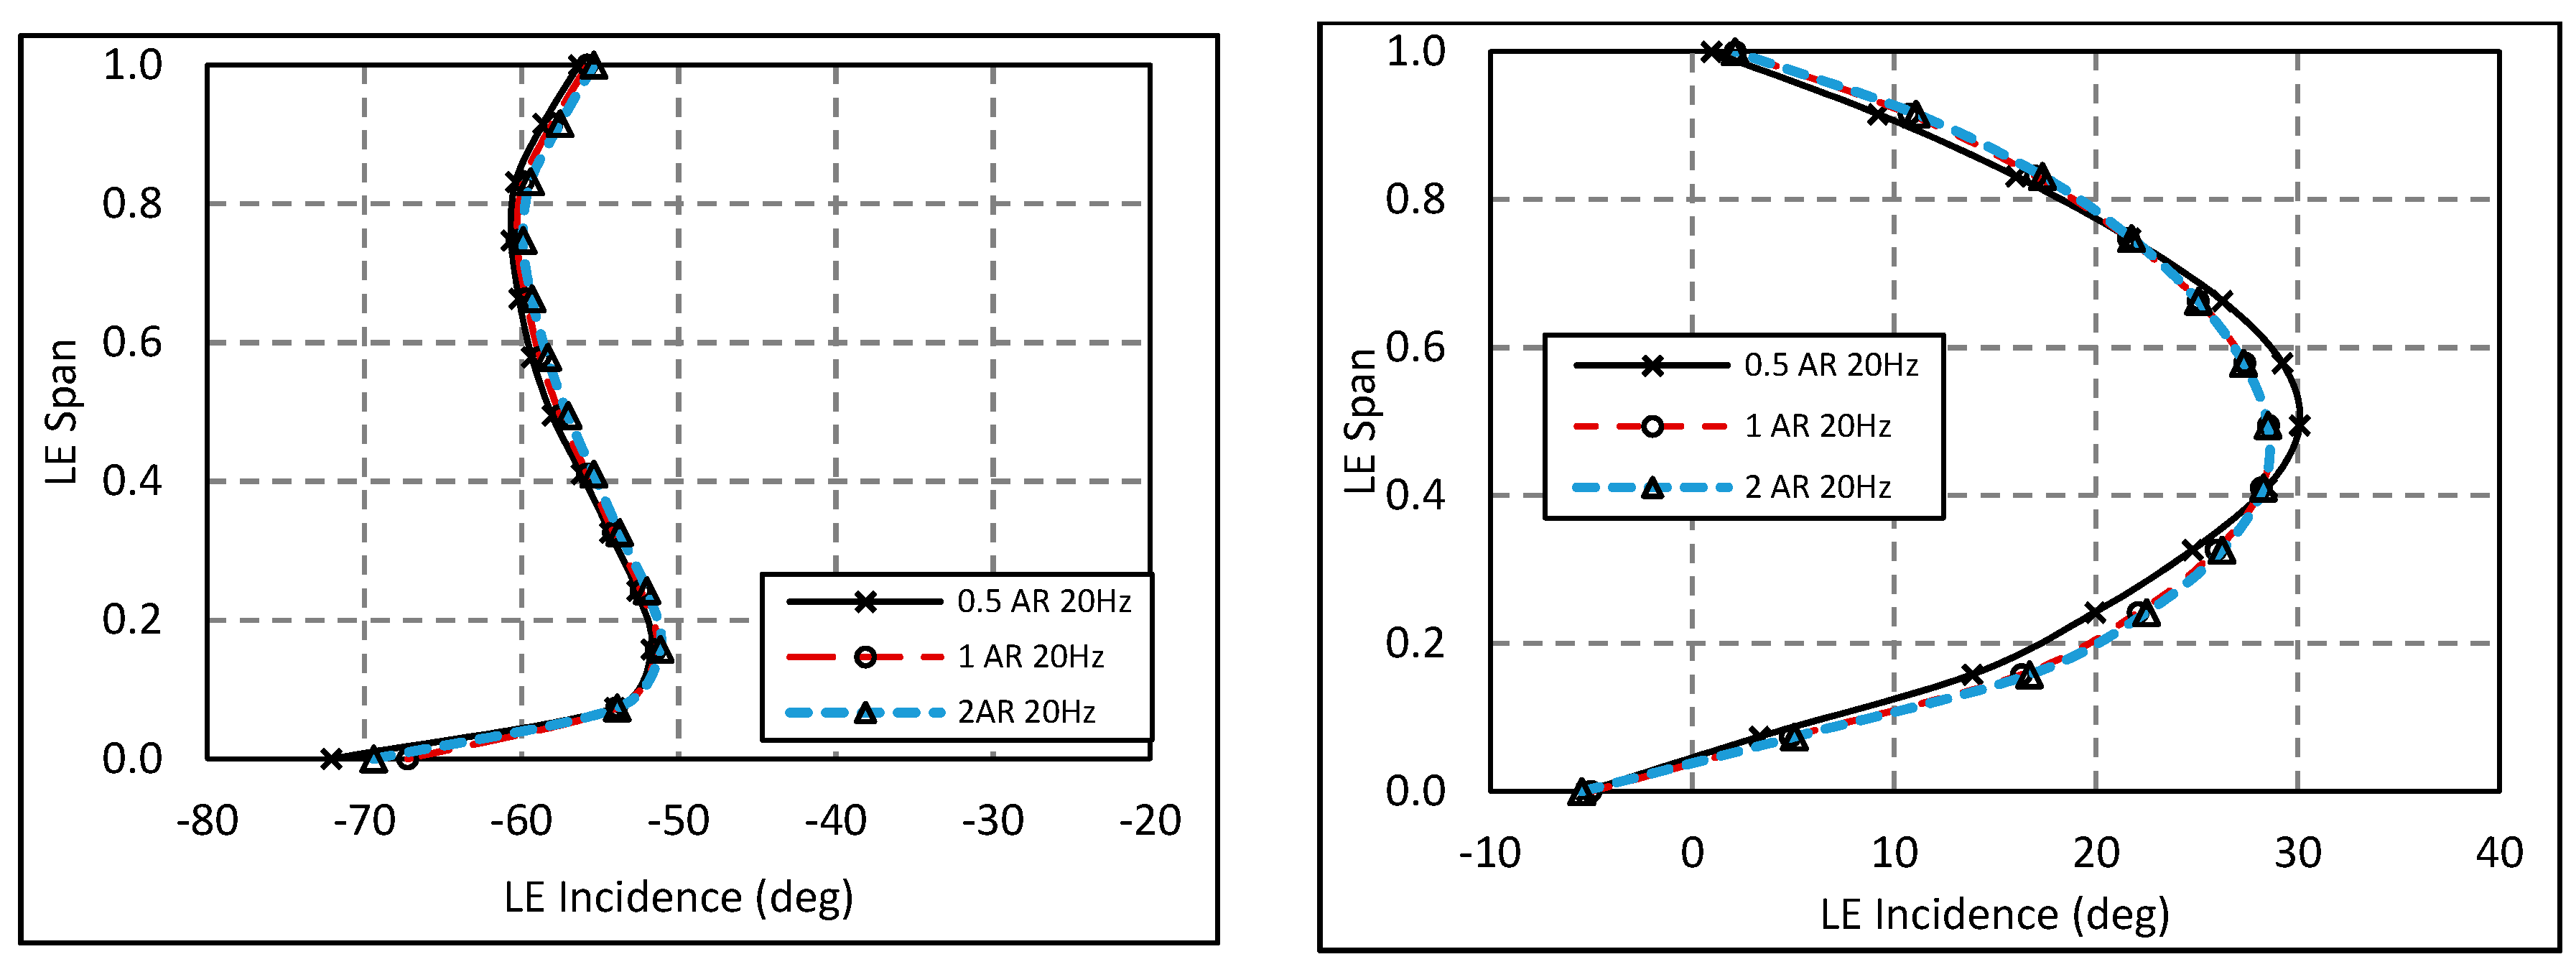
Figure 22.
LE incidence at 40 Hz frequency. (Left) Minimum incidence running point; (Right) Maximum incidence running point.
Figure 22.
LE incidence at 40 Hz frequency. (Left) Minimum incidence running point; (Right) Maximum incidence running point.
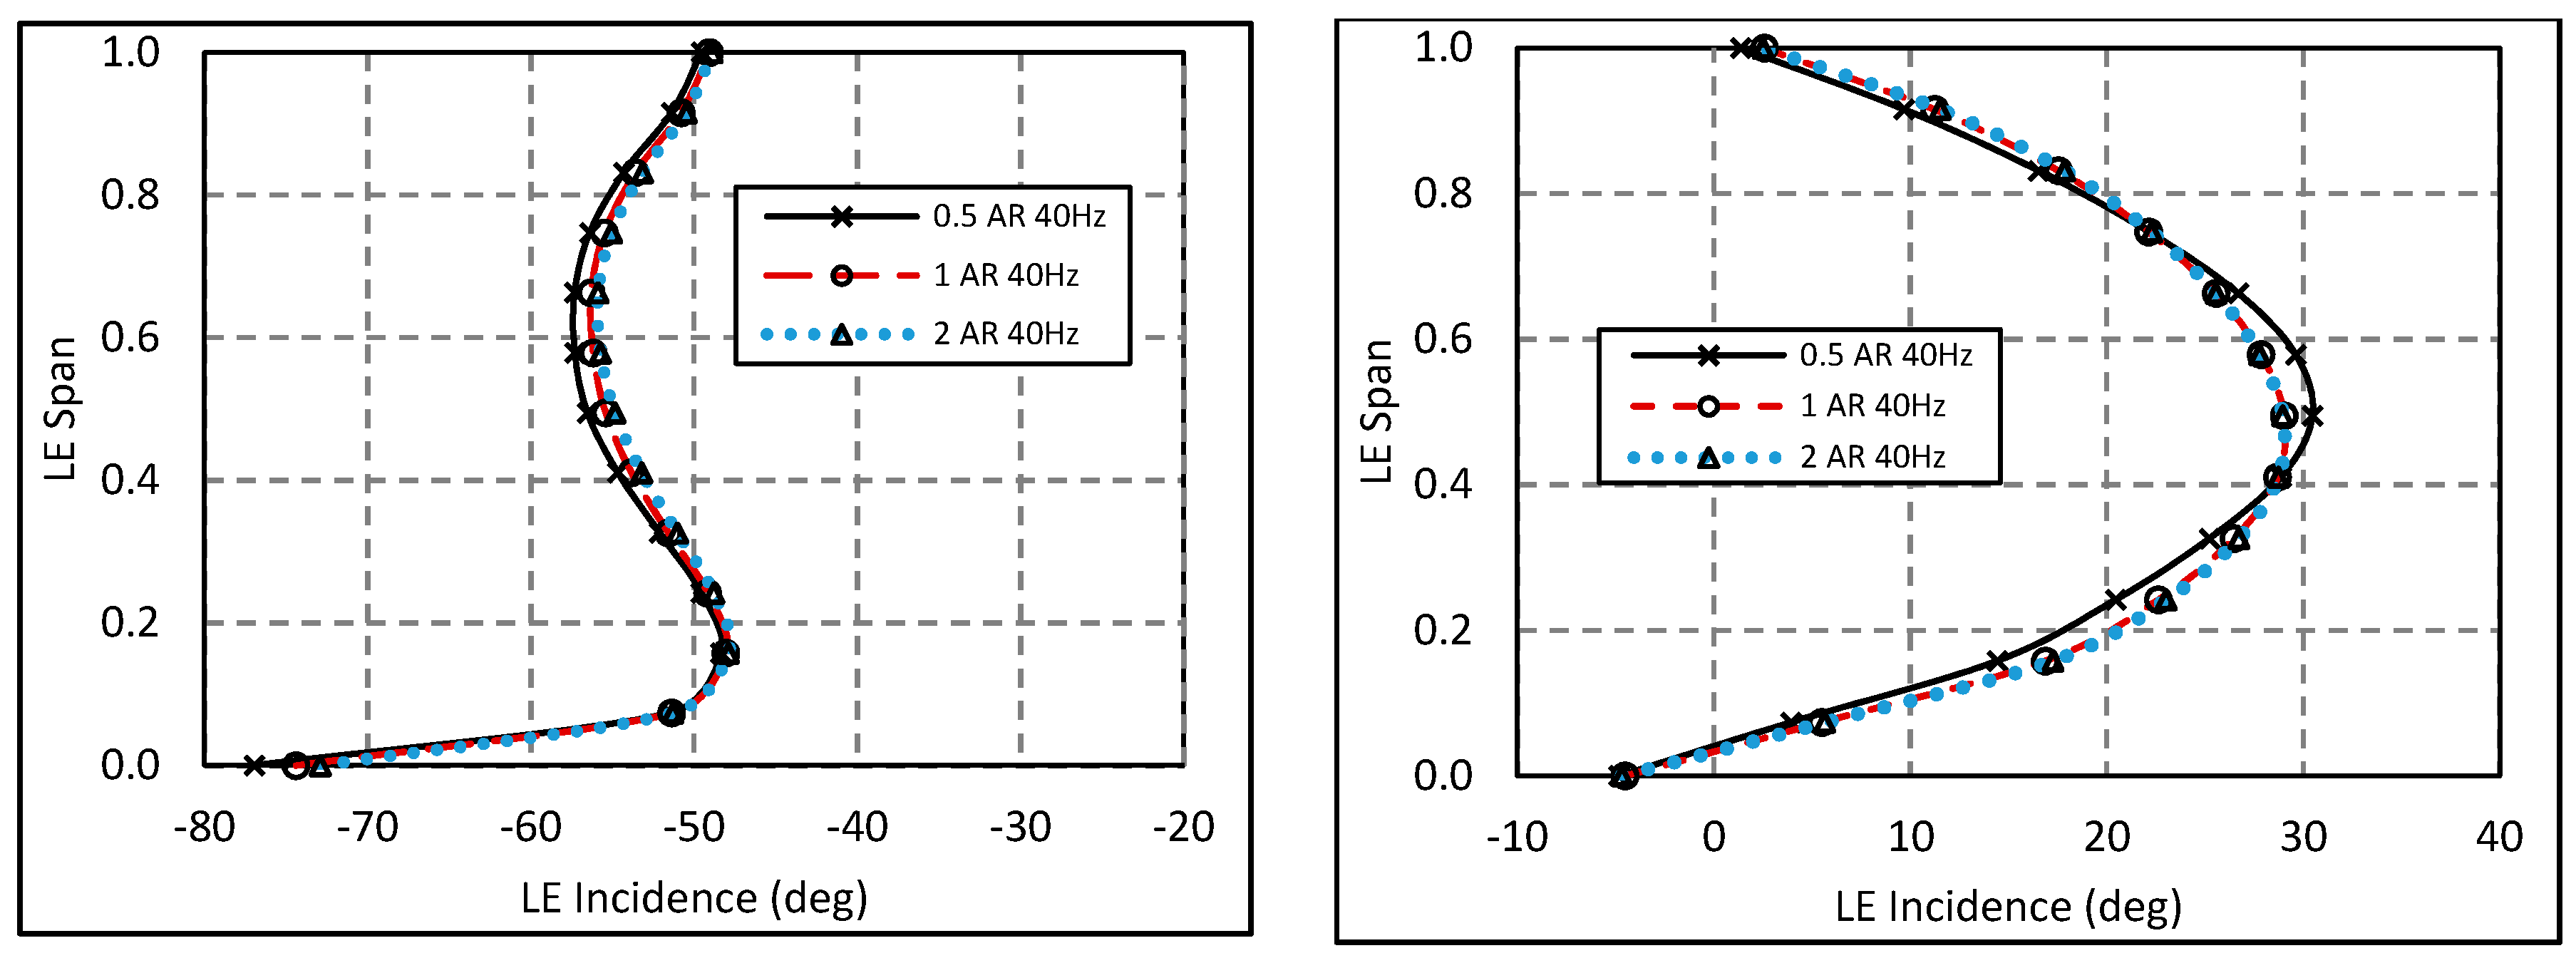
Figure 23.
LE incidence at 60 Hz frequency. (Left) Minimum incidence running point; (Right) Maximum incidence running point.
Figure 23.
LE incidence at 60 Hz frequency. (Left) Minimum incidence running point; (Right) Maximum incidence running point.


Table 1.
Normalized performance of each aspect ratio housing design at 20 Hz, 40 Hz and 60 Hz pulse frequency.
Table 1.
Normalized performance of each aspect ratio housing design at 20 Hz, 40 Hz and 60 Hz pulse frequency.
| Frequency | Aspect Ratio | 0.5 | 1 | 2 |
|---|---|---|---|---|
| 20 Hz | Eff Min U/cs | 99.02% | 99.94% | 100.00% |
| Eff Max U/cs | 92.41% | 96.48% | 100.00% | |
| Cycle AVG Rotor Eff | 98.96% | 99.75% | 100.00% | |
| Cycle AVG Stage Eff | 98.53% | 99.57% | 100.00% | |
| Volute Pt Loss Coefficient | 0.1231 | 0.1064 | 0.1061 | |
| 40 Hz | Eff Min U/cs | 99.12% | 100.00% | 99.99% |
| Eff Max U/cs | 93.85% | 97.96% | 100.00% | |
| Cycle AVG Rotor Eff | 99.00% | 99.77% | 100.00% | |
| Cycle AVG Stage Eff | 98.59% | 99.61% | 100.00% | |
| Volute Pt Loss Coefficient | 0.1221 | 0.1056 | 0.1057 | |
| 60 Hz | Eff Min U/cs | 98.83% | 99.71% | 100.00% |
| Eff Max U/cs | 97.04% | 99.38% | 100.00% | |
| Cycle AVG Rotor Eff | 99.01% | 99.73% | 100.00% | |
| Cycle AVG Stage Eff | 98.60% | 99.59% | 100.00% | |
| Volute Pt Loss Coefficient | 0.1195 | 0.1032 | 0.1035 |
© 2017 by the authors. Licensee MDPI, Basel, Switzerland. This article is an open access article distributed under the terms and conditions of the Creative Commons Attribution (CC BY) license (http://creativecommons.org/licenses/by/4.0/).
Share and Cite
MDPI and ACS Style
Lee, S.P.; Barrans, S.M.; Jupp, M.L.; Nickson, A.K. The Impact of Volute Aspect Ratio on the Performance of a Mixed Flow Turbine. Aerospace 2017, 4, 56. https://doi.org/10.3390/aerospace4040056
AMA Style
Lee SP, Barrans SM, Jupp ML, Nickson AK. The Impact of Volute Aspect Ratio on the Performance of a Mixed Flow Turbine. Aerospace. 2017; 4(4):56. https://doi.org/10.3390/aerospace4040056
Chicago/Turabian StyleLee, Samuel P., Simon M. Barrans, Martyn L. Jupp, and Ambrose K. Nickson. 2017. "The Impact of Volute Aspect Ratio on the Performance of a Mixed Flow Turbine" Aerospace 4, no. 4: 56. https://doi.org/10.3390/aerospace4040056
Note that from the first issue of 2016, this journal uses article numbers instead of page numbers. See further details here.