Comparative Study of Aircraft Boarding Strategies Using Cellular Discrete Event Simulation

Department of Electrical, Computer, Software and Systems Engineering, Embry-Riddle Aeronautical University, Daytona Beach, FL 32114, USA
*
Authors to whom correspondence should be addressed.
Aerospace 2017, 4(4), 57; https://doi.org/10.3390/aerospace4040057
Submission received: 6 November 2017
/
Revised: 23 November 2017
/
Accepted: 25 November 2017
/
Published: 28 November 2017
(This article belongs to the Collection Air Transportation—Operations and Management)
Abstract
:Time is crucial in the airlines industry. Among all factors contributing to an aircraft turnaround time; passenger boarding delays is the most challenging one. Airlines do not have control over the behavior of passengers; thus, focusing their effort on reducing passenger boarding time through implementing efficient boarding strategies. In this work, we attempt to use cellular Discrete-Event System Specification (Cell-DEVS) modeling and simulation to provide a comprehensive evaluation of aircraft boarding strategies. We have developed a simulation benchmark consisting of eight boarding strategies including Back-to-Front; Window Middle Aisle; Random; Zone Rotate; Reverse Pyramid; Optimal; Optimal Practical; and Efficient. Our simulation models are scalable and adaptive; providing a powerful analysis apparatus for investigating any existing or yet to be discovered boarding strategy. We explain the details of our models and present the results both visually and numerically to evaluate the eight implemented boarding strategies. We also compare our results with other studies that have used different modeling techniques; reporting nearly identical performance results. The simulations revealed that Window Middle Aisle provides the least boarding delay; with a small fraction of time difference compared to the optimal strategy. The results of this work could highly benefit the commercial airlines industry by optimizing and reducing passenger boarding delays.
1. Introduction
Airlines generate revenue by utilizing and flying airplanes. One of the factors for reducing airlines cost is the quick turnaround of their airplanes. A turnaround time is used to measure the efficiency of an airline’s operation in a traditional metric. Usually turnaround time is measured by the time between an airplane’s arrival and its departure [1]. Some factors that influence the turnaround time include passenger deplaning, baggage unloading, fueling, cargo, airplane maintenance, cargo loading, baggage loading and passenger boarding. The most difficult factor to control is passenger boarding time since airlines have little control over passengers. Therefore, airlines have to be cautious in making changes to reduce boarding time [2]. Many researchers have proposed and investigated different boarding strategies aiming at reducing the boarding time even by a couple of minutes [2,3,4,5,6,7,8]. Among the existing boarding strategies, the following are the most well-known techniques: Back-to-Front, Random Strategy, Outside-in (or Window Middle Aisle), Rotating zone, Reverse Pyramid, Optimal, Practical Optimal and Efficient Strategy.
Aiming at evaluating the efficiency of various existing and new boarding strategies, we have implemented a discrete-event simulation benchmark based on the Discrete-Event System Specification (DEVS [9] and Cell-DEVS [10]) formalism. Our benchmark consists of DEVS-based models that are perfectly suitable for executing various simulations on any type of aircraft. Our simulation results are visually presented as 2-D animations, making it easily understandable by non-experts. In a prior work, we have reported simulation results for three of the above mentioned boarding strategies: Back-to-Front, Window Middle Aisle and Reverse Pyramid [11]. Here we present our extended effort, documenting our modeling and simulation findings for all eight boarding strategies. We compare our simulation results to the optimal strategy to present the degree of efficiency for the given strategies.
This work attempts to present the power of DEVS and Cell-DEVS in analyzing and investigating aviation-related challenges. We demonstrate how flexible, adaptive and precise Cell-DEVS is in simulating passenger behavior. This paper is organized as follows: Section 2 provides a brief background about various boarding strategies and highlights some of the related works, then introduces Cell-DEVS formalism. Section 4 discusses the high-level and low-level design. The DEVS and Cell-DEVS implementation details are introduced in Section 5. Section 6 provides the simulation results and analysis. The concluding remarks are given in Section 7.
2. Background
Aiming at reducing boarding times, the airline industry has tried various enplaning methods. Below we summarize the commonly used strategies.
Back-to-Front: This boarding plan is known as the “traditional” boarding method. Passengers are boarded to from the back row of the aircraft and continue with the rows up to the front. Aircraft rows are divided into zones. The zones can be any number reaching from two to the total number of actual rows. This strategy is easy to implement, however, it is easily prone to inefficiency, as congestions occur over the boarding rows [1].
Random Strategy: This boarding plan is when passengers are not assigned to specific seats but line up at the gate counter and are admitted in the order they arrive. Travelers can choose any unoccupied seat as soon as they are onboard. Passenger will start to rush into the plane to get a better seat. This makes the boarding process faster; however, this reduces passengers’ comfort level [4].
Outside- In Method: This method is also called “Window Middle Aisle.” Passengers who are assigned to window seats will board first. When it is finished, middle and aisle seats follow. This method has so far revealed very efficient boarding time. It potentially reduces passenger interference caused by loading luggage and completely reduces passengers interfering with each other as they walk down the rows. This method is relatively easy to implement [8].
Rotating Zone: In this method, aircraft rows are divided into zones (each zone grouping a number of rows). This method starts with the last zone in the back to be seated, then continues with the first zone in the front. After this, the order continues again with the furthest yet unoccupied zone in the back, then the front one and so on. The advantage of this method is that passengers who are boarding at the back and at the front will not interfere with each other [8,12].
Reverse Pyramid: This method is to board passengers from the outer back to the inner front of cabin. This method is in fact a combination of Back-to-Front and Window to Aisle. It calls for simultaneously loading an aircraft from back to front and outside in. Window and middle passengers near the back of the plane board first; those with aisle seats near the front are called last. This strategy is proven to be an efficient method by American West Airlines [2].
Optimal Method: This method is to make passengers board in order from Back-to-Front but in every other row. This method aims at reducing the interference among passengers from back and the front and giving passengers enough space to load their luggage, which reduces the luggage delay in return. However, this method is not practical based on South West Airline experience. It is a challenge to arrange all the passengers in the proper order [7].
Practical Optimal Method: This technique defines four boarding groups. First group is all passengers in even rows in one side of the airplane. The second group is all passengers in even rows in another side of the airplane. The third and fourth group is the passengers in odd rows in each side of the airplane. This method is not as efficient as the optimal method but it is practical and it proved to be a successful boarding method [7].
A number of studies have been conducted previously by implementing various boarding strategies using different simulation techniques including: Linear Programming [8], Discrete-Event simulation [2] and even Cellular Automata [6]. A comprehensive literature survey about passenger boarding simulation techniques was reported in Reference [13] while a newer more extensive comparative study [14] was published in 2014 taking into account past, current and future research in this area. The study analyzes a number of research conducted on traditional (e.g., random, back-to-front and outside-in) and newer boarding strategies (e.g., eliminating carry-on luggage, using two doors), where authors summarized that, based on the studies found, simple strategies such as random boarding generally outperforms the commonly used back-to-front method.
New research has been reported recently that takes into account other factors such as changing aircraft layout at the infrastructure level and seat interference [15]. Most related effort to our work can be found in References [16,17,18,19]. In Reference [12], a grid based simulation model was used based on the asymmetric simple exclusion process (ASEP) where simulation is carried as a stochastic forward directed, one dimensional and discrete time and space process. The work focused on analyzing boarding time from three perspectives: seat load factors, passenger acceptance of chosen boarding order and arrival rates. The simulation results also showed that the use of rear door enhances boarding efficiency by 25%.
In this work, we have implemented precise and aircraft-independent boarding strategies and provide a comparison of their efficiency. Our simulation is based on the Discrete-Event System Specification DEVS and Cell-DEVS theory. Unlike Cellular Automata (CA), Cell-DEVS does not require updating the entire cellular grid at every time step. Rather, only cells with updated neighbor values are evaluated. This improvement overcomes the issue of the original CA by reducing the overall execution cost, leading to faster computations. We show that precise simulations results, comparable to those produced by complex mathematical modeling techniques (like those reported in Reference [8] using linear programming), can be obtained from the collective behavior of discrete-event cellular grids. A number of research work has used cell-driven simulation (self-defined cellular simulation environment) where they implement a simplified CA-based simulation to analyze boarding methods. The work in Reference [3] for instance, augments the simulation study conducted in Reference [5] by implementing a simple cell-based simulation environment to mimic passenger’s interactions while boarding. Similarly, Steffen et al. [7] combine cell-divided simulation concept with Markov Chain Monte Carlo optimization algorithm and propose their own optimal boarding strategy for their specific simulation setting (boarding by seat). More recently, the researcher in Reference [20] improvised their previous cell-based simulations [12] by studying use of an additional door for the boarding process, a change of the boarding strategy and the potential application of different seat layouts. Field trials were also carried out to evaluate the simulation results. Even though the above studies attempt to include cell-based simulations, they do not make use of CA computational apparatus and instead only divide their simulated environment into cells for handling interactions and capturing simulation progression. In our study however, we systematically make use of the robust Cell-DEVS theory to design and computer simulation scenarios.
The Cell-DEVS cell space is composed of very simple cells that make local decisions solely based on the information gathered from their immediate neighbors. To implement our DEVS and Cell-DEVS models we used CD++ [21] development toolkit. CD++ is an open-source object-oriented modeling and simulation environment that implements both DEVS and Cell-DEVS theories in C++. The tool provides a specification language that defines the model’s coupling, the initial values, the external events and the local transition rules for Cell-DEVS models. CD++ also includes an interpreter for Cell-DEVS models. The language is based on the formal specifications of Cell-DEVS. The model specification includes the definition of the size and dimension of the cell space, the shape of the neighborhood and the border.
Cellular Discrete Event Approach
The selected modeling and simulation methodology for this work is the Cellular Discrete-Event System Specification (Cell-DEVS) formalism [10]. A model defined by Cell-DEVS is a cellular grid where each cell represents an independent agent. Agents communicate and interact with each other throughout the simulation by sending/receiving messages. The behavior of each agent is expressed using a state-machine. Agents can be stationary or mobile meaning they can change their position within the grid. Each cell defines a surrounding neighborhood that affects its state value. Whenever a computation is performed and the cell’s value is modified, all its neighboring cells get an update to re-evaluate their states accordingly. A cell’s value changes as a result of a simple local computation based on the current state of the cell and its immediate neighbors as dictated by the Cell-DEVS specification. Each cell can choose to have as many direct or indirect neighbors.
A Cell-DEVS model is defined by:
where X is a set of external input events; Y is a set of external output events; I represents the model’s modular interface; S is the set of sequential states for the cell; θ is the cell state definition; N is the set of states for the input events; d is the delay for the cell; δint is the internal transition function; δext is the external transition function; τ is the local computation function; λ is the output function; and D is the state’s duration function. The modular interface (I) represents the input/output ports of the cell and their connection to the neighbor cell. Communications among cells are performed through these ports. The values inserted through input ports are used to compute the future state of the cell by evaluating the local computation function τ. Once τ is computed, if the result is different from the current cell’s state, this new state value must be sent out to all neighboring cells informing the state change. Otherwise, the cell remains in its current state and therefore no output will be propagated to other cells. This will happen when the time given by the delay function expires. Finally, the internal, external transition functions and output functions (λ) define this behavior. Cell-DEVS improves execution performance of cellular models by using a discrete-event approach. It also enhances the cell’s timing definition by making it more expressive.
TDC = <X, Y, I, S, θ, N, d, δint, δext, τ, λ, D>,
CD++ [21] is an open-source object-oriented modeling and simulation environment that implements Cell-DEVS theories in C++. The tool provides a specification language that defines the model’s coupling, the initial values, the external events and the local transition rules for Cell-DEVS models. CD++ also includes an interpreter for Cell-DEVS models. The language is based on the formal specifications of Cell-DEVS. The model specification includes the definition of the size and dimension of the cell space, the shape of the neighborhood and the border. The cell’s local computing function is defined using a set of rules with the form postcondition delay {precondition}. These indicate that when the precondition is met, the state of the cell changes to the designated postcondition after the duration specified by delay. If the precondition is not met, then the next rule is evaluated until a rule is satisfied or there are no more rules. CD++ also provides a visualization tool, called CD++ Modeler, which takes the result of the Cell-DEVS simulation as input and generates a 2-D representation of the cell space evolution over the simulation time. This feature of the tool provides an interactive environment allowing for visual tracking of the mode’s evolution.
3. Modeling Assumptions
In order to implement the eight boarding strategies introduced in the previous section, common parameters and assumptions were considered. Based on the study in Reference [22], we define ranges for four different parameters as given in Table 1. These parameters define:
- Walking Speed: the speed range at which passenger walks from the moment he/she enters the aircraft till reaching the target seat (unit: meter per second).
- Clearing Time: the time range passengers spend on storing their luggage in the overhead compartment or underneath the seat in the front (unit: seconds).
- Getting out of Seat: the time range a passenger takes to get up from their seat, allowing other passengers to sit within that row (unit: seconds).
- Passenger Flow Rate: the range number of passengers that enter the aircraft at a certain amount of time (unit: passenger per second).
All of these parameters are given in the form of a range from min_value to max_value. We have mapped these ranges to our Cell-DEVS model to precisely implement a near-reality model of passenger boarding strategies. Details of these mappings are given in the next section when the model’s rules are explained. Recent studies were conducted to validate some of these parameters. Compared to the assumptions reported in Table 1, the field trails in References [23,24] reported passenger flow rate of 0.48–3.17 pax/s and average baggage storage of 13.9 s for similar aircraft used in our study. Other strategy-specific data were also reported that require further extension of our work to allow for a comparative study.
There are two basic elements that interfere with the boarding process: aisle interference and seat interference [22]. Aisle interference is introduced when a passenger is blocked by another passenger in the aisle, while seat interference is when a passenger tries to get to a seat near the window but is blocked by another passenger already seated near the aisle. Given these two interferences, three types of delays are recognized: walking delay, luggage delay and variable seated passenger delay. In Table 2, based on the range values presented on Table 1, we defined fixed delay values for the following parameters:
- Walking Delay: the average time it takes a passenger to pass a row (unit: milliseconds).
- Luggage Delay: the average time spent by individual passengers to store their luggage in the overhead compartment (unit: milliseconds).
- Middle Seat Delay: the delay time a window passenger should wait at the row until middle/aisle passengers who are already seated within that row get up (unit milliseconds).
- Aisle Seat Delay: the delay time a window or middle passenger should wait at the row until aisle passenger who is already seated within that row gets up (unit milliseconds).
The models we present in this article do not consider passengers who travel in groups (e.g., families with children), as this would affect the seating strategy, since they need to be boarded at the same time. We are anticipating that extra delays might be introduced under such situations.
4. System Design
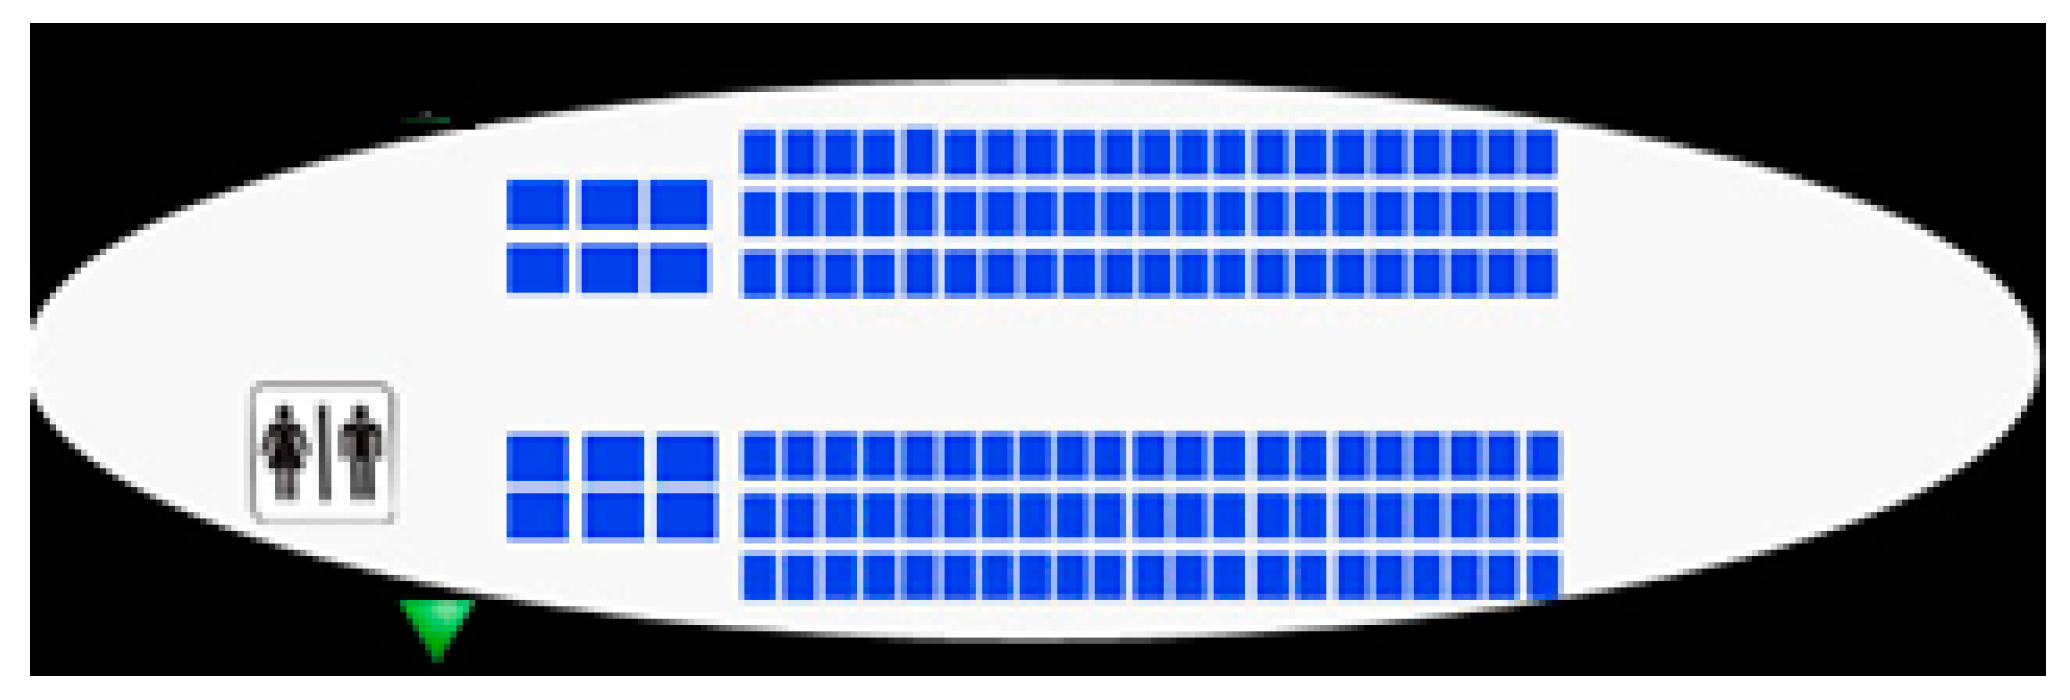
Our aircraft model defines an Airbus 320 internal space layout with two different seating areas (first and economy classes) giving a total of 26 rows and 150 seats, a single middle aisle and an entrance door as given in Figure 1.
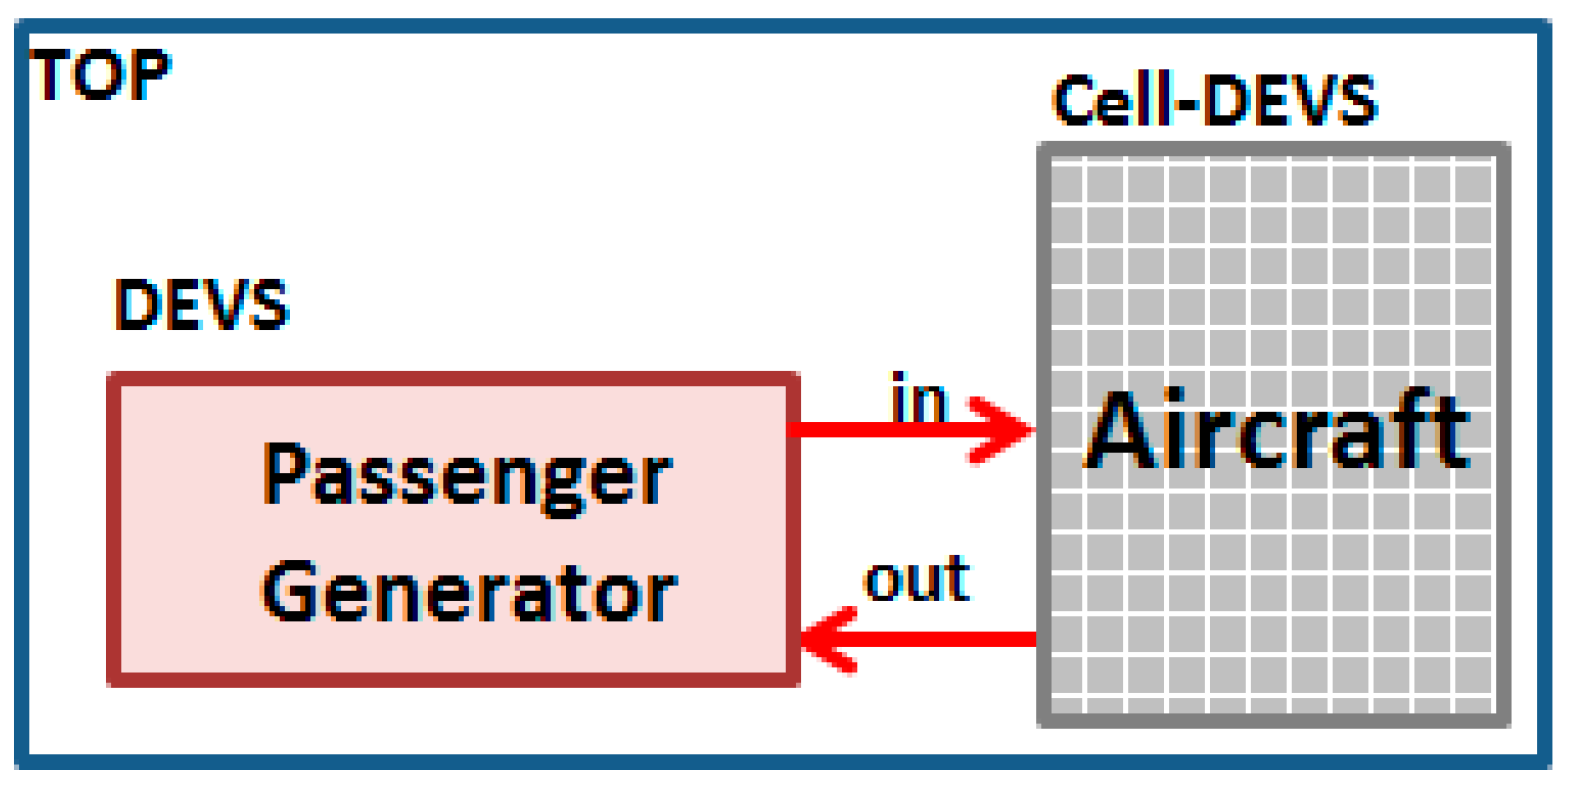
To model the proposed system using DEVS, we define a DEVS coupled model composed of an atomic DEVS component and a coupled Cell-DEVS grid as illustrated in Figure 2. Our DEVS component “Passenger Generator” is in charge of generating passengers with specific seat numbers and injecting them into the Aircraft cellular model.
The two subsystems (Passenger Generator and Aircraft) are interconnected through input/output ports defined in the Top coupled DEVS specification. The atomic Passenger Generator component is defined as represented in Figure 3:
This internal behavior of the component is translated from its state diagram illustrated in Figure 4. Basically, the Passenger Generator is always in waiting mode. Whenever the cellular Aircraft model requests a new passenger entrance (indicated when the aircraft door is not occupied by a passenger), the Passenger Generator calculates an unassigned seat and sends the seat number as an integer value to the “in” port of the Aircraft Cell-DEVS model. When a seat number arrives at the input port of the door cell, it is simply regarded as a passenger who is assigned that specific seat number.
Obviously, the seat numbers generated by the Passenger Generator model cannot be duplicates and the order they are sent out to the Aircraft differs from one strategy to another. This is discussed in Section 5.1, Section 5.2, Section 5.3, Section 5.4, Section 5.5, Section 5.6, Section 5.7 and Section 5.8.
The Aircraft Cell-DEVS model is defined as a coupled DEVS model with 430 cells, where each cell is a DEVS machine. The model’s layout is illustrated in Figure 5 where yellow cells denote seats, red cell is a passenger and gray cells in the middle demonstrate the aisle. The aircraft door is a green cell in the bottom left corner of the model. Thanks to the capability of CD++ in representing 2D visualization of the simulation, our model verification process was made easy. Basically, the flow of the passengers and the order of seats being occupied were easily verifiable through the visualization. This way, we were able to observe the progress of the models dynamically and easily verify their correctness.
The Aircraft layout model in Figure 5 is defined in CD++ environment as following:
[aircraft]
- type: cell
- width: 10
- height: 43
- neighbors: aircraft(−1,−1) aircraft(−1,0) aircraft(−1,1) aircraft(0,−4)
- neighbors: aircraft(0,−3) aircraft(0,−2) aircraft(0,−1) aircraft(0,0)
- neighbors: aircraft(0,1) aircraft(0,2) aircraft(0,3)
- neighbors: aircraft(1,−1) aircraft(1,0) aircraft(1,1)
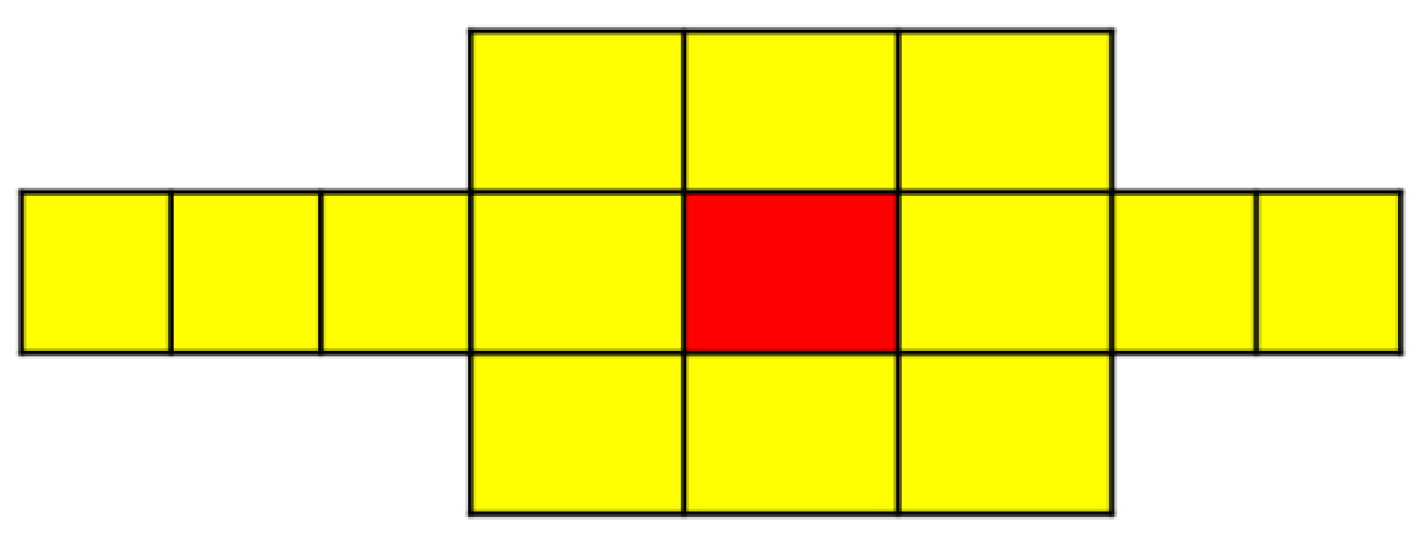
This yields a 10 by 43 cellular space where each cell defines fourteen cells in its neighborhood, as shown in Figure 6. The cellular neighborhood indicates that the value of a cell is affected by those residing in its neighborhood. Thanks to Cell-DEVS theory, when the value of a cell changes, only its neighborhood cells are notified rather than the entire cell space (a major limitation of Cellular Automata).
In order to recognize different cells (passenger, door, aisle, occupied and empty seats, etc.) we have defined our model states as follows (refer to Table 3):
Figure 7 demonstrates a screenshot of the aircraft’s front where all seats are occupied (yellow), the door is closed (green) and no passenger is in the aisle (gray).
5. Implementation Details
Seat numbers are generated randomly but are injected into the Aircraft model in a different sequence order depending on the boarding strategy. Thus, eight different versions of the Passenger Generator model were implemented to accommodate these restrictions. By using the same seed numbers, we have enforced identical random outputs over various simulation runs, thus our experiments did not need to be replicated. Although, the three models define the exact same DEVS specification that was illustrated in Figure 3, the internal behavior given by the external transition function is slightly different. Next, we will present these variations.
5.1. Seat Generation in Back-to-Front Strategy
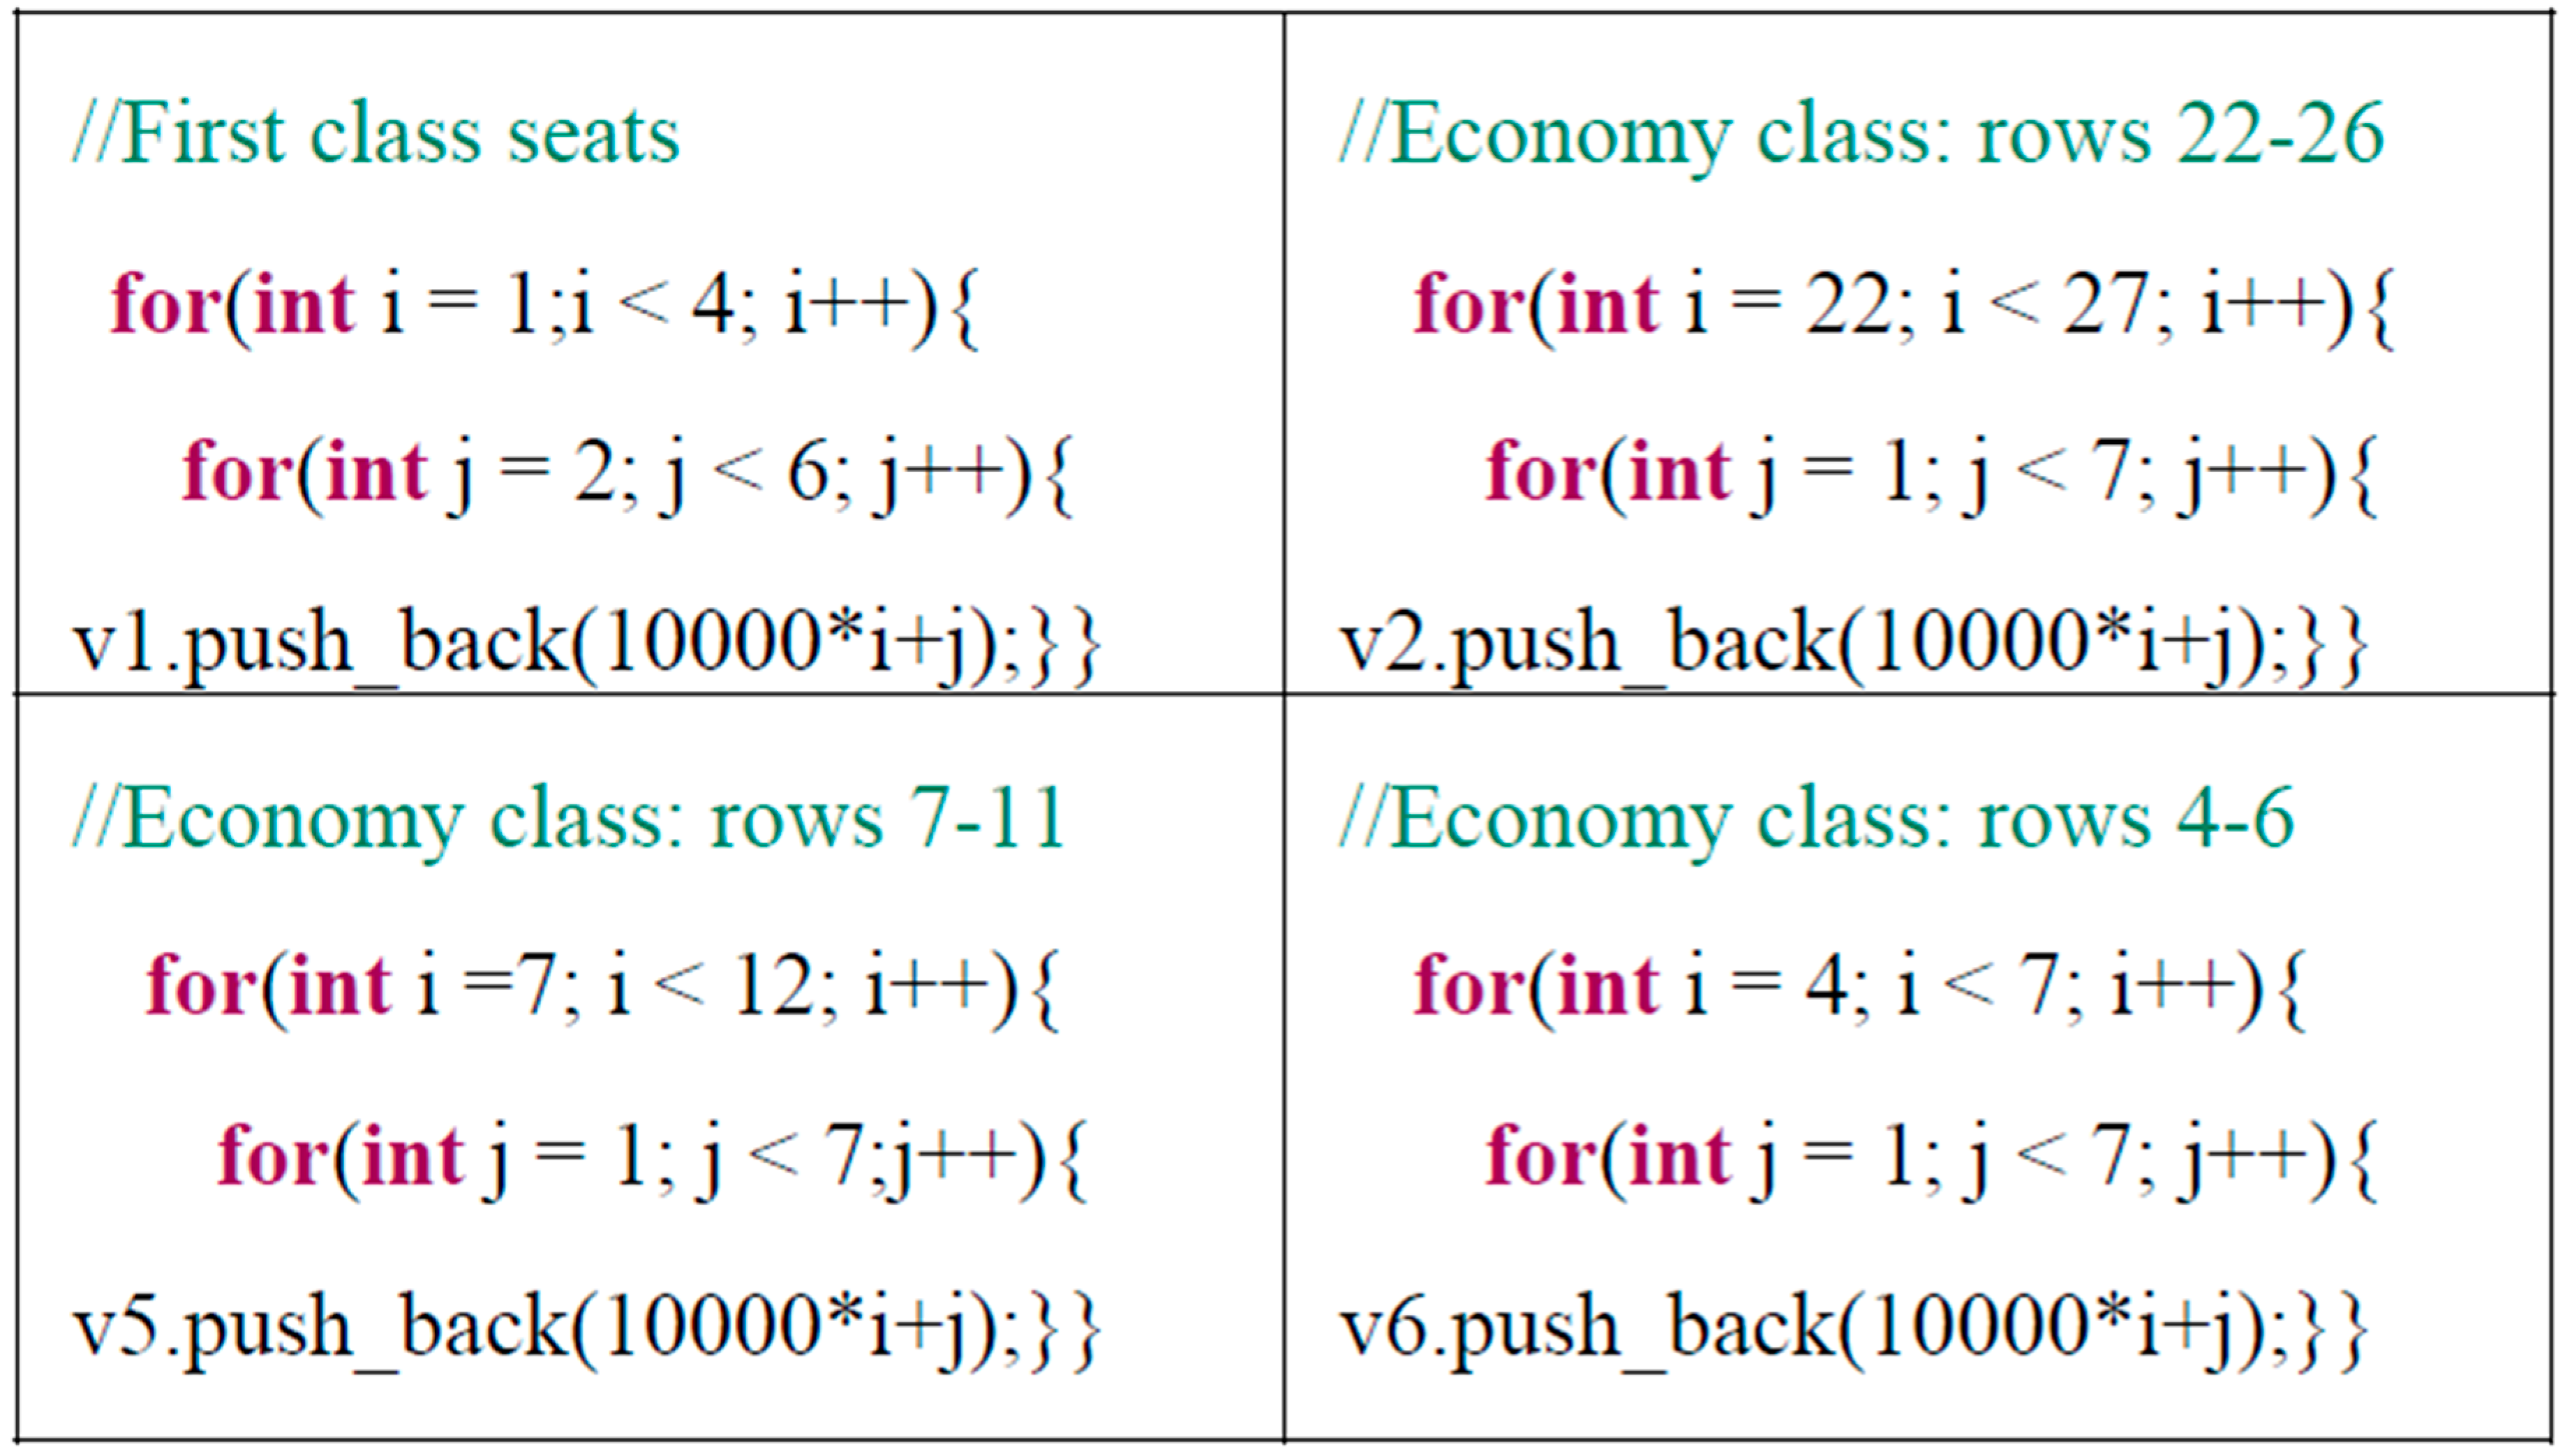
The Back-to-Front strategy includes six boarding zones: zone_1 (rows 1 to 3, business seats), zone_2 (rows 22 to 26), zone_3 (rows 17 to 21), zone_4 (rows 12 to 16), zone_5 (rows 7 to 11) and zone_6 (rows 4 to 6). Seat numbers are generated based on zones with a simple formula that considers the row number and the seat capacity within that row (6 for economy rows 4–26 and 4 for first-class rows 1–3). The code snippet in Figure 8 illustrates how seats within zones 1, 2, 3 and 6 are generated upon initialization of the DEVS model.
Given all seat numbers, upon each request from the Aircraft cellular model, the Passenger Generator model injects a random seat number within the current boarding zone. In our implementation, we simply handle this by shuffling the seat numbers within each zone as following:
random_shuffle(v1.begin(), v1.end());
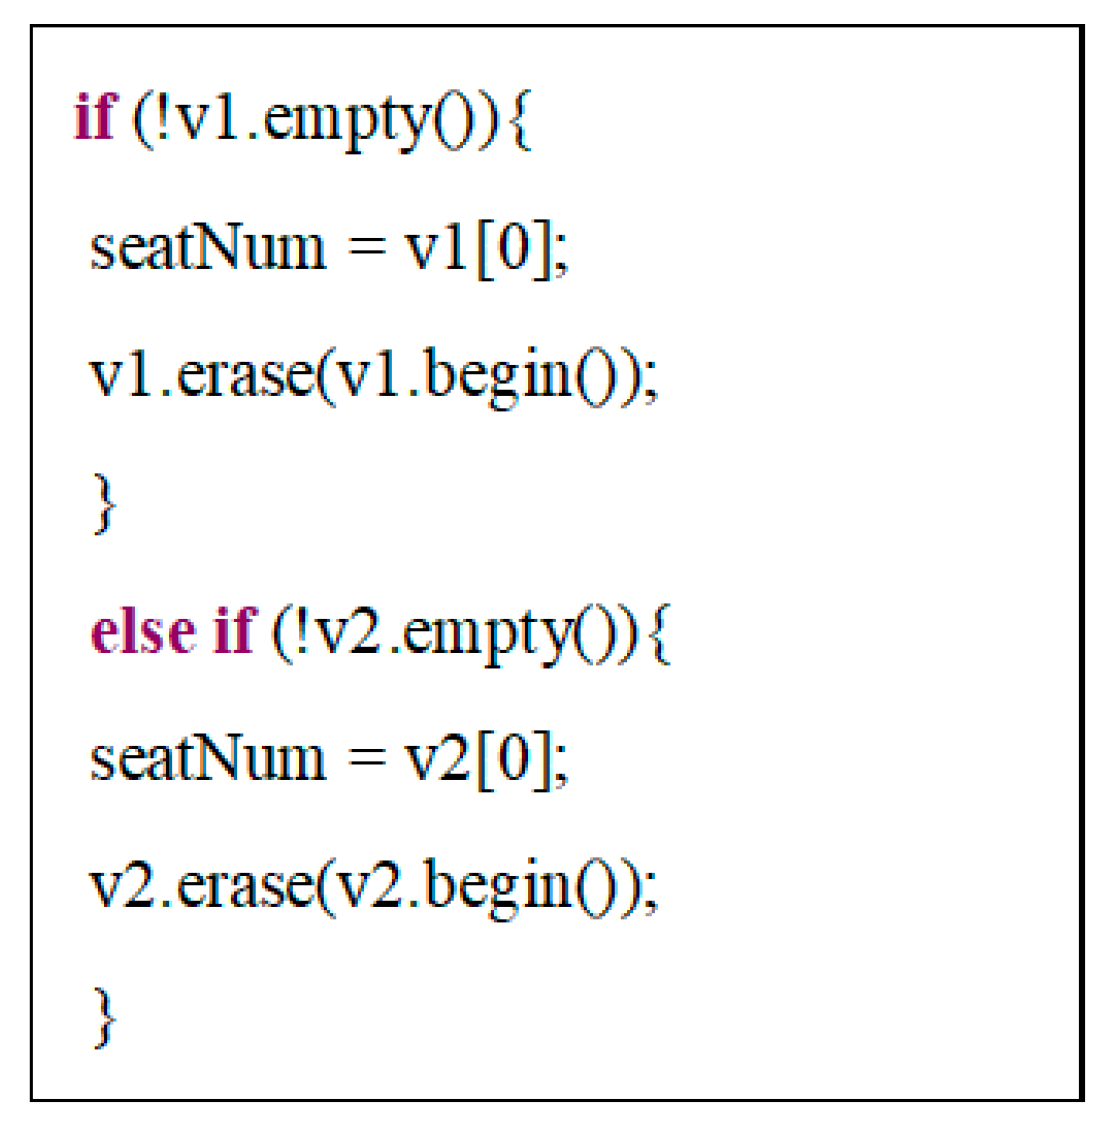
With Back-to-Front strategy, random seat numbers are sent out to the Aircraft in the order of zone_1, zone_6, zone_5, zone_4, zone_3 and zone_2. Only when all seat numbers from a given zone are sent out, the seat numbers from next zone are selected. This behavior is implemented within the DEVS external transition function which is triggered when the Aircraft requests a passenger by sending an input through port “in” of the Passenger Generator model. This is shown in Figure 9.
5.2. Seat Generation in Random Strategy
Seat generation for Random strategy consists of two zones: zone_1 (rows 1 to 3, business seats) and zone_2 (economy class seats of rows 4 to 26). All seats are generated randomly, depicting the random seat assignment, as presented in Figure 10.
Seats at then randomly shuffled at both zones by invoking the random_shuffle operation on seat queues.
5.3. Seat Generation in Window Middle Aisle (WMA) Strategy
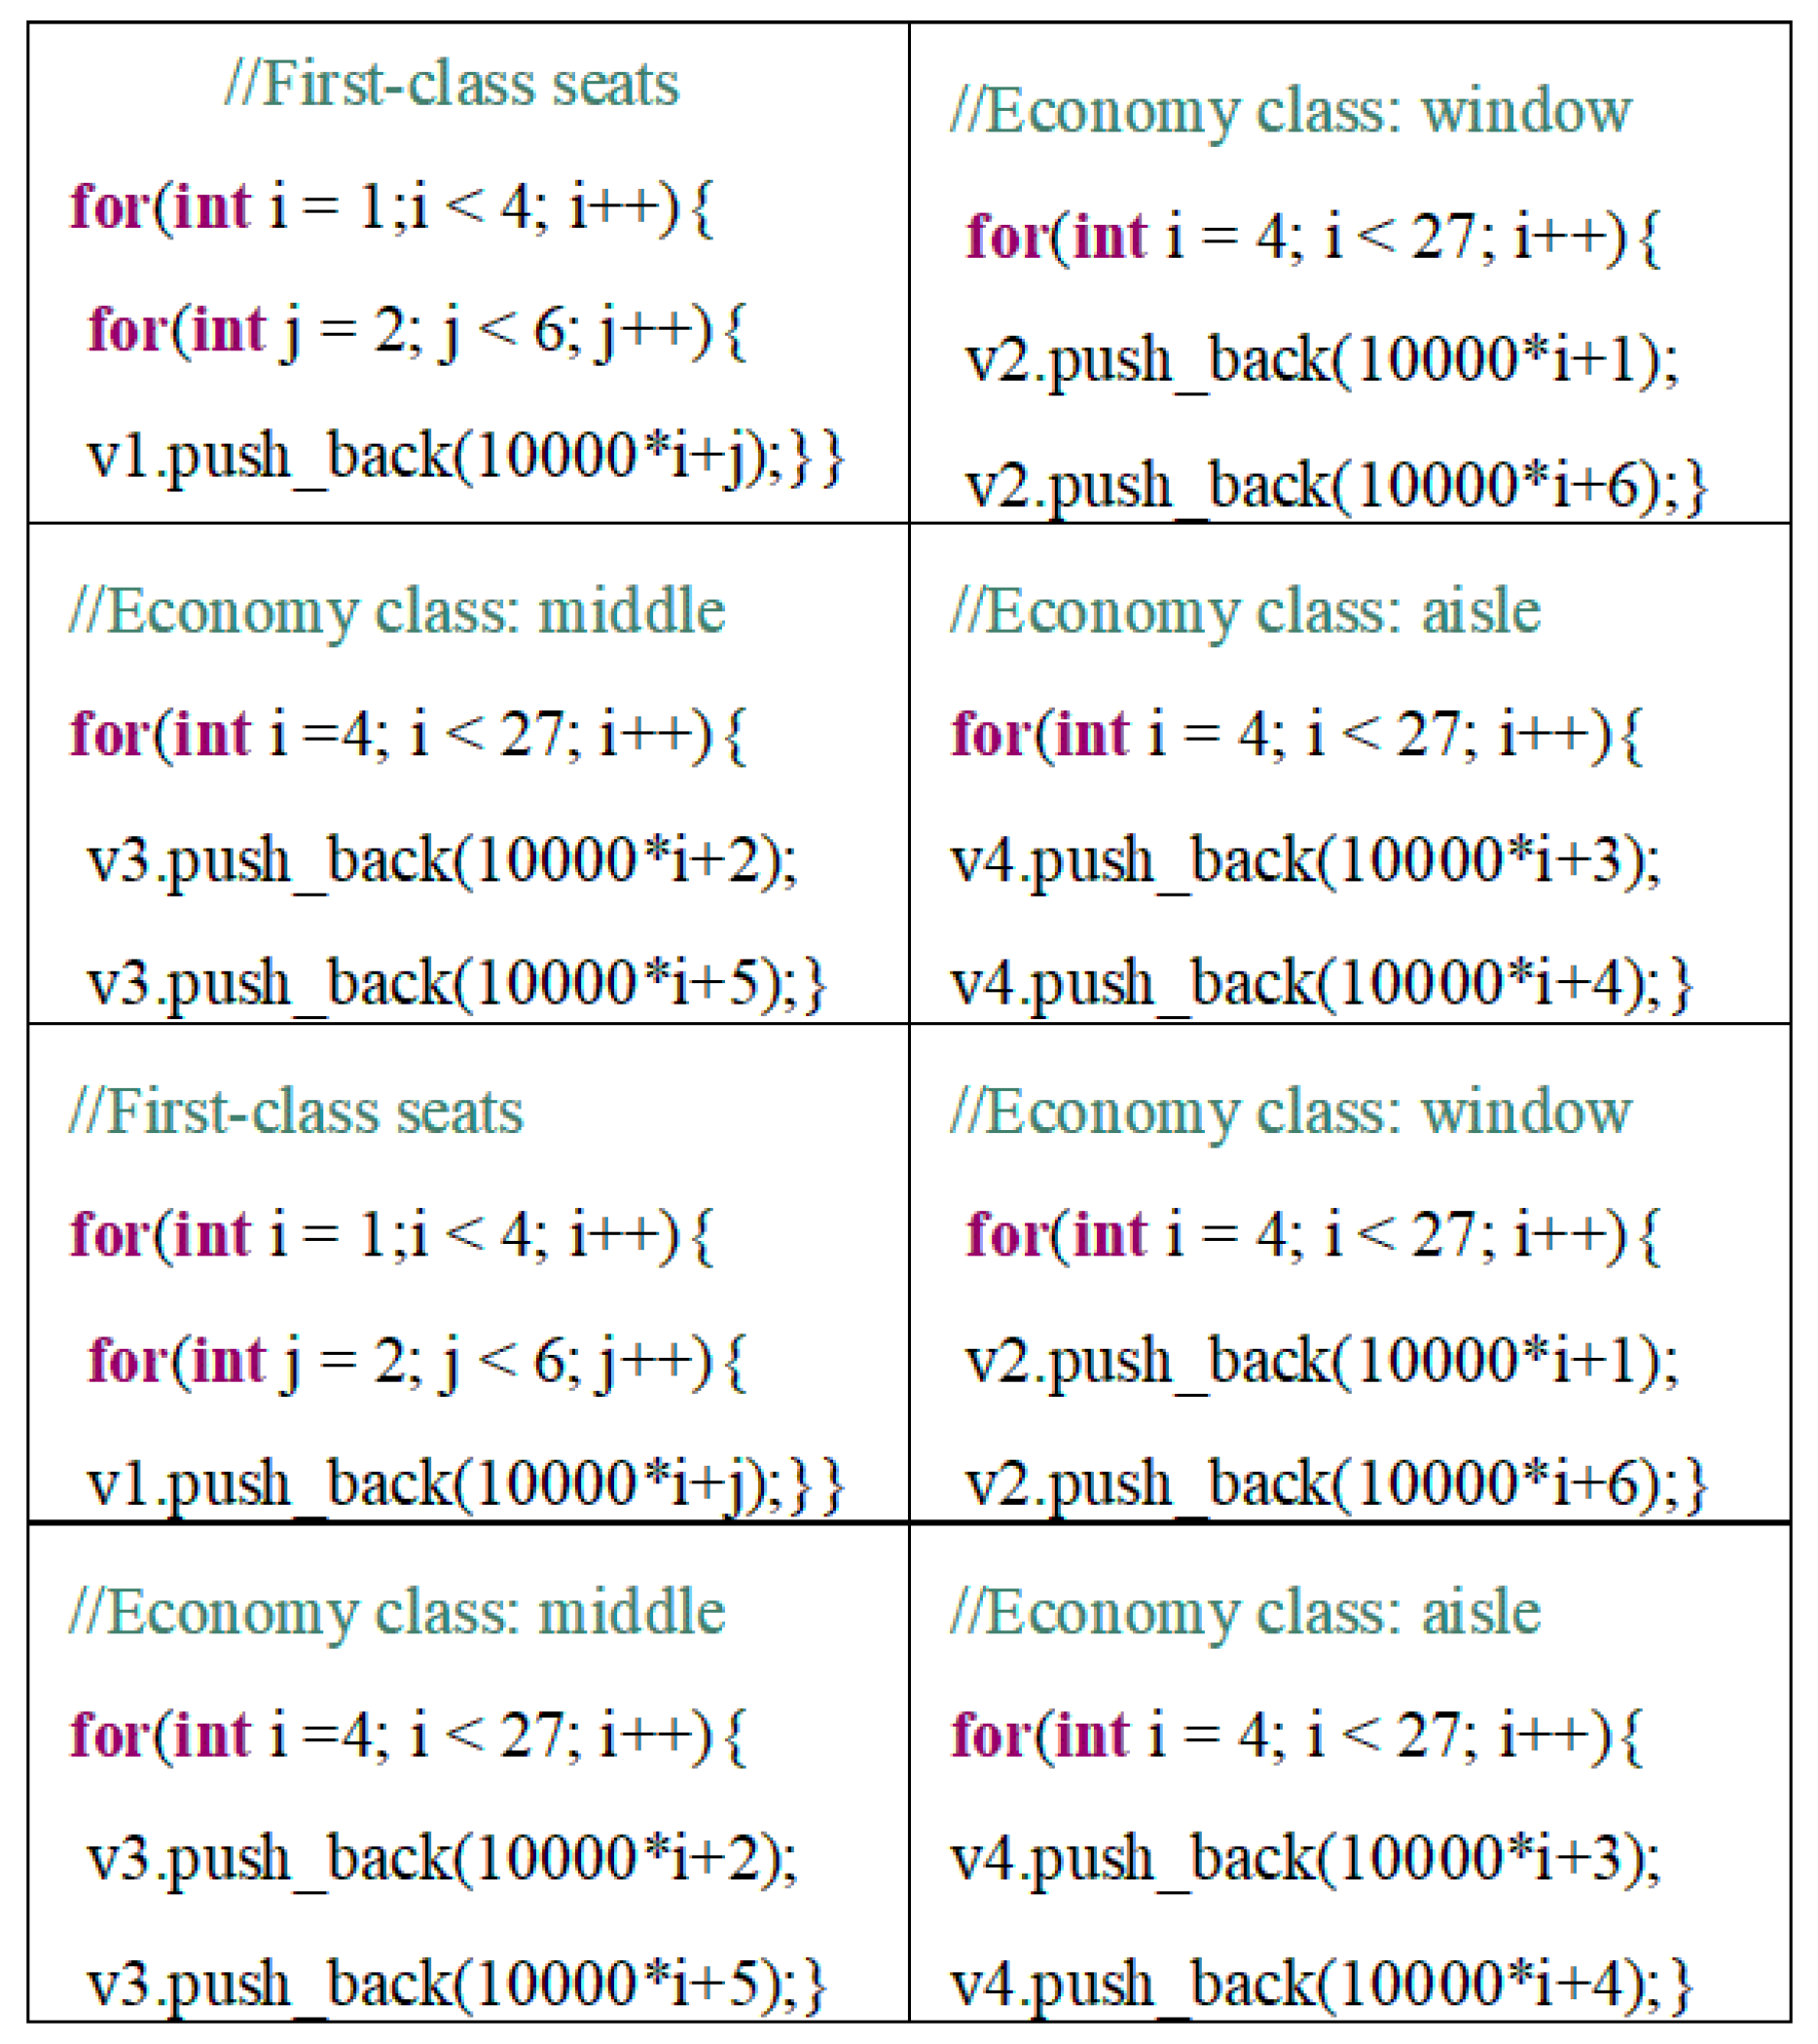
The WMA strategy defines four zones: zone_1 (rows 1 to 3, business seats), zone_2 (window seats of rows 4 to 26), zone_3 (middle seats of rows 4 to 26) and zone_4 (aisle seats of rows 4 to 26). The first zone seats are generated similar to Back-to-Front Strategy and then the seats for the remaining three zones are generated as presented in Figure 11.
As discussed in Back-to-Front strategy, the seat numbers are sent to the Aircraft by selecting random seat numbers from within each zone, given a zone sequence of: first-class (zone_1), window seats (zone_2), middle seats (zone_3) and aisle seats (zone_4). Only when a zone is completely seated, the next zone is selected for seating (random fashion is only within each zone, the zones follow WMA sequence).
5.4. Seat Generation in Zone Rotate Strategy
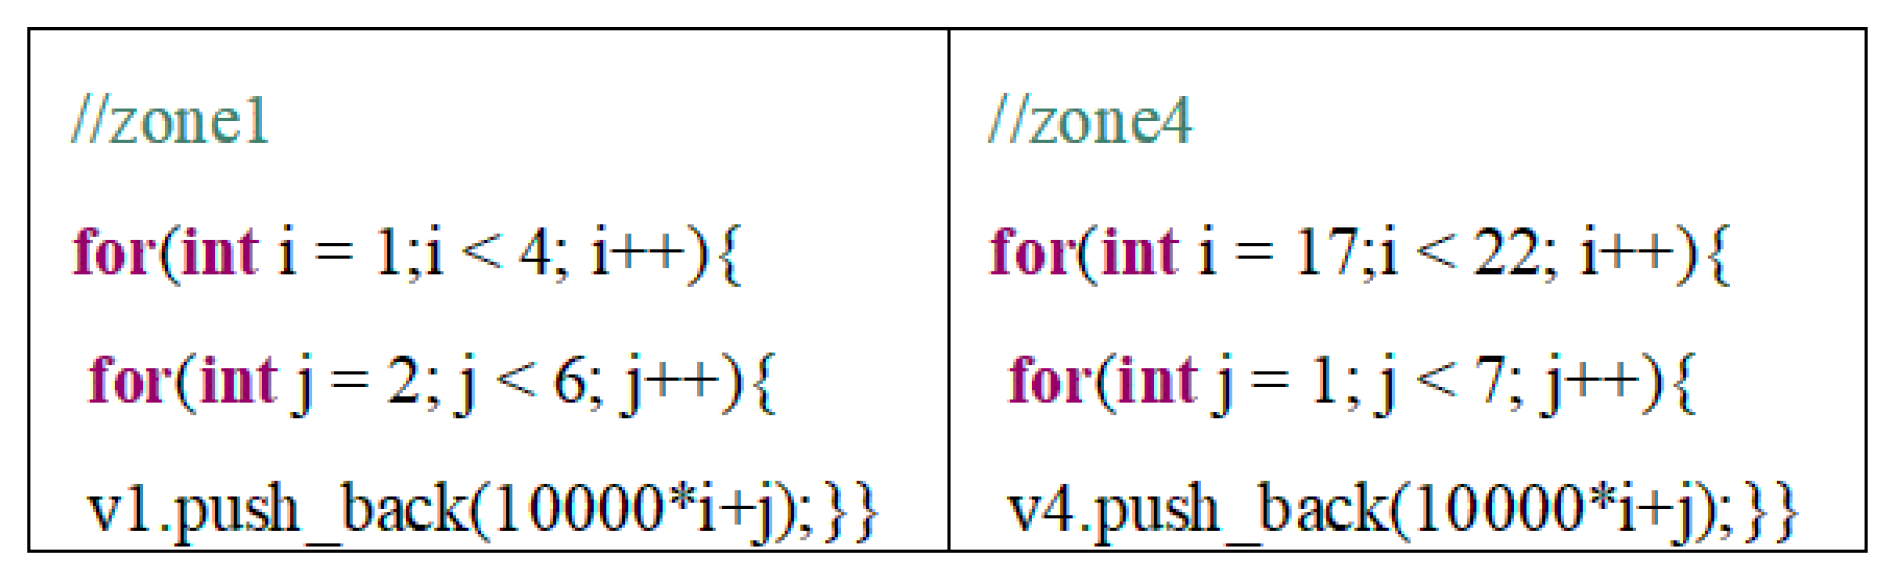
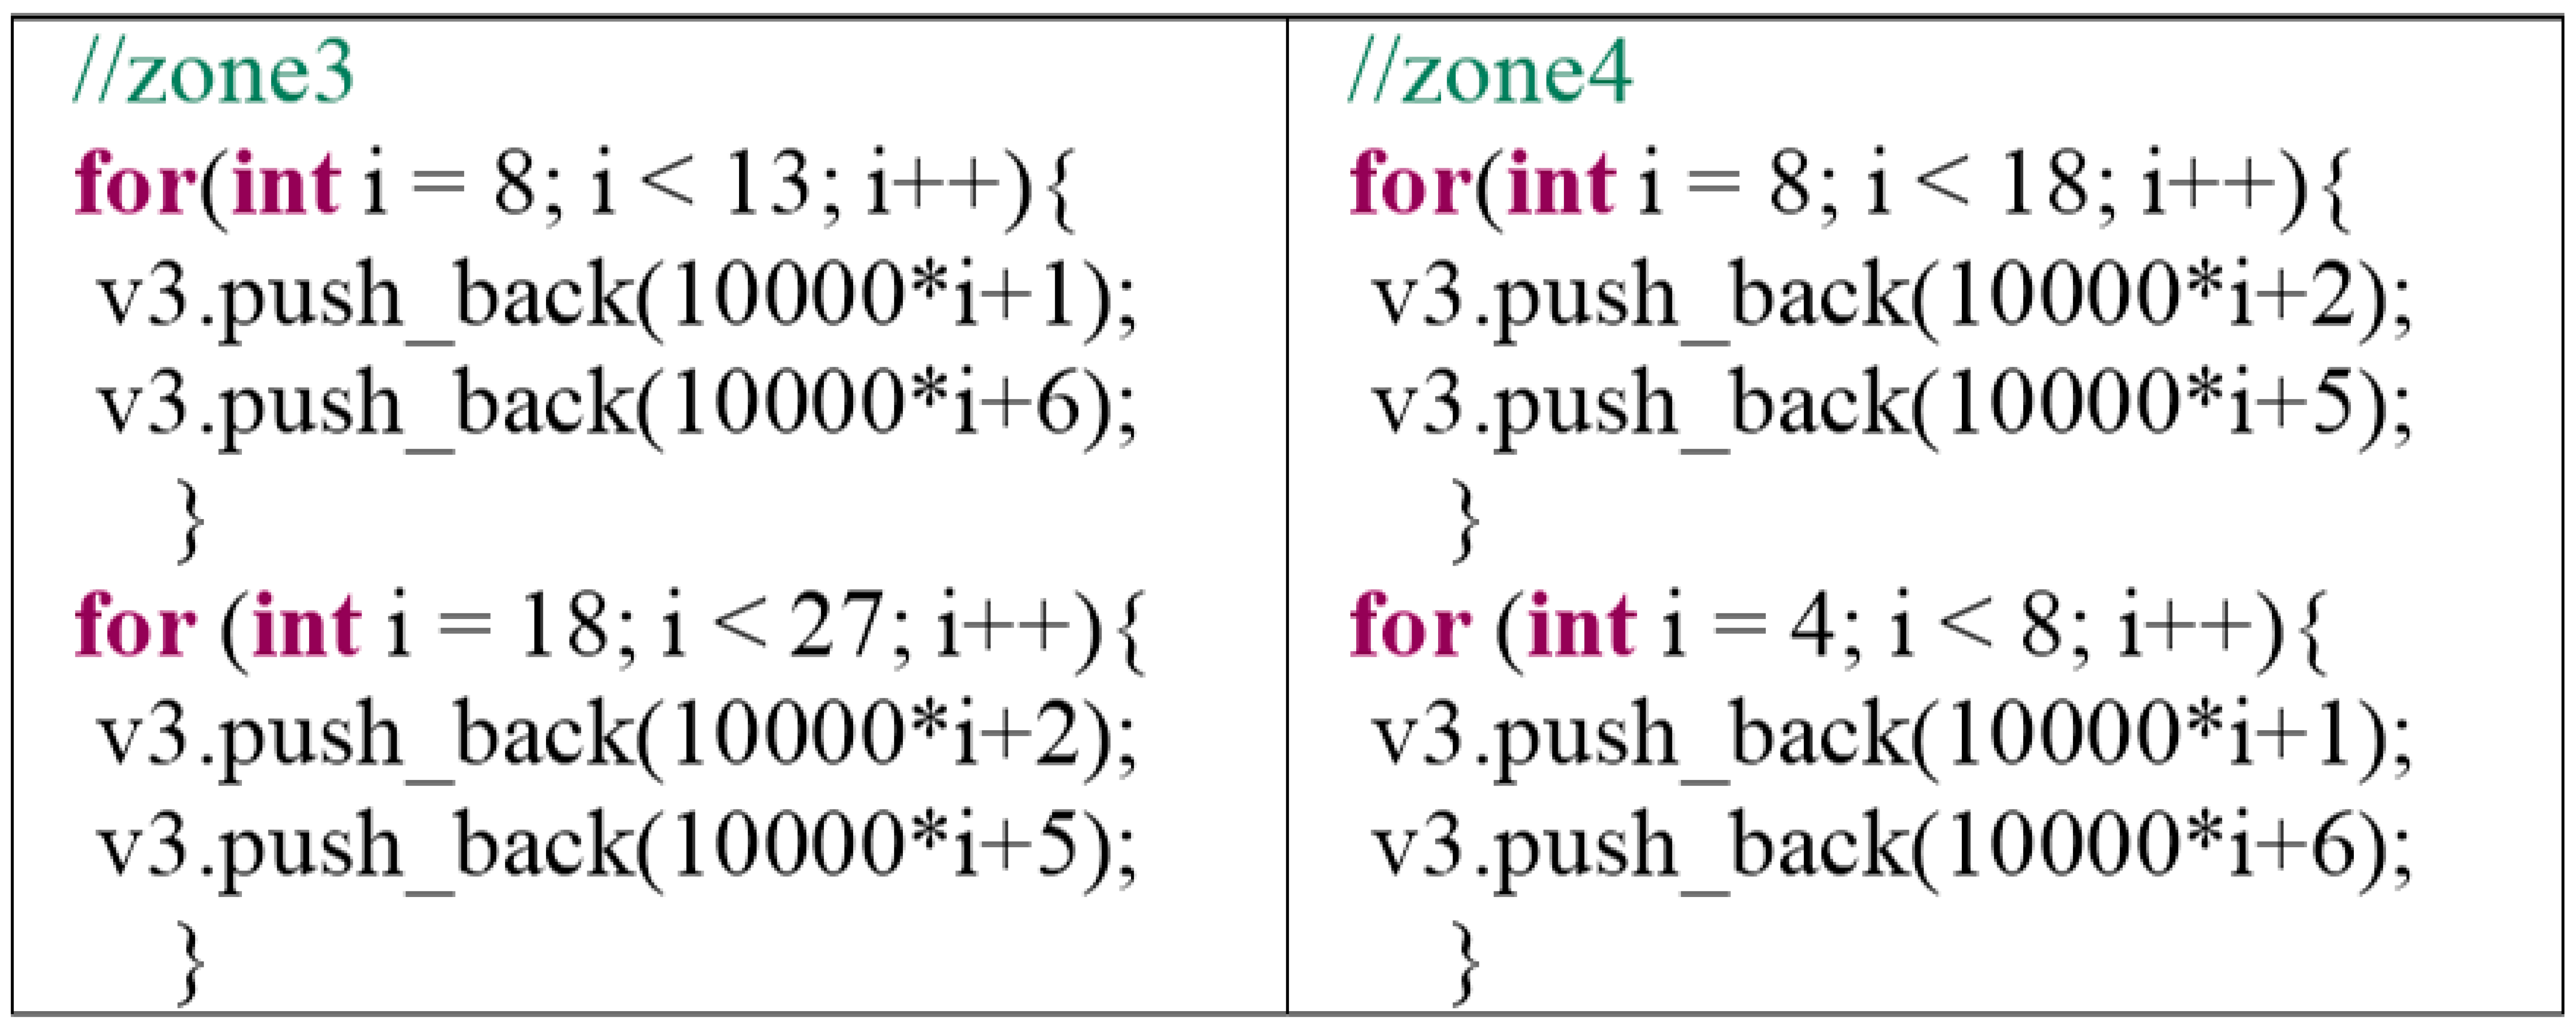
Zone Rotate strategy defines six zones: zone_1 (rows 1 to 3, business seats), zone_2 (rows 22 to 26), zone_3 (rows 4 to 8), zone_4 (rows 17 to 21), zone_5 (rows 9 to 13) and zone_6 (rows 14 to 16). Figure 12 provides the implementation of zone_1 and zone_4. Similar to other strategies, seats within each zone are then randomly shuffled.
5.5. Seat Generation in Reverse Pyramid (RP) Strategy
Similar to Back-to-Front, the RP strategy defines six zones: zone_1 (rows 1 to 3, business seats), zone_2 (window seats of rows 13 to 26), zone_3 (window seats of rows 8 to 12 and middle seats of rows 18 to 26), zone_4 (middle seats of rows 8 to 17 and window seats of rows 4 to 7), zone_5 (aisle seats of rows 17 to 26 and middle seats of rows 4 to 7) and zone_6 (aisle seats of rows 4 to 16). Figure 13 provides the implementation of zone_3 and zone_4.
5.6. Seat Generation in Optimal Strategy
The Optimal strategy consists of thirteen zones, where seats are assigned to each zone as follows: zone_1 (rows 1 to 3, business seats), zone_2 (right side window seats on odd rows 4 to 26), zone_3 (left side window seats on odd rows 4 to 26), zone_4 (right side window seats on even rows 4 to 26), zone_5 (left side window seats on even rows 4 to 26), zone_6 (right side middle seats on odd rows 4 to 26), zone_7 (left side middle seats on odd rows 4 to 26), zone_8 (right side middle seats on even rows 4 to 26), zone_9 (left side middle seats on even rows 4 to 26), zone_10 (right side aisle seats on odd rows 4 to 26), zone_11 (left side aisle seats on odd rows 4 to 26), zone_12 (right side aisle seats on even rows 4 to 26) and zone_13 (left side aisle seats on even rows 4 to 26). Figure 14 shows seat generation of only two sample zones.
5.7. Seat Generation in Optimal Practical Strategy
The Optimal practical strategy consists of five zones, with the following configuration: zone_1 (first-class, rows 1 to 3), zone_2 (left side seats on odd rows 4–36), zone_3 (right side seats on odd rows 4–36), zone_4 (left side seats on even rows 4–36) and zone_5 (right side seats on even rows 4–36). Figure 14 and Figure 15 shows seat generation of only two sample zones. As in Optimal Strategy, seats within each zone are randomly shuffled afterwards.
5.8. Seat Generation in Efficient Strategy
The Efficient strategy generates five zones, where zones are assigned the following seat numbers: zone_1 (first-class, rows 1 to 3), zone_2 (window seats on rows 16 to 26 and middle seats on rows 22 to 26), zone_3 (window seats on rows 12 to 15 and middle seats on rows 15 to 21 and aisle seats on rows 21 to 26), zone_4 (window seats on rows 5 to 11 , middle seats on rows 10 to 14 and aisle seats on rows 15 to 20) and zone_5 (window seats on row 4, middle seats on rows 4 to 9 and aisle seats on rows 4 to 14). Figure 16 shows seat generation of only two sample zones. Seats within each zone are then randomly shuffled.
Unlike the DEVS Passenger Generator model which has to behave differently under various boarding strategies, the Aircraft Cell-DEVS model is exactly the same. The following section reveals its details.
5.9. Aircraft Rules Specification and Implementation
Based on the Cell-DEVS model defined in Section 3, the Aircraft model implements a series of rules that are evaluated for every cell on the cell space over time steps. As mentioned before, the eight boarding strategies use the exact same Cell-DEVS Aircraft model, since the boarding pattern really depends on the order at which passengers are called to enplane. This is handled by the DEVS Passenger Generator model described in the previous section. Here we will present the cellular model rules and explain how simulation evolves based on the discrete-event continuous-time property of DEVS theory.
The rules are divided into two groups:
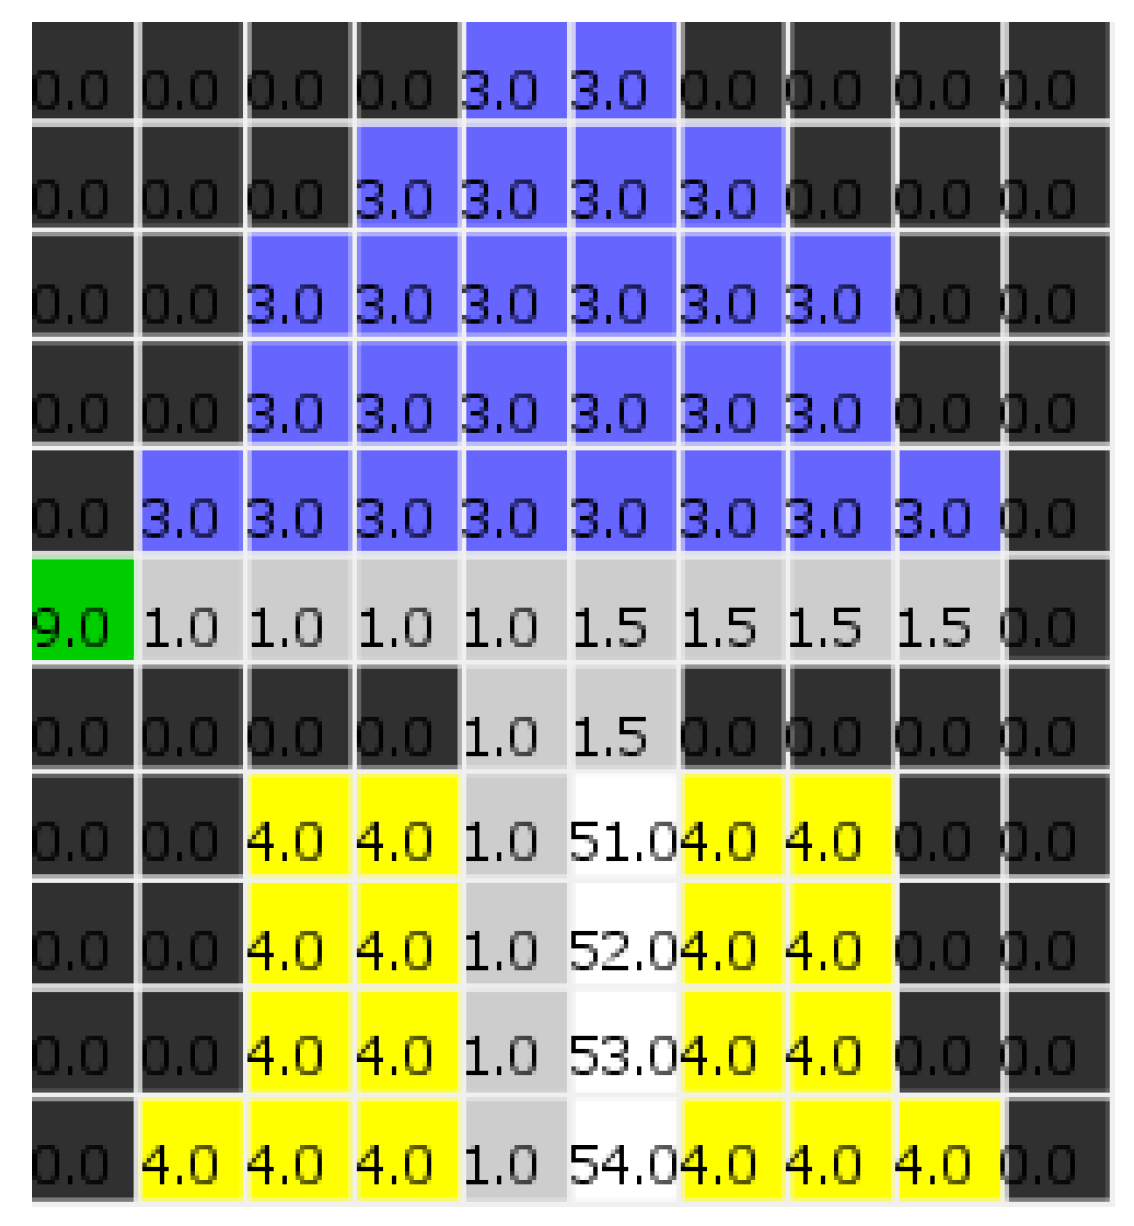
- pre-seat rules: a set of nine rules with responsibilities to send requests to the Passenger Generator model to release passengers and guide passengers at the aircraft door to walk to the beginning of the seats aisle. The area that pre-seat rules apply to is from cell (0, 0) to cell (6, 0) where cell (y, x) defines the y and x coordinates of the cell on the grid. The affected area by pre-seat rules is highlighted in a surrounding solid box in Figure 17.
- seating rules: a set of 33 rules handling passengers’ forward movement within the aisle and occupation of seats. These rules only apply to the cells that represent the seats (both first-class and economy) and the aisle, as well as passengers on these cells. This area is highlighted in Figure 17 with a surrounding dashed box.
A rule in Cell-DEVS is the local computing function which is defined in the form of {result} delay {precondition}. This indicates that when the precondition is met, the state of the cell changes to the designated result after the duration specified by delay. If the precondition is not met, then the next rule is evaluated until a rule is satisfied or there are no more rules. In the space below we will present some of the rules implemented in Aircraft model.
For instance, the following rule (from pre-seat rules):
rule: {(0,0) + send(out1,2)} 0 {(0,0) = 2}
defines that whenever the door cell is unoccupied, a request for passenger entrance should be sent to the Passenger Generator model immediately.
Now let’s consider the seating rules for a scenario where a passenger is walking down the aisle with a window seat assigned to her. There are four possible scenarios, thus four evaluation rules:
(1) Aisle seat and middle seat is occupied:
rule: 1 #Macro(WBothSeatDelayAddUp) {(0,0) > 10000 and (0,−1) = 4 and (0,−2) = 4}
(2) Only aisle seat is occupied:
rule: 1 #Macro(WAisleSeatDelayAddUp) {(0,0) >10000 and (0,−1) = 4 and (0,−2) > 100}
(3) Only middle seat is occupied:
rule: 1 #Macro(WMiddleSeatDelayAddUp) {(0,0) > 10000 and (0,−2) = 4 and (0,−1) > 100}
(4) Neither the aisle seat nor the middle seat is occupied:
rule: 1 #Macro(WNoneSeatDelayAddUp) {(0,0) > 10000 and (0,−1) > 100 and (0,−2) > 100}
The #Macros defined in the above rules are the fixed delays applied to the passenger when he/she gets to the assigned row. These delays are defined in a “boarding.inc” file with a format presented in Figure 18. The delay values are conducted from the literature and were addressed earlier in Table 2.
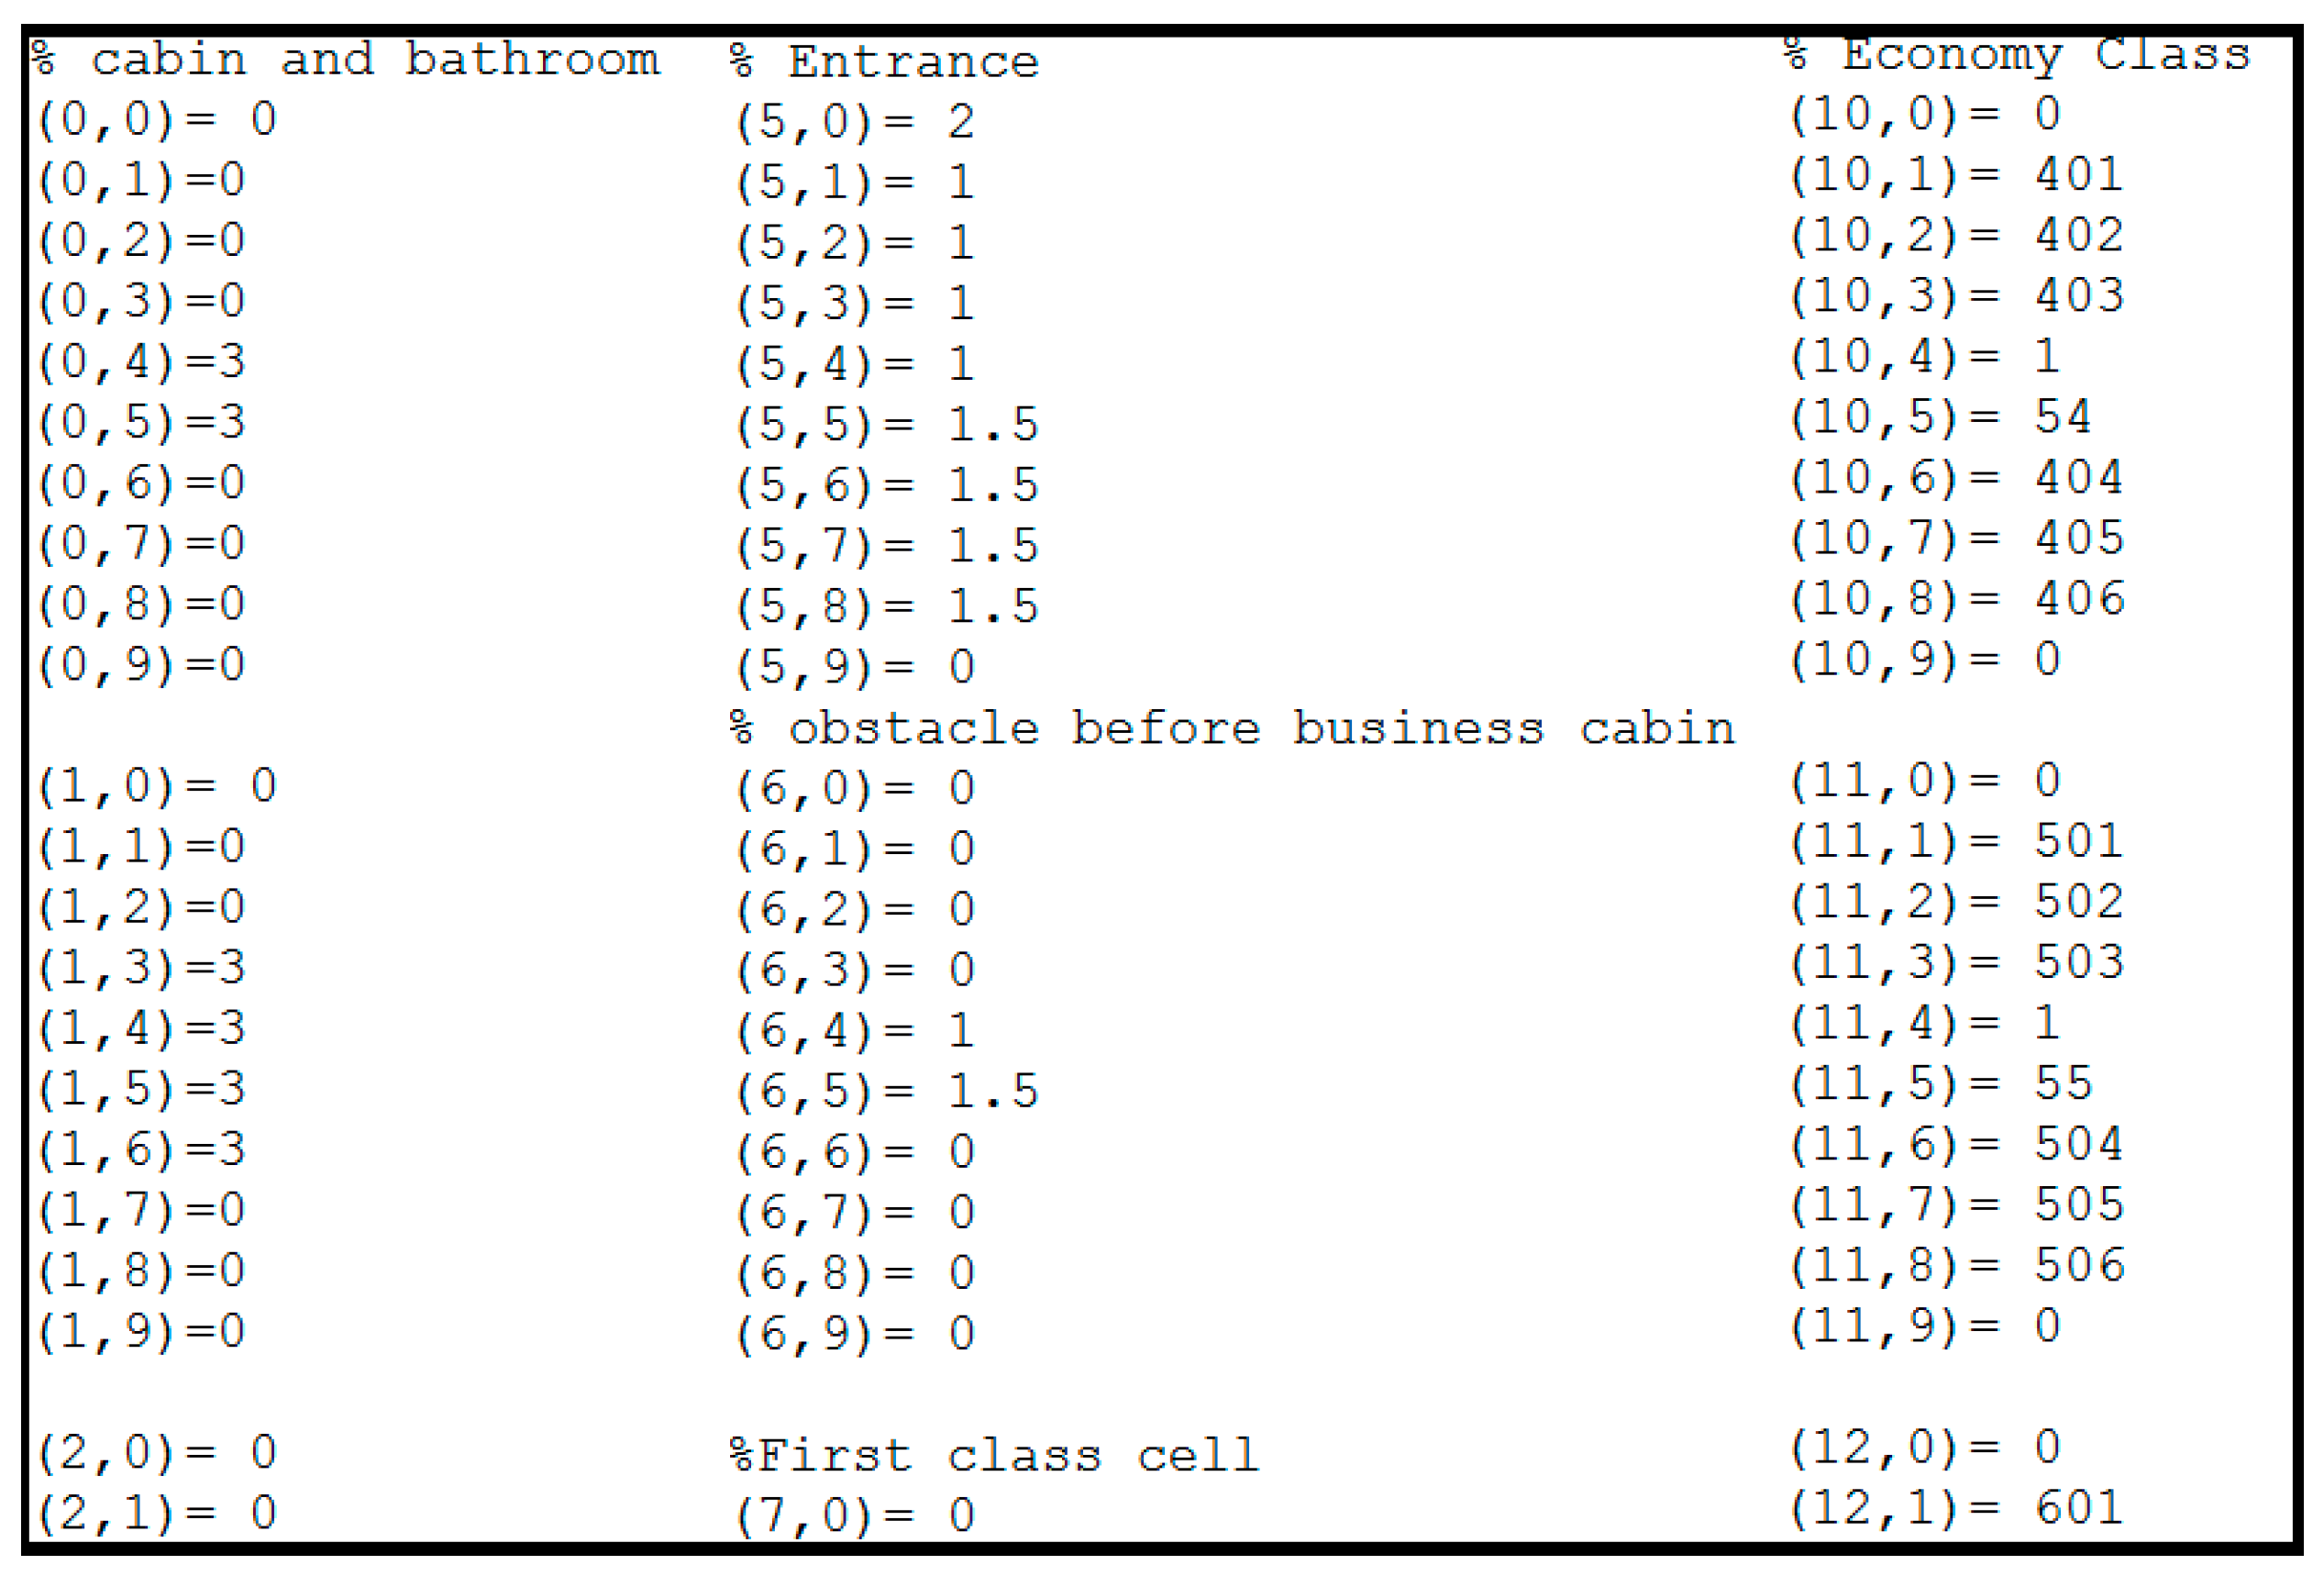
In order to execute the simulations, a model file is created, providing DEVS top level structure where Passenger Generator and Cellular Aircraft models are connected through coupling. CD++ allows creating and editing model file by providing syntax checking mechanism. Another file that needs to be generated is the model initialization file, consisting of initial values for the cells, as demonstrated in Figure 19.
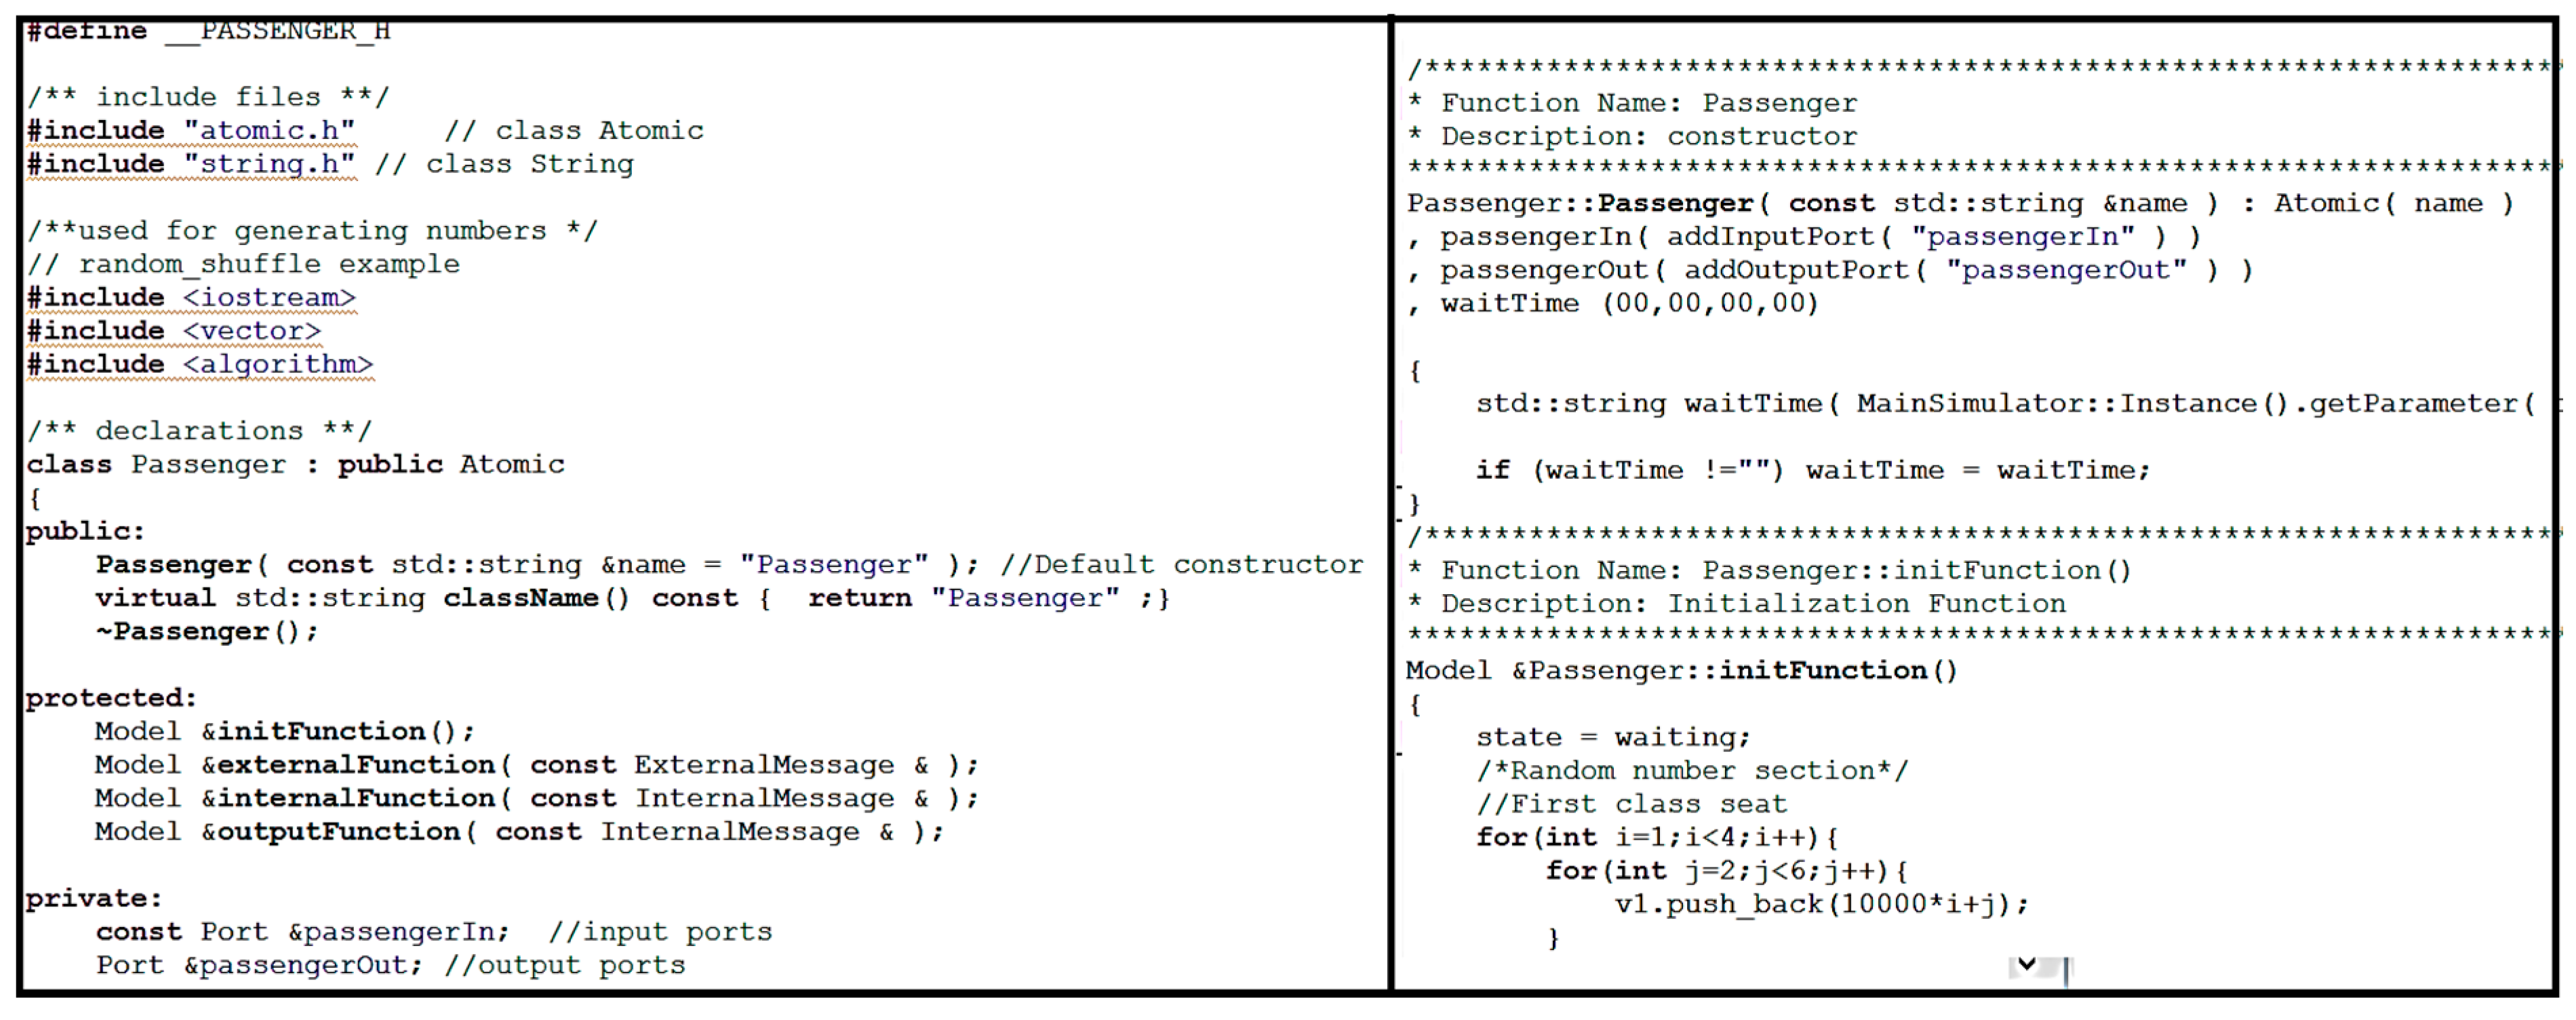
The Passenger Generator, a DEVS model, is implemented in C++ (requiring a header and source code files). Figure 20 provides a screenshot of the Passenger Generator source code Figure 20.
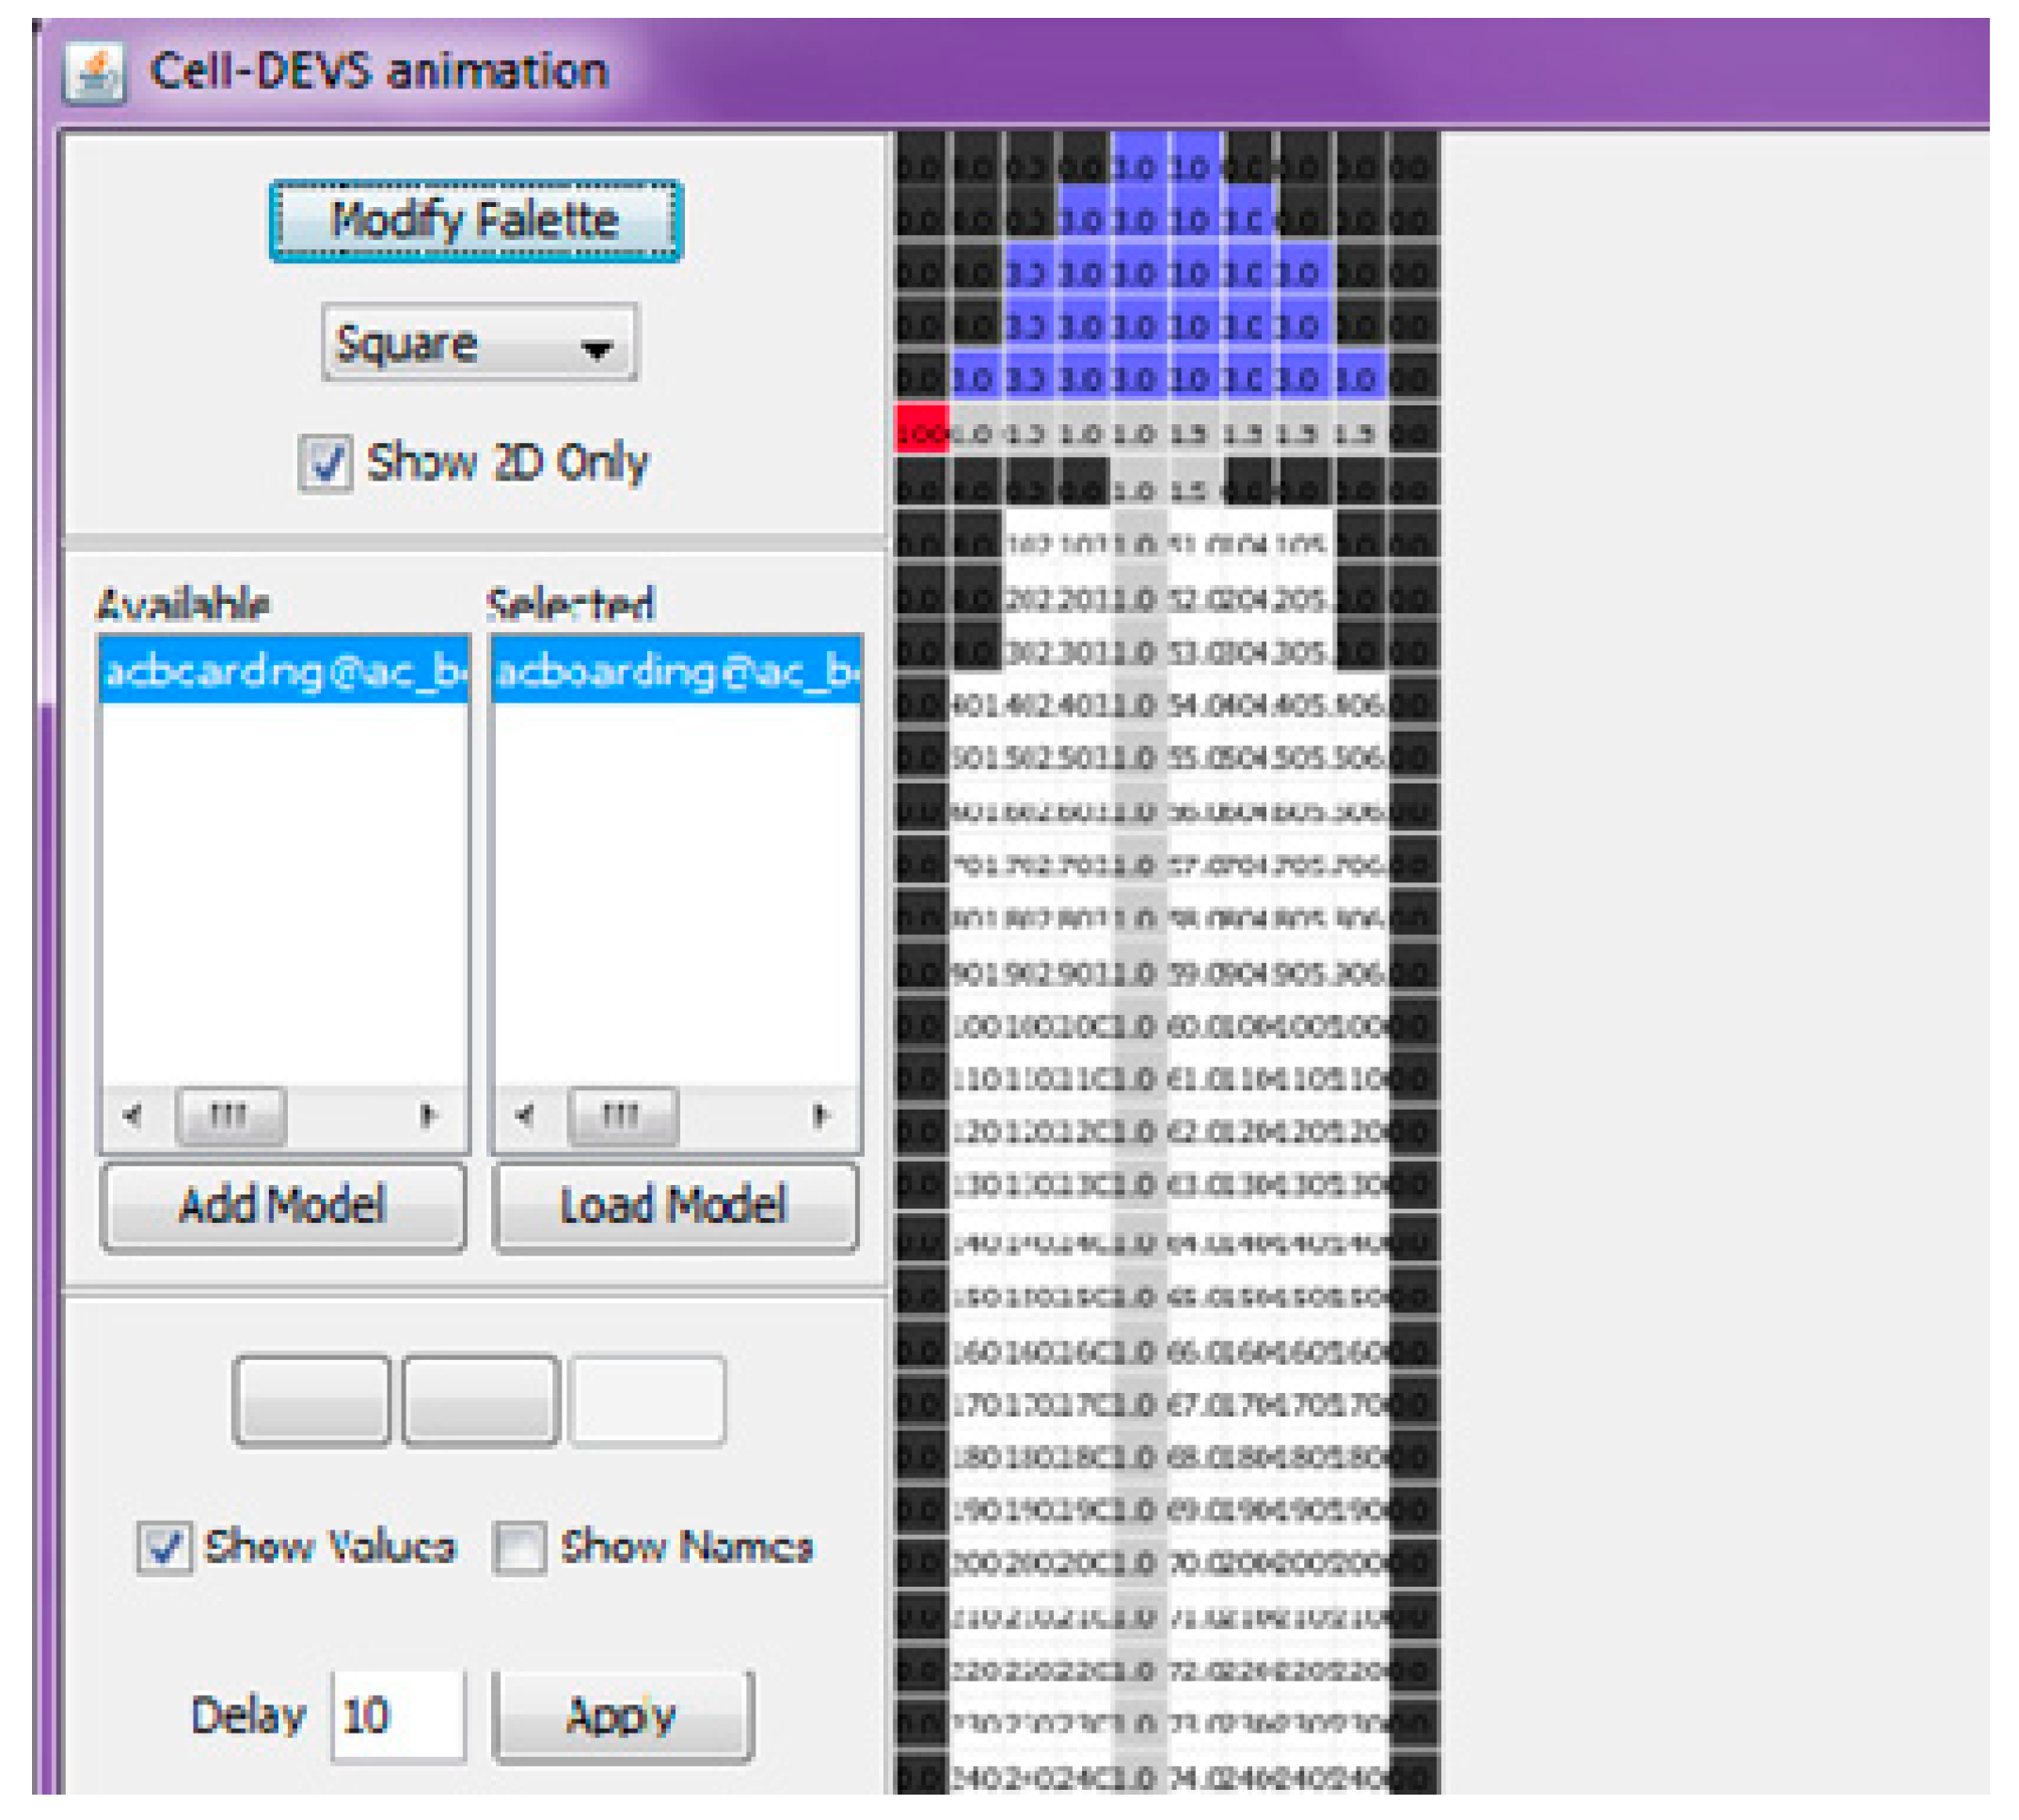
CD++ provides a visualization tool, called CD++ Modeler, which takes the result of the Cell-DEVS simulation as input and generates a 2-D representation of the cell space evolution over the simulation time (presented in Figure 21). We will use this feature to visually present the results of our simulations.
6. Simulation Results
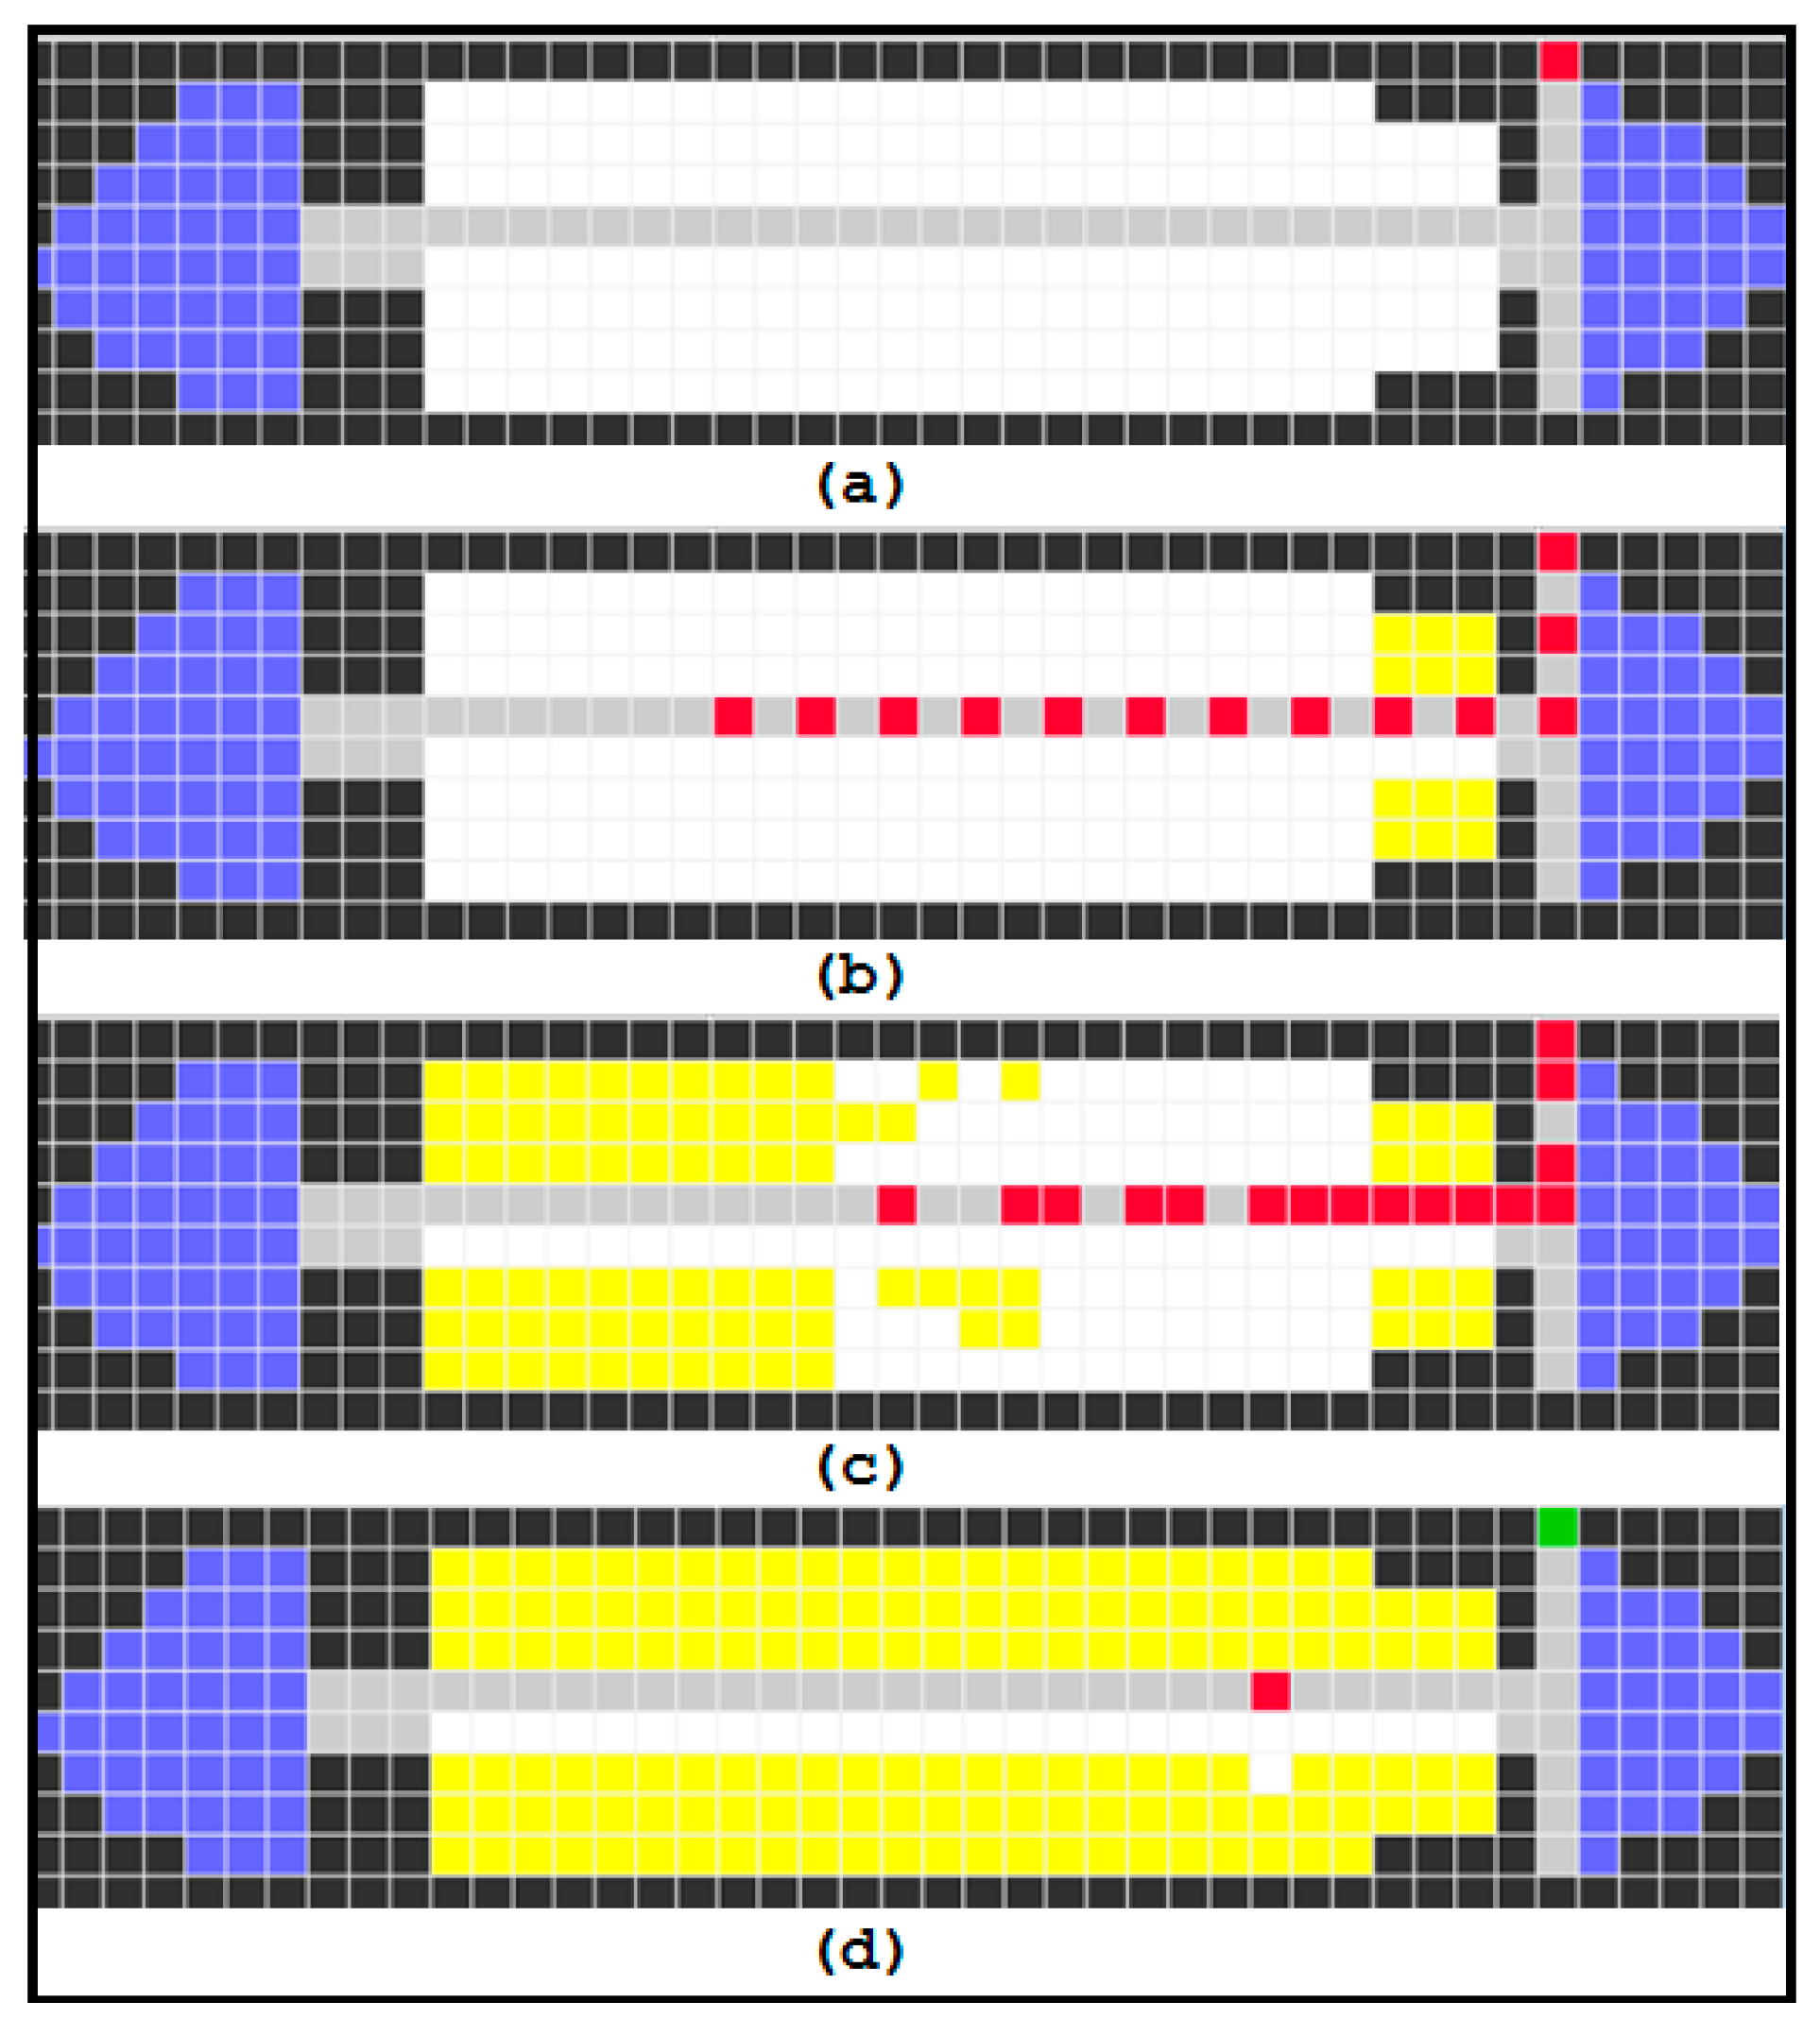
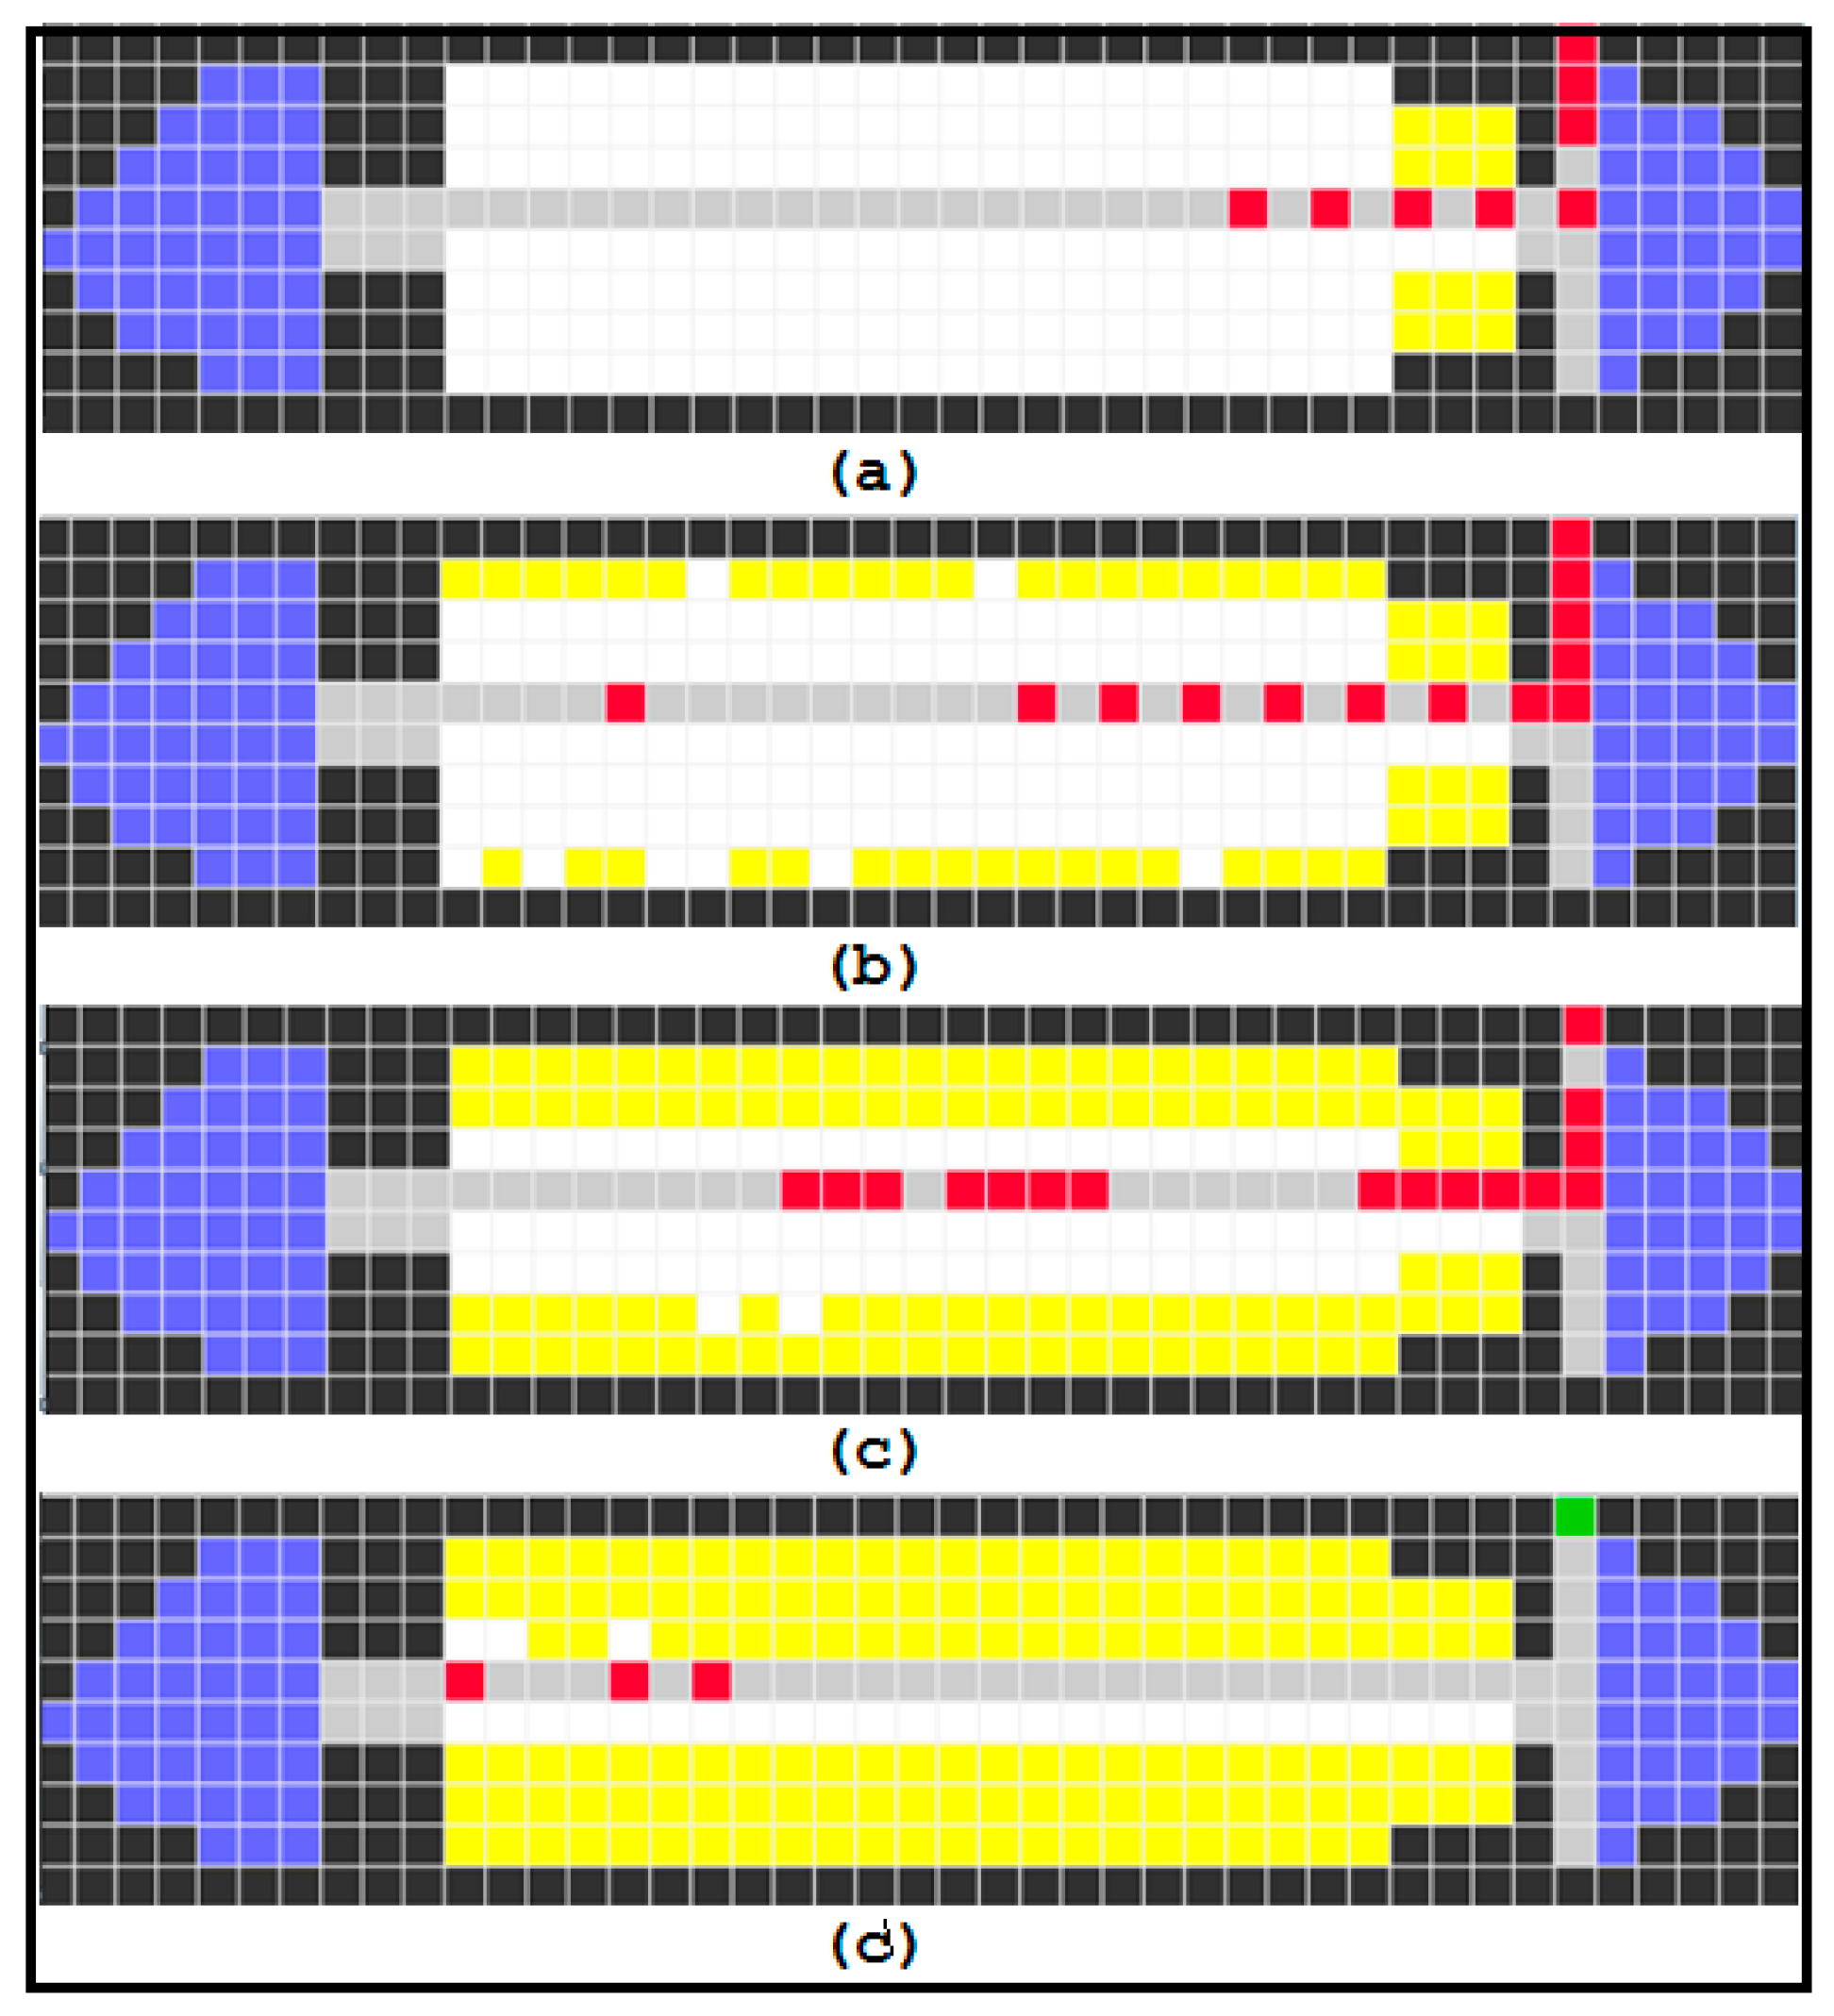
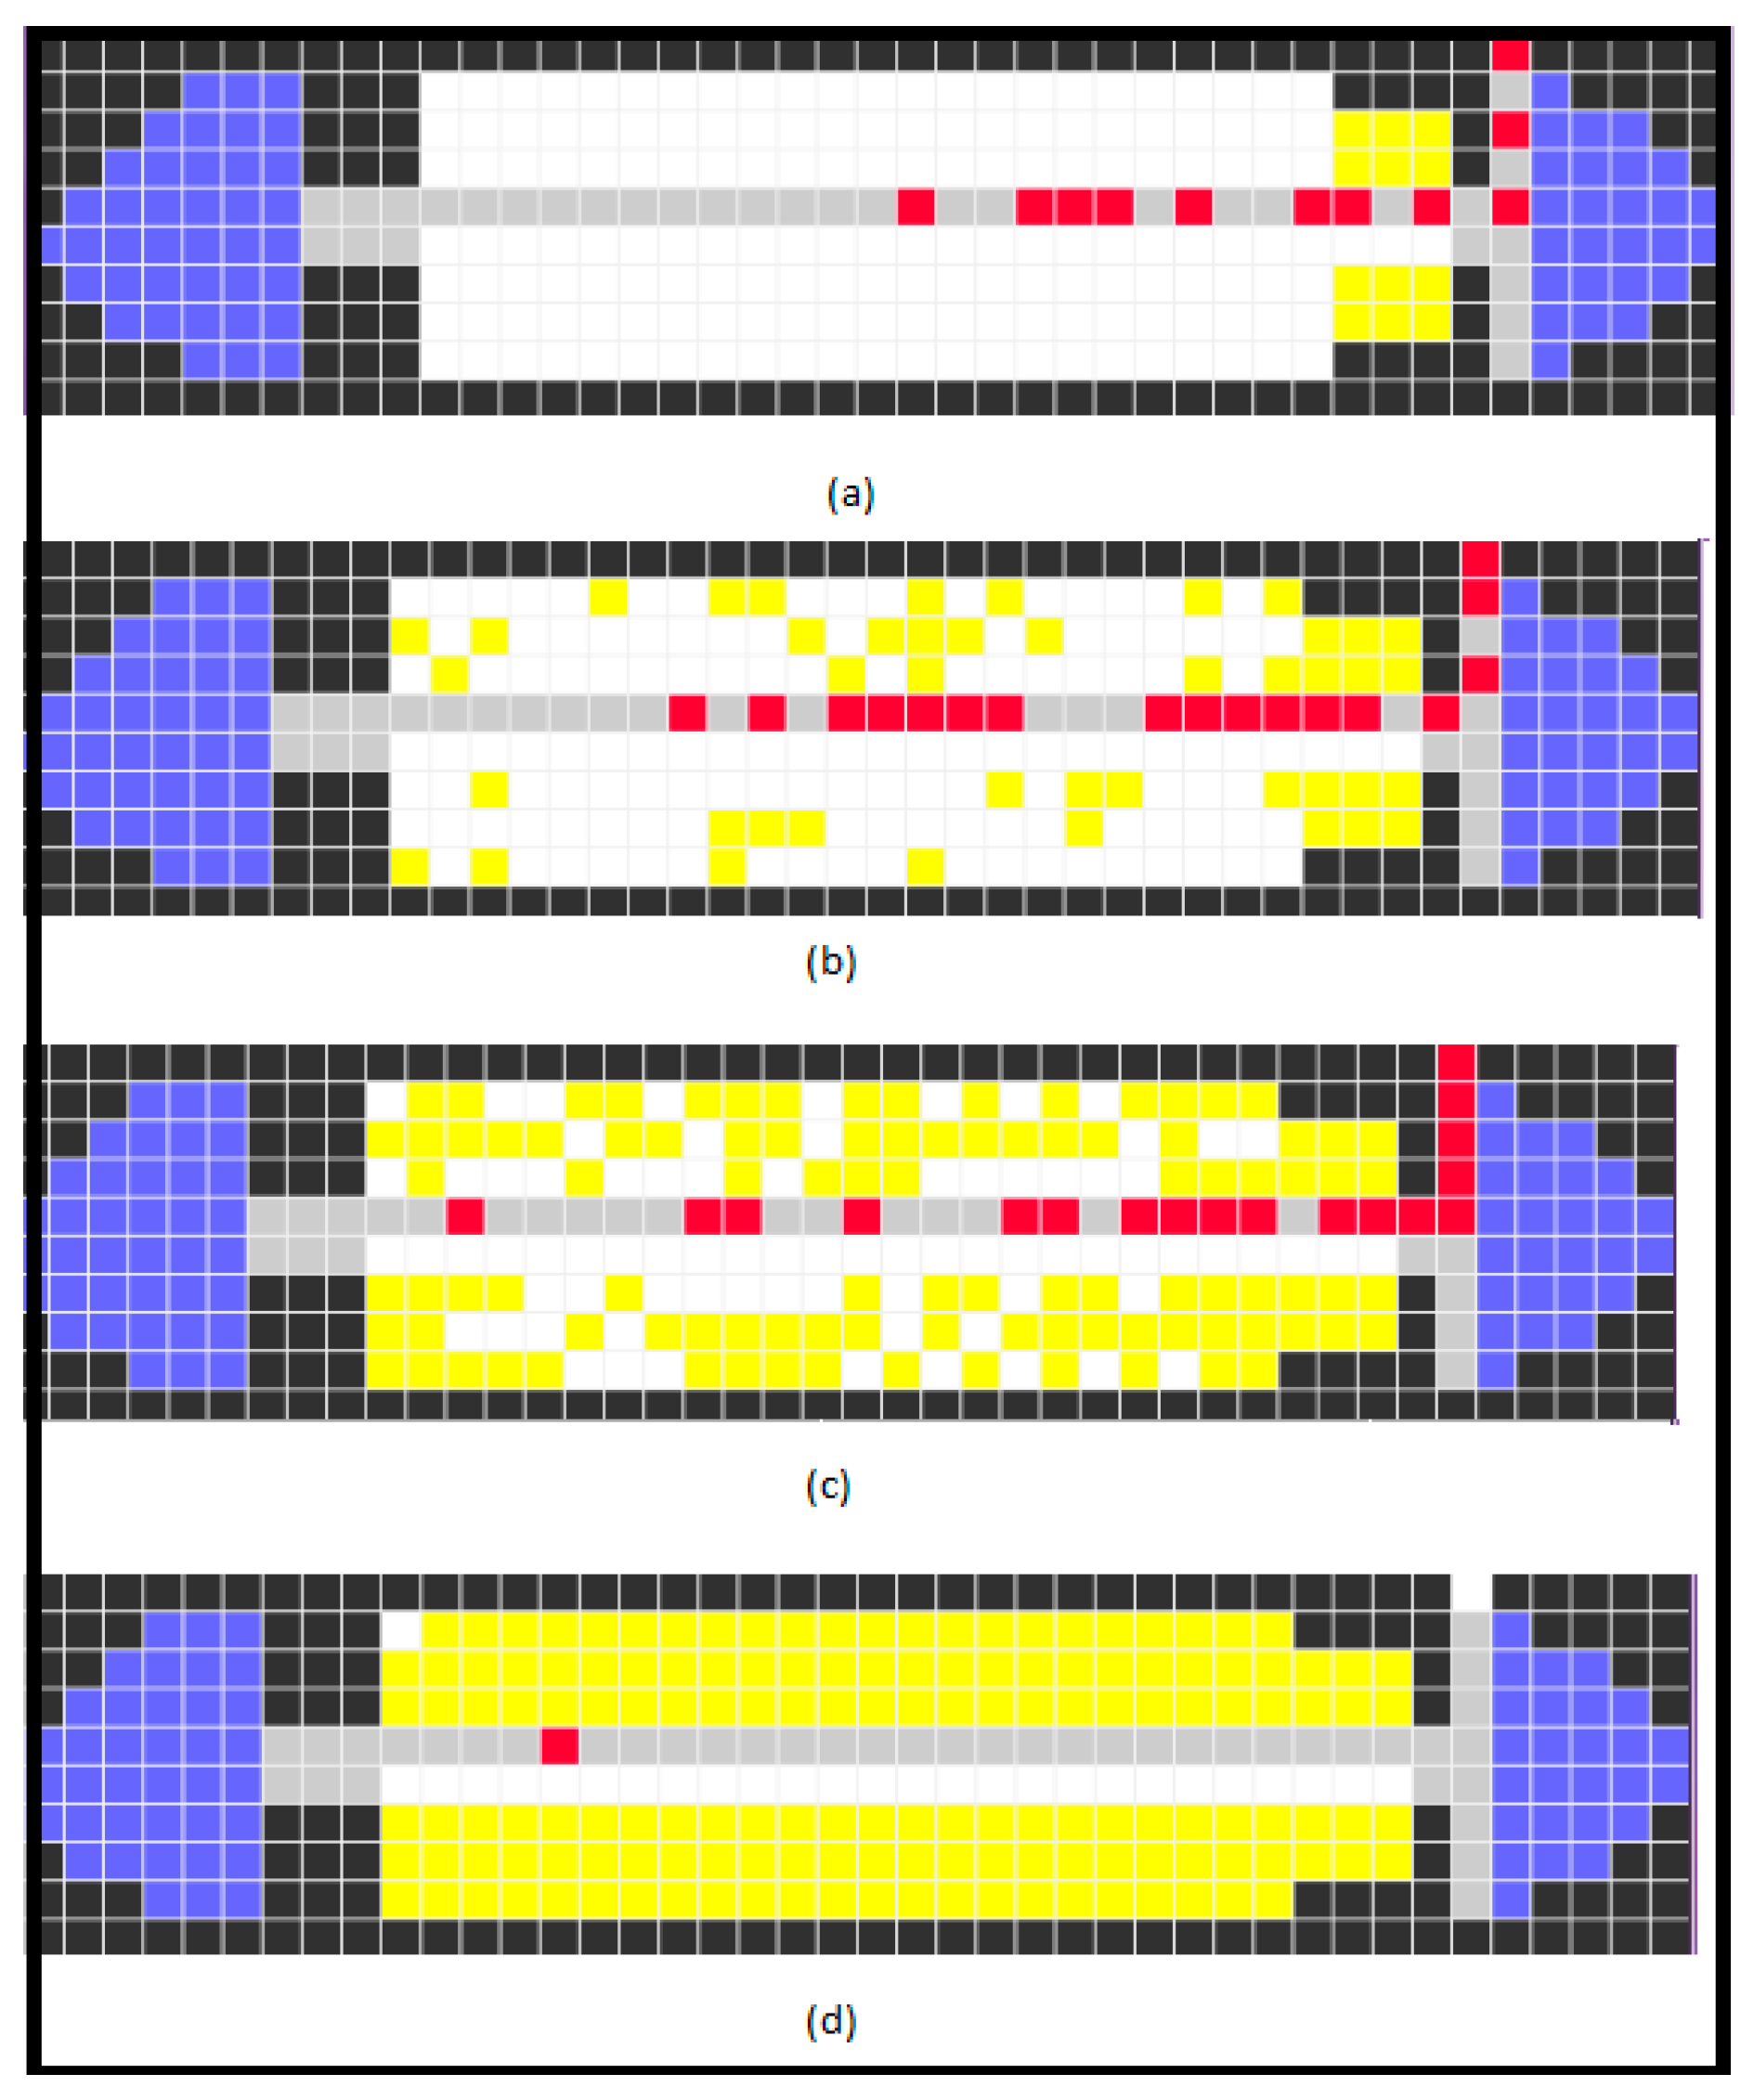
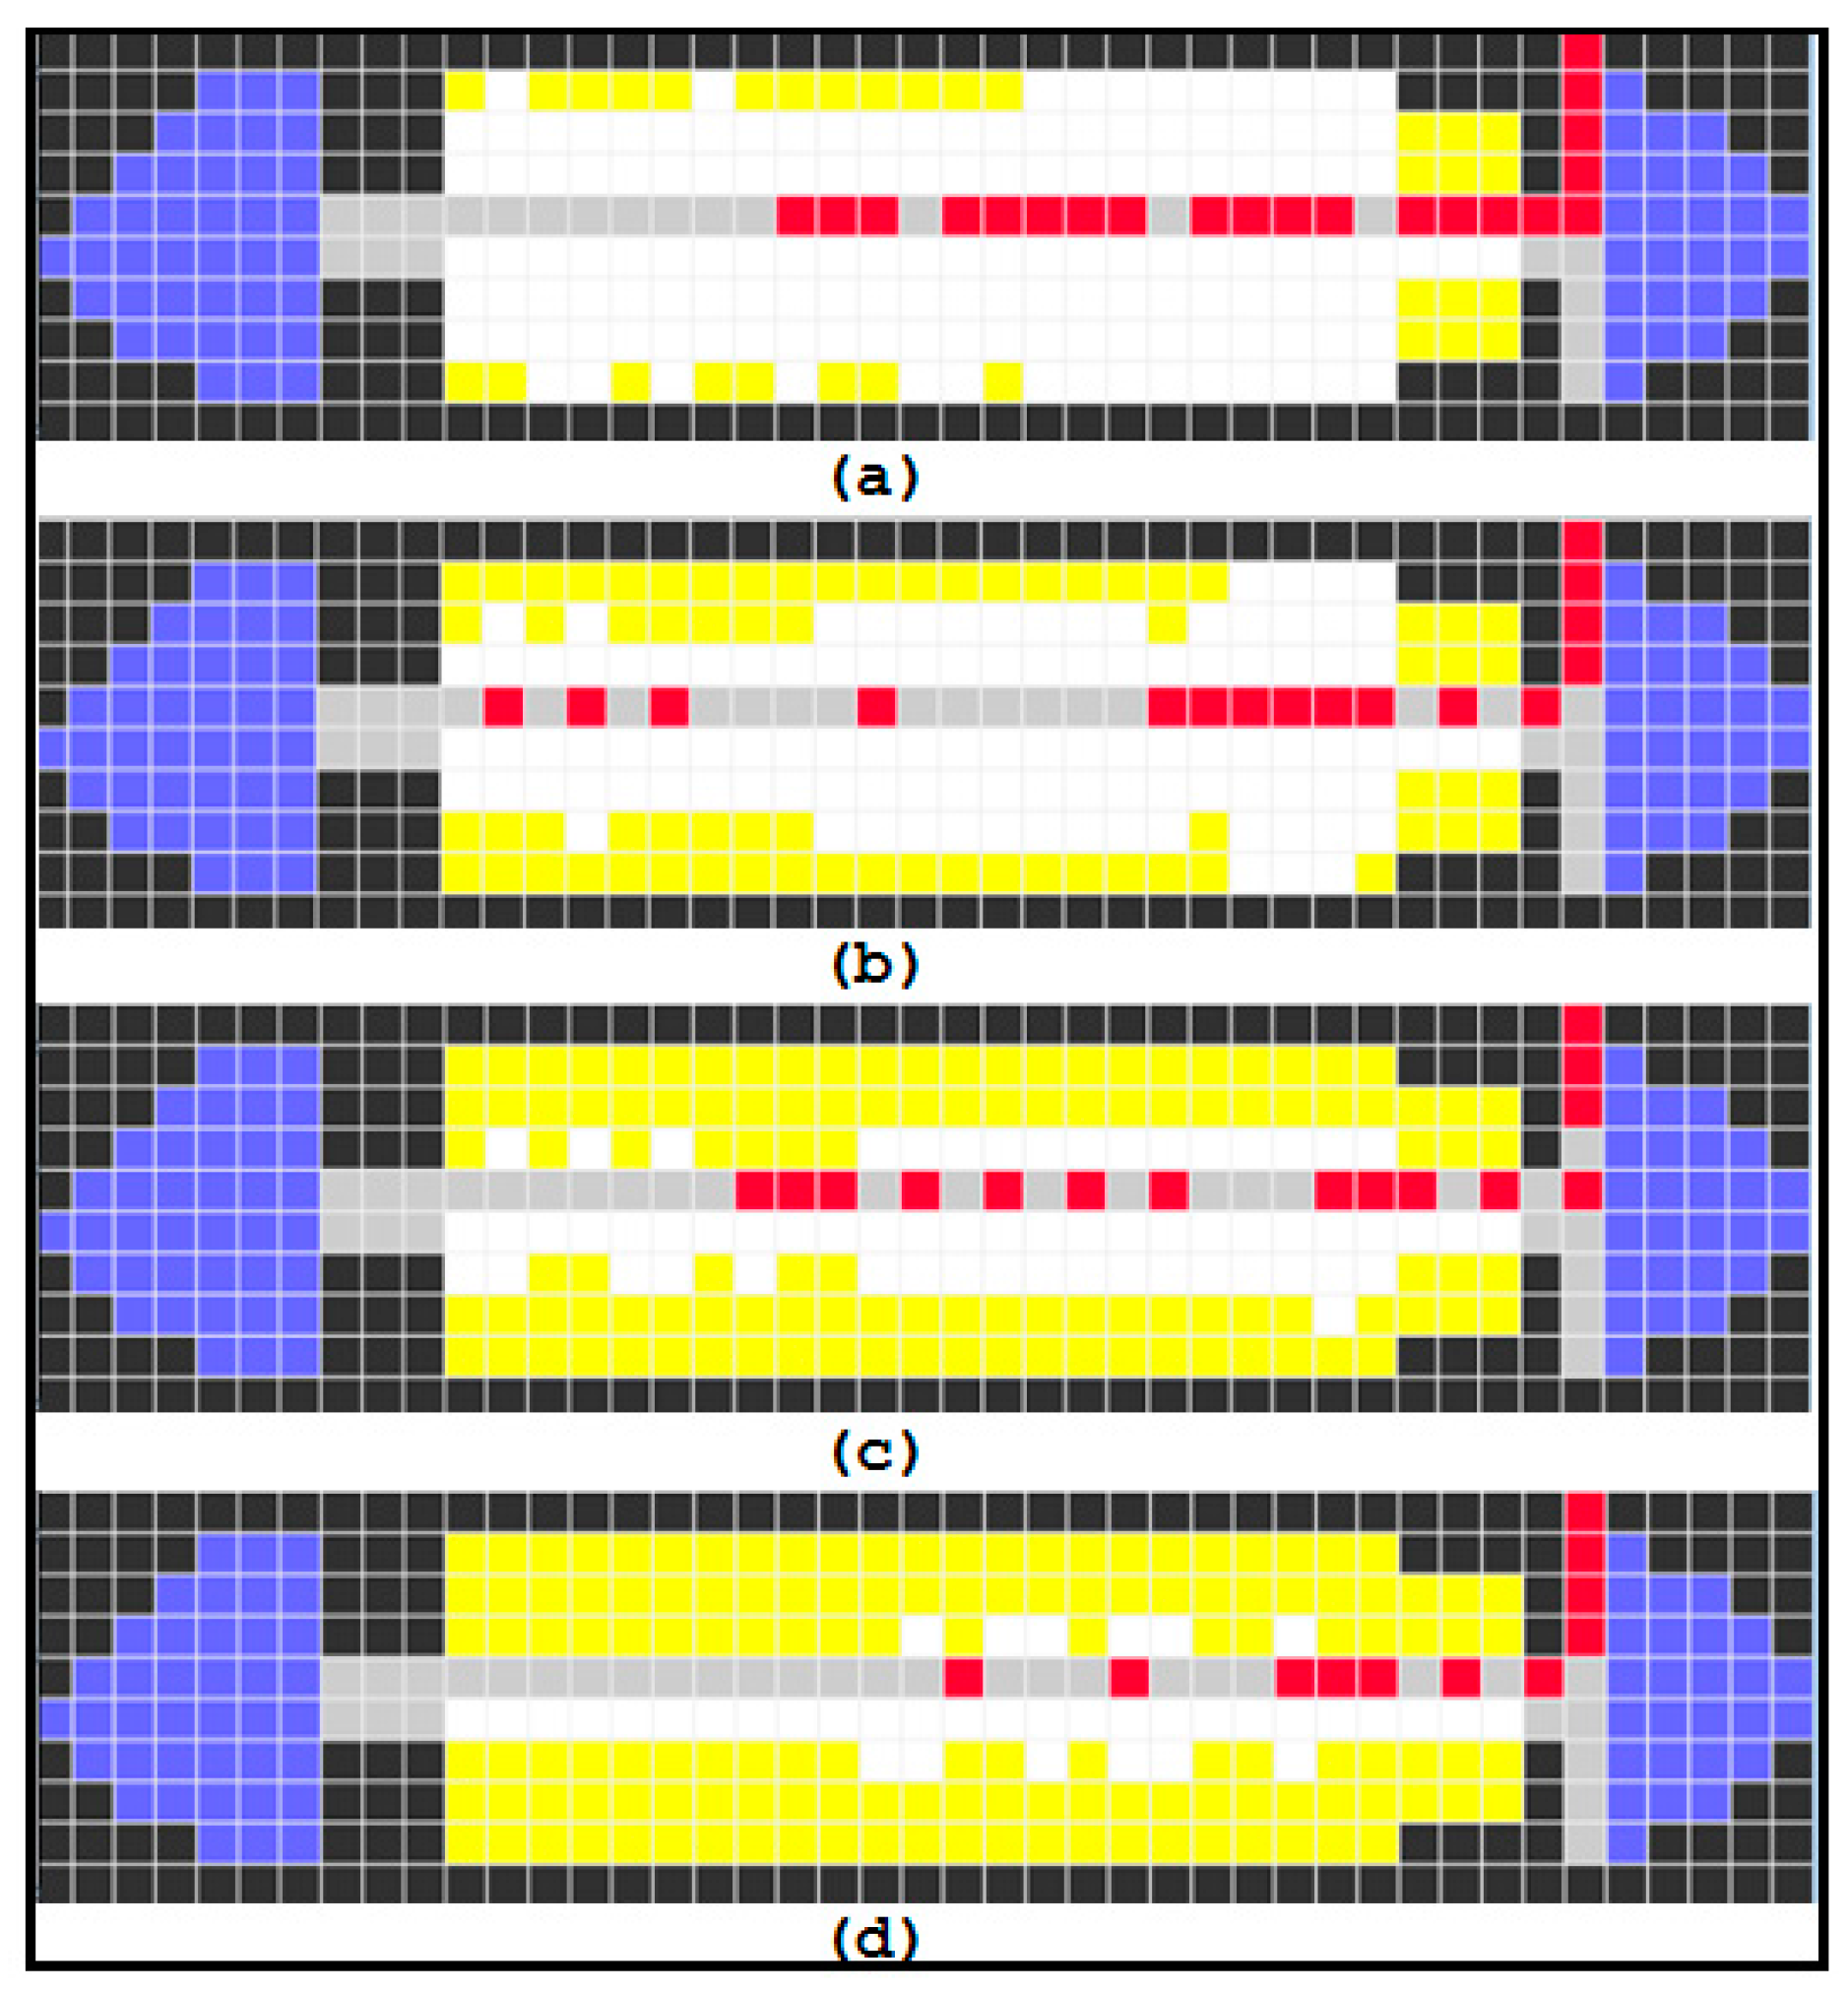
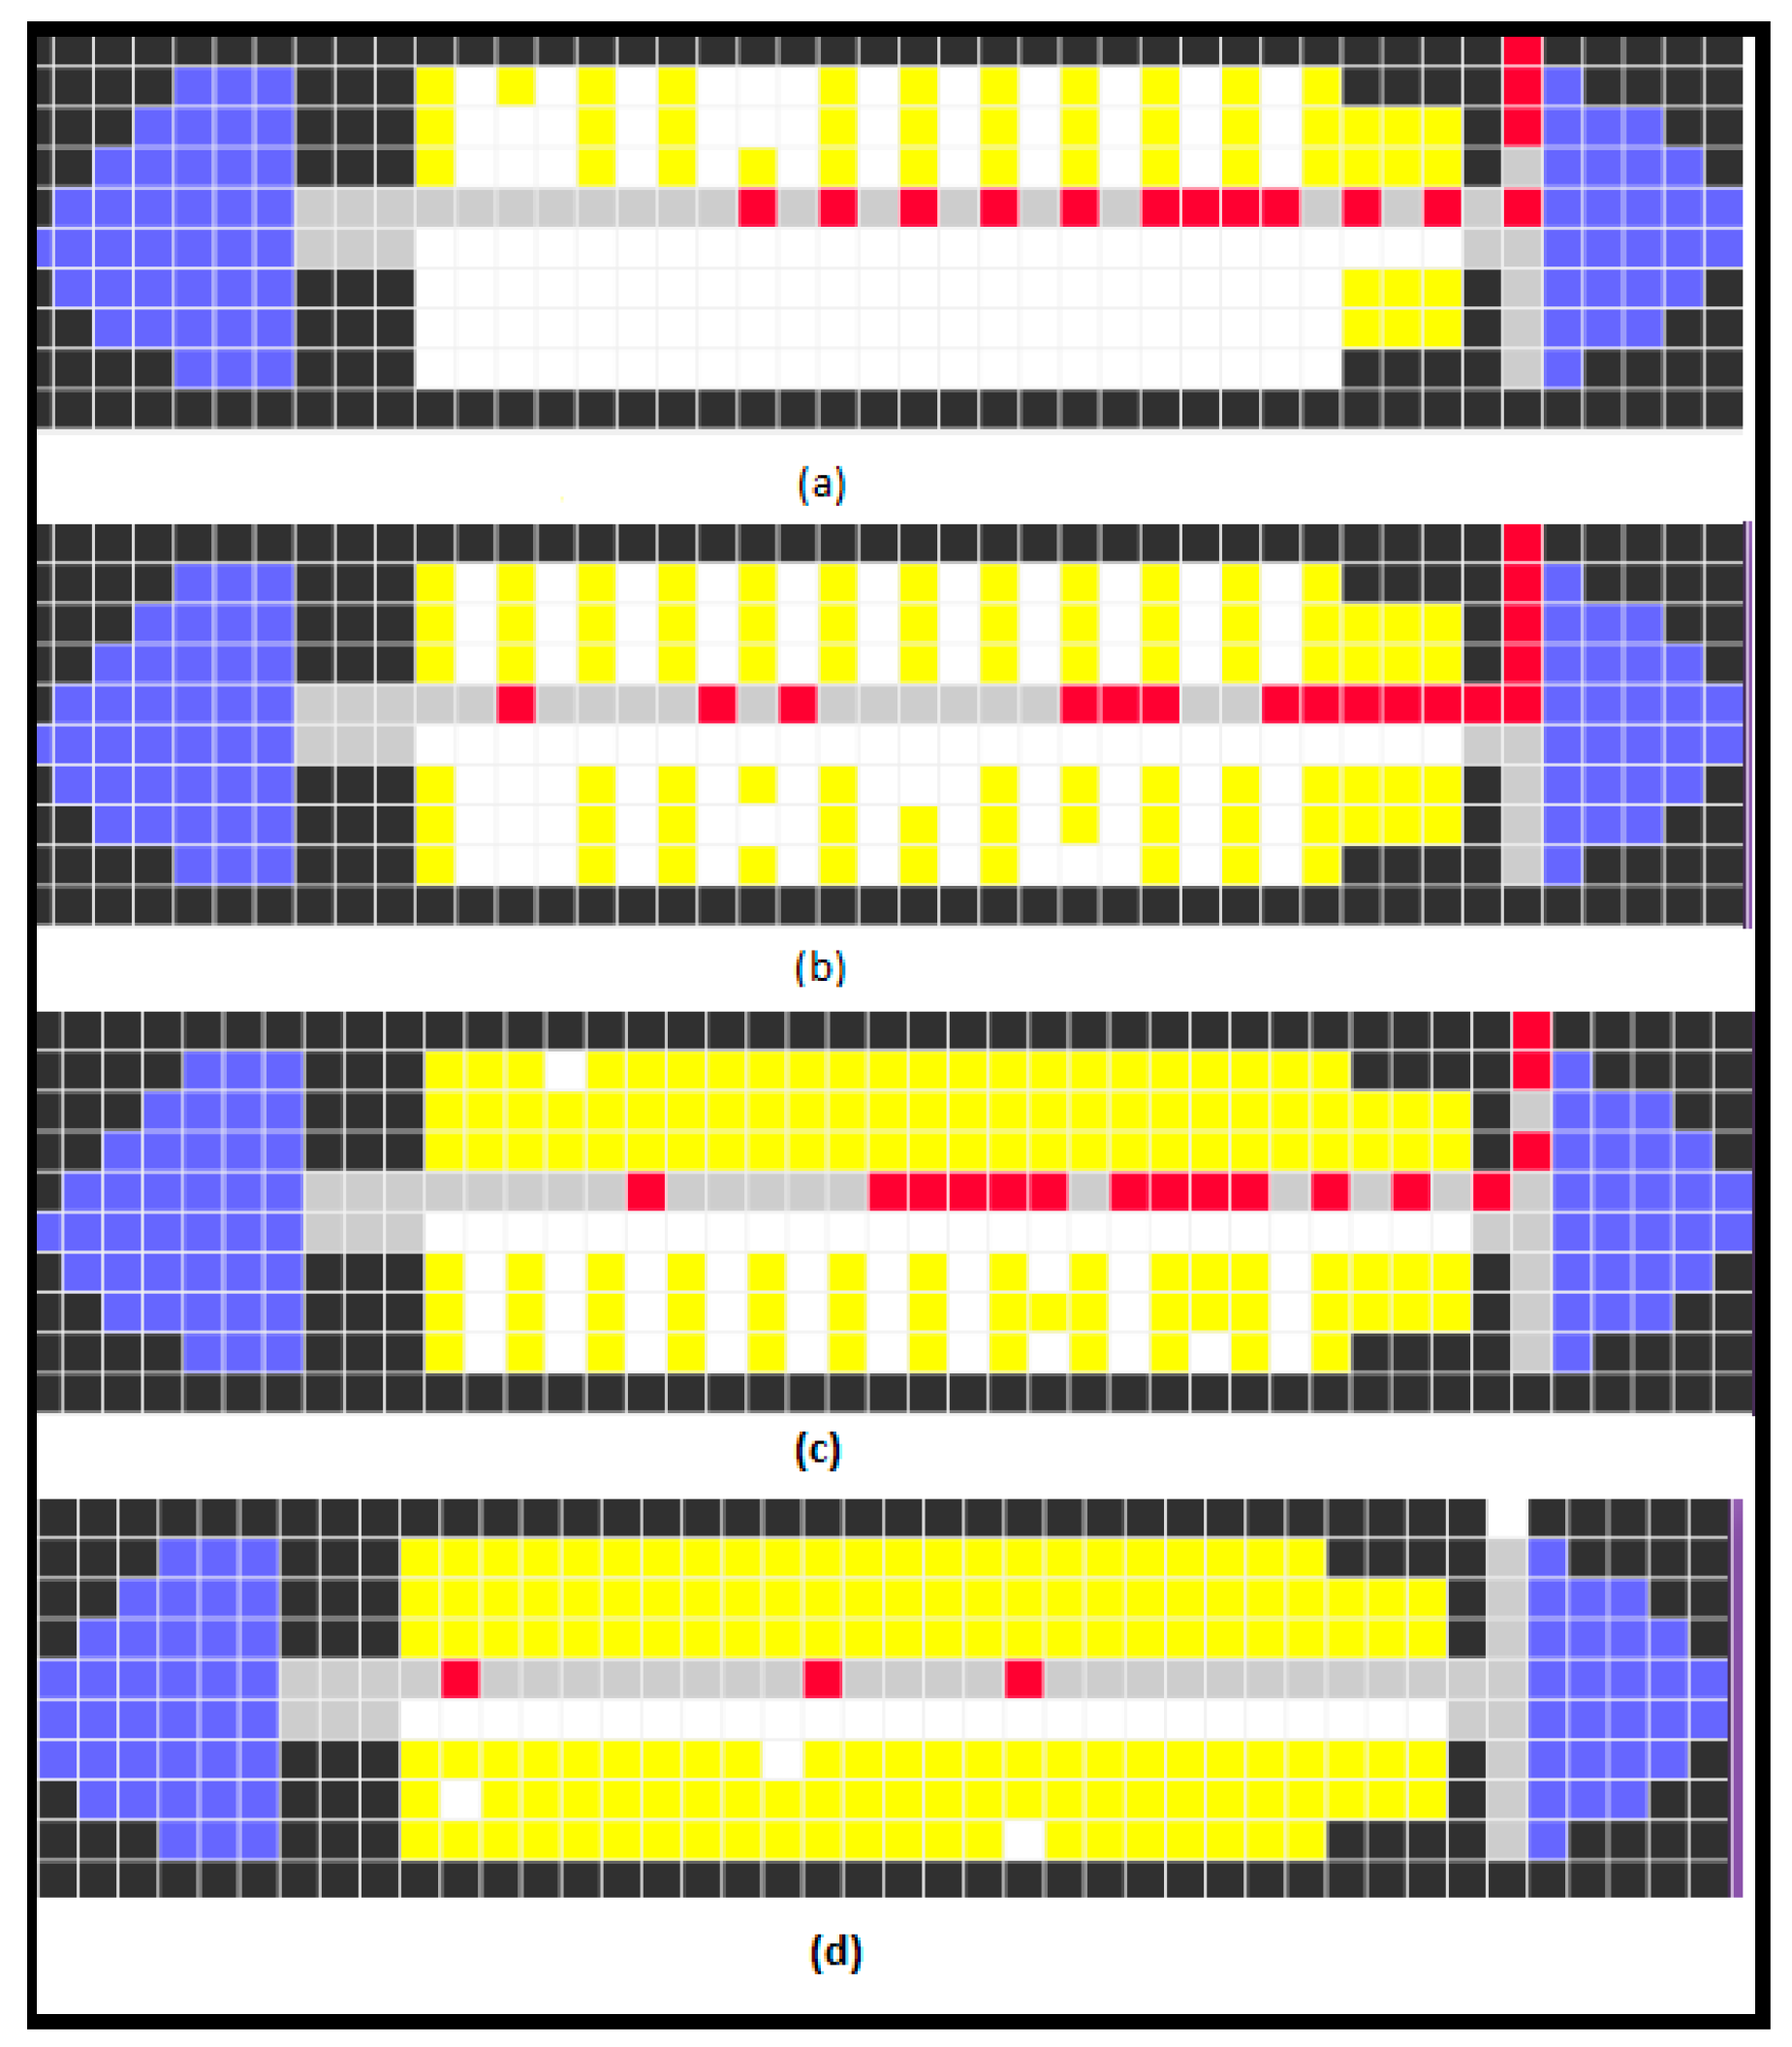
Given the common Cell-DEVS model file (“Aircraft.MA”) we execute the overall simulation by including the desired Passenger Generator DEVS model for the specific boarding strategy (generating strategy-specific seat assignments). The simulation results are captured in the following screenshots. Figure 22 shows four simulation scenarios of the Back-to-Front strategy: (a) one passenger has entered the aircraft and currently occupying the door; (b) the first-class zone is completely seated; (c) the last back two zones are also seated; (d) the last passenger is about to be seated. Similar simulation results were also conducted for the other eight strategies. As illustrated in Figure 23 for the WMA strategy, the four scenarios describe when: (a) the first-class passengers are seated; (b) all window passengers are seated; (c) all middle passengers are seated and (d) the last three aisle passengers are about to be seated. Simulation screenshots for Random, Zone Rotate, Reverse Pyramid, Optimal, Optimal Practical and Efficient strategies are given in Figure 24, Figure 25, Figure 26, Figure 27, Figure 28 and Figure 29 respectively, illustrating four various simulation scenes (initial, midway, near final and final) for each strategy. Video representation of the simulation runs can be viewed here [25] to better illustrate various strategies.
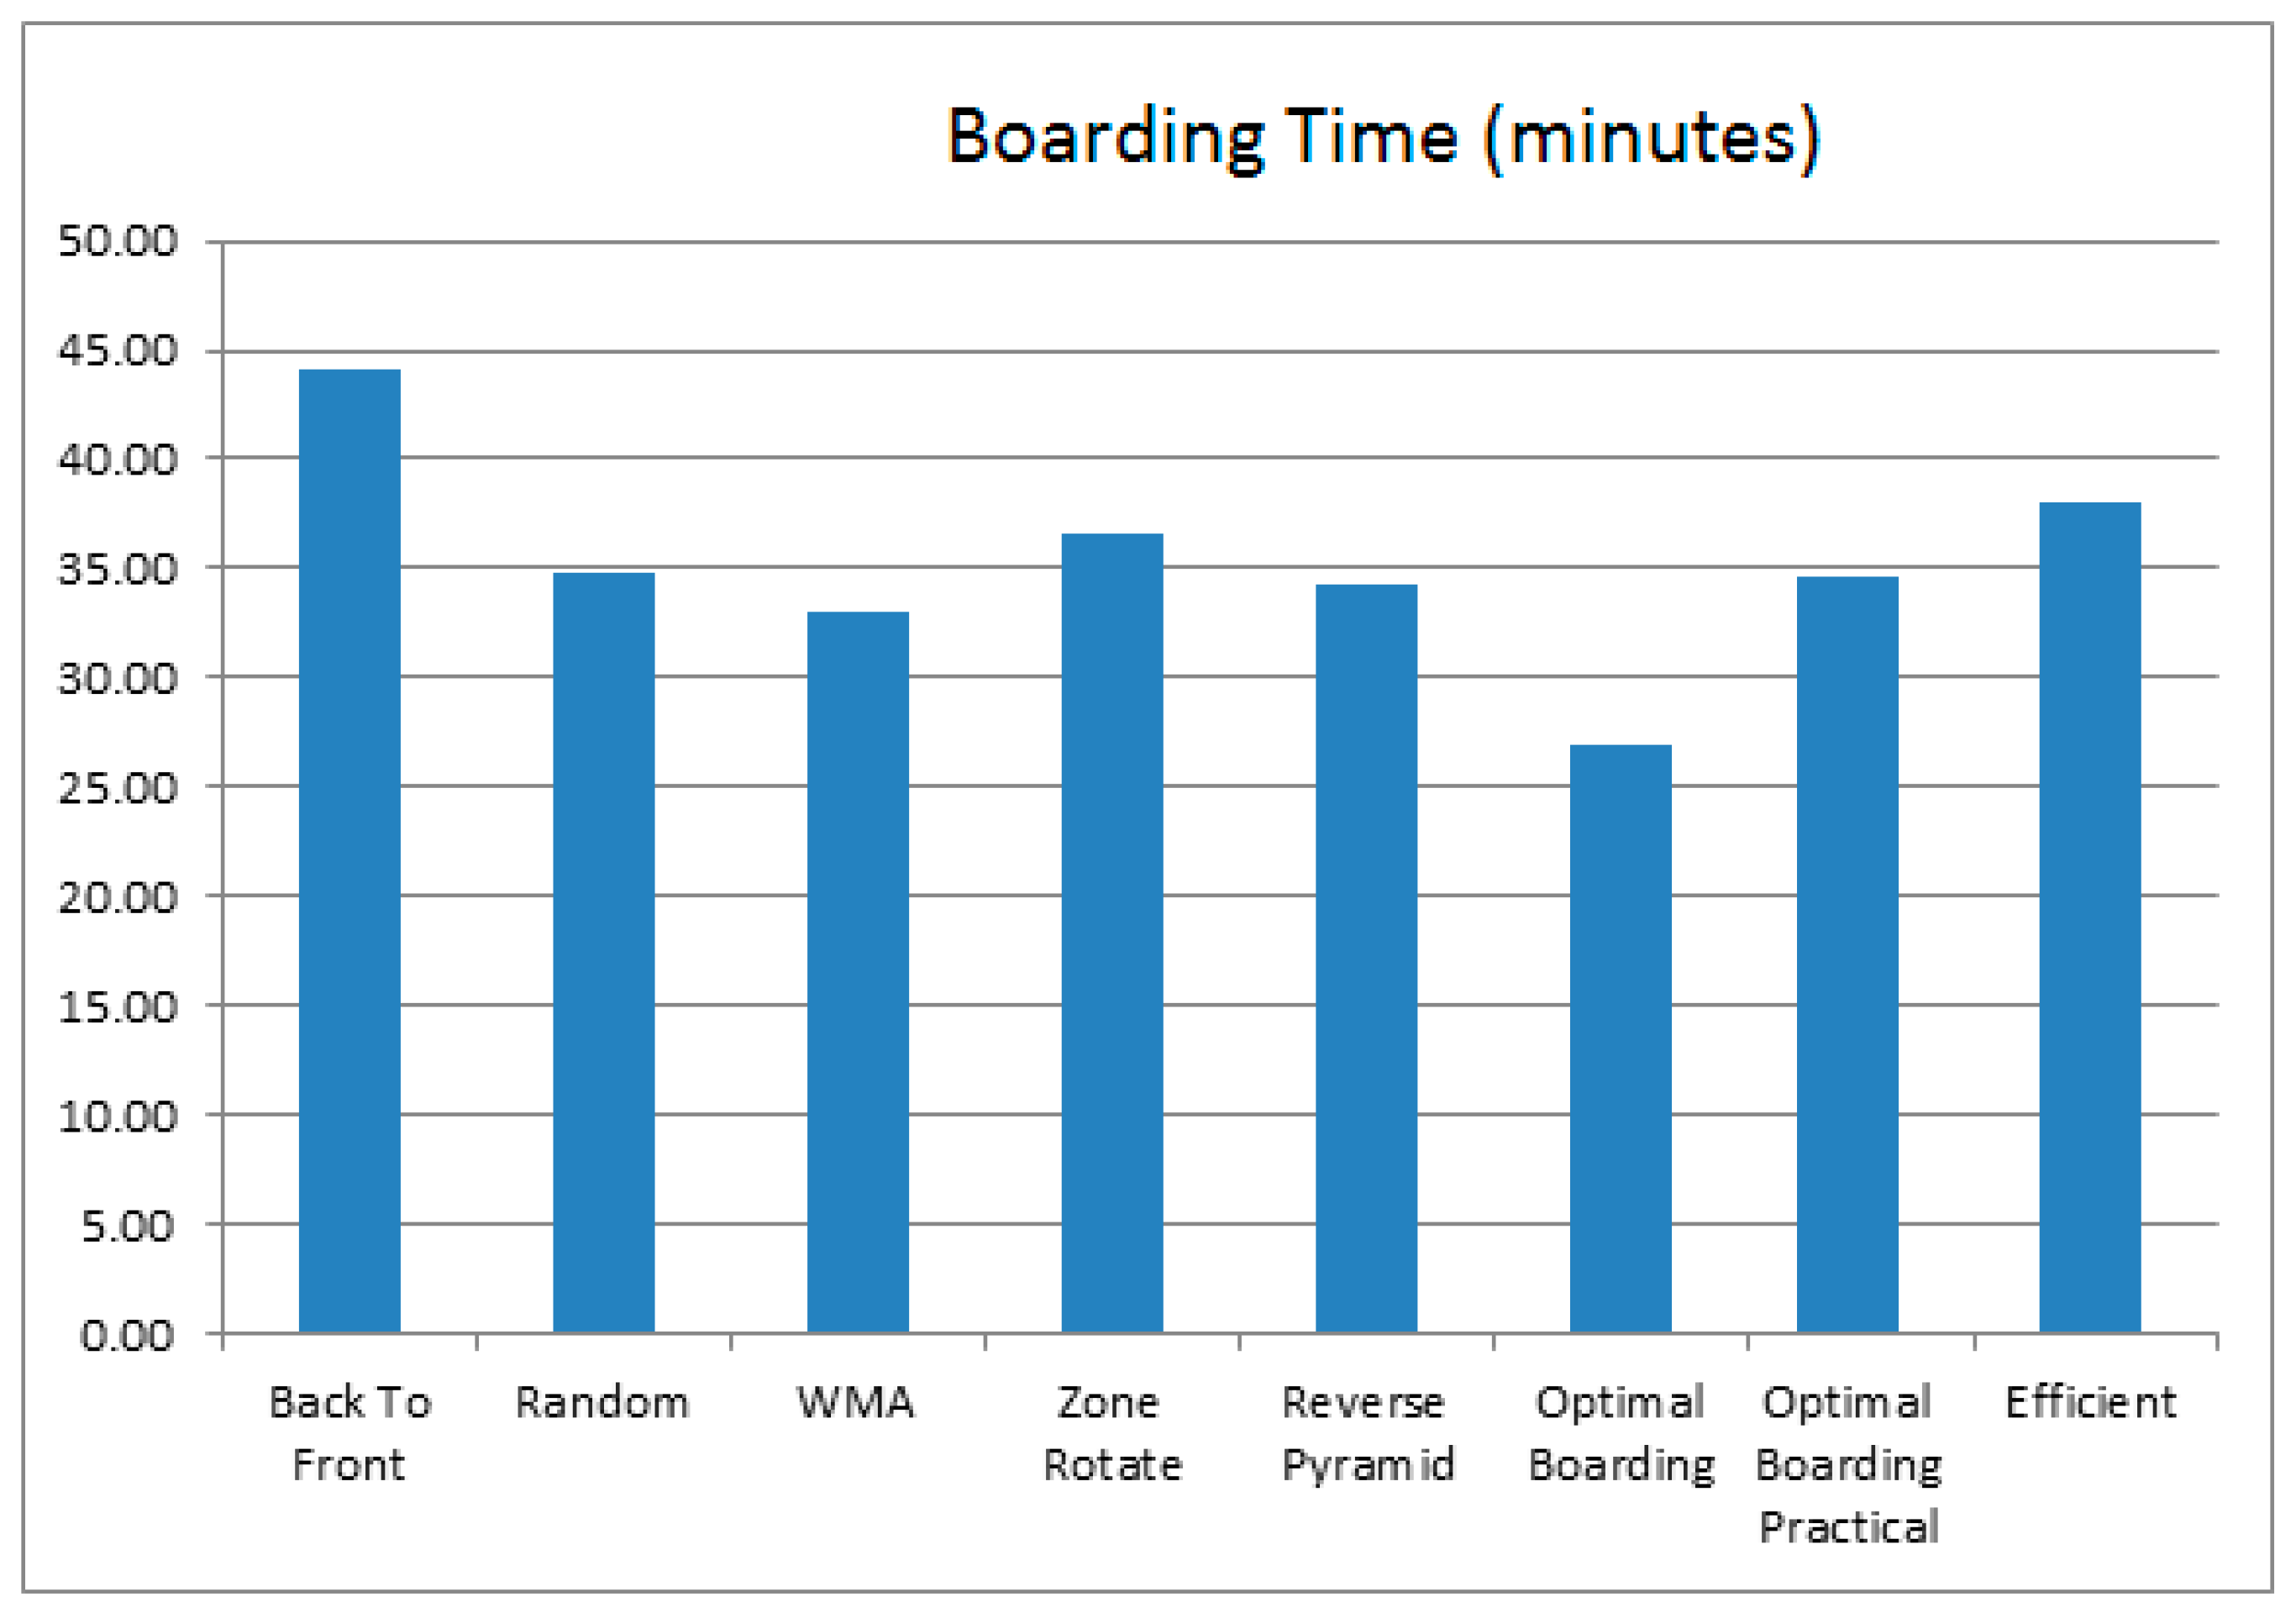
In order to compare the performance of the implemented strategies, we collected the overall execution time for the simulations. Two sets of experiments were conducted, investigating fixed and variant walking delay for passengers based on the values expressed in Table 1 (delay ranges) and Table 2 (fixed delays). With fixed delay values for all passengers (Table 2 fixed delay values for every passenger), the execution results revealed that among all strategies, the Window-Middle-Aisle provides the fastest boarding with only 26.16 min compared to the Optimal strategy with 19.43 min. The Optimal strategy provides a reference point as the “fastest” boarding method. Clearly, the Optimal strategy is not practical since it will cause huge line ups at the gates, trying to get passengers entering the airplane one by one at a descending order of seat number (with exception for first-class passengers). However, as indicated on the diagram illustrated in Figure 30, the Optimal Practical strategy, closest to the optimal concept, was still outperformed by the WMA strategy.
With variable delay values (selected randomly for passengers from the range values presented in Table 1), the simulation results yield slightly different timing values as reported on Figure 31. Nonetheless, the WMA was again the fastest practical strategy, taking only 32.57 min compared to the Optimal strategy with 26.93 min.
Comparing our results with similar studies in the literature, we find similar outcome. Table 4 summarizes the best practical boarding strategies in the literature, revealing that Window-Middle-Aisle as the most efficient boarding method for zone-based enplaning.
7. Conclusions
We presented a simulation study investigating the efficiency of aircraft’s passenger boarding strategies. We used the Discrete Event System Specification (DEVS) and its cellular extension (Cell-DEVS) theory to evaluate eight boarding strategies: Back-to-Front, Window Middle Aisle, Random, Zone Rotate, Optimal, Optimal Practical, Reverse Pyramid and Efficient strategies. With the obtained simulation results, we concluded that among the eight implemented boarding strategies, the Window Middle Aisle provided the least boarding time, while Back-to-Front was the most inefficient method. Given the ideal smallest boarding time of 18.55 min from the Optimal Strategy with fixed walking delays, our most efficient boarding strategy exceeds this by about 7 min which in airlines world is still a significant time incurring huge costs. We are currently implementing other boarding strategies, as well as variable luggage storing delays, families with small children and passengers needing assistance, aiming at exploring better options to save time, satisfying both passengers and airliners.
Author Contributions
Shafagh Jafer has compiled the manuscript and provided major text contribution, while Wei Mi developed the models and conducted tests, as well as provided comparative results study.
Conflicts of Interest
There are no conflicts of interest.
References
- Van den Briel, M.; Villalobos, J.; Hogg, G. The aircraft boarding problem. In Proceedings of the 12th Industrial Engineering Research Conference (IERC), Portland, OR, USA, 18–20 May 2003. [CD ROM]; Paper No. 2153. [Google Scholar]
- Van Den Briel, M.H.L.; Villalobos, J.R.; Hogg, G.L.; Lindemann, T.; Mulé, A.V. America west airlines develops efficient boarding strategies. Interfaces 2005, 35, 191–201. [Google Scholar] [CrossRef]
- Ferrari, P.; Nagel, K. Robustness of efficient passenger boarding strategies for airplanes. Transp. Res. Rec. J. Transp. Res. Board 2005, 1915, 44–54. [Google Scholar] [CrossRef]
- Nyquist, D.C.; McFadden, K.L. A study of the airline boarding problem. J. Air Transp. Manag. 2008, 14, 197–204. [Google Scholar] [CrossRef]
- Van Landeghem, H.; Beuselinck, A. Reducing passenger boarding time in airplanes: A simulation based approach. Eur. J. Oper. Res. 2002, 142, 294–308. [Google Scholar] [CrossRef]
- Marelli, S.; Mattocks, G.; Merry, R. The role of computer simulation in reducing airplane turn time. Aero Mag. 1998, 1, 10. [Google Scholar]
- Steffen, J.H. Optimal boarding method for airline passengers. J. Air Transp. Manag. 2008, 14, 146–150. [Google Scholar] [CrossRef]
- Bazargan, M. A linear programming approach for aircraft boarding strategy. Eur. J. Oper. Res. 2007, 183, 394–411. [Google Scholar] [CrossRef]
- Zeigler, B.P.; Praehofer, H.; Kim, T.G. Theory of Modeling and Simulation: Integrating Discrete Event and Continuous Complex Dynamic Systems; Academic press: Cambridge, MA, USA, 2000. [Google Scholar]
- Wainer, G.A. Discrete-Event Modeling and Simulation: A Practitioner’s Approach; CRC Press: Boca Raton, FL, USA, 2009. [Google Scholar]
- Jafer, S.; Mi, W. Simulation of aircraft boarding strategies with discrete-event cellular DEVS. In Proceedings of the Symposium on Theory of Modeling & Simulation-DEVS Integrative, Tampa, FL, USA, 13–16 April 2014; Society for Computer Simulation International: San Diego, CA, USA, 2014; p. 32. [Google Scholar]
- Schultz, M.; Christian, S.; Hartmut, F. Efficiency of Aircraft Boarding Procedures. In Proceedings of the ICRAT 2008, Fairfax, VA, USA, 1–4 June 2008. [Google Scholar]
- Audenaert, J.; Verbeeck, K.; Berghe, G.V. Multi-agent based simulation for boarding. In Proceedings of the 21st Belgian-Netherlands Conference on Artificial Intelligence, Eindhoven, The Netherlands, 29–30 October 2009; pp. 3–10. [Google Scholar]
- Jaehn, F.; Neumann, S. Airplane boarding. Eur. J. Oper. Res. 2015, 244, 339–359. [Google Scholar] [CrossRef]
- Schultz, M. The Seat Interference Potential as an Indicator for the Aircraft Boarding Progress; No. 2017-01-2113; SAE Technical Paper; SAE: Warrendale, PA, USA, 2017. [Google Scholar]
- Mas, S.; Juan, A.A.; Arias, P.; Fonseca, P. A simulation study regarding different aircraft boarding strategies. In Modeling and Simulation in Engineering, Economics, and Management; Springer: Berlin/Heidelberg, Germany, 2013; pp. 145–152. [Google Scholar]
- Steiner, A.; Philipp, M. Speeding up the airplane boarding process by using pre-boarding areas. In Proceedings of the 9th Swiss Transport Research Conference, Monte Verità, Switzerland, 9–11 September 2009; pp. 1–30. [Google Scholar]
- Bauer, M.; Bhawalkar, K.; Edwards, M. Boarding at the Speed of Flight. UMAP J. 2007, 28, 237. [Google Scholar]
- Ciarallo, F.W.; Ward, K.K.; Hill, R.R. Modeling Airline Boarding for Improved Efficiency and Passenger Experience. In Proceedings of the IIE Annual Conference, Pittsburgh, PA, USA, 20–23 May 2017; Institute of Industrial and Systems Engineers (IISE): Norcross, GA, USA, 2017; pp. 1900–1905. [Google Scholar]
- Schultz, M.; Kunze, T.; Fricke, H. Boarding on the critical path of the turnaround. In Proceedings of the 10th USA/Europe air Traffic Management Research and Development Seminar (ATM2013), Chicago, IL, USA, 10–13 June 2013. [Google Scholar]
- Wainer, G. CD++: A toolkit to develop DEVS models. Softw. Pract. Exp. 2002, 32, 1261–1306. [Google Scholar] [CrossRef]
- Muller, J. Optimal Boarding Methods for Airline Passengers; Hamburg University Internal Report; Hamburg University: Hamburg, Germany, August 2009. [Google Scholar]
- Schultz, M. Aircraft Boarding-Data, Validation, Analysis. In Proceedings of the 12th USA/Europe Air Traffic Management Research and Development Seminar, Seattle, WA, USA, 26–30 June 2017. [Google Scholar]
- Schultz, M. Reliable Aircraft Boarding for Fast Turnarounds. In Proceedings of the ENRI International Workshop on ATM/CNS (EIWAC 2017), Tokyo, Japan, 14–16 November 2017. [Google Scholar]
- Cell-DEVS Boarding Strategies. Available online: https://youtu.be/sodyh4e5yyE?list=PLRvCUnTmrqJCyZNDGAgJmXSu0N1i8GMzv (accessed on 26 November 2017).
- Steffen, J.H.; Hotchkiss, J. Experimental test of airplane boarding methods. J. Air Transp. Manag. 2012, 18, 64–67. [Google Scholar] [CrossRef]
Figure 1.
System overview.

Figure 2.
Discrete-Event System (DEVS) conceptual model of the system.

Figure 3.
Passenger generator DEVS specification.
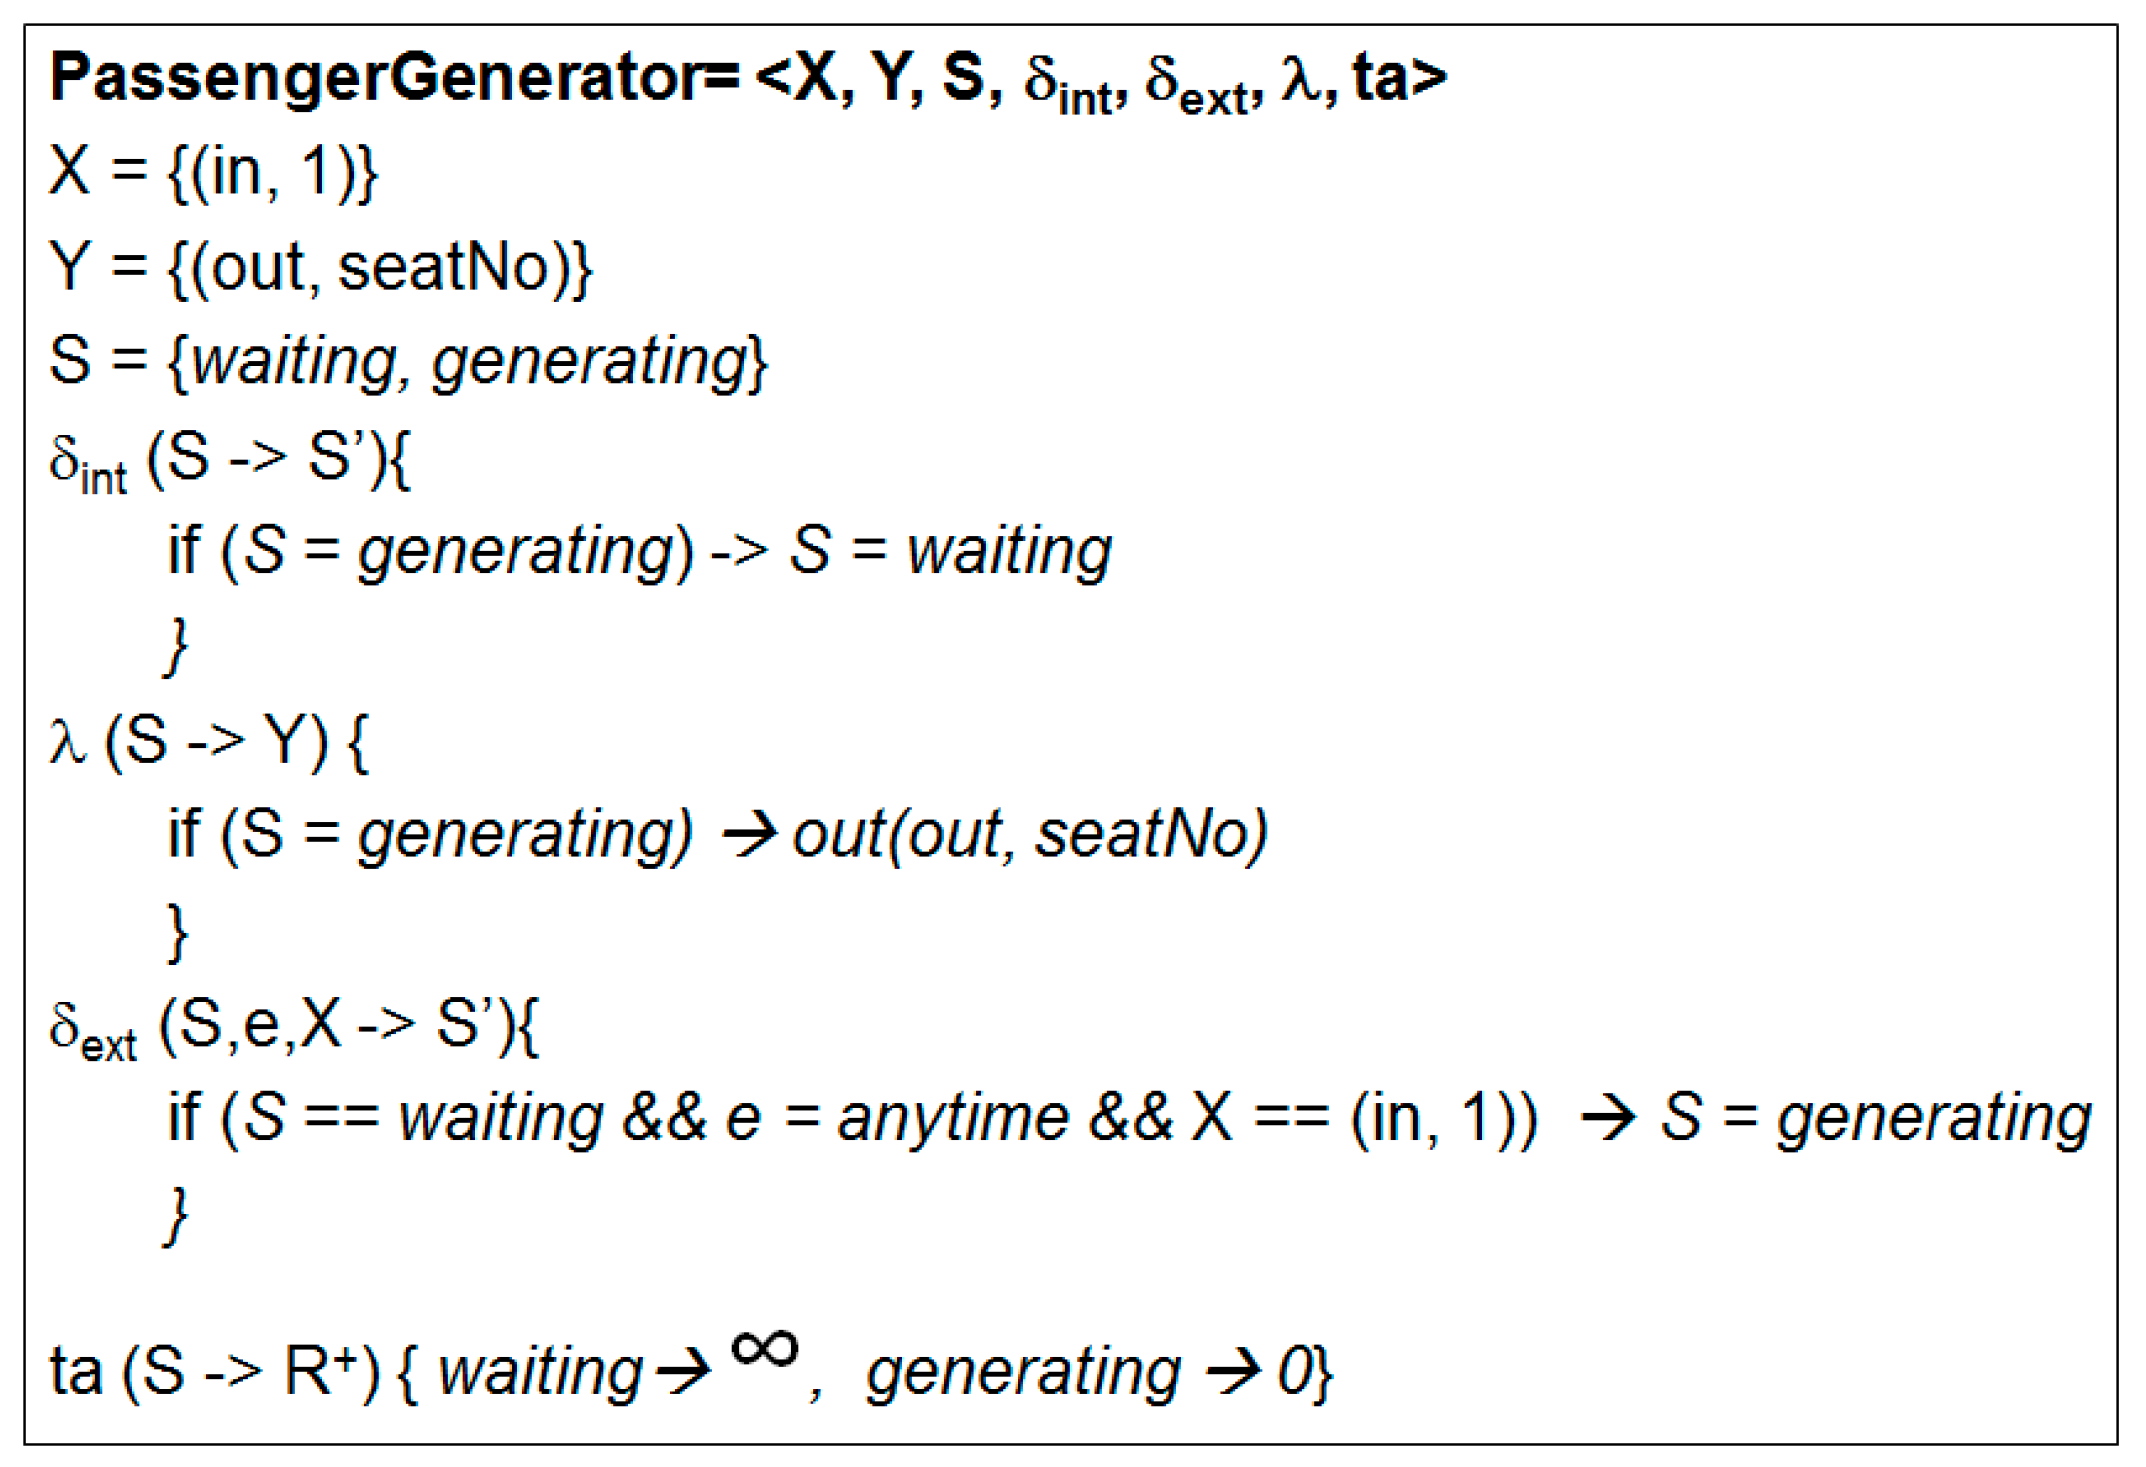
Figure 4.
Passenger generator state diagram.
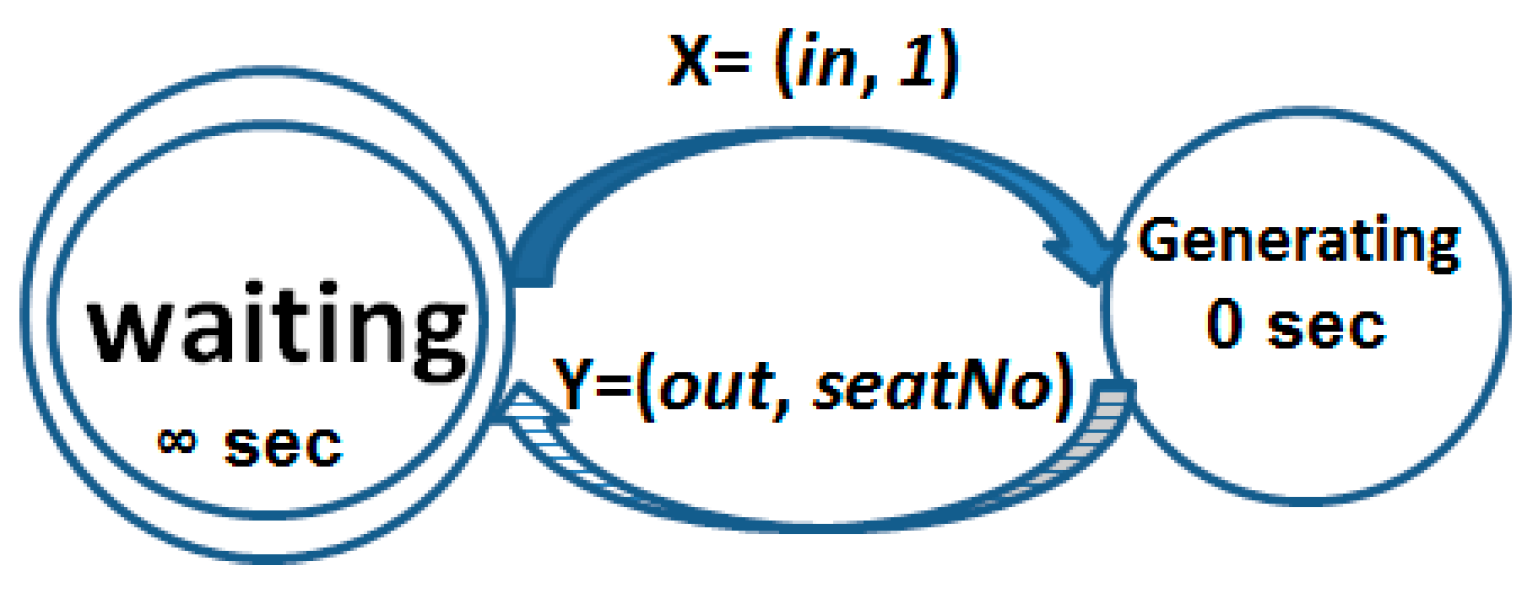
Figure 5.
Aircraft Cell-DEVS model.
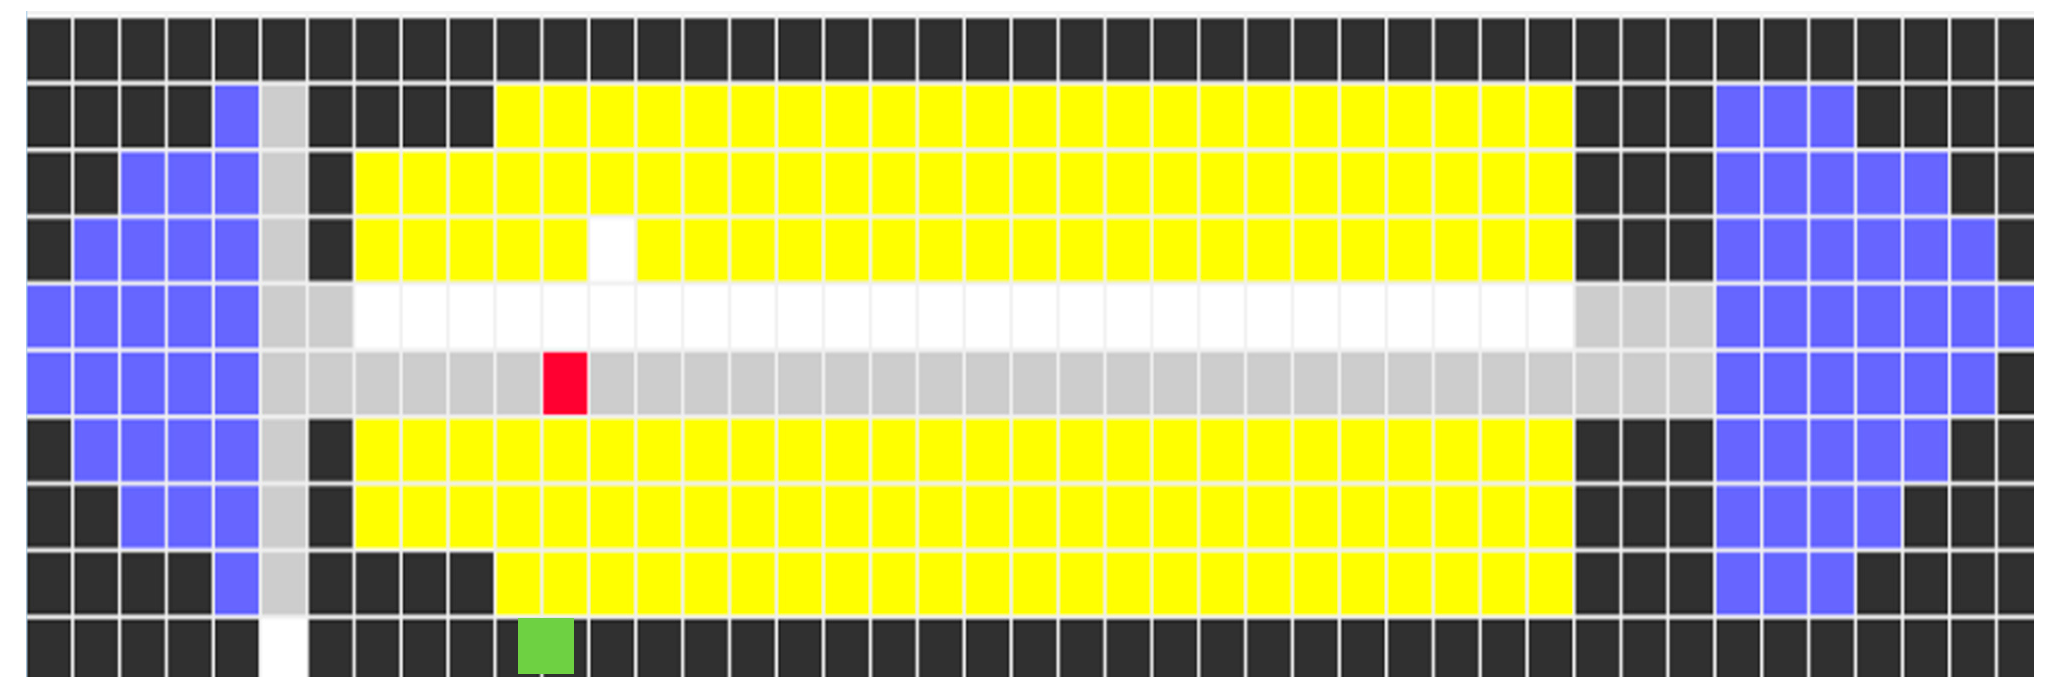
Figure 6.
Aircraft model cellular neighborhood.

Figure 7.
Mapping state values to cells.

Figure 8.
Back-to-Front seat number generation for sample zones: 1, 2, 3 and 6.

Figure 9.
Back-to-Front random seats selection.

Figure 10.
Random strategy seat number generation.
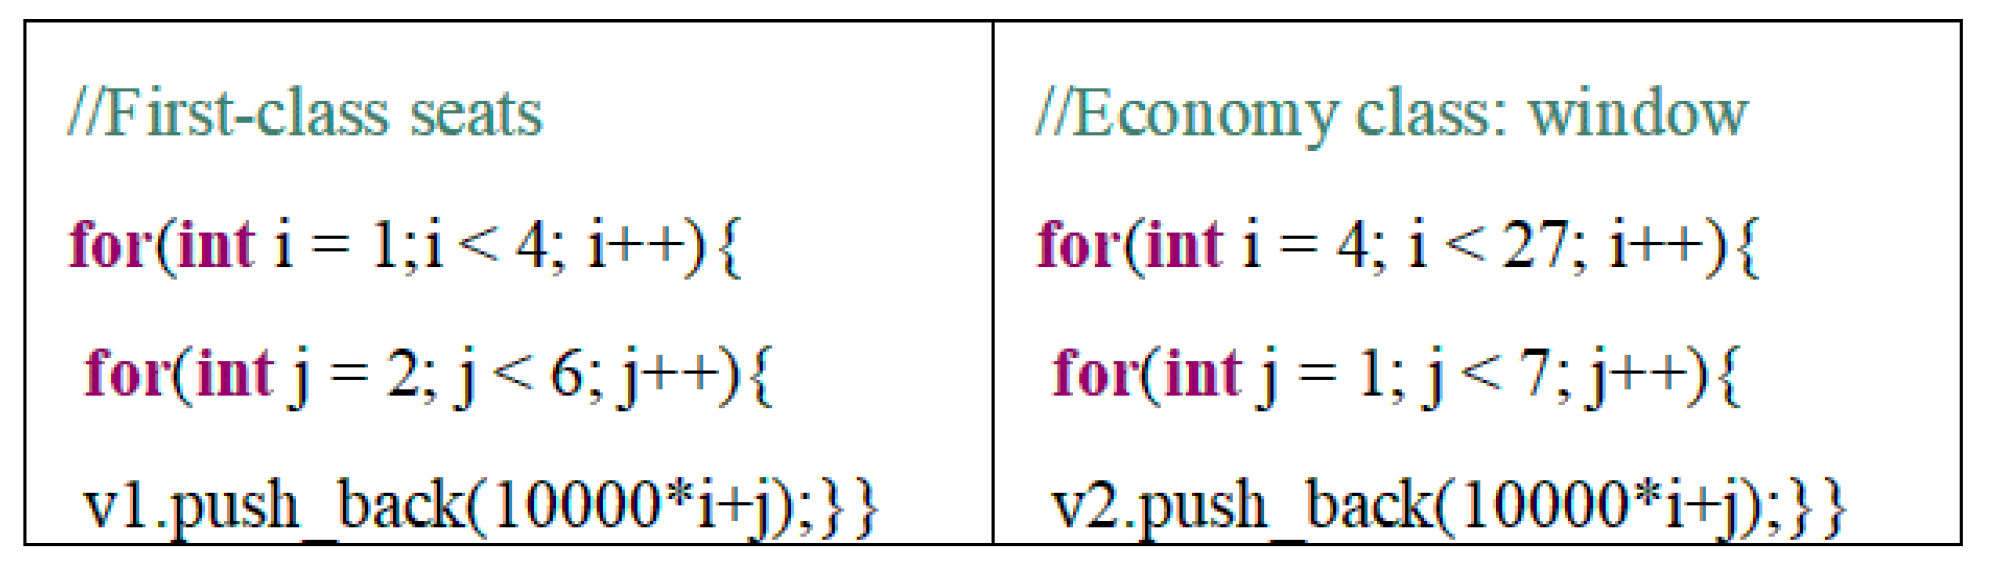
Figure 11.
Window Middle Aisle (WMA) seat number generation.

Figure 12.
Zone rotate seat number generation.

Figure 13.
RP seat number generation.

Figure 14.
Optimal strategy seat number generation.
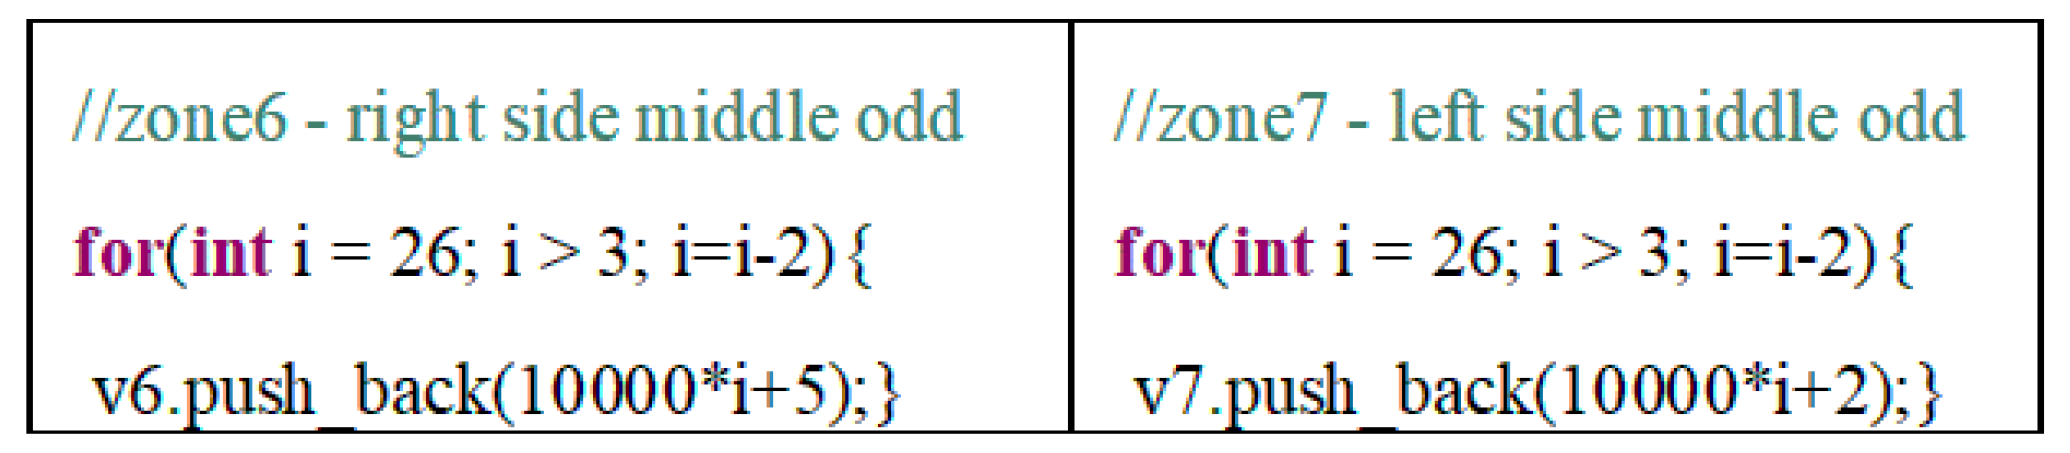
Figure 15.
Optimal strategy seat number generation.
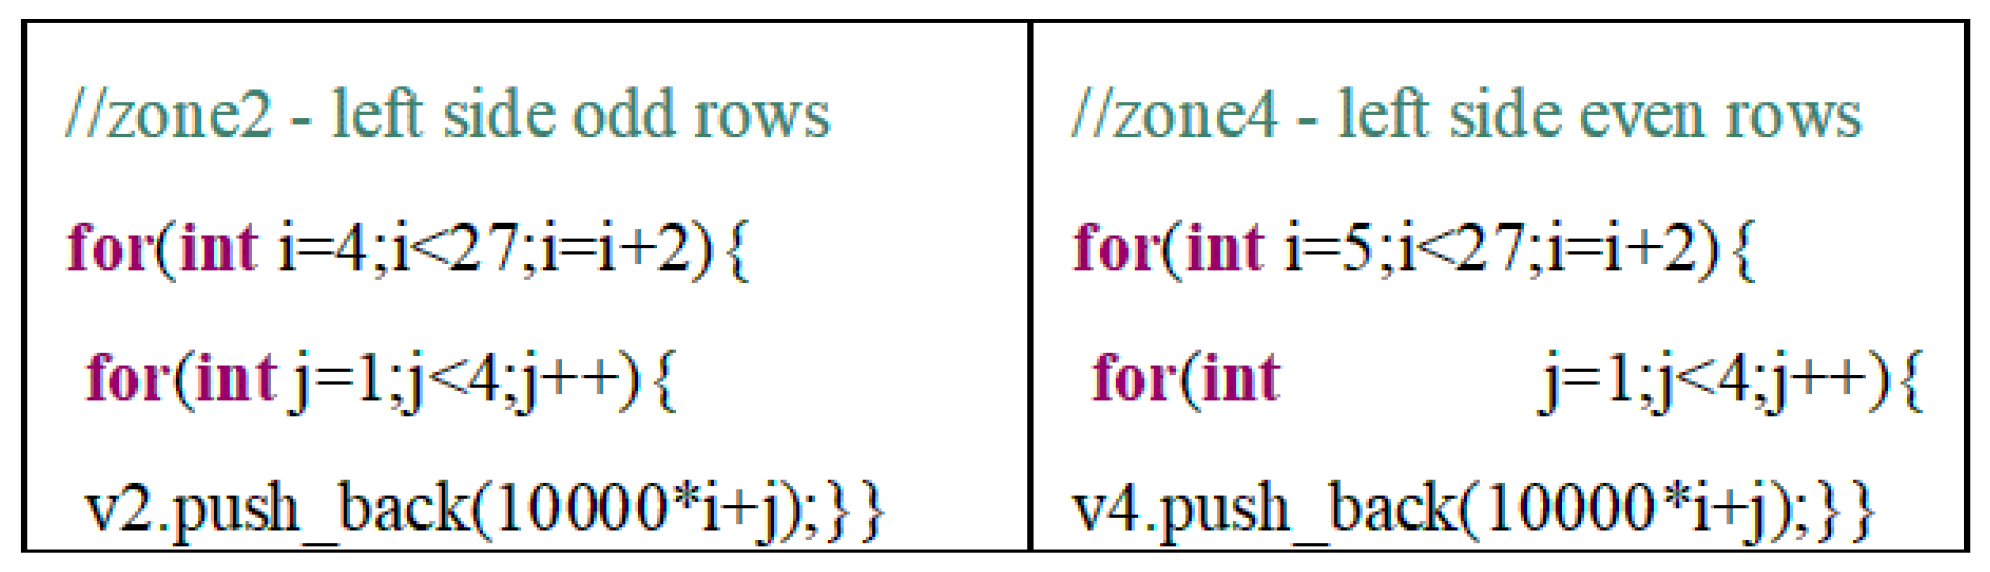
Figure 16.
Optimal strategy seat number generation.
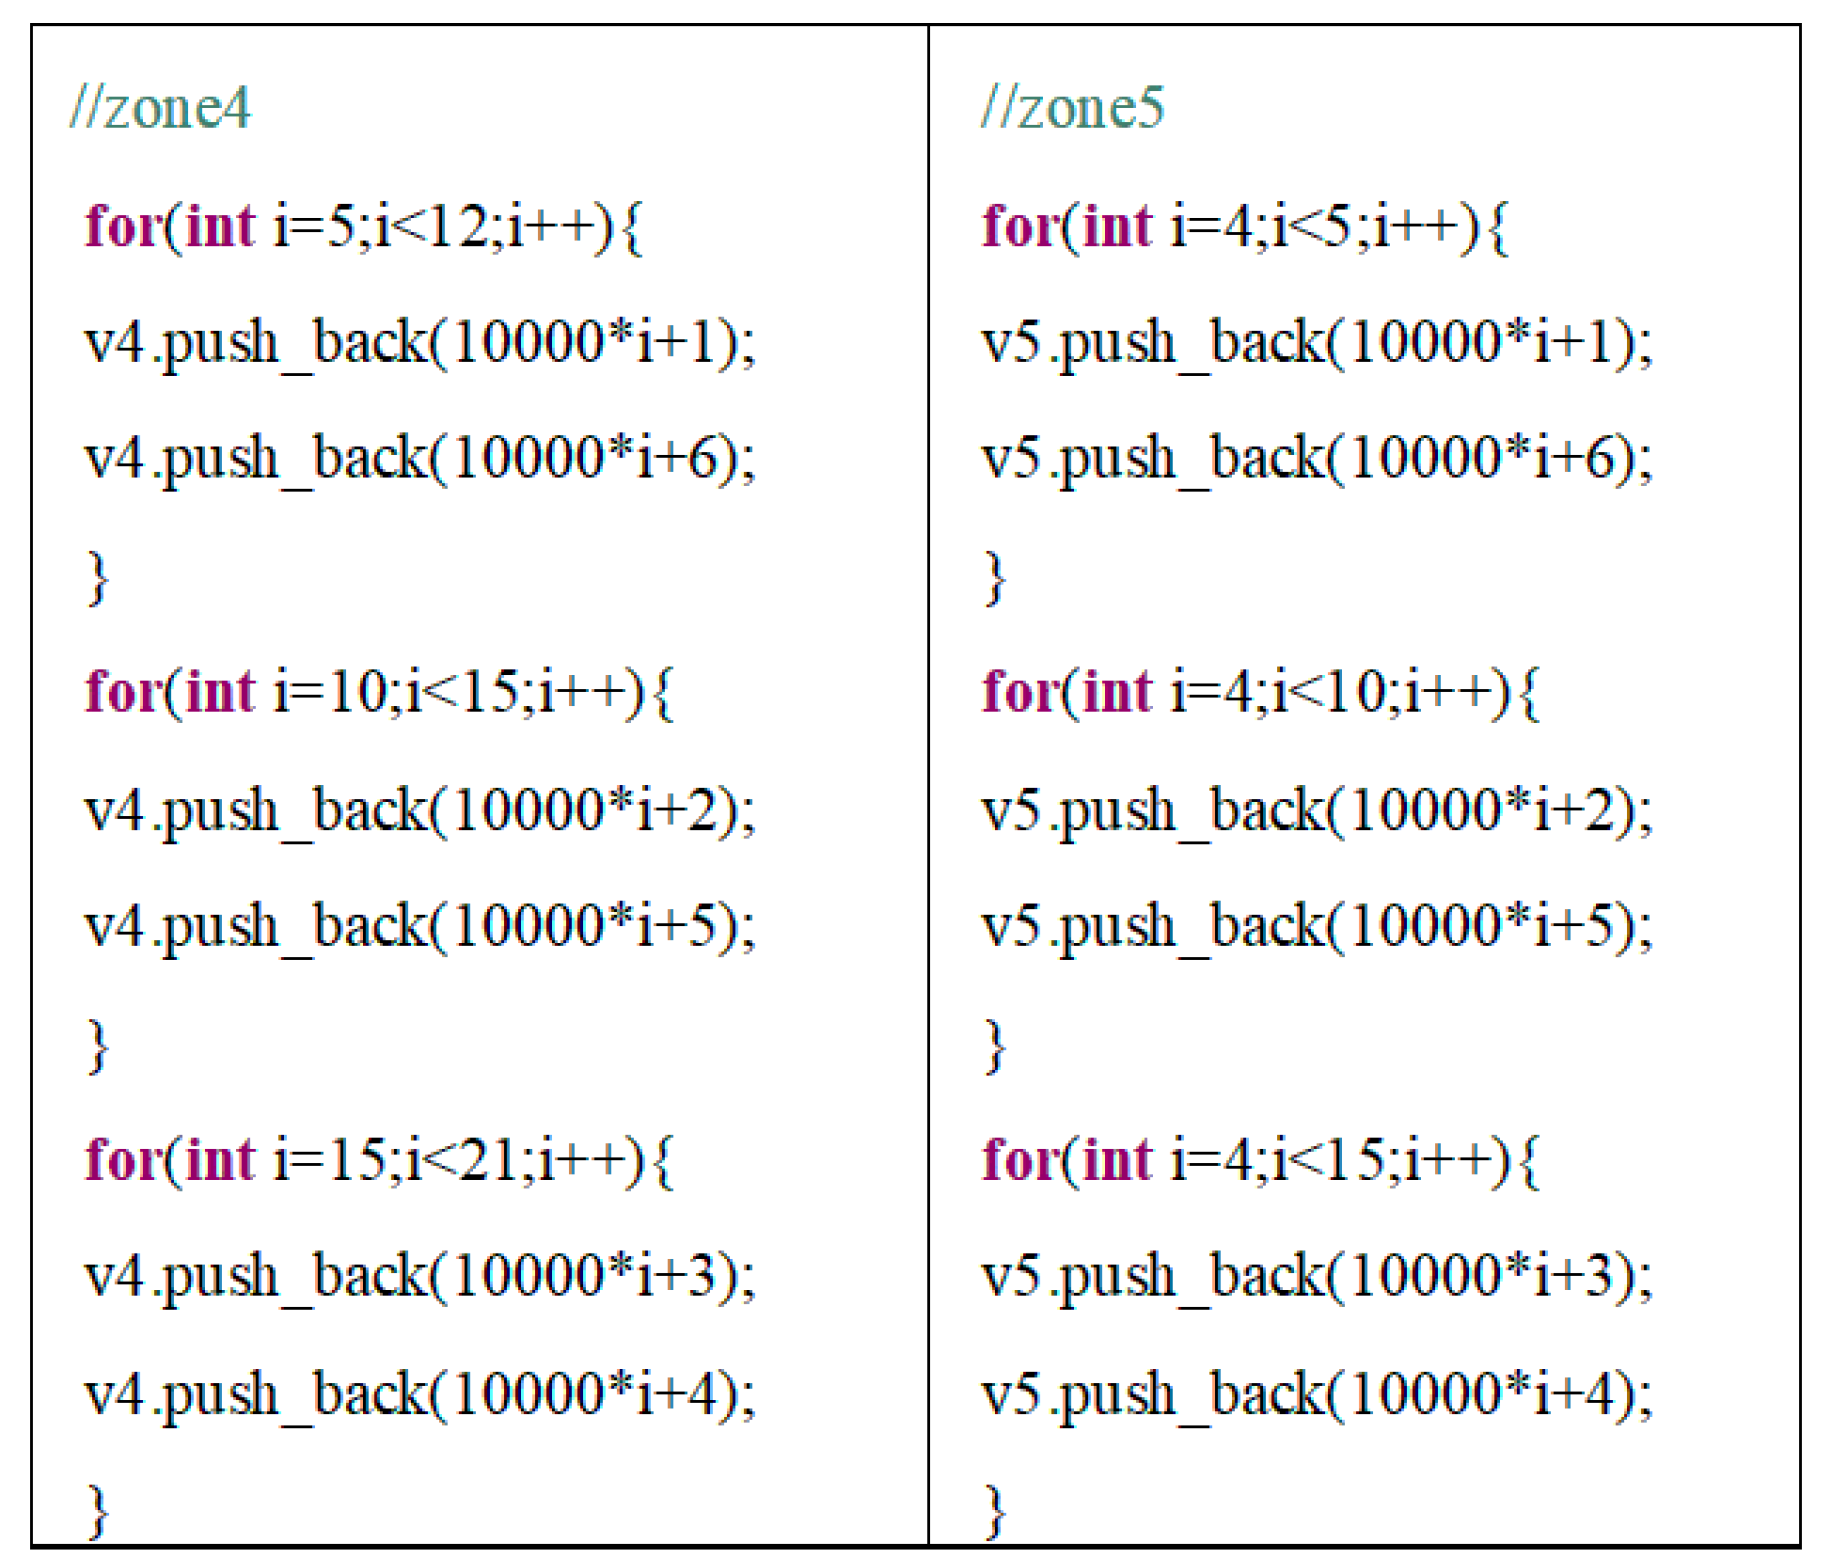
Figure 17.
Areas evaluated by “pre-seat” (solid box) and “seating” (dashed box) rules.
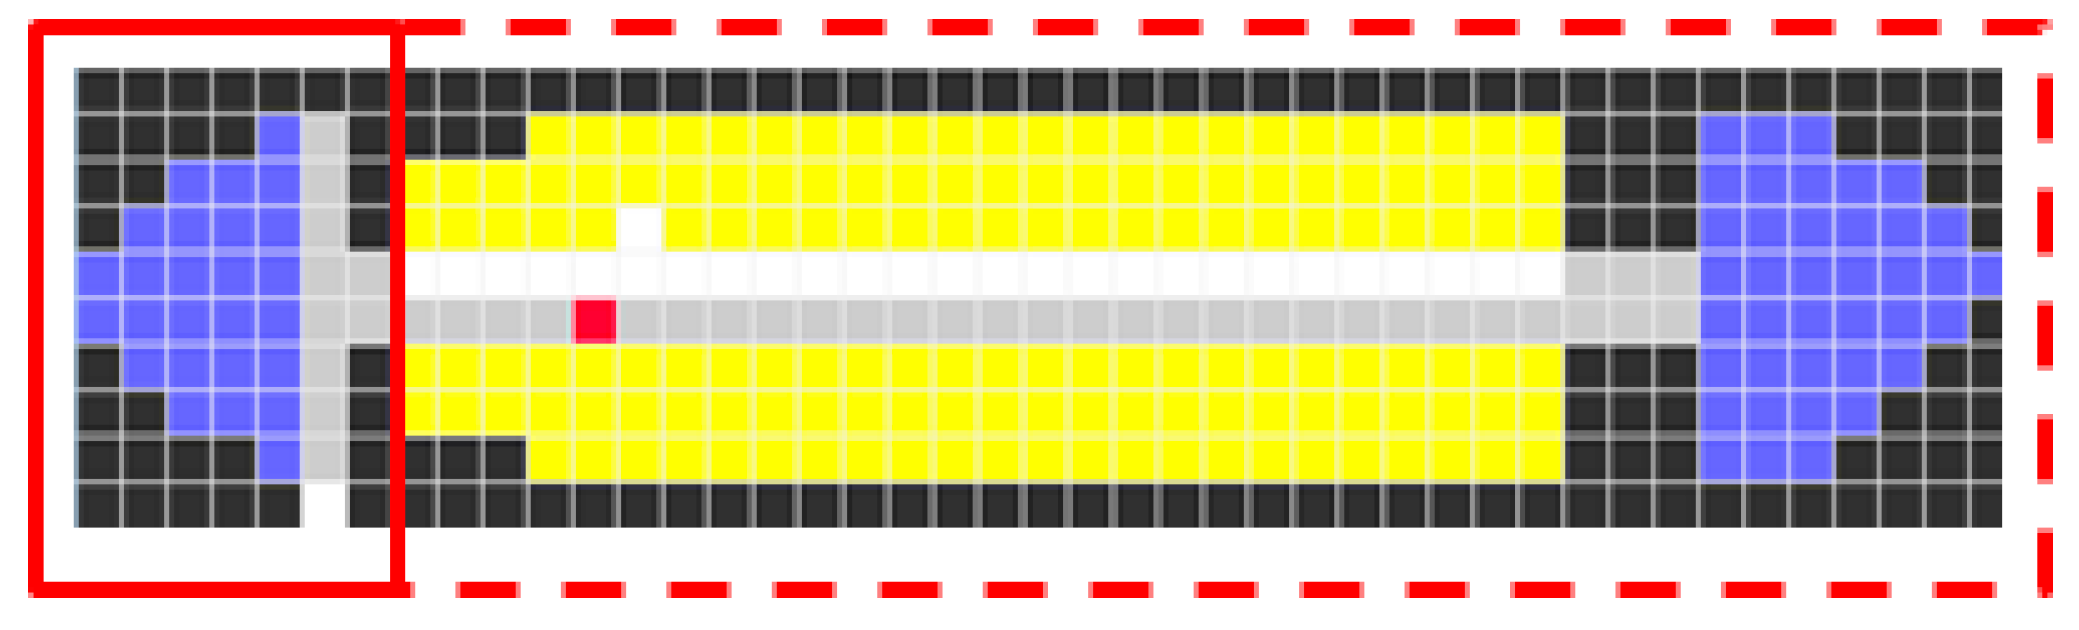
Figure 18.
Sample macros defining various delay values based on Table 2 ranges.
Figure 18.
Sample macros defining various delay values based on Table 2 ranges.
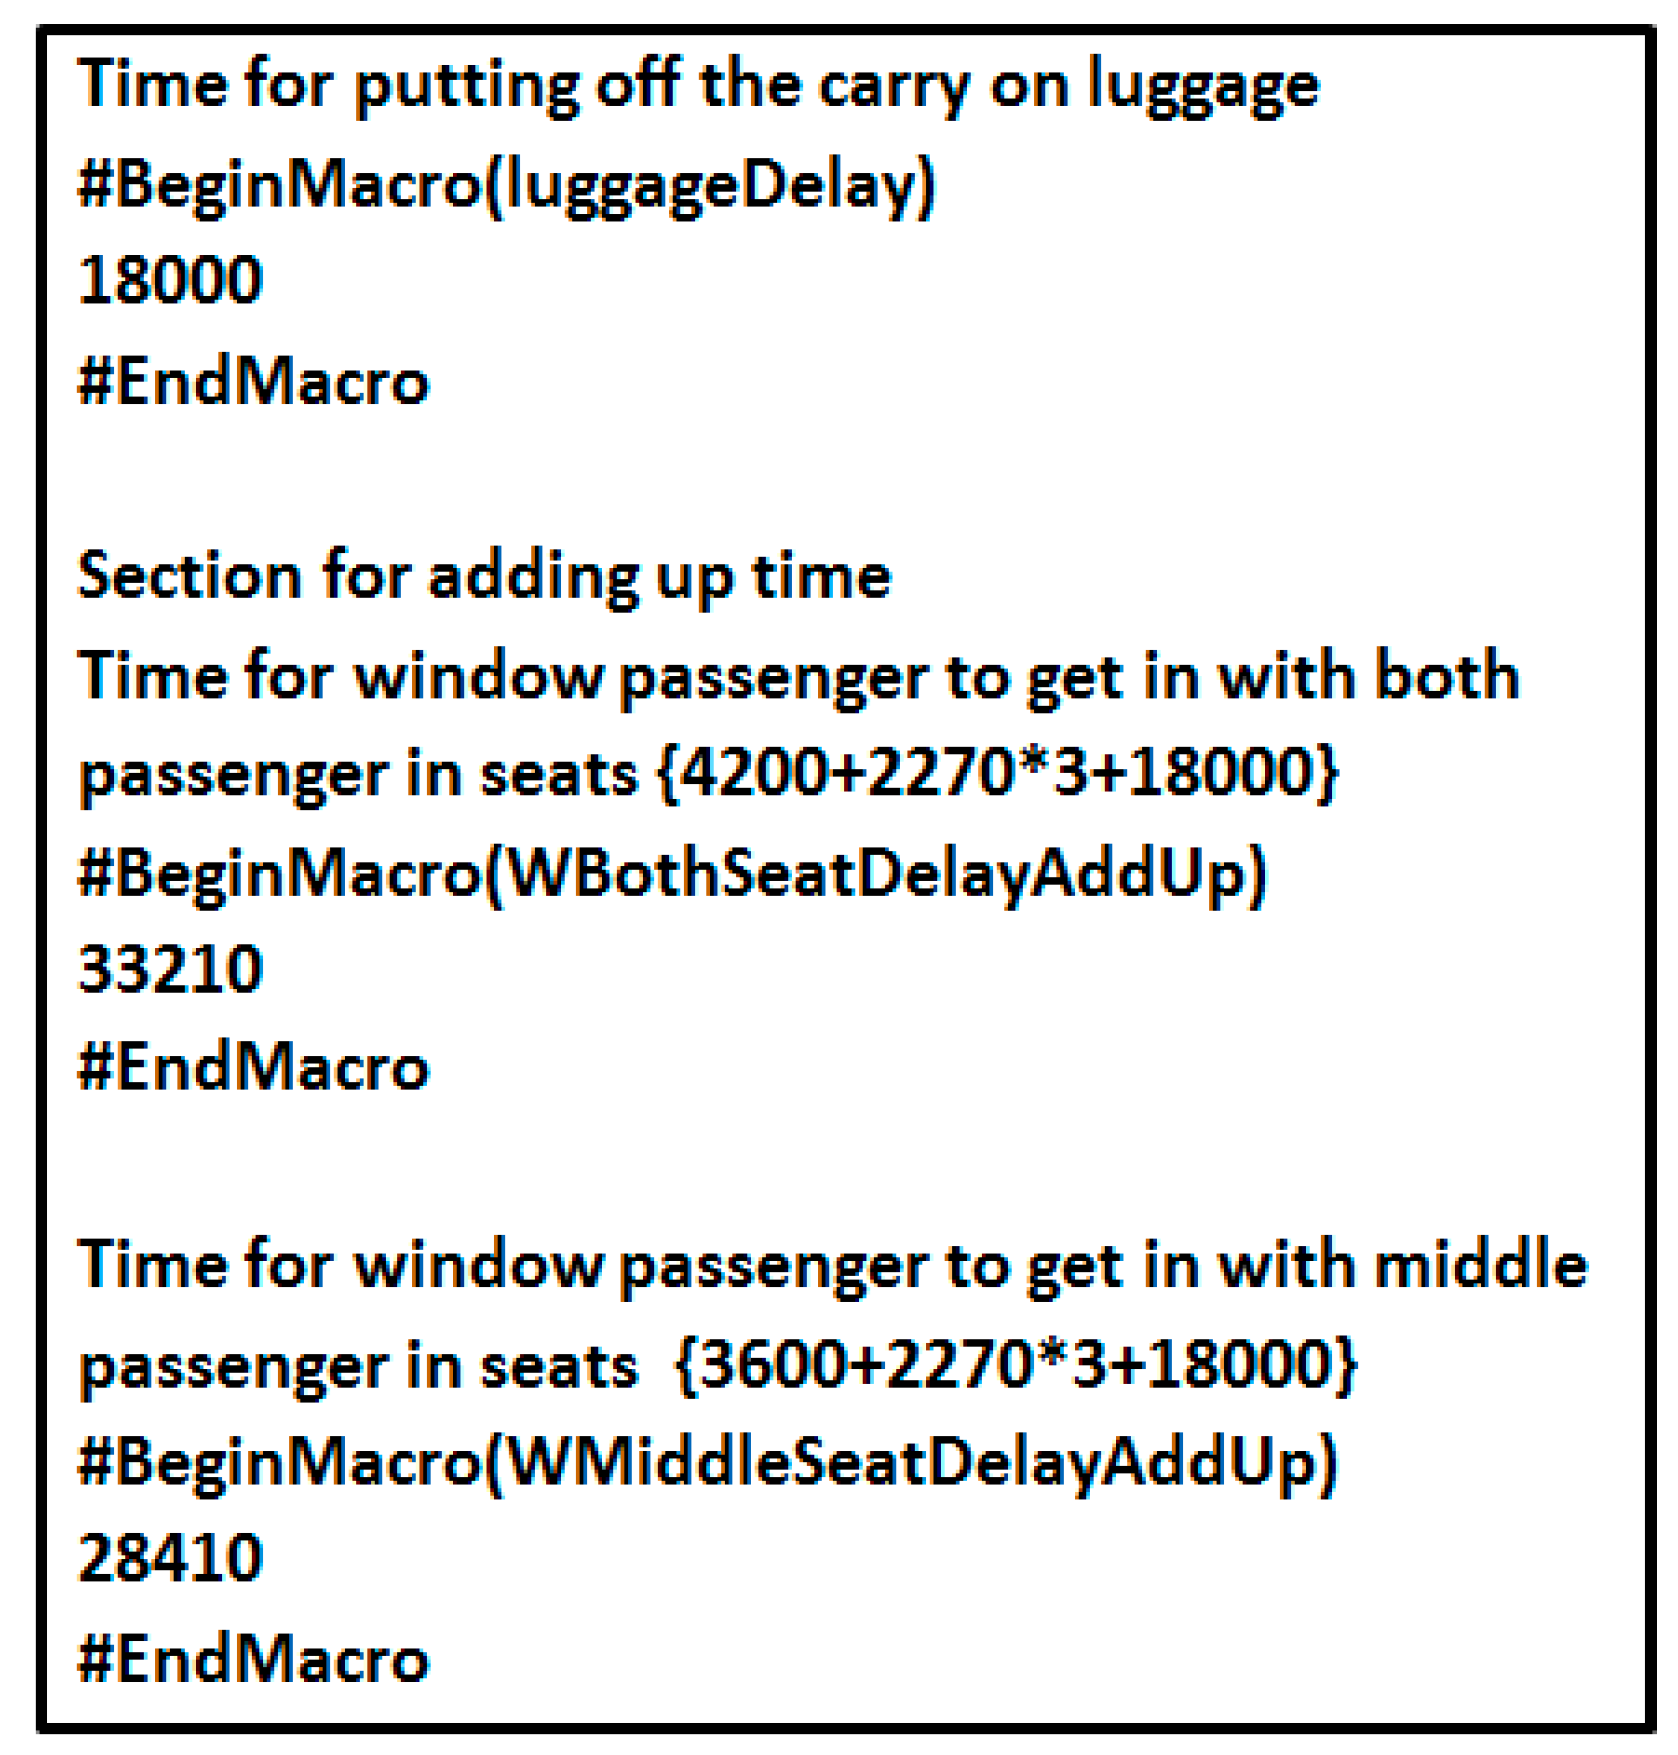
Figure 19.
Initializing cell space with various values.

Figure 20.
Passenger generator header and source file (C++).

Figure 21.
CD++ animation for Cell-DEVS.

Figure 22.
Back-to-Front strategy.

Figure 23.
Window Middle Aisle (WMA) strategy.

Figure 24.
Random strategy.

Figure 25.
Zone rotate strategy.
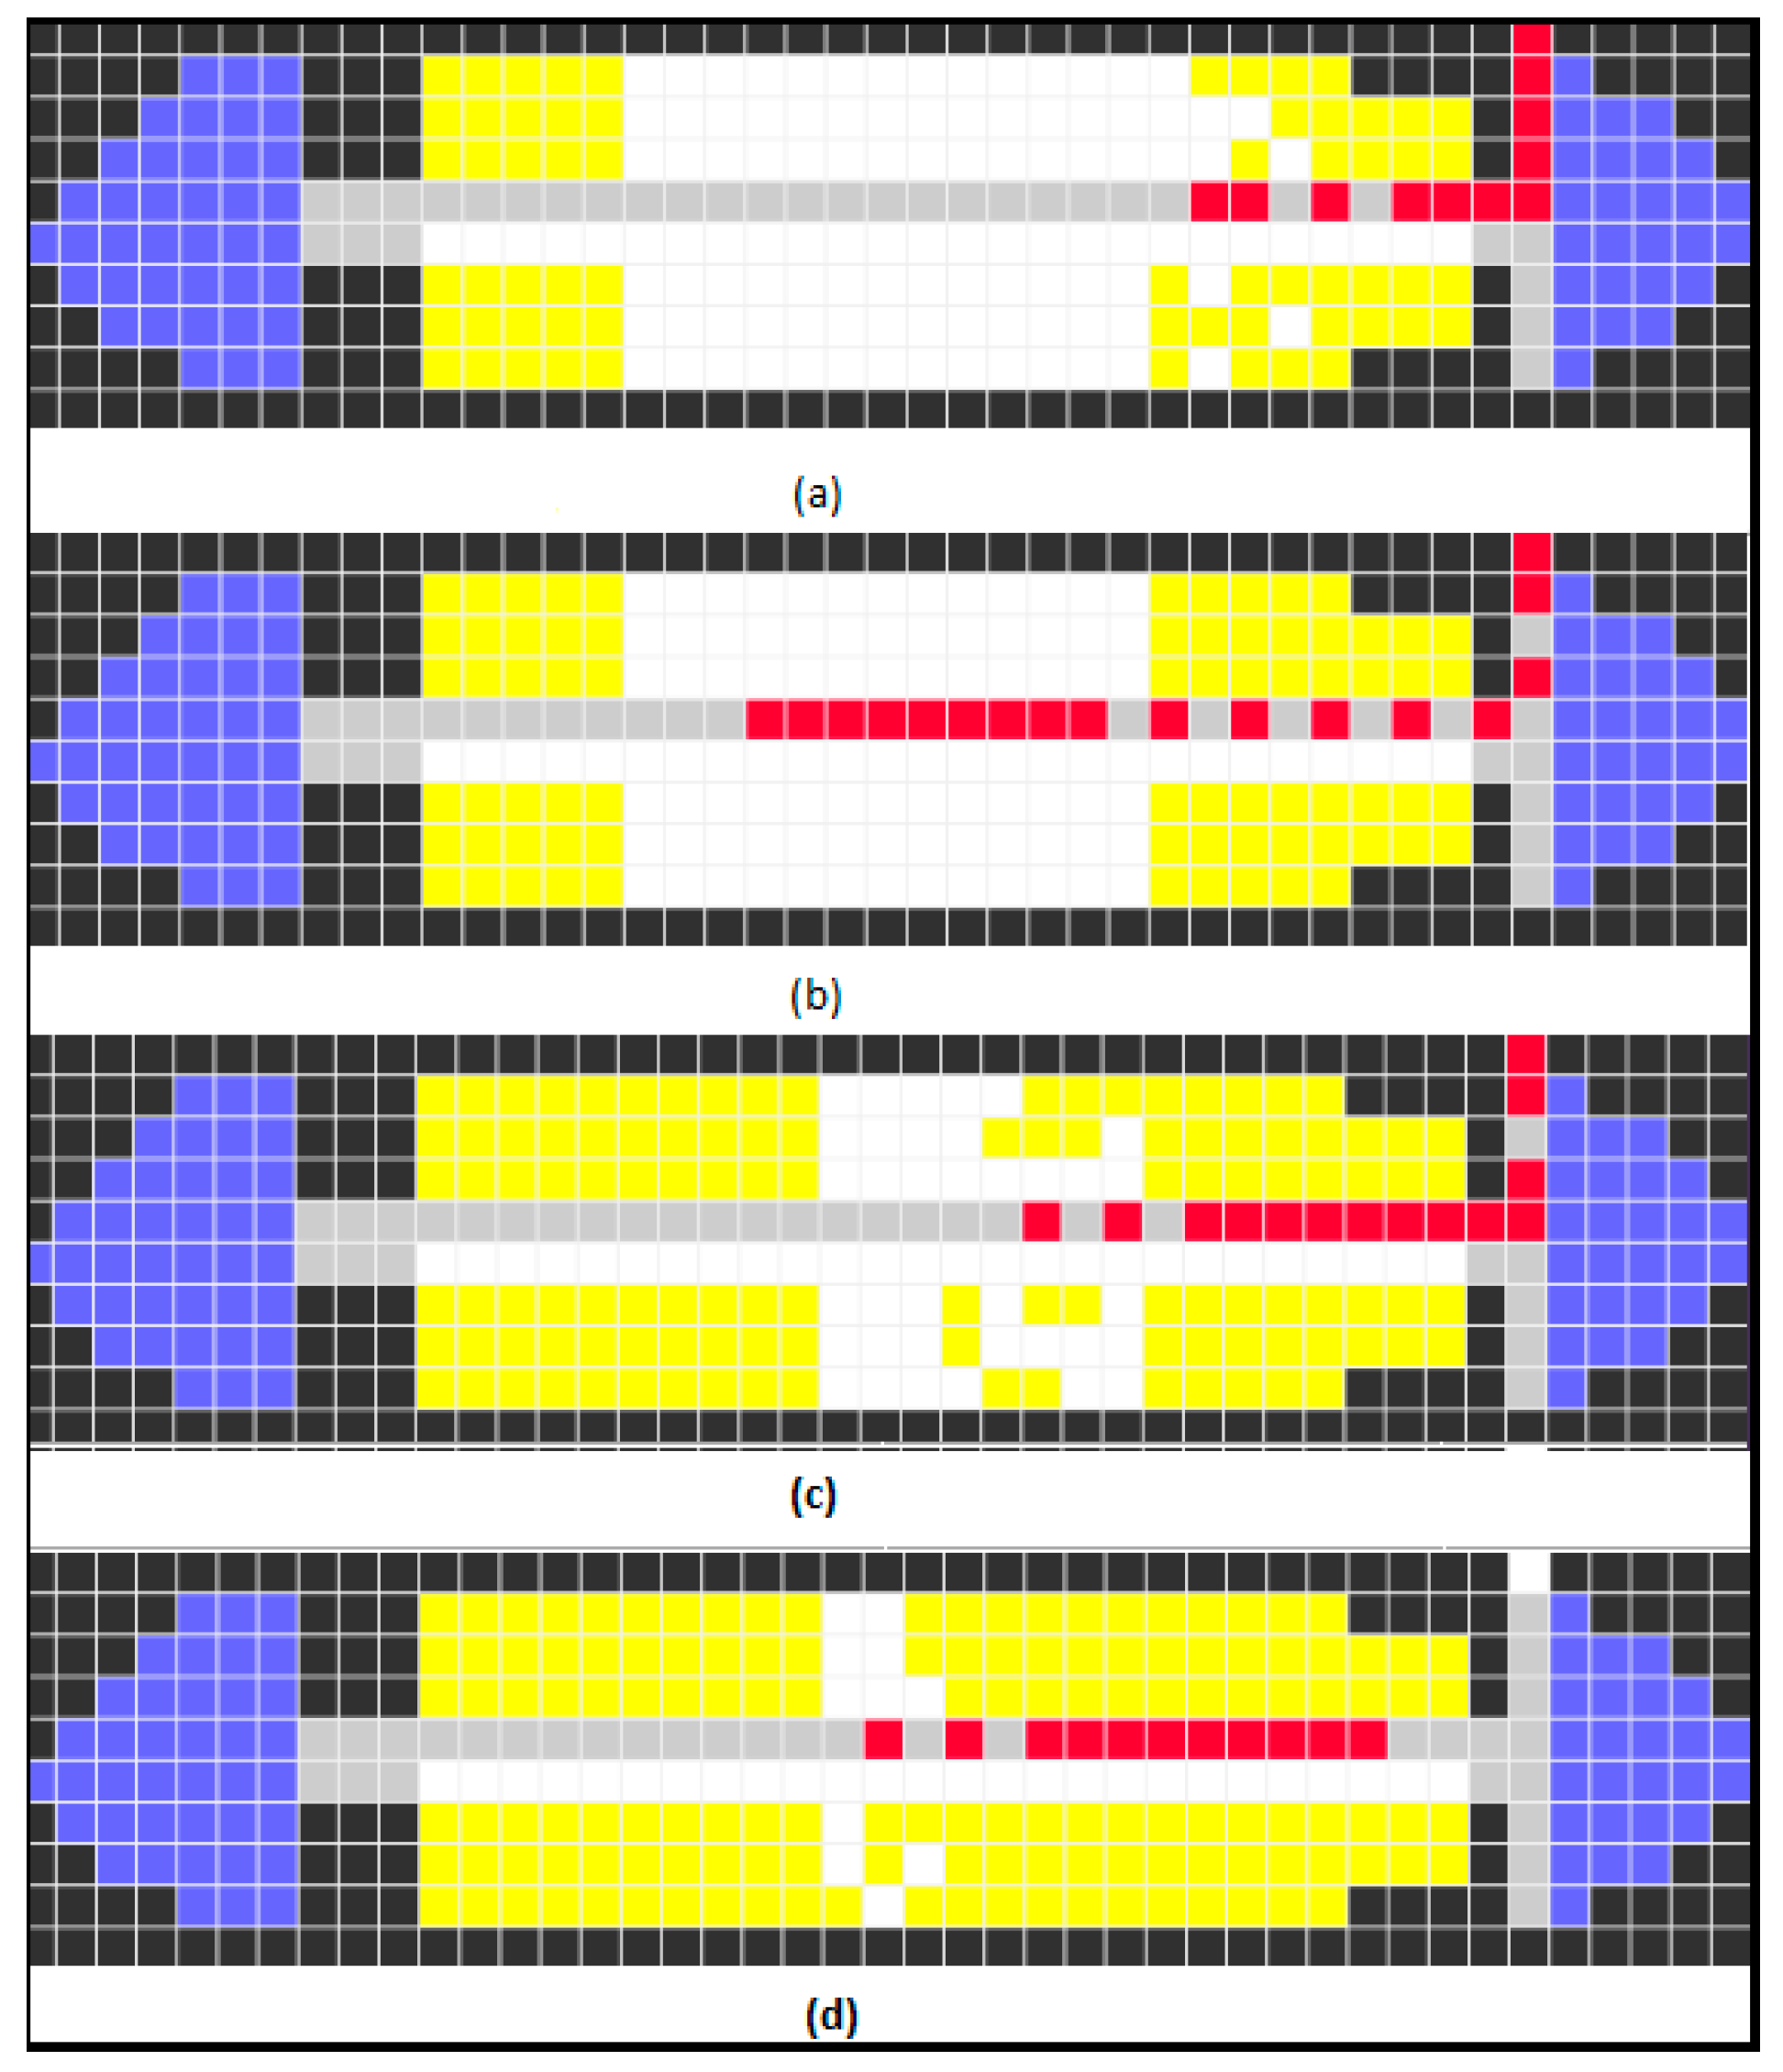
Figure 26.
Reverse pyramid strategy.

Figure 27.
Optimal strategy.
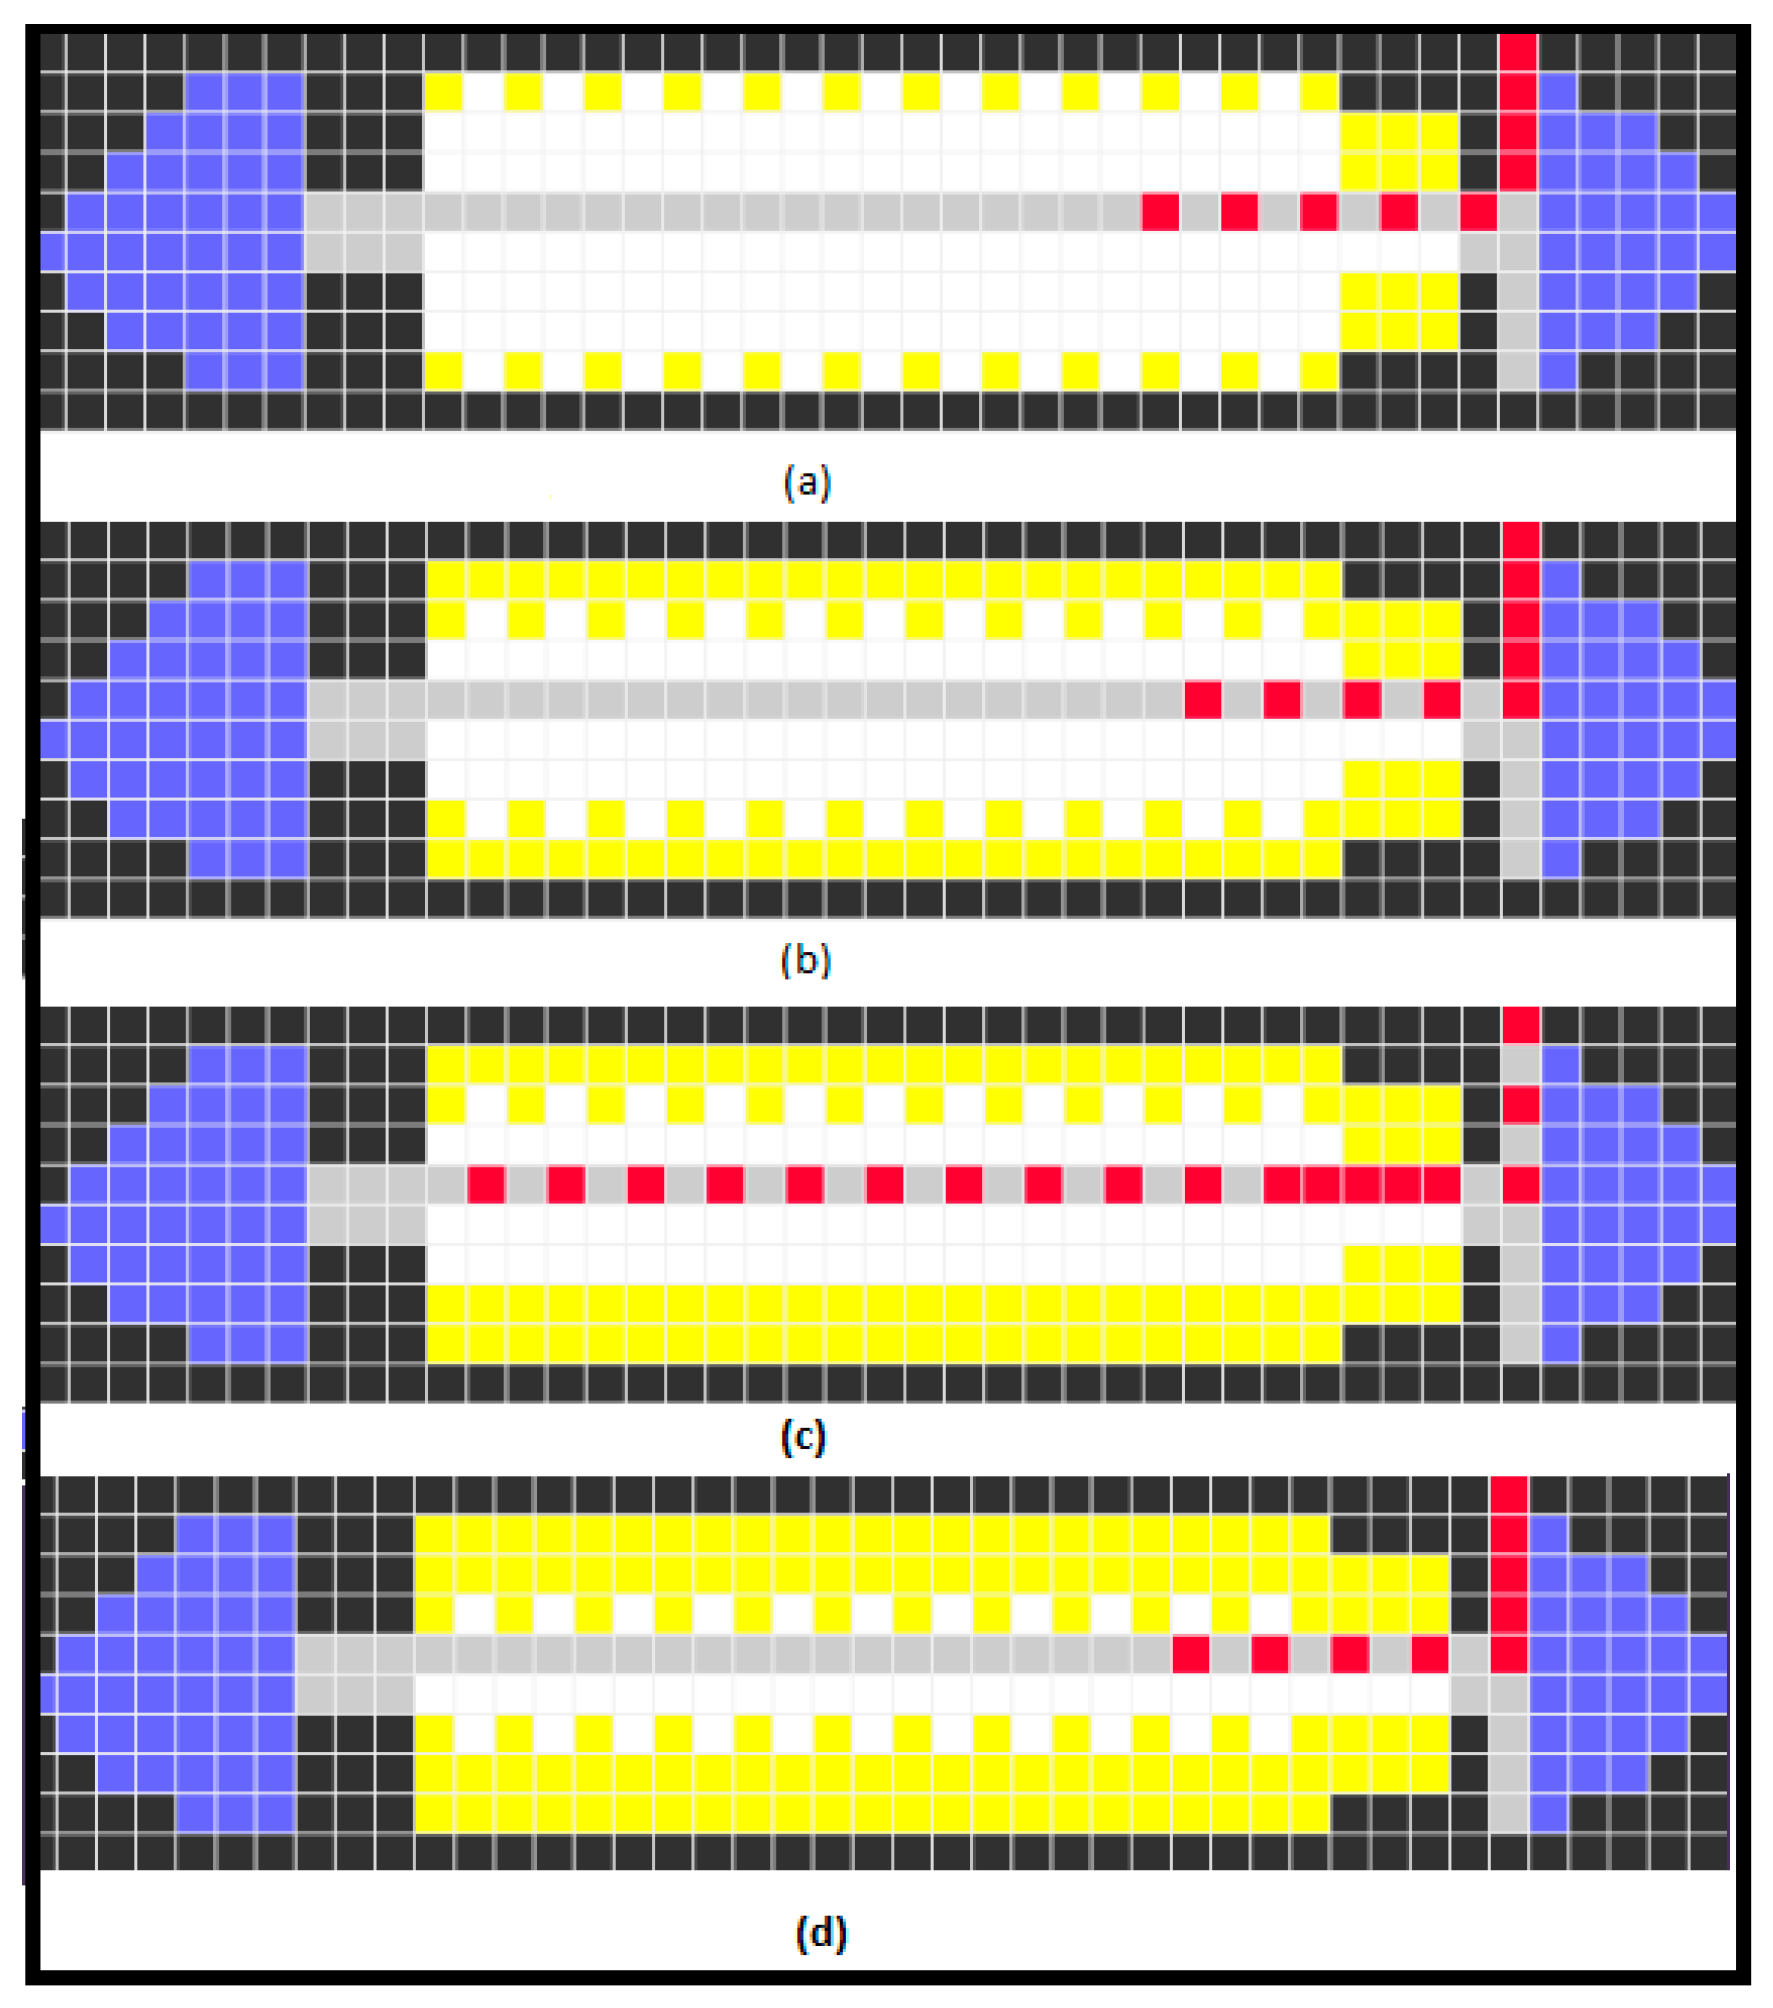
Figure 28.
Optimal practical (every other row) strategy.

Figure 29.
Efficient strategy.

Figure 30.
Boarding time with fixed walking delays.
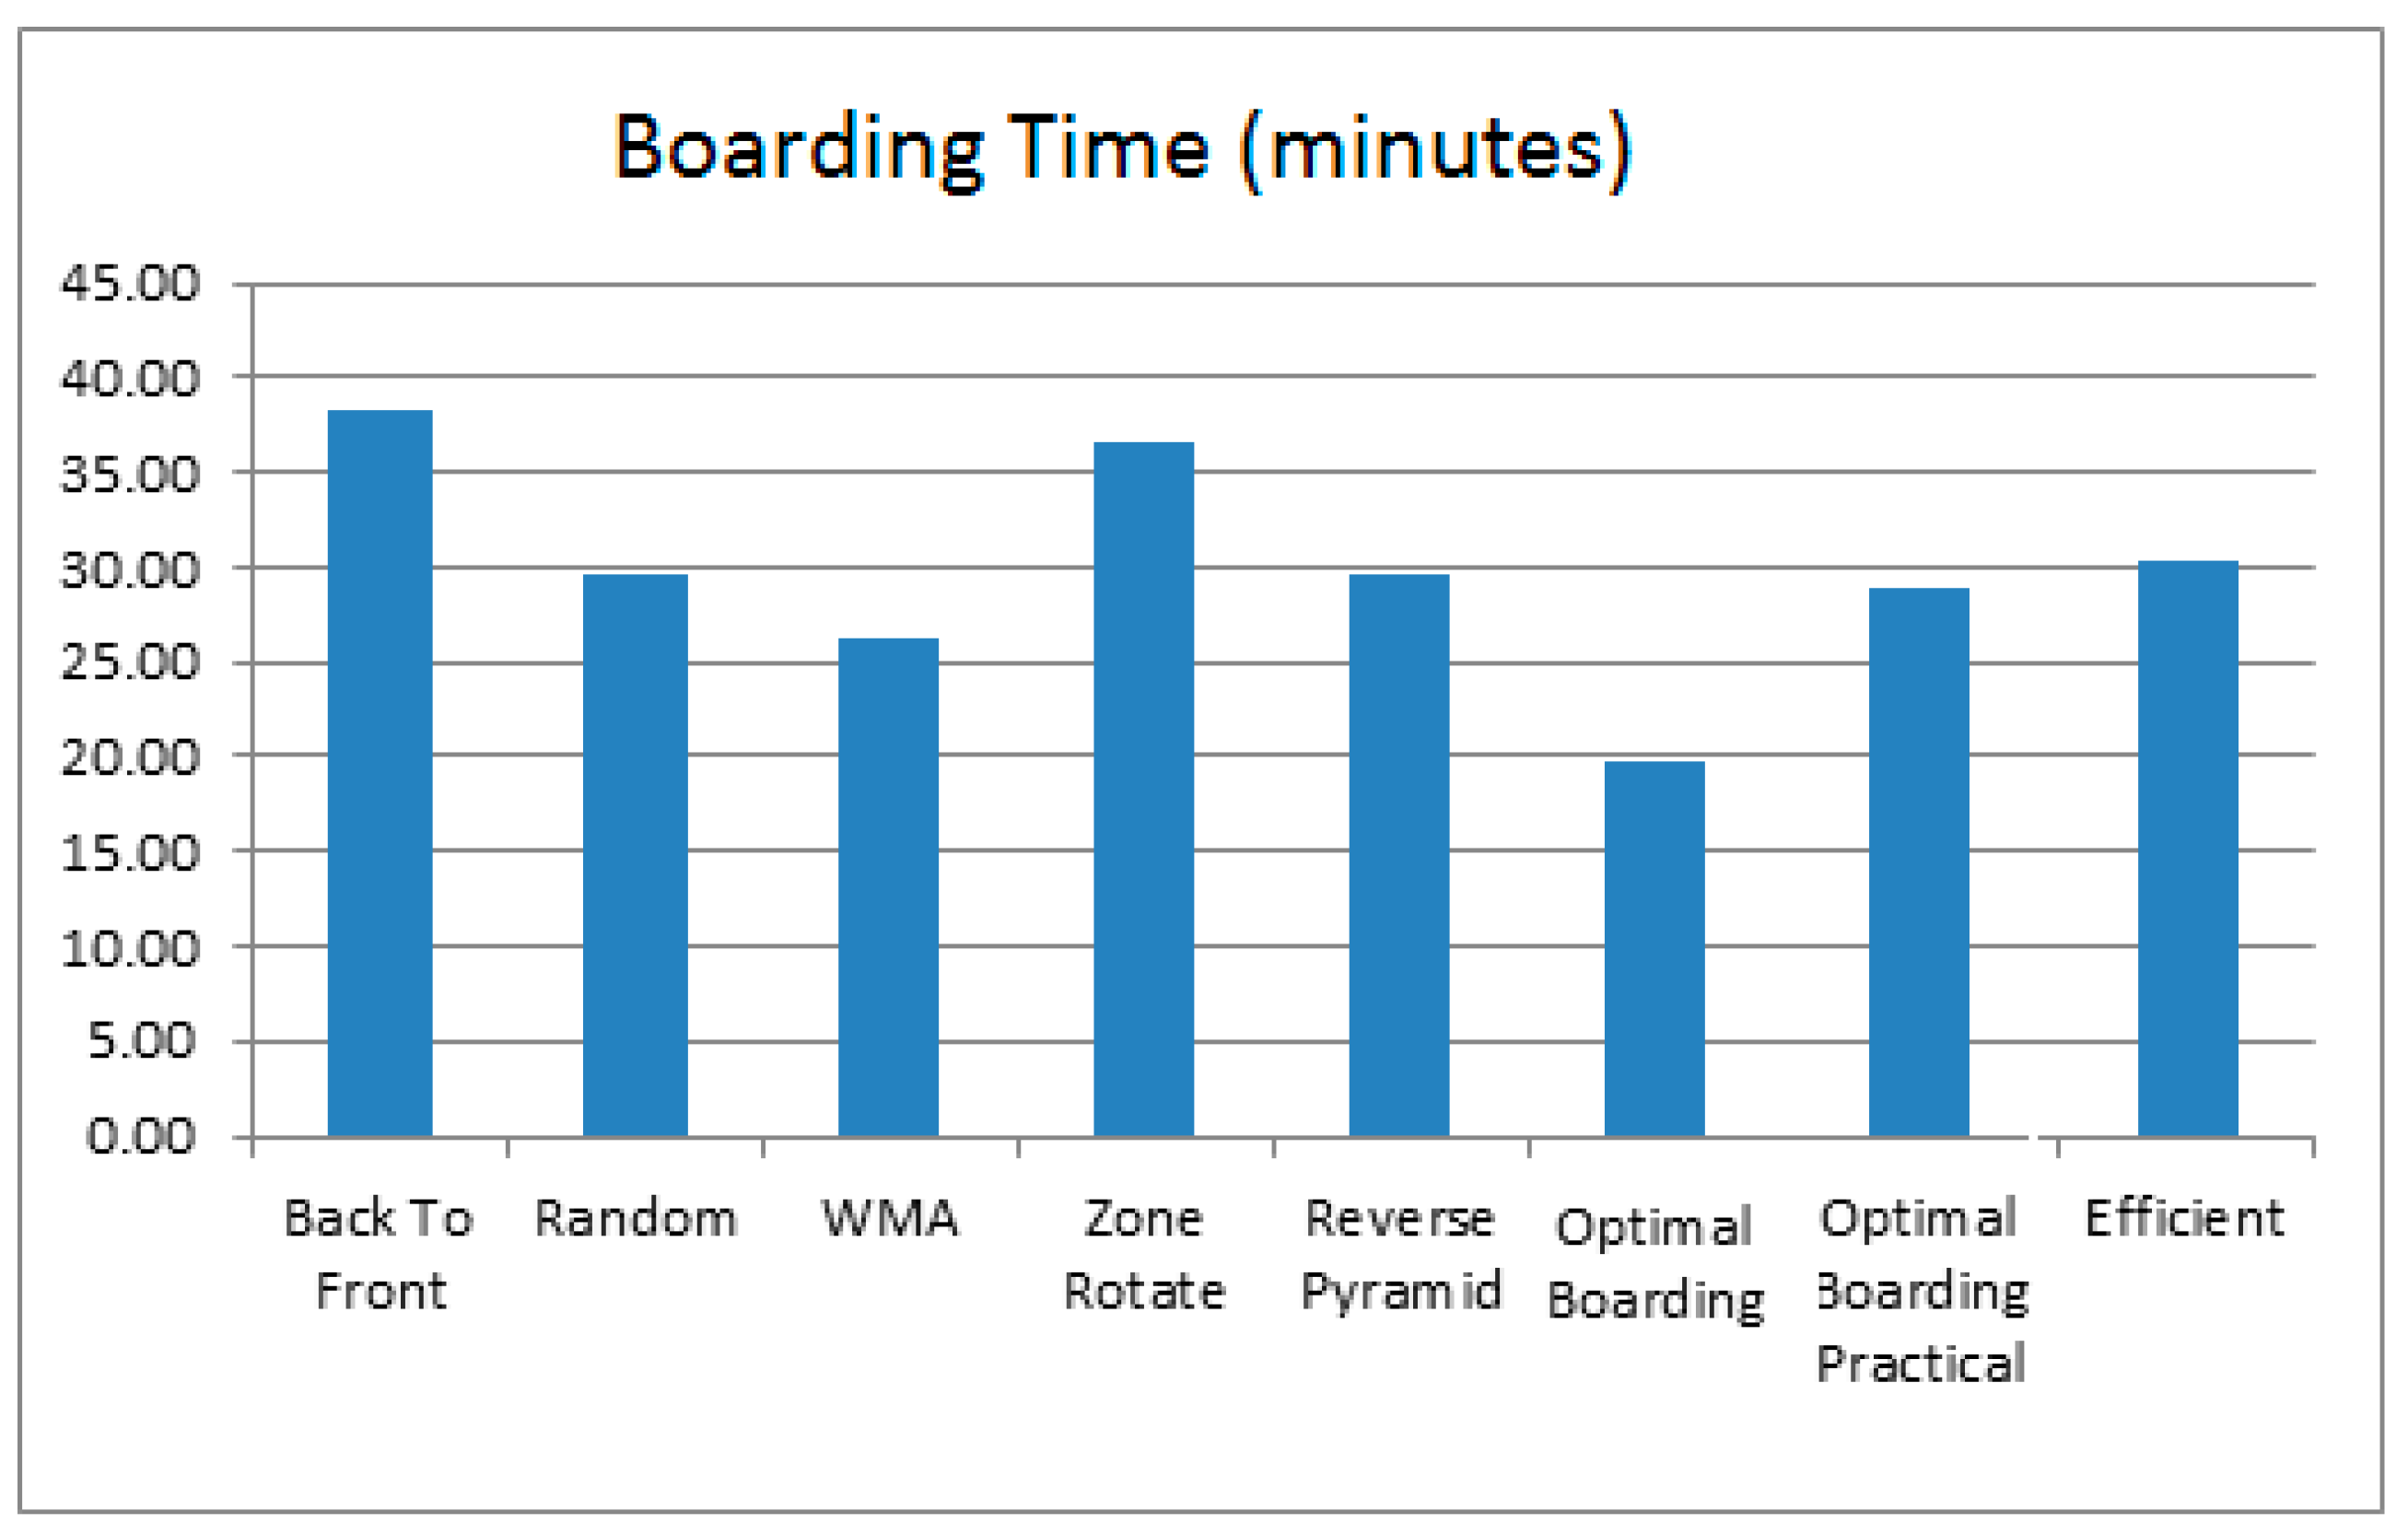
Figure 31.
Boarding time with variable walking delays.


Table 1.
Basic parameters ranges [22].
Table 1.
Basic parameters ranges [22].
| Parameter | Range | Unit |
|---|---|---|
| Walking Speed | 0.27–0.44 | [m/s] |
| Clearing Time | 6–30 | [s] |
| Getting out of seat | 3–4.2 | [s] |
| Passenger flow rate | 0.2–1 | [pax/s] |
Table 2.
Various delay values [22].
Table 2.
Various delay values [22].
| Parameter | Time | Unit |
|---|---|---|
| Walking delay | 2270 | ms |
| Luggage Delay | 18,000 | ms |
| Two passengers get out of seats | 4200 | ms |
| Middle passenger gets out of seat | 3600 | ms |
| Aisle passenger gets out of seat | 3000 | ms |
Table 3.
Cellular state values.
| State Name | State Value | Color | Description |
|---|---|---|---|
| Wall | 0 | Black | Wall or obstacle |
| Aisle | 1, 51–76 | Gray | Aisle |
| Door Open | 2 | Green | Boarding door is open |
| Cabin | 3 | Blue | Cabin or bathroom or cafe |
| Empty Passenger Seat | 100–3000 | white | Passenger seat |
| Walking Passenger | 10,000–300,000 | Red | Walking Passenger |
| Seats with passenger | 4 | Yellow | Seat is occupied with passenger |
| Door Closed | 9 | Green | All the passengers have been boarded |
© 2017 by the authors. Licensee MDPI, Basel, Switzerland. This article is an open access article distributed under the terms and conditions of the Creative Commons Attribution (CC BY) license (http://creativecommons.org/licenses/by/4.0/).
Share and Cite
MDPI and ACS Style
Jafer, S.; Mi, W. Comparative Study of Aircraft Boarding Strategies Using Cellular Discrete Event Simulation. Aerospace 2017, 4, 57. https://doi.org/10.3390/aerospace4040057
AMA Style
Jafer S, Mi W. Comparative Study of Aircraft Boarding Strategies Using Cellular Discrete Event Simulation. Aerospace. 2017; 4(4):57. https://doi.org/10.3390/aerospace4040057
Chicago/Turabian StyleJafer, Shafagh, and Wei Mi. 2017. "Comparative Study of Aircraft Boarding Strategies Using Cellular Discrete Event Simulation" Aerospace 4, no. 4: 57. https://doi.org/10.3390/aerospace4040057
Note that from the first issue of 2016, this journal uses article numbers instead of page numbers. See further details here.