Mathematical Modeling of Liquid-fed Pulsed Plasma Thruster

Department of Electronics and Communication Engineering, Manipal Institute of Technology, Manipal, Karnataka 576104, India
Aerospace 2018, 5(1), 13; https://doi.org/10.3390/aerospace5010013
Submission received: 19 December 2017
/
Revised: 16 January 2018
/
Accepted: 18 January 2018
/
Published: 22 January 2018
(This article belongs to the Special Issue Micro-Propulsion Systems and Components for Small Spacecraft—Current Trends, Innovations and Challenges)
Abstract
:Liquid propellants are fast becoming attractive for pulsed plasma thrusters due to their high efficiency and low contamination issues. However, the complete plasma interaction and acceleration processes are still not very clear. Present paper develops a multi-layer numerical model for liquid propellant PPTs (pulsed plasma thrusters). The model is based on a quasi-steady flow assumption. The model proposes a possible acceleration mechanism for liquid-fed pulsed plasma thrusters and accurately predicts the propellant utilization capabilities and estimations for the fraction of propellant gas that is completely ionized and accelerated to high exit velocities. Validation of the numerical model and the assumptions on which the model is based on is achieved by comparing the experimental results and the simulation results for two different liquid-fed thrusters developed at the University of Tokyo. Simulation results shows that up-to of liquid propellant injected is completely ionized and accelerated to high exit velocities (>50 Km/s), whereas, neutral gas contribute to only of the total specific impulse and accelerated to low exit velocity (<4 Km/s). The model shows an accuracy up-to . Optimization methods are briefly discussed to ensure efficient propellant utilization and performance. The model acts as a tool to understand the background physics and to optimize the performance for liquid-fed PPTs.
1. Introduction
Pulsed plasma thrusters (PPTs) came into existence more than five decades ago. PPTs were one of the first electric propulsion systems to be ever flown due to their low cost and relative simplicity. The low power requirements, simple design, robustness and high specific impulse (>1000 s) are some of the key factors making PPTs attractive and viable propulsion system for small spacecrafts [1]. PPTs utilize the electromagnetic force and gas-dynamic pressure interactions to accelerate the ionized and neutral gas by a controlled pulse discharge [1,2]. The ionized gas could be created by the decomposition of a solid polymer propellant (typically polytetrafluoroethylene (PTFE)) or more recently using liquid-propellant [3,4].
However, in spite the relative simplicity and low cost of ablative PPTs, there are two key issues with the performance of these thrusters—
(1) Ablative PPTs tend to have a very low efficiency (typically <10%) [1,5]. Poor propellant utilization is the key factor identified for this low efficiency [6]. Only a small fraction of the ablated mass is actually ionized due to the high temperature of the discharge arc and accelerated to high exit velocities due to electromagnetic and gas-dynamic thrust interactions. Whereas, a significant portion of mass ablated remains neutral and accelerated to a relatively low exit velocity due to thermal velocities buildup [5]. Additionally, significant mass is lost after the main pulse discharge due to the process of late time ablation and post-pulse macro-particle production [7]. Experimentally, propellant losses and post pulse particle productions were observed in various experiments [1,5]. For Lincoln Experimental Satellite-6 (LES-6) PPT, propellant measurements were made using Faraday cup and charge accumulation on the cup showed that only of the total mass shot was ionized and accelerated to a high velocity of 42.5 Km/s, whereas, the mean velocity measured from the thrust stand measurements was 3.2 Km/s [8]. This suggests that the neutral mass has relatively very low exit speed when compared to the lighter ionized mass. Similar velocity distribution was observed for the Russian MIPD-3 thrusters [9].
(2) Another problem with Teflon fed PPTs is the contamination that is caused by the exhaust [1]. Teflon is composed of Carbon and Fluorine. Fluorine potentially damages the solar arrays, whereas, Teflon bar and the electrodes would undergo carbonization, this significantly decreases the lifetime of ablative PPTs and results in undesirable secondary arc discharges in the thruster [10]. Overcoming the shortcomings of Teflon-fed PPTs requires an alternative propellant which is capable of providing a proper controlled propellant utilization without creating contamination problems.
Liquid-fed PPTs are an attractive solution to the problems of low efficiency and contamination. First, it is observed that the plasma mass ejected per discharge and the total mass shot per discharge for ablative PPTs both scale with the discharge energy [1,11], therefore, it is not possible to ensure complete ionization of propellant in case of ablative pulsed plasma thrusters where the mass shot per discharge is uncontrollable. Liquid-fed PPTs have an advantage of controlled mass supply. The injected propellant mass could be controlled [3,12]. Therefore, it is possible to operate liquid-fed PPTs at energy levels which ensures complete ionization and plasma formation for the given injected mass. Second, the contamination risks associated with liquid propellant PPTs is relatively lower. Water is one of the most attractive liquid propellant for pulsed plasma thrusters due to its relatively low contamination risk.
Figure 1 depicts the working principal of liquid propellant PPT developed at the University of Tokyo [3]. The intermittent injector supplies the liquid propellant (water for this case) between the inter-electrode region. Mechanical valves are used to inject the liquid into the thrust chamber. Water is vaporised into gas, a main discharge is initiated between the parallel electrodes using a spark plug trigger. The discharge converts water and vapor into conducting plasma, which is then accelerated by interaction of electromagnetic and gas-dynamic thrust components. Experimental results shows water-fed PPTs predominantly operates in electromagnetic mode [3].
However, to completely understand the propellant utilization and propellant mass interactions in liquid-fed PPTs and to further improve the performance, a detailed numerical model for plasma and neutral mass interactions and acceleration is required.
Several numerical models have been proposed in the past to predict the performance of pulsed plasma thrusters. Theoretical models range from low order one-dimensional models [2,13] to advanced magneto-hydrodynamics (MHD) modelings [14,15]. One-dimensional electro-mechanical models combine the discharge circuit impedance with the dynamical laws to provide plasma acceleration details. However, conventional slug and snowplow models assume complete ionization of propellant gas and leads to an significant error in predicting the performance of PPTs. In fact, the conventional slug models produced an error up-to in predicting the performance for LES-6 PPT [16]. Slug and snowplow models have been modified to give greater accuracy by accounting the effects of post-pulse macro particle production and gas-dynamic thrust developments [17]. However, the complications with the model has also increased and does not provide a clear plasma interaction behavior. Moreover, the model is not applicable for liquid propellant PPTs. Mass ablation model is also proposed to calculate the mass ablated per discharge [11]. However, the model does not incorporate the mass produced after the primary pulse (post-pulse mass), this post pulse mass could be significant in ablative pulsed plasma thrusters as observed from various experimental results. MHD modelings have also undergone major advancements to account for the late-time ablation mass [11,18,19]. Numerical calculations were also performed for ablation controlled discharges and were applied to the plasma calculations for a Micro-PPT [20,21]. The MHD modelings however, increase the complexity and makes it difficult to implement. Numerical model for water-fed PPTs exist [22]. The model however, is not very accurate and leads to over-prediction of performance parameters for the thruster. The primary reason for this is the assumption the model makes is similar to MHD models, i.e., it presumes complete ionization of the propellant gas.
Present paper makes an attempt to explain the plasma and neutral gas mass flow in injector-based liquid-fed PPTs using mathematical modeling and develops a dynamical model for the same. The mathematical model is implemented in MATLAB/SIMULINK environment. The assumptions on which the model is based on is then validated by comparing the simulation results with the experimental data and observations. Lastly, brief optimization methods are discussed to improve the performance for liquid-fed PPTs.
2. Mathematical Model
A MATLAB/SIMULINK implementable model is developed in this section. The model is used to obtain the plots of various crucial performance parameters. The mathematical model is described in three parts—(1) Equivalent circuit modeling; (2) Propellant flow and mass modeling; (3) Dynamical modeling.
2.1. Equivalent Circuit Modeling
The complete propellant acceleration processes is assumed to be described using an equivalent series inductance-capacitance-resistance (L-C-R) model. It is pretty difficult to obtain the time varying inductance and plasma resistance for equivalent circuitry for PPTs. Therefore, we incorporate constant element model for the present mathematical modeling.
Therefore, the discharge current () and discharge voltage () could be obtained by solving the differential equation,
The discharge current () and discharge voltage () are given by,
where , , , C, are respectively, the charge on the capacitor, total circuit inductance, total circuit resistance, circuit capacitance and initial discharge voltage. The circuit resistance and inductance are obtained from the experimental discharge waveforms. Differential Equation (1) is solved using the experimentally determined impedances to calculate the charge on the capacitor at a given time. The plots of the discharge current and voltage are obtained from Equation (2), which are then used as an input for the sub-models discussed below. It should be noted that the circuit model is based on a quasi-steady assumption, therefore, the model is valid for PPTs with pulse timings much greater than the transit timing. For high frequency PPTs, the discharge current and voltage waveforms predicted by the model would deviate with a real PPT.
2.2. Plasma Flow and Mass Modeling
Conventional slug and snowplow models assume complete ionization of the propellant gas [2,13]. Therefore, only one layer of plasma sheet exists in these models. However, to incorporate the presence of neutral mass including the mass generated after the main discharge by the process of late time evaporation, we presume two different layers exist in the thrust chamber. First layer is the plasma sheet layer and the second layer is the neutral mass layer.
Figure 2A depicts the emission of two different layers for liquid-fed PPT. It is assumed that as soon as the liquid is injected between the inter electrode region, it is distributed uniformly like a thin film. An arc discharge heats the propellant. When the heat of the discharge into liquid propellant raises above the decomposition temperature (), it causes decomposition of the propellant. This forms the decomposition layer (depth of which is represented by ). A portion of decomposition layer is accelerated to high velocity by electromagnetic () and gas-dynamic () thrust components, this layer is called electromagnetic layer (depth of which is represented by ), this layer forms the plasma layer. The remaining layer is composed of the neutral mass (depth of which is represented by ()) and accelerated to low thermal velocity, this layer is the neutral mass layer.
Figure 2B represents the proposed flow model for the two layers. In the present model it is assumed that the neural mass layer is composed of all the neutral mass produced during and after the discharge. The mass of the neutral mass layer remains constant () and is presumed to move with a constant velocity. The plasma mass accumulates mass at rate proportional to the current squared [11]. The force on the plasma sheet is due to the electromagnetic thrust component and gas-dynamic thrust component . Therefore, as the plasma sheet propagates down the thrust chamber it ionizes the gas and accumulates mass in it.
The total mass accelerated per discharge () could therefore, be given by the sum of the constant neutral mass sheet () and plasma sheet mass (),
A quasi-steady flow assumption as proposed by Turchi et al. [23] is used to calculate the mass flow rate and hence the plasma sheet mass near the thin liquid film for liquid-fed PPT. The model is idealized on the condition that at magnetic pressure greater than the plasma pressure and in the limits of high magnetic Reynolds number there exists a magneto-sonic point in the MHD flow. The boundary conditions at this point combined with the Alfven critical speed are used to calculate the mass flow rate of the propellant [11]. For the damped sinusoidal calculated by the L-C-R model, the flow is quasi-steady if the successive pulse timing is greater than the transit timing for the PPT (). This condition ensures a quasi-steady flow behavior. The mass flow rate and hence the plasma mass could be hence given by,
where is the discharge current, h and w are respectively, thruster height and width. is the Alfven critical speed, the expression of which is given by,
where and m are respectively, the ionization potential and molar mass of the propellant. It could be observed from Equation (4) that the mass of the plasma sheet is proportional to the integral of the current squared which is in turn proportional to the discharge energy, therefore, it could be concluded that it is possible to operate the liquid propellant in complete electromagnetic mode by ensuring complete ionization of the propellant. Comparison between the material properties for Teflon and Water is shown in Table 1 [15,24].
Unfortunately, at present there is no accurate numerical model which can precisely predict the neutral mass generated during the discharge processes, therefore, the neutral gas mass layer () is calculated using the values of the total mass supplied (determined experimentally) and the plasma sheet mass.
2.3. Dynamical Modeling
It is presumed that the thrust on the plasma sheet is due to Lorentz electromagnetic thrust component and gas-dynamic components. The two forces contribute to the thrust delivered to the plasma sheet. The net force acting on the plasma sheet () is therefore given by,
The electromagnetic thrust is calculated using the conventional snowplow model relations [2,13], and is proportional to the discharge current and inductance per unit length (). Since the pulse timings for PPTs are decently long enough, therefore, the induced emfs are still weak and hence, are neglected in the present model. The relation for the electromagnetic thrust component is thus given by,
The gas dynamic thrust in vacuum is calculated by assuming that the entire plasma flow is choked within the discharge channel as suggested by Henrikson [11]. The gas-dynamic thrust component is thus given by,
where , R, are respectively, ratio of specific heats, molar gas constant and plasma electron temperature. and are thrust coefficients the ratio of which is given by, . The gas dynamic component is proportional to the mass flow rate near the thin liquid film for liquid-fed PPT.
The net force on the plasma sheet could be also expressed in terms of the sheet mass () and position () using Newton’s second law,
Equations (4) and (6)–(9) are combined to evaluate the net thrust and hence, the position of the plasma sheet with respect to time () is given by the differential equation,
Solving differential Equation (10), the sheet distance () could be calculated. It could be observed from Equation (10) that the electromagnetic and gas-dynamic thrust components are both proportional to the discharge current squared. Therefore, the position of the plasma sheet is dependent on the discharge current and current ringing processes. The mean velocity of the sheet () and the impulse bit delivered by the sheet () could be further calculated using the relations,
The neutral mass in the present model as mentioned is assumed to be of constant mass and moves with a constant low speed ().
From previous experimental observations for ablative PPTs it is observed that the neutral gas mass moves independent of the discharge current and current ringing [25], therefore, the assumption of constant velocity profile and constant mass is pretty reasonable. The velocity of the neutral sheet mass () is evaluated by Mikellides [14] and represents the upper limit to the neutral mass velocity, as the calculations utilized the equilibrium vapor pressure. The neutral velocity is thus given by,
where , R, , are respectively density of the liquid propellant, specific gas constant, self magnetic field and decomposition temperature of the propellant. The mean position of the neutral gas sheet () could be given by,
The impulse bit delivered by the neutral sheet mass () is given by,
The impulse bit delivered by the neutral mass is expected to be exceptionally low due to the relative low speed of the neutral mass when compared to the plasma sheet mass.
The total Impulse bit (), thus delivered by the thruster is the combination of the plasma sheet mass and the neutral mass and is given by,
The average velocity could be hence evaluated using the expression (15), therefore, the mean exit velocity could be thus given by,
This completes the description of the mathematical model for the liquid-fed pulsed plasma thruster. In the next section the model is implemented in MATLAB/SIMULINK environment to test the validity of the proposed numerical model.
3. Implementation and Discussion of Mathematical Model
In present section we test the accuracy of the model and the assumptions made throughout by comparing the simulation results with two water-fed PPTs developed and tested at the University of Tokyo [3,12,25]. First, we validate the circuit models and dynamical models by computing the simulation results for a 13.5 J energy water-fed thruster [12]. For convenience we term this thruster as Liquid propellant pulsed plasma thruster-1 (LPPT-1). Second, we validate the mass flow model by comparing the simulation results with the high speed images for a 7.4 J class of thruster [25], for convenience we term this thruster as LPPT-2.
3.1. Results for LPPT-1
We first validate the equivalent circuit model and dynamical model using LPPT-1. Table 2 shows the operational parameter for LPPT-1 [12].
The circuit impedances values are taken from Table 1 as an input for the governing differential equation for circuit model. The solution of the equation is used to calculate the discharge current for LPPT-1. Simulations were performed for both singly and doubly ionized water. However, simulations for singly ionized water showed good agreement with the experimental results. Therefore, simulation results for only singly ionized water is presented in the present paper. For singly ionized water, = 21,200 m/s. Figure 3 depicts the comparison between the experimental results with the simulation results for the discharge current. The discharge current waveform is in close agreement with the experimental values. The peak current for the experimental setup is close to 14 kA, whereas the model suggests a peak current of 13.4 kA.
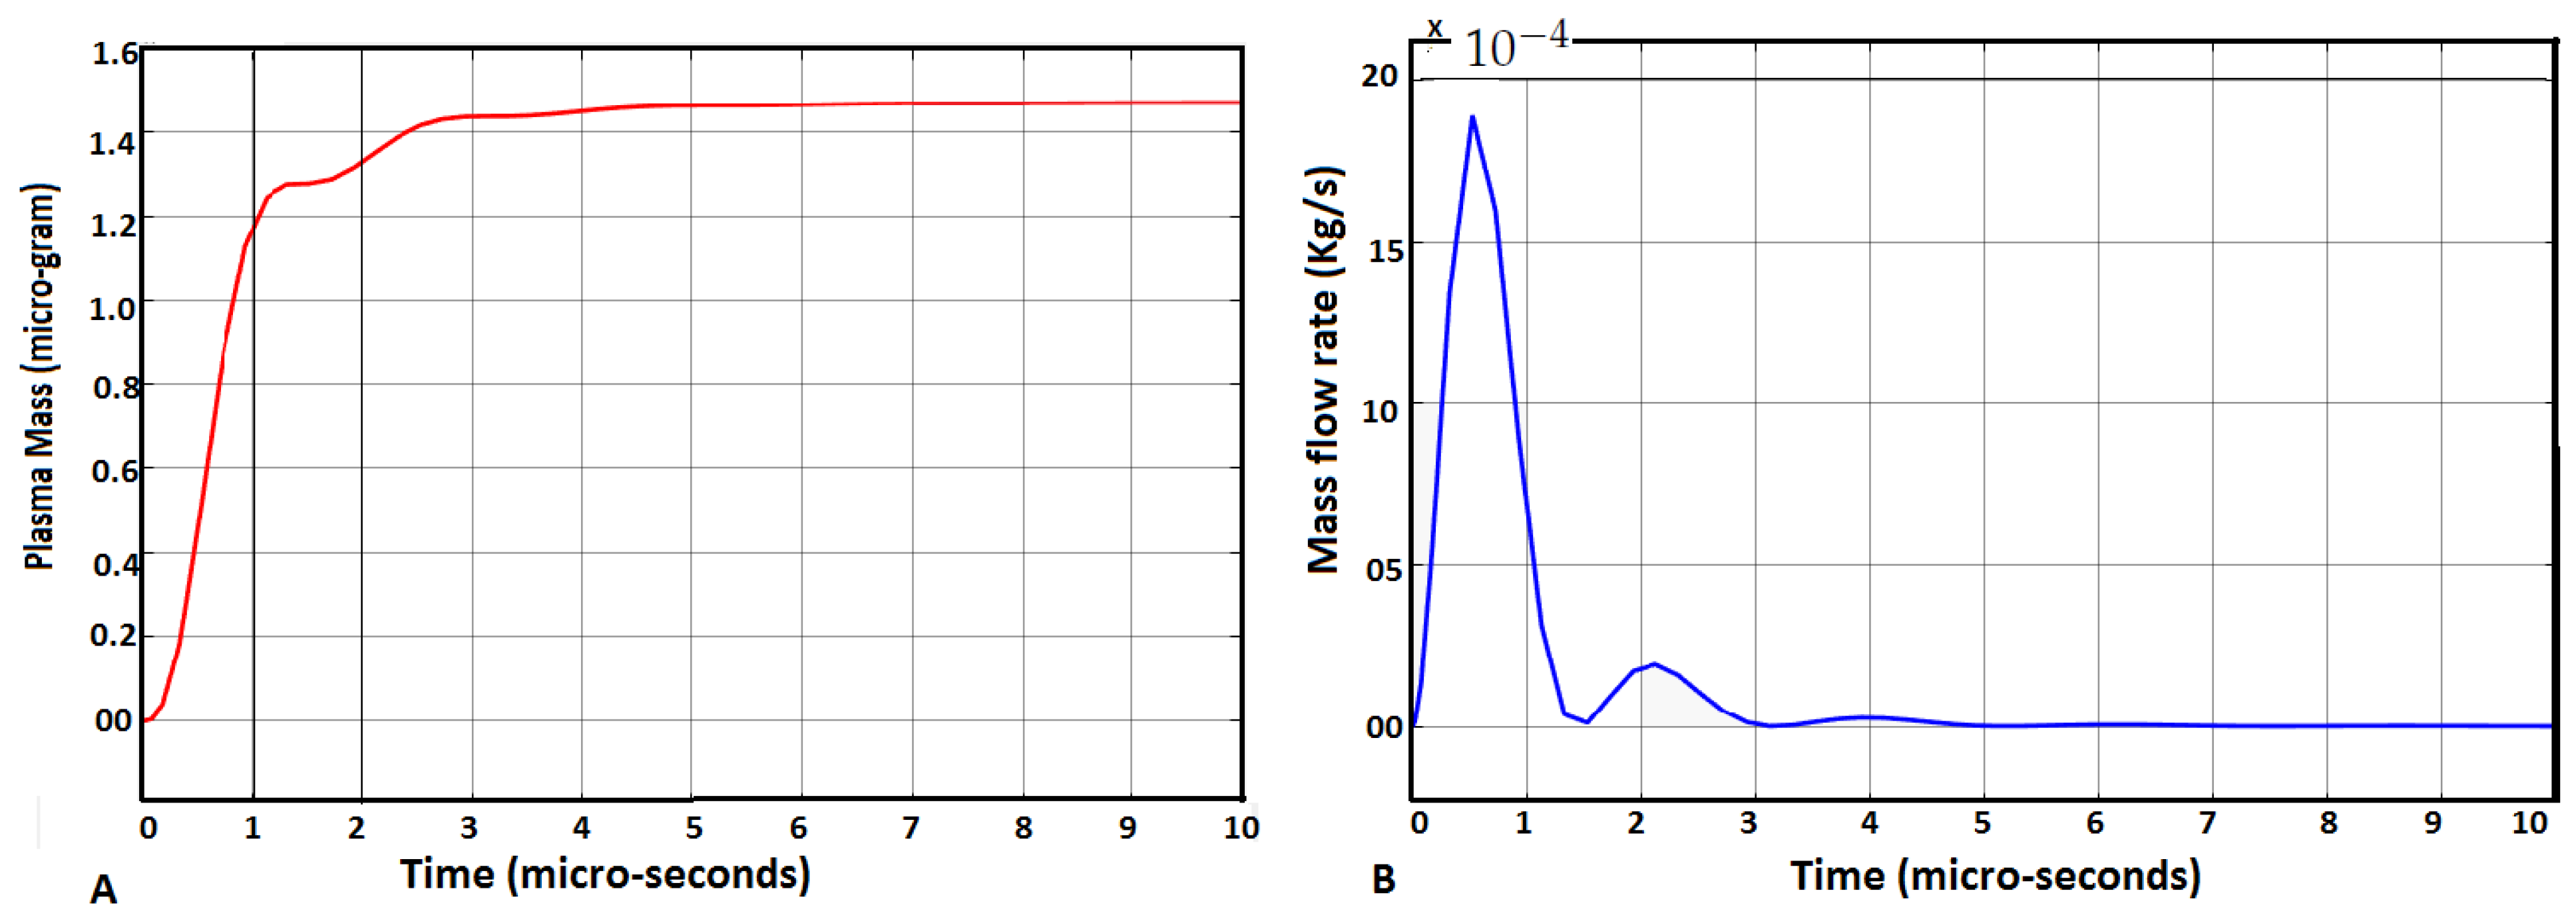
Figure 4A depicts the sheet mass calculated using the discharge current waveform and Equation (4). As mentioned the plasma sheet mass is calculated for singly ionized water. It could be observed that for the 2.8 g of liquid propellant injected only 1.46 g of propellant is converted to plasma. Therefore, only of the injected propellant forms the plasma mass, the remaining supplied mass is converted to neutral gas mass and accelerated to a relatively low exit velocity when compared to the plasma mass. The propellant utilization however, is still better than the LES-6 and other ablative PPTs where only of propellant is ionized [1]. Figure 4B depicts the mass flow rate at the surface of the thin liquid film. It should be noted that the plasma mass is the total plasma mass accelerated per discharge and not precisely the mass of the plasma sheet, as there might be secondary “crowbar” breakdown due to the under-damped behavior of the discharge current.
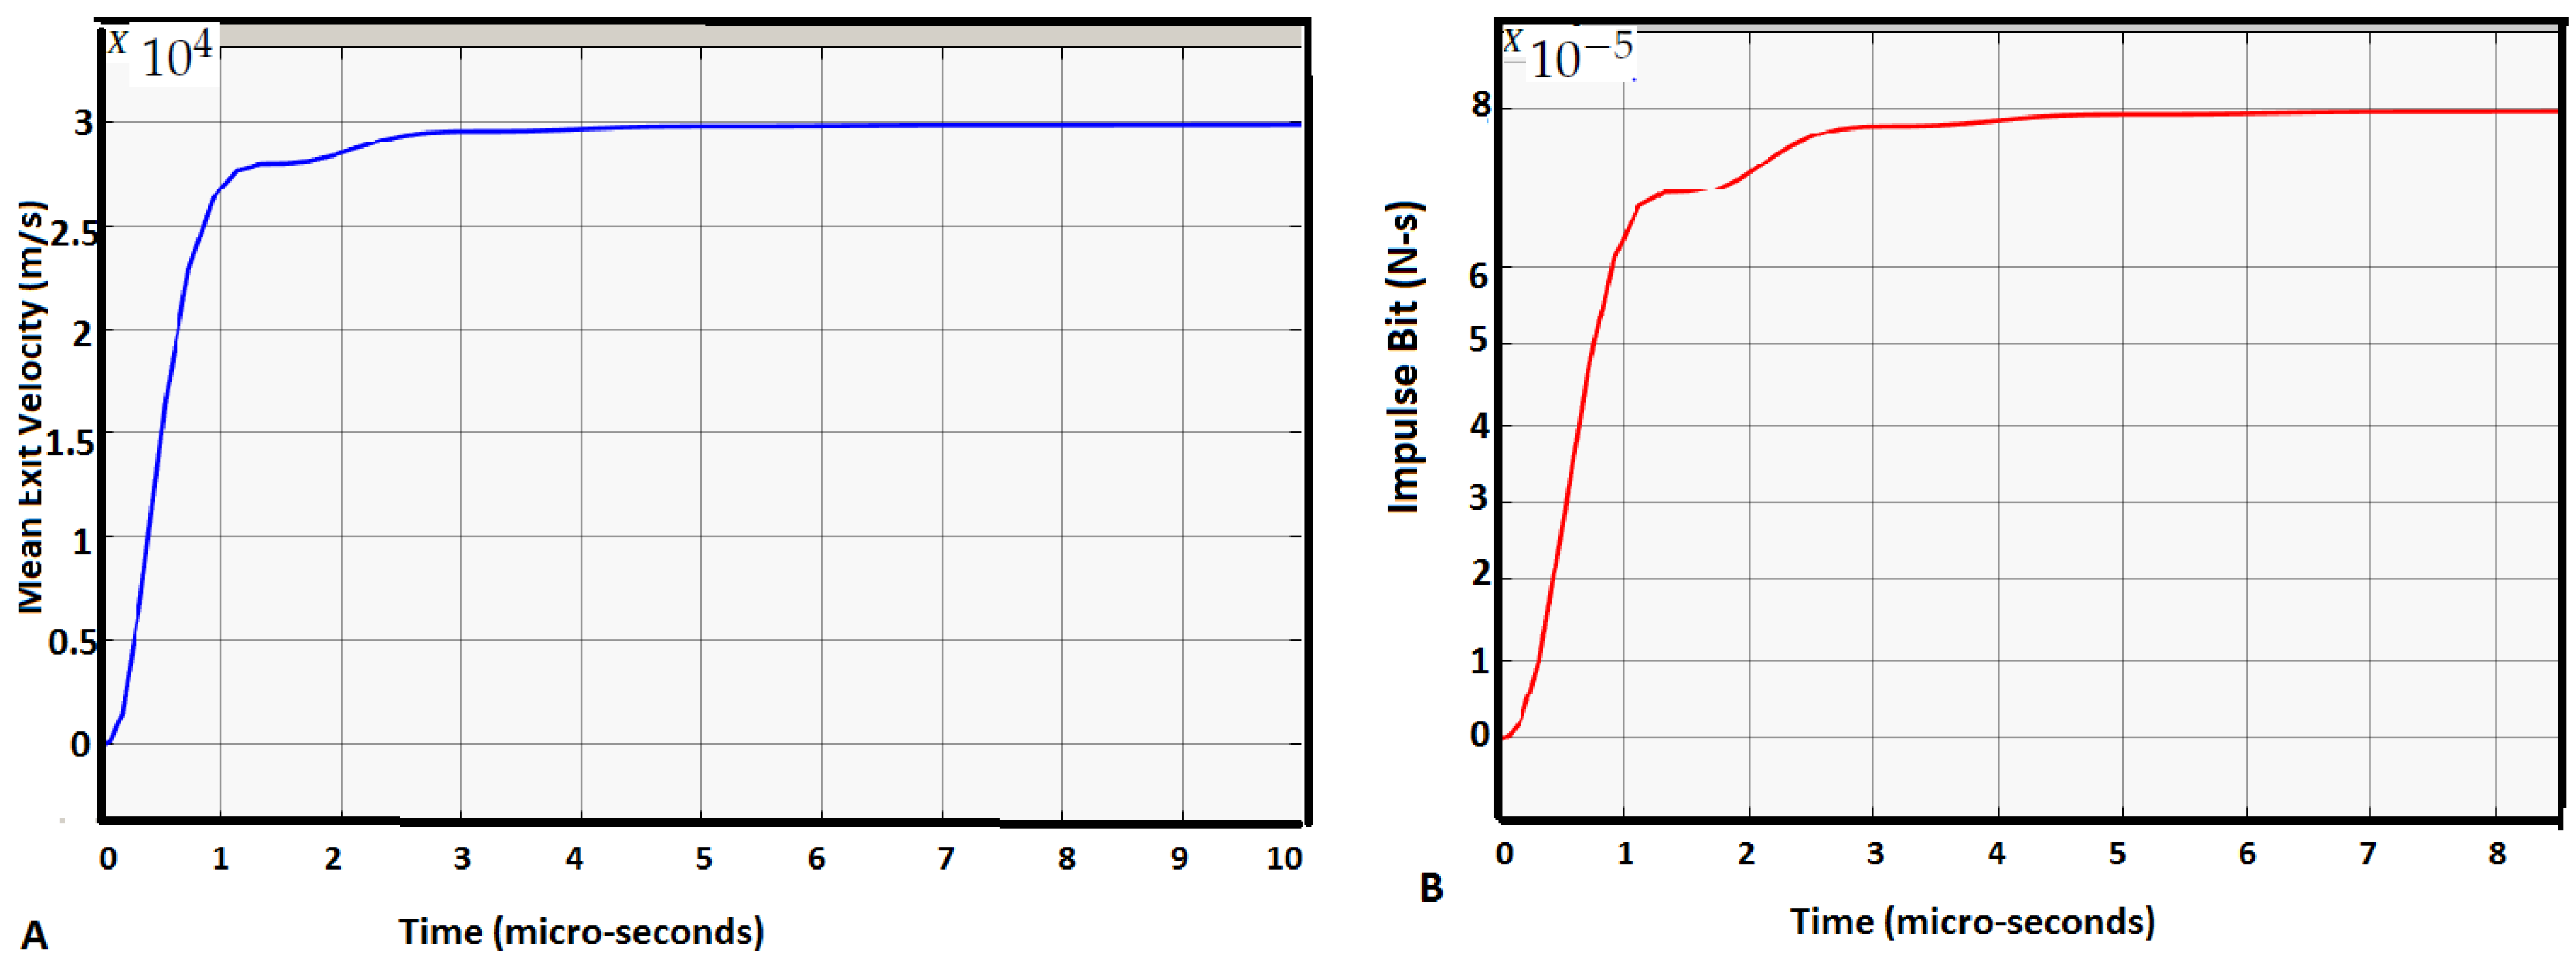
Using the dynamical equations, the model evaluates the mean exit velocity of plasma sheet to be approximately equal to 49 Km/s. This velocity is much greater than the expected velocity for ionized water propellant given by the Alfven critical speed calculations (approximately 40 Km/s). Simulations for the mean exit velocity () and Impulse bit () is shown in Figure 5. Simulations results show an of 79.2 N-s and of 28 Km/s. It can be observed if the supplied propellant mass was completely ionized, the mean exit velocity would increase by approximately a factor of two. This would increase specific impulse significantly.
Table 3 summarizes the comparison between the experimental results and mathematical model results. It could be seen that the model slightly under-predicts the performance for LPPT-1. The primary reason behind this is the calculations the model assumed was that the mean exit velocity of neutral mass is approximately close to zero. However, there is certain contribution by the neutral mass to the total impulse bit, this primarily leads to an under-prediction in the numerical values. By comparing the experimental results with the simulation results the mean exit velocity of the neutral mass layer is calculated to be 3.6 Km/s. Therefore, the charged mass carry about of the total impulse bit. Whereas the neutral mass only contribute about of the total impulse bit. The neutral mass layer therefore, is accelerated to a very low speed. It could be concluded the charged mass contributes significantly to the total momentum when compared to the decomposed neutral mass.
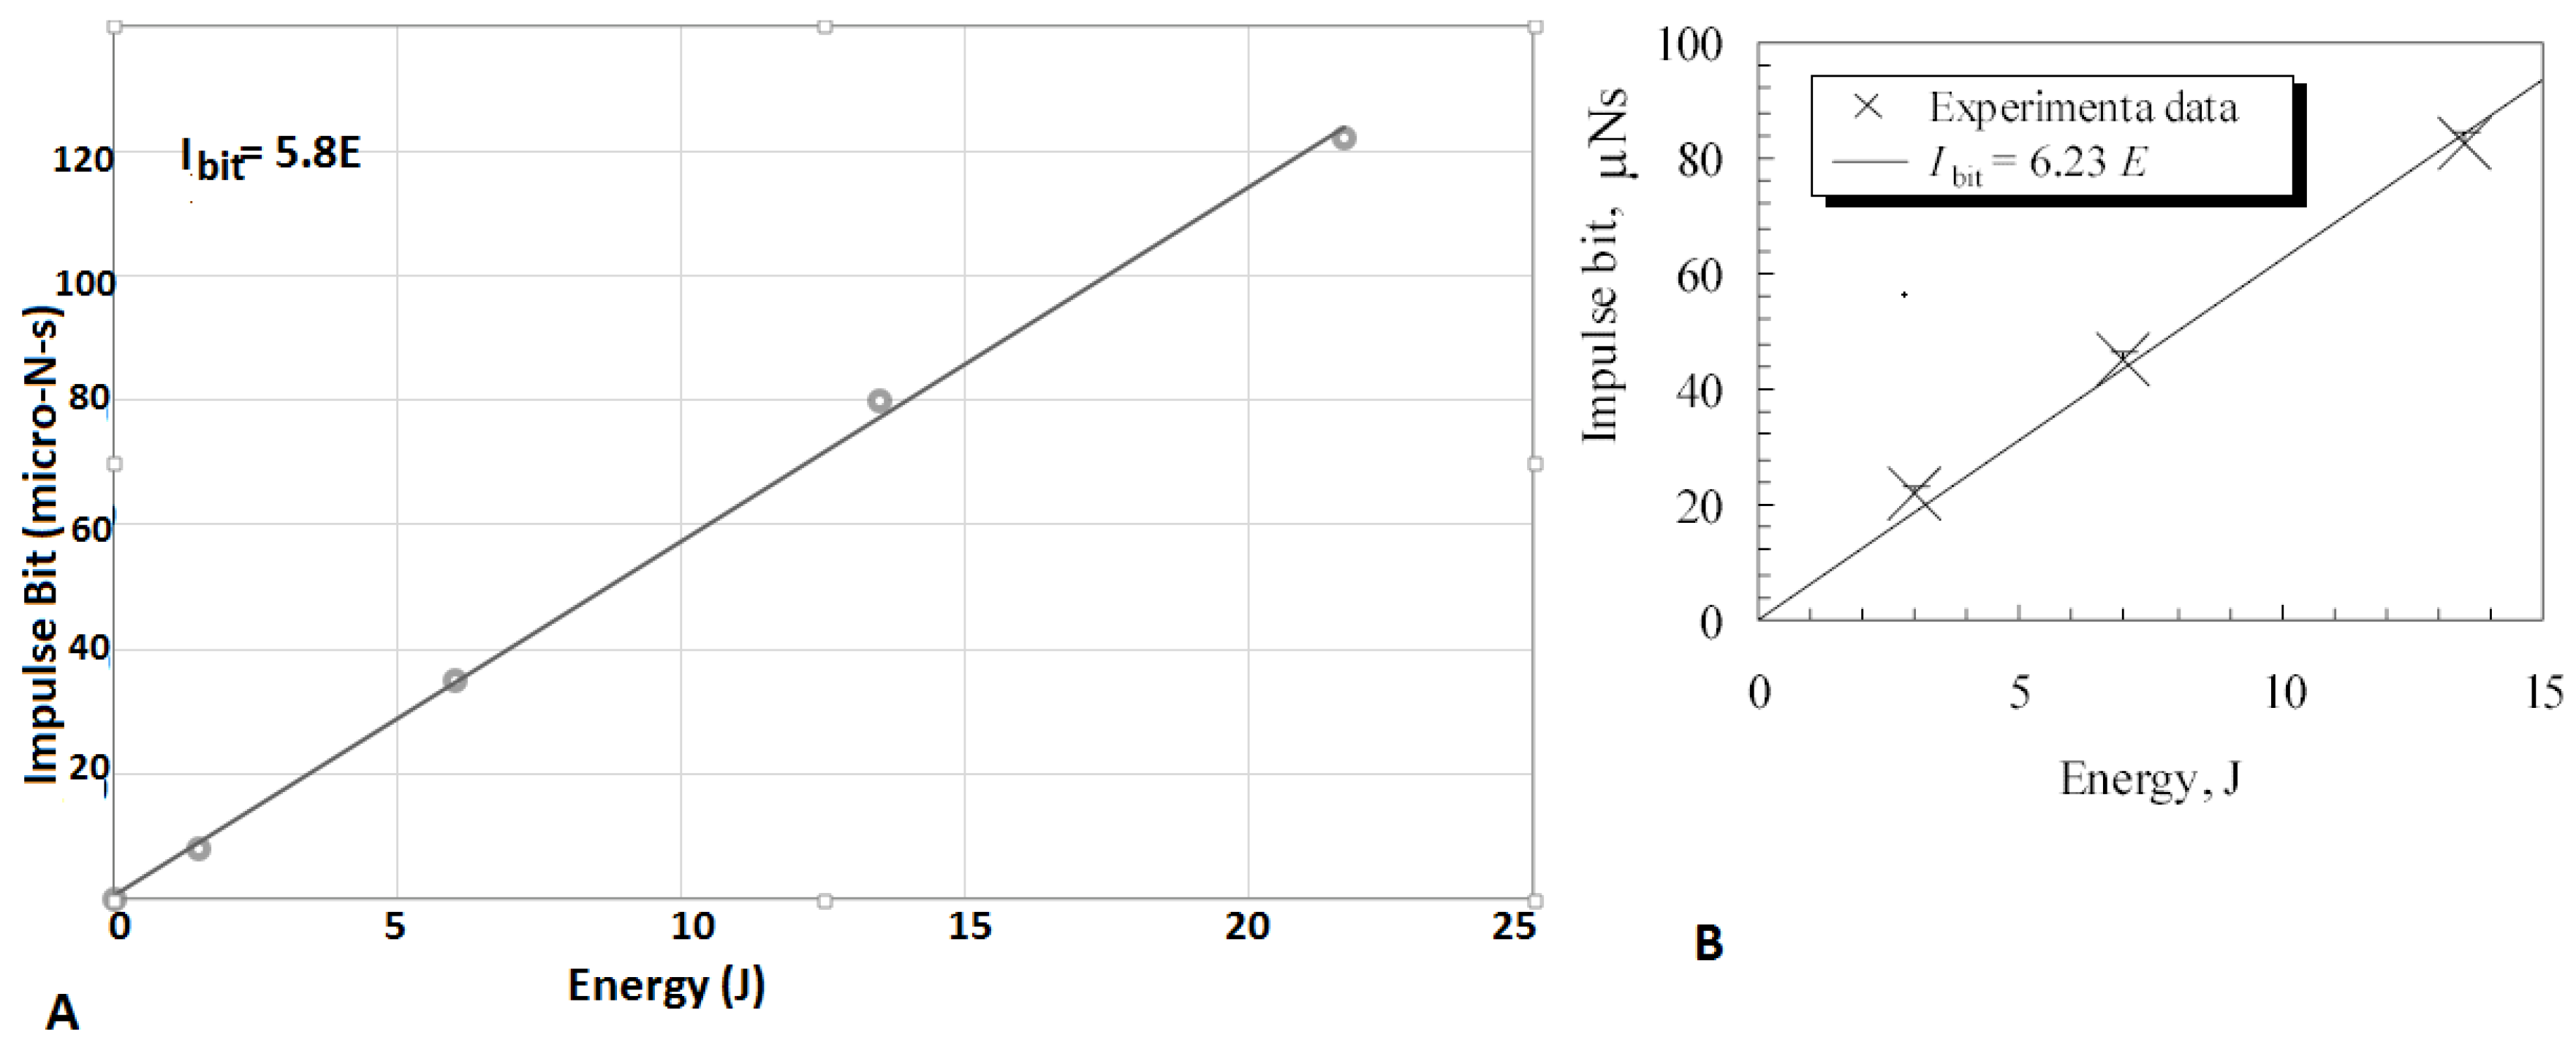
Effects of the variation in the discharge energy on the total impulse bit was also evaluated for a constant mass supply of 2.8 g and compared using the numerical model. Figure 6 depicts the comparison between the same. It could be observed that the Impulse bit is proportional to the discharge energy. Increasing the discharge energy for a given constant injected mass ensures more propellant mass forms the plasma sheet and since the supplied mass is constant for liquid-fed PPT, the impulse bit and efficiency could be increased significantly. This lacked in ablative PPTs as the neutral and ionized gas mass both increased with increasing the discharge energy. Therefore, energy variations in case for ablative PPTs won’t result in significant performance improvements, however, liquid-fed PPTs performance could be improved significantly by varying the discharge energy .
3.2. Results for LPPT-2
A second class of liquid pulsed plasma thruster operating at energy level of 7.4 J [26,27] is studied in present analysis. Circuit parameters from the experimental study are used to evaluate the discharge current waveform. Figure 7 depicts the comparison between the experimental results with the simulation results for the discharge current. There is an under-prediction of the discharge current in the simulation results. Experimental plot shows a peak discharge current of 13 kA whereas, the experimental plot shows an discharge current close to 11 kA. The reason for the under-prediction might be due to the constant element assumption made for the circuit modeling.
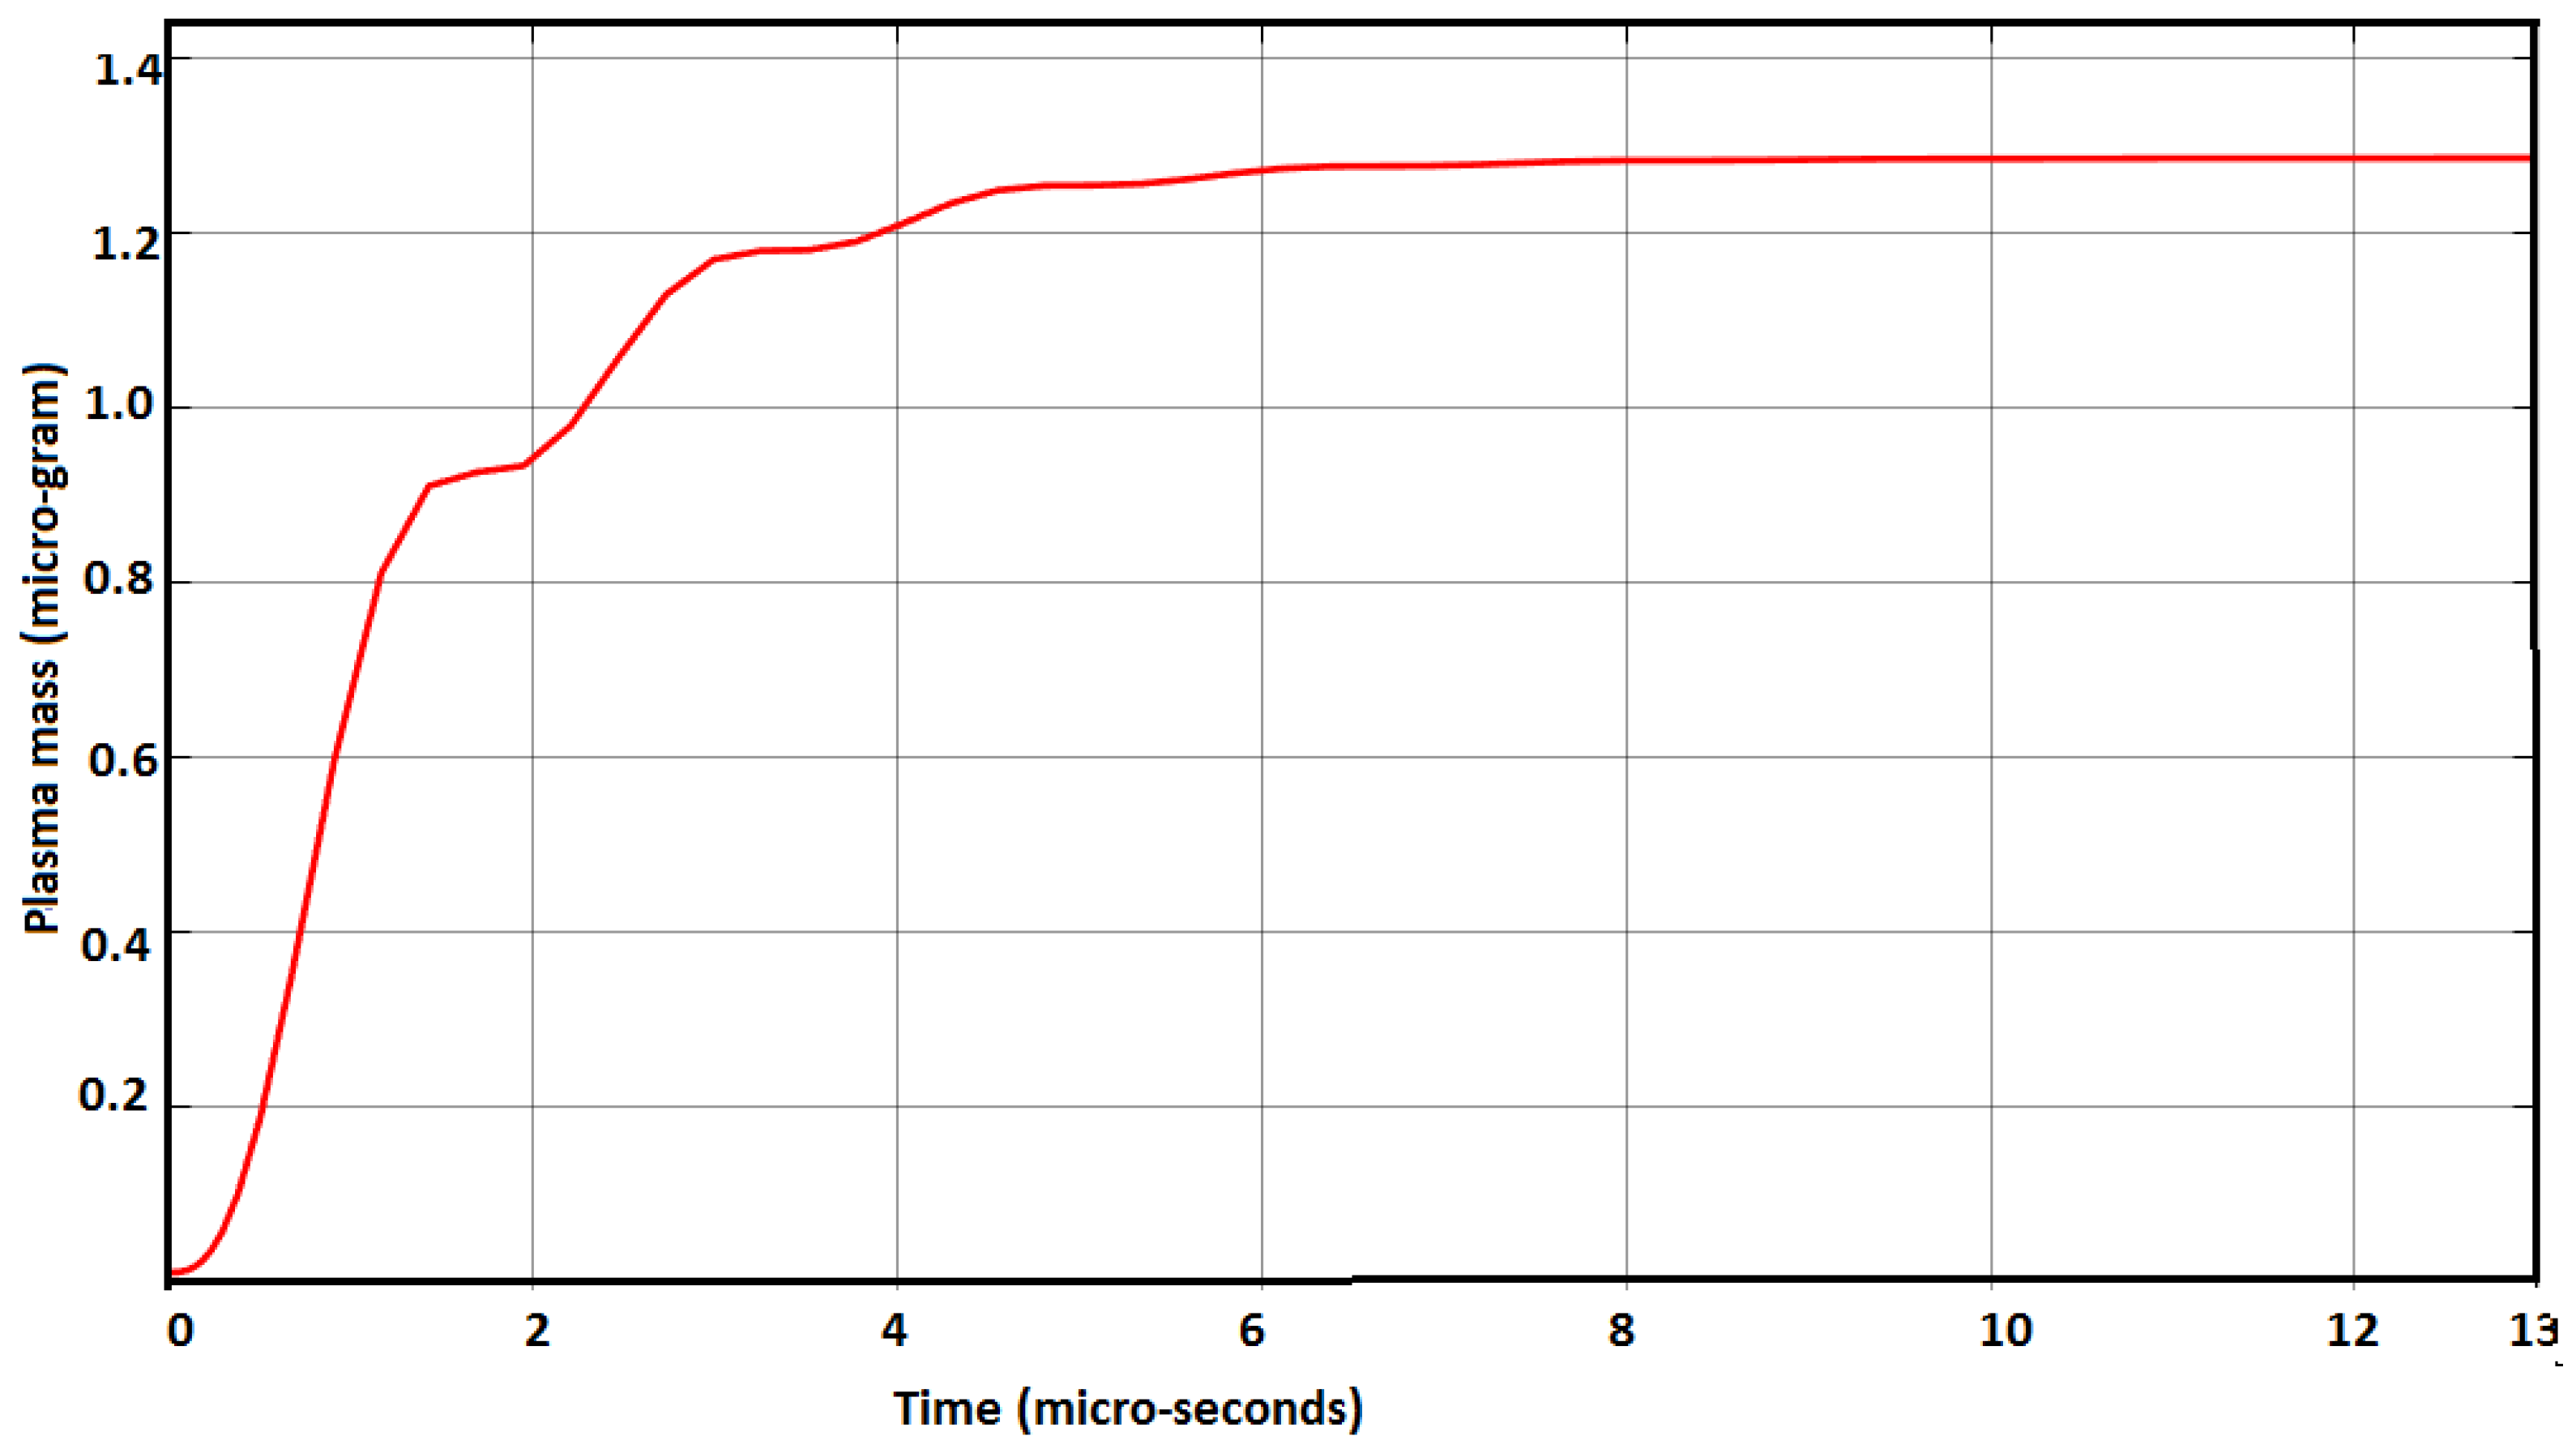
The discharge current evaluated using simulations is used in the plasma and mass flow modeling. The plasma mass shot per discharge is plotted as shown in Figure 8. It could be observed that the total plasma mass accelerated per discharge is close to 1.3 g. The total mass shot for LPPT-2 is 3 g. This suggests to the existence of a significant neutral propellant mass moving with a relatively lower velocity.
The experimental results for LPPT-2 [26] reveals that the plasma velocity is between 33 Km/s to 43 Km/s. Whereas, the average exit velocity is close to 17 Km/s, this observation confirms the presence of slow moving neutral particles in the discharge chamber for LPPT-2. Although the mass of the plasma and neutral mass is not mentioned in the experimental results data [26], however, using the plasma and average velocities values and the total mass supplied, we can calculate the mean plasma mass. Using the above values, the average plasma mass shot per discharge was calculated to be close to 1.1 g. This is in good agreement with the numerical simulation as shown in Figure 8. Although from the experimental emission spectrography a neutral mass layer wasn’t observed as proposed in the numerical model developed in this paper, the experimental values do validate the presence of dense neutral mass in the thruster due to mismatch in the values for mean plasma exit velocity and total mean velocity.
Figure 9 depicts the comparison between the simulation results for plasma mass shot during the first current cycle with the experimental high speed photographs for plasma emission. It could be observed that at about t = 1 s the plasma layer is completely exhausted out of the thrust chamber. The mass of the plasma mass at this first current cycle is close to 0.7 g. Comparing this value with the total plasma mass shot (1.2 g), it could be concluded that the plasma generated after the secondary breakdown is of much lesser mass. This is also validated by the experimental observations for LPPT-2. It could also be concluded from the experimental photographs that the plasma sheet is not uniform as assumed in the present numerical model. However, the overall distribution of the plasma and neutral mass calculated by the model is close to the experimental measurements. Experiments show 1.1 g of the injected propellant is converted to the plasma. Whereas, the model suggests (as shown in Figure 8) that the plasma mass is close to 1.24 g. Therefore, the model is accurate enough to provide a gross mass distribution between the plasma and neutral gas mass.
4. Optimization Suggestions for Liquid-fed PPTs
Based on the numerical models and its comparison with the experimental results for liquid-fed PPTs, it could be concluded that even though the supplied propellant per discharge is controllable, yet, there are significant inefficiency in propellant utilization. Present section discusses some of the optimization control strategies which could be used to improve the performance and efficiency of liquid-fed PPTs.
4.1. Discharge Energy Variation
Unlike ablative PPTs, increasing the discharge energy for injector-based liquid-fed PPTs will not increase the supplied mass for acceleration. Therefore, irrespective of the energy levels in which the thruster is operated in, total supplied mass is constant. However, the plasma mass shot scales with the discharge energy, therefore, it is possible to operate the thruster at energy levels where the total supplied propellant mass is exactly equal to the mass of the ionized gas.
It is evident from Figure 6, that the impulse bit varies linearly with the discharge energy, therefore, it is possible to operate liquid propellants PPTs in electromagnetic mode of operation by controlling the discharge energy for the thruster. Table 4 depicts the simulation results for the effects of variation in the discharge energy on various crucial performance parameters for LPPT-1. For a discharge energy of 20 J, specific impulse up-to can be achieved with an thrust efficiency of . This measurement is also validated by the experimental results [3].
4.2. Variation in Supplied Ablation Mass
The primary advantage for using liquid-fed PPTs is supplied ablation mass is controllable using fast grating injectors. The primary requirement to increase the performance for PPTs is that the supplied ablation mass should be less than or equal to the propellant mass ionized by the arc discharge to prevent process of late time evaporation. Referring to ablation model assumption as shown in Figure 2, it can be said that if is approximately equal to , then maximum propellant utilization is achieved. This boundary condition effectively ensures complete ionization of ablation mass supplied. Therefore, increasing the ablation mass supplied without changing the discharge energy will effectively lead to greater fraction of propellant mass which is not completely ionized. Table 5 depicts the simulation results for the effects in the performance parameters for LPPT-1 by varying the supplied propellant mass. The discharge energy for simulations is fixed at 13.5 J.
It can be observed from numerical simulation that variation in supplied mass has no significant impact on impulse bit delivered. However, the mean exit velocity decreases significantly with increasing the supplied mass. This trend is expected as the decomposition mass layer depth increases significantly with increasing the mass supplied with no change in the electromagnetic mass layer as the discharge energy and aspect ratio remains constant. Since decomposition mass layer has low impact on thrust and impulse bit it effectively leads to poor propellant utilization and decreases the specific impulse.
Therefore, it can be concluded to improve the propellant utilization capability for water-fed PPTs, mass supplied through injector should be precisely equal to the mass of gas that could be ionized for the given discharge energy.
4.3. Circuit Parameters
The discharge current has a significant role on the plasma mass shot and hence on the propellant utilization. It is evident from Equation (4), that the plasma mass shot is proportional to the integral of the discharge current squared. If we integrate the current squared for an significantly long interval (till the capacitor is completely discharge), then it could be shown that,
where, is the time taken by the capacitor to completely discharge. Therefore, decreasing the total circuit resistance should increase the plasma mass shot. However, care should be taken while using the expression as for a constant discharge energy decreasing the circuit resistance without any change to the circuit inductance would eventually lead to a under-damped discharge current waveform. This might lead to secondary “crowbar” breakdowns which ultimately bring down the energy transfer efficiency of the plasma sheet and hence degrades the performance. Therefore, based on solely the relations (4), (17) and from previous experimental observation it could be said that a critically damped waveform with low resistance must be pursued for increasing the plasma mass shot and energy transfer efficiency.
5. Conclusions
A multi-layer, quasi-steady mathematical model for plasma acceleration and performance is developed for liquid-fed PPTs in present paper. The model assumes there are two discrete uniform sheets of mass (plasma and neutral mass) in the discharge chamber. The model could be seen as a modified version of the conventional slug/snowplow models for PPTs. The conventional 1-D models assume complete ionization of the propellant mass, therefore, they presume the existence of single sheet of mass. However, previous experiments showed only a small fraction of mass shot is ionized (or forms the plasma sheet). Present model assumes that the plasma layer is accelerated to high exit velocity due to the electromagnetic and gas-dynamic thrust components, whereas the neutral sheet mass is accelerated to a significantly lower exit velocity. The model is validated by comparing the experimental results for two different class of thrusters. It could be concluded that:
(1) Comparing experimental results for water propellant PPTs with numerical simulation it is concluded that the model is very accurate in calculating and predicting the performance parameters for the thruster. High speed photographs from experiments did not show the existence of two different mass layers which the model does assume. However, with the assumptions of two discrete mass layers the models did show an accuracy up-to 92 percent. Calculations from the experimental results did show that not all the mass injected in the discharge chamber forms the plasma, therefore, this does suggest existence of slow moving macro-particles. The plasma sheet layer is accelerated to high velocity by electromagnetic and gas-dynamic interactions, whereas the neutral mass layer moves with a relatively low velocity and independent of the discharge circuitry.
(2) The model assumes a uniform plasma sheet layer, however, comparing the experimental results did show that the plasma sheet is not uniform. However, the mass of the plasma sheet calculated by the model is good agreement with the experimental data.
(3) An optimum balance could be achieved between the supplied propellant mass, discharge energy and Impulse bit. From analysis it is shown that even though the supplied propellant mass is controllable, yet only a fraction of supplied mass forms the plasma sheet. This effectively degrades the propellant utilization capability for liquid-fed PPT. For a given supplied mass increasing the discharge energy will increase the mass of the plasma shot. Similarly, for a given energy level the injected mass could be controlled to ensure complete ionization of the propellant. Therefore, by carefully balancing the two parameters, the specific impulse and hence the efficiency of liquid-fed PPTs could be increased significantly.
To summarize, liquid-fed PPTs have an enormous capability to achieve much higher performance and efficiency than they are presently capable of. Present mathematical model can act as a tool for researchers to better understand the underlying plasma and neutral mass acceleration processes which could effectively lead to much efficient design of liquid-fed PPTs in future.
Acknowledgments
The author would like to thank his friend and colleague Mr. Soham De for his help in developing and editing the figures presented in the paper.
Conflicts of Interest
The author declares no conflict of interest.
References
- Burton, R.; Turchi, P. Pulsed plasma thruster. J. Propuls. Power 1998, 14, 716–735. [Google Scholar] [CrossRef]
- Jahn, R.G. Physics of Electric Propulsion; Courier Corporation: North Chelmsford, MA, USA, 2006. [Google Scholar]
- Kakami, A.; Koizumi, H.; Komurasaki, K.; Arakawa, Y. Design and performance of liquid propellant pulsed plasma thruster. Vacuum 2004, 73, 419–425. [Google Scholar] [CrossRef]
- Scharlemann, C.A. Investigation of Thrust Mechanisms in a Water Fed Pulsed Plasma Thruster. Ph.D. Thesis, The Ohio State University, Columbus, OH, USA, 2003. [Google Scholar]
- Thomassen, K.; Solbesj, A. Analysis of solid teflon pulsed plasma thruster. Development 1969, 6, 565–569. [Google Scholar]
- Spanjers, G.G.; McFall, K.A.; Gulczinski, F.S.; Spores, R.A. Investigation of propellant inefficiencies in a pulsed plasma thruster. AIAA Pap. 1996, 96, 2723. [Google Scholar]
- Spanjers, G.G.; Lotspeich, J.S.; McFall, K.A.; Spores, R.A. Propellant losses because of particulate emission in a pulsed plasma thruster. J. Propuls. Power 1998, 14, 554–559. [Google Scholar] [CrossRef]
- Vondra, R.; Thomassen, K.; Solbes, A. A pulsed electric thruster for satellite control. Proc. IEEE 1971, 59, 271–277. [Google Scholar] [CrossRef]
- Popov, G.; Orlov, M.; Antropov, N.; Gomilka, L.; Diakonov, G.; Krivonosov, I.; Popov, G.; Orlov, M.; Antropov, N.; Gomilka, L.; et al. Parameters of plasmoids injected by PPT. In Proceedings of the 33rd Joint Propulsion Conference and Exhibit, Seattle, WA, USA, 6–9 July 1997; p. 2921. [Google Scholar]
- Myers, R.M.; Arrington, L.A.; Pencil, E.J.; Carter, J.; Heminger, J.; Gatsonis, N. Pulsed plasma thruster contamination. In Proceedings of the 32nd Joint Propulsion Conference and Exhibit, Lake Buena Vista, FL, USA, 1–3 July 1996. [Google Scholar]
- Henrikson, E.M.; Mikellides, P.G. Modeling of ablation-fed pulsed plasma thruster operation using a new approach to the ablation process. In Proceedings of the 44th AIAA/ASME/SAE/ASEE Joint Propulsion Conference & Exhibit, Hartford, CT, USA, 21–23 July 2008; Volume 4645. [Google Scholar]
- Koizumi, H.; Kakami, A.; Furuta, Y.; Komurasaki, K.; Arakawa, Y. Liquid propellant pulsed plasma thruster. In Proceedings of the 28th International Electric Propulsion Conference, Toulouse, France, 17–21 March 2003. Number 2003-87. [Google Scholar]
- Laperriere, D.D.; Gatsonis, N.A.; Demetriou, M.A. Electromechanical modeling of applied field micro pulsed plasma thrusters. In Proceedings of the 41st AIAA/ASME/SAE/ASEE Joint Propulsion Conference Exhibit, Tucson, AZ, USA, 10–13 July 2005. [Google Scholar]
- Mikellides, Y.G. Theoretical Modeling and Optimization of Ablation-Fed Pulsed Plasma Thrusters. Ph.D. Thesis, The Ohio State University, Columbus, OH, USA, 1999. [Google Scholar]
- Scharlemann, C.; Corey, R.; Mikellides, I.; Turchi, P.; Mikellides, P. Pulsed plasma thruster variations for improved mission capabilities. In Proceedings of the 35th Intersociety Energy Conversion Engineering Conference and Exhibit 2000, Las Vegas, NV, USA, 24–28 July 2000. [Google Scholar]
- Nada, T. One-dimensional model of a pulsed plasma thruster. Aeronaut. J. 2013, 117, 929–942. [Google Scholar] [CrossRef]
- Yang, L.; Liu, X.Y.; Wu, Z.W.; Wang, N.F. Analysis of Teflon Pulsed Plasma Thrusters Using a Modified Slug Parallel Plate Model. In Proceedings of the 47th AIAA/ASME/SAE/ASEE, Joint Propulsion Conference and Exhibit, San Diego, CA, USA, 2011; Volume 6077. [Google Scholar]
- Turchi, P.; Mikellides, I.; Mikellides, P.; Schmahl, C. Theoretical investigation of pulsed plasma thrusters. AIAA Pap. 1998, 98, 3807. [Google Scholar]
- Huang, T.; Wu, Z.; Liu, X.; Xie, K.; Wang, N.; Cheng, Y. Modeling of gas ionization and plasma flow in ablative pulsed plasma thrusters. Acta Astronaut. 2016, 129, 309–315. [Google Scholar] [CrossRef]
- Keidar, M.; Boyd, I.D.; Beilis, I.I. On the model of Teflon ablation in an ablation-controlled discharge. J. Phys. D Appl. Phys. 2001, 34, 1675. [Google Scholar] [CrossRef]
- Boyd, I.D.; Keidar, M.; McKeon, W. Modeling of a pulsed plasma thruster from plasma generation to plume far field. J. Spacecr. Rocket. 2000, 37, 399–407. [Google Scholar] [CrossRef]
- Wang, S.Y.; Liu, X.Y.; Yang, L.; Wu, Z.W.; Cheng, Y.; Wang, N.F. Numerical Simulation of a Water Propellant Pulsed Plasma Thruster. In Proceedings of the 48th AIAA/ASME/SAE/ASEE, Joint Propulsion Conference and Exhibit, Atlanta, GA, USA, 30 July–1 August 2012. [Google Scholar]
- Turchi, P.; Mikellides, I.; Mikellides, P.; Kamhawi, H. Optimization of pulsed plasma thrusters for microsatellite propulsion. In Proceedings of the 35th Joint Propulsion Conference and Exhibit, Los Angeles, CA, USA, 20–24 June 1999; American Institute of Aeronautics and Astronautics Inc. (AIAA): Reston, VA, USA, 1999. [Google Scholar]
- Haynes, W.M. CRC Handbook of Chemistry and Physics; CRC Press: Boca Raton, FL, USA, 2014. [Google Scholar]
- Koizumi, H.; Noji, R.; Komurasaki, K.; Arakawa, Y. Plasma acceleration processes in an ablative pulsed plasma thruster. Phys. Plasmas 2007, 14, 033506. [Google Scholar] [CrossRef]
- Koizumi, H.; Noji, R.; Komurasaki, K.; Arakawa, Y. Study on plasma acceleration in an ablative pulsed plasma thruster. In Proceedings of the 43rd AIAA/ASME/SAE/ASEE, Joint Propulsion Conference and Exhibit, Cincinnati, OH, USA, 8–11 July 2007. [Google Scholar]
- Koizumi, H.; Noji, R.; Komurasaki, K.; Arakawa, Y. Plasma Flow Behaviors and Their Effects on the Performance of Pulsed Plasma Thrusters. In Proceedings of the 30th International Electric Propulsion Conference, Florence, Italy, 17–20 September 2007; pp. 17–20. [Google Scholar]
Figure 1.
Operation of liquid propellant PPT [12].
Figure 1.
Operation of liquid propellant PPT [12].

Figure 2.
Plasma and neutral mass: (A) Emission; (B) Flow for liquid-fed PPT.

Figure 3.
Discharge current waveform: (A) Experimental result [12]; (B) Simulation result.
Figure 3.
Discharge current waveform: (A) Experimental result [12]; (B) Simulation result.

Figure 4.
(A) Plasma sheet mass variation with time; (B) Mass flow rate at the liquid film surface.

Figure 5.
Simulation results for LPPT-1: (A) Mean exit velocity; (B) Impulse bit.

Figure 6.
Total impulse bit vs. Discharge energy: (A) Simulation result; (B) Experimental result [12].
Figure 6.
Total impulse bit vs. Discharge energy: (A) Simulation result; (B) Experimental result [12].

Figure 7.
Discharge current for LPPT-2: (A) Experimental result [27]; (B) Simulation result.
Figure 7.
Discharge current for LPPT-2: (A) Experimental result [27]; (B) Simulation result.
Figure 8.
Simulation for plasma mass as a function of time for LPPT-2.

Figure 9.
Comparison of the numerical simulation for plasma mass with the high speed photographs [27].
Figure 9.
Comparison of the numerical simulation for plasma mass with the high speed photographs [27].


Table 1.
Material property for Water and Teflon.
| Material | Mass (Amu) | 1st Ionization Energy (eV) | 2nd Ionization Energy (eV) | Heat of Vaporisation (J/Kg) | Heat Capacity (J/KgK) |
|---|---|---|---|---|---|
| Water | 18.02 | 40.8 | 75.9 | 4179 | |
| Teflon | 100 | 92.2 | 280.9 | 1250 |
Table 2.
Operation parameter for LPPT-1.
| Operation Parameter | Value |
|---|---|
| 0.88 | |
| Capacitor (C) | 3 F |
| Discharge voltage () | 3000 V |
| Total mass supplied per discharge () | 2.8 g |
| Total discharge resistance () | 82 m |
| Total inductance () | 84 nH |
Table 3.
Simulation results and Experimental results for LPPT-1.
| Parameter | Simulation Result | Experimental Result |
|---|---|---|
| Discharge Voltage (V) | 3000 | 3000 |
| Capacitor (F) | 3 | 3 |
| Mean exhaust velocity (Km/s) | ||
| Charged mass exit velocity (Km/s) | 49 | − |
| Charged mass shot (g) | − | |
| Neutral mass shot (g) | − | |
| Impulse bit (N-s) | ||
| Specific Impulse (s) | 2800 | 3400 |
Table 4.
Discharge energy variation effects on performance of LPPT-1.
| Discharge Energy (J) | Charged Mass Shot (g) | Mean Exit Velocity (Km/s) | Impulse Bit (N-s) | Specific Impulse (s) |
|---|---|---|---|---|
| 1.5 | 3 | 8 | 306 | |
| 6 | 12 | 35 | 1224 | |
| 13.5 | 2800 | |||
| 21.6 | 41 | 120 | 4183 |
Table 5.
Comparison of different supplied ablation mass.
| Supplied Mass (g) | (N-s) | Exit Velocity (Km/s) | (s) |
|---|---|---|---|
| 2.0 | 78 | 39 | 3974 |
| 2.8 | 78.2 | 27.2 | 2800 |
| 6.8 | 82 | 12 | 1224 |
| 9.0 | 83 | 8.5 | 868 |
© 2018 by the author. Licensee MDPI, Basel, Switzerland. This article is an open access article distributed under the terms and conditions of the Creative Commons Attribution (CC BY) license (http://creativecommons.org/licenses/by/4.0/).
Share and Cite
MDPI and ACS Style
Misra, K. Mathematical Modeling of Liquid-fed Pulsed Plasma Thruster. Aerospace 2018, 5, 13. https://doi.org/10.3390/aerospace5010013
AMA Style
Misra K. Mathematical Modeling of Liquid-fed Pulsed Plasma Thruster. Aerospace. 2018; 5(1):13. https://doi.org/10.3390/aerospace5010013
Chicago/Turabian StyleMisra, Kaartikey. 2018. "Mathematical Modeling of Liquid-fed Pulsed Plasma Thruster" Aerospace 5, no. 1: 13. https://doi.org/10.3390/aerospace5010013
Note that from the first issue of 2016, this journal uses article numbers instead of page numbers. See further details here.