A Macroscopic Performance Analysis of NASA’s Northrop Grumman RQ-4A


Department of Computer Architecture, Technical University of Catalonia—Barcelona Tech, Esteve Terradas 7, 08860 Castelldefels, Spain
*
Author to whom correspondence should be addressed.
Aerospace 2018, 5(1), 6; https://doi.org/10.3390/aerospace5010006
Submission received: 1 December 2017
/
Revised: 2 January 2018
/
Accepted: 4 January 2018
/
Published: 10 January 2018
(This article belongs to the Special Issue Aircraft Dynamics & Control)
Abstract
:This paper presents the process of identification, from a macroscopic point of view, of the Northrop Grumman RQ-4A Global Hawk Remote-Piloted Aircraft System from real, but limited flight information. Performance parameters and operational schemes will be extracted by analyzing available data from two specific science flights flown by the Global Hawk back in 2010. Each phase of the flight, take-off, climb, cruise climb, descent and landing, is analyzed from various points of view: speed profile, altitude, climb/descent ratios and rate of turn. The key performance parameters derived from individual flights will be confirmed by performing a wider statistical validation with additional flight trajectories. Derived data are exploited to validate a simulated RQ-4A vehicle employed in extensive real-time air traffic management simulated integration exercises and to complement the development of a future RQ-4A trajectory predictor.
1. Introduction
Remote-Piloted Aircraft System (RPAS) performance data are mostly unavailable for Air Traffic Management (ATM) research. Aircraft flight performance is generally derived from the manufacturer’s flight manuals. However, nowadays, there is no publicly available information for any major RPAS type. That lack of performance data limits the relevance of any airspace impact analysis and hinders the capacity to fully understand the RPAS operational strategies. To overcome this limitation, the evaluation of existing RPAS flight operations is an alternative way to extract flight performance data and reduce this knowledge gap.
A common way to formalize aircraft performance is by creating an Aircraft Performance Model (APM). Generating accurate performance models from flight data is divided into two phases. First, the basic operational characteristics of the vehicle are extracted from the flight manual to define a basic performance model. Then, the model parameters are determined on the basis of the actual flight data that are available for regressions and validation. Given the non-availability of the RQ-4A flight manual, this research develops a basic performance analysis to identify the operative characteristics through trajectory observation. Based on that crucial information, a complete aircraft performance model could be carried out in the future.
The majority of existing APM for ATM purposes are based on the Base of Aircraft Data (BADA) [1,2,3]. BADA has been developed in close cooperation with the manufacturers and airlines (thus with extensive availability of manufacturers and flight data). Two BADA models have been developed, both of them following the total mass model mathematics approach: Family 3 and family 4. Both provide wide coverage of aircraft type ( and of the current airspace users respectively) with different levels of accuracy.
The objective of this paper is to analyze the performance of the Northrop Grumman RQ-4A from data as operated by the National Aeronautics and Space Administration (NASA) in real science missions [4]. The analysis will be considered macroscopic, as we limit ourselves to identifying approximate values for the most relevant performance parameters of that aircraft. NASA’s operations are taken as a representative use case for potentially upcoming RPAS and their most likely applications. However, the analysis of the RQ-4A performance will be limited by the publicly available flight trajectory data, as provided by NASA’s Earth Science Project Office (ESPO) [5].
A few research initiatives have tackled the performance analysis of RPAS. Performance modeling for RPAS is crucial for a variety of reasons; among others, to determine how manned aviation and RPAS may interact [6] or how collision encounters should be managed [7]. NASA proposed performance models for twelve RPAS in [8]. Performance data are presented in two formats: the BADA format and the Multi Aircraft Control System (MACS) specified by NASA. Unfortunately, the reference trajectories used did not come from real flight data, but from a kinematic trajectory generator, which was then validated by the RPAS manufacturers. More troublesome is the fact that the performed identifications did not cover the whole RPAS flight envelope, at least for aircraft with ceiling altitudes above those of conventional airliners. For instance, for the RPAS RQ-4A Global Hawk, the authors assume a cruise altitude of 31,000 ft, while its known ceiling altitude is 64,000 ft. This is an issue because the modeled performance only considers aircraft operation up to that altitude, thus leaving out upper ones, and therefore, aircraft performance is not properly modeled for the typical cruise altitudes of this RPAS.
Complementary to the previous effort, Goppert et al. [9] have also developed a methodology to generate BADA models from public data and available images. In this work, they demonstrate the strategy by generating models for both a Northrop Grumman X47-B and the Multiplex EasyStar RPAS. The generation of the BADA models is limited to the creation of look-up tables describing the nominal performance of the aircraft.
This research will support the objectives above by delivering performance parameters and operational schemes of the Northrop Grumman RQ-4A Global Hawk. Results will be extracted by analyzing available data from an initial sample of two real science flights flown by the Global Hawk back in 2010. Each phase of the flight, take-off, climb, cruise climb, descent and landing, will be analyzed from various points of view: speed profile, altitude, climb/descent ratios and rate of turn. The analysis will exhibit the consistent behavior of the vehicle across the two flights being analyzed.
The key performance parameters derived from the selected individual flights will be confirmed by performing a statistical validation with additional flight trajectories. A more extensive collection of flight trajectories in which similar operations were carried out has been selected. Box plot statistics of some performance parameters have been carried out on those trajectories. The observed results are consistent with the data extracted from the individual flights, thus validating the initial observations.
As an initial application, the observed macroscopic performance parameters were applied to validate a simulated RQ-4A. The vehicle was to be extensively employed in almost 50 real-time RPAS-ATM simulation exercises within the scope of the Single European Sky ATM Research (SESAR) Evaluation of the RPAS-ATM Interaction in Non-segregated Airspace (ERAINT) project [10,11]. Real ATC controllers managed the RQ-4A integration in realistic scenarios, which included the operation of the RQ-4A in terminal airspace and under the occurrence of various types of emergencies. Previous to the evaluation campaign, the performance of the simulated aircraft was compared to the RQ-4A macroscopic performance parameters. The attained results demonstrated that the simulated RQ-4A performance and operational characteristics were similar to those of the real vehicle, thus being considered a valid simulation platform from an ATM perspective.
The macroscopic values attained in this study have been also employed to create an ATM-oriented performance model of the RQ-4A based on BADA3. The research resulted in the first set of official BADA performance models for RPAS. The identification process was released by EUROCONTROL in its Technical Note No. 15/11/06-50 [12] and Release Note 15/11/06-50 [13].
The rest of this publication is organized as follows. Section 2 outlines the main characteristics of the RQ-4A RPAS, the motivations that justified its acquisition by NASA, its mission architecture and the specific science mission to be employed as the use case to analyze its macroscopic performance. Section 3 analyzes the main performance and operational characteristics of the RQ-4A phase by phase, namely take-off, climb, cruise climb, descent and landing, for two selected real science operations flown by NASA. These results will be confirmed by statistically analyzing additional trajectories. Section 5 shows the validation process of the selected macroscopic variables of a simulated RQ-4A vehicle employed in real-time ATM evaluations. Finally, in Section 6, conclusions and further work are presented.
2. NASA’s RQ-4A Background
This section provides a short outline of NASA’s Global Hawk acquisition process and program goals. Two long duration flights from the Genesis and Rapid Intensification Processes (GRIP) science campaign [14] have been selected to extract relevant performance data. Data from other RQ-4A science missions are also available from public NASA servers [5].
2.1. The NASA Global Hawk Aircraft
NASA’s Dryden Flight Research Center (DFRC) procured three pre-production RQ-4A Global Hawk aircraft (manufactured by Northrop Grumman Corporation) from the United States Air Force (USAF). These aircraft are being used to support NASA and the National Oceanic and Atmospheric Administration, as well as additional science institutions, who require access to a high-altitude, long-endurance surveillance system for Earth observation research [15].
The Global Hawk (see Figure 1) is a low-wing, long-range, long-endurance, single-engine unmanned jet aircraft that typically operates as a fully-autonomous vehicle using an elaborate pre-loaded mission plan [16]. The execution of the mission plan begins when the aircraft is commanded to taxi to the runway and ends when the aircraft taxis off the runway on the completion of a mission. The Global Hawk aircraft provides a combination of high-altitude and long-endurance performance capabilities that can meet many mission science requirements [17]. The RQ-4A can carry more than 1500 lb () of payload up to 65,000 () with a mission endurance of over and a total range in excess of 10,000 (18,518 ). More recently, the RQ-4A has been deployed to NASA Wallops and Guam, in addition to DFRC, to increase its operational range and mission capabilities.
The typical flight profile of the aircraft consists of a rapid climb to approximately 54,000 (), which is the maximum altitude that can be achieved in the maximum take-off weight configuration; then, a subsequent climb at a lower, steady rate as fuel is expended, until the aircraft reaches its maximum operating altitude of 65,000 (). Flight at the maximum operational altitude is sustained until the aircraft returns to the operations base and descends for landing. High-altitude operation is usually maintained for most of the flight, delaying the aircraft descent to the very last segment of the flight for fuel efficiency, safety and ease of airspace integration.
2.2. The Genesis and Rapid Intensification Processes Missions
The GRIP experiment was a NASA Earth Science field experiment in 2010 that was conducted to understand better how tropical storms form and develop into major hurricanes [14]. NASA used a DC-8 aircraft, a WB-57 aircraft and the Global Hawk RPAS configured with a suite of in situ and remote sensing instruments used to observe and characterize the lifecycle of hurricanes (see Figure 1).
The long-endurance GRIP flights provide a perfect sample corresponding to the typical concept of operation employed by the Global Hawk during a high-altitude, long-endurance operation. Table 1 depicts all Global Hawk GRIP 2010 sorties of aircraft NS872, of which Operations 0060 and 0062 have been selected for more in-depth analysis. Since the initial GRIP missions, additional science campaigns have been carried out, and some of those trajectories will be used later in the paper to validate the initial performance findings.
Figure 2 provides a general view of Mission 872-0062. The mission departs from DFRC and crosses the continental United States (U.S.) through an approved corridor near the U.S.-Mexico border. Once over the Gulf of Mexico, the RQ-4A cruises at high altitude to its intended mission area over the Gulf itself. The RPAS performed a triangular scanning pattern designed to cover the whole Gulf while chasing hurricane formation information. The actual mission area and trajectory change over time to track relevant atmospheric events identified by real-time satellite data or by onboard sensors. The overall mission time exceeds 24 h of high-altitude flight.
Departure and approach operations, as well as the take-off and landing operations, occur over segregated Dryden airspace. After take-off, the aircraft turns inside the segregated airspace until a high-altitude is reached. Then, it leaves DFRC airspace leading to its cruise climb corridor. Finally, the return approach is performed at high-altitude, and descent is not initiated until the RPAS is within DFRC airspace.
3. RQ-4A Performance Analysis
This section will analyze, from a macroscopic point of view, the most relevant parameters of the RQ-4A mission trajectories under investigation. The data employed are obtained from ESPO [5] through its public servers that provide mission information (not extracted from the RQ-4A autopilot, but from the mission systems). The available data are formatted using the Interagency Working Group standard format Number 1 (IWG1) [18], which lacks any weight or fuel flow information. Thus, a critical element in any flight trajectory analysis is not available. However, under the existing mission configuration during the selected GRIP operations, it can be assumed that the RQ-4A operated close to its maximum take-off weight. Two elements justify that assumption: first, the extreme duration of the operation, with the RQ-4A flying for more than 24 h and farther than 2000 Nautical Miles (NM) from its base, which indicates a maximum fuel configuration; second, the wide range of sensors employed during GRIP, which should occupy a significant portion of its payload capabilities.
3.1. Take-Off Analysis
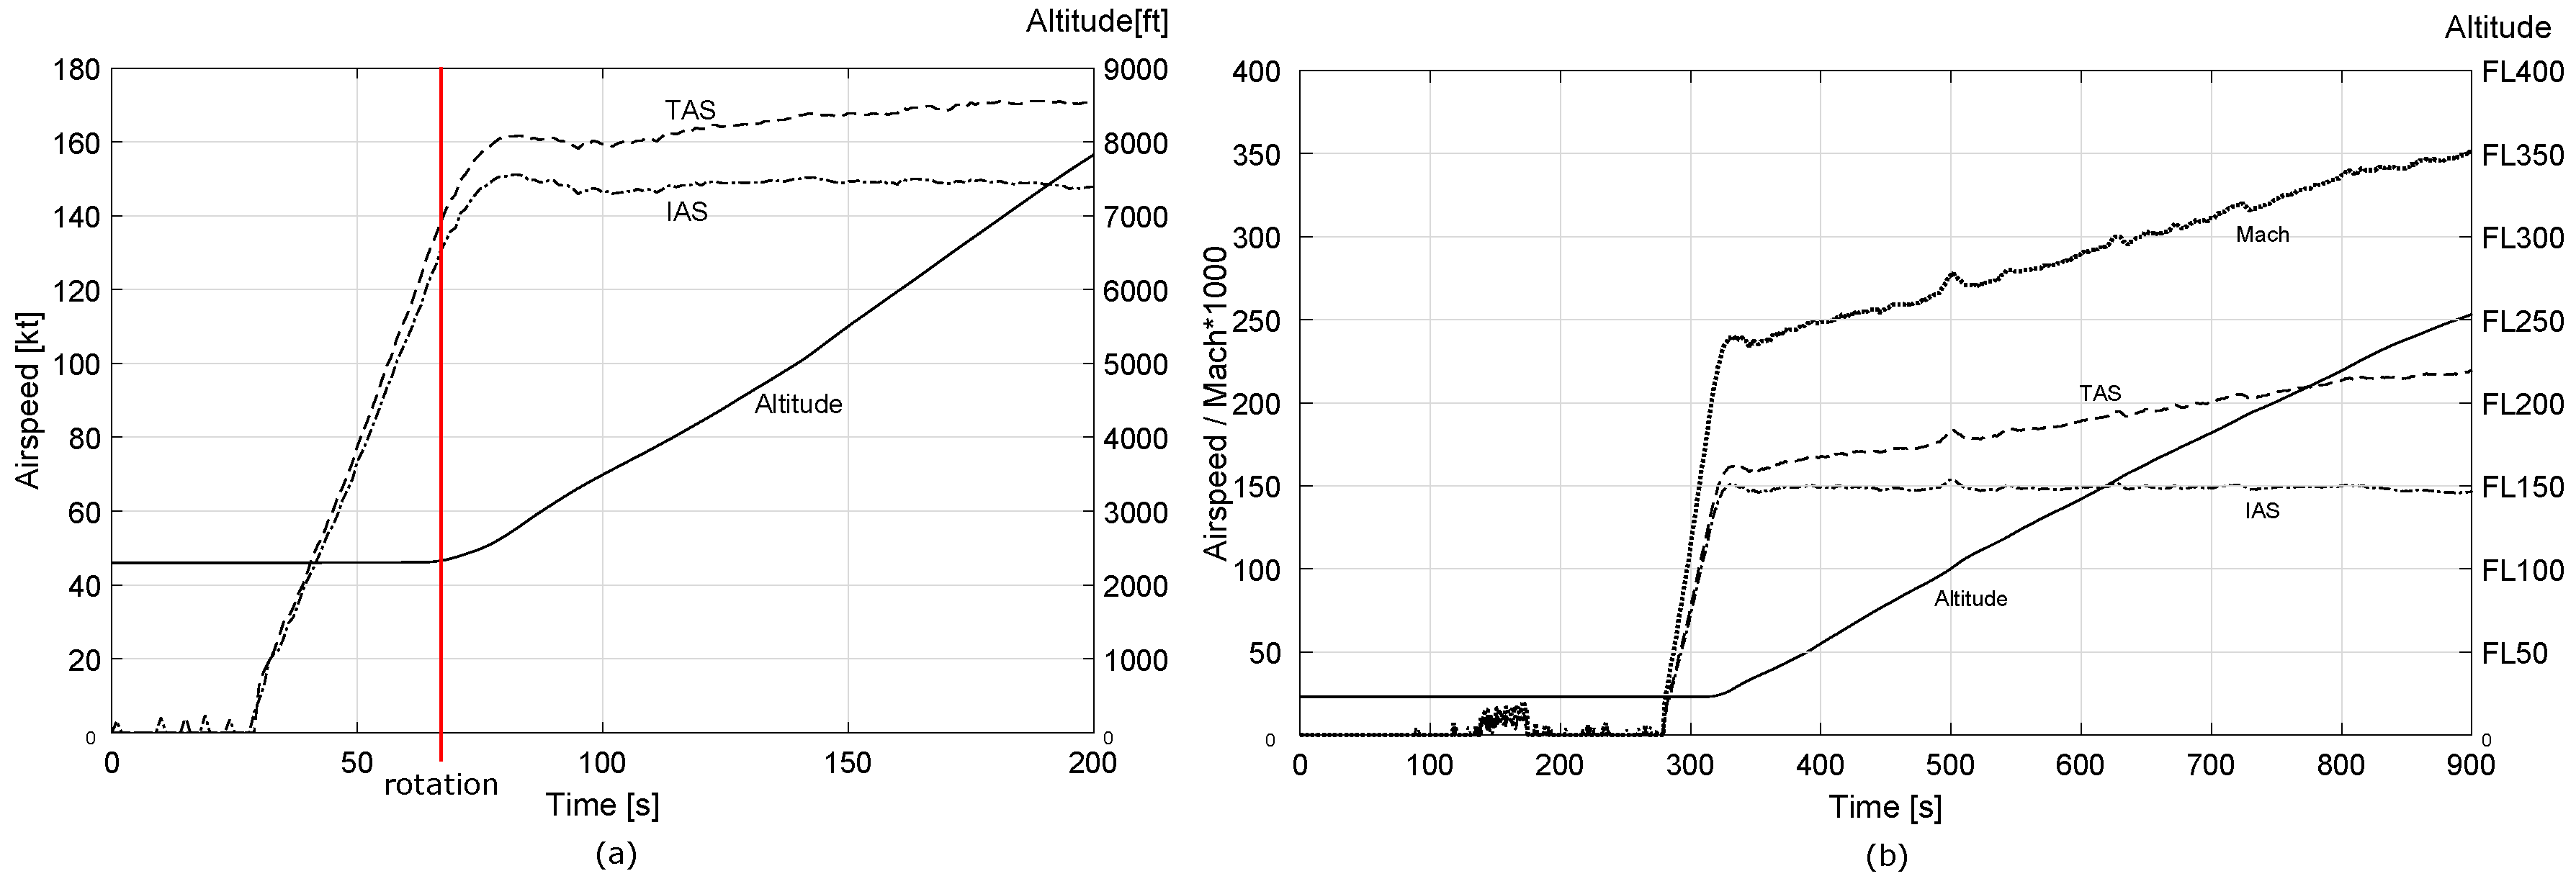
Take-off analysis (see Figure 3a) shows that aircraft rotation occurs at around (speeds referenced as Indicated Air Speed (IAS) unless specified otherwise) and that from the start rolling to rotation, 38 s is required. After rotation, speed is stabilized at around . Analysis for the second take-off run shows almost the exact behavior, 37 s until rotation at the same rotation speed of . Speed stabilization occurs at .
The initial climb after take-off is executed continuously without any further level-off. That unconstrained climb is justified because it was executed within DRFC segregated airspace. Most likely, a stepwise climb should be expected in case the RQ-4A is directly operated from non-segregated areas. The climb from – takes just 63 s, 59 s in the second take-off. This value gives an average low-level climb rate of 2300 feet per minute ( for the second take-off).
3.2. Climb Profile Analysis
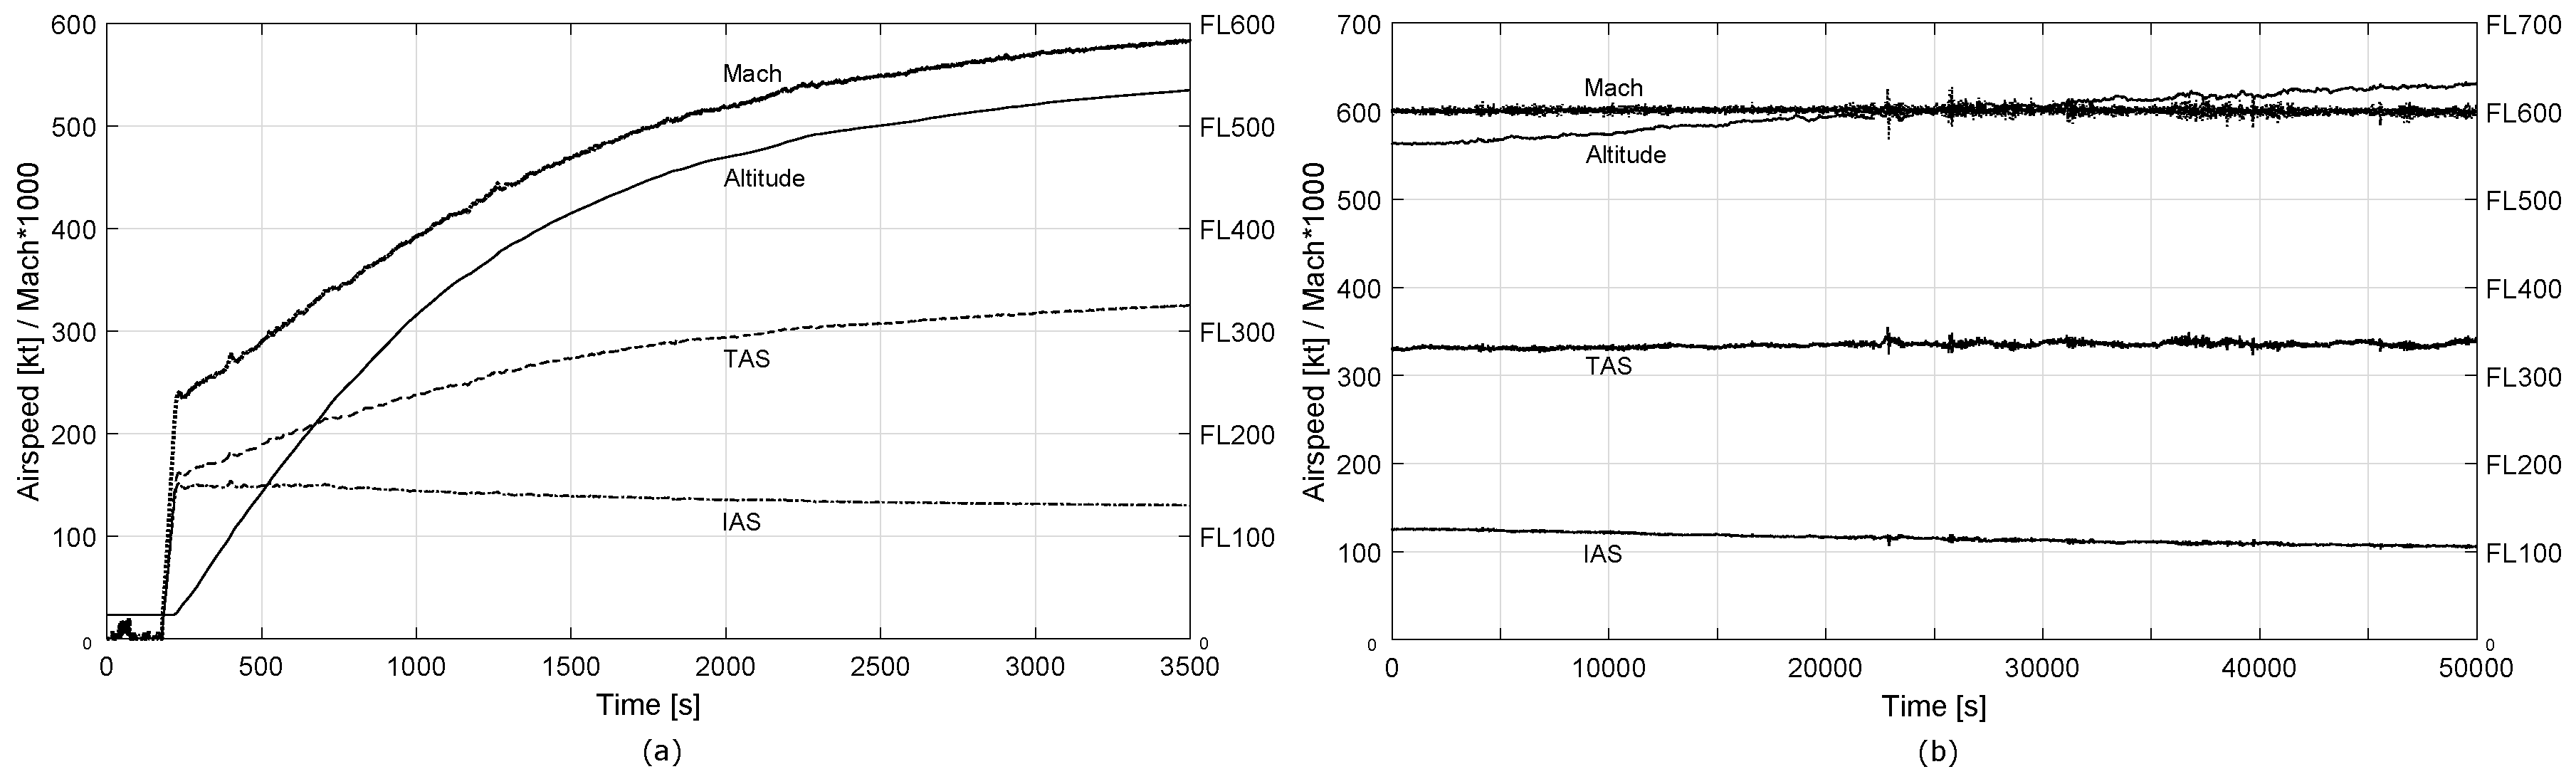
Given Mission 872-0060, Figure 3b depicts the initial climb to medium altitudes, Figure 4a from medium altitudes to the point at which cruise climb is initiated, around FL550 (Flight Level 550 or 55,000 feet of altitude).
Table 2 and Table 3 provide summaries of the climb performance with cumulative performance and partial performance for various altitude ranges. The analysis starts at FL100 and provides time and vertical speeds with 10,000 increments, except the last fragment from FL500–FL550. The table also accumulates total flight time from FL100 up to the end of each altitude block, as well as averaged vertical speeds from FL100. Both tables show a common trend in which each 10,000 range requires an increasing amount of time to be climbed. Climb rates for each segment and average climb rates for the whole climb period are provided in the table. On average, the RQ-4A climbs from FL100–FL550 at a rate of .
In addition to the analysis of the climb performance itself, one of the most relevant elements that can be extracted from those figures is the fact that the RQ-4A does not implement a constant IAS or constant Mach climb pattern as most airliners do. From the available data, it is clear that a progressive reduction of IAS occurs once FL220 is attained. Up until this point, a more or less constant speed profile is employed in both flights. Checking the high-altitude portion of the flights, it can be observed that the IAS decrease is maintained in such a way that a continuous Mach increase occurs. The Mach number increase is maintained until it becomes almost constant at Mach once FL550 is reached. That speed is also maintained as cruise speed throughout the whole flight, as long as the RQ-4A remains at high altitude.
3.3. Cruise Climb Profile Analysis
The Global Hawk, as well as other aircraft operating at extreme altitudes, can reach around FL650 if it performs a cruise climb over long periods of time. Such a climb mode is strongly dependent on the fuel flow, atmospheric temperatures, winds and the exact aircraft drag configuration (that depends on the science payload setup for each mission).
Figure 4b depicts the cruise climb executed for Mission 872-0060. Cruise climb starts around FL550, reaching maximum altitudes close to FL640. The time required to reach that altitude is around 20 h; thus, in these missions, the maximum ceiling is reached almost at the end of the mission. The RQ-4A keeps its cruise climb during the whole mission, even during the return legs, extending its operation to around 30 h, allowing the aircraft to reach its maximum FL650 ceiling.
Table 4 analyzes the cruise climb profile for both missions. The first segment always covers the time to climb from FL500 up to FL560, and from that point up, fixed time intervals (each 10,000 s apart) are employed. Each row shows the total cruise-climb cumulative time, the altitude reached and the climb rate for that interval. At the end of the climbing process, the RQ-4A vertical speed becomes almost residual (around 2–10 fpm). However, those small climb rates, once accumulated over long periods of time, permit the Global Hawk to reach its FL650 maximum ceiling.
3.4. Descent Profile Analysis
Figure 5 depicts the descent profile from GRIP Mission 872-0060. Descending from high altitude is divided into two different phases. The descent from FL640 follows a progressive increase of the descent rate that is initially associated with the limitations imposed by the fact of operating at extreme altitudes. It is assumed that the Global Hawk performs a powered descent to avoid either stalling or exceeding its maximum TAS. The descent from FL550 down to FL100 is further divided into three segments:
- From FL550 down to FL475, the Global Hawk attains an almost constant descent rate of . The aircraft levels off at that point.
- From FL475 down to FL300, the descent is re-initiated, showing a similar descent rate.
- At lower altitudes, from FL300 down to FL100, the descent rate is reduced to .
At this point in the analysis, it is clear that the Global Hawk exploits some speed brake mechanism used in combination with a reduction of the engine throttle setting. Some minor oscillations can be observed that cannot be properly justified without further information from the operation.
Finally, it is worth noting that the analysis of the climb and descent profiles shows that the RQ-4A speed management in both phases of the operation is equivalent; that is, the RQ-4A speed is only dependent on the actual altitude and independent of the phase of the flight.
3.5. Landing Analysis
Landing at DRFC starts with the Global Hawk descending from FL100 down to touchdown altitude (see Figure 6 for Mission 872-0060). The landing sequence is initiated at an approximate altitude of . Operation 872-0060 shows a clear transition at around 4830–4585 ft, which is interpreted as related to the landing gear extraction, combined with an apparent decrease in speed.
The RQ-4A descends at a rate of in the first segment and then further reduces that rate to until touchdown. Landing speed starts at , slowing down to ; and then further decelerating (once landing gear is extracted) to (see Figure 6).
3.6. Turn Analysis
Turn rates and bank angles have also been investigated over the range of operative altitudes. A cross-analysis of altitude-speed-heading change has been used by identifying well-defined turns over the whole 872-0060 mission. Each selected turn has been analyzed and recorded within Table 5. Results are consistent with the limited information known about the RQ-4A turning performance at high-altitude.
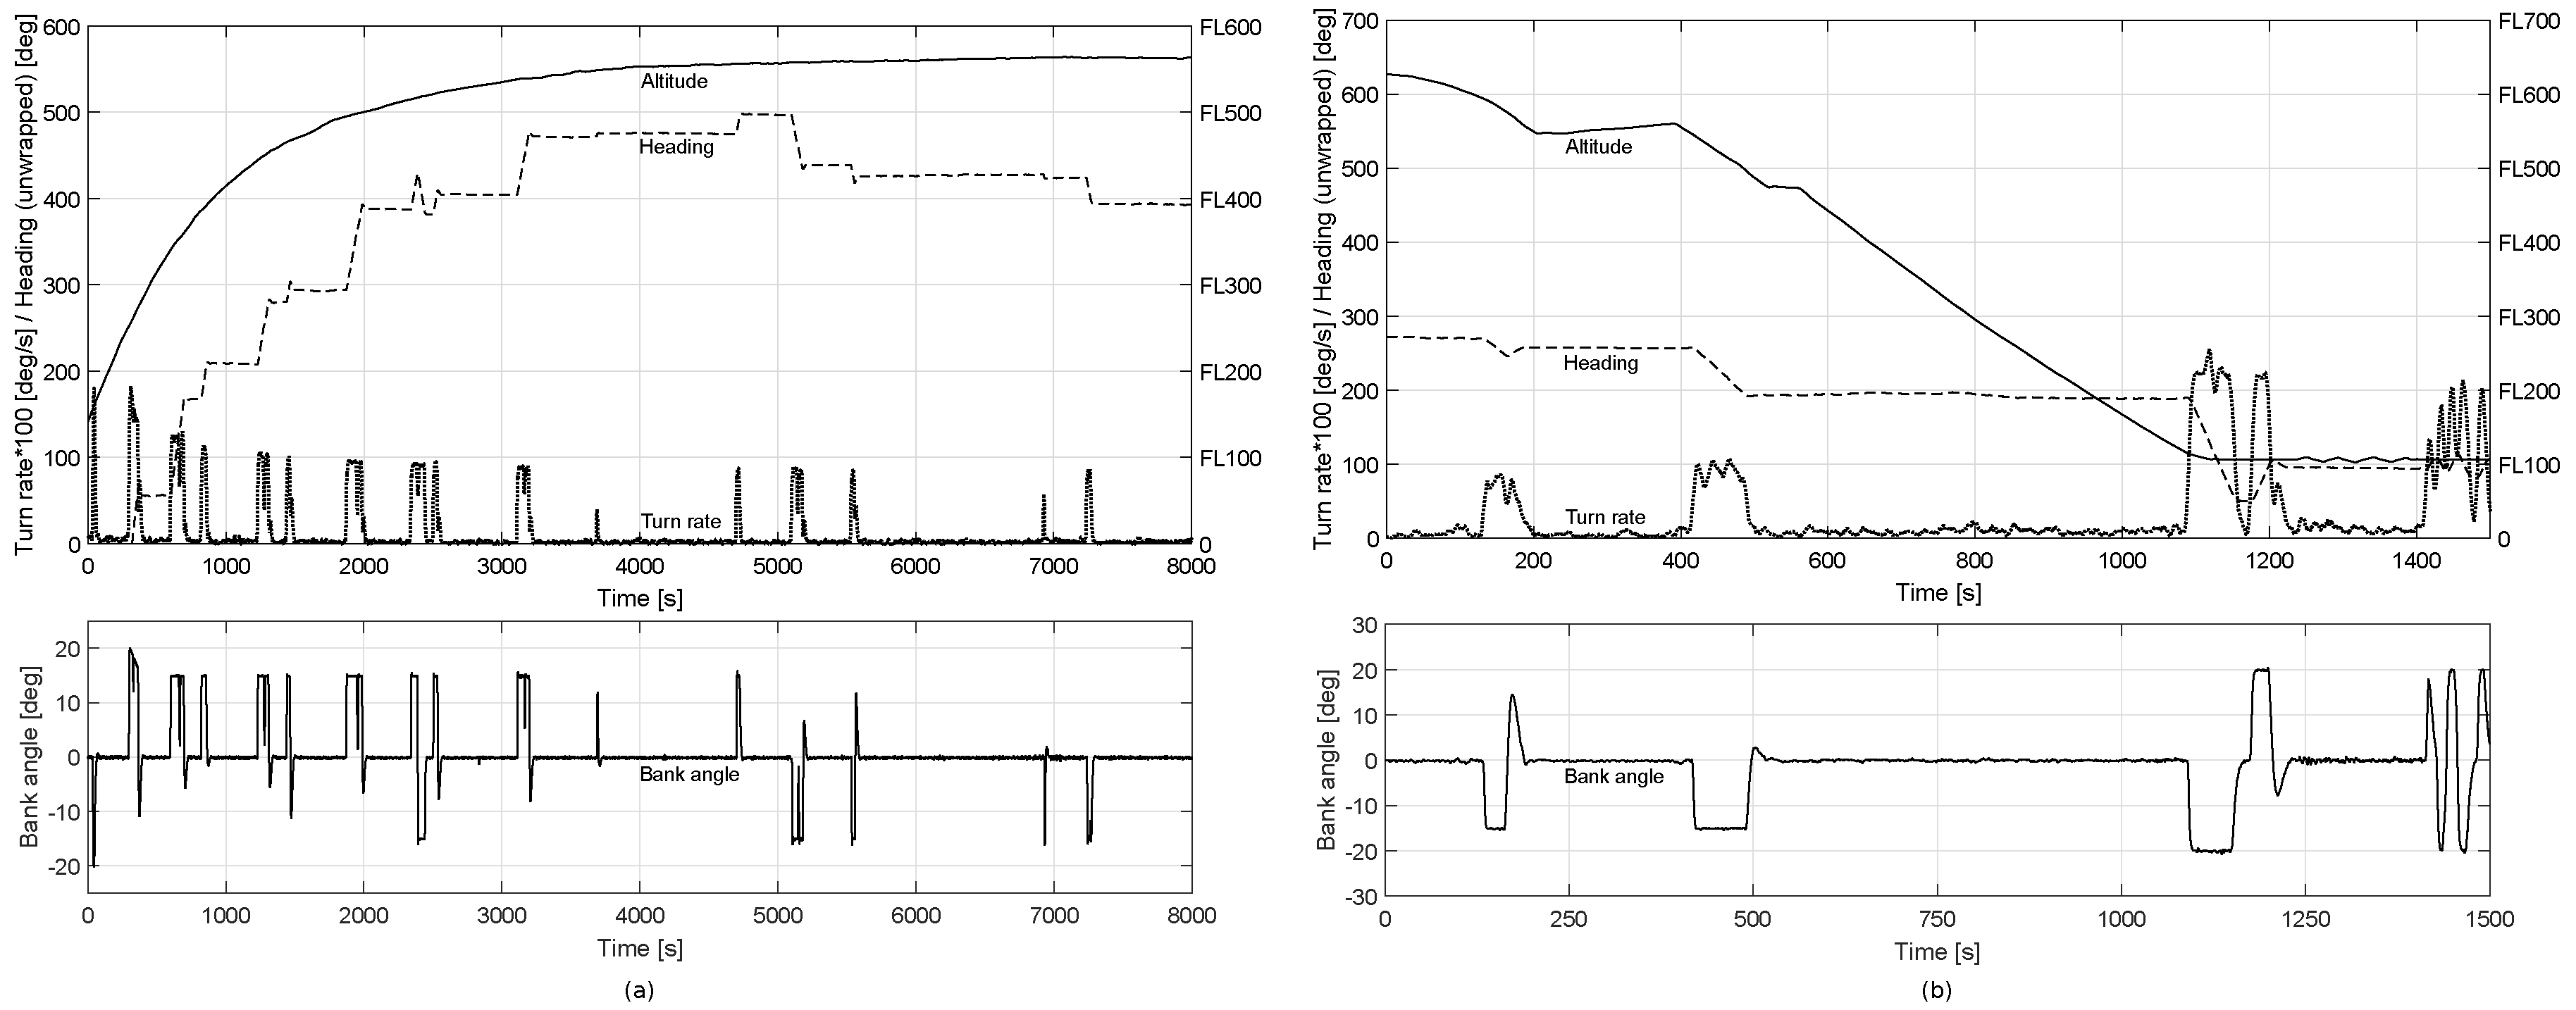
The profile of the 872-0060 mission, coupled with the aircraft bank angle, turn rate and heading change, is shown in Figure 7. The profile is divided into two parts: the climb on the left and the descent on the right. Most of the operation, with the RQ-4A in cruise climb, has been omitted. The image also shows the aircraft heading, and changes in that value can be easily coupled with those instants in which the RQ-4A bank angle differs from zero.
A general inspection of the image reveals that the bank angle is reduced with the altitude, thus progressively decreasing in the left image and increasing again in the right image, consistent with the intensive turning implemented during the descent phase of the flight (recall Figure 2).
Once the RQ-4A gets to altitude, the bank angle is further reduced. The images show how that turn performance decreases at high-altitude FL500-FL550 and even more at maximum altitude FL640. The bank angle capability gets reduced from at FL270 down to 14 and higher altitudes, due to the increase in speed becoming a two-factor increase in turn radius, i.e., from 1.5/s at FL270 down to 0.86/s at FL640.
4. Macroscopic Parameter Validation
A clearer understanding of the operational characteristics of the RQ-4A has been achieved, an additional validation step has been carried out. The objective is, by exploiting additional flight trajectories, to confirm that the most relevant climb and descent macroscopic parameters are consistent with the values gathered through the observation of individual trajectories.
To fulfill this objective, we have collected additional GRIP missions, as well as a subset of Hurricane and Severe Storm Sentinel (HS3) missions, gathering a total of 23 trajectories that follow a similar mission profile. The HS3 missions are the continuation of the GRIP missions, flying additional surveillance operations over the Atlantic. The trajectories are divided into the climb, cruise climb and descent trajectories. Flight trajectory fragments below FL60 are discarded as that portion of the flight is strongly dominated by the departure and arrival operations. The cruise climb portion of the flight is also neglected in this analysis, which solely focuses on the initial climb and descent portions of the operation. Box plot analysis of the most relevant variables is performed based on the data gathered from that set of trajectories.
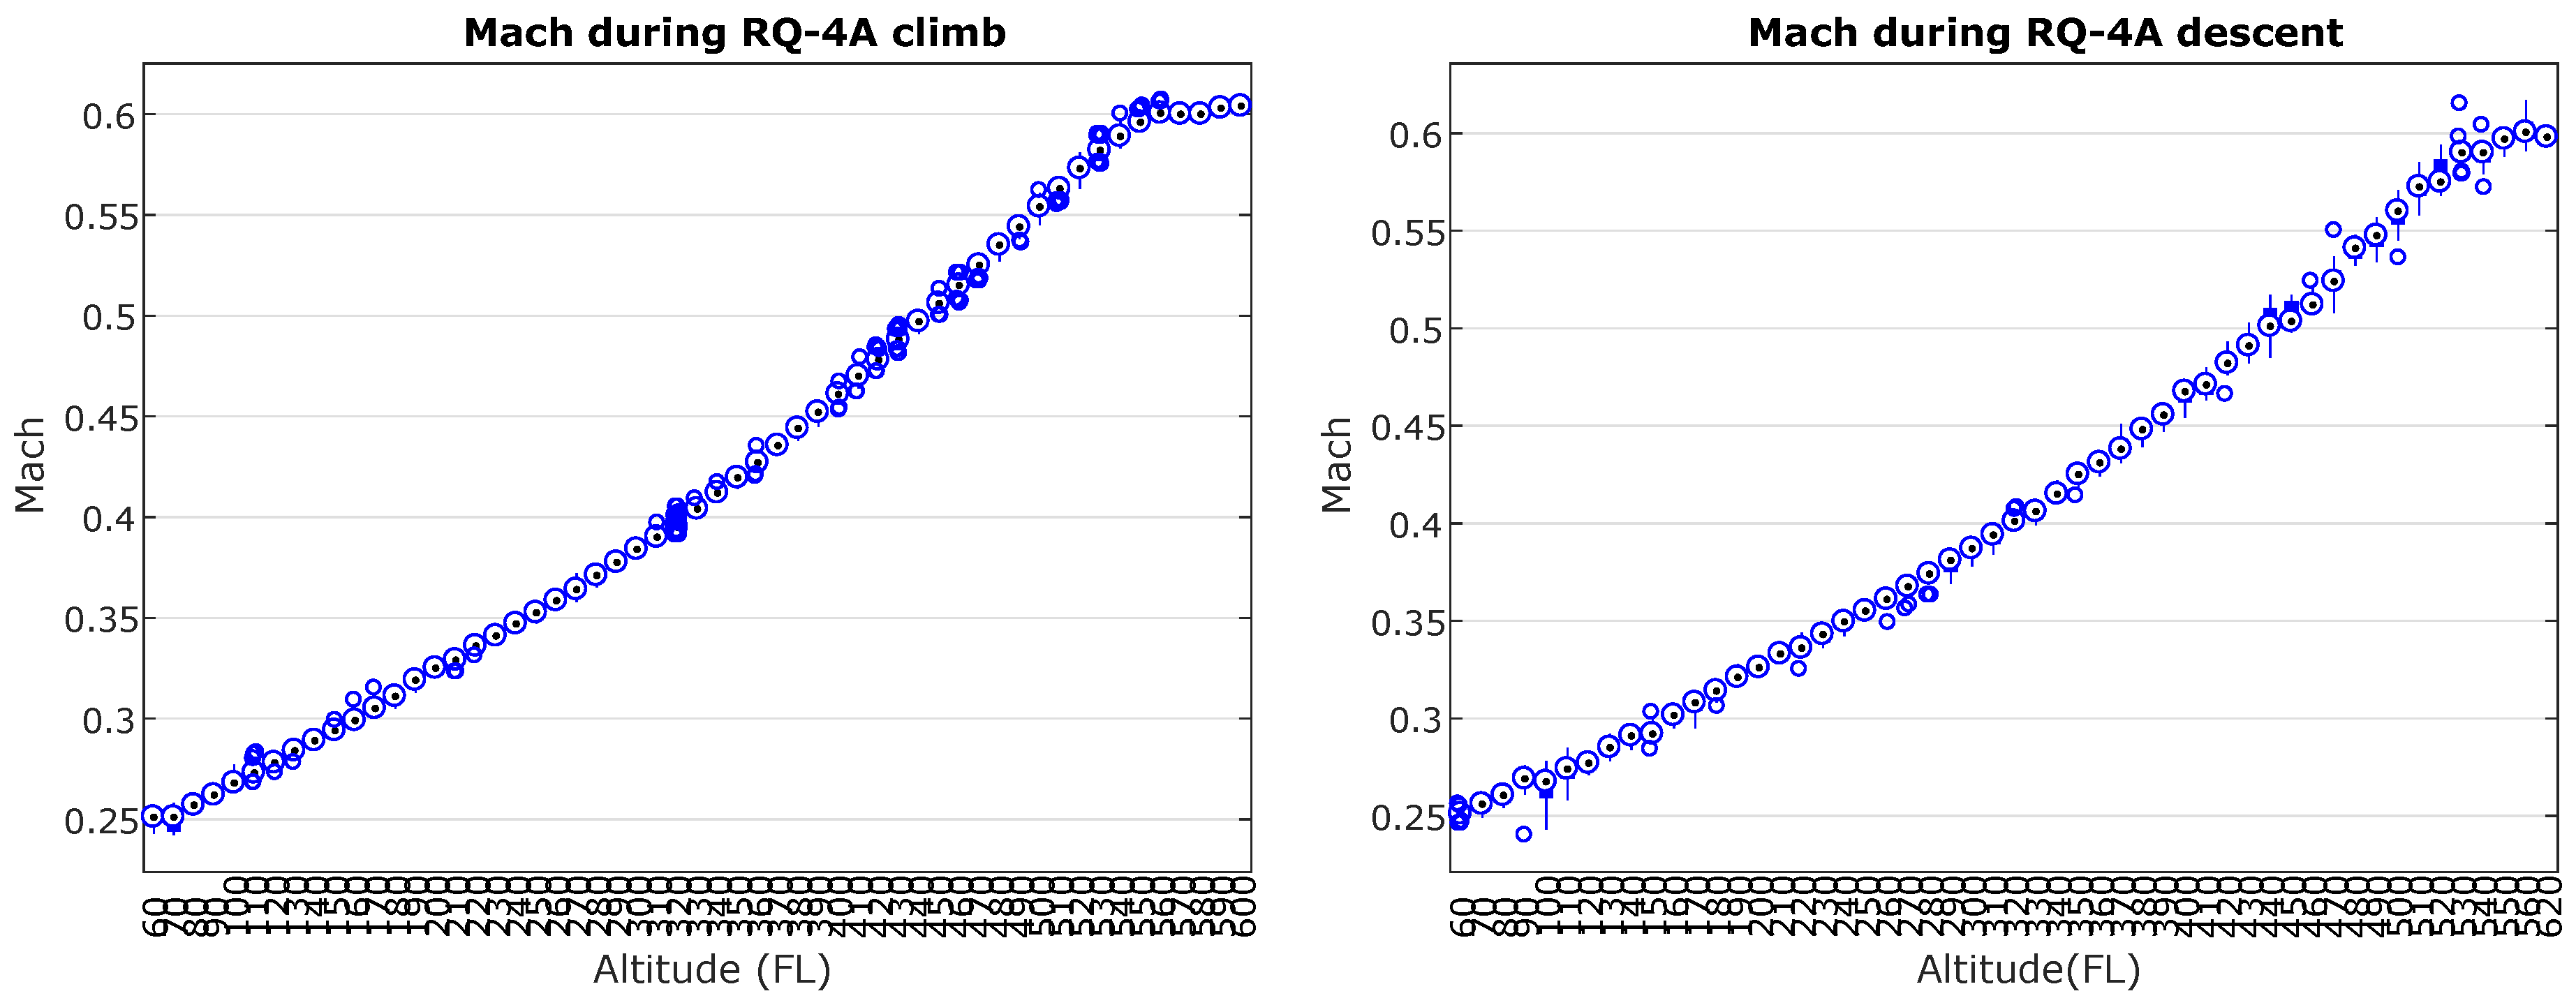
Figure 8 depicts IAS during climb and descent operations. The diagrams show that the IAS profile is dependent on the altitude and that it is equivalent to climb and descent. IAS variations are more substantial at low altitudes, mainly due to the combinations of small ascents and descents that occur during the RQ-4A departure and especially during its arrival phase. Also relevant is the fact that no portion of the flight reveals a constant IAS value, which is typically employed by airliners during some phases of their operations. This evaluation is confirmed by the Mach box plot analysis shown in Figure 9. The diagrams are almost equivalent for both climb and descent operations. Additionally, it also becomes clear that no constant Mach phase is employed by the Global Hawk, except when it reaches near its high-altitude cruise phase in which it operates at a constant Mach .
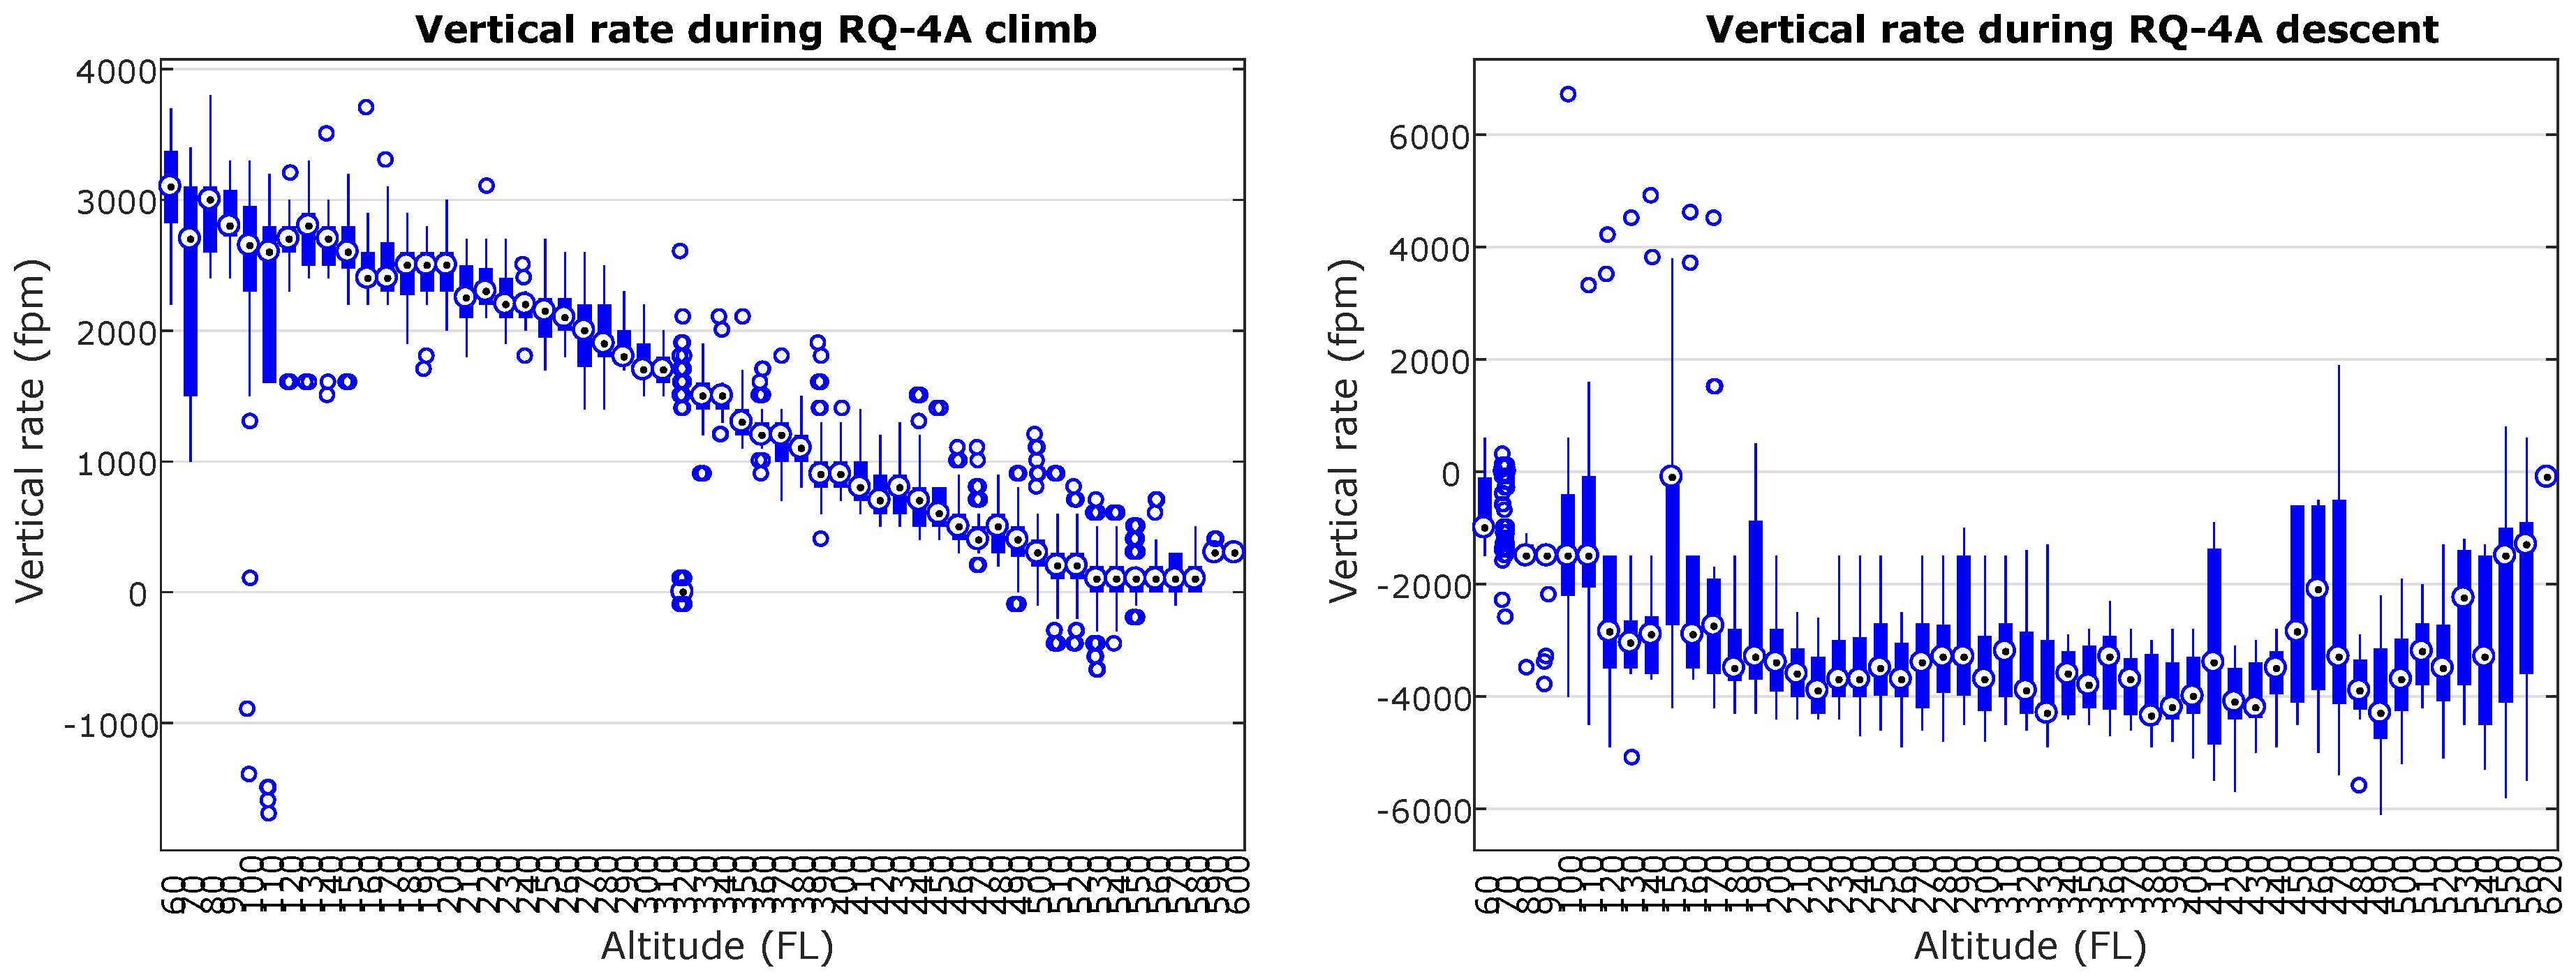
Finally, Figure 10 depicts the vertical rate also during climb and descent operations. The climb box plot shows an initial climb close to 3000 fpm with several outliers that occur due to some altitude oscillations associated with the departure procedures. The vertical rate progressively decreases until the cruise climb phase is reached at FL550. Additionally, a level-off at FL310 can be observed in some of the departure operations, which leads to a broader vertical rate variation at that altitude. The vertical rate variations observed during the descent phase are much more extensive, although it is clear that values in excess of fpm are sustained for a significant portion of the descent. Note also the positive vertical rate values near FL150 as a result of altitude oscillations associated with entering the final landing phase.
5. Performance Validation of a Simulated RQ-4A
A computer model of the RQ-4A was constructed within the scope of the recent SESAR projects conceived of to validate RPAS integration through real-time simulations. The vehicle was to be extensively employed in 50 real-time RPAS-ATM simulation exercises within the scope of the ERAINT project [10,11,19]. Active-duty ATC controllers managed the RQ-4A integration, which included the operation of the RQ-4A in terminal airspace and under the occurrence of various types of emergencies. Prior to the evaluation campaign, the performance of the simulated aircraft was compared to the RQ-4A macroscopic performance parameters identified in this research.
5.1. Aircraft Appearance and Ice Hawk Test Mission
The RQ-4A model operates on top of the X-Plane 10 simulator [20], and its design approximates the performance of the RQ-4A macroscopic data. Both the modeling capabilities offered by the X-Plane simulator and the actual physical data available for this aircraft (precise dimensions and engine performance) limit the quality of the model. The X-Plane reconstruction of the RQ-4A resembles the real aircraft, a Block 10 pre-series flying under NASA’s livery. The simulated aircraft has approximately the same dimensions, weight, fuel capacity and engine performance. Figure 11 depicts a close-up view of the RQ-4A NS872 taking off from Runway 01L of Oslo-Gardermoen airport and en-route at high altitude.
The Ice Hawk mission is an RPAS simulated operation designed to monitor the North Pole ice cover, departing from both Europe and the U.S. The European portion of the mission departs from Runway 01L of Oslo-Gardermoen airport. The RPAS proceeds north until the mission area is reached where an extra-wide scan operation is performed. Once completed, the RPAS returns to the original airport under a different route. The selected cruise flight level is FL640; thus, a long cruise climb operation is necessary to reach that altitude. Figure 11 outlines the test mission as seen in the RAISE [19] simulation environment. The Ice Hawk mission is employed as no detailed flight plan information is available with respect to the real GRIP missions. This mission was designed within the effort carried out by the SESAR ERAINT project to evaluate the impact of RPAS integration in European airspace [11].
5.2. Climb Profile
The full climb profile from take-off up to cruise altitude at FL640 is depicted in Figure 12. The climb profile shows very similar behavior when compared with GRIP 872-0060, shown in Figure 4a. Some sampled points along both simulated and real operations are provided as reference points (see Table 6).
Note that it is difficult to compare both profiles at high altitude, as when cruising, the real RQ-4A has a high variation in its altitude data. Such variation may be due to wind/temperature variations when operating at extreme altitudes. Moreover, the simulated RQ-4A also exhibits a spurious oscillation in its pitch angle when climbing. That oscillation will induce some degradation in its climb profile; thus, it is expected that both values (real and simulated) will get closer if that pitch control oscillation could be eliminated.
5.3. Speed Profile
Figure 12 depicts a TAS/IAS speed profile during the climb phase of the operation. Speed versus altitude analysis can be performed by correlating them by comparing the simulation time for each sample.
The analysis of the data shows that the climb speed is coherent with the real climb analysis shown in Figure 3b and Figure 4. However, a discrepancy was found in the way speed is set up at high altitude. The target Mach (TAS 330–340 kt) is too slow to maintain good turning performance above FL600 for the simulated model. Thus, a small speed divergence was induced in the commanded TAS to be flown. Initially, the difference amounts to 1–3 kt, but progressively needed to be increased to at higher flight levels. At FL640, the simulated RQ-4A accelerates up to . Fortunately, that discrepancy did not affect the results of the ATM evaluation campaign.
5.4. Vertical Speed Profile
The analysis of the data demonstrates that the climb speed of the simulated vehicle is coherent with the real climb analysis shown in Figure 12. The simulated RPAS initiates its take-off run until rotation occurs at 150 kt TAS. The RQ-4A initiates its initial climb with a fixed vertical speed of 2000 fpm, relaxing that value to . In that state, the vehicle performs various forms of climb oscillation. First, the climb profile increases to almost . Then, the autopilot switches to a pitch control climb with a throttle setting. The X-plane control system reduces the climb pitch, thus transferring the thrust energy to acceleration rather than to the climb itself. The result is a brief acceleration of the RQ-4A, which continues with an energy re-balance between the acceleration and the climb. The result is a small deceleration of the simulated RQ-4A back to its nominal speed profile and an intense increase in the climb ratio, as a result of the energy transfer from speed to climb, back to its initial .
The analysis of the climb performance shows that the simulated RQ-4A somehow outperforms the climb performance at low levels from FL50–FL100, in which the climb rate evolves from –. From FL100 up to FL200, the climb rate evolves from –. The climb is progressively reduced and from FL200 up to FL300 to and , respectively. Both IAS and TAS together with the altitude profile evolve similarly to the real RQ-4A.
The comparison between the real and simulated RQ-4A is much more complex during descent. The selection of the descent profile has many operational options, including the throttle setting, as well as the selection of the speed-brake setting, which is unknown to the authors. Figure 12b depicts one of the descent profiles implemented to land at Oslo-Gardermoen. As in the real NASA descent profiles, the simulated profile was configured in three steps:
- Initial descent from high-altitude down to FL550 without speed-brakes and a throttle setting. This powered descent is employed to guarantee that the RQ-4A did not stall at high-altitude if the engine were idled. The RQ-4A will slowly gain descent momentum as it reaches lower levels of the atmosphere.
- Additional descent from FL550 down to FL350 with an intermediate speed-brake setting and engine setting at idle. The RQ-4A will maintain an almost continuous descent profile at as the targeted speed is only slightly modified according to the altitude being flown.
- Before the RQ-4A reaches FL350, the descent profile is increased by increasing the speed-brake setting to obtain a more aggressive vertical descent at around . Once FL350 is reached, the aircraft is stabilized until clearance is granted to continue to descend down to FL140 with the same aggressive descent profile. Vertical speed starts at to be progressively decreased down to at FL140.
Once at FL140, the diagram shows some continuous altitude changes corresponding to the required STAR procedure to approach Oslo-Gardermoen, first at and then at due to the usage of the lower setting of the speed-brake. Note that the real NASA RQ-4A mission is not restricted to operate a STAR procedure, as it ends up landing within segregated airspace. Moreover, other descent profiles could be attained by using different speed-brake settings. Finally, the glide slope before landing is flown at the same speed as the real RQ-4A, employing a vertical speed of around .
Table 7 outlines a comparison between real and simulated speeds and climb rates. The table is not intended for the comparison of absolute values as the simulation environment assumes a standard atmosphere. On the contrary, the atmospheric variations, as well as the altitude calibration during the GRIP missions are unknown.
5.5. Turn Profile
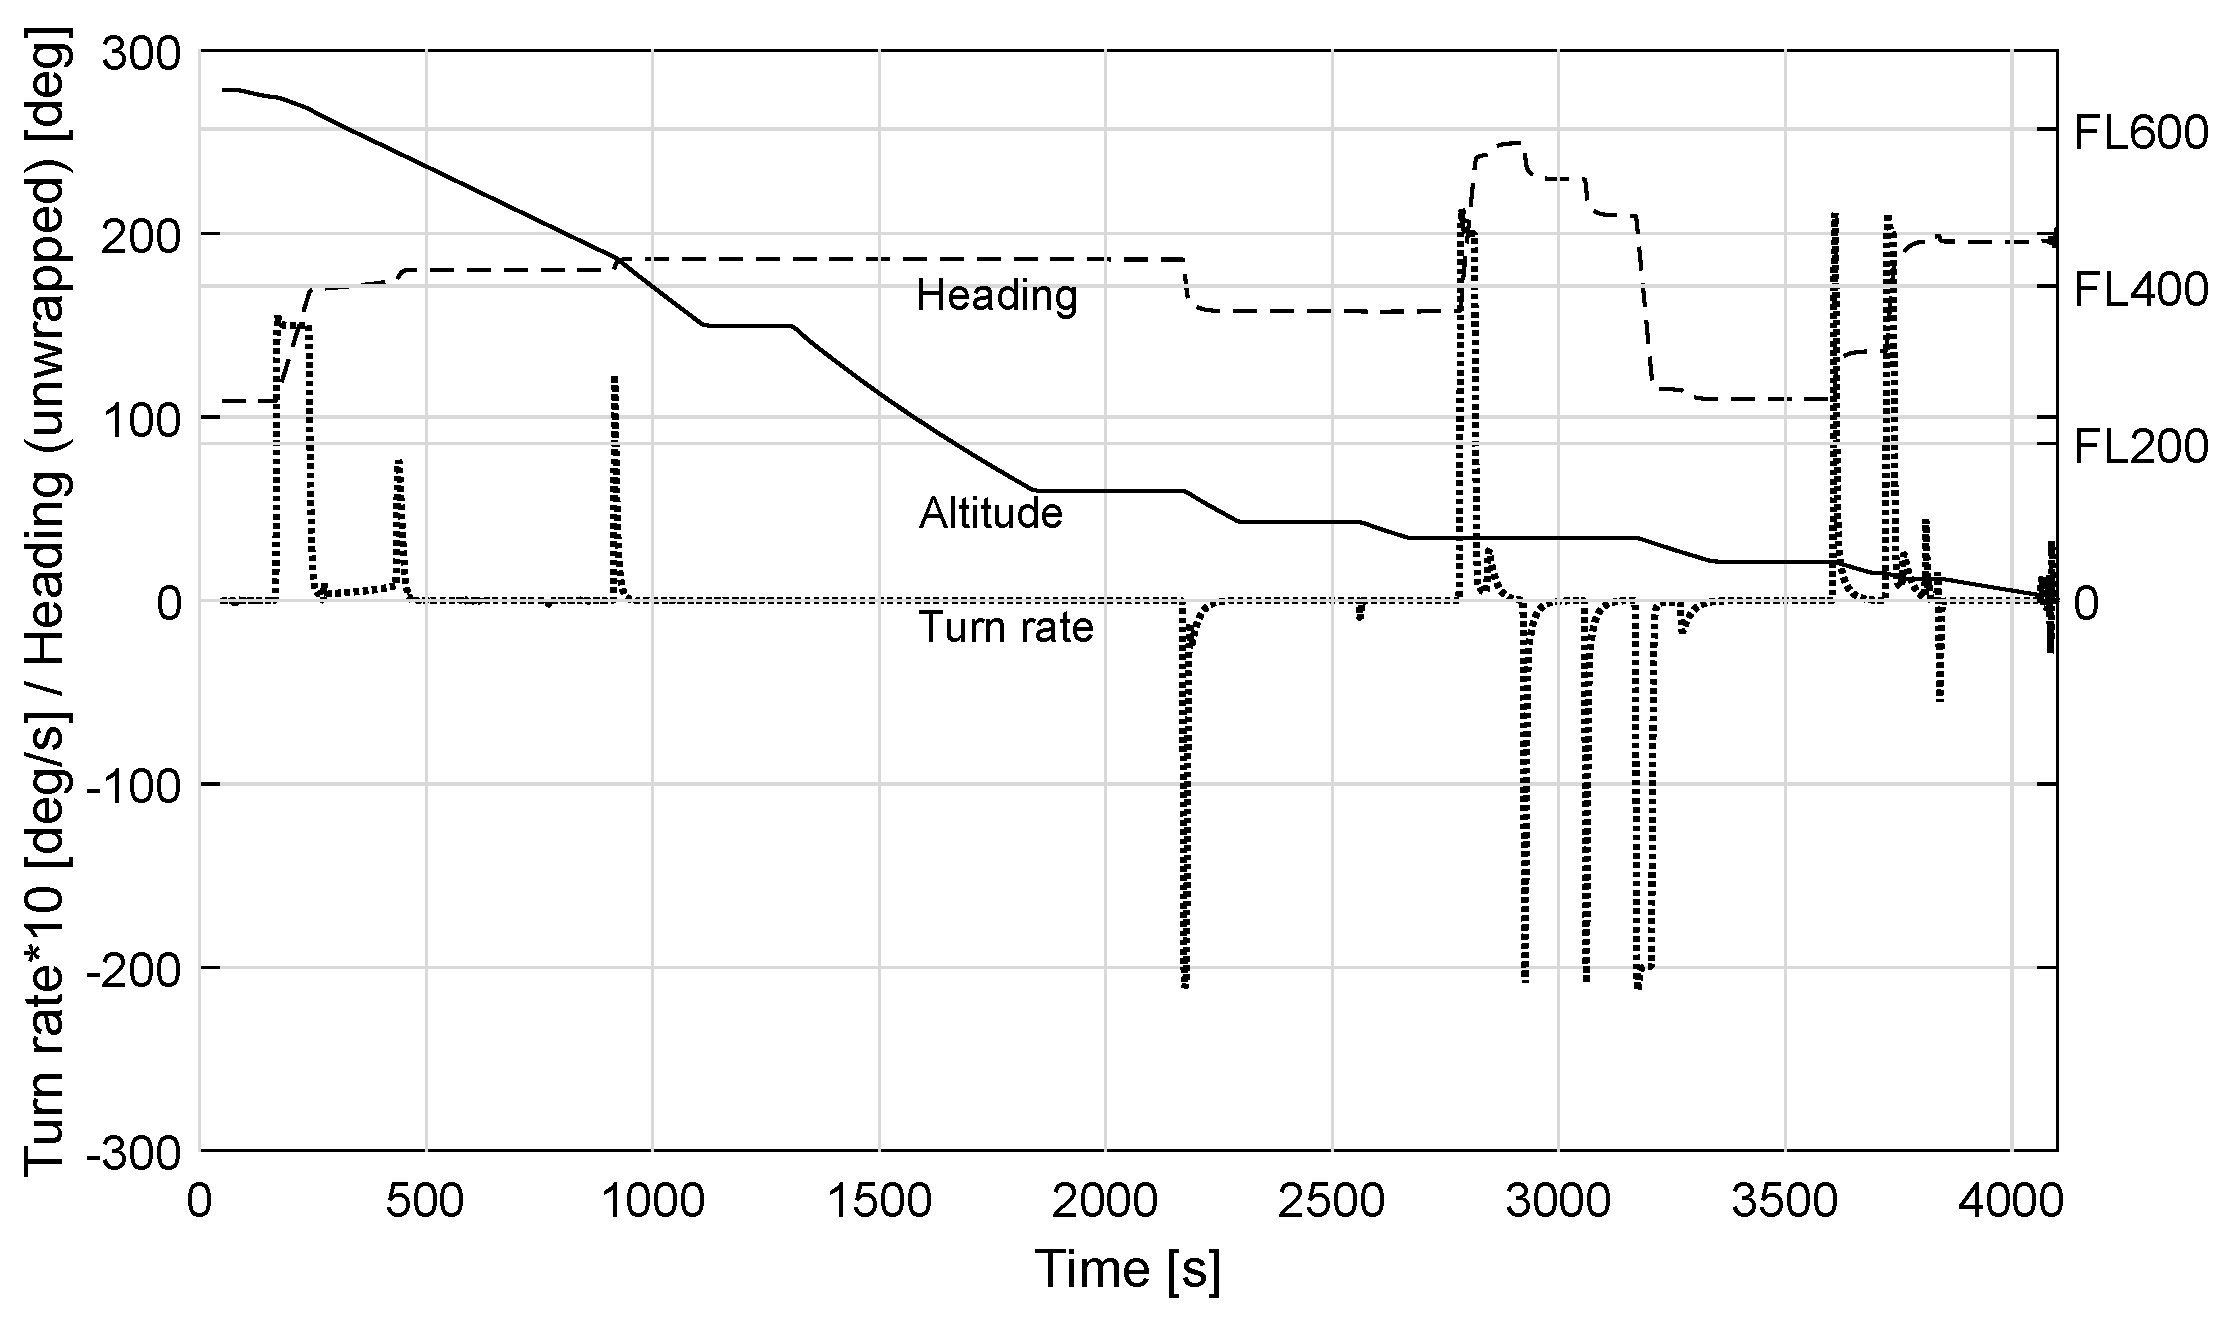
To complete the performance analysis of the simulated RQ-4A, in Figure 13, we explore information about the turn performance achieved during the same return procedure into Oslo-Gardermoen. The figure depicts the RPAS altitude, magnetic heading, back angle and turn rate during that portion of the flight.
Data inspection shows a similar trend when compared with the performance of the real RQ-4A. Turns performed at high-altitude are limited to a bank angle (providing less than one degree per second in turn rate). Once the RPAS has descended to lower altitudes, the back angle increases significantly, reaching a more aggressive (which provides degrees per second in turn rate). Although not observed in this trajectory, the bank angle achieved by the simulated model progressively increases as altitude decreases, providing an equivalent turn rate profile when compared to the real vehicle.
6. Conclusions
Understanding the most relevant performance characteristics of RPAS will become paramount to facilitate their integration. Performance prediction helps ATC to understand the limitations of RPAS under their supervision better. Moreover, short- and long-term trajectory prediction is essential for the implementation of various collision avoidance safety nets, as well as flight efficiency applications like the generation of 4D trajectory predictions.
In the absence of the flight manual of an RPAS, the generation of its performance models requires the initial identification of its basic operative and performance characteristics from the available flight trajectories. Based on this initial understanding of the aircraft, further analysis can be performed to derive an accurate APM. This paper carried out basic operational and performance analysis to determine the main characteristics of the RQ-4A.
The mission trajectories flown by a NASA-operated RQ-4A have been investigated and some of their macroscopic performance behavior identified. The analysis of the results highlights some of the main differences between airliners and RPAS regarding climb and descent profiles, cruise speeds and operational altitudes. The results have been validated by performing a more extensive statistical analysis over a set of trajectories flown under the same operational objectives.
Based on these data, an RQ-4A simulation model implemented in X-Plane to be employed in RPAS-ATC real-time exercises has been validated. The initial analysis of the modeled RQ-4A demonstrated that, although the real aircraft and its simulation counterpart are not equivalent, simulated performance is reasonably close to the actual behavior and mission patterns of NASA’s vehicle. Thus, the vehicle was successfully employed in an extensive ATM evaluation campaign.
The availability of the macroscopic performance model generated in this research has also triggered the development of accurate performance models based on Eurocontrol’s BADA formalism. Operational RQ-4A understanding generated through this work, combined with a broad set of real trajectories, led to the implementation of an RQ-4A performance model included in the official BADA3 dataset.
Acknowledgments
This work was partially funded by the Ministerio de Economia y Competitividad of Spain under Contract TRA2016-77012-R and by EUROCONTROL acting on behalf of the SESAR Joint Undertaking (the SJU) and the European Union as part of Work Package E in the SESAR Programme. Opinions expressed in this work reflect the authors’ views only, and EUROCONTROL and/or the SJU shall not be considered liable for them or for any use that may be made of the information contained herein.
Author Contributions
Pablo Royo and Raúl Cuadrado implemented the ATM simulation environment in which the computer model of the RQ-4A was evaluated. Cristina Barrado performed the analysis of the initial RQ-4A trajectories, while Marc Pérez-Batlle performed the Box Plot analysis of the larger set of trajectories employed for validation. Enric Pastor wrote the paper, and performed the comparison between the real RQ-4A and its computer model in collaboration with Marc Pérez-Batlle.
Conflicts of Interest
The authors declare no conflict of interest.
Abbreviations
The following abbreviations are used in this manuscript:
| APM | Aircraft Performance Models |
| ATM | Air Traffic Management |
| BADA | Base of Aircraft Data |
| DFRC | Dryden Flight Research Center |
| ERAINT | Evaluation of the RPAS-ATM Interaction in Non-segregated Airspace |
| ESPO | Earth Science Project Office |
| fpm | Feet per minute (climb/descent rate) |
| ft | Altitude in feet |
| GRIP | Genesis and Rapid Intensification Processes |
| HS3 | Hurricane and Severe Storm Sentinel |
| IAS | Indicated Air Speed |
| IWG1 | Interagency Working Group standard format number 1 |
| kt | Speed in knots, either IAS or TAS |
| MACS | Multi-Aircraft Control System |
| min | Minutes |
| NASA | National Aeronautics and Space Administration |
| NM | Nautical Miles |
| RPAS | Remote-Piloted Aircraft System |
| SESAR | Single European Sky ATM Research |
| TAS | True Air Speed |
| USAF | United States Air Force |
References
- Nuic, A. User Manual for the Base of Aircraft Data (BADA) Revision 3-13; Technical Report 15/04/02-43; Eurocontrol: Brétigny-sur-Orge, France, 2015. [Google Scholar]
- Nuic, A.; Iagaru, M.; Gallo, E. Advanced aircraft performance modelling for ATM: Bada 4.0 results. In Proceedings of the 25th Digital Avionics System Conference, Portland, OR, USA, 15–19 October 2006; pp. 1–12. [Google Scholar]
- Nuic, A.; Poinsot, C.; Iagaru, M.; Gallo, E.; Navarro, F.; Querejeta, C. Advanced aircraft performance modelling for ATM: Enhancements to the BADA model. In Proceedings of the 24th Digital Avionics System Conference, Washington, DC, USA, 30 October–3 November 2005. [Google Scholar]
- Naftel, J. NASA Global Hawk: Project Overview and Future Plans; Technical Report 20110011977; NASA Global Hawk: Washington, DC, USA, 2011.
- NASA’s ESPO Office (Earth Science Project Office). 2016. Available online: http://espo.nasa.gov/ (accessed on 8 January 2018).
- Clothier, R.; Williams, B.; Fulton, N. Structuring the safety case for unmanned aircraft system operations in non-segregated airspace. Saf. Sci. 2015, 79, 213–228. [Google Scholar] [CrossRef]
- Le Tallec, C. VFR general aviation aircraft and UAV flights deconfliction. Aerosp. Sci. Technol. 2005, 9, 495–503. [Google Scholar] [CrossRef]
- Wieland, F.; Delaurentis, D.; Kubat, G. Modeling and Simulation for UAS in the NAS; Technical Report NASA CR-2012-NND11AQ74C; NASA Langley Research Center: Hampton, VA, USA, 2012.
- Goppert, J.; Hwang, I. Constructing BADA models of existing UASs from public data and photos using open source tools. In Proceedings of the AIAA Modeling and Simulation Technologies (MST) Conference, Boston, MA, USA, 19–22 August 2013. [Google Scholar]
- Pastor, E.; Perez-Batlle, M.; Royo, P.; Cuadrado, R.; Barrado, C. Real-time simulations to evaluate the RPAS integration in shared airspace. In Proceedings of the 4th SESAR Innovation Days (SIDs2014), Madrid, Spain, 25–27 November 2014. [Google Scholar]
- Pastor, E.; Royo, P.; Cuadrado, R.; Barrado, C.; Perez-Batlle, M. ERAINT—Evaluation of the RPAS-ATM interaction in non-segregated airspace. In SESAR Innovation Days (SID2013); Eurocontrol: Stokholm, Swedeen, 2013. [Google Scholar]
- Eurocontrol. Approach to the Introduction of RPAS in BADA 3 Aircraft Performance Model; EEC Technical Note No. 15/11/06-50; Eurocontrol: Brétigny-sur-Orge, France, 2015. [Google Scholar]
- Eurocontrol. Existing RPAS Models; Release Note to EEC Technical Note No. 15/11/06-50; Eurocontrol: Brétigny-sur-Orge, France, 2015. [Google Scholar]
- Braun, S.A.; Kakar, R.; Zipser, E.; Heymsfield, G.; Albers, C.; Brown, S.; Durden, S.L.; Guimond, S.; Halverson, J.; Heymsfield, A.; et al. NASA’s genesis and rapid intensification processes (GRIP) field experiment. Bull. Am. Meteorol. Soc. 2013, 94, 345–363. [Google Scholar] [CrossRef]
- Newman, P.; Fahey, D. NASA Global Hawk UAS and its application for atmospheric science. In Proceedings of the AIAA Infotech@Aerospace Conference, Seattle, WA, USA, 6–9 April 2009. [Google Scholar]
- Ostwald, P.; Hershey, W. Helping Global Hawk fly with the rest of us. In Proceedings of the Integrated Communications, Navigation and Surveillance Conference, Herndon, VA, USA, 30 April–3 May 2007. [Google Scholar]
- Schelp, T.; Corea, V.; Jeffries, J. Development of the RQ-4A Global Hawk propulsion system. In Proceedings of the 39th AIAA/ASME/SAE/ASEE Joint Propulsion Conference and Exhibit, Huntsville, AL, USA, 20–23 July 2003. [Google Scholar]
- Sorenson, C. Global Hawk Payload Network Communications Guide; NASA Doc. DFRC-GH-0029; Dryden Flight Research Center: Edwards, CA, USA, 2008.
- Royo, P.; Barrado, C.; Pastor, E. Isis+: A software-in-the-loop unmanned aircraft system simulator for nonsegregated airspace. J. Aerosp. Inf. Syst. 2013, 10, 530–543. [Google Scholar] [CrossRef]
- Kummar, K.; Reel, P. Analysis of contemporary robotics simulators. In Proceedings of the International Conference on Electrical and Computer Technology (ICETECT), Nagercoil, India, 23–24 March 2011. [Google Scholar]
Figure 1.
NASA’s Global Hawk platform and payload as configured for the GRIP mission (courtesy of NASA ESPO).
Figure 1.
NASA’s Global Hawk platform and payload as configured for the GRIP mission (courtesy of NASA ESPO).
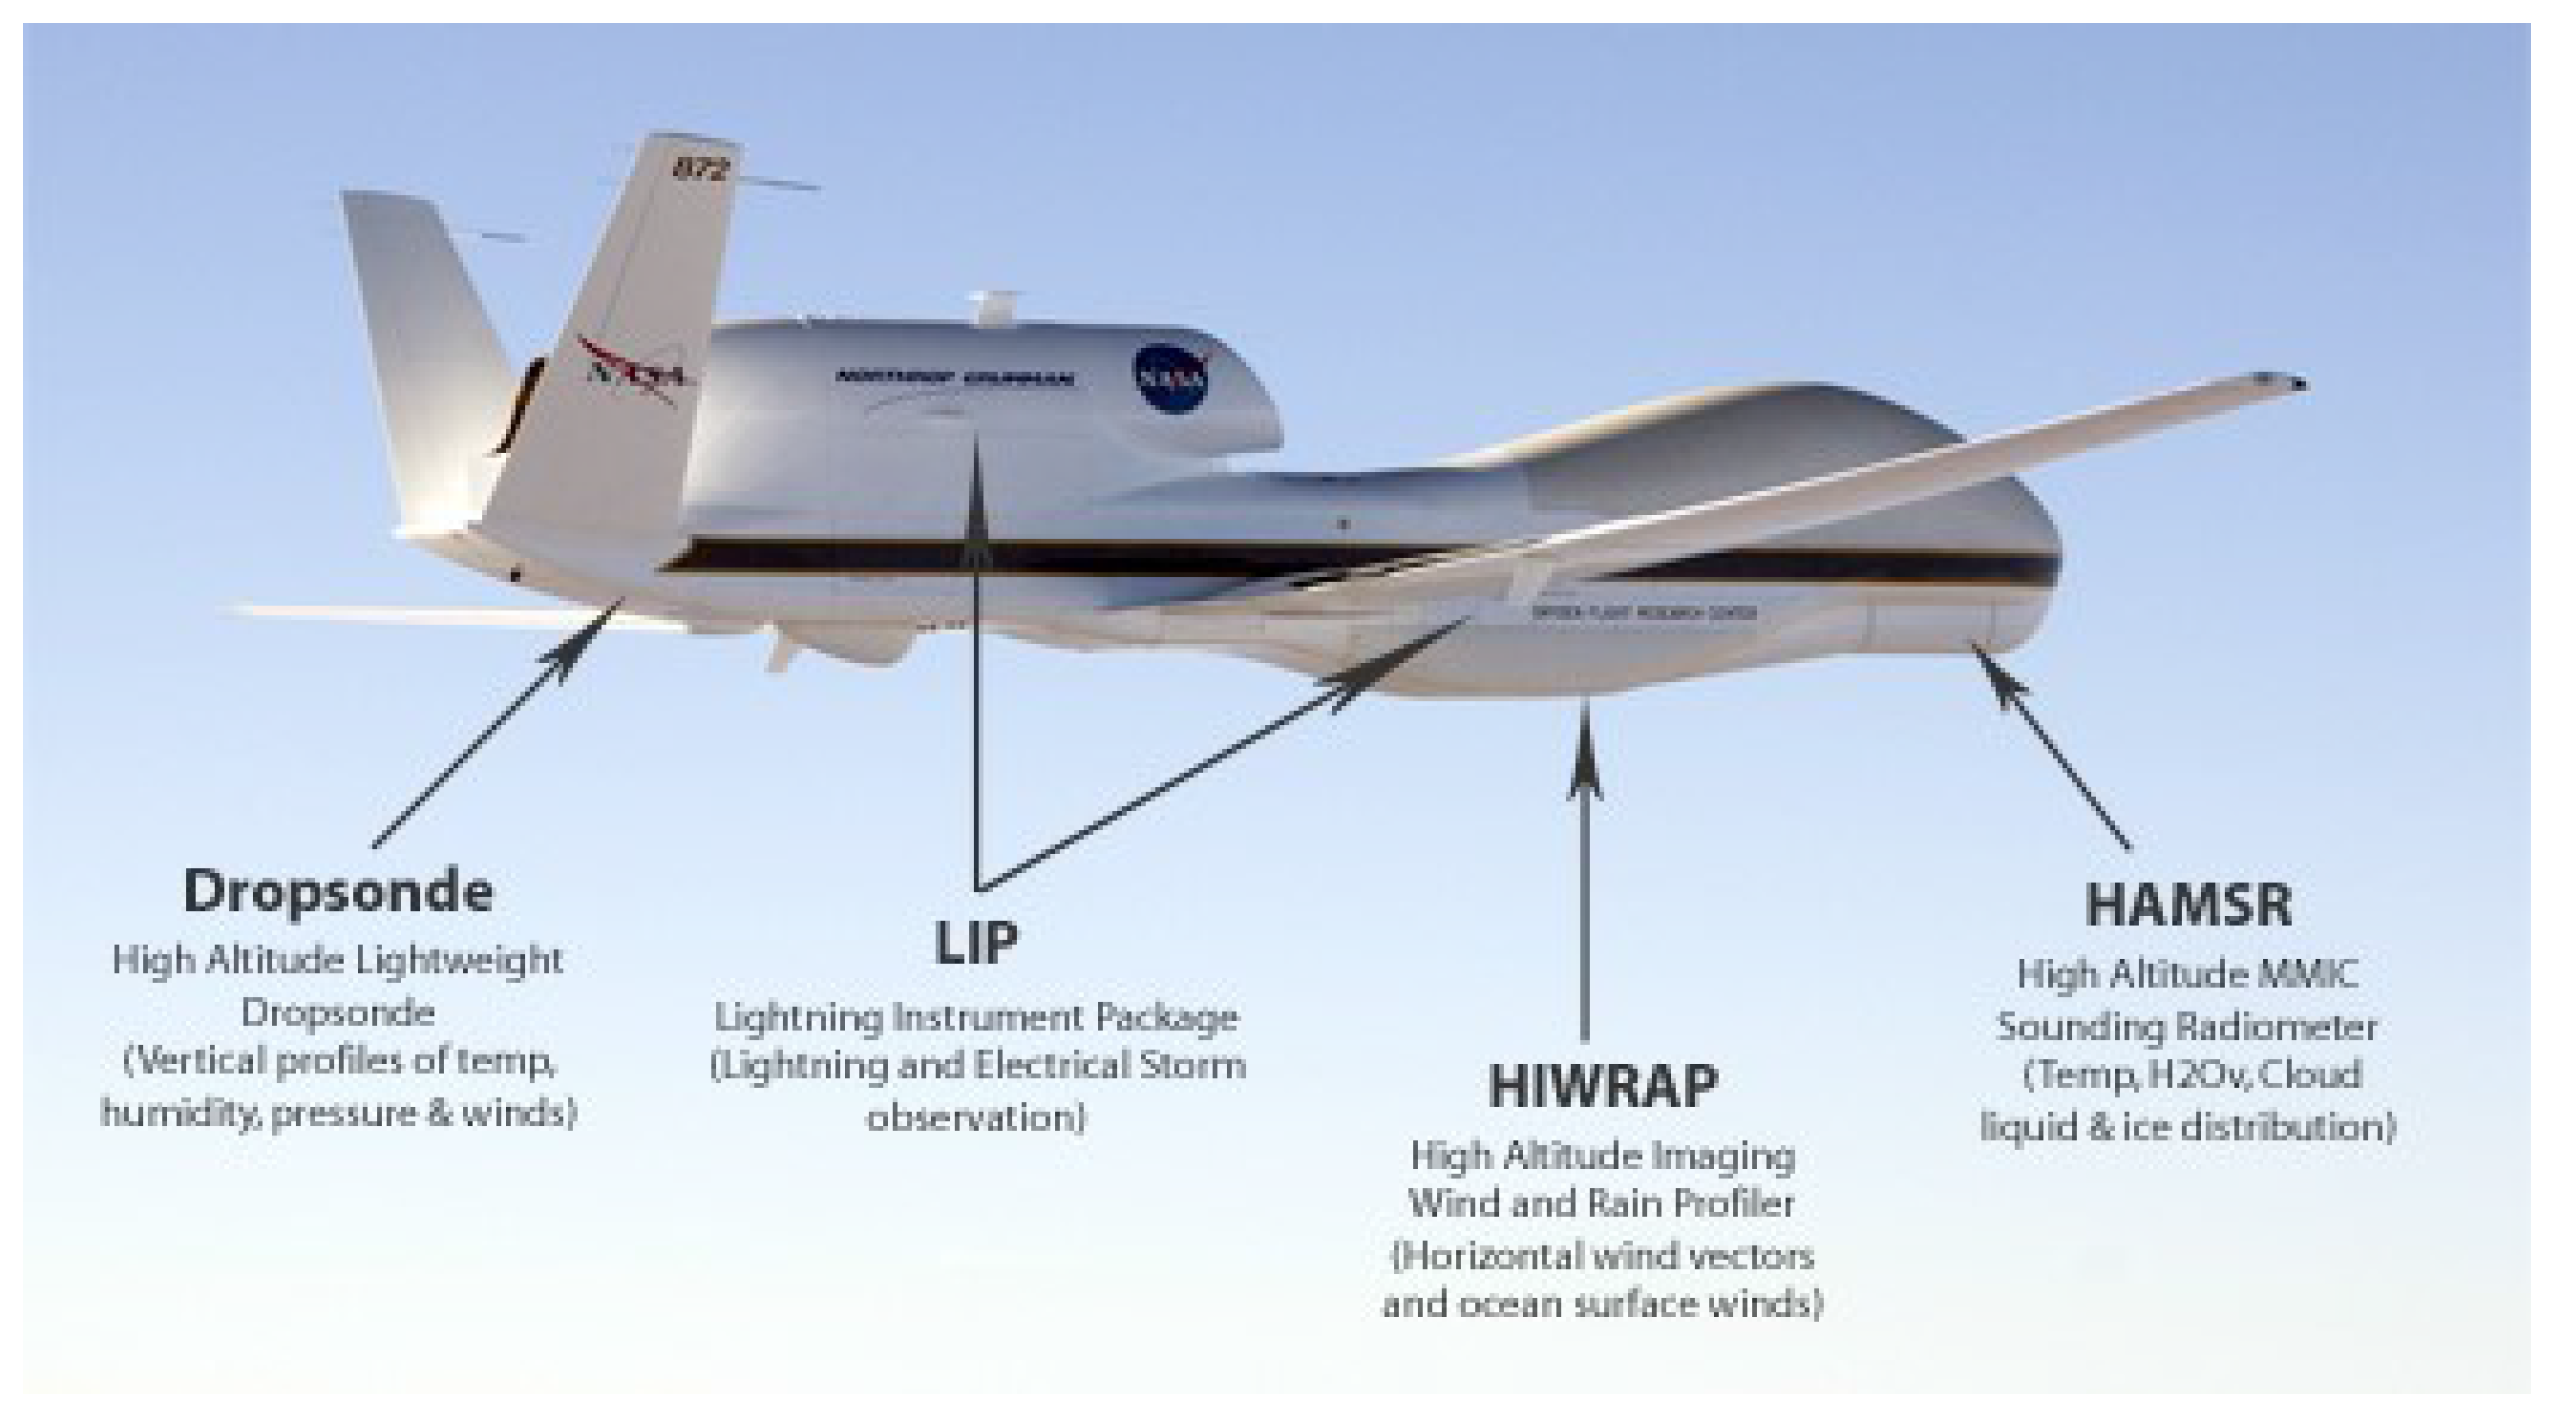
Figure 2.
General view of NASA’s Global Hawk GRIP Mission 872-0062.
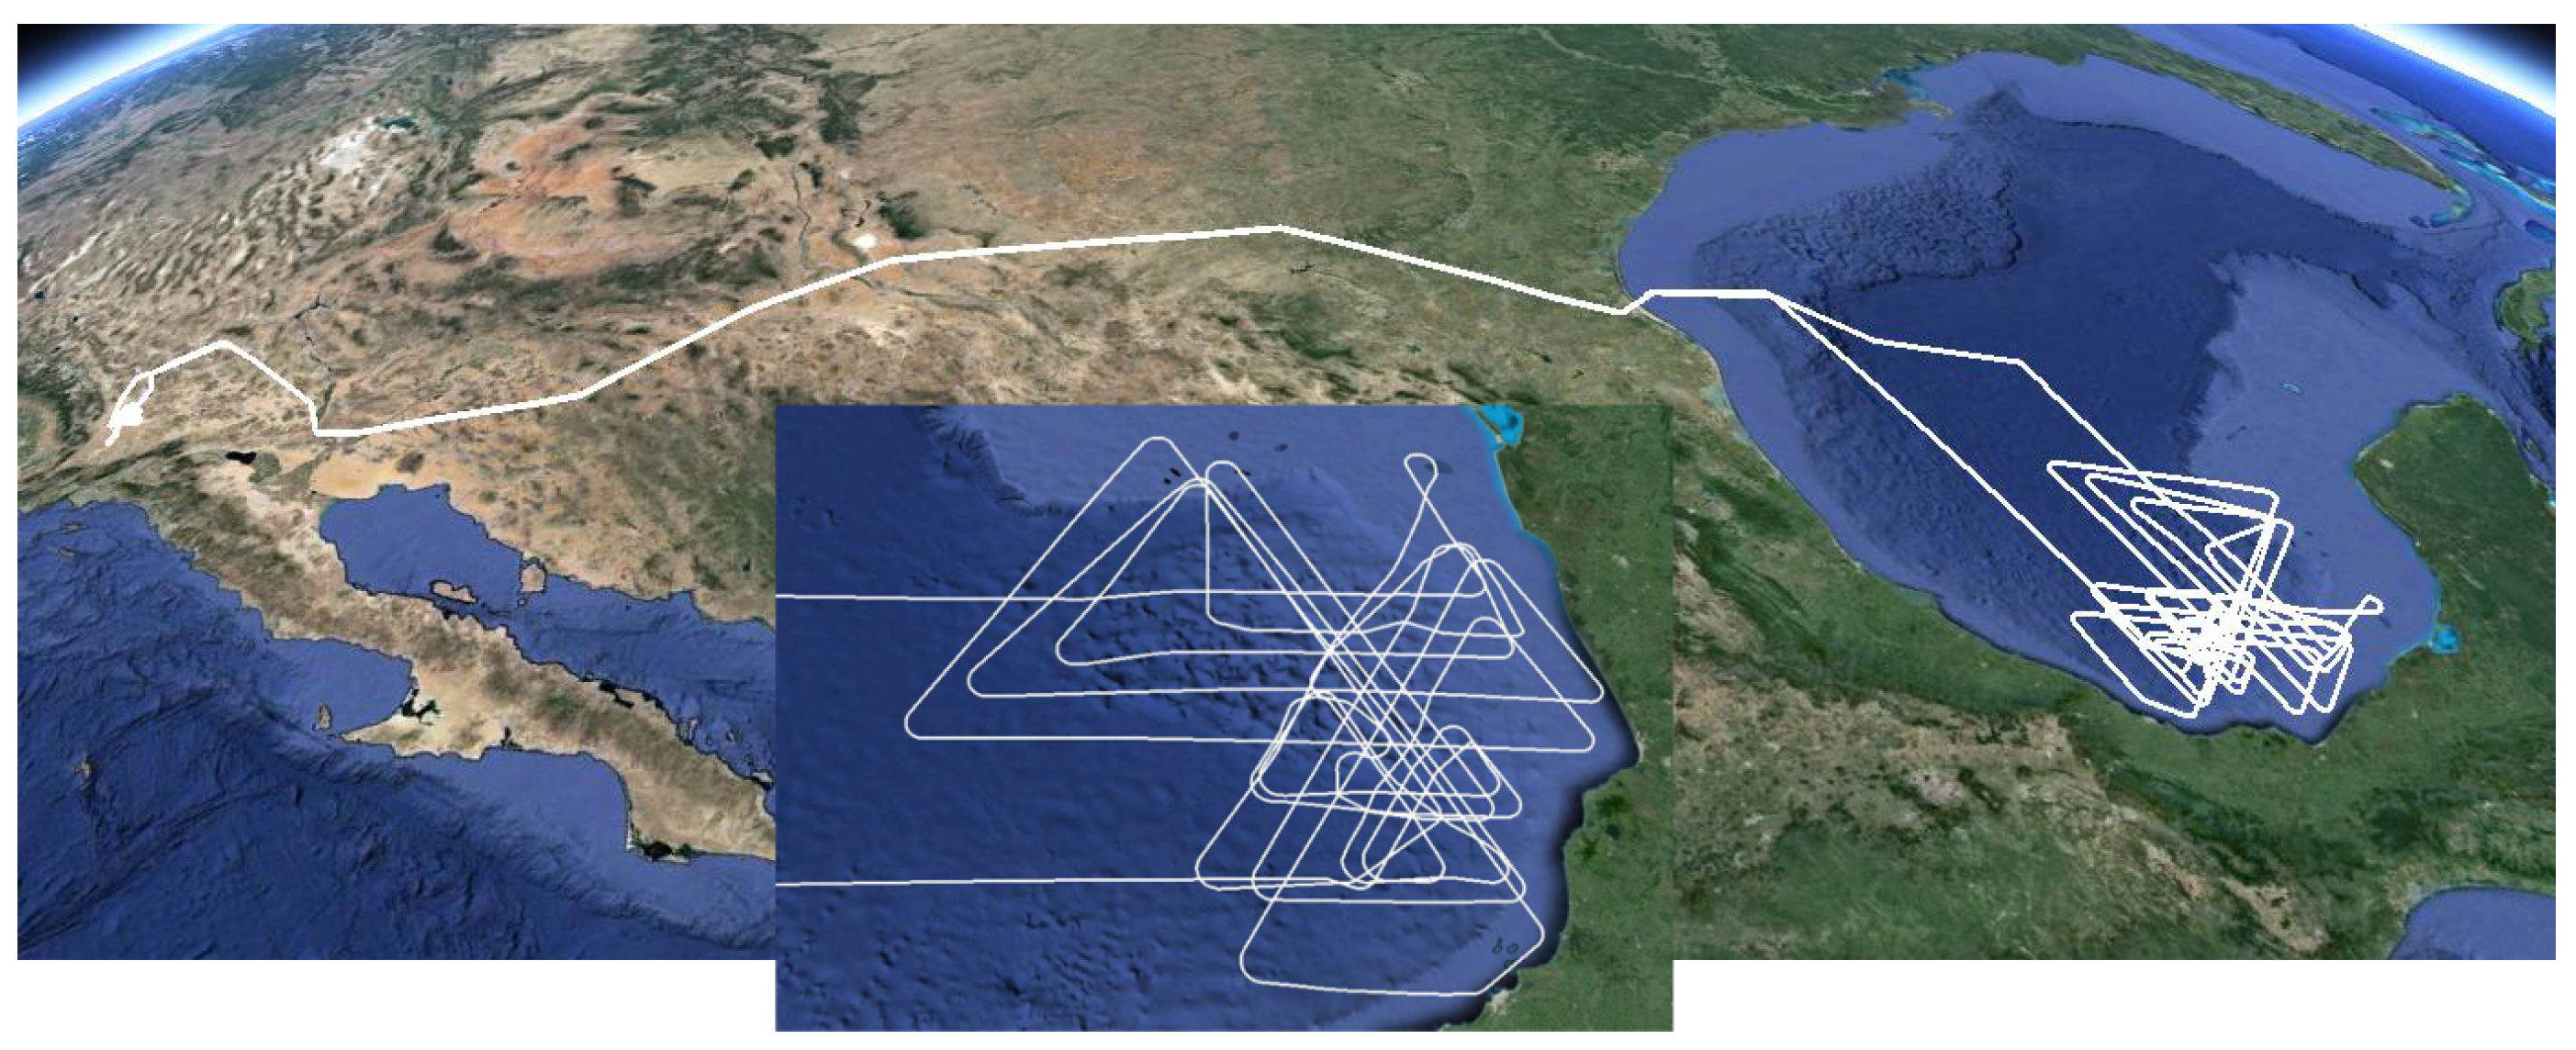
Figure 3.
(a) NS872 take-off and (b) initial climb performance for Mission 872-0060.

Figure 4.
(a) NS872 climb up to cruise climb altitude and (b) cruise climb for Mission 872-0060. FL, Flight Level.
Figure 4.
(a) NS872 climb up to cruise climb altitude and (b) cruise climb for Mission 872-0060. FL, Flight Level.

Figure 5.
NS872 descent performance for Mission 872-0060.
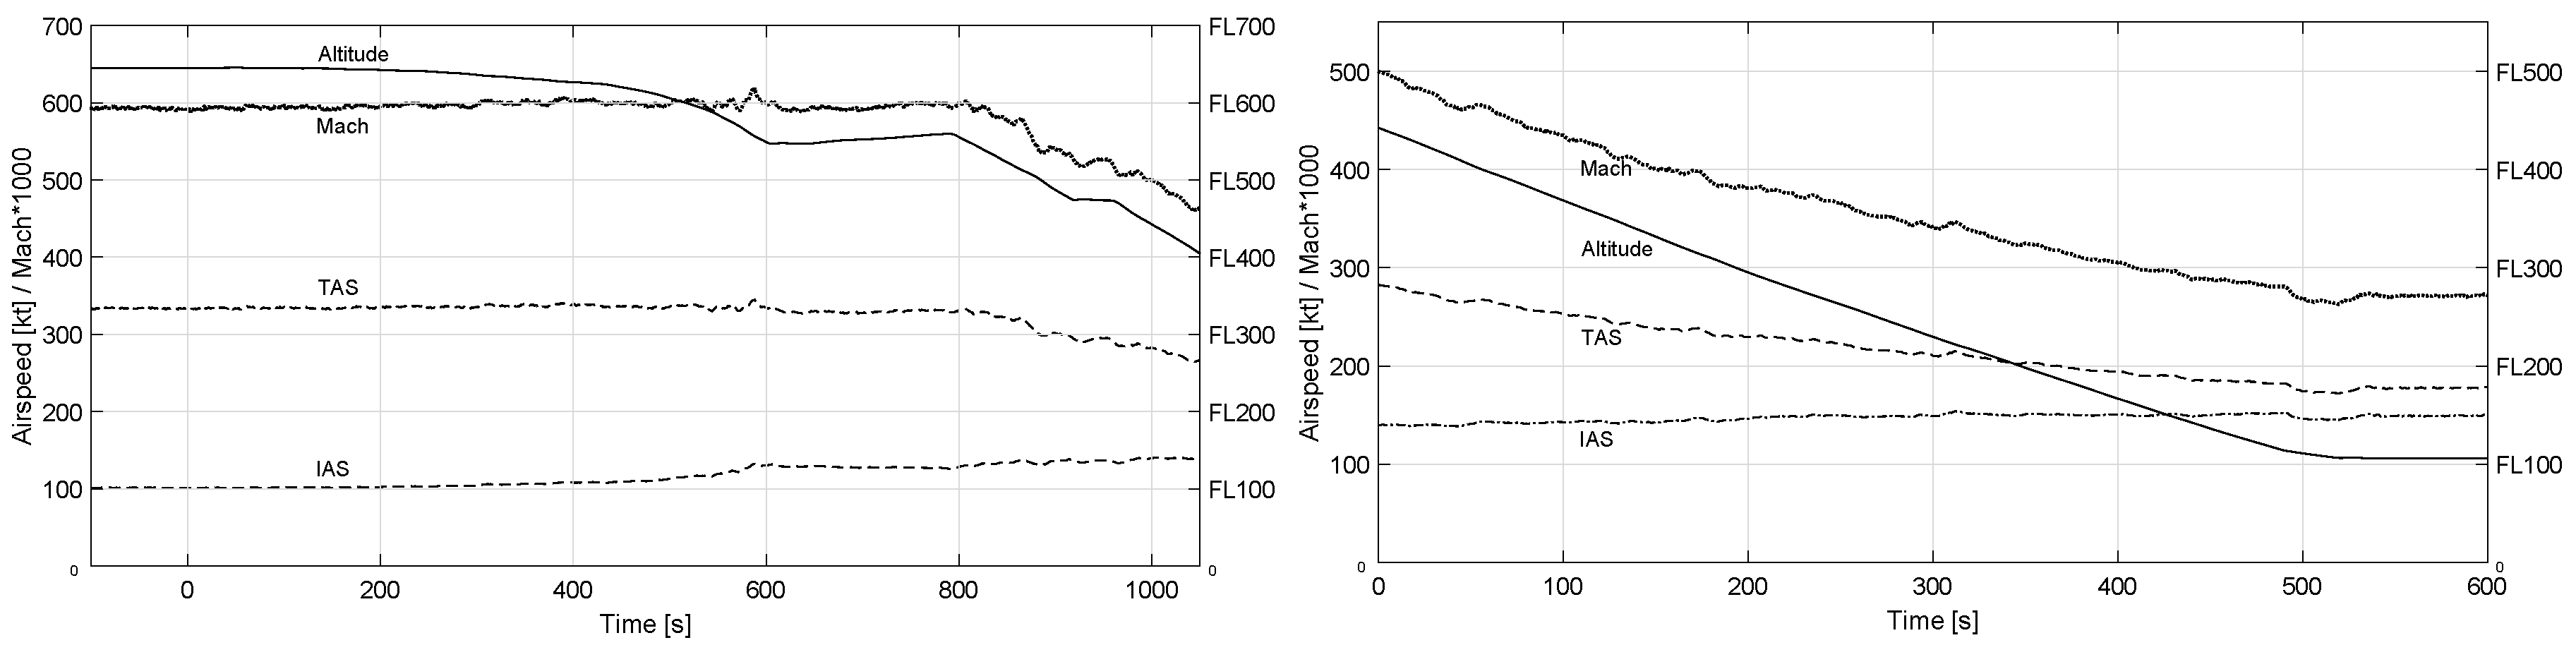
Figure 6.
NS872 final landing path for Mission 872-0060.
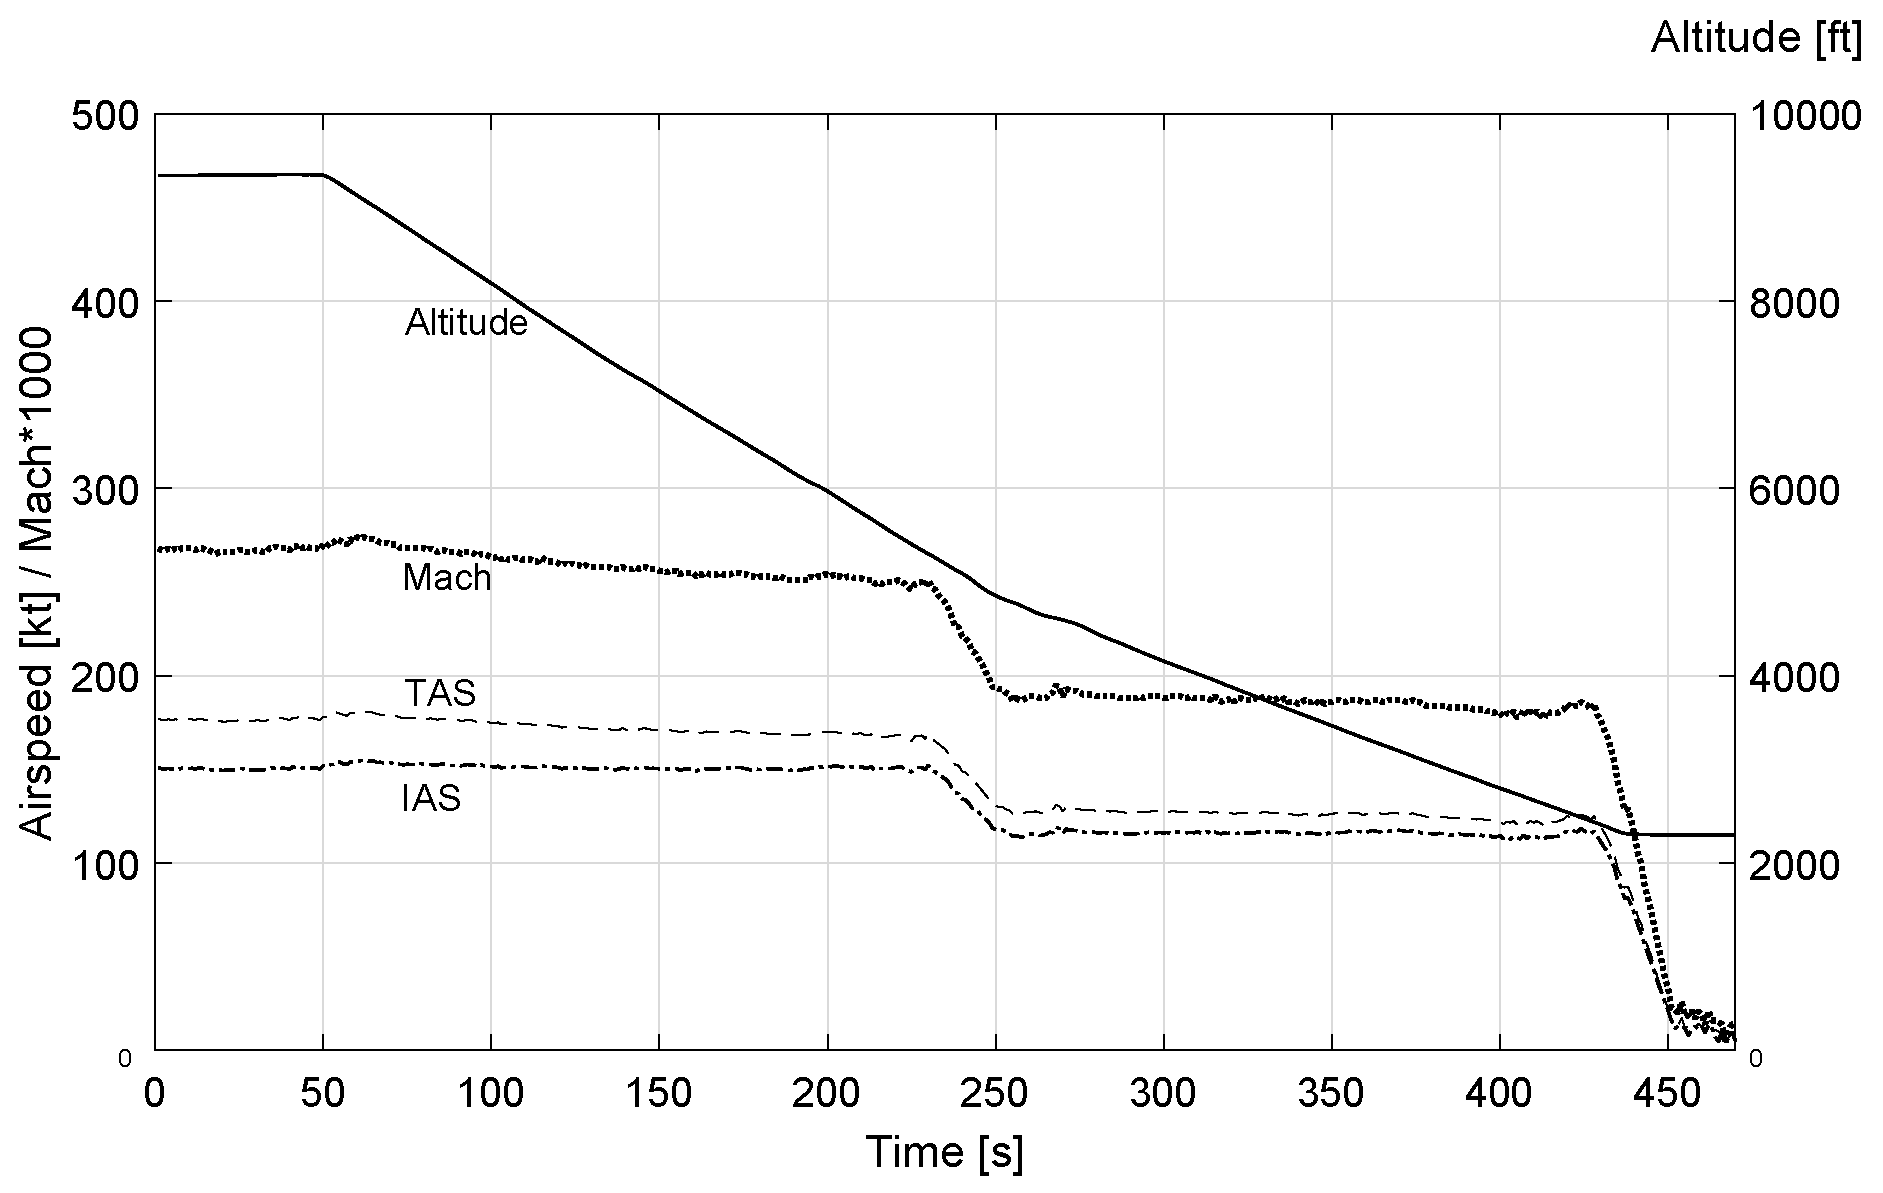
Figure 7.
NS872 back angle overview along Mission 872-0060.

Figure 8.
Box plot analysis for IAS speed during climb and descent operations.
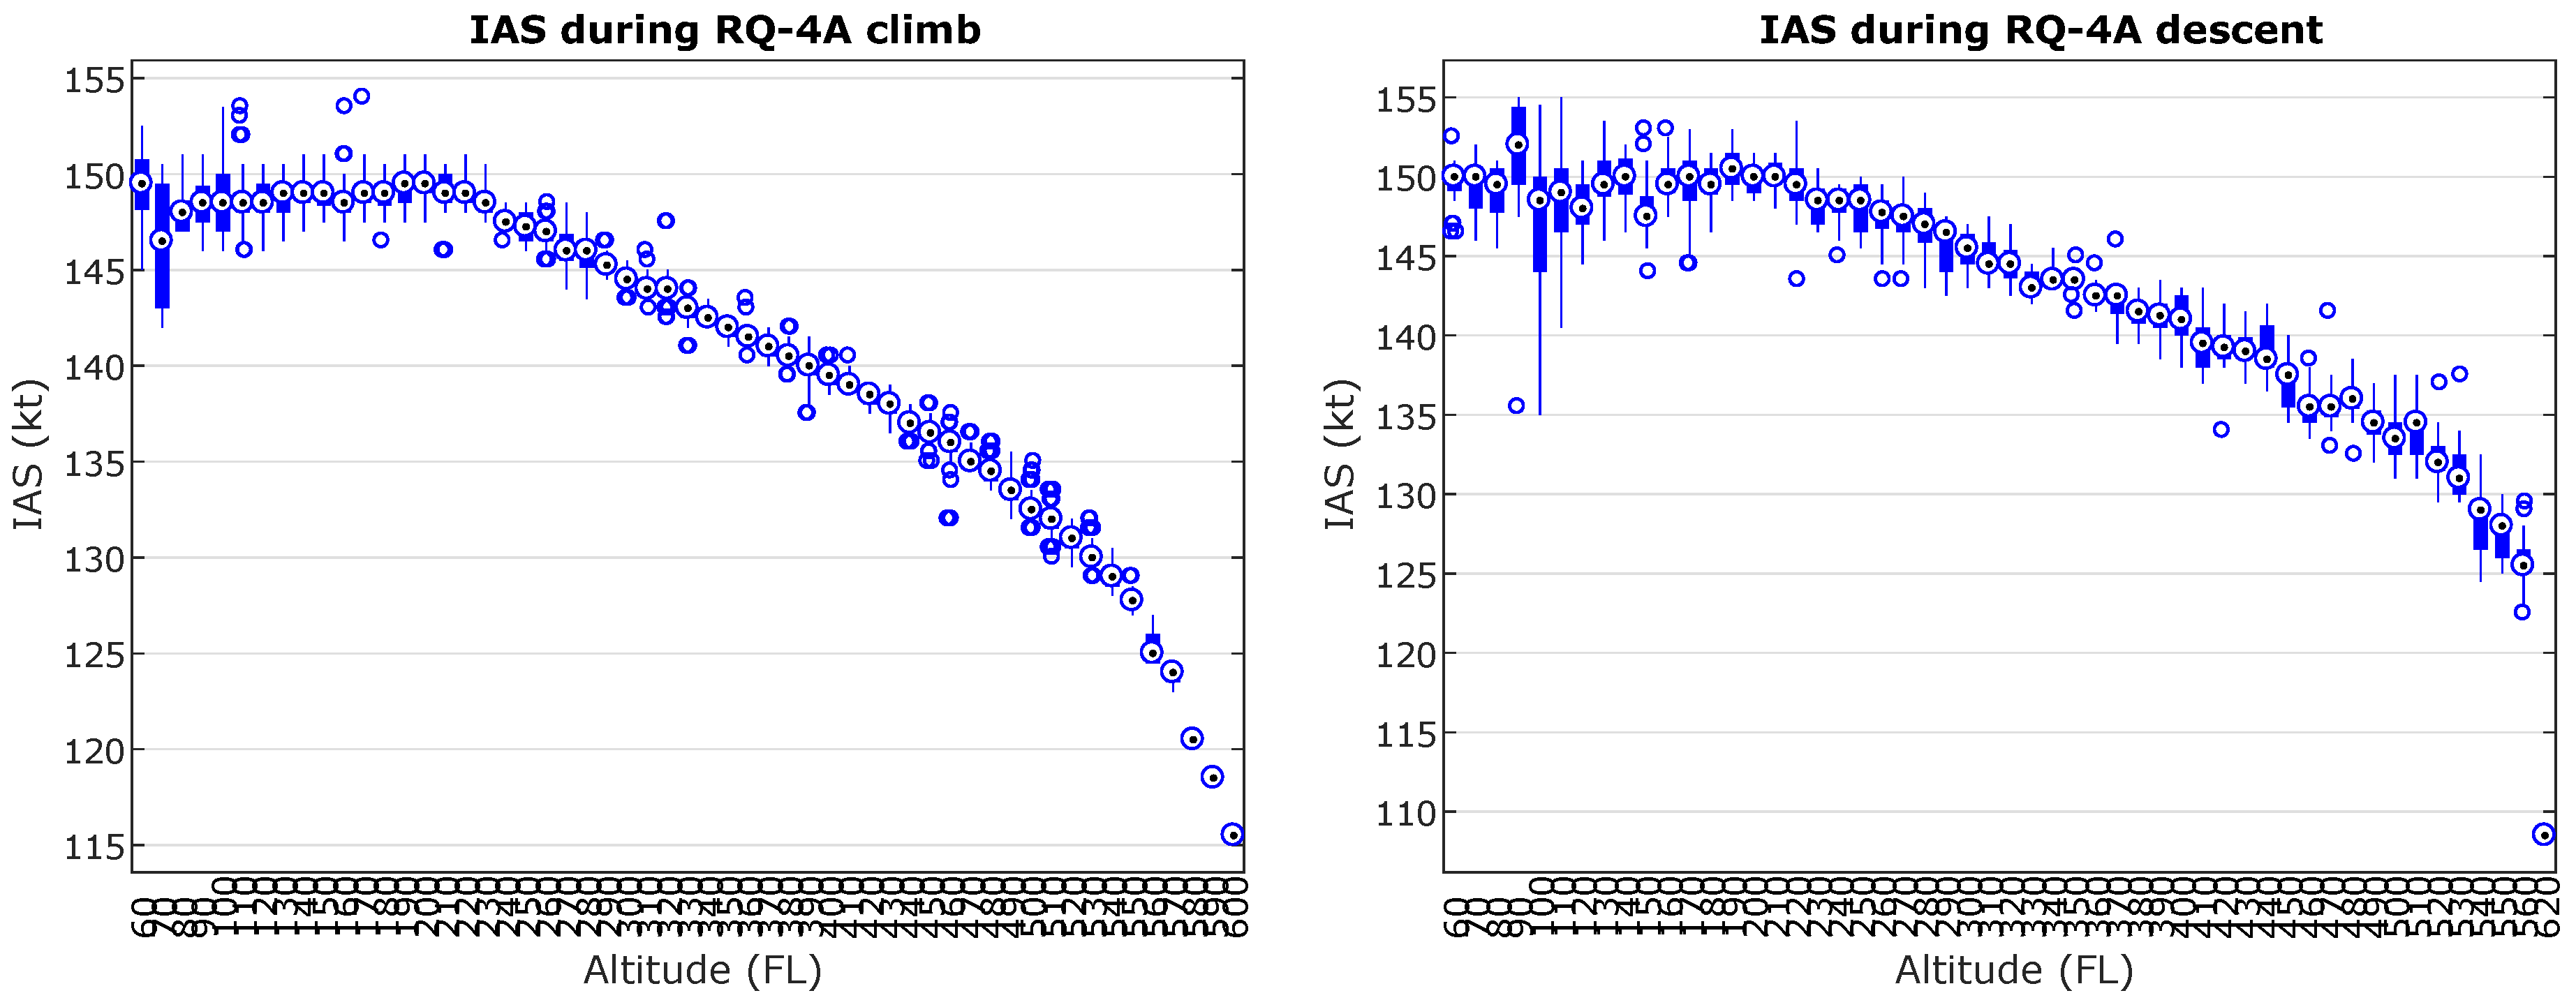
Figure 9.
Box plot analysis for Mach speed during climb and descent operations.

Figure 10.
Box plot analysis for vertical rate during climb and descent operations.

Figure 11.
Simulated NS872 taking off from Oslo-Gardermoen airport and its high-altitude mission over the North Pole.
Figure 11.
Simulated NS872 taking off from Oslo-Gardermoen airport and its high-altitude mission over the North Pole.
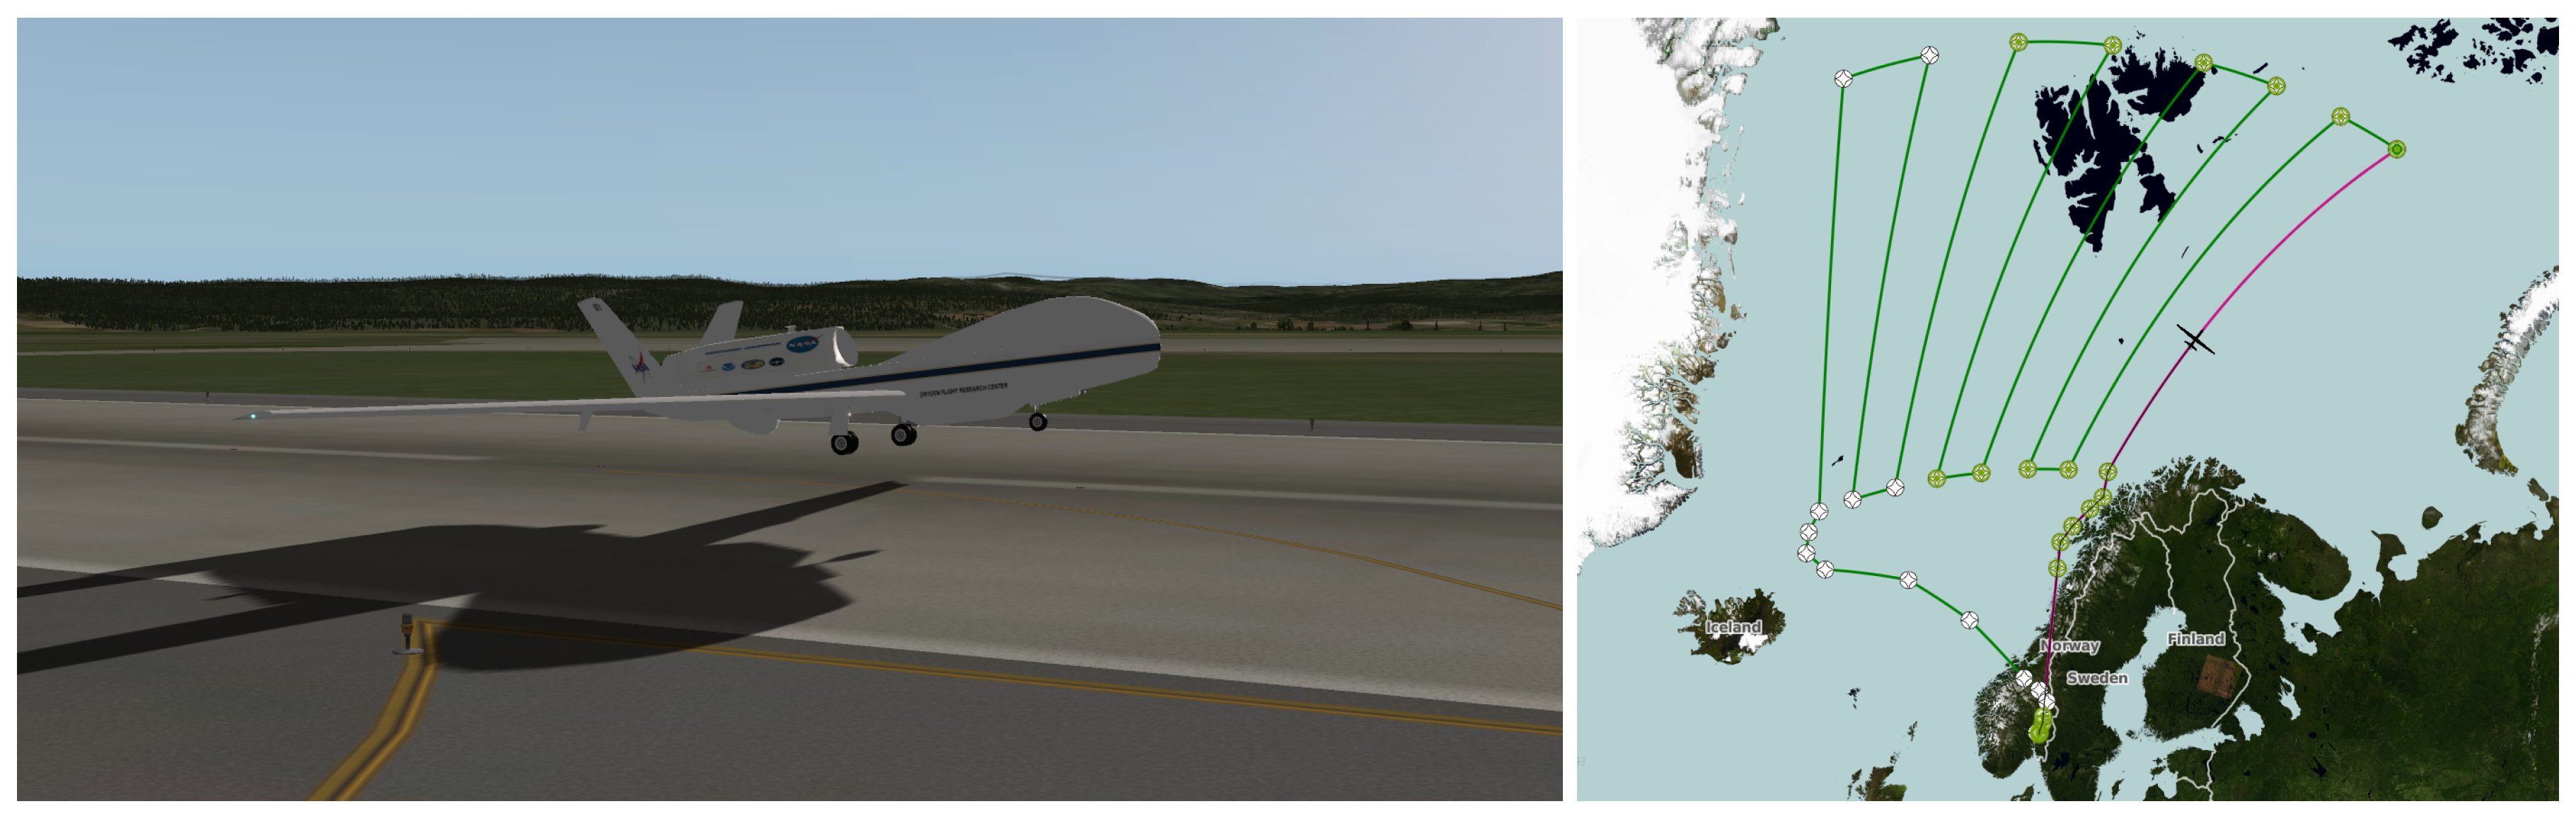
Figure 12.
Simulated RQ-4A climb/speed profile of a surveillance mission over the North Pole and descent profile back into Oslo-Gardermoen.
Figure 12.
Simulated RQ-4A climb/speed profile of a surveillance mission over the North Pole and descent profile back into Oslo-Gardermoen.
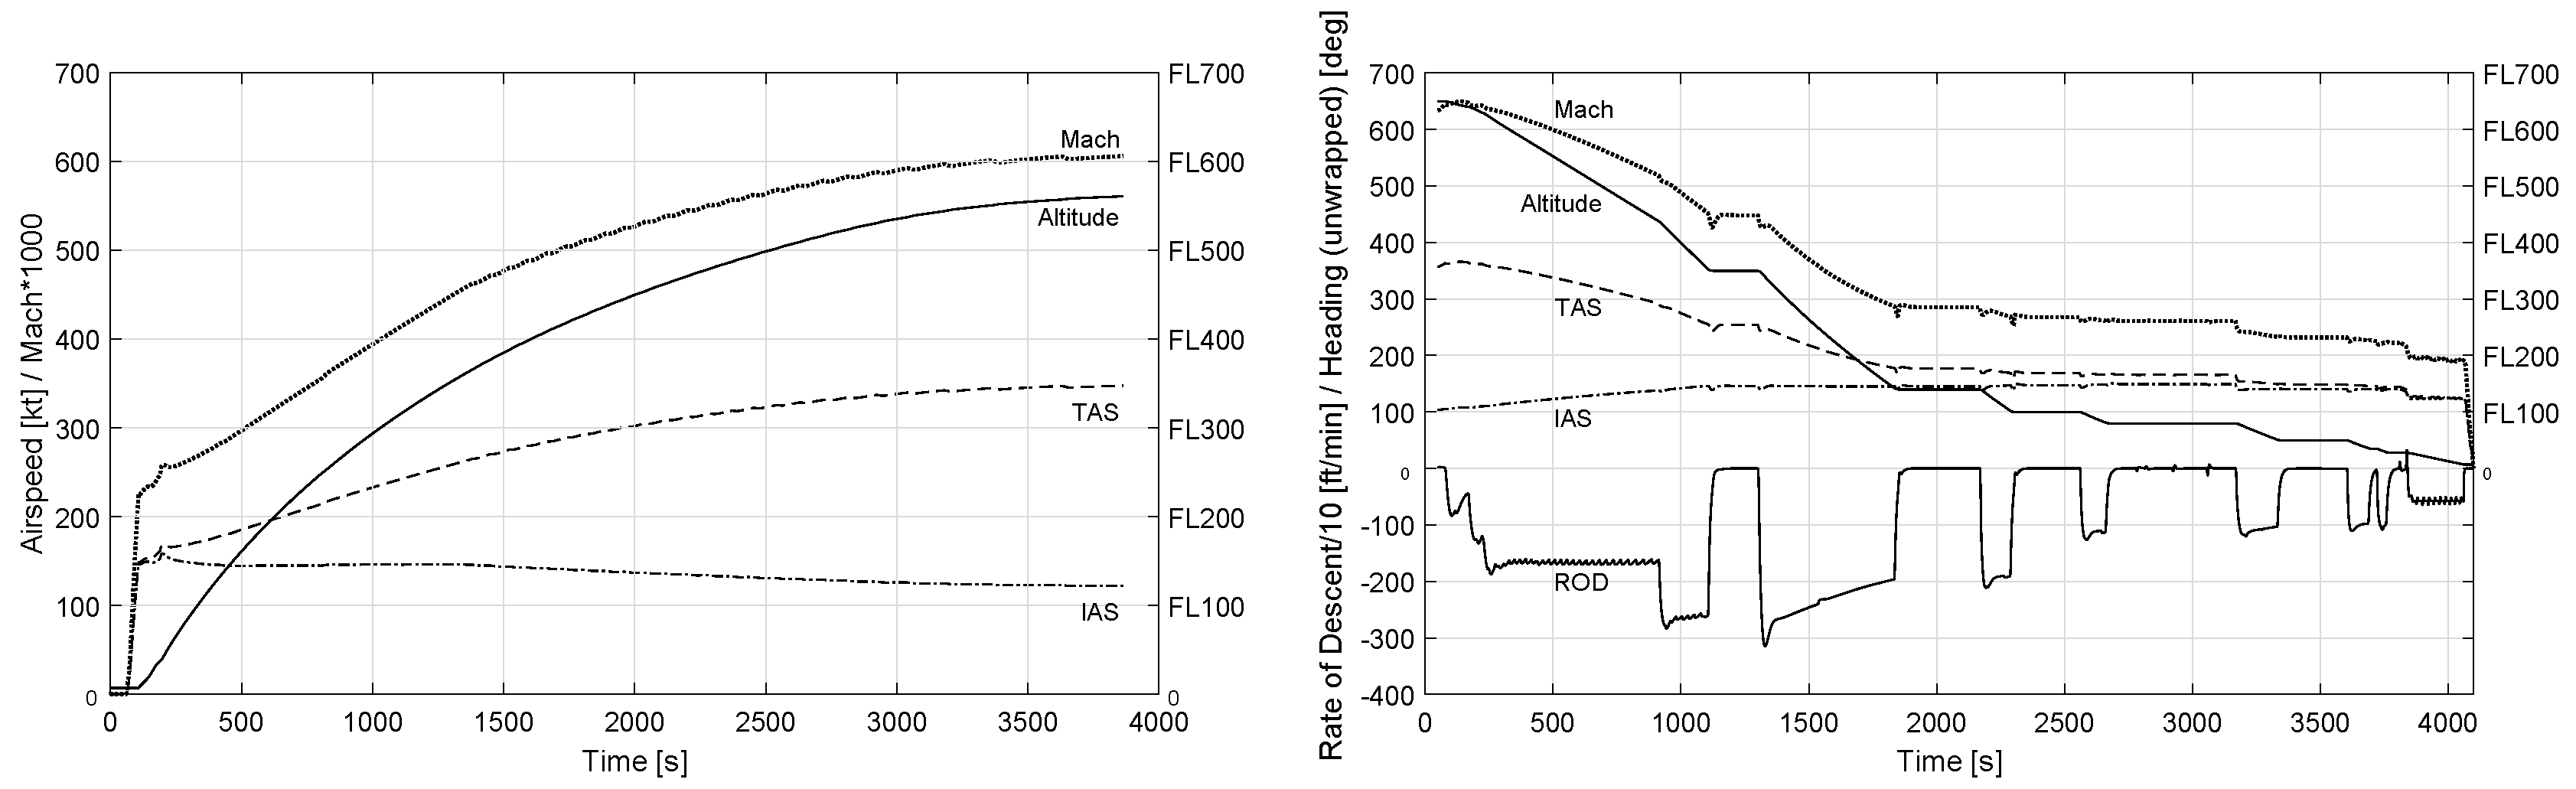
Figure 13.
Simulated NS872 turn profile back into Oslo-Gardermoen.


Table 1.
Global Hawk flight missions for the GRIP program in 2010.
| Sortie | Flight Date | Take-Off Time | Landing Time | Flight Hours |
|---|---|---|---|---|
| 872-0059 | Sat 08/28/2010 | 08/28/2010-12:53 | 08/29/2010-04:11 | 15.30 |
| 872-0060 | Wed 09/01/2010 | 09/01/2010-03:50 | 09/02/2010-04:01 | 24.20 |
| 872-0061 | Sun 09/12/2010 | 09/12/2010-11:30 | 09/13/2010-11:50 | 12.30 |
| 872-0062 | Thu 09/16/2010 | 09/16/2010-13:12 | 09/17/2010-14:26 | 24.20 |
Table 2.
Global Hawk total and partial climb rates for Mission 872-0060.
| Altitude Block (ft) | Climb Time (s) | Climb Rate (fpm) | |||
|---|---|---|---|---|---|
| Start | End | Total | Partial | Cumulative | Partial |
| 10,000 | 20,000 | 236.4 | 236.4 | 2538.07 | 2538.07 |
| 20,000 | 30,000 | 542.3 | 305.9 | 2212.7 | 1961.4 |
| 30,000 | 40,000 | 997.19 | 454.9 | 1805.0 | 1318.9 |
| 40,000 | 50,000 | 2160.2 | 1163.01 | 1111.0 | 515.9 |
| 50,000 | 55,000 | 4607.0 | 2446.8 | 586.06 | 122.6 |
Table 3.
Global Hawk total and partial climb rates for Mission 872-0062.
| Altitude Block (ft) | Climb Time (s) | Climb Rate (fpm) | |||
|---|---|---|---|---|---|
| Start | End | Total | Partial | Cumulative | Partial |
| 10,000 | 20,000 | 254.6 | 254.6 | 2356.6 | 2356.6 |
| 20,000 | 30,000 | 538.6 | 284 | 2227.9 | 2112.6 |
| 30,000 | 40,000 | 981.8 | 443.2 | 1833.3 | 1353.8 |
| 40,000 | 50,000 | 2106.8 | 1125 | 1139.1 | 533.3 |
| 50,000 | 55,000 | 4584.1 | 2477.3 | 588.9 | 121.1 |
Table 4.
Global Hawk cruise climb rates for Missions 872-0060 and 872-0062.
| Total Time (min) | Altitude (ft) | Climb Rate (fpm) | |||
|---|---|---|---|---|---|
| 872-0060 | 872-0062 | 872-0060 | 872-0062 | 872-0060 | 872-0062 |
| 83.3 | 57.0 | 56,250.0 | 56,382.9 | 75.0 | 111.9 |
| 250.0 | 223.7 | 57,500.0 | 57,446.8 | 7.5 | 6.38 |
| 416.7 | 390.4 | 59,375.0 | 58,297.8 | 11.25 | 5.10 |
| 583.3 | 557.1 | 60,750.0 | 60,000.0 | 8.25 | 10.21 |
| 750.0 | 723.8 | 62,000.0 | 61,276.6 | 7.5 | 7.65 |
| 916.6 | 890.5 | 62,916.6 | 62,340.4 | 5.5 | 6.38 |
| 1083.3 | 1057.2 | 63,333.3 | 63,510.6 | 2.5 | 7.01 |
| 1250.0 | 1223.9 | 63,750.0 | 64,468.0 | 2.5 | 5.74 |
Table 5.
Global Hawk turn rates and bank angles for Mission 872-0060.
| Altitude (ft) | TAS (kt) | Turn Rate (deg/s) | Bank Angle (deg) |
|---|---|---|---|
| 3764.7 | 157.8 | 2.71 | 21.3 |
| 6294.1 | 167.1 | 2.38 | 20.0 |
| 7705.8 | 170.3 | 2.24 | 19.2 |
| 16,176.4 | 192.9 | 1.87 | 18.2 |
| 26,973.6 | 223.6 | 1.5 | 17.0 |
| 35,000.0 | 247.3 | 1.26 | 15.9 |
| 39,210.5 | 264.0 | 1.15 | 15.5 |
| 51,709.4 | 315.9 | 0.88 | 14.2 |
| 53,846.1 | 326.1 | 0.88 | 14.7 |
| 63,137.2 | 337.5 | 0.86 | 14.8 |
Table 6.
Global Hawk climb time for the real and simulated RQ-4A.
| Climb to | Time (min) | |
|---|---|---|
| Simulated | Real | |
| FL180 | 7.8 | 6.6 |
| FL210 | 9.7 | 8.3 |
| FL250 | 12.6 | 9.8 |
| FL340 | 19.5 | 15.0 |
| FL420 | 29.5 | 21.6 |
| FL500 | 45.6 | 38.3 |
| FL520 | 51.0 | 46.6 |
| FL540 | 63.0 | 63.3 |
| FL570 | 3.9 (h) | 3.6 (h) |
| FL600 | 7.8 (h) | 8.9 (h) |
Table 7.
Global Hawk cruise speed and climb rates for the real and simulated RQ-4A.
| Altitude Range | Real | Simulated | ||
|---|---|---|---|---|
| Climb Rate (fpm) | TAS (kt) | Climb Rate (fpm) | TAS (kt) | |
| 2500–5000 | 2400–2500 | 156–165 | 2600–2900 | 150–166 |
| FL100–FL200 | 2400–2500 | 177–205 | 1750–2400 | 170–197 |
| FL200–FL300 | 1900–2100 | 205–230 | 1265–1750 | 197–235 |
| FL300–FL400 | 1300–1400 | 230–265 | 932–1265 | 235–280 |
| FL400–FL500 | 500–550 | 265–310 | 500–932 | 280–324 |
| FL500–FL550 | 120–125 | 310–330 | 170–500 | 324–345 |
| FL550–FL560 | 50–120 | 330–330 | 69–170 | 345–347 |
| FL560–FL650 | 2–10 | 330–335 | 12–69 | 347–349 |
© 2018 by the authors. Licensee MDPI, Basel, Switzerland. This article is an open access article distributed under the terms and conditions of the Creative Commons Attribution (CC BY) license (http://creativecommons.org/licenses/by/4.0/).
Share and Cite
MDPI and ACS Style
Pastor, E.; Pérez-Batlle, M.; Barrado, C.; Royo, P.; Cuadrado, R. A Macroscopic Performance Analysis of NASA’s Northrop Grumman RQ-4A. Aerospace 2018, 5, 6. https://doi.org/10.3390/aerospace5010006
AMA Style
Pastor E, Pérez-Batlle M, Barrado C, Royo P, Cuadrado R. A Macroscopic Performance Analysis of NASA’s Northrop Grumman RQ-4A. Aerospace. 2018; 5(1):6. https://doi.org/10.3390/aerospace5010006
Chicago/Turabian StylePastor, Enric, Marc Pérez-Batlle, Cristina Barrado, Pablo Royo, and Raúl Cuadrado. 2018. "A Macroscopic Performance Analysis of NASA’s Northrop Grumman RQ-4A" Aerospace 5, no. 1: 6. https://doi.org/10.3390/aerospace5010006
Note that from the first issue of 2016, this journal uses article numbers instead of page numbers. See further details here.