Prediction of Heat Transfer in a Jet Cooled Aircraft Engine Compressor Cone Based on Statistical Methods

Karlsruhe Institute of Technology (KIT), Institut für Thermische Strömungsmaschinen (ITS), 76131 Karlsruhe, Germany
*
Author to whom correspondence should be addressed.
Aerospace 2018, 5(2), 51; https://doi.org/10.3390/aerospace5020051
Submission received: 17 February 2018
/
Revised: 12 April 2018
/
Accepted: 16 April 2018
/
Published: 1 May 2018
(This article belongs to the Special Issue Secondary Air Systems in Gas Turbine Engines)
Abstract
:The paper presents the setup and analysis of an experimental study on heat transfer of a jet cooled compressor rear cone with adjacent conical housing. The main goal of the paper is to describe the systematic derivation of empirical correlations for global Nusselt numbers to be used in the design process of a jet engine secondary air system. Based on the relevant similarity parameters obtained from literature, operating points are deduced leading to a full factorial design experiment to identify all effects and interactions. The varied similarity parameters are the circumferential Reynolds number, the non-dimensional mass flow, the non-dimensional spacing between rotor and stator, and the jet incidence angle. The range of the varied similarity parameters covers engine oriented operating conditions and is therefore suitable to predict Nusselt numbers in the actual engine component. In order to estimate measurement uncertainties, a simplified model of the test specimen, consisting of a convectively cooled flat plate, has been derived. Uncertainties of the measured quantities and derived properties are discussed by means of a linear propagation of uncertainties. A sensitivity study shows the effects of the input parameters and their interactions on the global Nusselt number. Subsequently, an empirical correlation for the global Nusselt numbers is derived using a multivariate non-linear regression. The quality of the empirical correlation is assessed by means of statistical hypotheses and by a comparison between measured and predicted data. The predicted values show excellent agreement with experimental data. In a wide range, accuracies of 15% can be reached when predicting global Nusselt numbers. Furthermore, the results of the sensitivity study show that pre-swirled cooling air does not have a positive effect on heat transfer.
1. Introduction
Increasing the efficiency and decreasing pollutant emissions is the main goal in developing future jet engines. A promising way to reach higher efficiencies is to realise higher engine pressure ratios. While currently pressure ratios of approximately 40 are state of the art, future jet engines will be able to reach pressure ratios of 60 and higher [1]. Among others, this entails rising fluid temperature at the high pressure compressor outlet. In order to guarantee structural and thermal integrity of the compressor rotor, cooling of the compressor becomes necessary. Jet cooling of the compressor rear cone, which can be found between the last stage of the high-pressure compressor and the high-pressure shaft, is a possible concept to decrease the occurring thermal and structural loads and thus to increase lifetime. Cooling air can be taken from the inner diffusor upstream the combustion chamber and the high pressure turbine and led through a heat exchanger (for a possible air cooling concept, see [2]). Afterwards, the cooling air enters the rotor-stator cavity through an array of nozzles and flows radially inwards towards the high pressure shaft. A more detailed description of the cooling assembly is given in [3,4]. In order to design an efficient cooling system, detailed knowledge on the heat transfer between the rotor-stator cavity and the rotor is necessary. As no literature is available for jet cooling of a rotating cone, a test rig was developed at the Institut für Thermische Strömungsmaschinen (ITS) at Karlsruhe Institute of Technology (KIT) [4] and experiments were conducted, covering a wide range of engine conditions. Furthermore, CFD studies [3] were carried out to identify fundamental effects concerning heat transfer and fluid friction in advance. Main objectives are the reduction of the total relative temperature of the cooling air, and an efficient cooling of the rotor structure with respect to reduced frictional heating and increased heat transfer.
In jet engines, fluid dynamics and heat transfer in cavities between rotating and stationary parts are of huge interest. A comprehensive literature overview of current research on rotor-stator and rotor-rotor cavities is given in [5,6,7]. However, discoidal rotor-stator systems with or without superposed flow are the most common configurations. Therefore, heat transfer and aerodynamics in discoidal rotor-stator systems have been intensively investigated in the past. A detailed summary of the theory and a detailed literature survey was published by Owen and Rogers [8].
Conical rotor-stator systems were hardly investigated in the past. To the authors’ knowledge, a single experimental heat transfer study of Alexiou et al. [9] exists, where Nusselt numbers on a jet engine compressor rear cone without adjacent casing were determined. However, aerodynamic studies on enclosed cylinders, cones, and discs with constant gap width were performed by Wimmer and Zierep [10]. For sufficiently high rotational velocities and cone angles, results for the conical rotor-stator configuration show a flow regime similar to that found in the discoidal one. A detailed numerical and experimental study of the flow field in a compressor rear cone at large relative spacing is presented in [11]. For no superposed flow the authors find a similar flow structure of the conical rotor-stator system and a discoidal one. With regard to the present case with high rotational velocities and a medium cone angle of , the aerodynamic and heat transfer are expected to be similar to those of a discoidal rotor-stator system.
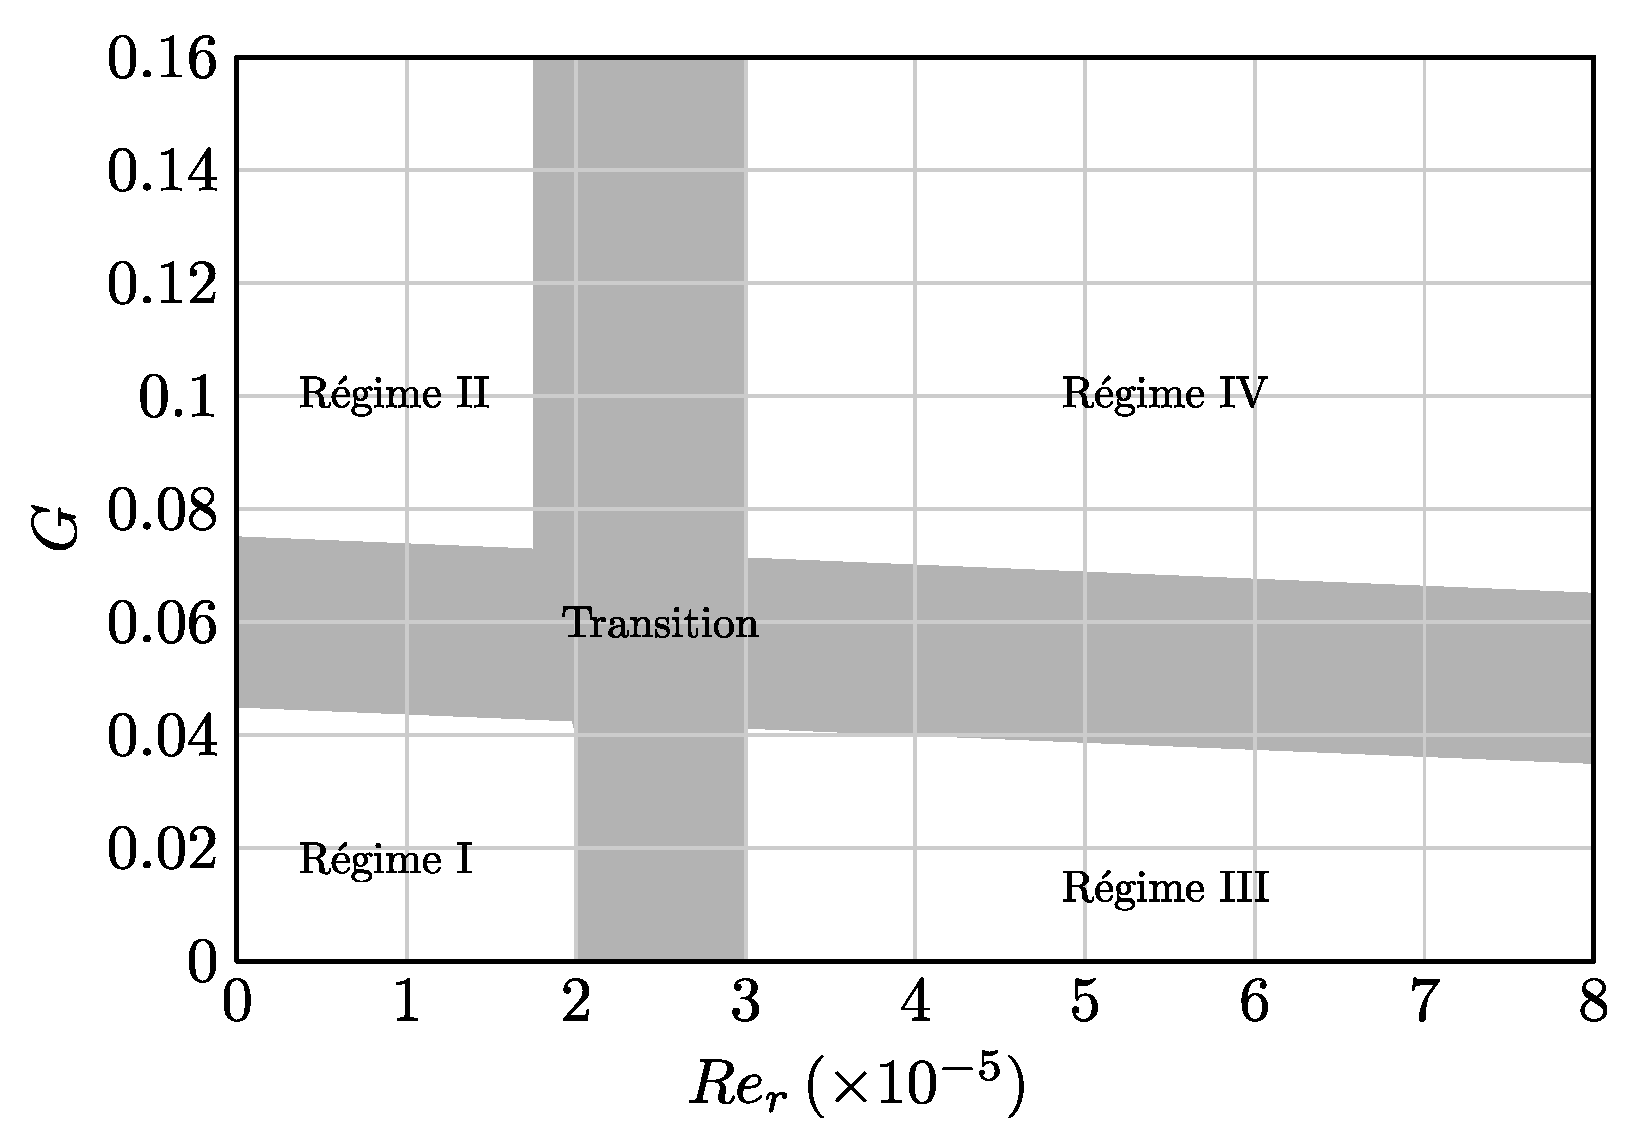
Heat transfer results for a discoidal rotor-stator system without superposed flow were first published by Dorfman [12]. In accordance with the torque measurements of Daily and Nece [13], four heat transfer regimes were found depending on the circumferential Reynolds number and the relative spacing between rotor and stator. In Figure 1 the heat transfer results from Pellé and Harmand [14] for an open discoidal rotor-stator system without a superposed flow of air are depicted. For low circumferential Reynolds numbers and a low relative spacing between rotor and stator, laminar flow with merged rotor and stator boundary layer occurs. Based on the aerodynamic results of Owen and Rogers [8], Daily and Nece [13], surface averaged Nusselt numbers can be derived [14] yielding
for regime I. With increasing spacing between rotor and stator the boundary layers separate and an inviscid core between the rotor and stator boundary layer exists (regime II). Nusselt numbers can be correlated by
for regime II. For low relative spacing and increasing circumferential Reynolds numbers, a transition from laminar to turbulent flow (regime III) occurs. In this region, the global Nusselt number
increases with decreasing relative spacing and with increasing circumferential Reynolds number . Another transition to regime IV can be observed for turbulent flow with increasing relative spacing. Similar to regime II, boundary layers are separated at high relative spacing leading to the Nusselt number correlation
Due to the high circumferential Reynolds number and the low relative spacing, regimes III and IV are likely to occur in the presented rotor-stator system.
For the present case of a rotor-stator system with a superposed radial inflow, only a few heat transfer studies are available. Those in a radial turbine of Mitchell and Metzger [15] show a dependency of the global Nusselt number on the mass flow , the spacing , and the circumferential Reynolds number . Recent experimental results by Djaoui et al. [16] reveal a large effect of the inflow conditions on the stator Nusselt number of a discoidal rotor-stator system with superposed inflow.
Planning experiments and analysing data [17] by using statistical methods are sparsely found in literature, as most authors compare their results to well-documented basic experiments and correlations. To get a first overview of the data and to identify the most important input parameters and interactions, statistical methods provide many ways to thoroughly characterize a physical problem. Therefore, the main goal of the present work is to derive empirical correlations to obtain global Nusselt numbers for a jet cooled conical rotor-stator cavity. The work especially focuses on the setup of the experiments using systematic statistical approaches. Fundamental physical effects will be discussed based on a sensitivity study.
In the first section of this work, the experimental procedure, the governing similarity parameters, and the parameter space are described. The subsequent section contains the discussion of the measurement uncertainty, and the influence of the predefined similarity parameters is discussed by means of a sensitivity study. Based on the observed effects and interactions, the actual derivation of correlations by using a multivariate regression is done. Finally, the suitable quality of the correlation is verified by a comparison between measured and predicted data.
2. Experimental Procedure
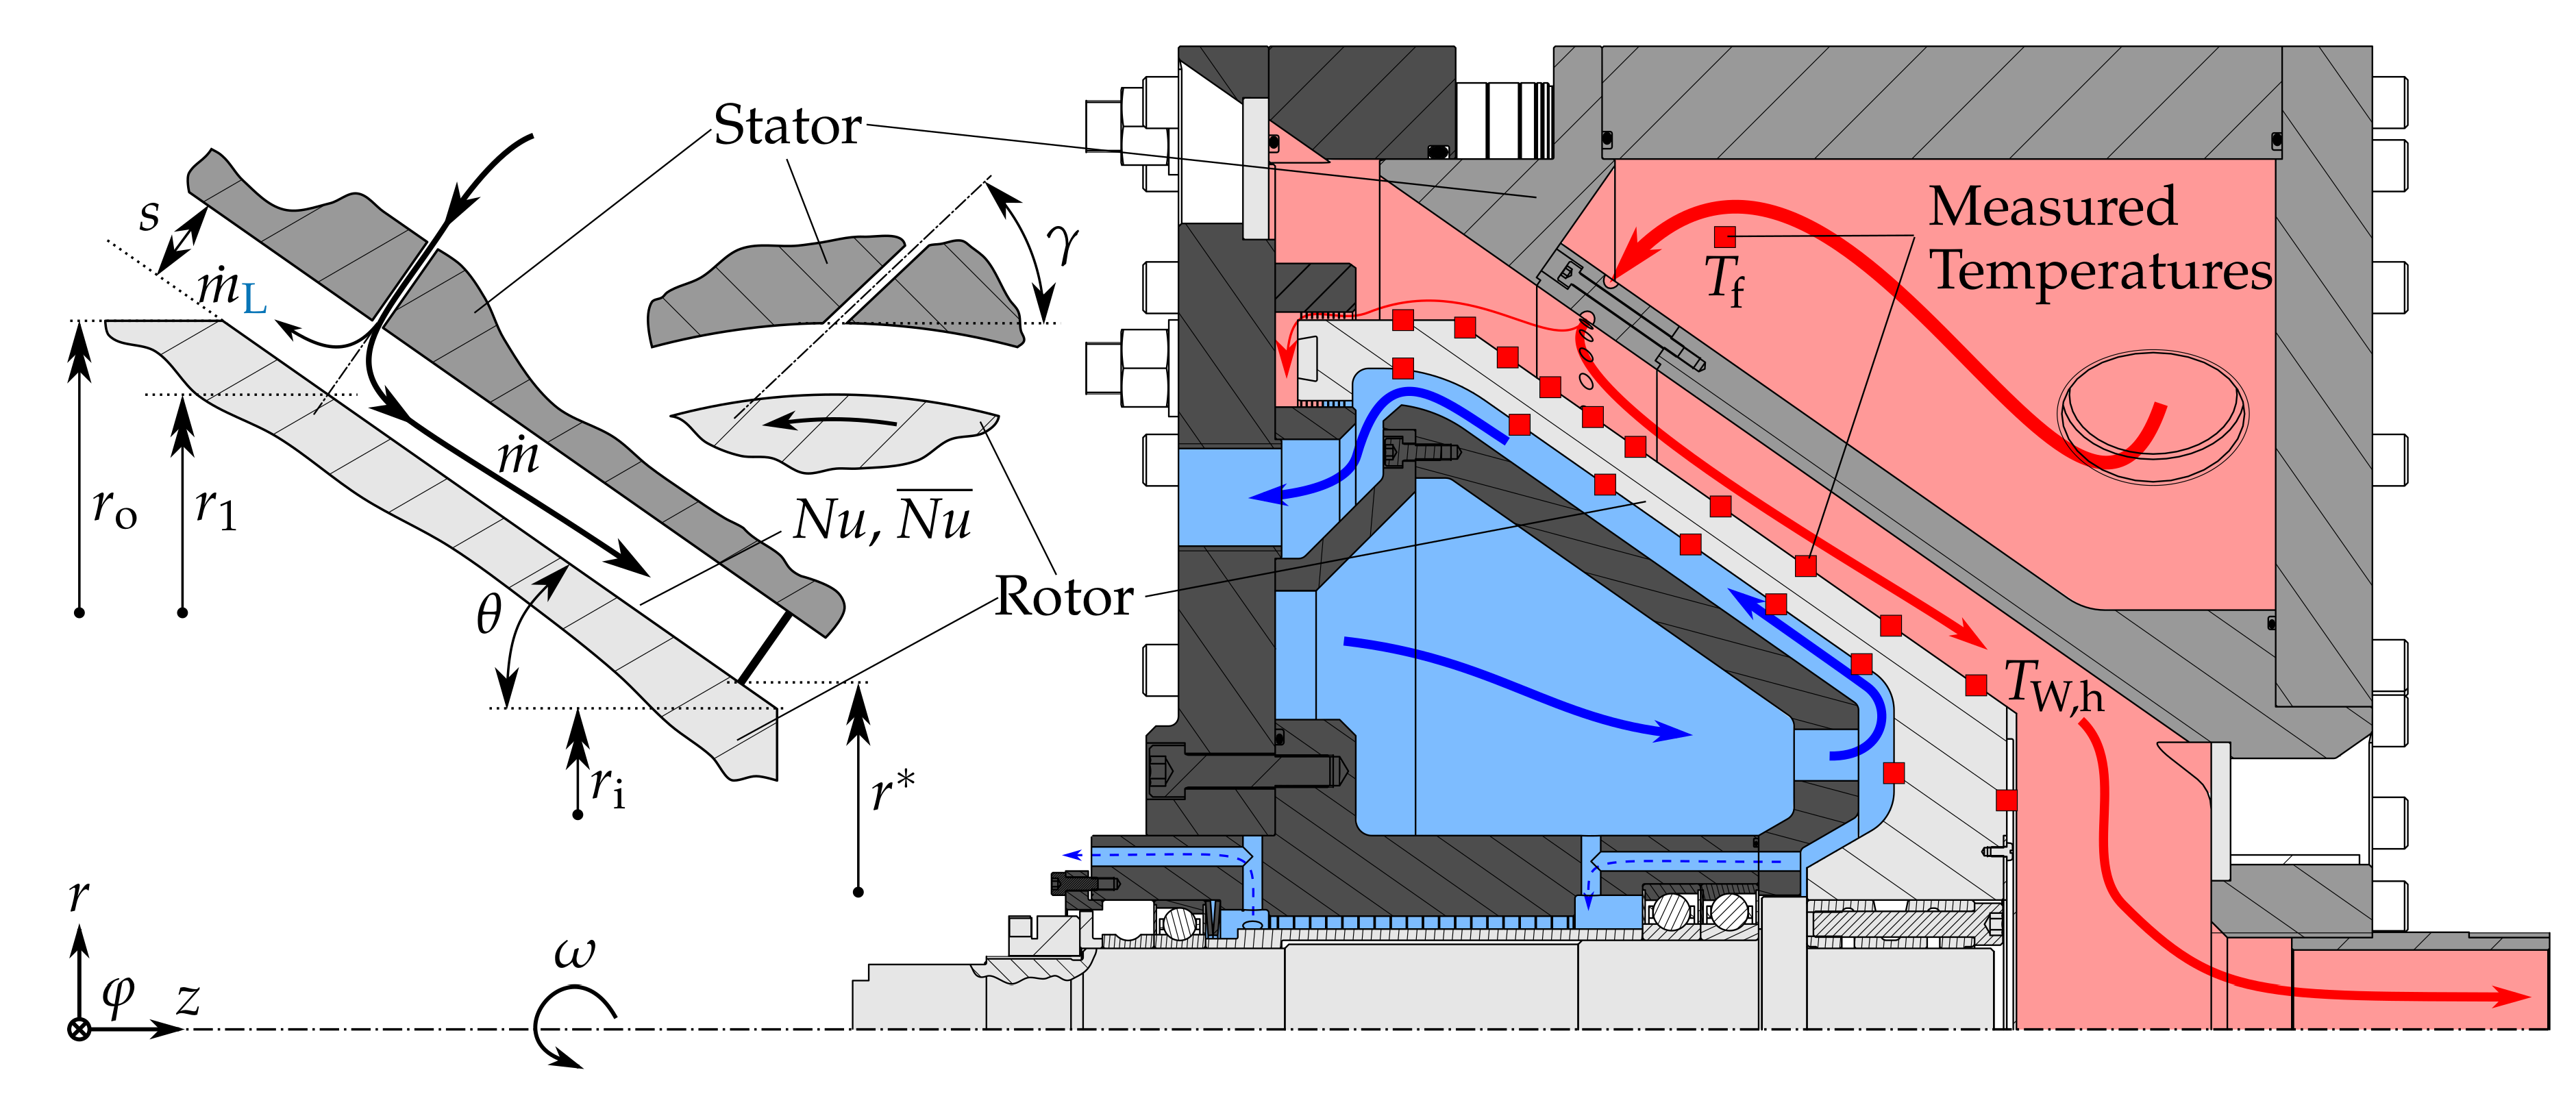
A brief description of the physical problem and the test rig setup will be given below; for further information on the test rig, refer to [4] and to Appendix A. The test rig setup is based on the generic rotor-stator system depicted in Figure 2. Jet cooling is realized by an array of 48 nozzles with incidence angle in order to achieve variable inflow conditions. In contrast to the real application and due to design restrictions, the rotor structure is heated by the incoming jet [3]. After entering the rotor-stator cavity, impinging the rotor surface at radius air flows radially inwards, while a small amount of leakage air flows radially outwards. The main air flow supplies heat to the rotor and leaves the cavity at radius . The locally supplied heat can be expressed by means of the local Nusselt number
depending on the characteristic length scale , the fluid thermal conductivity , the surface heat flux density , and the adiabatic wall temperature difference , where is the adiabatic wall temperature (see Appendix B). With respect to the dimensioning of a secondary air system, the total amount of heat transferred between the inlet at and the outlet of the rotor-stator system at is of main interest. Therefore, the global (or surface averaged) Nusselt number is defined [8] according to
where Equation (5) has been applied and the differential conical surface .
The main challenge of the experimental procedure is therefore to estimate the surface heat flux density based on the rotor surface temperatures of the inner and outer rotor surface (Figure 2, red squares). The temperature measurements are done by means of 28 K-type thermocouples from which 12 are located at the inner rotor surface and 16 at the outer rotor surface. Signal transmission between the rotating temperature sensors and the evaluation unit is done by a 28-channel telemetry unit. Measured temperatures are interpolated and set as boundary conditions of a two-dimensional, axisymmetric finite-element model of the rotor. Solving the heat equation for the rotor structure provides the surface heat flux density (see Appendix A). The results of the finite-element analysis are finally inserted into Equation (6) to calculate global Nusselt numbers.
The objective of the experimental work is to derive an empirical correlation for determining the global Nusselt number between the inlet of the rotor-stator system and the evaluation radius at the most inner measurement position next to the outlet radius , depicted in Figure 2. The evaluation radius has been chosen in order to avoid extrapolation of the measured data to the inner radius . The evaluation is based on the design parameters derived in the literature survey and is expected to have a significant effect on the global Nusselt number and is therefore discussed in the following section.
2.1. Design Parameters
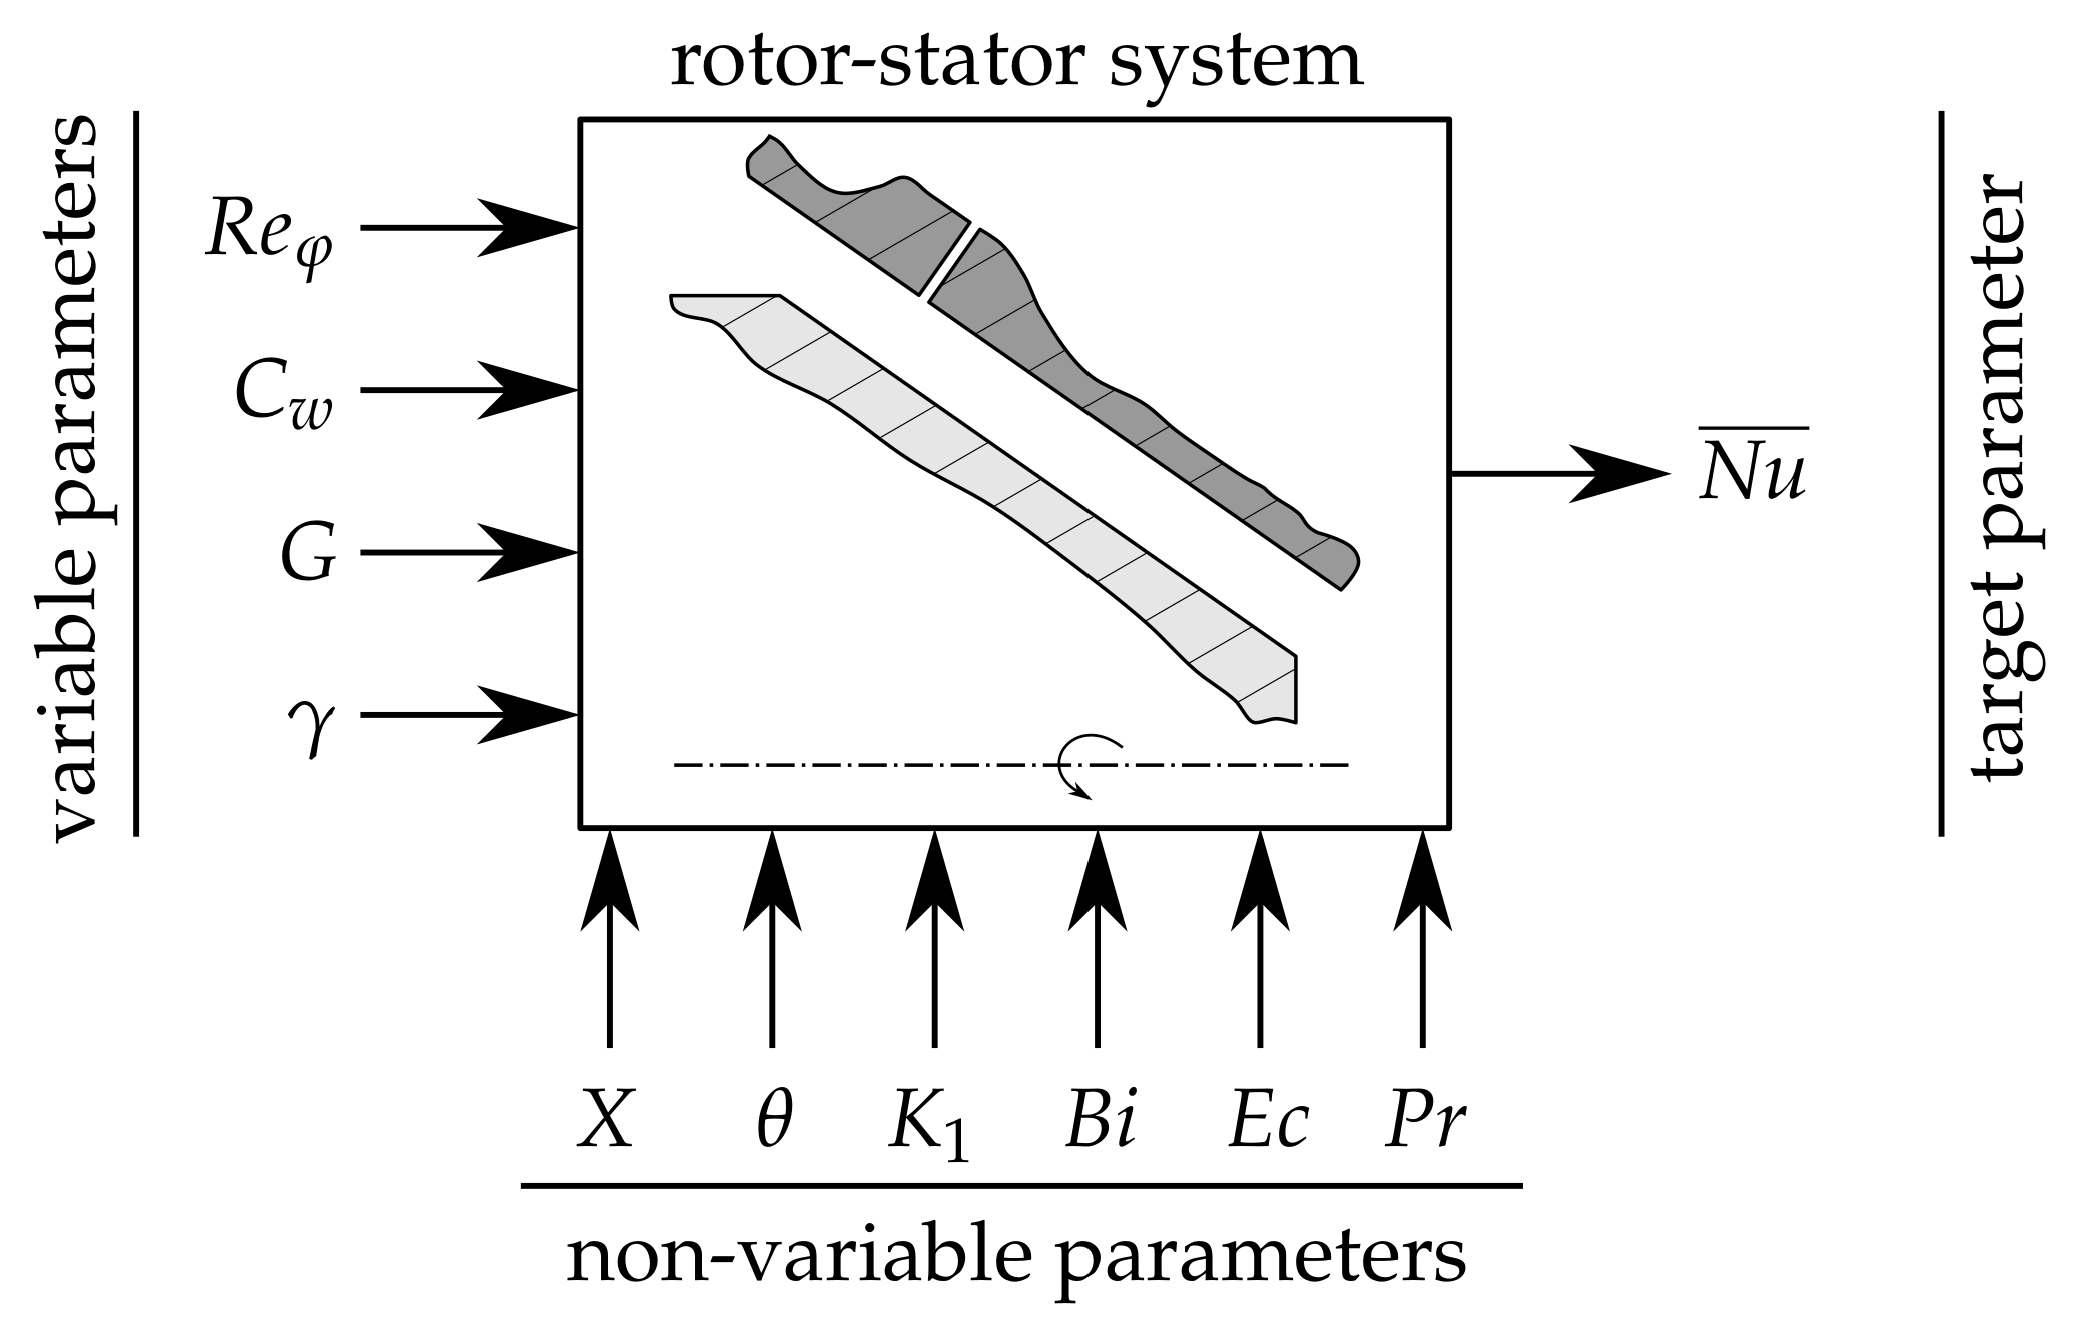
According to the heat transfer results of Mitchell and Metzger [15], the rotational velocity, the superposed mass flow, and the gap width have a major effect on the heat transfer in a rotor-stator gap with a radial inflow. Furthermore, the results of Pellé and Harmand [14] reveal a large effect of the inflow conditions. The inflow conditions mainly depend on the tangential velocity component of the gap inlet velocity which is a function of the incidence angle and the superposed mass flow. These properties are varied within the experimental study. Besides the variable parameters, there are several constant or dependent non-dimensional groups, denoted as non-variable parameters.
The design parameters varied during the test campaign are defined based on the design of a pre-swirl system of a rotor-stator assembly in a jet engine. For different engines, several non-dimensional gap widths between rotor and adjacent stator can be found. During operation, the rotational Reynolds number and the cooling air mass flow rate might change. In addition, the inflow conditions are mainly determined by the jet incidence angle and can be varied from no pre-swirl () to maximum pre-swirl (). A schematic of the experimental study and the variable and non-variable parameters is illustrated in Figure 3. The definitions of the non-dimensional groups and the parameter range realized in the study can be found in Table 1. For guidance, typical parameter ranges of jet engines are added. The data ranges are taken from literature [8,9,18] or are derived from authors’ calculations.
2.2. Design Parameter Space
With respect to the scope of this work, which is to identify the influence of similarity parameters on the global Nusselt number, some preliminary considerations have to be made in order to define a suitable test plan. Determining if there is a linear correlation or no correlation between input and target parameters requires at least two factor levels of each input parameter. Accordingly, higher order non-linear correlations require three or more factor levels of input parameters. Thus, to identify the effects of all the four variable parameters , , , and and their interactions, at least single experiments are required, which matches a full factorial design experiment.
In order to efficiently discuss effects and interactions, all variable parameters were divided into discrete groups whose nominal values or factor levels refer to numbers from 1–3 or 4. The assignment between groups and factor levels can be taken from Table 2. The range of parameters is limited by the test rig capabilities as presented in Table 1. The operating conditions were chosen taking into account test rig limitations (e.g., vibrations), and reaching an optimum measurement accuracy.
The chart in Figure 4a shows the resulting test points dependent on the circumferential Reynolds number and the mass flow rate , which will be repeated for all geometric variations of and as listed in Table 2. The test points for the repeat measurements were chosen based on a Box-Behnken design, where the extreme points and the centre point of the experiment include repeat measurements, denoted by the filled circles in Figure 4a. Consequently, 14 single experiments including 5 repeated points were performed for each of 12 different geometries, leading to a total of 108 samples to be used to derive a correlation. The experimentally reached test points are illustrated in Figure 4b. The solid lines represent the factor levels of the nominal values while the dashed lines are ±2% deviations. Most test points lie within the ±2% interval. The test points slightly outside the interval result from the fact that the nominal test points were located next to natural frequencies of the test rig and therefore had to be shifted to lower rotational velocities.
The following discussion of the results and the derivation of a correlation is based on the discrete groups introduced in Table 2.
3. Results and Discussion
With regard to a critical discussion of the results, the first step is an uncertainty analysis of the complete measuring chain. The uncertainty analysis is followed by a sensitivity study to find the main effects and interactions influencing the global Nusselt number. Finally, the correlation to predict a global Nusselt number is derived and discussed.
3.1. Measurement Uncertainty
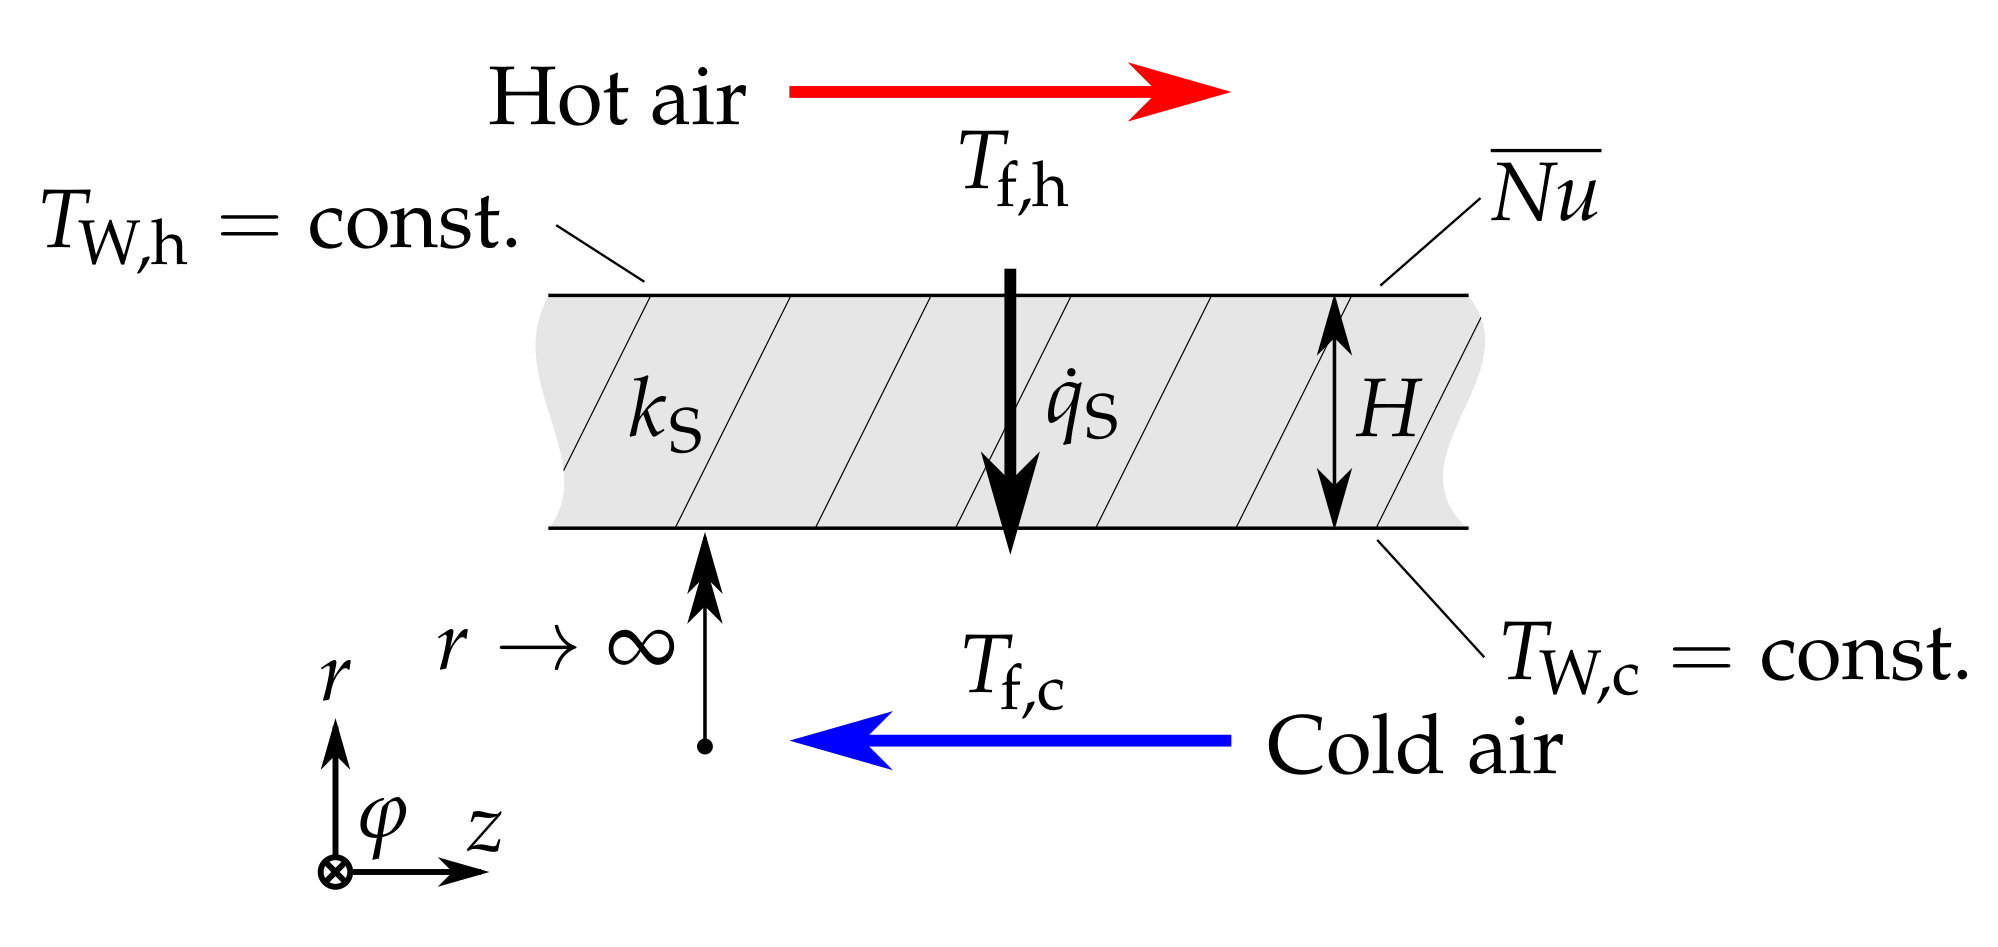
Due to the complexity of the two-dimensional heat transfer problem, a simplified model according to Figure 5 has been defined in order to calculate a linear propagation of uncertainties. The model consists of a cylinder with a sufficiently large radius T, a uniform surface temperature distribution at the inner and outer surface and a constant heat flux density across the structure. For this one-dimensional configuration, Equation (6) simplifies to
where L is the characteristic length scale, and and are the total temperatures of the flow on the hot and the cold side, respectively. Consequently, the resulting uncertainty depends on the relative uncertainty of the wall thickness measurement H, of the characteristic length L, the thermal conductivities and , and the differential temperature measurements and . While the relative measurement uncertainty for the thickness and the thermal conductivity is assumed to be constant, the relative uncertainty of temperature changes with the temperature differences leading to a maximum uncertainty of global Nusselt numbers
The values represent the absolute measurement uncertainties. The wall temperature difference and the hot air temperature difference are dependent on the heat transfer, and thus the Nusselt number uncertainty is a function of the heat transfer, too.
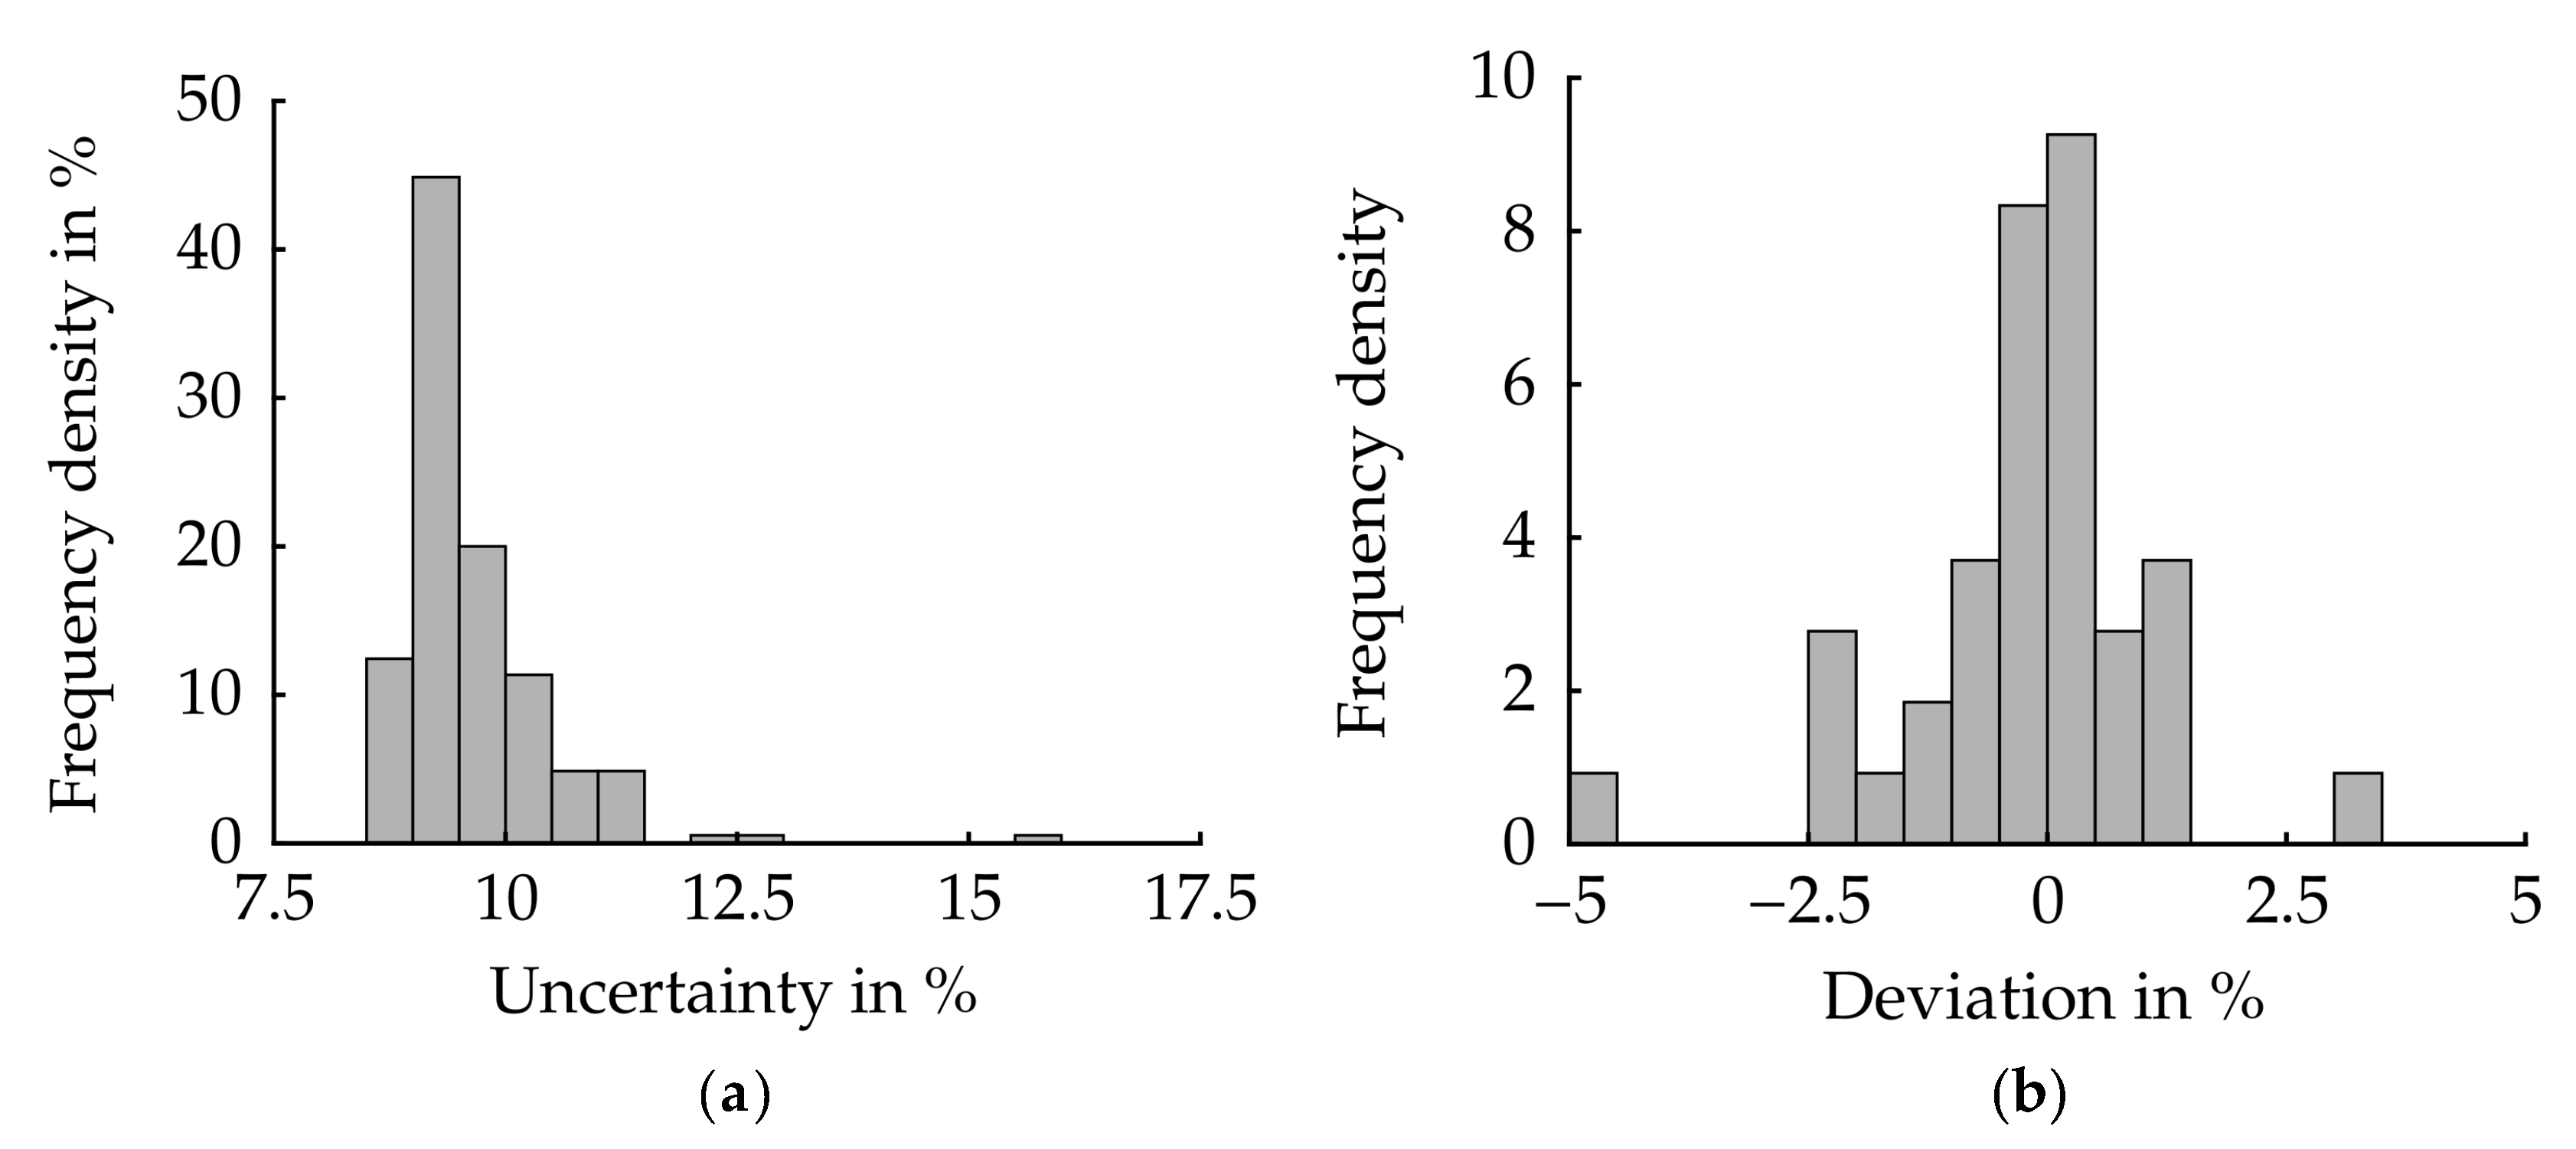
An uncertainty estimation based on the one-dimensional heat transfer problem results in a distribution of maximum relative uncertainties according to Figure 6a. The plot shows that uncertainties less than approximately 12% can be reached for most test points. As mentioned in Section 2, several operating points were repeated to confirm the proper setup and repeatability of the experiment. The deviation between the repeated and nominal test points is plotted in Figure 6b indicating a standard deviation for the temperature measurements of 2.5% or less for most test points. With regard to the standard deviations of the operating points of approximately ±2%, Figure 6b indicates an excellent repeatability of the experiments.
3.2. Sensitivity Study
The aim of the following sensitivity study is to identify the correlations between the global Nusselt number and the variable parameters , , , . Furthermore, possible interactions between the input parameters must be identified in order to derive an empirical correlation suitable for determining global Nusselt numbers.
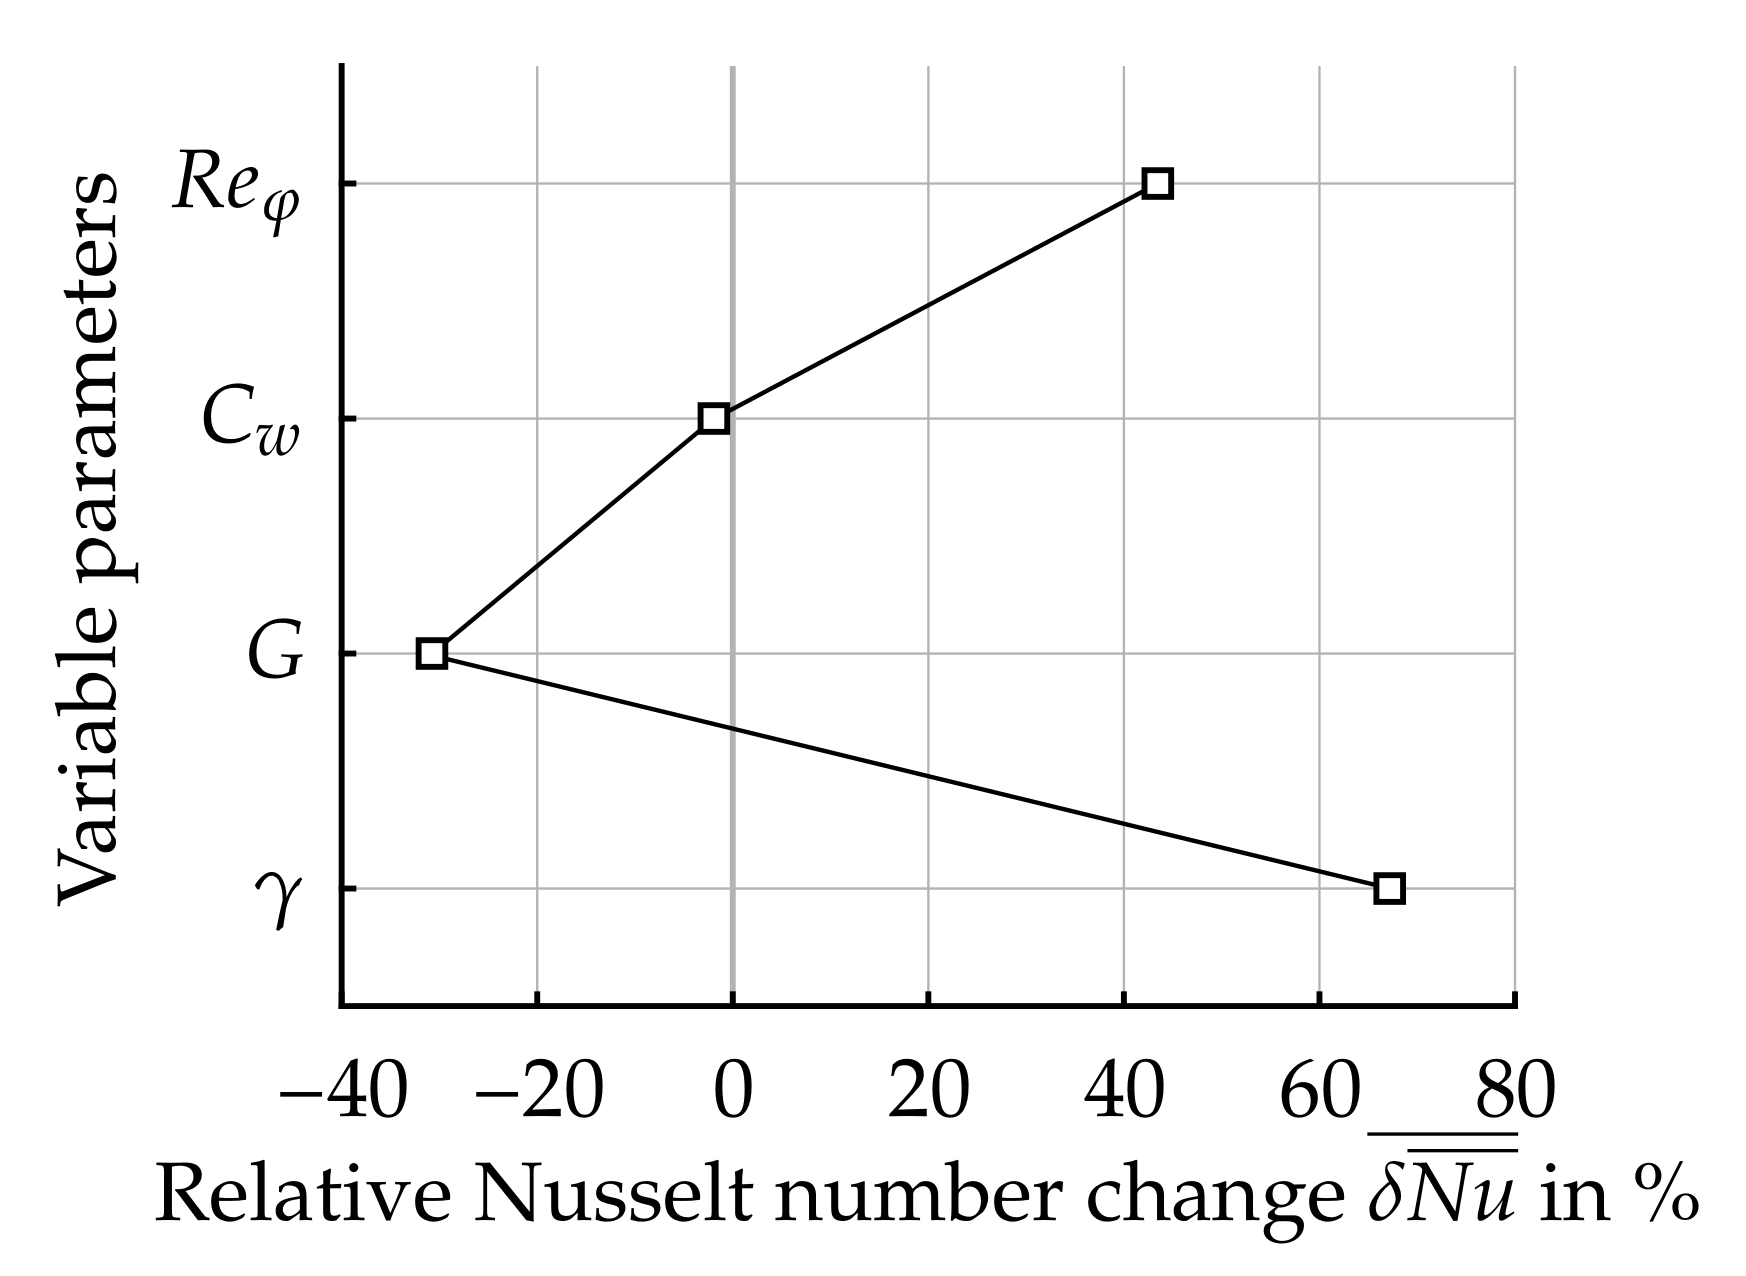
The chart depicted in Figure 7 contains the sample averaged relative changes of the global Nusselt numbers , when a single parameter is changed from the lowest (1) to the highest factor level (3 or 4) (see Table 2). For example, the relative effect of the circumferential Reynolds number is calculated such that
where are the factor levels of the variable parameters according to Table 2. It can be seen that increasing the circumferential Reynolds number or increasing the incidence angle both result in a large increase of the averaged Nusselt number of 43% and 67%, respectively. Consequently, an empirical correlation must take into account the positive correlation between these two parameters and the global Nusselt number. The increase of the non-dimensional gap width in turn leads to a large decrease of the global Nusselt number of −31%. No significant effect of the mass flow on the global Nusselt number can be found and the corresponding change of the relative global Nusselt number is approximately 0. The observed main effects confirm the results derived from previous studies (see Section 1). In rotor-stator systems, the circumferential Reynolds number and the relative spacing are the dominant parameters to describe the heat transfer. The negative effect of the relative spacing indicates that the present rotor-stator flow is similar to regime III, and further studies are necessary to prove this observation. The most important effect in the present case comes from the incidence angle which defines the tangential velocity component of the inlet air.
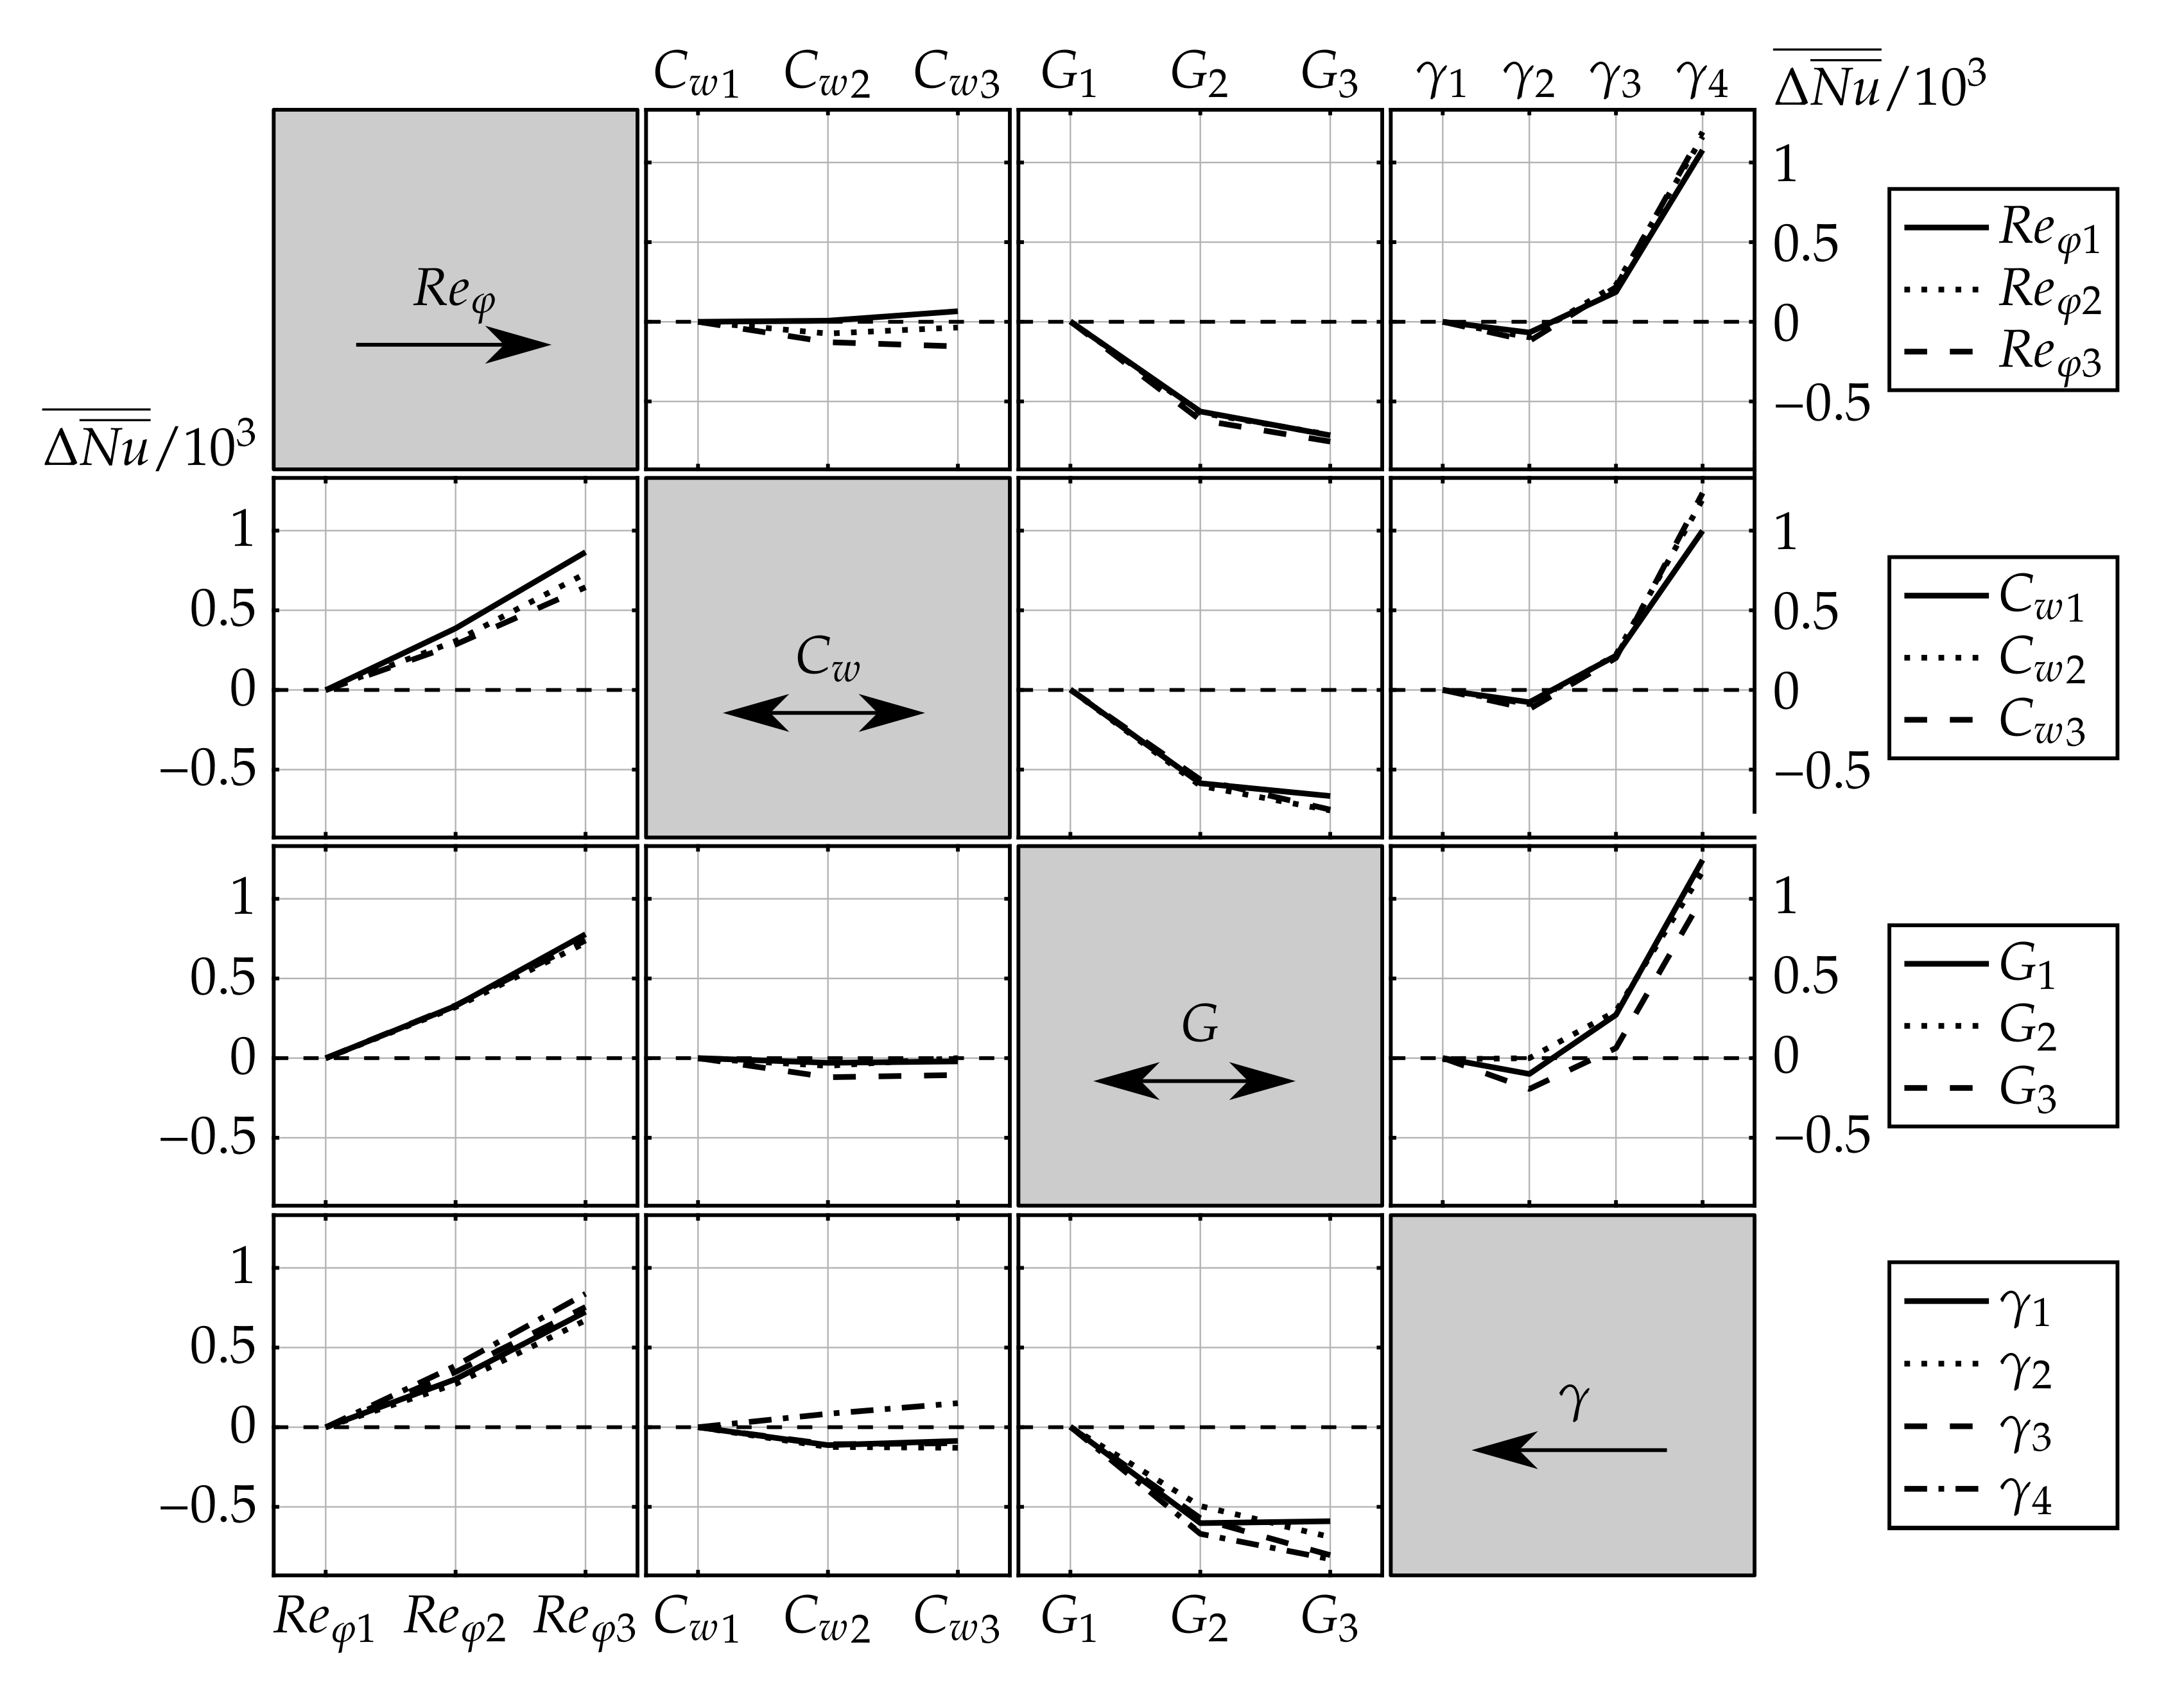
However, the above figure does not contain any information about possible interactions between the variable parameters. To identify these interactions, Figure 8 shows the charts for all 12 combinations between the variable parameters. One single chart illustrates the average change of the Nusselt number caused by the variation of a single parameter for the factor levels of another parameter, drawn as an array of curves. The definition of the averaged Nusselt number change for the combined change of variable parameters is similar to Equation (9). Data points illustrating an interaction between the circumferential Reynolds number and the mass flow rate (Row 2, Column 1) are calculated according to
To find all interactions, the indices are permuted according to the factor levels of the variable parameters in Table 2. Thus, the chart in Row 2 and Column 1 indicates the effect of the circumferential Reynolds number with changing mass flow rate with reference to the cases where . If all curves coincide, no interaction between the corresponding variable parameters can be found (e.g., in case of the first row, an interaction between the circumferential Reynolds number and the mass flow can be found in the second column). The corresponding chart (Row 1, Column 2) indicates that the slope of the curves for different Reynolds numbers changes with changing mass flow.
Accordingly, the same interaction can be found vice versa (Row 2, Column 1), indicating a decreasing effect of the circumferential Reynolds number on the global Nusselt number with increasing mass flow. The observed interaction can be explained by the relative velocity between the rotor surface and the surrounding air, which changes for a constant circumferential Reynolds number and increasing mass flow and therefore affects the local heat transfer. Another significant interaction can be observed between the mass flow and the incidence angle . The corresponding charts (R2, C4; R4, C2) indicate an increasing slope of the – dependency for increasing mass flows. On the other hand, increasing incidence angles result in an increasing slope of the effect of the mass flow on the global Nusselt number . The observation shows that the inflow conditions which depend on the mass flow and the incidence angle strongly affect the heat transfer in a rotor-stator system with radial inflow. This fact has already been found in previous studies [14]. Between the geometric parameters and , a third interaction can be identified based on Figure 8 (C3, R4; C4, R3), leading to an increasing effect of the incidence angle with decreasing gap width .
Results show that the main effect on the global Nusselt number is caused by the jet incidence angle . By choosing an appropriate value for the incidence angle, the global Nusselt number can be varied about 1000. Taking into account the effect of the gap width , Nusselt number changes of more than 200% can be realized. With regard to a maximum heat transfer, the smallest gap width , and the largest incidence angle yield an optimum configuration.
A summary of the main effects and interactions is given in Table 3. The major diagonal of the matrix represents the main effects of the corresponding parameters, which are dominant compared to the interactions, represented by the minor diagonals. Plus signs indicate a positive (increasing), minus signs a negative (decreasing) effect. For interactions, a plus sign means an increasing effect of one parameter if the other parameter increases. The minus sign indicates a decreasing effect of one parameter when increasing the other parameter. If no effect or interaction was observed, a ∘ is inserted. Based on these observations and the summary from Table 3, the general form of the empirical correlation can be derived. In a second step, remaining coefficients and exponents will be fitted, which is the objective of the following section.
3.3. Derived Correlation
Within the last section of the present study, an empirical correlation will be derived including the observations obtained from the sensitivity study. Using a common products of powers approach [8,14], including all effects and interactions leads to the generic correlation for the predicted Nusselt number
where and are the variable parameters, C is a coefficient, and are exponents. The results summarized in Table 3 indicate three main effects (, , ) and three interactions ( − , − , − ). Therefore, six exponents and one constant from the generic correlation from Equation (11) must be estimated, as all other effects and interactions are negligible. A nonlinear, multivariate regression based on a least-squares fit [19] is used to estimate the coefficient C and the exponents . In order to derive the correlation, no repeated data was used for the fit. The robustness of the generic correlation has been proven by randomly deleting up to 50 data points of the least-squares fit, leading to a variation of the estimated constant and exponents in the order of only 1%. The approach gives the correlation
where the incidence angle has been transformed with the cosine function to account for the nonlinear shape of the curves depicted in Figure 8. The first factor of Equation (12) includes all main effects observed in Section 3.2. Moreover, all observed interactions are taken into account in the second factor of the correlation. Therefore, the correlation is expected to allow for Nusselt number predictions within the parameter ranges , , , and with high accuracy. It is notable that the estimated exponent of the relative spacing is similar to the one found for regime III (Equation (3)) of rotor-stator systems without a superposed flow. For the circumferential Reynolds number the exponent is identical to the one found for regime IV (Equation (4)). As the realised spacing of the present study covers the transition regions between those two regimes (see, Figure 1), further investigations are necessary to completely understand the aerodynamics and heat transfer of rotor-stator systems with superposed centripetal flow. The quality of the derived correlation will be assessed in the following section.
3.4. Correlation Quality
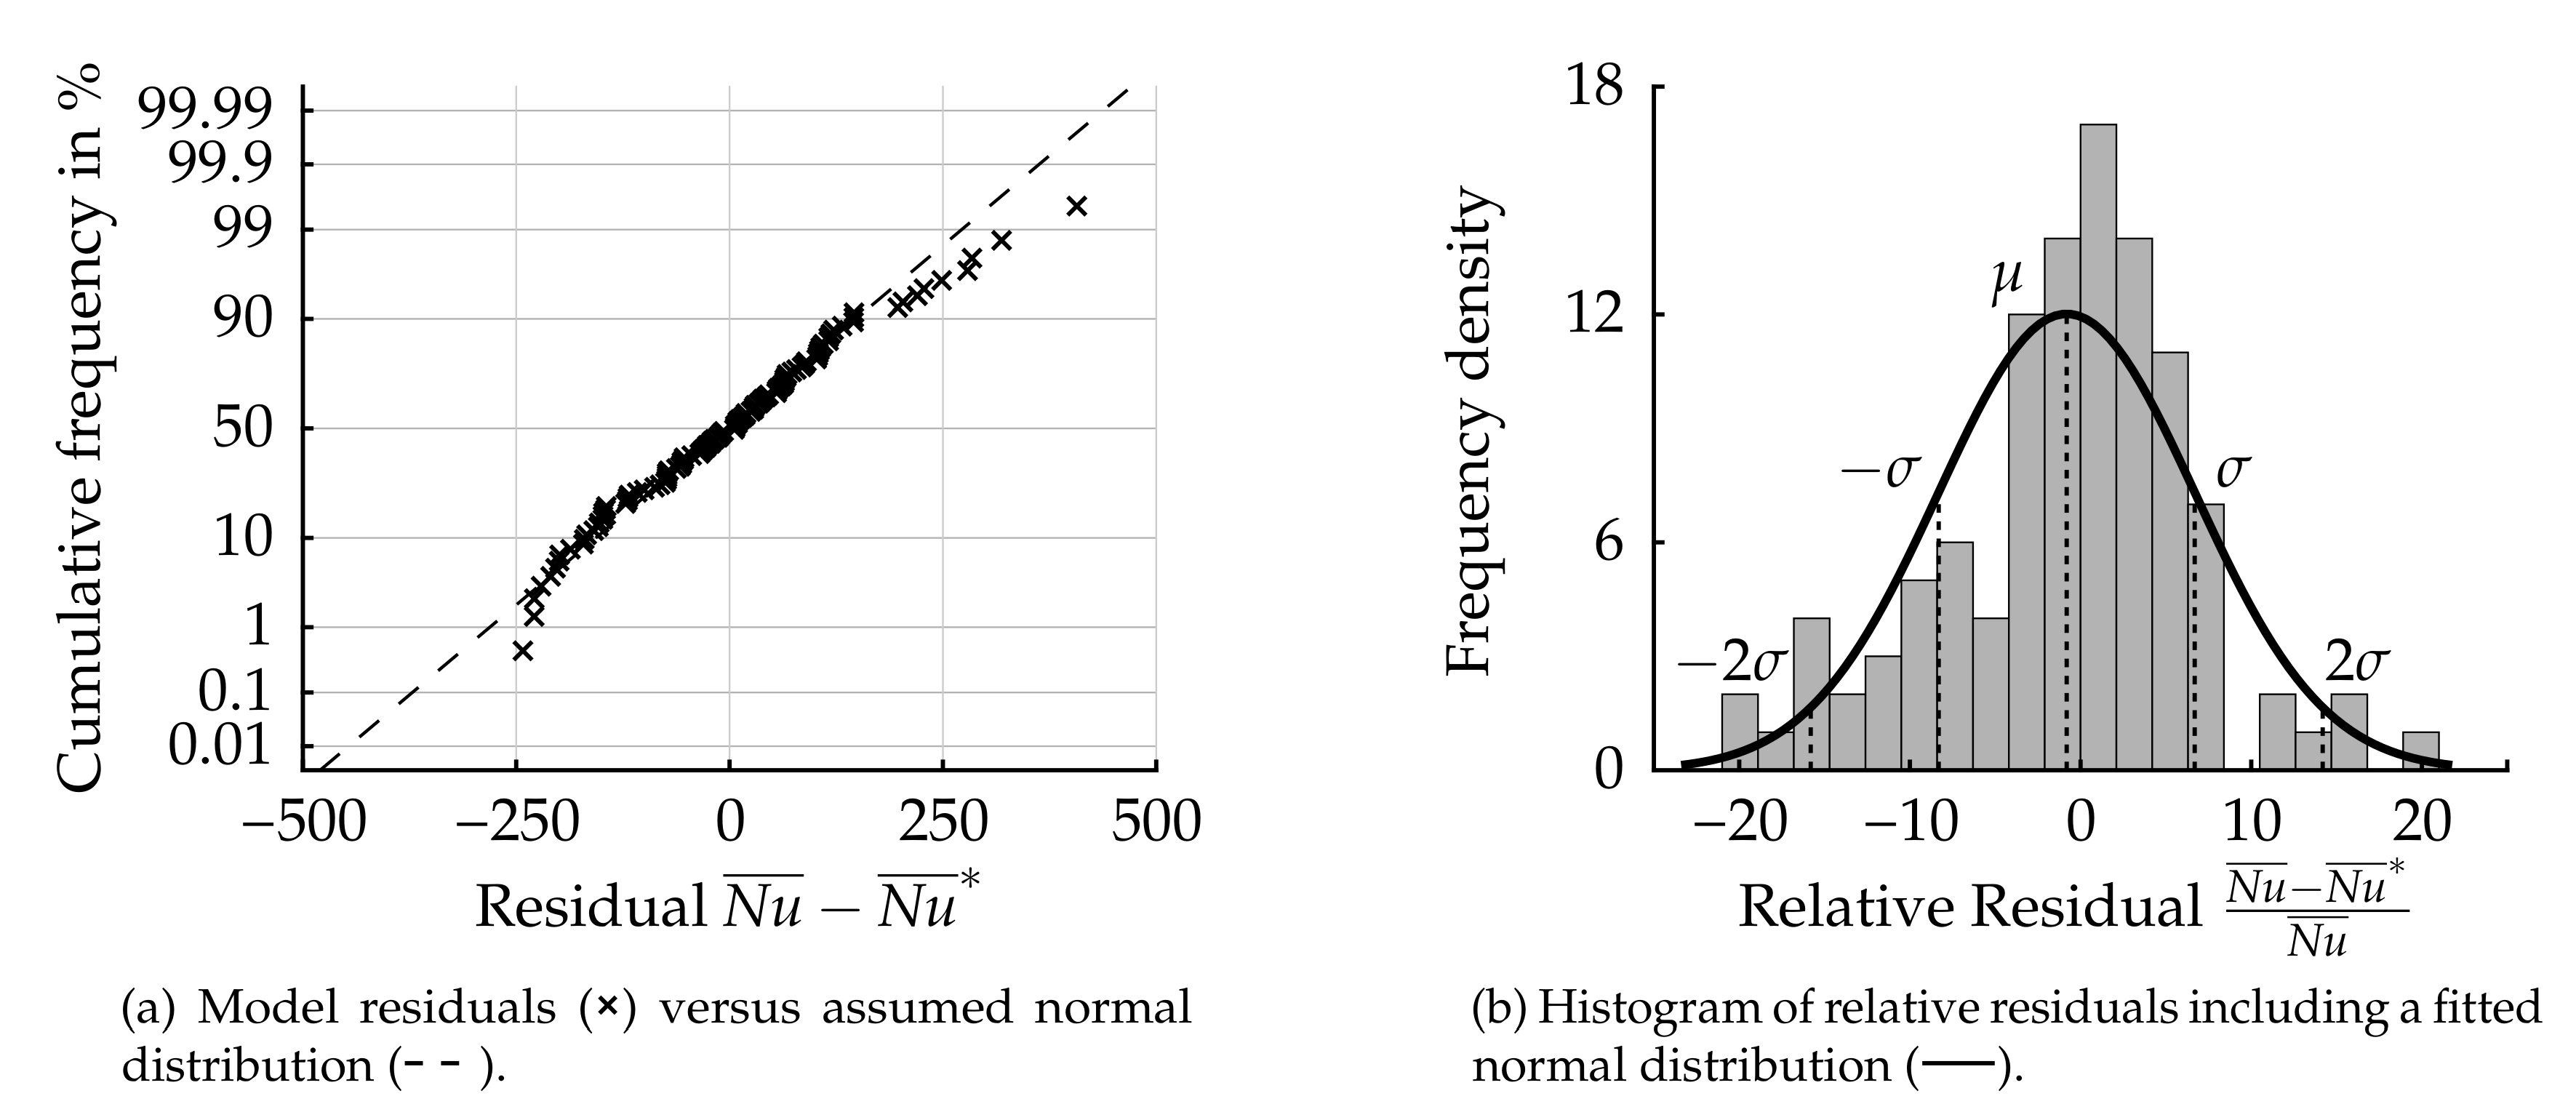
Assessing the quality of the derived correlation follows according to Figure 9. The chart in Figure 9a shows the distribution of the absolute residuals between the measured data and the predicted data. The dashed line represents the frequencies for a normal distribution of the residuals. Residuals which coincide with the normal distribution can be interpreted as stochastic deviations between predicted and measured data.
It can be concluded that most of the residuals can be described as stochastic deviations. For only 1% of the negative residuals, and 10% of the positive residuals, coincidence with the virtual normal distribution is worse. The corresponding residuals are likely caused by systematic model errors leading to the deviations between the empirical correlation and the measured data. Possible reasons for model errors could be missing interactions of three or more variable parameters, which were not considered within the present study.
In Figure 9b, the frequency density function of the relative residuals is depicted. Additionally, a normal distribution is added in order to derive an approximate standard deviation of the empirical correlation. The maximum relative error between prediction and measurement has a value of ±20%, whereas more than 95% of the relative errors are less than approximately 15.1%, indicating an excellent accuracy of the derived correlation.
The quality of the derived correlation and of the predicted global Nusselt numbers can be assessed by the set of parameters presented in Table 4.
The resulting coefficient of determination reaches a value of 96.3%, indicating a good adaption between model function and measured data as well as the root mean square error (RMSE) of 129. The deviations between predicted and measured data according to Figure 9b can approximately be described by an almost symmetric normal distribution with a standard deviation of 7.53%. As already mentioned, the maximum error of the correlation is expected to be within 20% for the parameter range discussed above. Therefore, the empirical correlation is judged to be suitable to predict global Nusselt numbers for the parameter range according to Table 1.
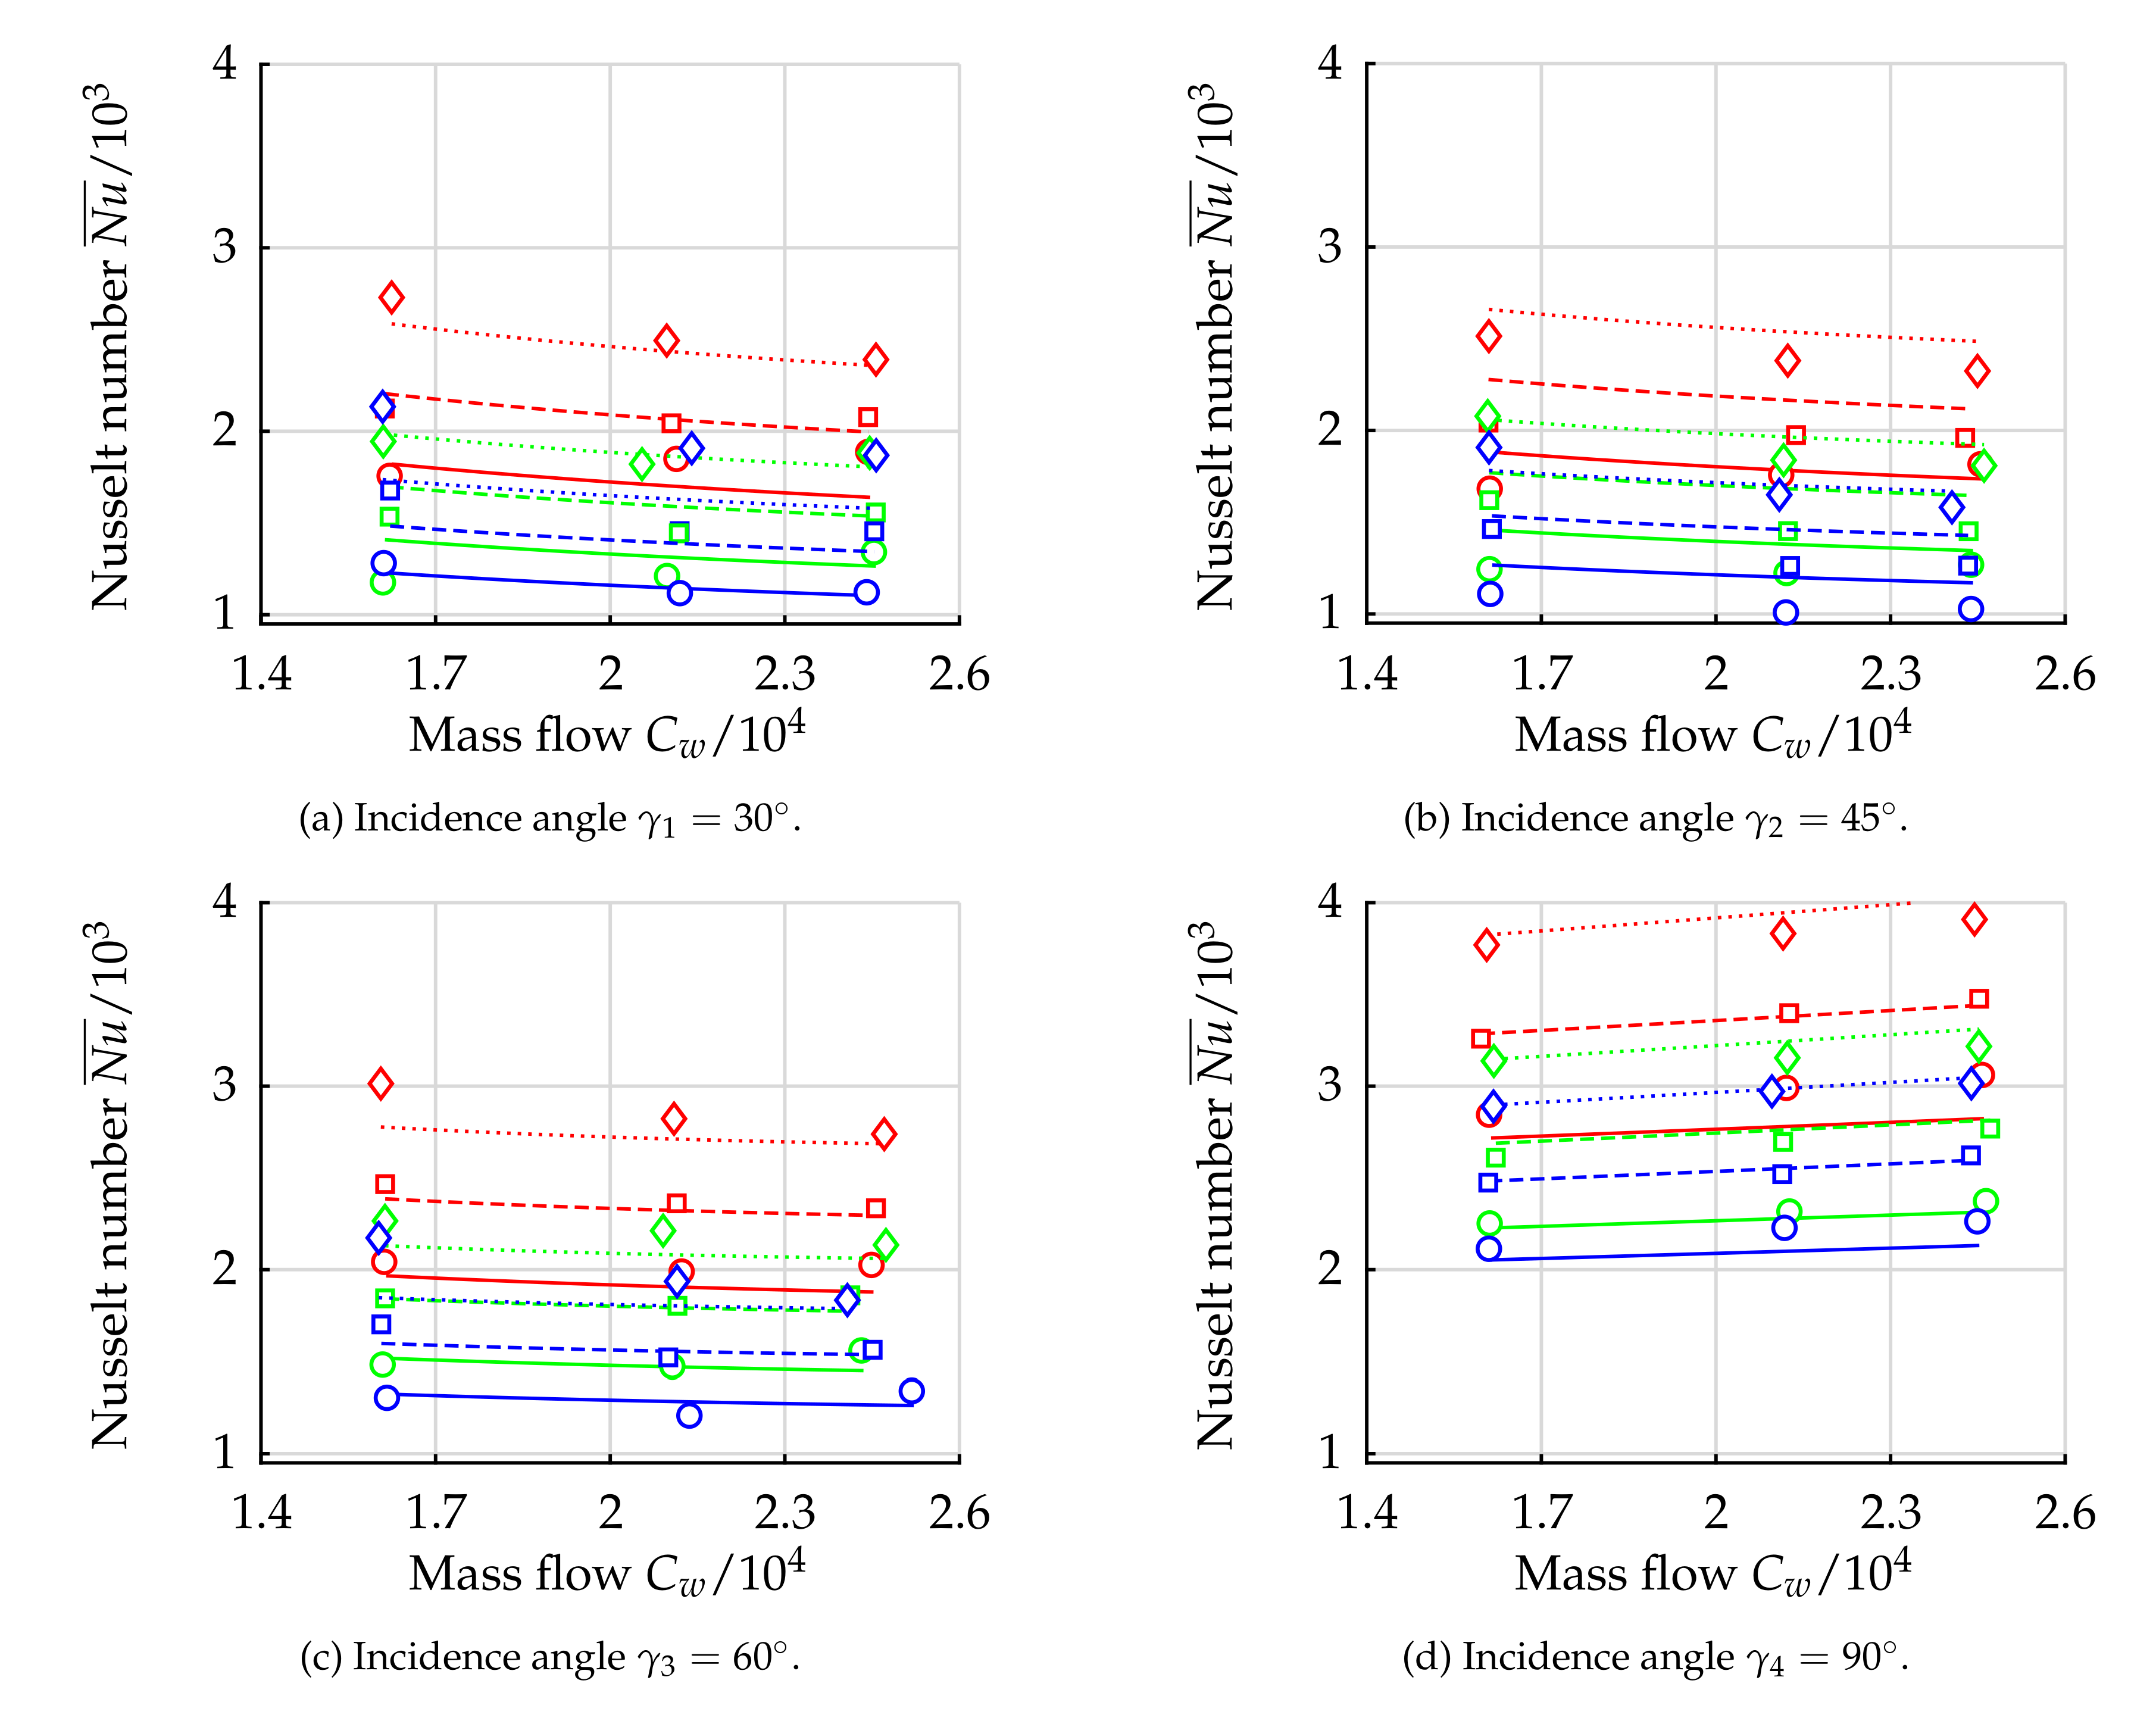
A comparison between the measured global Nusselt numbers (symbols) and the derived correlation (lines) can be found in Figure 10. The figures depict the global Nusselt number as a function of the mass flow rate for the tested circumferential Reynolds numbers (lines and symbols), and the relative spacing (colors). In Figure 10a the results for the incidence angle are depicted. While the calculated and measured Nusselt numbers are generally in good agreement, larger deviations can be found for , ( ![Aerospace 05 00051 i002]() ). In this case, the correlation shows a decreasing Nusselt number with increasing mass flow rate, while the experimental results indicate an increasing Nusselt number. The same trend can be observed for , and the relative spacing (
). In this case, the correlation shows a decreasing Nusselt number with increasing mass flow rate, while the experimental results indicate an increasing Nusselt number. The same trend can be observed for , and the relative spacing ( ![Aerospace 05 00051 i003]() ). For the case and (
). For the case and ( ![Aerospace 05 00051 i004]() ) larger deviations of 20% can be found, whereas the qualitative dependency is predicted correctly. The comparison for the incidence angle according to Figure 10b shows a similar effect, but the correlation generally over predicts the Nusselt numbers and underestimates the influence of the mass flow rate for higher gap widths and . This trend can also be observed for the incidence angle depicted in Figure 10c, while the quantitative deviations between measured and predicted data is small. In case of the largest incidence angle both the qualitative and the quantitative agreement between predicted and measured data is excellent.
) larger deviations of 20% can be found, whereas the qualitative dependency is predicted correctly. The comparison for the incidence angle according to Figure 10b shows a similar effect, but the correlation generally over predicts the Nusselt numbers and underestimates the influence of the mass flow rate for higher gap widths and . This trend can also be observed for the incidence angle depicted in Figure 10c, while the quantitative deviations between measured and predicted data is small. In case of the largest incidence angle both the qualitative and the quantitative agreement between predicted and measured data is excellent.
 ). In this case, the correlation shows a decreasing Nusselt number with increasing mass flow rate, while the experimental results indicate an increasing Nusselt number. The same trend can be observed for , and the relative spacing (
  ). For the case and (
  ) larger deviations of 20% can be found, whereas the qualitative dependency is predicted correctly. The comparison for the incidence angle according to Figure 10b shows a similar effect, but the correlation generally over predicts the Nusselt numbers and underestimates the influence of the mass flow rate for higher gap widths and . This trend can also be observed for the incidence angle depicted in Figure 10c, while the quantitative deviations between measured and predicted data is small. In case of the largest incidence angle both the qualitative and the quantitative agreement between predicted and measured data is excellent.
4. Summary and Conclusions
The present study presents the setup and analysis of an experiment to derive empirical correlations for global Nusselt numbers of a jet cooled conical rotor-stator system. One objective of the study is the identification of the most important variable parameters which determine the heat transfer. Therefore, the governing similarity parameters of the problem were introduced from previous publications. Consequently, the circumferential Reynolds number , the dimensionless mass flow rate , the relative rotor-stator spacing , and the incidence angle of the jet cooling were chosen as variable parameters for the experiments. The experimental setup was based on design of experiments leading to a full factorial test plan in order to identify and separate all main effects and interactions of the variable parameters on the global Nusselt number. The preliminary defined test points could be reached within an uncertainty of ±2% as well as a measurement uncertainty of approximately 10% for most test points.
The most significant physical effects were discussed, based on a sensitivity study. It has been shown that the incidence angle of the jet cooling has a major effect on the global Nusselt number, while no significant effect could be observed for the mass flow rate . For the circumferential Reynolds number , a large positive effect on heat transfer was found, whereas the gap width has a large negative effect on heat transfer. A maximum heat transfer inside the rotor-stator cavity can be reached by realizing an incidence angle of the jet cooling (no pre-swirl), and a non-dimensional gap width for all operation conditions. Furthermore, the results showed that changing the geometry enables a global Nusselt number change of more than 200%, leading to a large variety of different rotor-stator configurations with a tailored heat transfer characteristic.
Finally, an empirical correlation to predict global Nusselt numbers covering the parameter ranges , , , and was derived. The quality of the correlation was proven against experimental data, which showed that the empirical correlation includes the most significant effects and interactions. With the largest deviations between measured and predicted data of 15% for 95% of the measured data, the correlation is suitable to predict heat transfer in a conical rotor-stator cavity for the given range of variable parameters. Based on the correlation, the geometry of the compressor rear cone can be optimized to meet specific requirements of heat transfer in the rear cone assembly of a jet engine.
Author Contributions
Fabian Bleier, a PhD candidate at ITS, designed, performed, and analysed the experiments, and wrote the manuscript. Corina Schwitzke, a senior scientist at ITS, contributed to the design and the analysis of the experiment, and to the manuscript. Hans-Jörg Bauer, professor and head of ITS, initialized the study and acted as a project leader.
Acknowledgments
The authors would like to gratefully acknowledge the European Commission for supporting the present work within the Seventh Framework Programme project LEMCOTEC funded under the grant agreement 283216. Furthermore, the authors would like to thank MTU Aero Engines for the collaboration within the LEMCOTEC project.
Conflicts of Interest
The authors declare no conflict of interest.
Abbreviations
The following abbreviations are used in this manuscript:
| Latin Symbols | |
| A | Area (m2) |
| d | Diameter (m) |
| C | Coefficient of a model (variable) |
| H | Structural thickness (m) |
| L | Characteristic length (m) |
| Heat flux (W) | |
| T | Temperature (K) |
| Volumetric flow (m3/s) | |
| W | Mechanical power (W) |
| cp | Specific heat (J/(kg K)) |
| e | Exponent of a model (–) |
| h | Heat transfer coefficient (W/m2/K) |
| k | Thermal conductivity (W/(m K)) |
| Mass flow (kg/s) | |
| n | Number of inlet holes (–) |
| p | Pressure (Pa) |
| Heat flux density (W/m2) | |
| r | Radial coordinate (m) |
| s | Gap width (m) |
| u | Radial velocity component u = ur (m/s) |
| z | Axial coordinate (m) |
| Greek Symbols | |
| Δ | Absolute uncertainty (variable) |
| γ | Incidence angle (rad) |
| μ | Dynamic viscosity (Pa s) |
| ν | Kinematic viscosity (m/s2) |
| ω | Angular velocity (rad/s) |
| ϕ | Angular coordinate (rad) |
| ρ | Density (kg/m3) |
| σ | Normal stress (N/m2) |
| θ | Cone angle (rad) |
| Non-dimensional Groups | |
| Bi | Biot number Bi = h · H/kS |
| Non-dimensional Groups | |
| Cw | Non-dim. mass flow Cw = /(μ · ro) = /(v · ro) |
| D | Non-dim. jet hole diameter D = d/(2 · ro) |
| Ec | Eckert number Ec = u2/(cp · ΔT) |
| G | Gap ratio G = s/ro |
| K1 | Core rotation factor at gap inlet K1 = (cos γ · ujet)/(ro · ϕ) |
| Nu | Nusselt number Nu = h · ro/kf |
| Global Nusselt number = ʃ Nu · ΔT dA/ʃ ΔT dA | |
| Pr | Prandtl number Pr = μ · cp/k |
| Re | Reynolds number Re = u · ro/v |
| X | Radius ratio X = ri/ro |
| R | Recovery factor R = Pr1/3 |
| Indices | |
| 1 | Gap inlet property |
| ad | Adiabatic |
| c | Cooled |
| f | Fluid |
| h | Heated |
| i | Inner |
| jet | Jet |
| o | Outer |
| ϕ | Circumferential |
| S | Solid |
| W | Wall |
| L | Leakage |
| Abbreviations | |
| RMSE | Root Mean Square Error |
Appendix A. Finite-Element Model
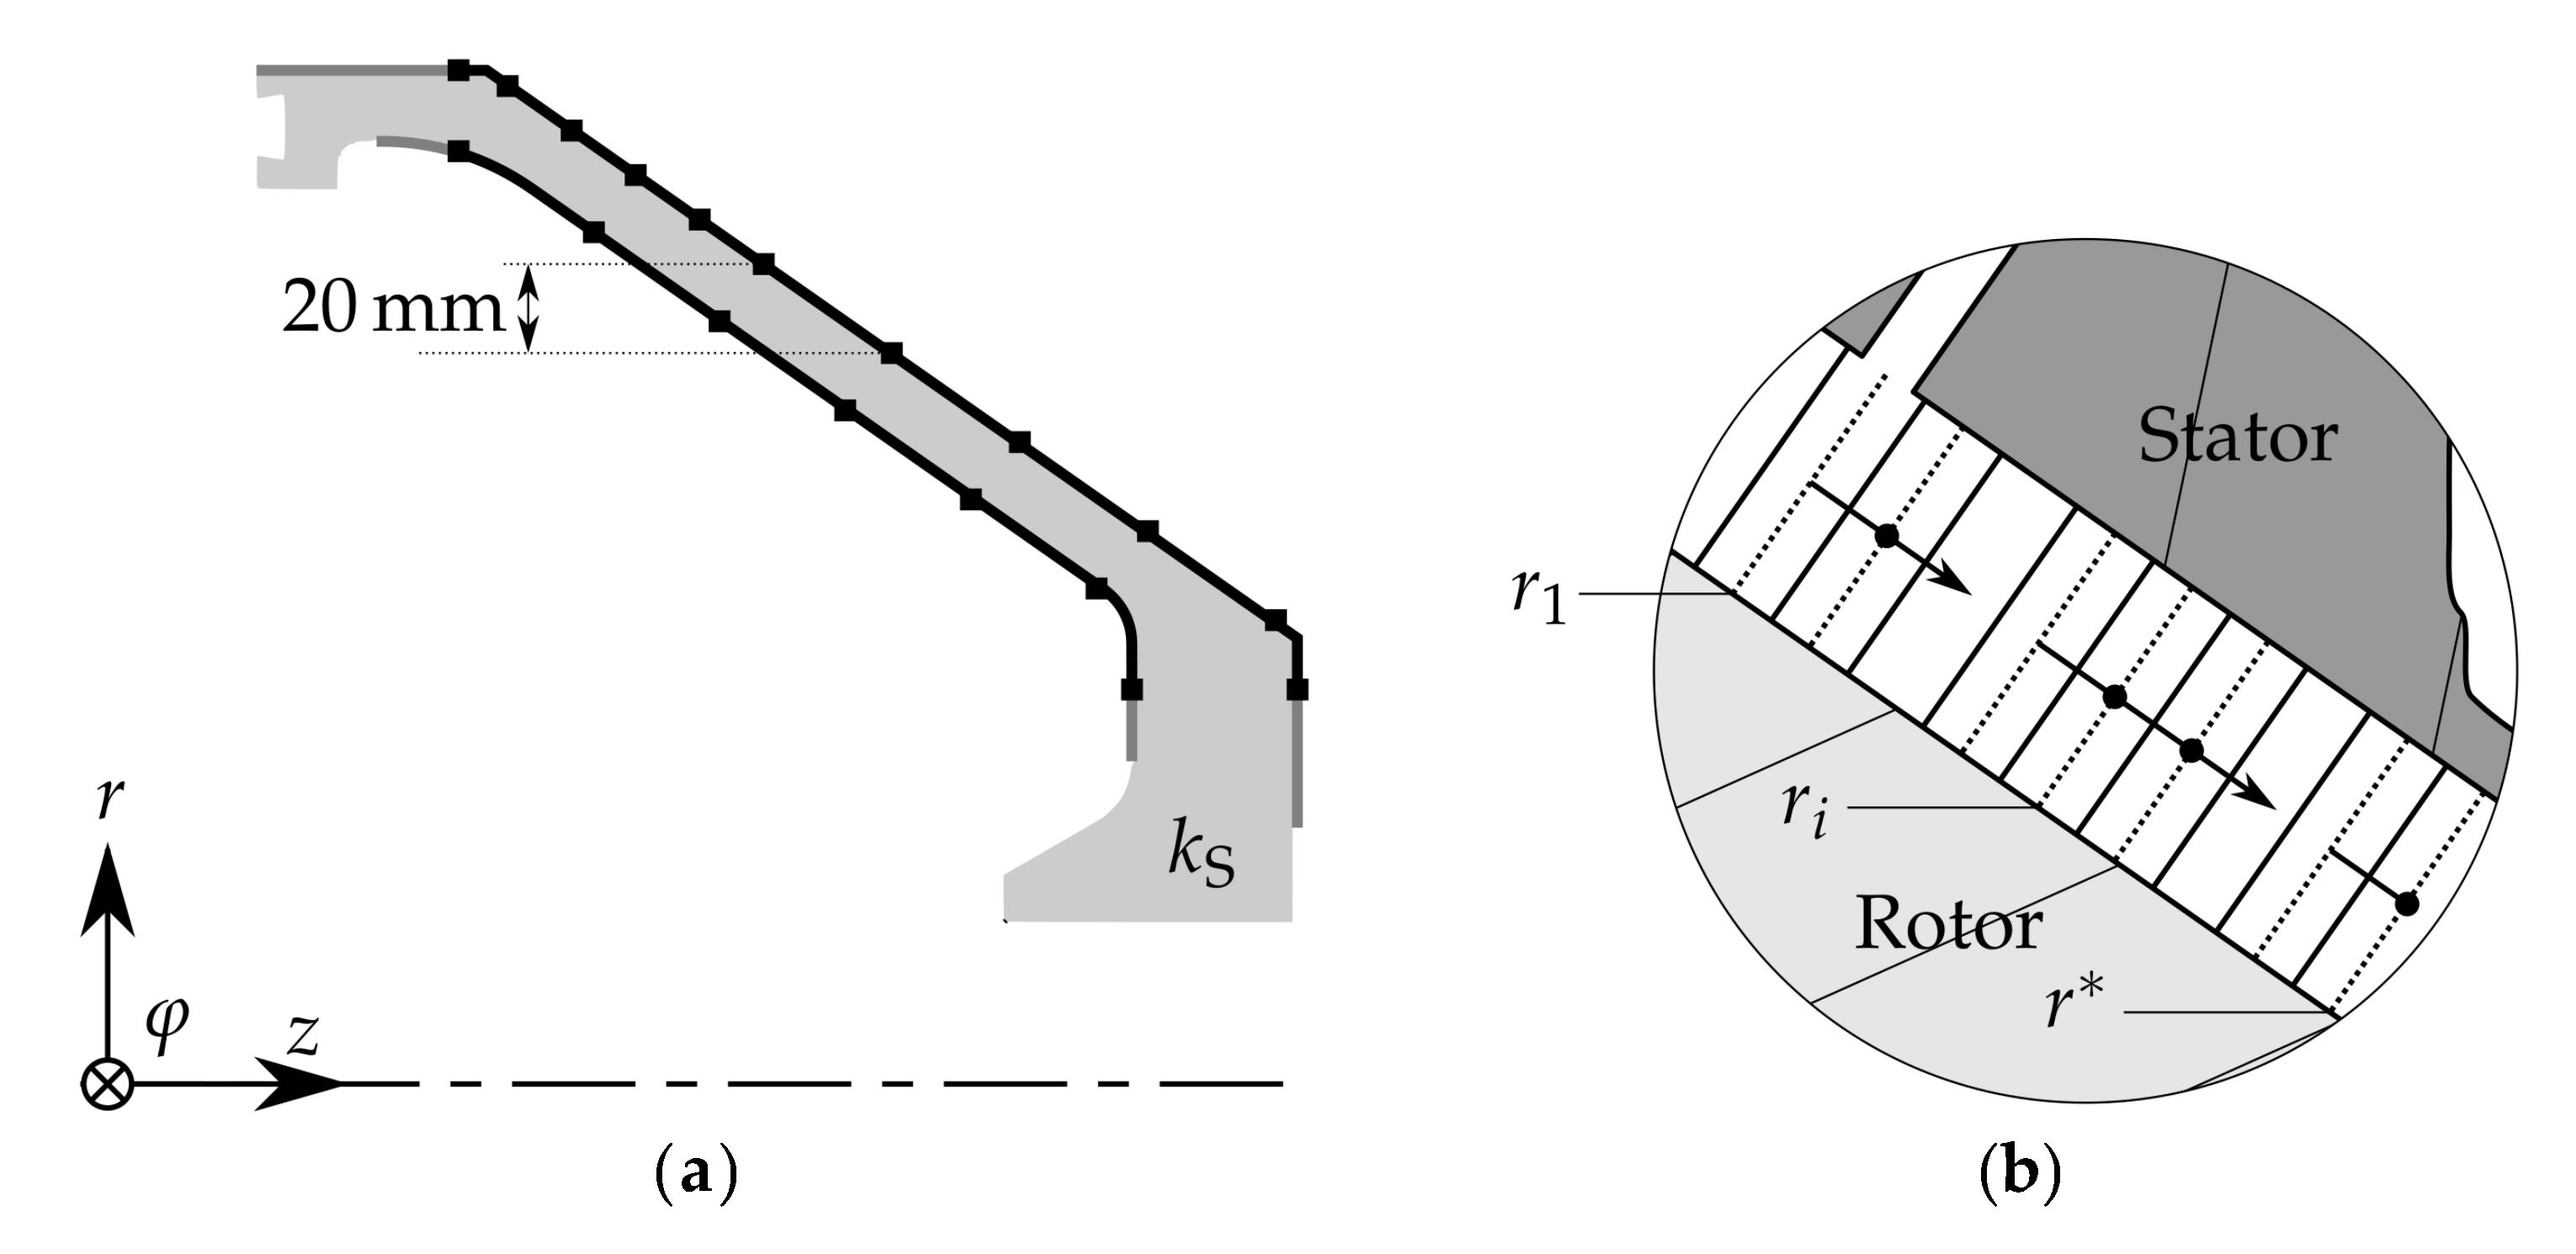
The local heat flux density of the rotor surface is calculated by a two-dimensional, axisymmetric finite-element model. The boundary conditions are depicted in Figure A1a. The temperature boundary conditions are derived by spline interpolation of the measured temperatures (∎). At the outer and inner rotor radius no temperature measurement was realized (―). However, a sensitivity study has shown that the boundary conditions in these regions do not affect the temperature distribution in the region of interest. Therefore, the temperatures of the adjacent measurements are used and extrapolated to these regions. The distance between the temperature measurements was chosen according to temperature distributions derived from CFD results. An additional study showed that maximum errors of 2% of the global Nusselt numbers occur when switching the interpolation scheme from spline to linear, indicating a proper distribution of the temperature measurements. The edge length of the quadratic finite elements is approximately 1 mm. Subsequently, the heat flux between the inlet radius , and the evaluation radius can be calculated by numerically integrating the local heat flux density. Therefore, the rotor surface has been discretised according to Figure A1b with an edge length .
Figure A1.
Boundary conditions of finite-element model and discretization of the rotor-stator system. (a) Finite-element model including boundary conditions: interpolated temperature and measurement point ( ![Aerospace 05 00051 i011]() ), extrapolated temperature (―). (b) Discretization of the rotor-stator gap to calculate the adiabatic wall temperature.
), extrapolated temperature (―). (b) Discretization of the rotor-stator gap to calculate the adiabatic wall temperature.
 ), extrapolated temperature (―). (b) Discretization of the rotor-stator gap to calculate the adiabatic wall temperature.
Figure A1.
Boundary conditions of finite-element model and discretization of the rotor-stator system. (a) Finite-element model including boundary conditions: interpolated temperature and measurement point ( ![Aerospace 05 00051 i011]() ), extrapolated temperature (―). (b) Discretization of the rotor-stator gap to calculate the adiabatic wall temperature.
), extrapolated temperature (―). (b) Discretization of the rotor-stator gap to calculate the adiabatic wall temperature.
), extrapolated temperature (―). (b) Discretization of the rotor-stator gap to calculate the adiabatic wall temperature.
Appendix B. Adiabatic Wall Temperature
The local adiabatic wall temperature is derived using the equation [8]
where the recovery factor . The local total fluid temperature depends on the total inlet temperature , the heat flux , the transferred mechanical power W, and the mass flow rate leading to the local adiabatic wall temperature
The locally transferred mechanical power W can be derived from the local heat transfer by applying the modified Reynolds analogy [8]. This assumption has been proven based on CFD results, leading to an error between the CFD results and applying the Reynolds analogy to the CFD results of maximum 15%.
The local free stream velocity u yields from evaluating the pressure gradient along the rotor-stator gap. In flows with dominant circumferential velocity the relationship
where r is the local Radius and is the fluid density, is valid. The pressure gradient is calculated from the spline interpolated stator wall pressures measured with radial distances of 50 mm. The validation of Equation (A3) for the present rotor-stator system was done by CFD calculations leading to maximum errors of 15% between CFD results and Equation (A3).
References
- Von der Bank, R.; Donnerhack, S.; Rae, A.; Cazalens, M.; Lundbladh, A.; Dietz, M. LEMCOTEC—Improving the Core-Engine Thermal Efficiency: Paper-Nr. GT2014-25040. In Proceedings of the ASME Turbo Expo 2014: Turbine Technical Conference and Exposition, Düsseldorf, Germany, 16–20 June 2014. [Google Scholar]
- Kervistin, R. Cooling System for a Gas Turbine Engine Compressor. U.S. Patent No. 5297386, 29 March 1994. [Google Scholar]
- Bleier, F.; Hufnagel, M.; Pychynski, T.; Eichler, C.; Bauer, H.J. Numerical Conjugate Heat Transfer Study of a Cooled Compressor Rear Cone: Paper-Nr. GT2014-26289. In Proceedings of the ASME Turbo Expo 2014: Turbine Technical Conference and Exposition, Düsseldorf, Germany, 16–20 June 2014. [Google Scholar]
- Bleier, F.; Höfler, C.; Pychynski, T.; Bauer, H.J. Design and Validation of a Test Rig for Heat Transfer Measurements on a Rotating Cone: Paper-Nr. ISABE-2015-20273. In Proceedings of the 22nd International Symposium on Air Breathing Engines, Phoenix, AZ, USA, 25–30 October 2015. [Google Scholar]
- Fénot, M.; Bertin, Y.; Dorignac, E.; Lalizel, G. A review of heat transfer between concentric rotating cylinders with or without axial flow. Int. J. Therm. Sci. 2011, 50, 1138–1155. [Google Scholar] [CrossRef]
- Harmand, S.; Pellé, J.; Poncet, S.; Shevchuk, I.V. Review of fluid flow and convective heat transfer within rotating disk cavities with impinging jet. Int. J. Therm. Sci. 2013, 67, 1–30. [Google Scholar] [CrossRef]
- Owen, J.M.; Rogers, R.H. Flow and Heat Transfer in Rotating-Disc Systems: Rotating Cavities; Research Studies Press: Taunton, UK; John Wiley & Sons: New York, NY, USA, 1995; Volume 2. [Google Scholar]
- Owen, J.M.; Rogers, R.H. Flow and Heat Transfer in rotating-Disc Systems: Rotor-Stator Systems; Research Studies Press: Taunton, UK; John Wiley & Sons: New York, NY, USA, 1989; Volume 1. [Google Scholar]
- Alexiou, A.; Hills, N.J.; Long, C.A. Heat Transfer in High-Pressure Compressor Gas Turbine Internal Air Systems: A Rotating Disc-Cone Cavity with Axial Throughflow. Exp. Heat Transf. 2000, 13, 299–328. [Google Scholar] [CrossRef]
- Wimmer, M.; Zierep, J. Transition from Taylor vortices to cross-flow instabilities. Acta Mech. 2000, 140, 17–30. [Google Scholar] [CrossRef]
- Long, C.A.; Turner, A.B.; Kais, G.; Tham, K.M.; Verdicchio, J.A. Measurement and CFD Prediction of the Flow within an HP Compressor Drive Cone. J. Turbomach. 2003, 125, 165–172. [Google Scholar] [CrossRef]
- Dorfman, L.A. Hydrodynamic Resistance and the Heat Loss of Rotating Solids; Oliver & Boyd: Edinburgh, Scotland, UK, 1963. [Google Scholar]
- Daily, J.W.; Nece, R.E. Chamber Dimension Effects on Induced Flow and Frictional Resistance of Enclosed Rotating Disks. J. Basic Eng. 1960, 82, 217–230. [Google Scholar] [CrossRef]
- Pellé, J.; Harmand, S. Heat transfer measurements in an opened rotor-stator system air-gap. Exp. Therm. Fluid Sci. 2007, 31, 165–180. [Google Scholar] [CrossRef]
- Mitchell, J.W.; Metzger, D.E. Heat Transfer From a Shrouded Rotating Disk to a Single Fluid Stream. J. Heat Transf. 1965, 87, 485. [Google Scholar] [CrossRef]
- Djaoui, M.; Dyment, A.; Debuchy, R. Heat transfer in a rotor-stator system with a radial inflow. Eur. J. Mecha.-B/Fluids 2001, 20, 371–398. [Google Scholar] [CrossRef]
- Tang, H.; Shardlow, T.; Michael Owen, J. Use of Fin Equation to Calculate Nusselt Numbers for Rotating Disks. J. Turbomach. 2015, 137, 121003. [Google Scholar] [CrossRef]
- Geis, T. Strömung und Reibungsinduzierte Leistungs- und Wirkungsgradverluste in Komplexen Rotor-Stator Zwischenräumen. Ph.D. Thesis, Department of Mechanical Engineering, University of Karlsruhe, Baden-Württemberg, Germany, 2002. [Google Scholar]
- Seber, G.A.F.; Wild, C.J. Nonlinear Regression; John Wiley & Sons, Inc.: Hoboken, NJ, USA, 1989. [Google Scholar]
Figure 1.
Heat transfer regimes for an open discoidal rotor-stator system (Reprinted from [14] with permission from Elsevier): regime I (laminar, merged boundary layers), regime II (laminar, separated boundary layers), regime III (turbulent, merged boundary layers), and regime IV (turbulent, separated boundary layers).

Figure 2.
Scheme of the physical problem with variable input parameters and test rig setup with schematic illustration of the temperature measurements ( ![Aerospace 05 00051 i001]() ) [4].
) [4].
 ) [4].
Figure 2.
Scheme of the physical problem with variable input parameters and test rig setup with schematic illustration of the temperature measurements ( ![Aerospace 05 00051 i001]() ) [4].
) [4].
) [4].
Figure 3.
Geometric and thermodynamic parameters influencing the target parameter.

Figure 4.
Comparison between nominal test plan and realized test plan for Reynolds number and mass flow .
Figure 4.
Comparison between nominal test plan and realized test plan for Reynolds number and mass flow .

Figure 5.
Comparison between nominal test plan and realized test plan for Reynolds number and mass flow .
Figure 5.
Comparison between nominal test plan and realized test plan for Reynolds number and mass flow .
Figure 6.
Detailed uncertainty analysis including linear propagation of uncertainties and repeatability of the experiments. (a) Nusselt number uncertainty for all measurements. (b) Deviation between repeated measurements.
Figure 6.
Detailed uncertainty analysis including linear propagation of uncertainties and repeatability of the experiments. (a) Nusselt number uncertainty for all measurements. (b) Deviation between repeated measurements.

Figure 7.
Main effects of all variable parameters on the averaged relative Nusselt number change .

Figure 8.
Illustration of the interactions between the variable parameters and their effect on the averaged global Nusselt number .
Figure 8.
Illustration of the interactions between the variable parameters and their effect on the averaged global Nusselt number .

Figure 9.
Absolute and relative distribution of the residuals between predicted Nusselt numbers and measured global Nusselt numbers .
Figure 9.
Absolute and relative distribution of the residuals between predicted Nusselt numbers and measured global Nusselt numbers .

Figure 10.
Comparison between measured data (symbols) and the derived correlation (lines) as a function of the mass flow rate for each incidence angle and the varations: : ( ![Aerospace 05 00051 i002]() ), (
), ( ![Aerospace 05 00051 i003]() ), (
), ( ![Aerospace 05 00051 i005]() ); : (
); : ( ![Aerospace 05 00051 i006]() ), (
), ( ![Aerospace 05 00051 i007]() ), (
), ( ![Aerospace 05 00051 i008]() ); : (
); : ( ![Aerospace 05 00051 i009]() ), (
), ( ![Aerospace 05 00051 i010]() ), (
), ( ![Aerospace 05 00051 i004]() ).
).
), ( ), (  ); : (
  ), (
), (  ), (
), (  ); : (
  ), (
), (  ), ( ).
Figure 10.
Comparison between measured data (symbols) and the derived correlation (lines) as a function of the mass flow rate for each incidence angle and the varations: : ( ![Aerospace 05 00051 i002]() ), (
), ( ![Aerospace 05 00051 i003]() ), (
), ( ![Aerospace 05 00051 i005]() ); : (
); : ( ![Aerospace 05 00051 i006]() ), (
), ( ![Aerospace 05 00051 i007]() ), (
), ( ![Aerospace 05 00051 i008]() ); : (
); : ( ![Aerospace 05 00051 i009]() ), (
), ( ![Aerospace 05 00051 i010]() ), (
), ( ![Aerospace 05 00051 i004]() ).
).
), ( ), ( ); : ( ), ( ), ( ); : ( ), ( ), ( ).

Table 1.
Variable and non-variable parameters and corresponding value ranges.
| Parameter | Definition | Test Rig Conditions | Engine Conditions [8,9,18] |
|---|---|---|---|
| Circ. Reynolds number | < 5 · 106 | > 10 · 106 | |
| Non-dim. mass flow rate | 16 · 103 to 25 · 103 | 5 · 103 to 50 · 103 | |
| Relative gap width | 0.03 to 0.11 | >0.05 | |
| Incidence angle | to | to | |
| Jet diameter ratio | 6.82 · 10−3 | tbd | |
| Number of jets n | 48 | tbd | |
| Leakage mass flow rate | 8 · 103 | ||
| Diameter ratio | 0.45 | >0.4 | |
| Cone angle | 35° | 36° | |
| Initial swirl ratio | <1.4 | <1.5 | |
| Biot number | 0.2 to 5 | 0.1 to 5 | |
| Eckert number | <2 | <1 | |
| Prandtl number | 0.71 | 0.72 |
Table 2.
Grouped variable parameters and their nominal values or factor levels.
| Group | /106 | /104 | ||
|---|---|---|---|---|
| 1 | 3.08 | 1.61 | 0.03 | |
| 2 | 3.83 | 2.12 | 0.07 | |
| 3 | 4.57 | 2.45 | 0.11 | |
| 4 | – | – | – |
Table 3.
Summary of the observed main effects (major diagonal) and interactions (minor diagonals) for increasing the variable parameters from the lowest to the highest factor level.
Table 3.
Summary of the observed main effects (major diagonal) and interactions (minor diagonals) for increasing the variable parameters from the lowest to the highest factor level.
| − | ∘ | ∘ | ||
| − | ∘ | ∘ | + | |
| ∘ | ∘ | + | ||
| ∘ | + | + |
Table 4.
Quality parameters of the correlation according to (Equation (12)).
Table 4.
Quality parameters of the correlation according to (Equation (12)).
| in % | RMSE | in % | in % |
|---|---|---|---|
| 96.3 | 129 | −0.812 | 7.53 |
© 2018 by the authors. Licensee MDPI, Basel, Switzerland. This article is an open access article distributed under the terms and conditions of the Creative Commons Attribution (CC BY) license (http://creativecommons.org/licenses/by/4.0/).
Share and Cite
MDPI and ACS Style
Bleier, F.; Schwitzke, C.; Bauer, H.-J. Prediction of Heat Transfer in a Jet Cooled Aircraft Engine Compressor Cone Based on Statistical Methods. Aerospace 2018, 5, 51. https://doi.org/10.3390/aerospace5020051
AMA Style
Bleier F, Schwitzke C, Bauer H-J. Prediction of Heat Transfer in a Jet Cooled Aircraft Engine Compressor Cone Based on Statistical Methods. Aerospace. 2018; 5(2):51. https://doi.org/10.3390/aerospace5020051
Chicago/Turabian StyleBleier, Fabian, Corina Schwitzke, and Hans-Jörg Bauer. 2018. "Prediction of Heat Transfer in a Jet Cooled Aircraft Engine Compressor Cone Based on Statistical Methods" Aerospace 5, no. 2: 51. https://doi.org/10.3390/aerospace5020051
Note that from the first issue of 2016, this journal uses article numbers instead of page numbers. See further details here.