1. Introduction
Since the collapse of the Lehman Brothers in 2008 and the consequent domino effects on major economies, the Bank of Japan (BoJ) has decided to provide liquidity to markets by adopting a second round of Quantitative (QE) and Qualitative Easing (CE) again after the period of 2001–2006. QE is defined as large-scale asset purchases, which are financed by central bank money. Thereby, excess reserves are created by ample liquidity injections by monetary authorities that aim to help to ensure financial stability. In combination with the zero interest rate policy, these were the basic means in Japan from 2001 to 2006 and had moderate, but important results for preventing a new crisis. When it comes to CE, it mainly works by helping credit creation through portfolio rebalancing. It requires asset price alterations to be effective and financial frictions, such as moral hazard and adverse selection, to be attenuated. Therefore, it is thought to be more target specific. QE and CE constitute the main forms of unconventional monetary policy when the economy is in a liquidity trap and zero interest rates leave no possibility for conventional monetary policy to be stimulatory. Interestingly, unconventional monetary practices may contain purchases of long-term securities in order to lower, long-term yields or may involve direct lending so as to inject liquidity in credit markets under distress (Fawley and Neely (2013) [
1]).
This study investigates the performance of Japanese mutual funds and their investment style when examined in the pre-Lehman Brothers collapse period in comparison to the period after that. According to Fawley and Neely (2013) [
1], the BoJ’s announcements about a second program of unconventional monetary measures commenced in 2008, after the Lehman Brothers collapse. Announcements by the monetary authorities in Japan involved a wide array of measures, including Special Funds-Supplying Operations (SFSOs), Outright Corporate Finance Instruments purchases (CFI), Fixed-Rate Operations (FROs), Growth-Supporting Funding Facility (GSFF) and Comprehensive Monetary Easing (CME). Interestingly, these announcements have affected economic units’ expectations, despite the implementation of these measures having started in 2011. This was the year that ‘‘Abenomics’’ were set off, namely the central bank triggered an anti-deflationary policy and in April 2013 announced that they would increase their monthly asset purchases so as to double the monetary base within two years.
A large volume of studies has examined unconventional monetary policies’ impact on assets indicating a significant positive effect (inter alia: Wang et al. (2015) [
2]; Hosono and Isobe (2014) [
3]; Honda et al. (2013) [
4]; Williams (2013) [
5]; Hanisch (2017) [
6]; MacDonald (2017) [
7]; Unalmis and Unalmis (2015) [
8]). Since the pioneering work of Sharpe (1992) [
9], there has been a growing literature focusing on assessing the style analysis of mutual funds globally (see for instance: Lobosco and DiBartolomeo (1997) [
10], Gallo et al. (1997) [
11], Cai et al. (1997) [
12], Bassett and Chen (2002) [
13], Amenc et al. (2003) [
14], Agudo and Marzal (2004) [
15], Papadamou and Siriopoulos (2004) [
16], Białkowski and Otten (2011) [
17], Bailey and Lopez de Prado (2012) [
18], Lean et al. (2015) [
19], Ahmad and Nor (2015) [
20], Kim et al. (2015) [
21]). Nevertheless, this study is the first that particularly employs a style analysis to examine the effects of active management on Japanese mutual funds in the pre- and post-Lehman Brothers collapse period. By employing style and performance analyses, we look into the effectiveness of active management in Japan during unconventional policy-adopting eras by monetary authorities. Namely, we intend to cast light on whether there are significant differences between active and passive strategies’ efficacy when ample liquidity is injected into the Japanese crisis-afflicted economy. Therefore, data on Japanese funds, as well as on Japanese sectors are utilized in order to assess excess returns due to active management, as well as alterations in style and sectoral exposure and performance. Differently said, our aim is to provide evidence regarding this innovative aspect of approaching non-conventional practices’ effects and to make out using style analysis whether management abilities regarding style selection and investing in the appropriate sectors can prove useful in terms of profitability. To this end, conventional times are compared with non-conventional ones by employing Sharpe criteria for assessment. To the best of our knowledge, none of the aforementioned studies has introduced this methodology to evaluate the impact of managers’ skills under the new framework of exceptional monetary easing so far. Our study adds to the existing literature by adopting the Sharpe style and performance analyses in studying how effectively Japanese mutual funds’ managers have performed and to what extent active management adds value to these funds over unconventional periods. Because further monetary policy options are still at stake in Japan, our results for the Japanese economy shed light on the impact of the currently-implemented measures adopted by other leading central banks on their mutual funds’ sectors.
The remainder of this paper is structured as follows:
Section 2 provides a literature review on style and performance analyses in relevant studies.
Section 3 gives information about the data and the main methodology of our research. In
Section 4, the empirical results are presented. Finally,
Section 5 concludes.
2. Literature Review
In line with the importance of asset returns and volatility, a non-negligible volume of studies about a significant number of countries has made use of Sharpe indices in order to evaluate the performance of mutual funds and relate it with their investment styles.
First, Sharpe (1994) [
22] by using the Treynor and Sharpe indices finds that only eleven out of thirty-four open-type mutual funds performed better than the Dow Jones portfolio. By employing the same methodology, Duggimpudi et al. (2010) [
23] find evidence for well-diversified funds that exhibit higher performance than the market. This is in tandem to Ahmad and Nor (2015) [
20], who find that the main pension funds in Malaysia, Singapore, Hong Kong and South Korea all had a negative real return. Moreover Drobetz and Kohler (2002) [
24], by studying fifty-one German and Swiss balanced mutual funds, attribute over 80% of returns’ variability to asset allocation. According to Gallo et al. (1997) [
11], Cai et al. (1997) [
12] and Detzler (1999) [
25], mutual funds were not able to overcome the benchmarks. Studies with differentiated approaches include: Lobosco and DiBartolomeo (1997) [
10], who find an approximation for Sharpe style weights and use Monte Carlo simulation, and Agudo and Marzal (2004) [
15], who use a modified Sharpe ratio for approximating a utility index. Notably, Lo (2002) [
26] finds that the Sharpe ratio can be overstated by up to 65% due to serial correlation. Interestingly, Lean et al. (2015) [
19] by employing the Fama–French three factor model (1993) [
27] find evidence that active management did achieve positive excess returns, whereas Davis (2001) [
28] argues that it did not. In accordance to the latter, Białkowski and Otten (2011) [
17] by employing the Carhart four-factor model (1997) [
29] argue that mutual funds underperformed.
At this point, we have to mention that Return-Based Style Analysis (RBSA) techniques are found to hold an increased portion of attention in the mutual fund literature. Specifically, Agarwal and Naik (2000) [
30] employ a generalized style analysis and find robustness for risk exposures of hedge funds with short positions and large shares. Lee (1997) [
31] shows alterations in the effective mixture of assets, and Ibbotson and Kaplan (2000) [
32], by examining ninety-four U.S. mixed mutual funds, find a high exposure to bonds and high-capitalization U.S. stocks. Domian and Reichenstein (2008) [
33] and Weng and Trück (2011) [
34] show the inclination of high-yield bonds towards small-cap stocks and important exposure to Asian developing markets’ stocks and cash and high-ranked bonds, respectively. Moreover, Das and Uma Rao (2013) [
35] investigate ninety-four U.S. socially-responsible mutual funds and find that active management does not add value. In the same vein, Papadamou and Siriopoulos (2004) [
16] find that only five out of nineteen U.S. mutual funds investing in Europe had positive cumulative returns, and none could outperform the Eurostoxx benchmark. According to Gallo et al. (2000) [
36], twenty-five real estate mutual funds in the U.S. have a larger Sharpe index than the weighted market capitalization index. Plantinga and Scholtens (2001) [
37] analyze more than 800 investment funds and find significant differences regarding performance characteristics, in contrast to Scholtens (2005) [
38], who finds no significant differences between styles. Interestingly, Barberis and Schleifer (2001) [
39] and Brown and Goetzmann (2001) [
40] argue that assets with the same style demonstrate large comovements in performance.
Gronewoller et al. (2001) [
41] separate stock mutual funds according to stock capitalization and find no overperformance, whereas Otten and Bams (2002) [
42] look into the returns of five hundred and six European stock mutual funds and find that low capitalization European mutual funds are capable of adding value. Moreover, Prince and Bacon (2010) [
43] by analyzing forty small capitalization growth mutual funds find that twenty-seven of them outperformed the Russell 2000 benchmark. When it comes to Bauer et al. (2005) [
44], they find that risk-adjusted returns between ethical and conventional funds do not differ. Moreover, Chau et al. (2003) [
45] provide evidence that management skills do not highly matter, and Chen and deBondt (2004) [
46] argue that buying past winners and selling past losers leads to better performance. In a similar vein, Capocci and Hübner (2004) [
47] present evidence of a preference towards investment in small capitalization stocks and emerging markets’ bonds. Christensen (2005) [
48] finds that none of the mutual funds in Denmark could have excess returns. Interestingly, Noulas et al. (2005) [
49] by studying twenty-three Greek stock mutual funds show positive returns during the first three years in the stock exchange, but those did not endure. For their part, Hakamada et al. (2007) [
50] investigate Asia-Pacific hedge funds and decompose returns into asset class factors. In a different approach, Phoon et al. (2008) [
51] study fifty Australian mutual funds and find that the majority of managers did not outperform their benchmark. Moreover, Amenc et al. (2003) [
14] show that stock portfolios’ managers investing globally tend towards larger diversification. Finally, Tan (2015) [
52,
53] studies fifteen stock mutual funds during the QE period and find significant manager skills in portfolio selection.
When referring to innovations in estimating, Idzorek and Bertsch (2004) [
54] develop a style-drift score, whereas Swinkels and van der Sluis (2001) [
55] also use rolling regressions. In a similar vein, Bassett and Chen (2002) [
13] use quantiles in regressions to examine the effect of style on the tails of the conditional return distribution, whereas Ter Horst et al. (2002) [
56] conduct simulations and find that investment style is not revealed by actual portfolio holdings. Moreover, Christodoulakis (2002) [
57] by adopting a decision-theoretic Bayesian framework finds that style factors indeed explain these returns during the selected period. Notably, Pattarin et al. (2004) [
58] propose a classification algorithm aiming to analyze time-series of past returns. Kim et al. (2015) [
21] examine the efficacy of using asymptotic and Bayesian confidence intervals for Sharpe-style weights. Furthermore, Bailey et al. (2012) [
18] support that the Probabilistic Sharpe Ratio (PSR) should account for estimation errors in an Identical Independent non-normal Distribution (IID).
The recent financial crisis that was triggered by the Lehman Brothers collapse has led to worldwide renewed interest in the effects of non-standard policies on asset performance. Not surprisingly, therefore, there has been a growing volume of literature concerning QE impacts on asset prices in the last few years, indicative of the importance of non-conventional policy throughout markets. In the case of Japan (inter alia), Hanisch (2017) [
6] argues that a monetary policy shock that raises the monetary base has a positive strong effect on stock prices. Unconventional policy is found to be effective on the real economy through the stock price channel (Honda et al., (2013) [
4]). Specifically, Lambert and Ueda (2014) [
59] argue that there is no clear effect of monetary easing on bank stock valuation, whereas Reza et al. (2015) [
60] and Hosono and Isobe (2014) [
3] support that QE effectiveness may be affected by imperfect pass-through to asset prices. Moreover, Wang et al. (2015) [
2] by employing a value-at-risk methodology provide evidence that right-tails of U.S. and Japanese stock returns decrease, whereas left-tails of markets increase due to QE. Therefore, this paper tries to shed light on this direction by investigating the performance and style of equity funds over a QE versus a non-QE period in Japan.
4. Empirical Findings
4.1. Mutual Funds’ Performance
In
Table 3, performance analysis is conducted for the whole sample period. The cumulative returns of mutual funds are exhibited in the first line of the table. The HJPIX mutual fund has the highest cumulative return (0.687), whereas the GNJFX has the lowest (0.139) and is the only one not able to get higher than the TOPIX benchmark. Worth mentioning at this point is that five out of eight mutual funds have higher cumulative returns than the market benchmark (only the CNJFX and the FJPNX do not).
The HJPIX and HJPNX mutual funds have the largest monthly returns, equal to 0.5%, whereas the CNFJX has the lowest monthly return (0.1%). All mutual funds, apart from the CNJFX, have a return equal to or lower than the benchmarks. The same conclusions are drawn by testing the monthly average geometric return (Geo Mean). Notably, the Sharpe ratio is higher than the TOPIX benchmark in seven out of eight mutual funds in monthly, as well as in annualized excess returns. The same is not true when comparison is made with the Mkt benchmark, which outperforms half of the funds.
In
Table 4, it can be seen that seven mutual funds have a positive alpha, implying higher risk-adjusted returns than the TOPIX benchmark. HJPIX and HJPNX present the highest alphas, whereas CNFJX has the lowest. The residuals’ deviation values (Residual Standard Deviation (RSD)) indicate similar values across funds with the exception of FJSCX. When it comes to estimation with the French market index (Mkt) as the benchmark, six out of eight funds have positive annualized alphas, thereby higher returns than the Mkt index. CNJFX is again found to have the lowest risk-adjusted return. In case of the TOPIX index, the explanatory power of the model measured by
R2 ranges from 46% to 69.88%, while these figures increased significantly in the case of the French’s market index. Using both benchmarks, the FJPNX and PRJPX have the highest values of
R2.
By focusing on the graphical presentation of mutual funds’ cumulative returns in
Figure 1, we are driven to the following comments. Firstly, almost all funds present a negative cumulative return over the pre-crisis period, in contradiction to the second period, where every fund demonstrates significant positive values. This latter result may be attributed to the extensive quantitative easing policies undertaken by a number of developed central banks. Secondly, only one fund exhibits a positive cumulative although small return in the pre-Lehman Brothers default period. Additionally, this fund outperformed the two benchmark indices. Moreover, there is a lower than 10% standard deviation of returns in annualized terms, if the TOPIX benchmark is employed, on only three out of eight funds, whereas volatility is lower under the Mkt benchmark.
R2 values indicate a better fit of the data under the Mkt index. Furthermore, beta coefficients provide evidence for more aggressive funds relative to the market when the Mkt benchmark is employed. When it comes to the alpha/beta ratio, this indicates by how much expected excess returns, which are determined by fundamental values, will be larger than the expected losses due to market volatility. Thereby, it helps express the degree by which the fund is anticipated to be able to confront efficiently the market risks and prove profitable.
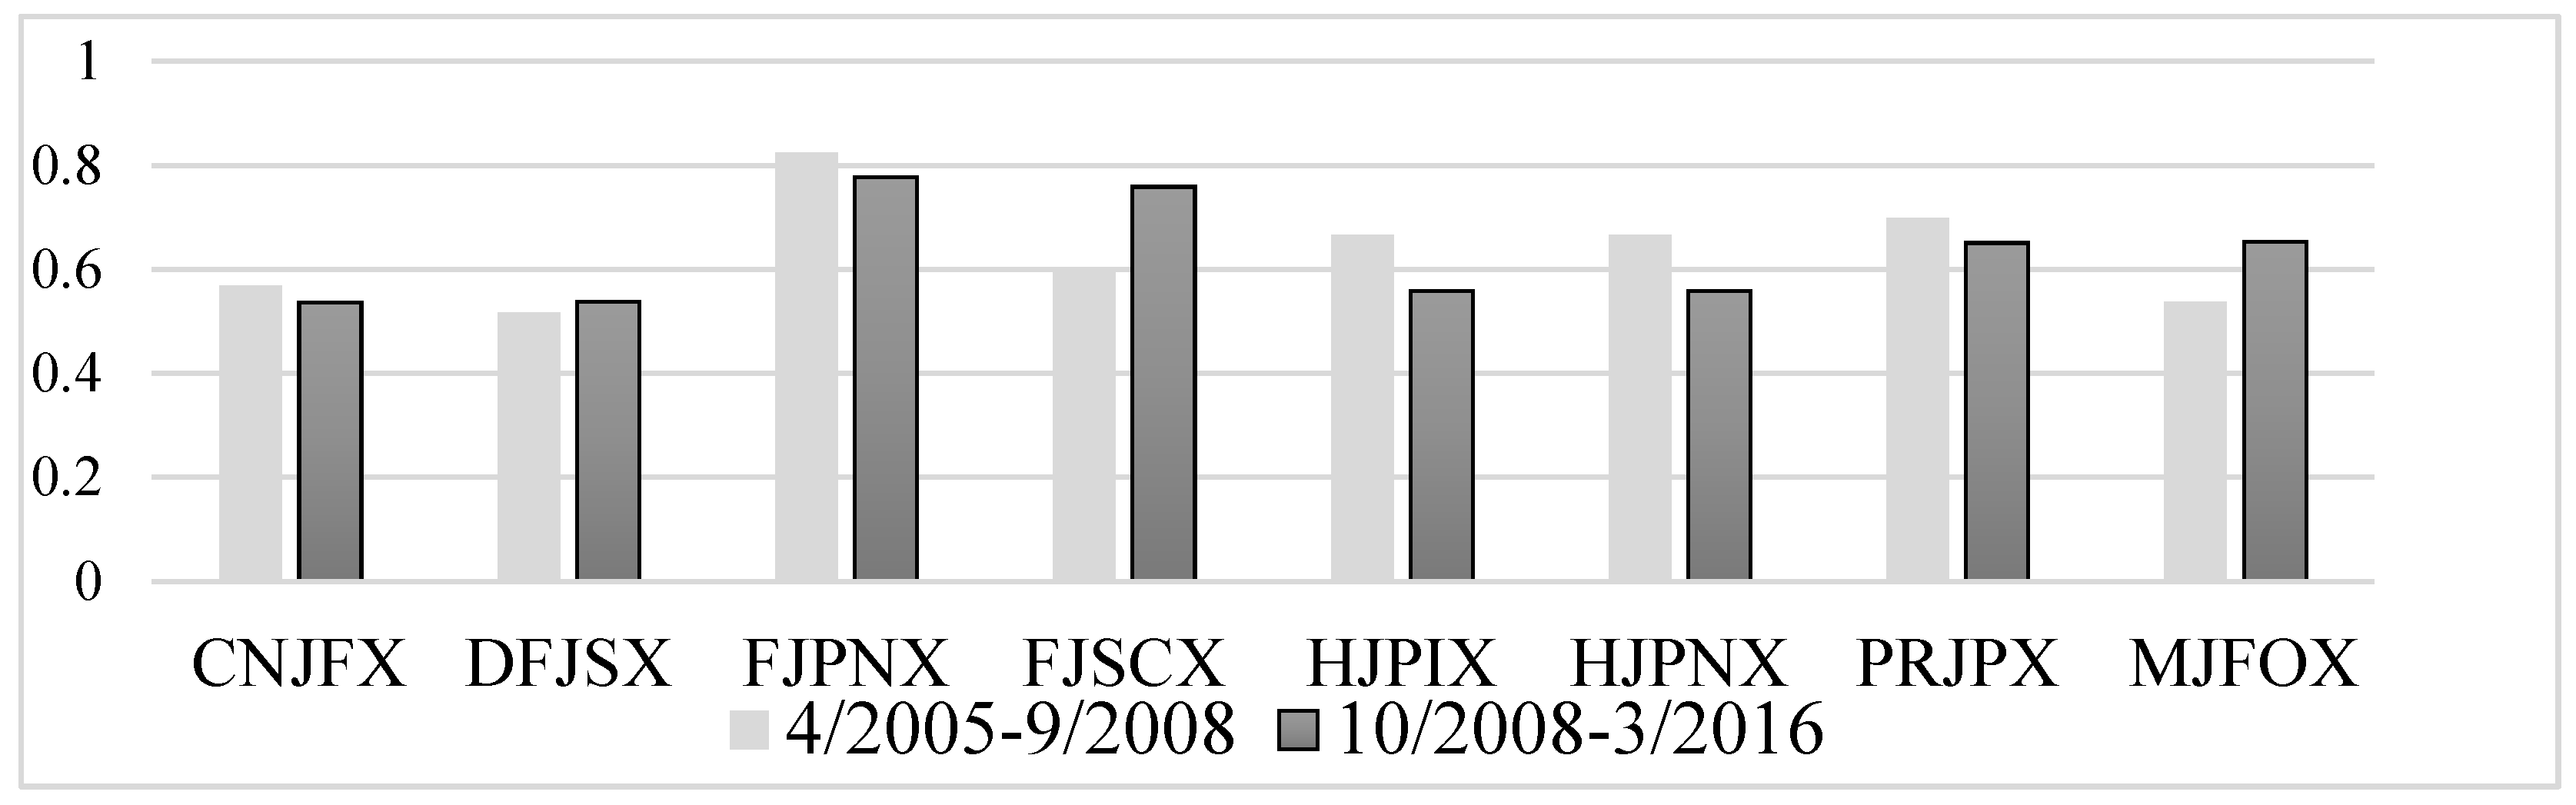
Figure 2 and
Figure 3 exhibit the evolution of systematic risk for each fund between the two sub-periods. Mutual funds are found to have lower volatility than the TOPIX benchmark. After the crisis outburst, risk is found to lessen for the majority of mutual funds. DFJSX has the lowest beta (0.517) pre-crisis, while CNJFX (0.536) post-crisis.
One can observe that four mutual funds have a higher systematic risk in the after-2008 period. As regards the rest, two of them have almost equal risk with the pre-Lehman Brothers collapse period. All funds exhibit a higher than 0.8 systematic risk coefficient no matter whether the examination takes place with pre-2008 or after-Lehman Brothers default data.
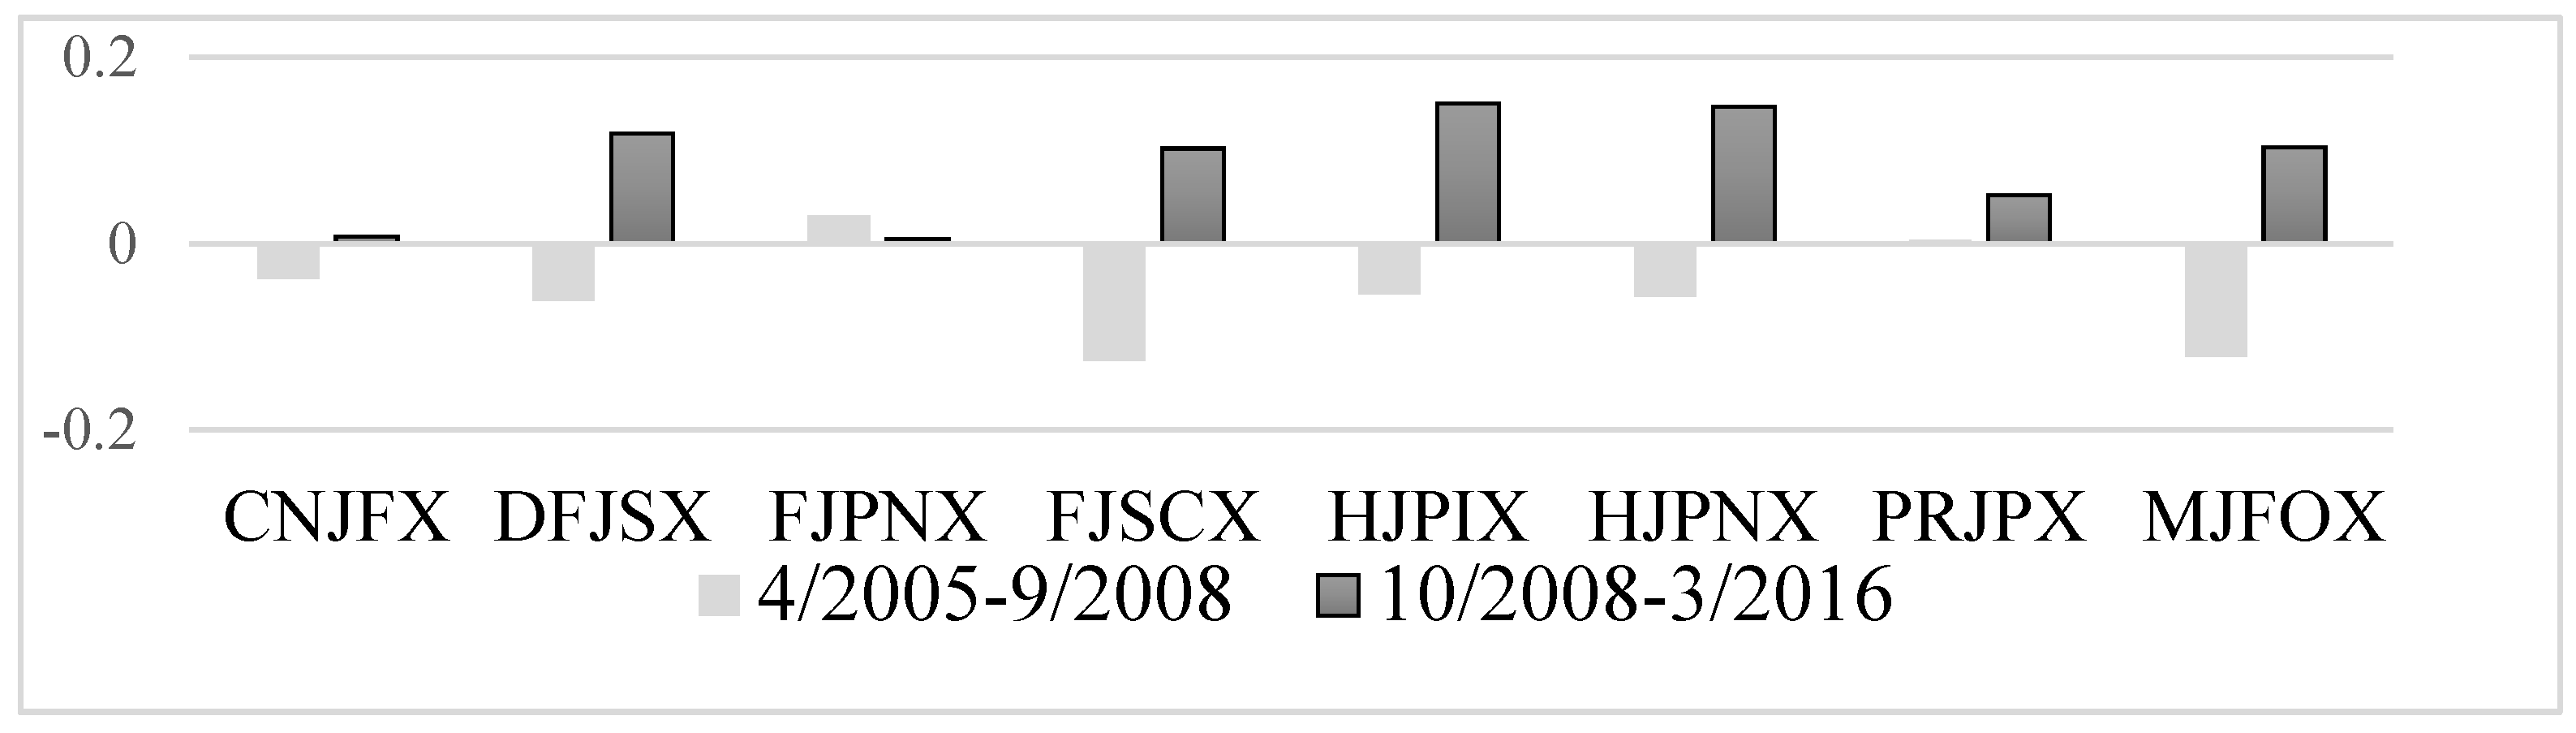
Figure 4 presents the Sharpe index for mutual funds. This index is a risk-adjusted measure of return in order to assess the efficiency of mutual funds. It can be seen that five out of eight funds have higher than a 0.15 ratio for the post-Lehman collapse period, and all eight have higher than 0.05 values. On the other hand, all funds but one exhibit negative Sharpe ratios before 2008.
During the pre-Lehman Brothers default period, the ratio is found to be negative for the majority of the mutual funds, as well as for the benchmarks. Only one fund has a positive Sharpe ratio before the Lehman Brothers collapse, and this is the only fund with a higher value than the benchmarks. On the other hand, all mutual funds exhibit positive Sharpe ratios during the second sub-period. The highest is that of HJPIX (0.206) and is followed by: HJPNX (0.203), MJFOX (0.171) and DFJSX (0.168). SNJFX and FJPNX have the lowest values and are the only that are below the benchmarks. Moreover, FJPNX has the smallest increase of all compared to the pre-crisis period.
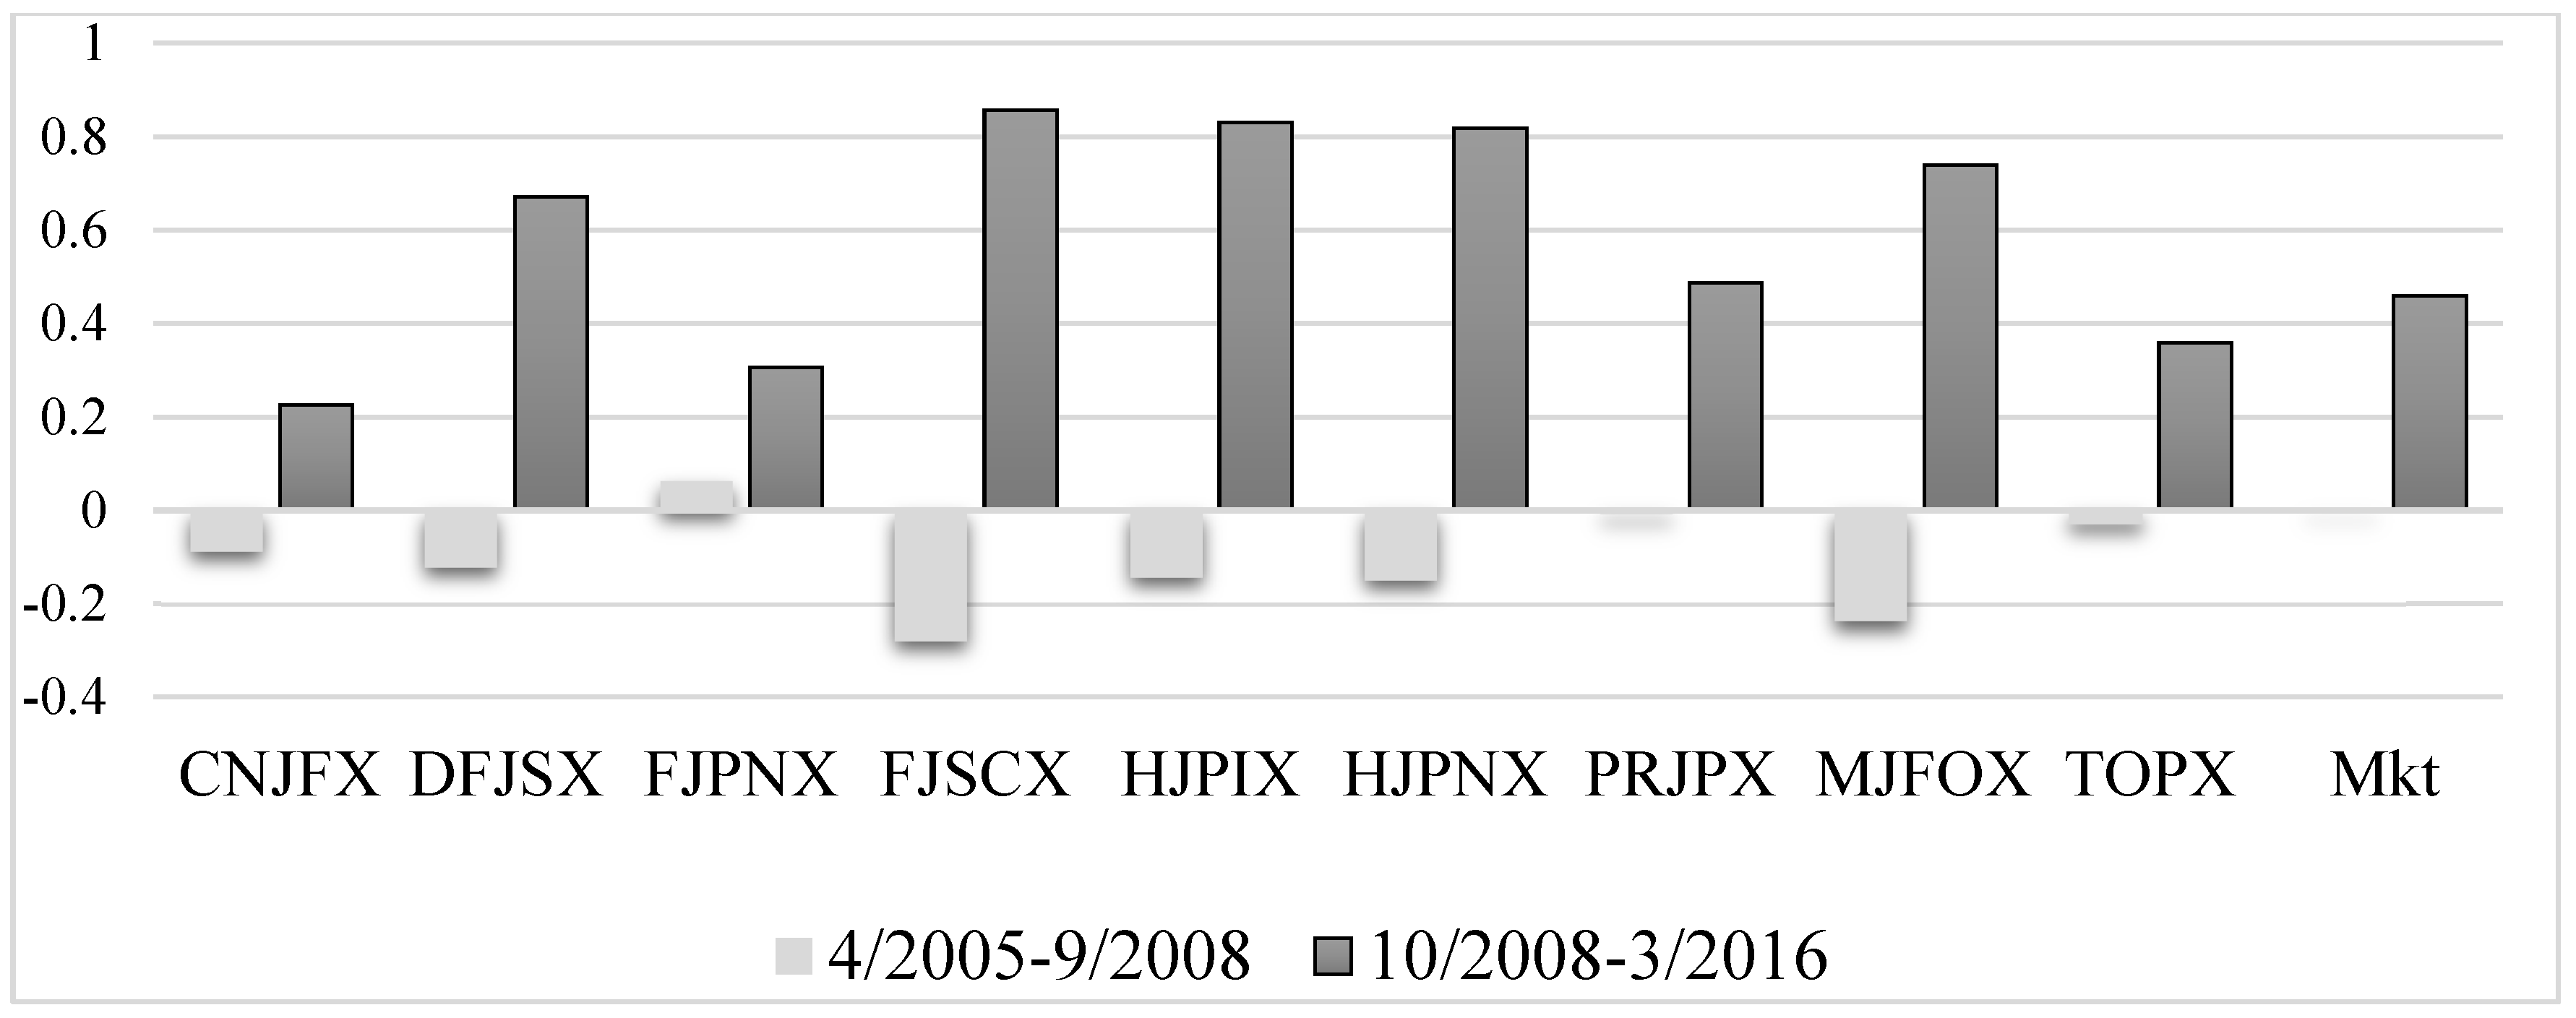
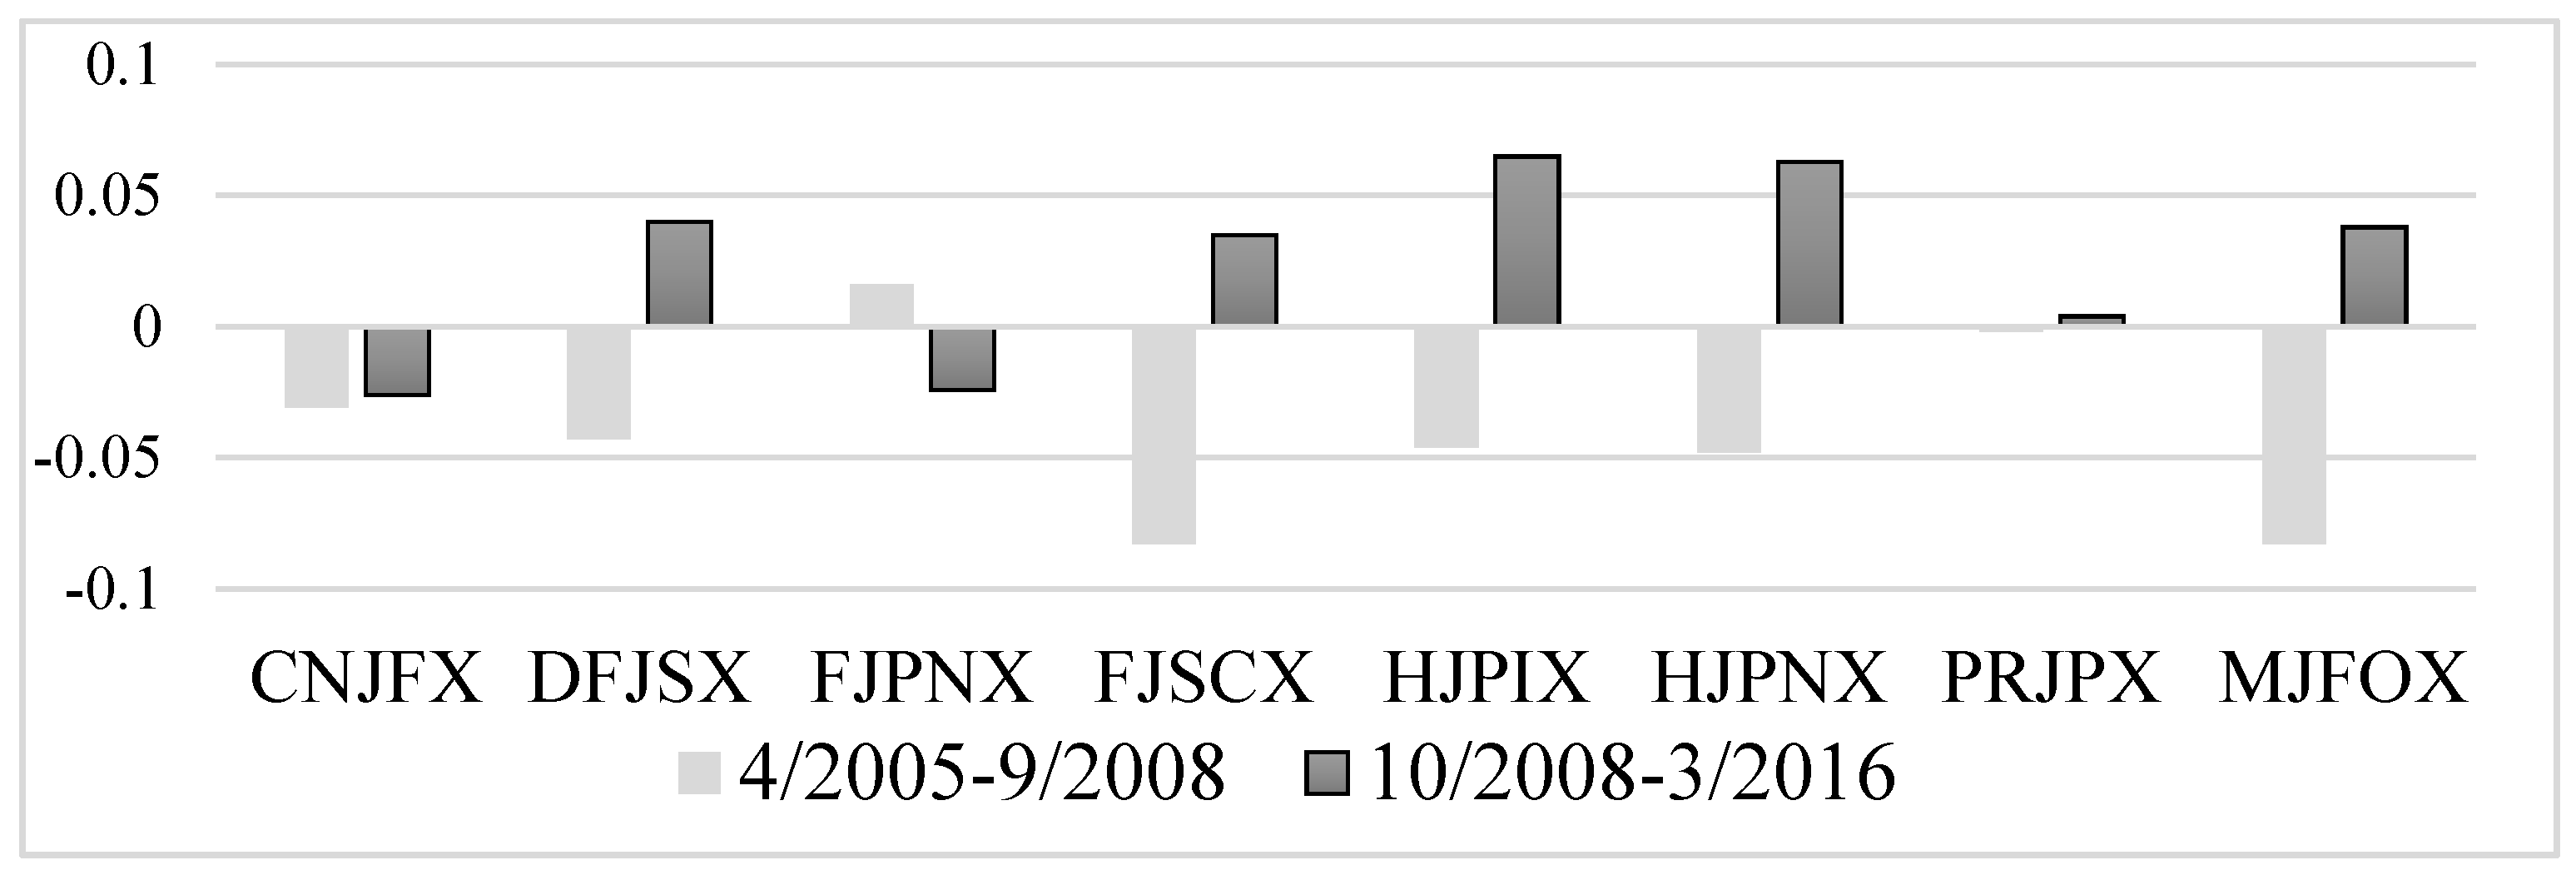
Figure 5 and
Figure 6 demonstrate the alpha/beta ratios when the TOPIX and the Mkt indices are applied, respectively. By taking TOPIX as a benchmark, the majority of mutual funds are found to have a negative alpha/beta index, as only PRJPX and FJPNX are slightly positive. Six out of eight mutual funds have negative alpha/beta ratios before the Lehman Brothers collapse in both diagrams. Alpha/beta ratios are found to present higher positive values in the post-2008 period and higher negative ones before 2008 by employing the TOPIX benchmark than when the Mkt benchmark is used. Notably, funds that performed better than others before the Lehman Brothers collapse are found unable to have high profits after 2008, contrary to funds that used to have poor performance.
4.2. Style Analysis
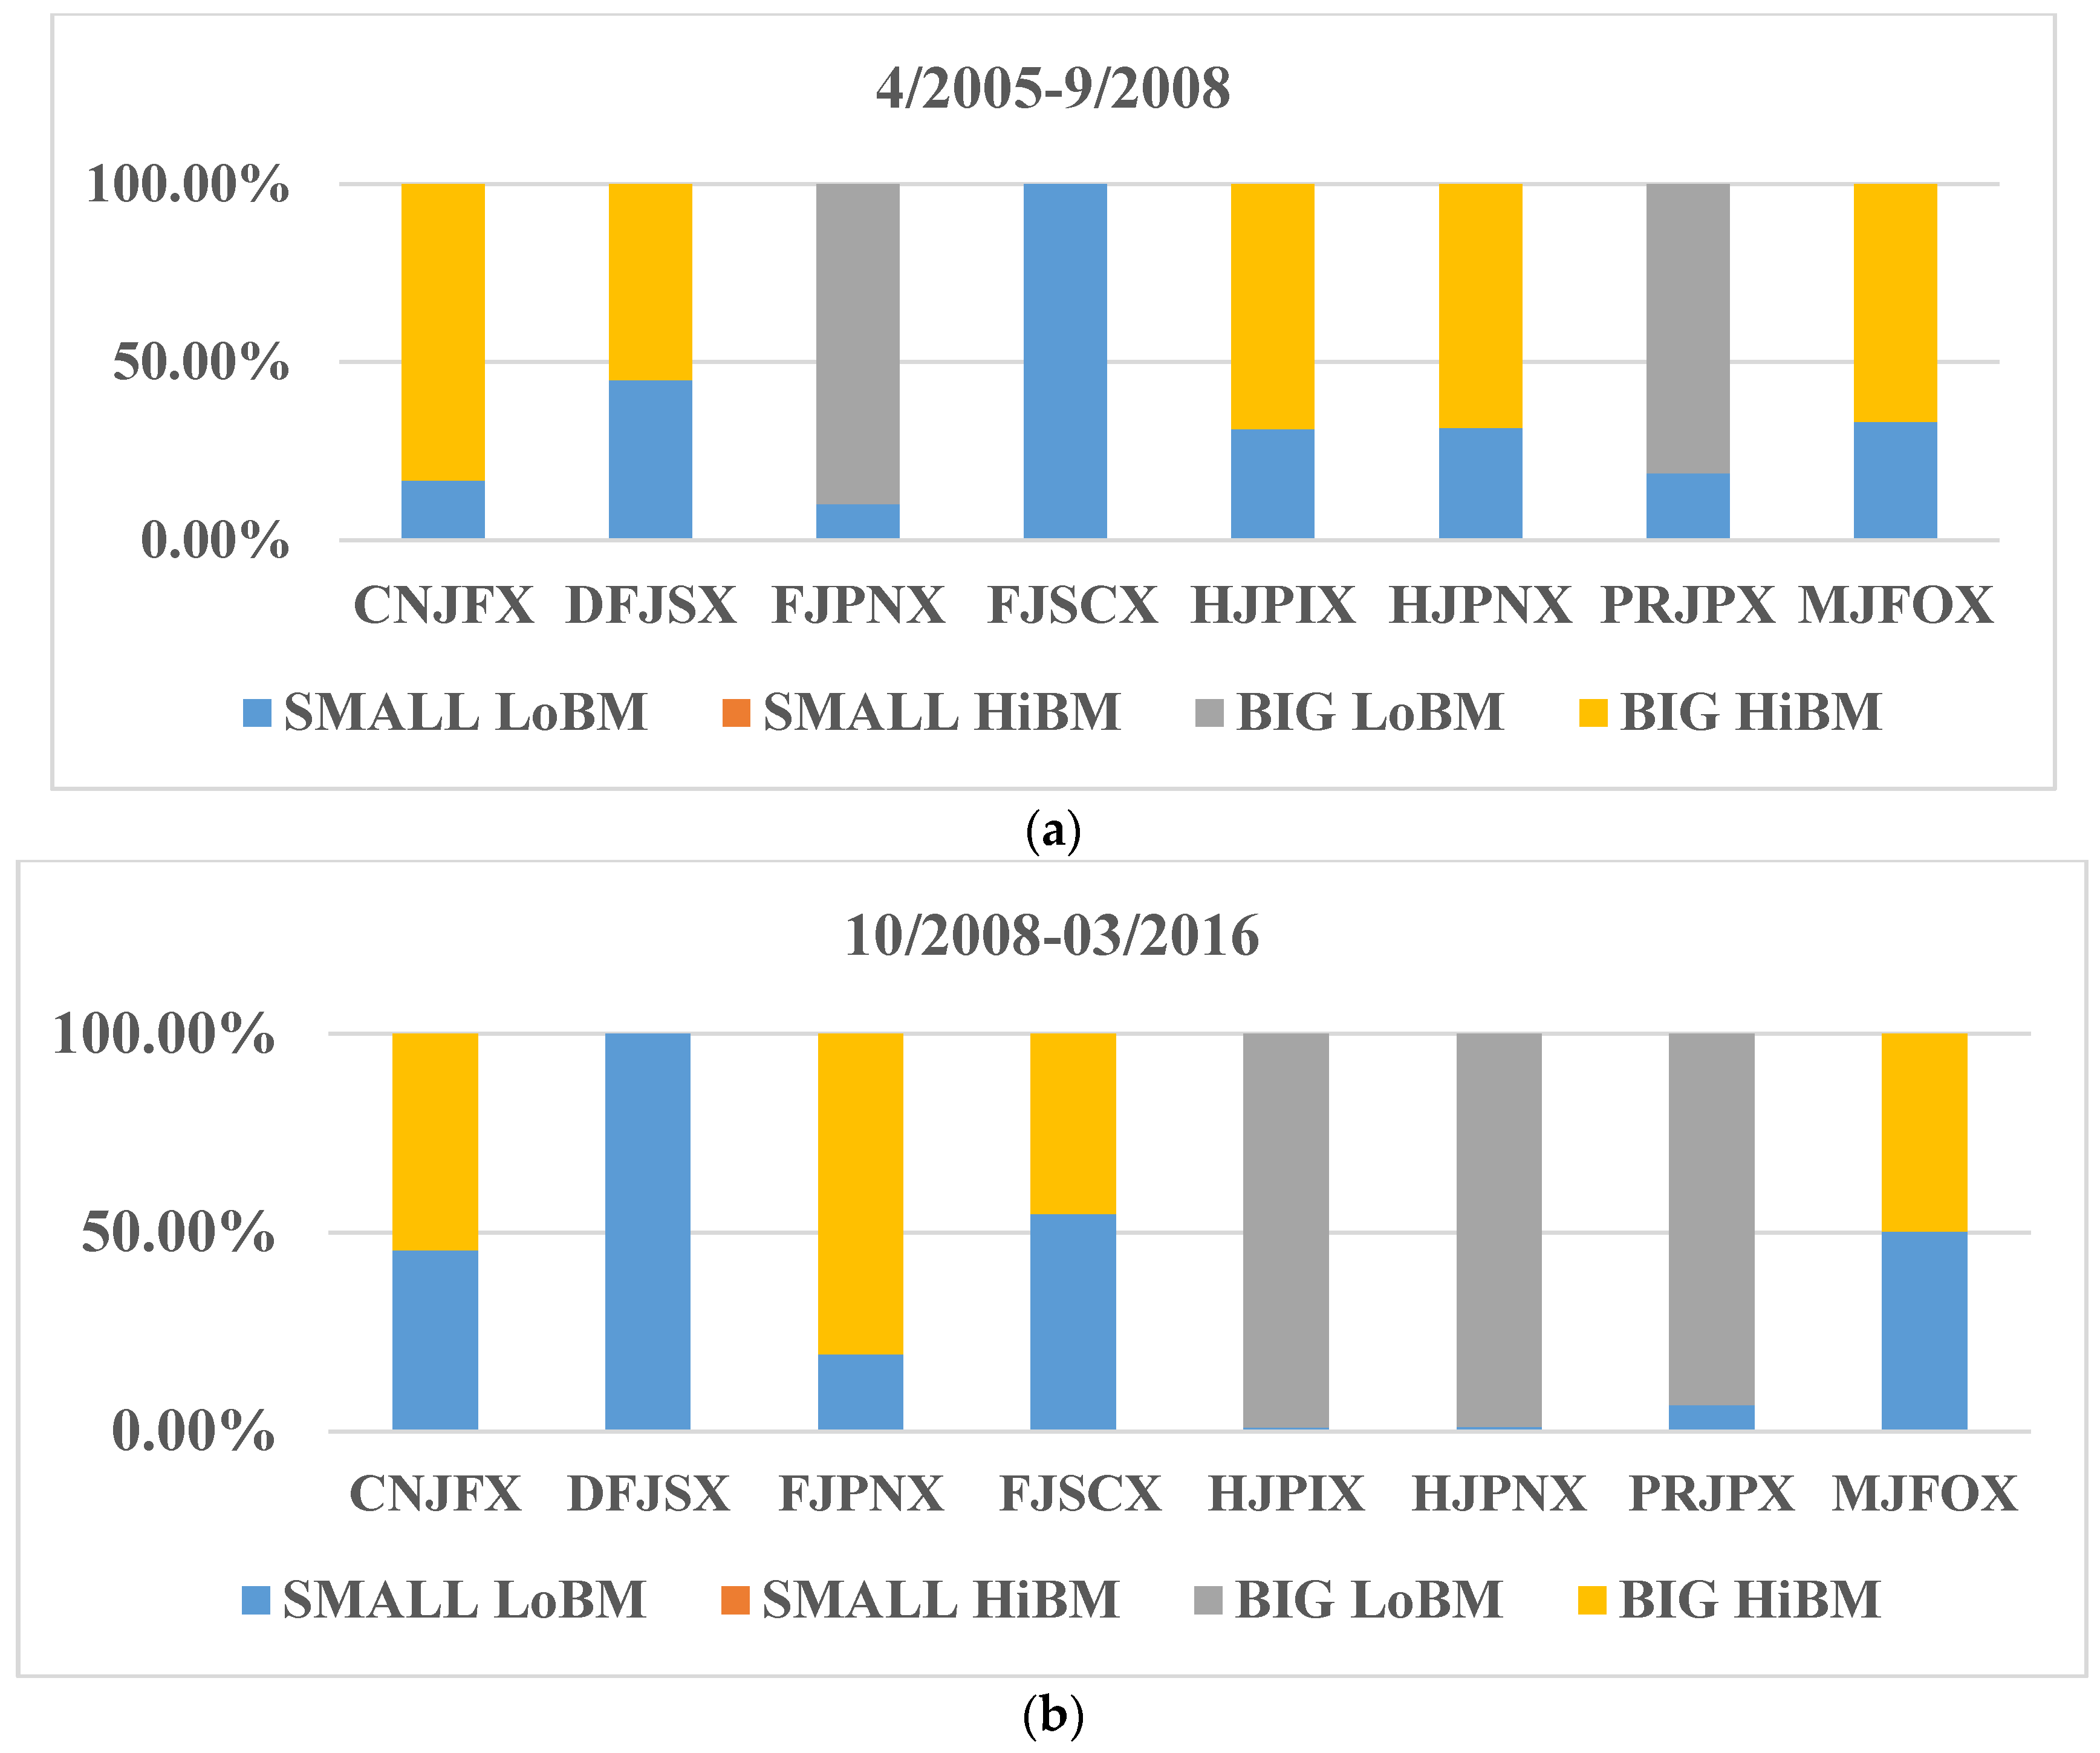
Table 5 provides information about the extent of each fund’s exposure to each investment style. The market portfolio, as well as six mutual funds are exposed only to the SMLoBM style and the BIGHiBM. It is observed that DFJSX and FJSCX are the only funds with a higher exposure to SMLoBM between the two styles. It is noteworthy that none of the mutual funds or the benchmarks is exposed to the SMHiBM style.
Table 6 provides useful measures about contribution of active management on mutual fund performance. The measure indicated as
RSelection is the difference between the return of the mutual fund and the return of a passive mixture with the same style. An active fund manager is considered to have excess returns over the benchmark style. In four (CNJFX, FJSCX, HJPIX, HJPNX) out of eight occasions, asset selections present a significant contribution to fund returns.
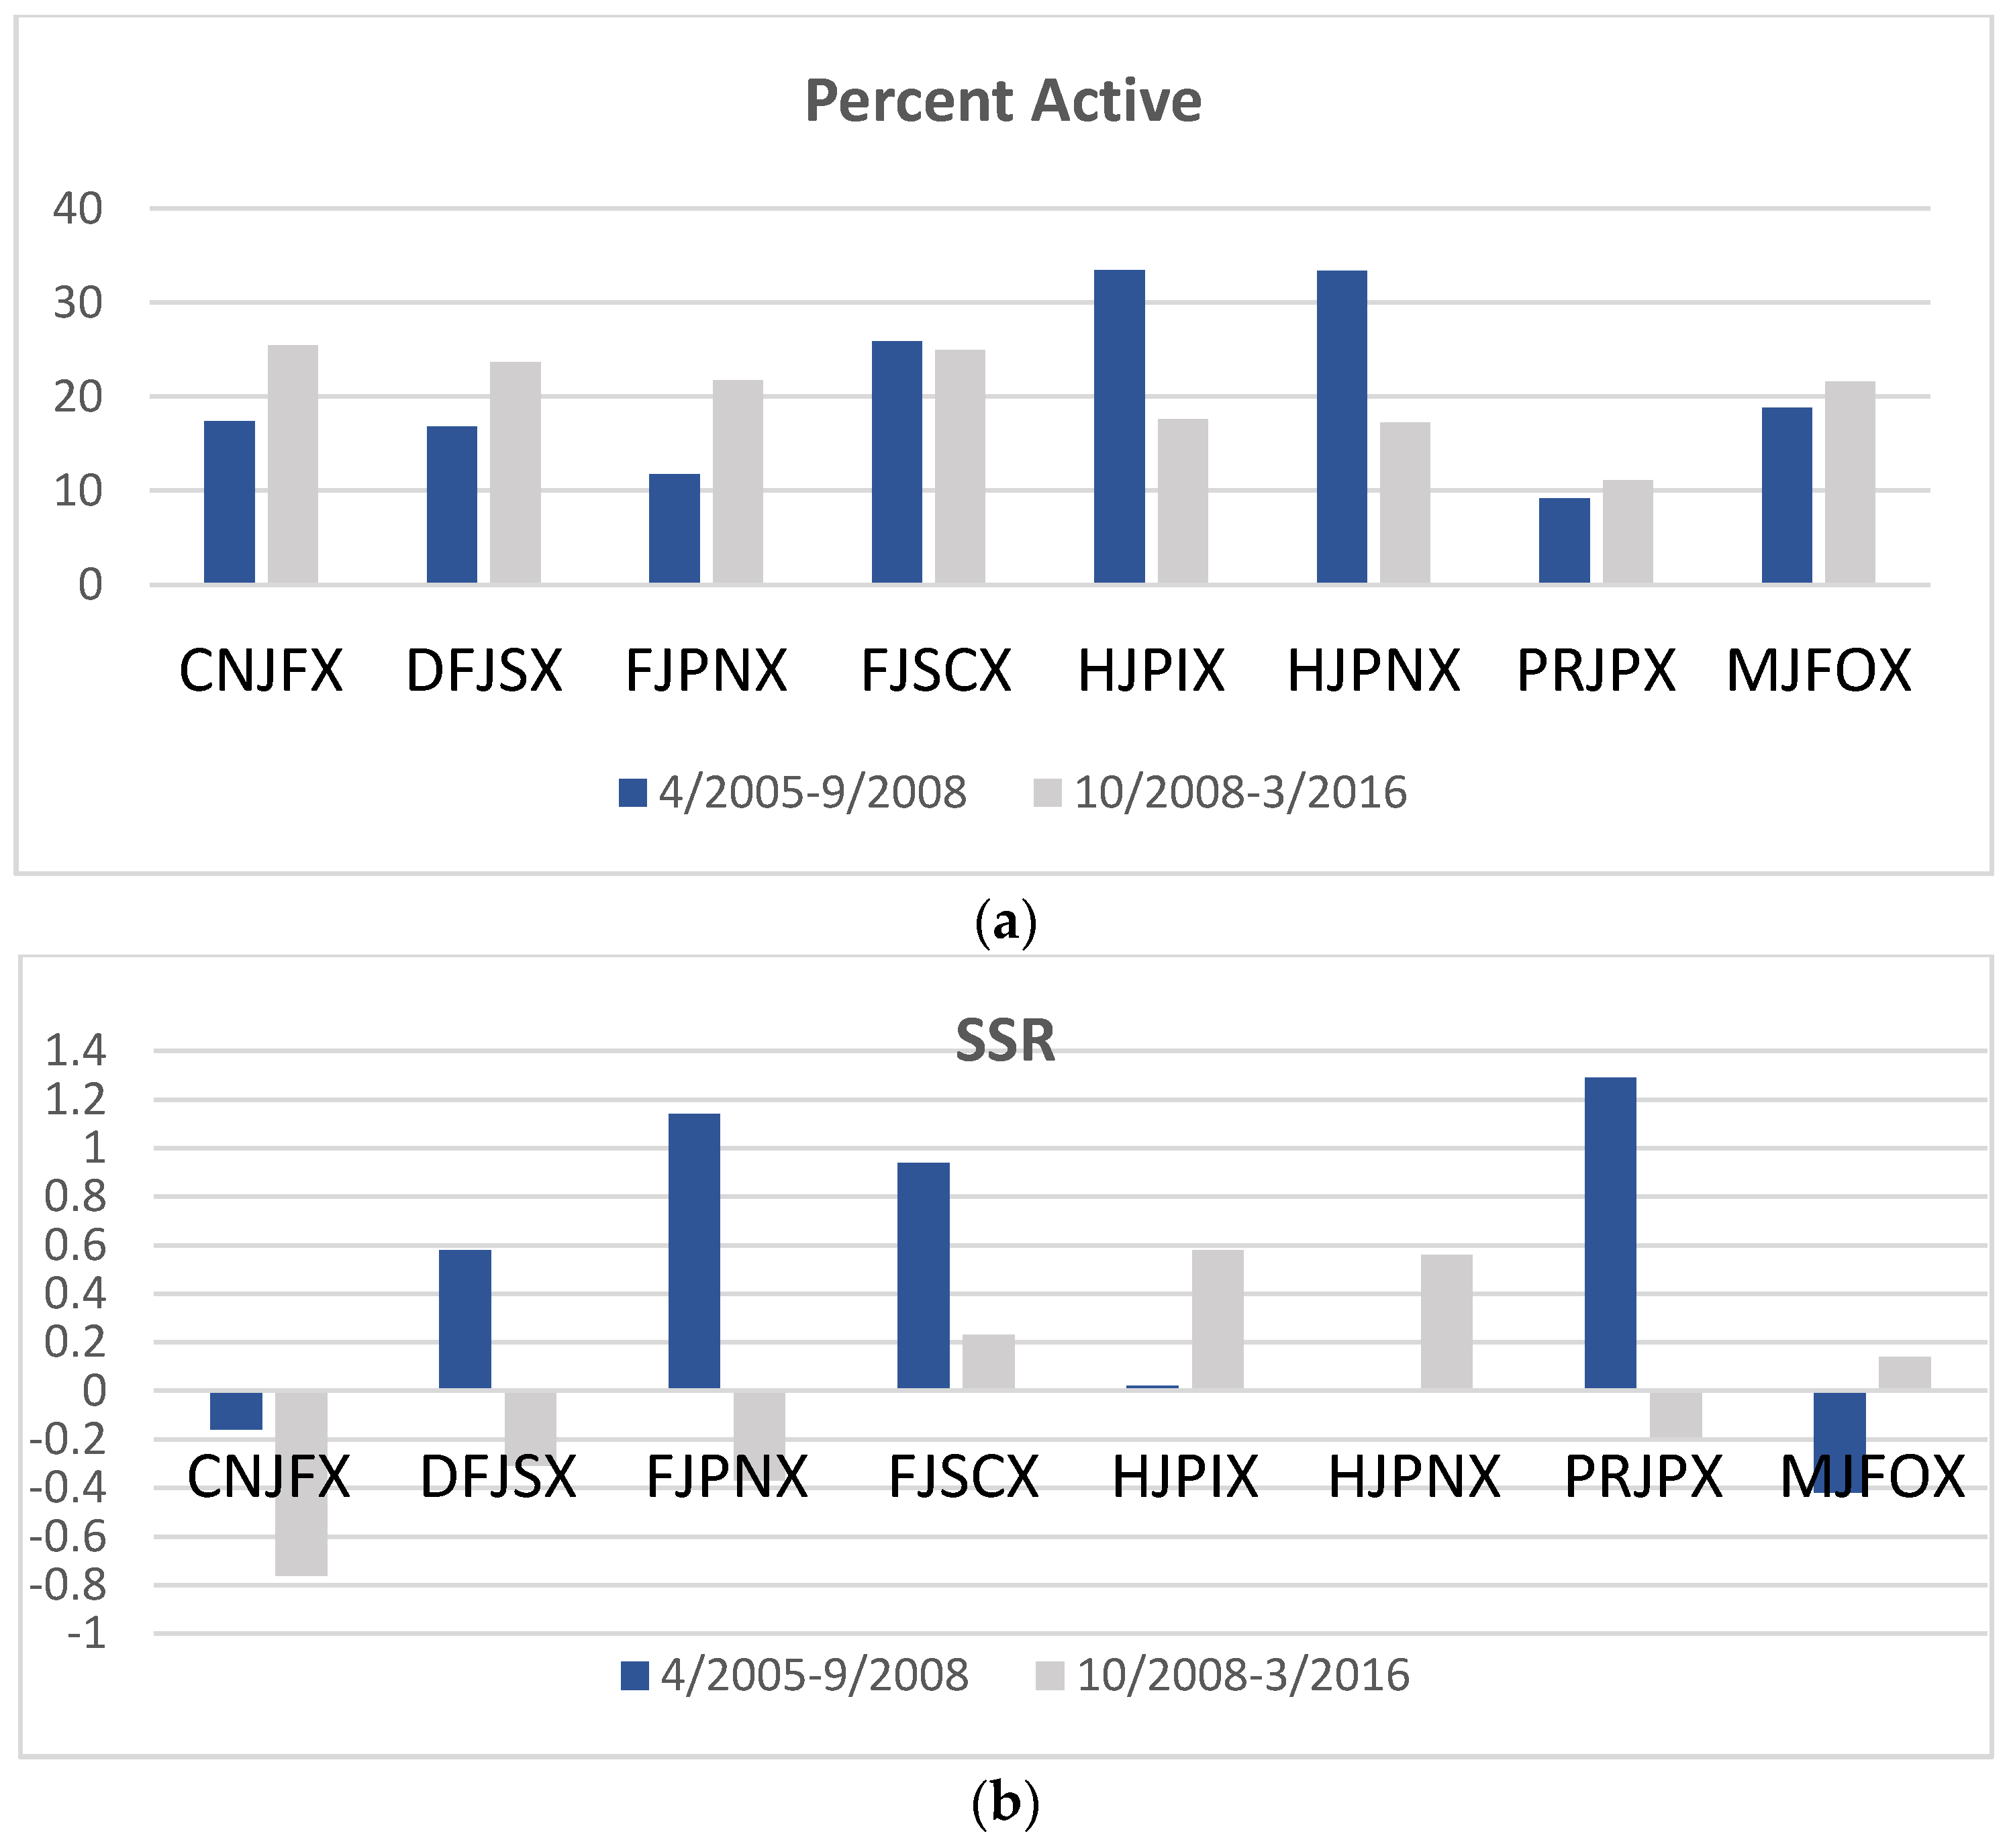
The Sharpe Selection Ratio (SSR) is used as an alternative measure of the traditional Sharpe ratio, as it allows one to demonstrate not only risk-adjusted return, but also how much is the added value per unit of risk when active management takes place. Volatility due to active management is found to be higher than 0.05 for seven out of eight funds, whereas the standard deviation due to style takes higher values only at four of the funds. Interestingly, seven out of eight mutual funds present a higher than 20% active value, where the latter measures deviation due to active management. By examining the SSR index, six out of eight funds exhibit a positive value added per unit of risk due to active management. However, none of them presents statistical significance according to the t-statistic.
Results indicate that HJPIX and HJPIN have the highest returns, whereas CNJFX has the lowest. It is shown that the majority of mutual funds have higher returns than from both benchmarks, as six out of eight funds have a higher RSelection than the benchmarks.
When it comes to standard deviations, FJSCX and FJPNX have the highest ones, whereas CNJFX the lowest. Overall, passive management is found to lead to higher deviations from active. It should be noted that active management has rendered four of the funds riskier than passive management would have. Furthermore, active management is found to be beneficial for the majority of mutual funds. According to the t-statistics, though, none of the mutual funds has a statistically-significant value-added due to active management.
Interestingly, there are significant changes in the post-Lehman Brothers collapse period in six out of eight funds, as only CNJFX and MJFOX have different percentages of exposures in the same styles as before. HJPIX and HJPNX have altered to being almost totally exposed to BIGLoBM, and also, PRJPX is more exposed to this than before 2008. Moreover, FJPNX has turned to BIGHiBM in place of BIGLoBM. Furthermore, FJSCX had the BIGHiBM substituting the SMLoBM style for more than 40% compared to the pre-Lehman Brothers collapse period.
Figure 7 exhibits the investment styles of the eight Japanese mutual before and after the Lehman Brothers collapse. Four out of eight mutual funds are found to present a higher preference for Big capitalization with Low Book to Market Value investment style in the second time period.
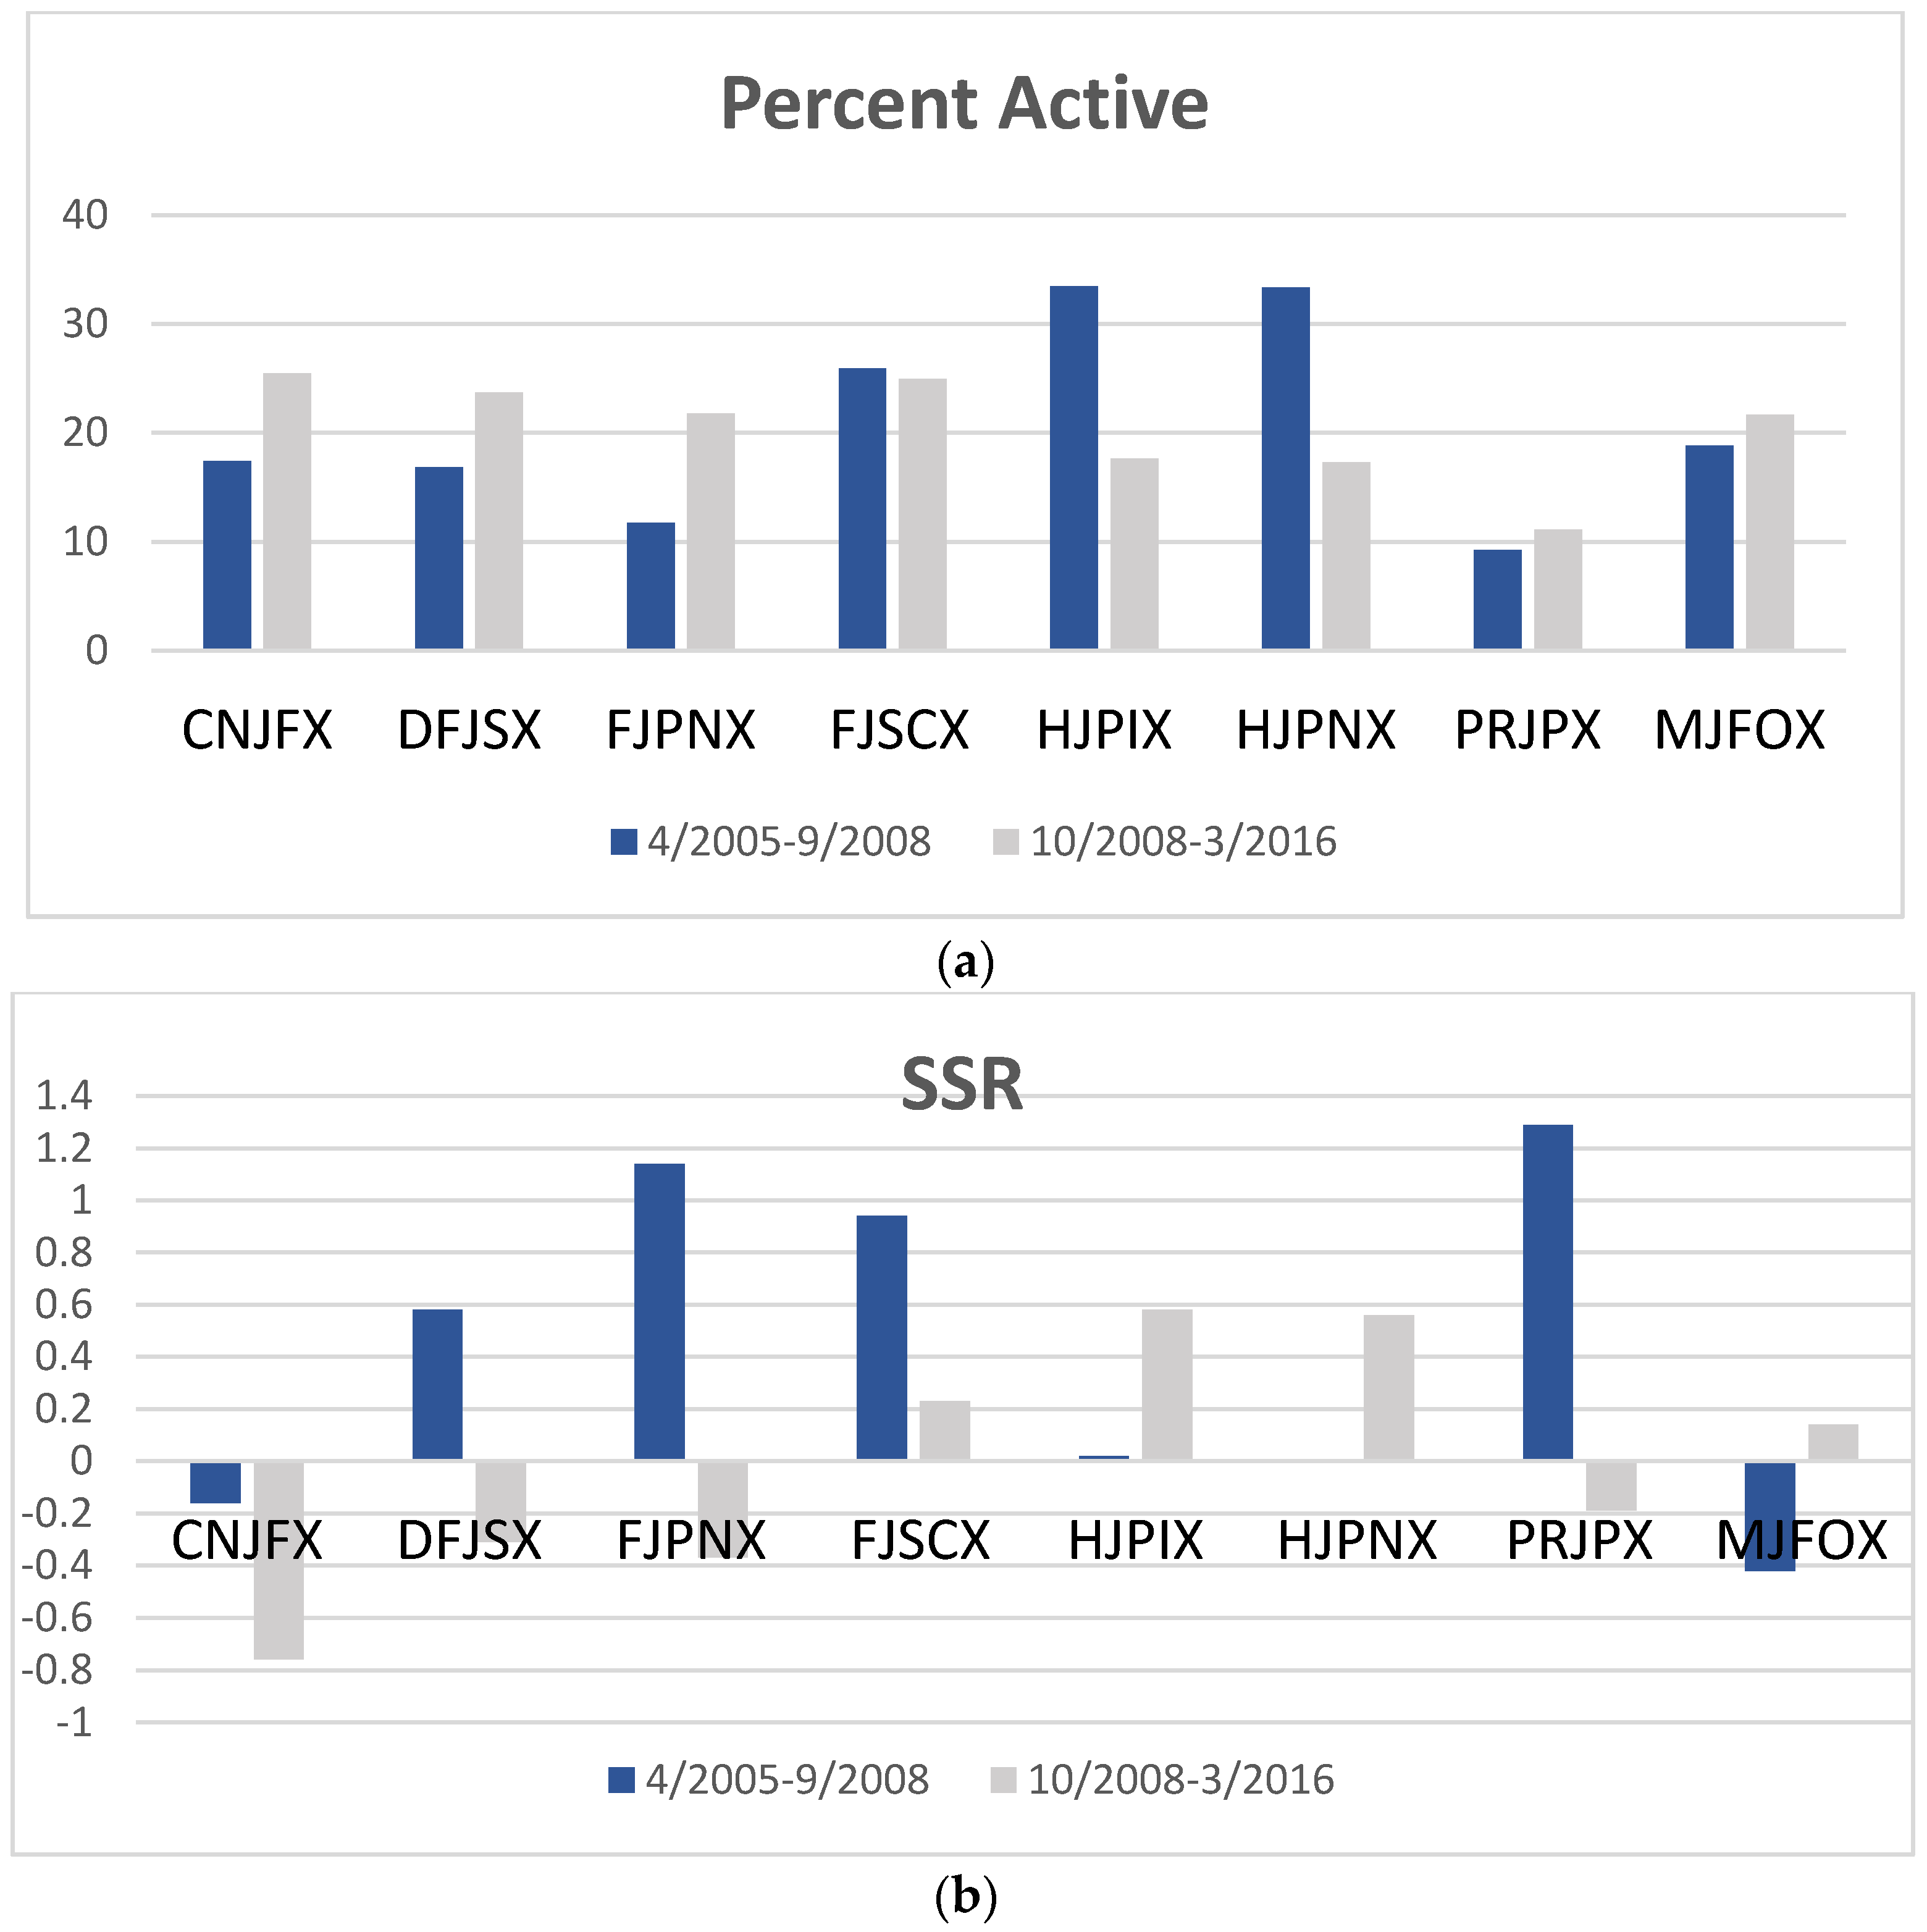
As can be seen from the first graph in
Figure 8, five out of eight mutual funds have their percentages of volatilities increased due to active management after the outburst of the financial crisis and the necessity for unconventional policy measures. This means that the actions of their managers renders them riskier during this period. FJPNX is shown to have the largest percentage change. HJPIX and HJPNX, on the contrary, present the highest drop, indicating lower risk due to active management over the second period.
The second graph of the same figure provides evidence that the selection Sharpe ratio is positive for the majority of mutual funds during the pre-crisis period, namely value is added per unit of added risk through active management. On the contrary, SSR values denote poor performance for half of the funds after the Lehman Brothers collapse, implying that active management in a monetary easing environment does not add significant value to the mutual fund performance. Worth mentioning over this second period is the distinction of the two funds, namely HJPNX and HJPIX, as it seems that their style drift leads them to higher performance.
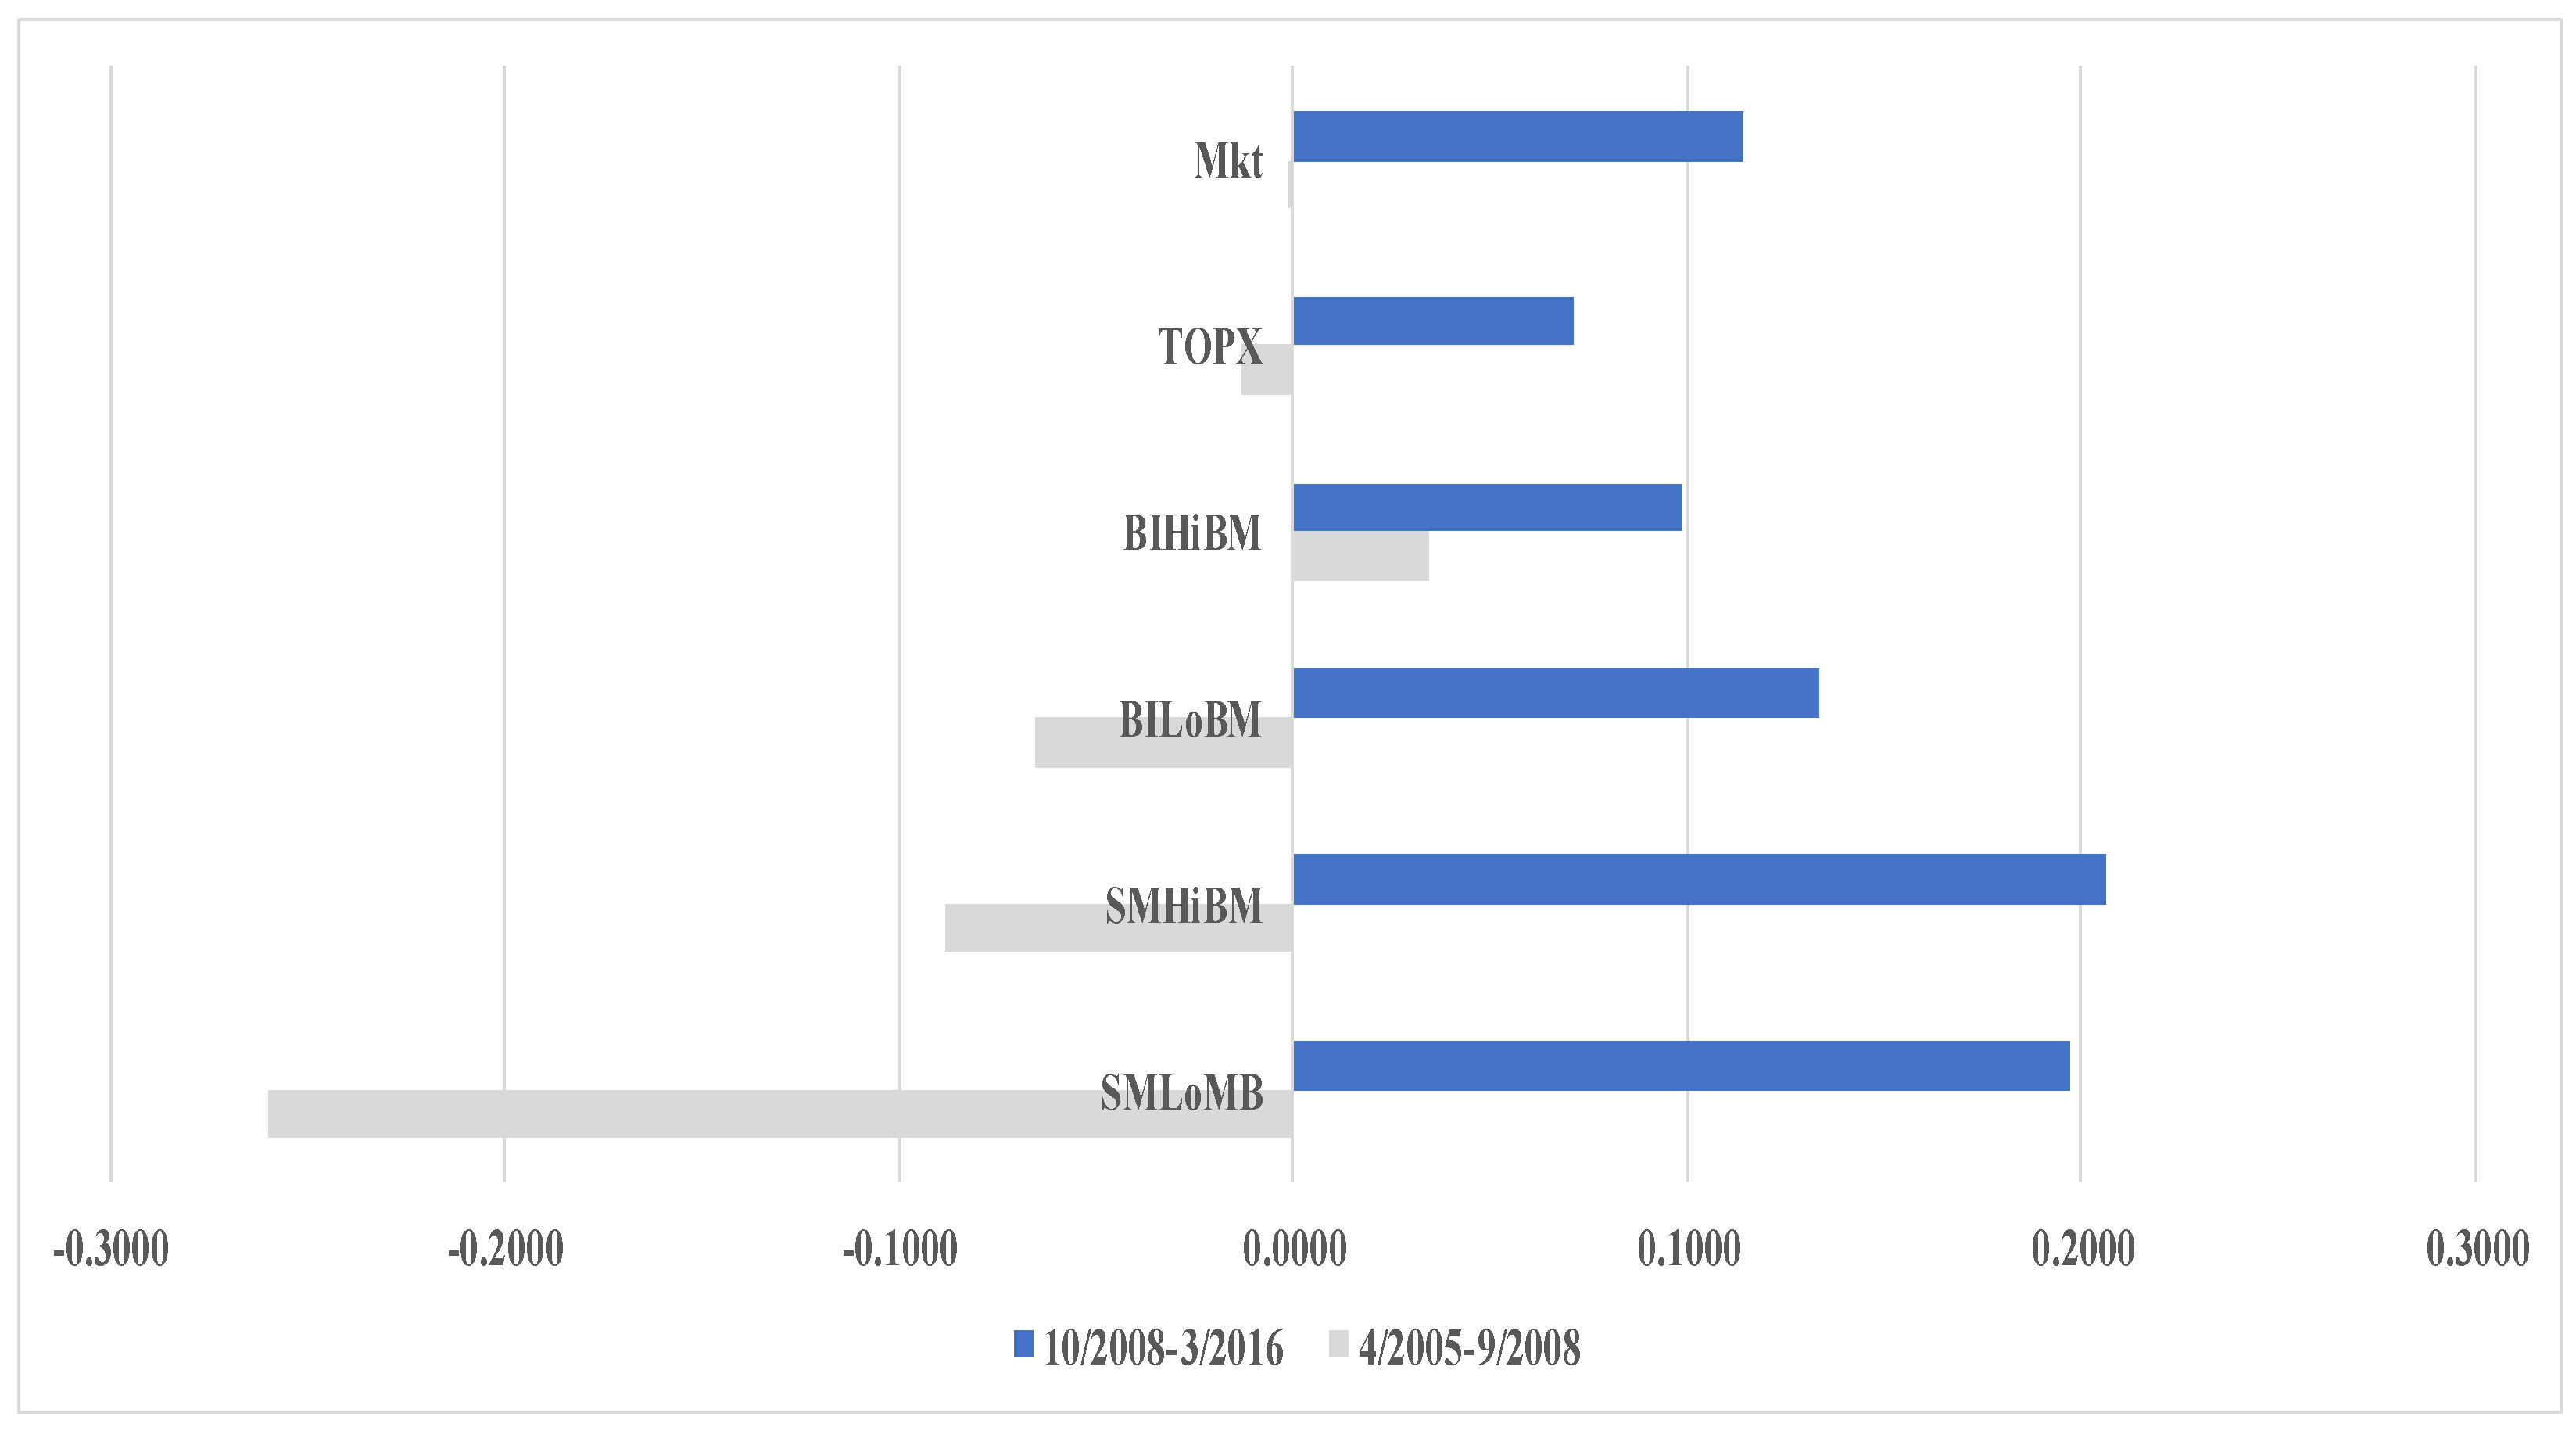
Figure 9 indicates that only the BIGHiBM investment style has a positive monthly return to standard deviation ratio in the pre-2008 period. Among the other three indices, SMLoBM has the worst performance. On the contrary, all indices, as well as the TOPX and Mkt benchmarks present higher values during the post-2008 period, and SMHiBM and SMLoBM exhibit the highest ones. High values are in tandem with the higher overall performance of mutual funds in this period.
4.3. Sectoral Style Analysis
Table 7 presents each mutual fund’s exposure to each of the thirty-six main sectors of the Japanese economy for the whole period by applying the Sharpe RBSA methodology. Mutual funds are found to have no exposure to nineteen out of thirty-six sectors, but most of them are open to: air transport (NAIR), construction (NCON), mining (NMNG), financials (NFIN) and medicals (NMED). It is noteworthy that half of the funds are by 40% or more exposed each to the “medicals” sector.
Overall, according to
Table 8, excess returns due to active asset management are very small. Moreover, the majority of funds are found to have worse returns than the TOPIX benchmark. Percent active values indicate that funds’ volatility due to asset selection managing skills is above 40% for six out of eight funds. Furthermore, SSR values are found to be negative for the majority of funds, thereby, there is evidence that active management does not add value per unit of added risk. Furthermore, there is no statistical significance found for this added value.
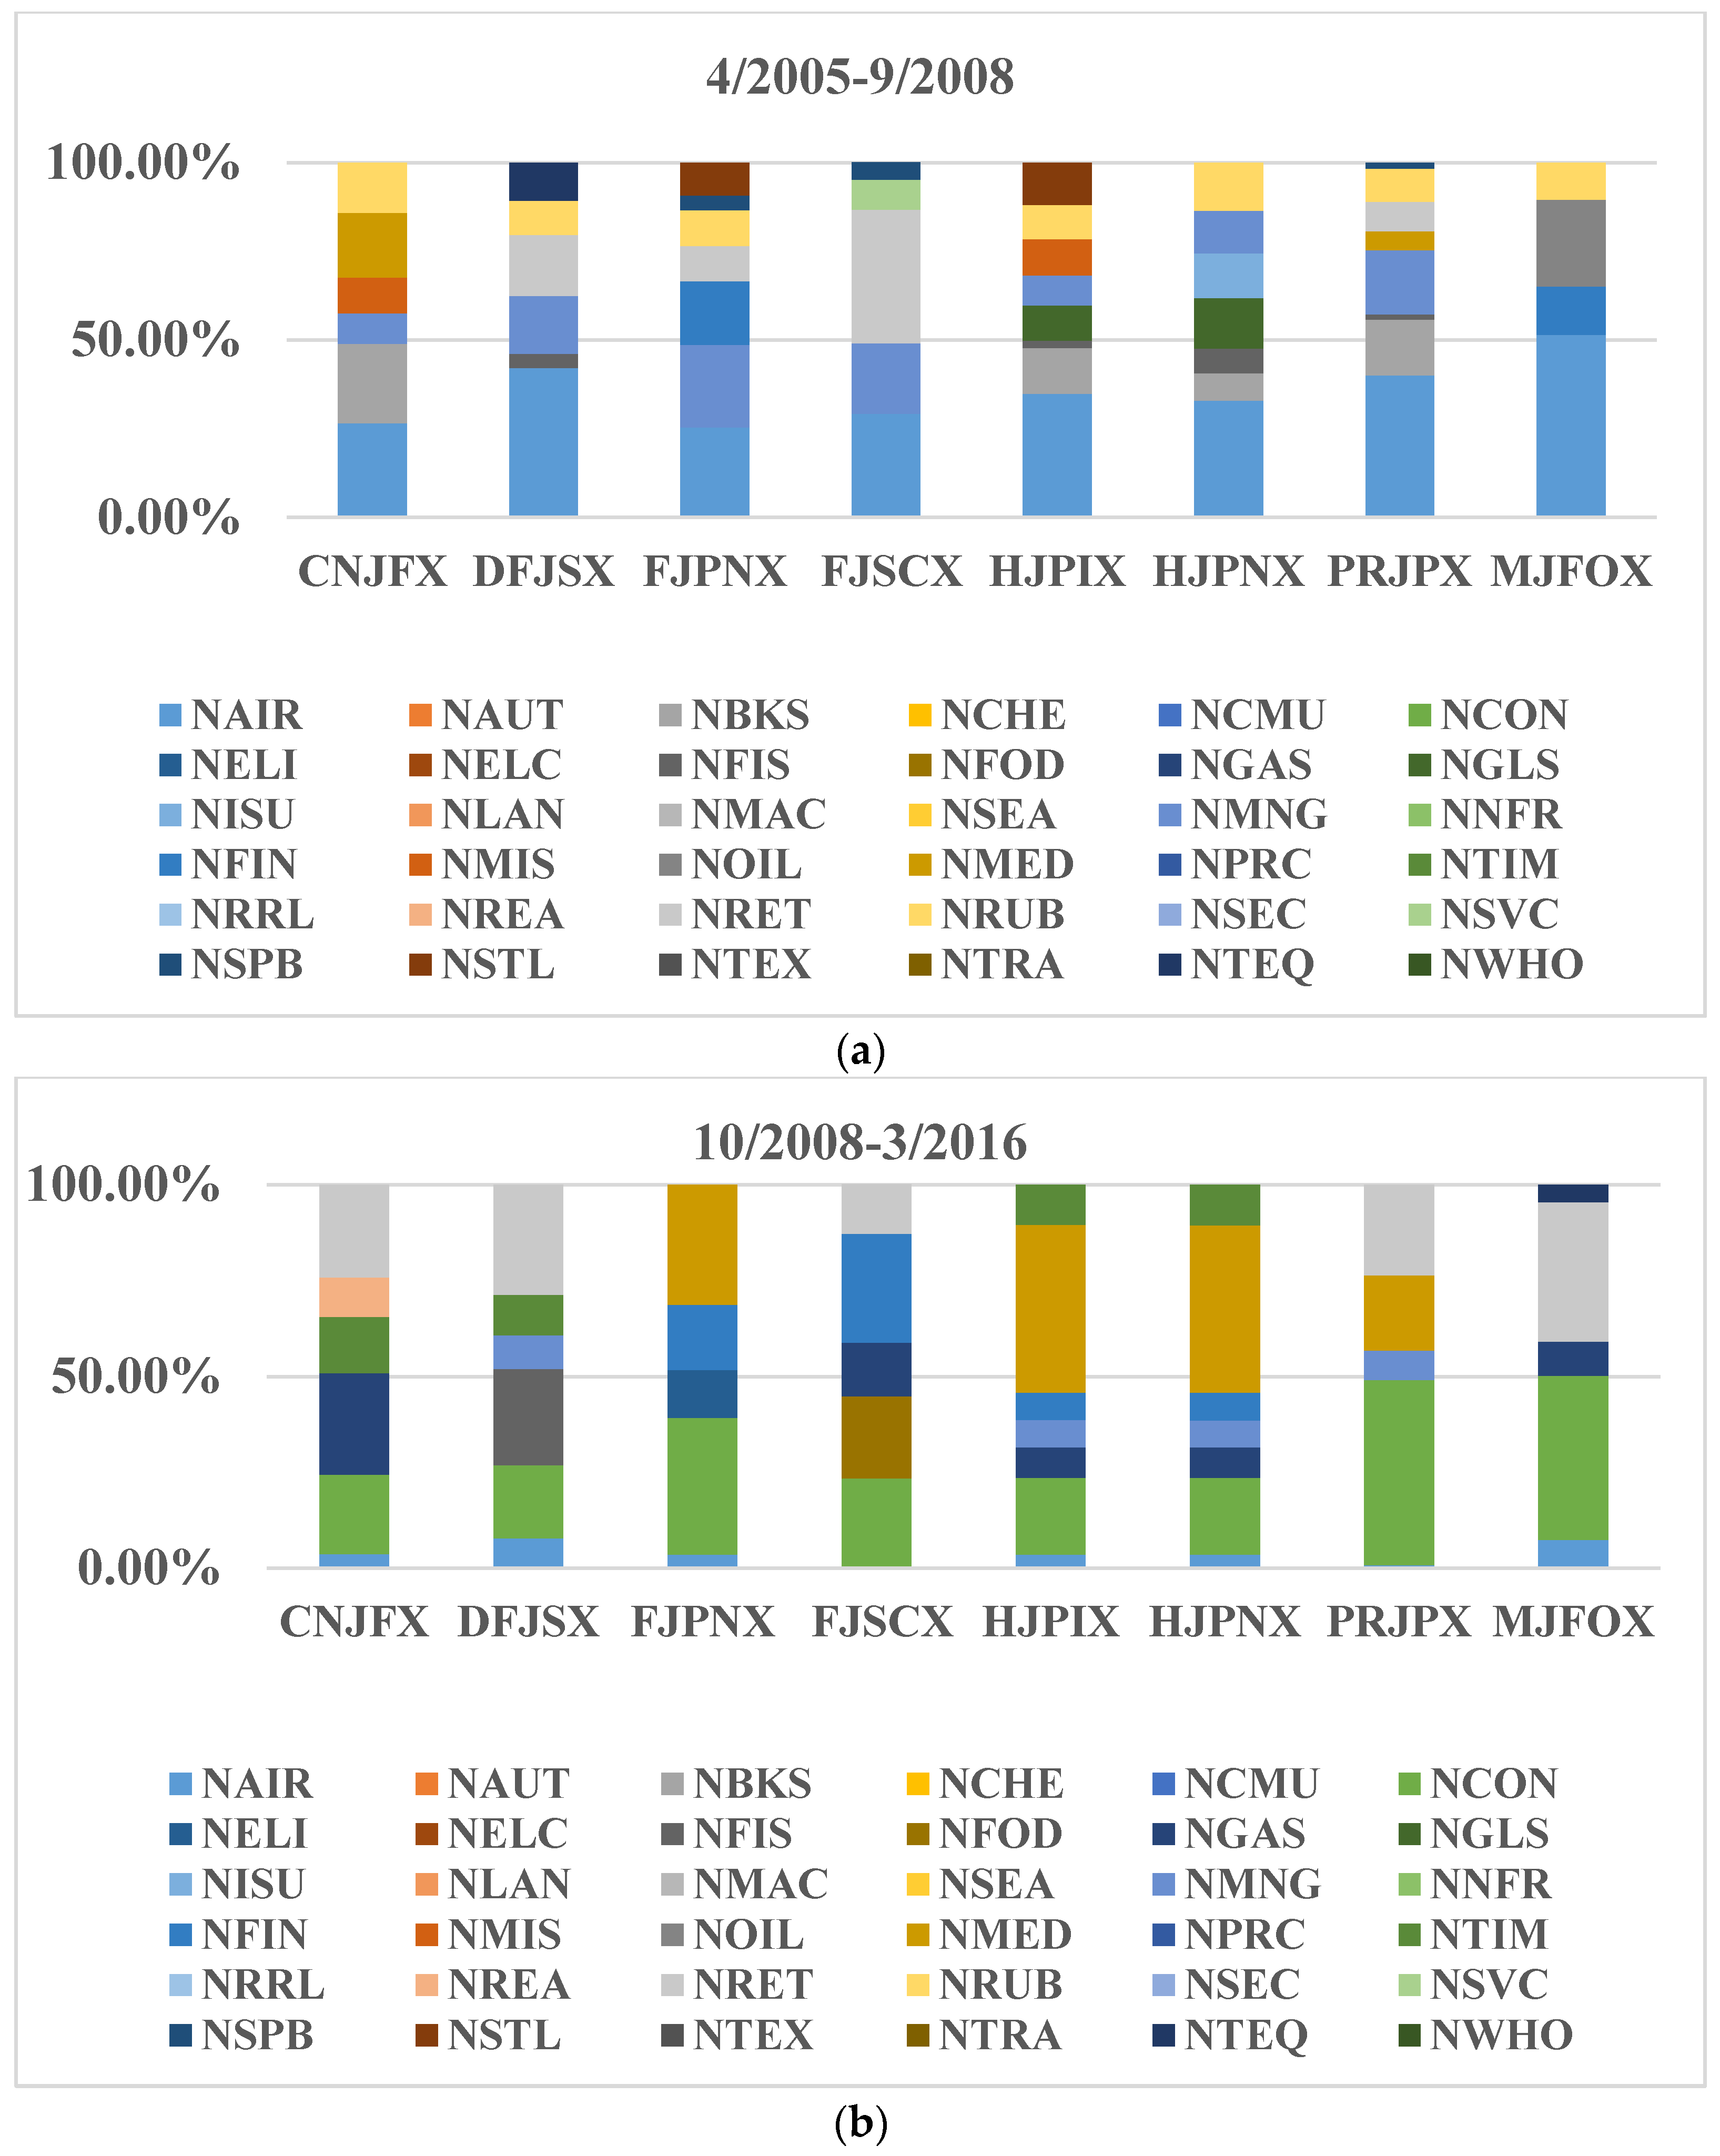
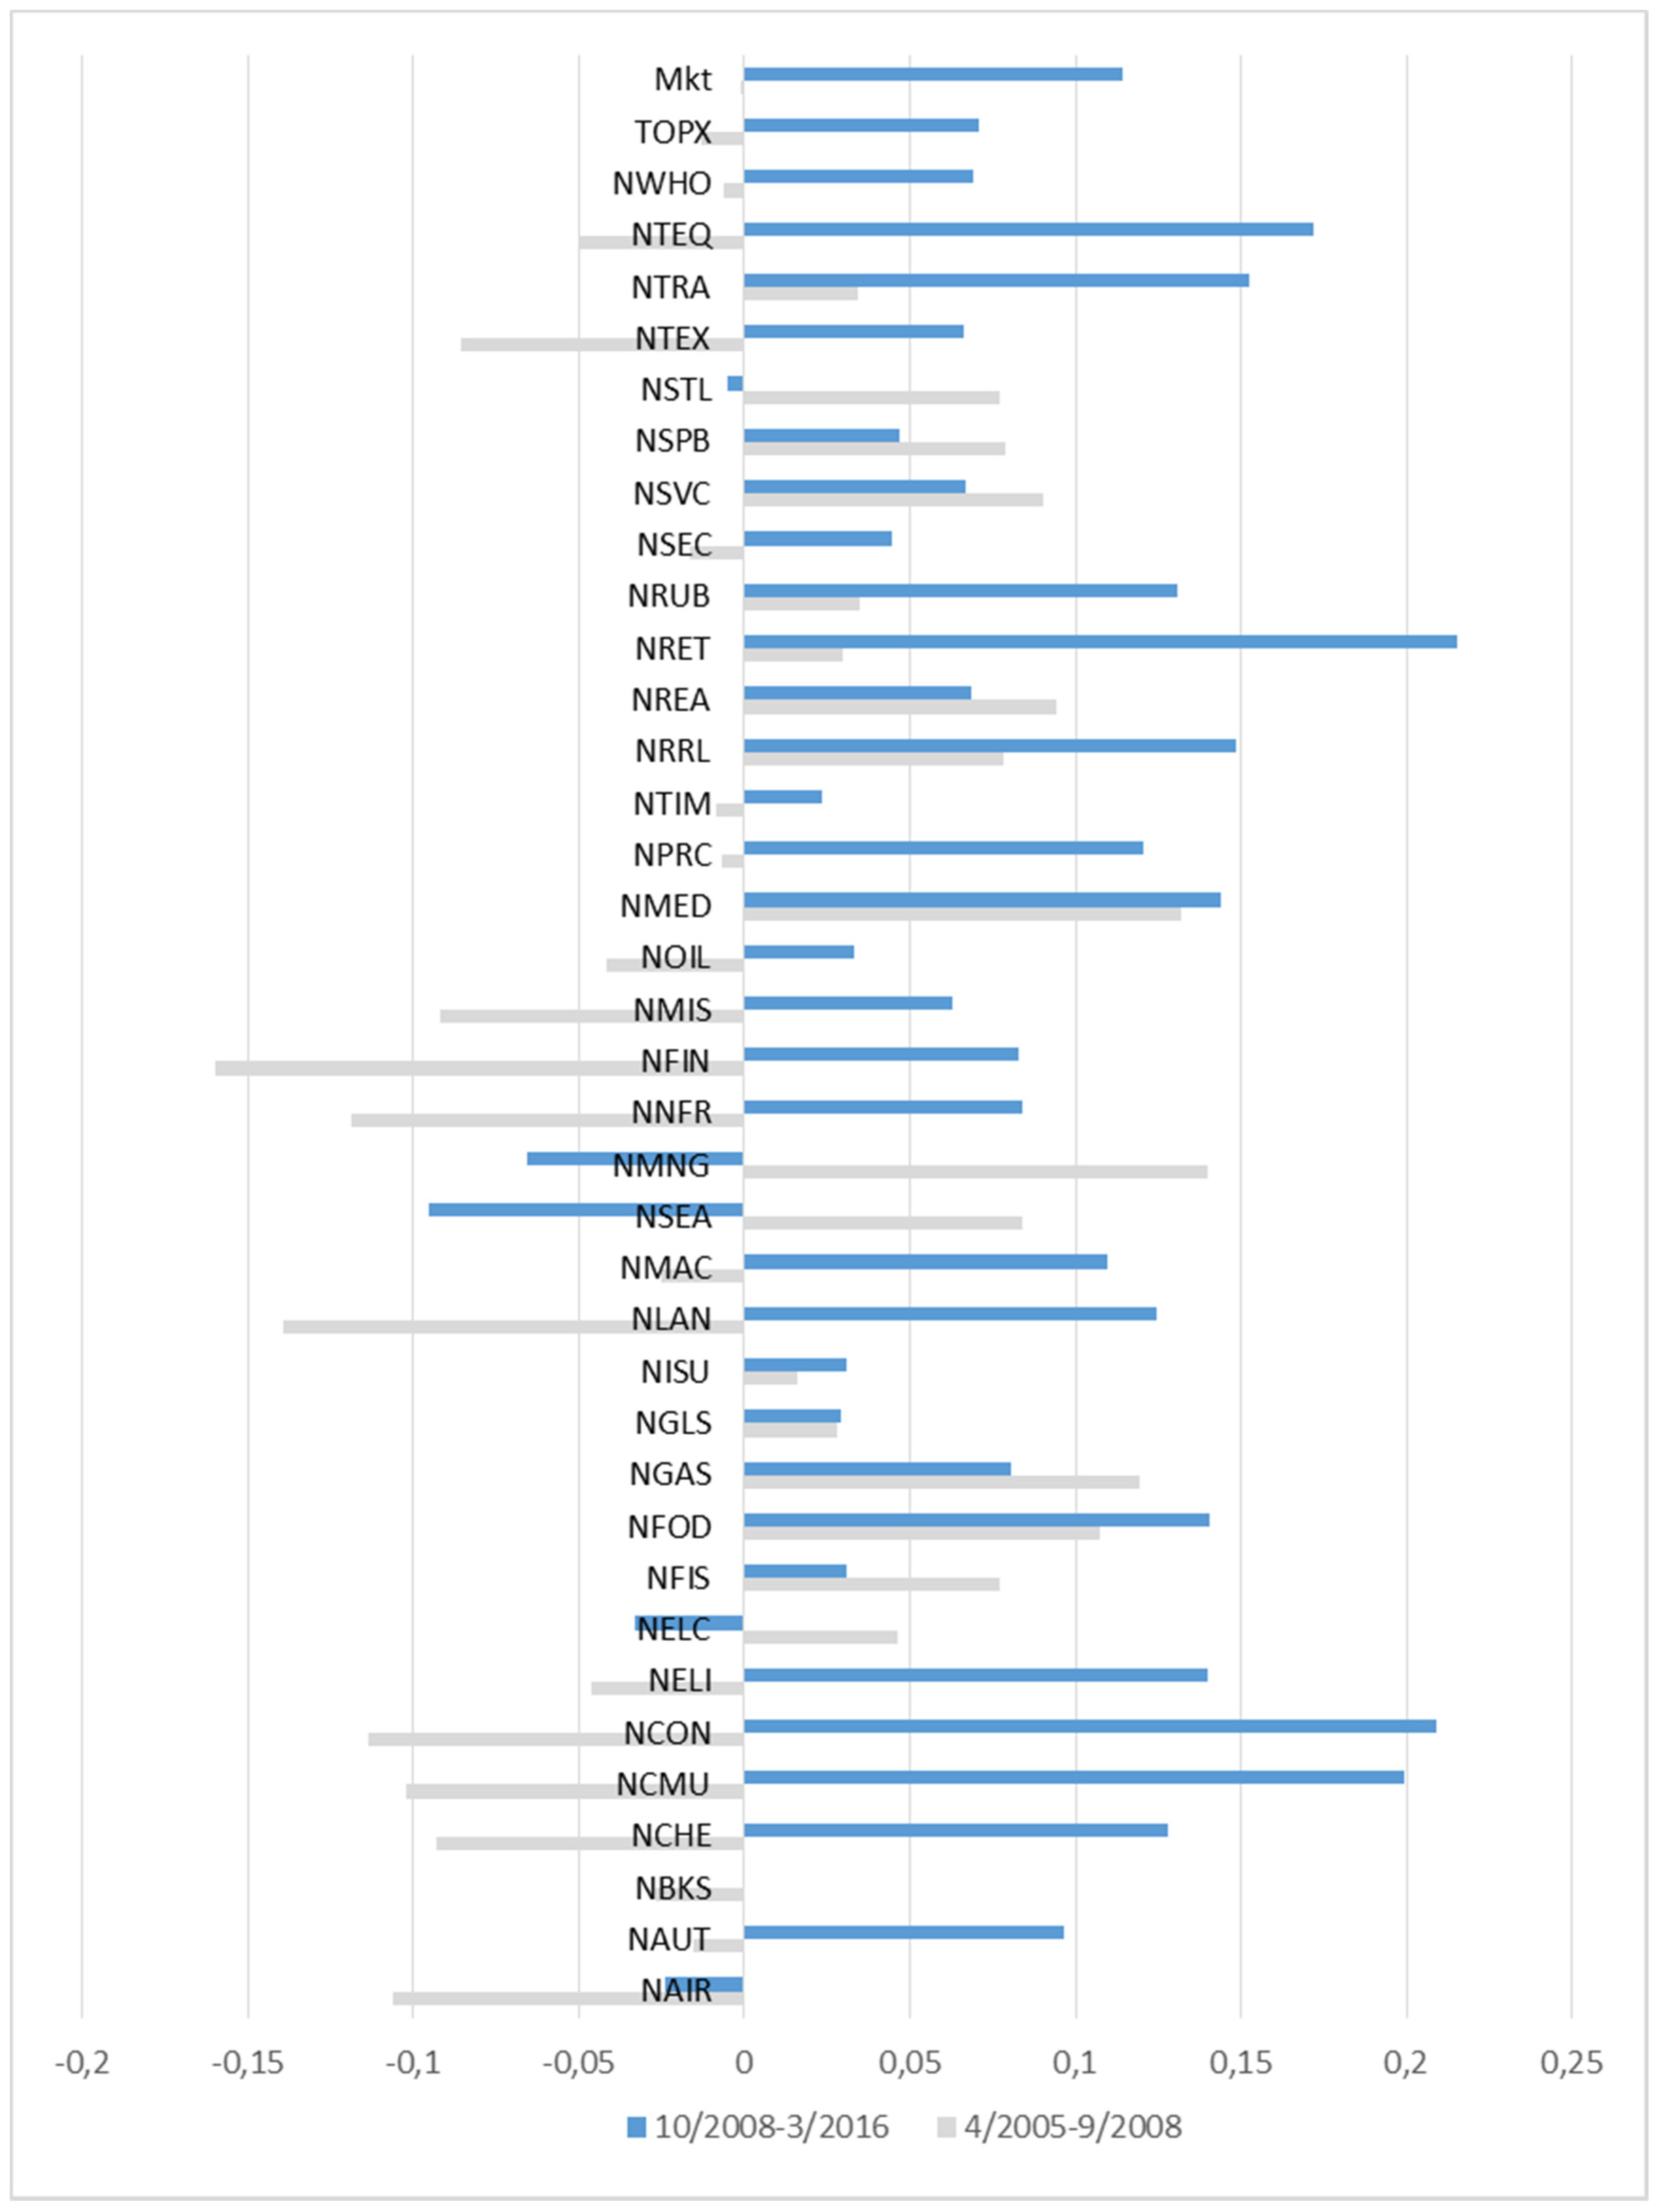
Figure 10 exhibits mutual funds’ exposure for the pre- and post-Lehman Brothers collapse period separately. During the pre-collapse period, most funds mainly invest in the air transport (NAIR) sector, as well as the retail (NRET) sector, and fewer invest in glass (NGLS) and in trade (NTRA) sector. Seven out of eight mutual funds prefer sea transportations (NSEA) to invest.
On the other hand, after the Lehman Brothers collapse, all funds have a preference towards the construction (NCON) sector. Moreover, the medicals (NMED) sector is selected by four funds in order to invest. All mutual funds mainly invest in air transportation (NAIR) before the Lehman Brothers collapse, whereas after 2008, there is large exposure to sea transportation (NSEA) and construction (NCON) sectors.
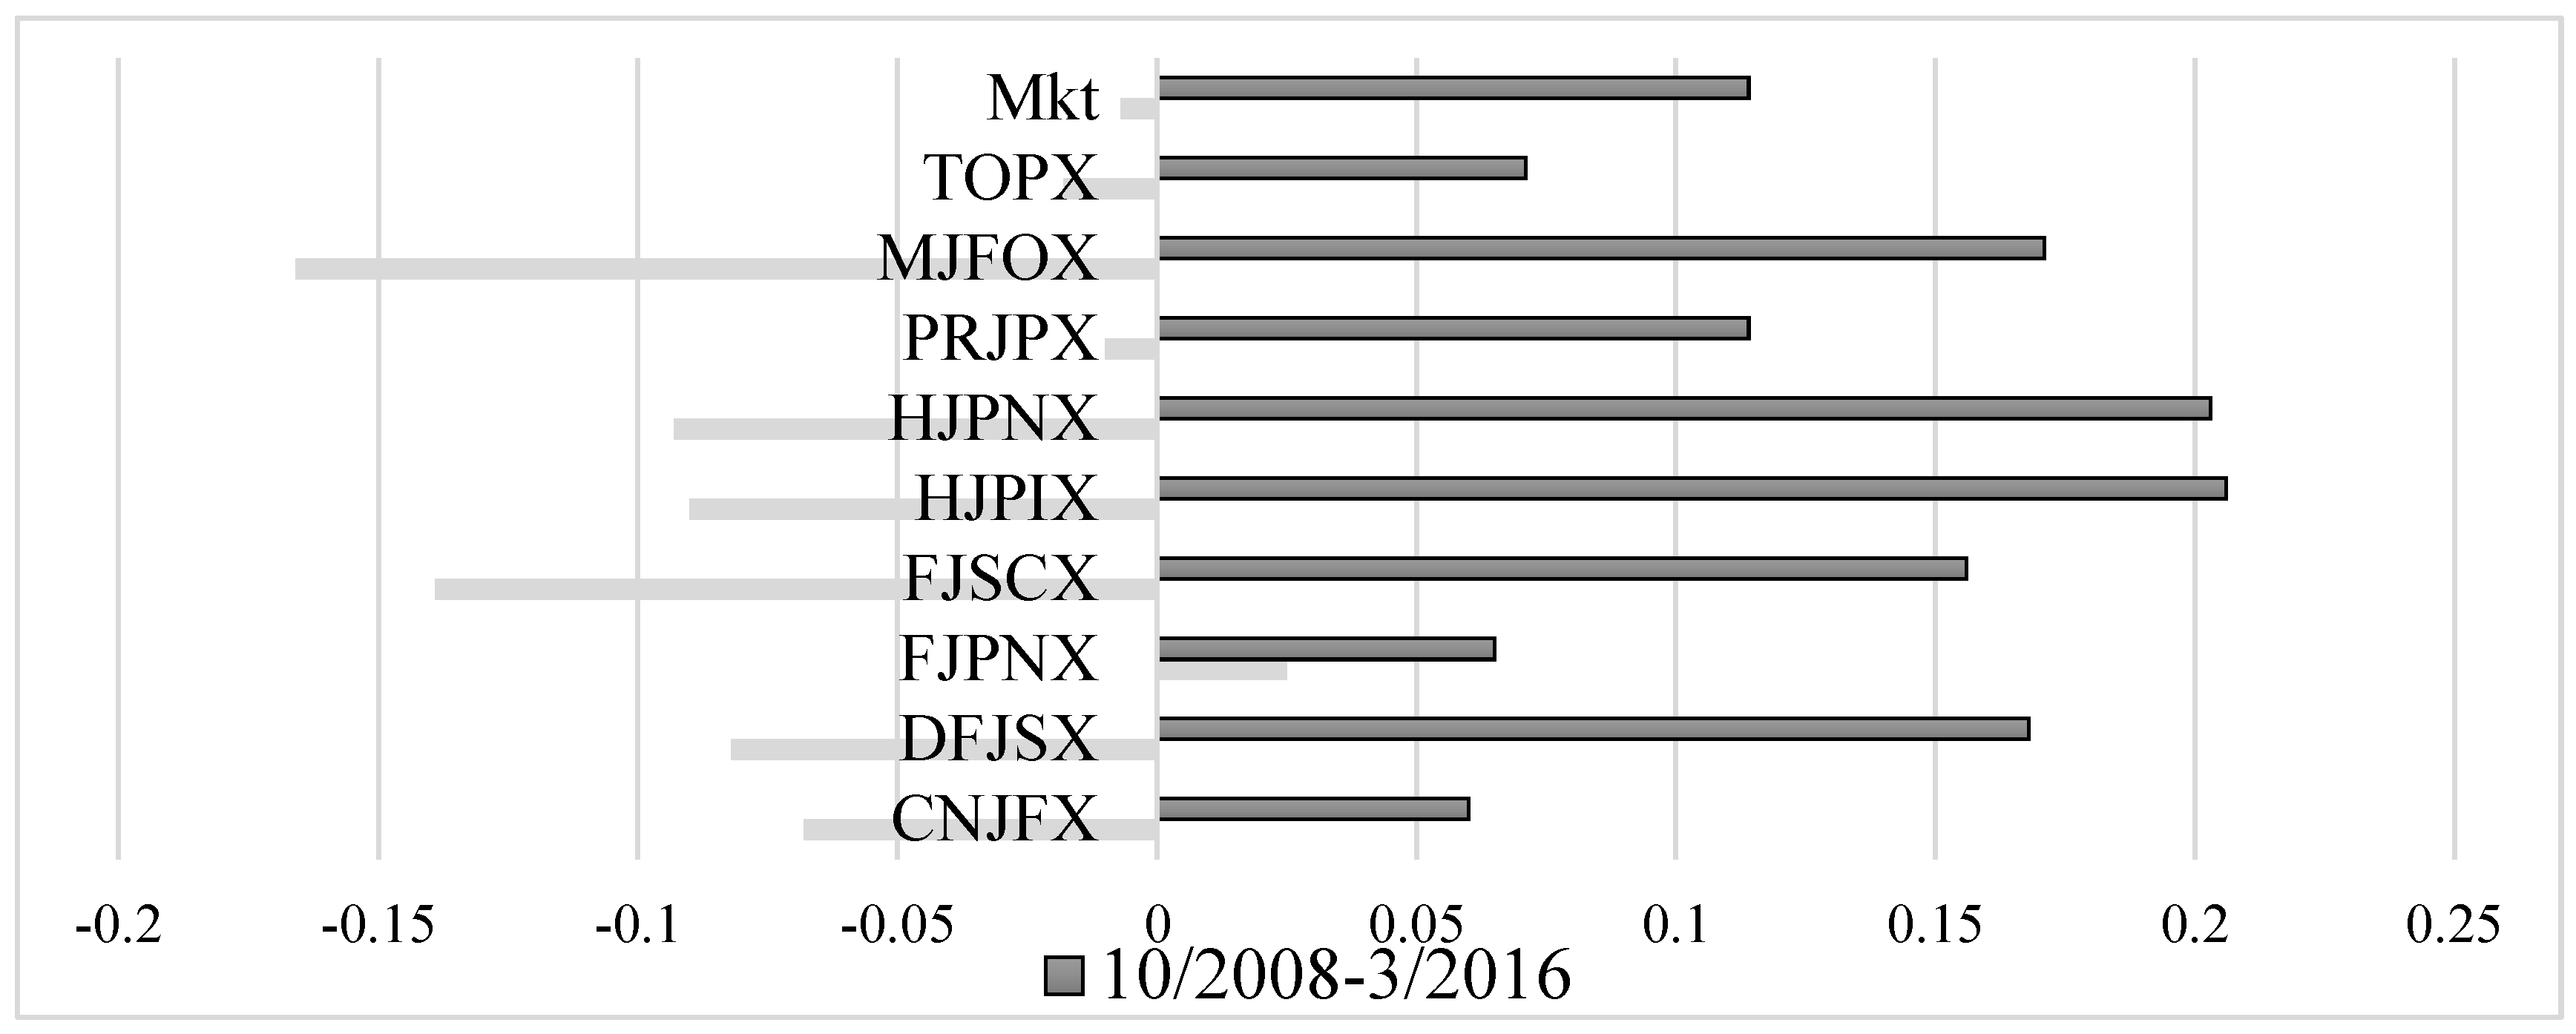
Based on the SSR index presented on
Figure 11, there is evidence that during the pre-2008 period, only two of the mutual funds do not add value through active management, as they take negative values. Nevertheless, after the Lehman Brothers collapse, half of the funds exhibit negative SSR indices. The percent active indicates that only two funds achieve lower volatility levels due to active management, as the rest are made riskier.
Figure 12 indicates that before the crisis onset, nineteen out of thirty-six sectors of the Japanese economy and the benchmarks have negative returns. The largest drops are shown in NFIN, NLAN, NNFR and NCON. On the contrary, the majority of them seem to have been improved after 2008, and NSEA has the largest negative return. Overall, only ten sectors perform well before 2008, whereas twenty-three after the Lehman Brothers collapse, indicating large alterations.
5. Conclusions
This paper conducts style and sectoral performance analysis in Japanese mutual funds before and after the crisis-evoking Lehman Brothers collapse in 2008. The exposure of these funds to thirty-six main sectors of the economy and four basic investment styles is investigated. Two different benchmark indices are used as a proxy for the market portfolio to test the robustness of our results, namely the TOPIX and the broader Fama–French market index.
We find evidence that cumulative returns have been higher after the Lehman Brothers collapse where announcements and actions of unconventional policy took place in Japan, as the majority of mutual funds have performed significantly better than before. Over the whole period, style analysis indicates that six out of eight funds are mostly exposed to small capitalization with low book-to-market value and to big capitalization with high book-to-market value assets. It is noteworthy that changes in exposure between the two periods are large and that big capitalization with low book-to-market value style becomes more popular in unconventional times.
By investigating the value added due to active management over the two periods, the results reveal useful conclusions. While the selection Sharpe ratios for sectoral and style analyses exhibit positive values added per unit of risk due to active management for the majority of our funds in the pre-Lehman default period, none of them presents statistical significance according to the t-statistic. This can be taken into consideration together with the fact of the lower performance of funds over this first period compared to the second one. Additionally, based on sectoral and style analyses after the post-Lehman default, only two out of eight funds achieve lower volatility levels and higher returns due to active management.
Therefore, our findings imply that active management in a monetary easing environment does not add significant value to the mutual fund performance. This should provide guidance to Japanese investors, as well as to asset managers in Japan in order to know the potential of their flexibility to invest in different funds in a highly frequent basis. Low deviations in profitability from passive to active management could prevent a significant portion of investors from employing fund managers. From the side of the latter, Sharpe ratios are adequately informative in that there is no large amelioration in risk diversification combined with better returns in an unconventional “cheap money” environment. Moreover, this could lead to smother trading activity by fund managers and investors in the Japanese asset markets over a QE period. These results might prove useful to the extent that economic conditions are similar in other crisis-affected advanced economies regarding the effects of non-conventional policymaking currently implemented or considered on fund markets there.


