
Does Corporate Diversity Really Matter in the Plantation Sector? Empirical Evidence from a World Islamic Leading Country and Market Reaction


Abstract
:1. Introduction
2. Theoretical Background and Construct Identification
Demographic and Cognitive Diversity and Firm Performance
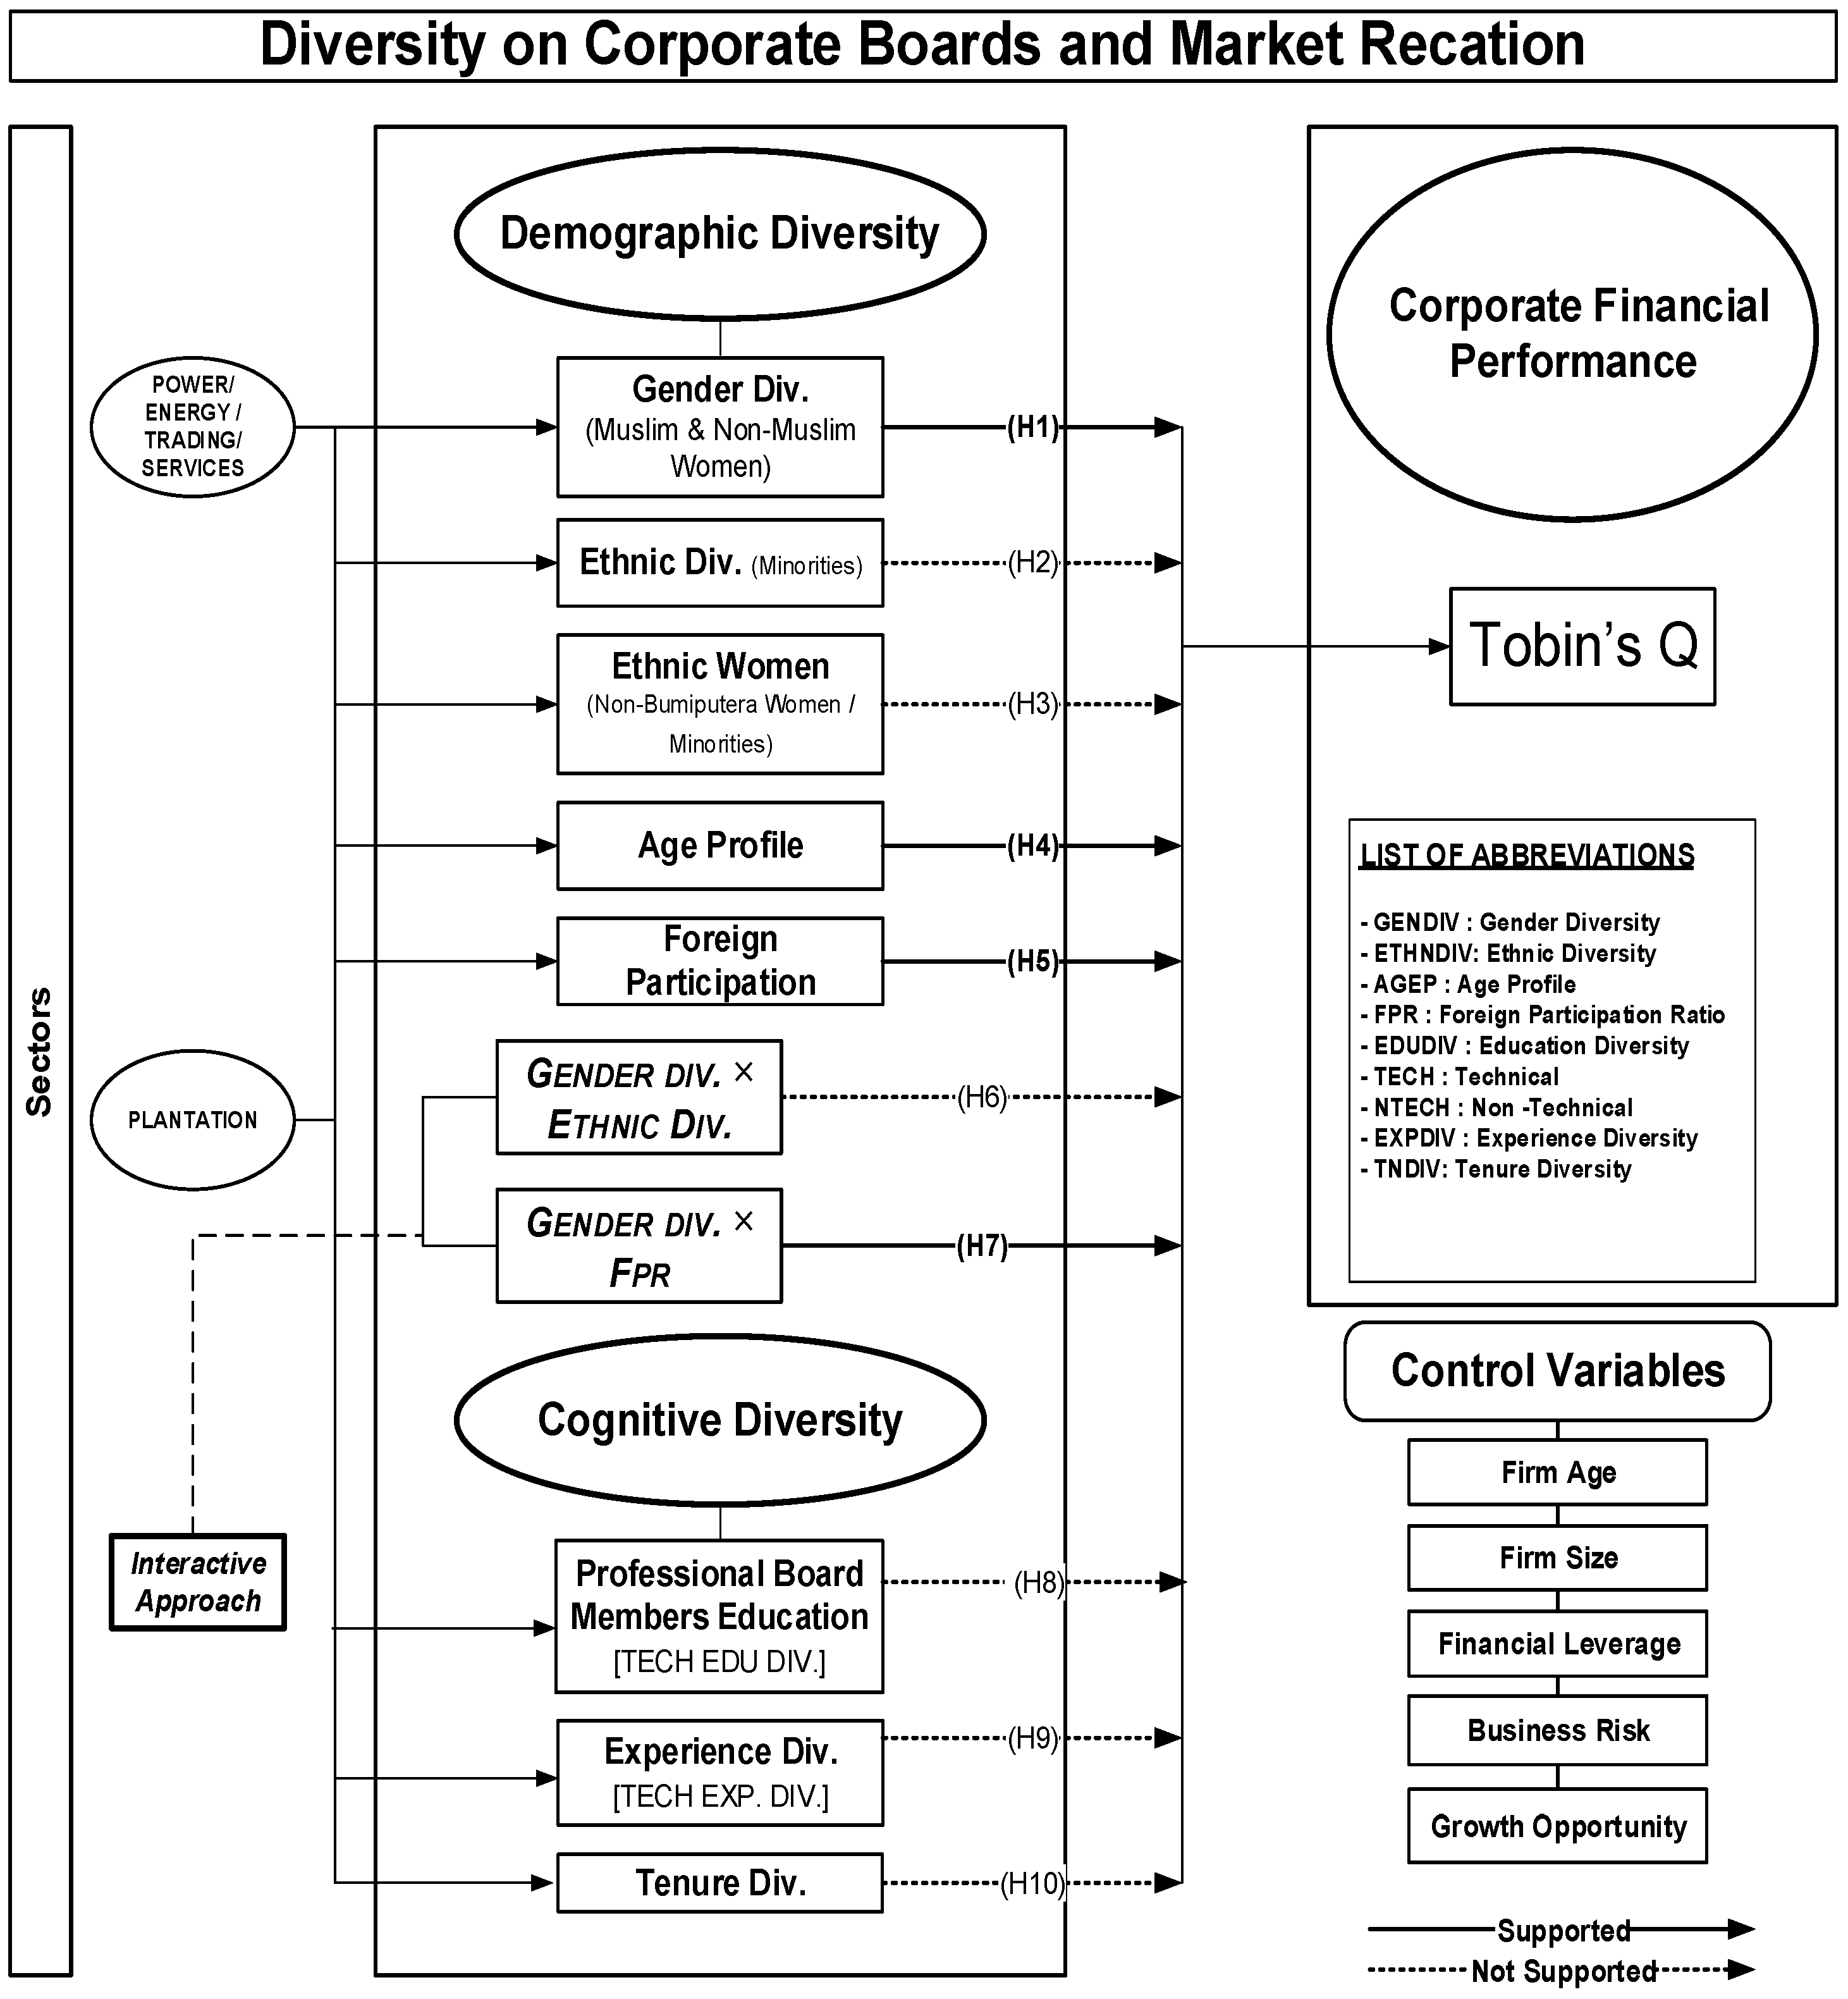
3. Hypotheses and Model Development
4. Empirical Design and Method
4.1. Measurement
4.2. Choice of Variables and Empirical Models
4.3. Dependent Variable
Tobin’s Q (Market Perspective)
4.4. Independent Variables
4.5. Control Variables
4.6. Data Collection
4.7. Data Analysis Strategy
4.8. Model Applied
5. Empirical Results
5.1. Descriptive Statistics
5.2. Correlation Matrix
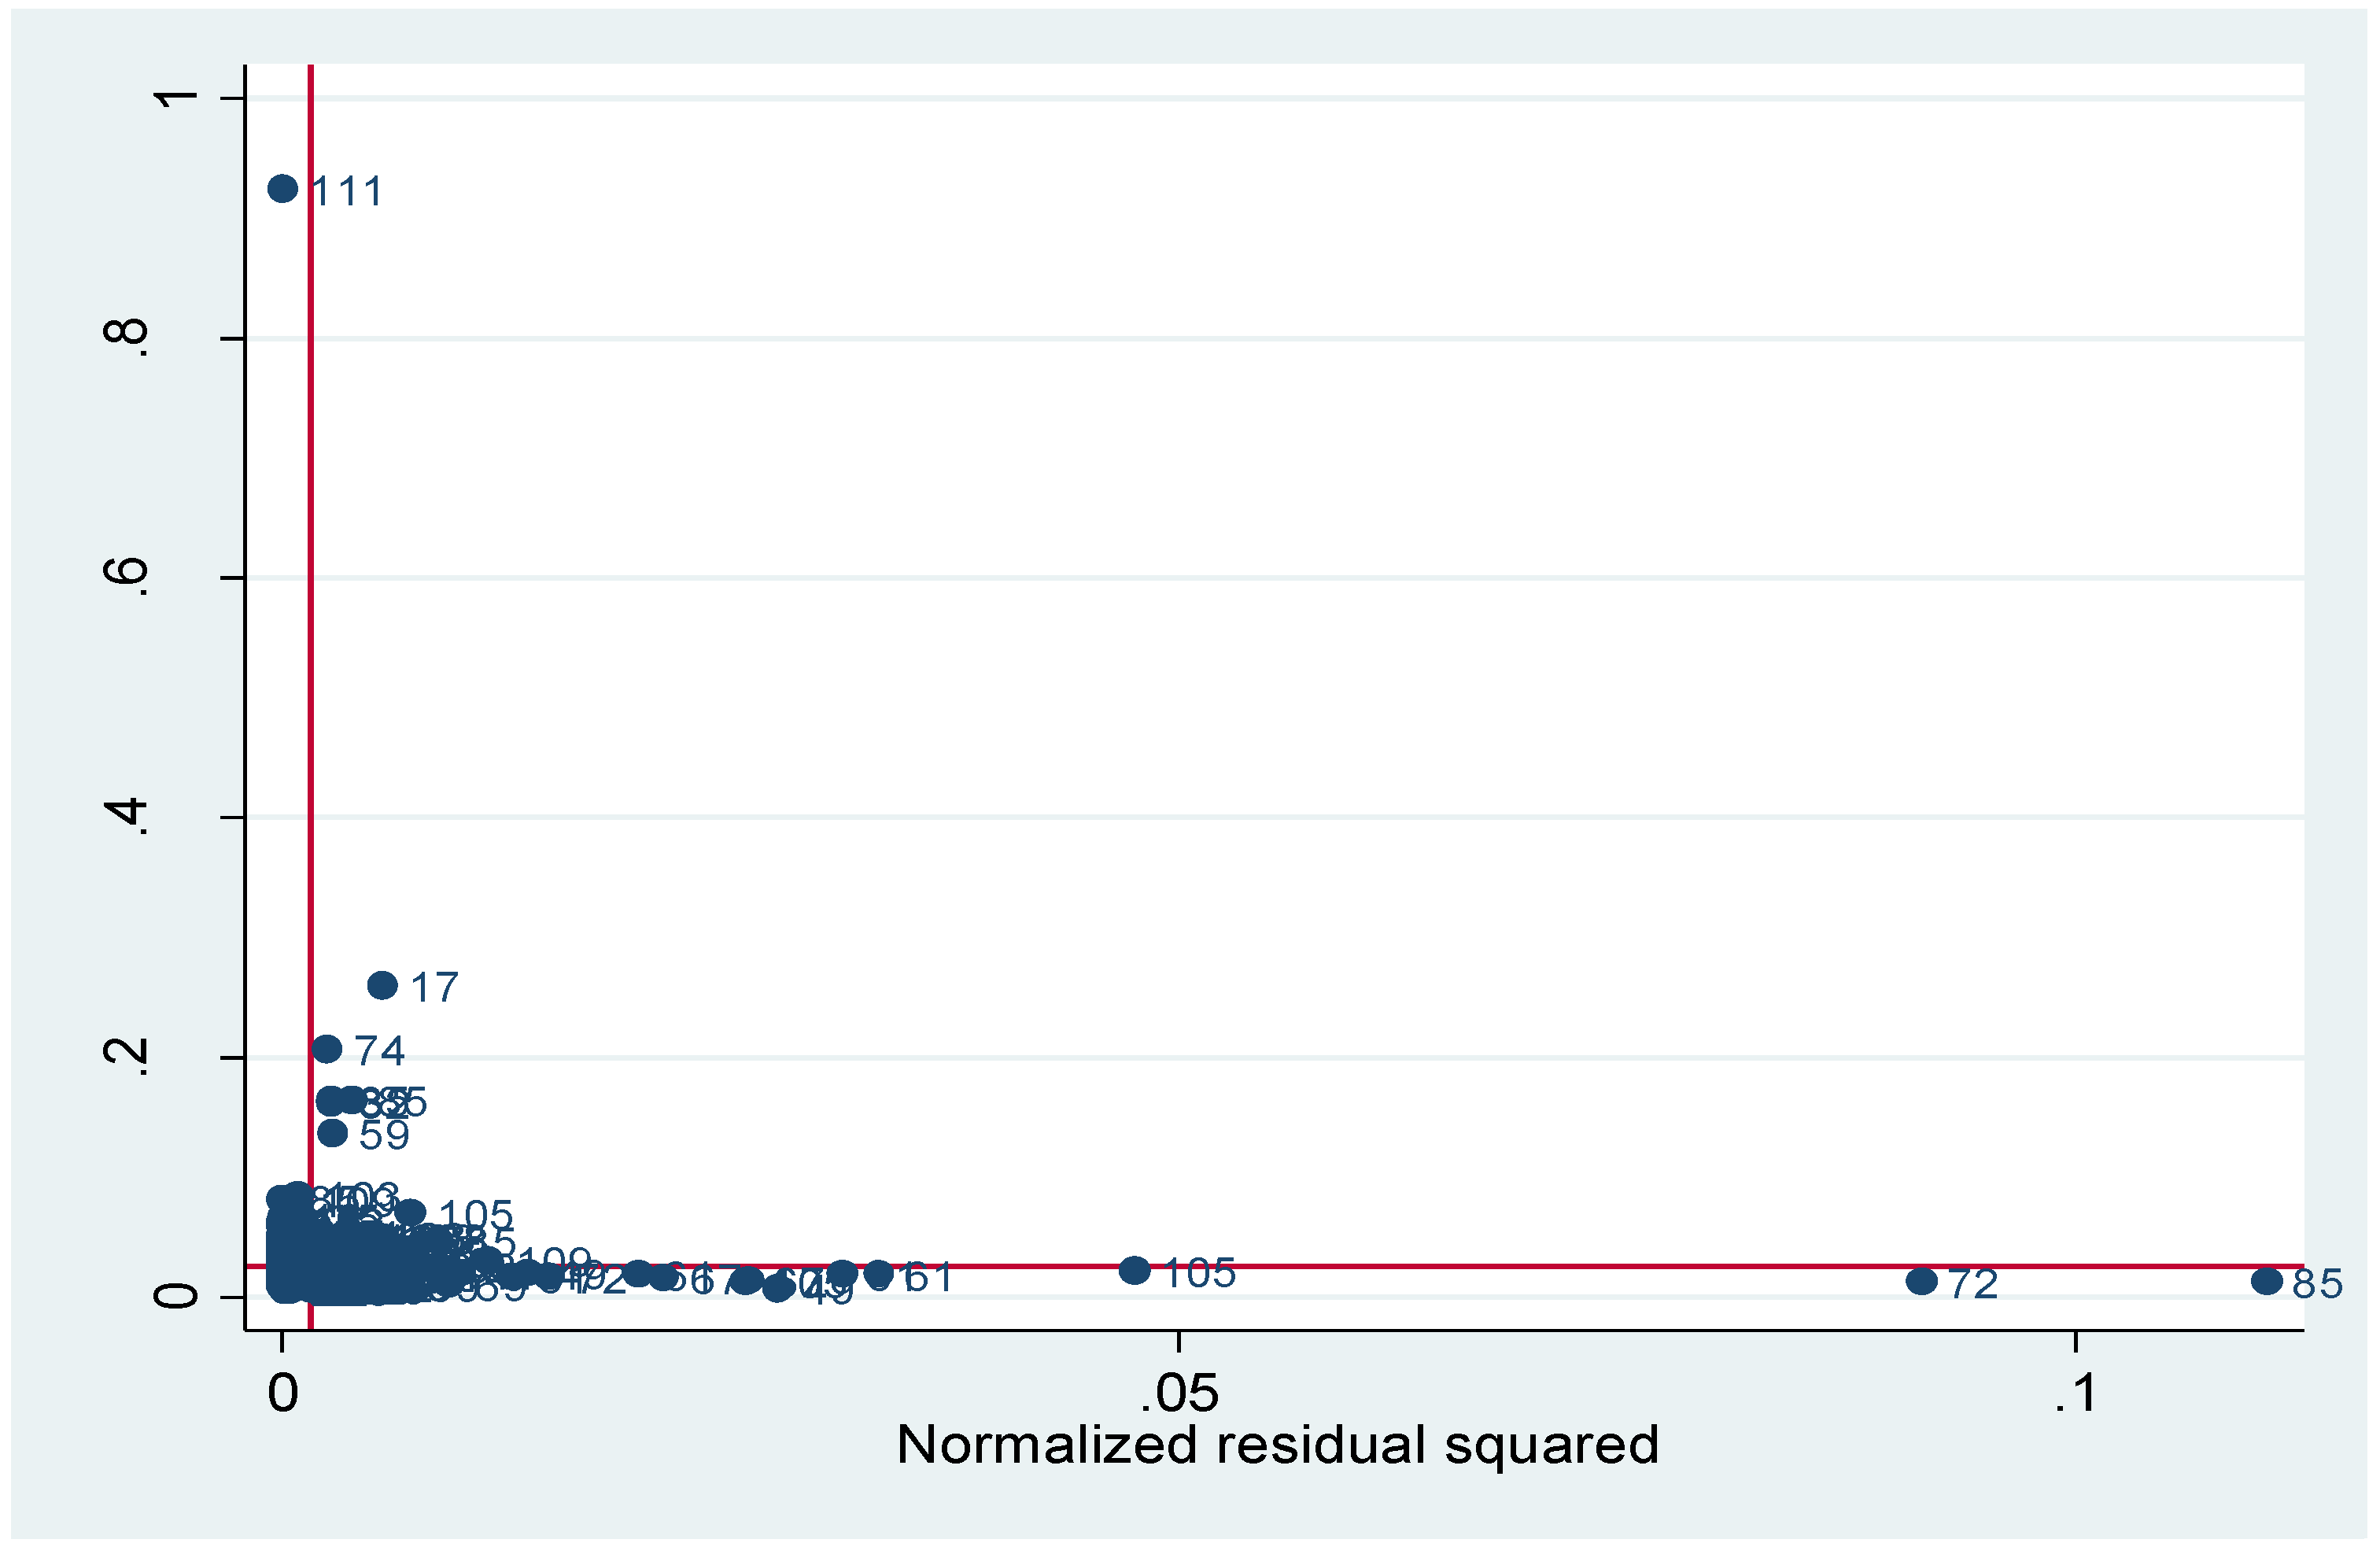
5.3. Cook’s Distance Outliers Test
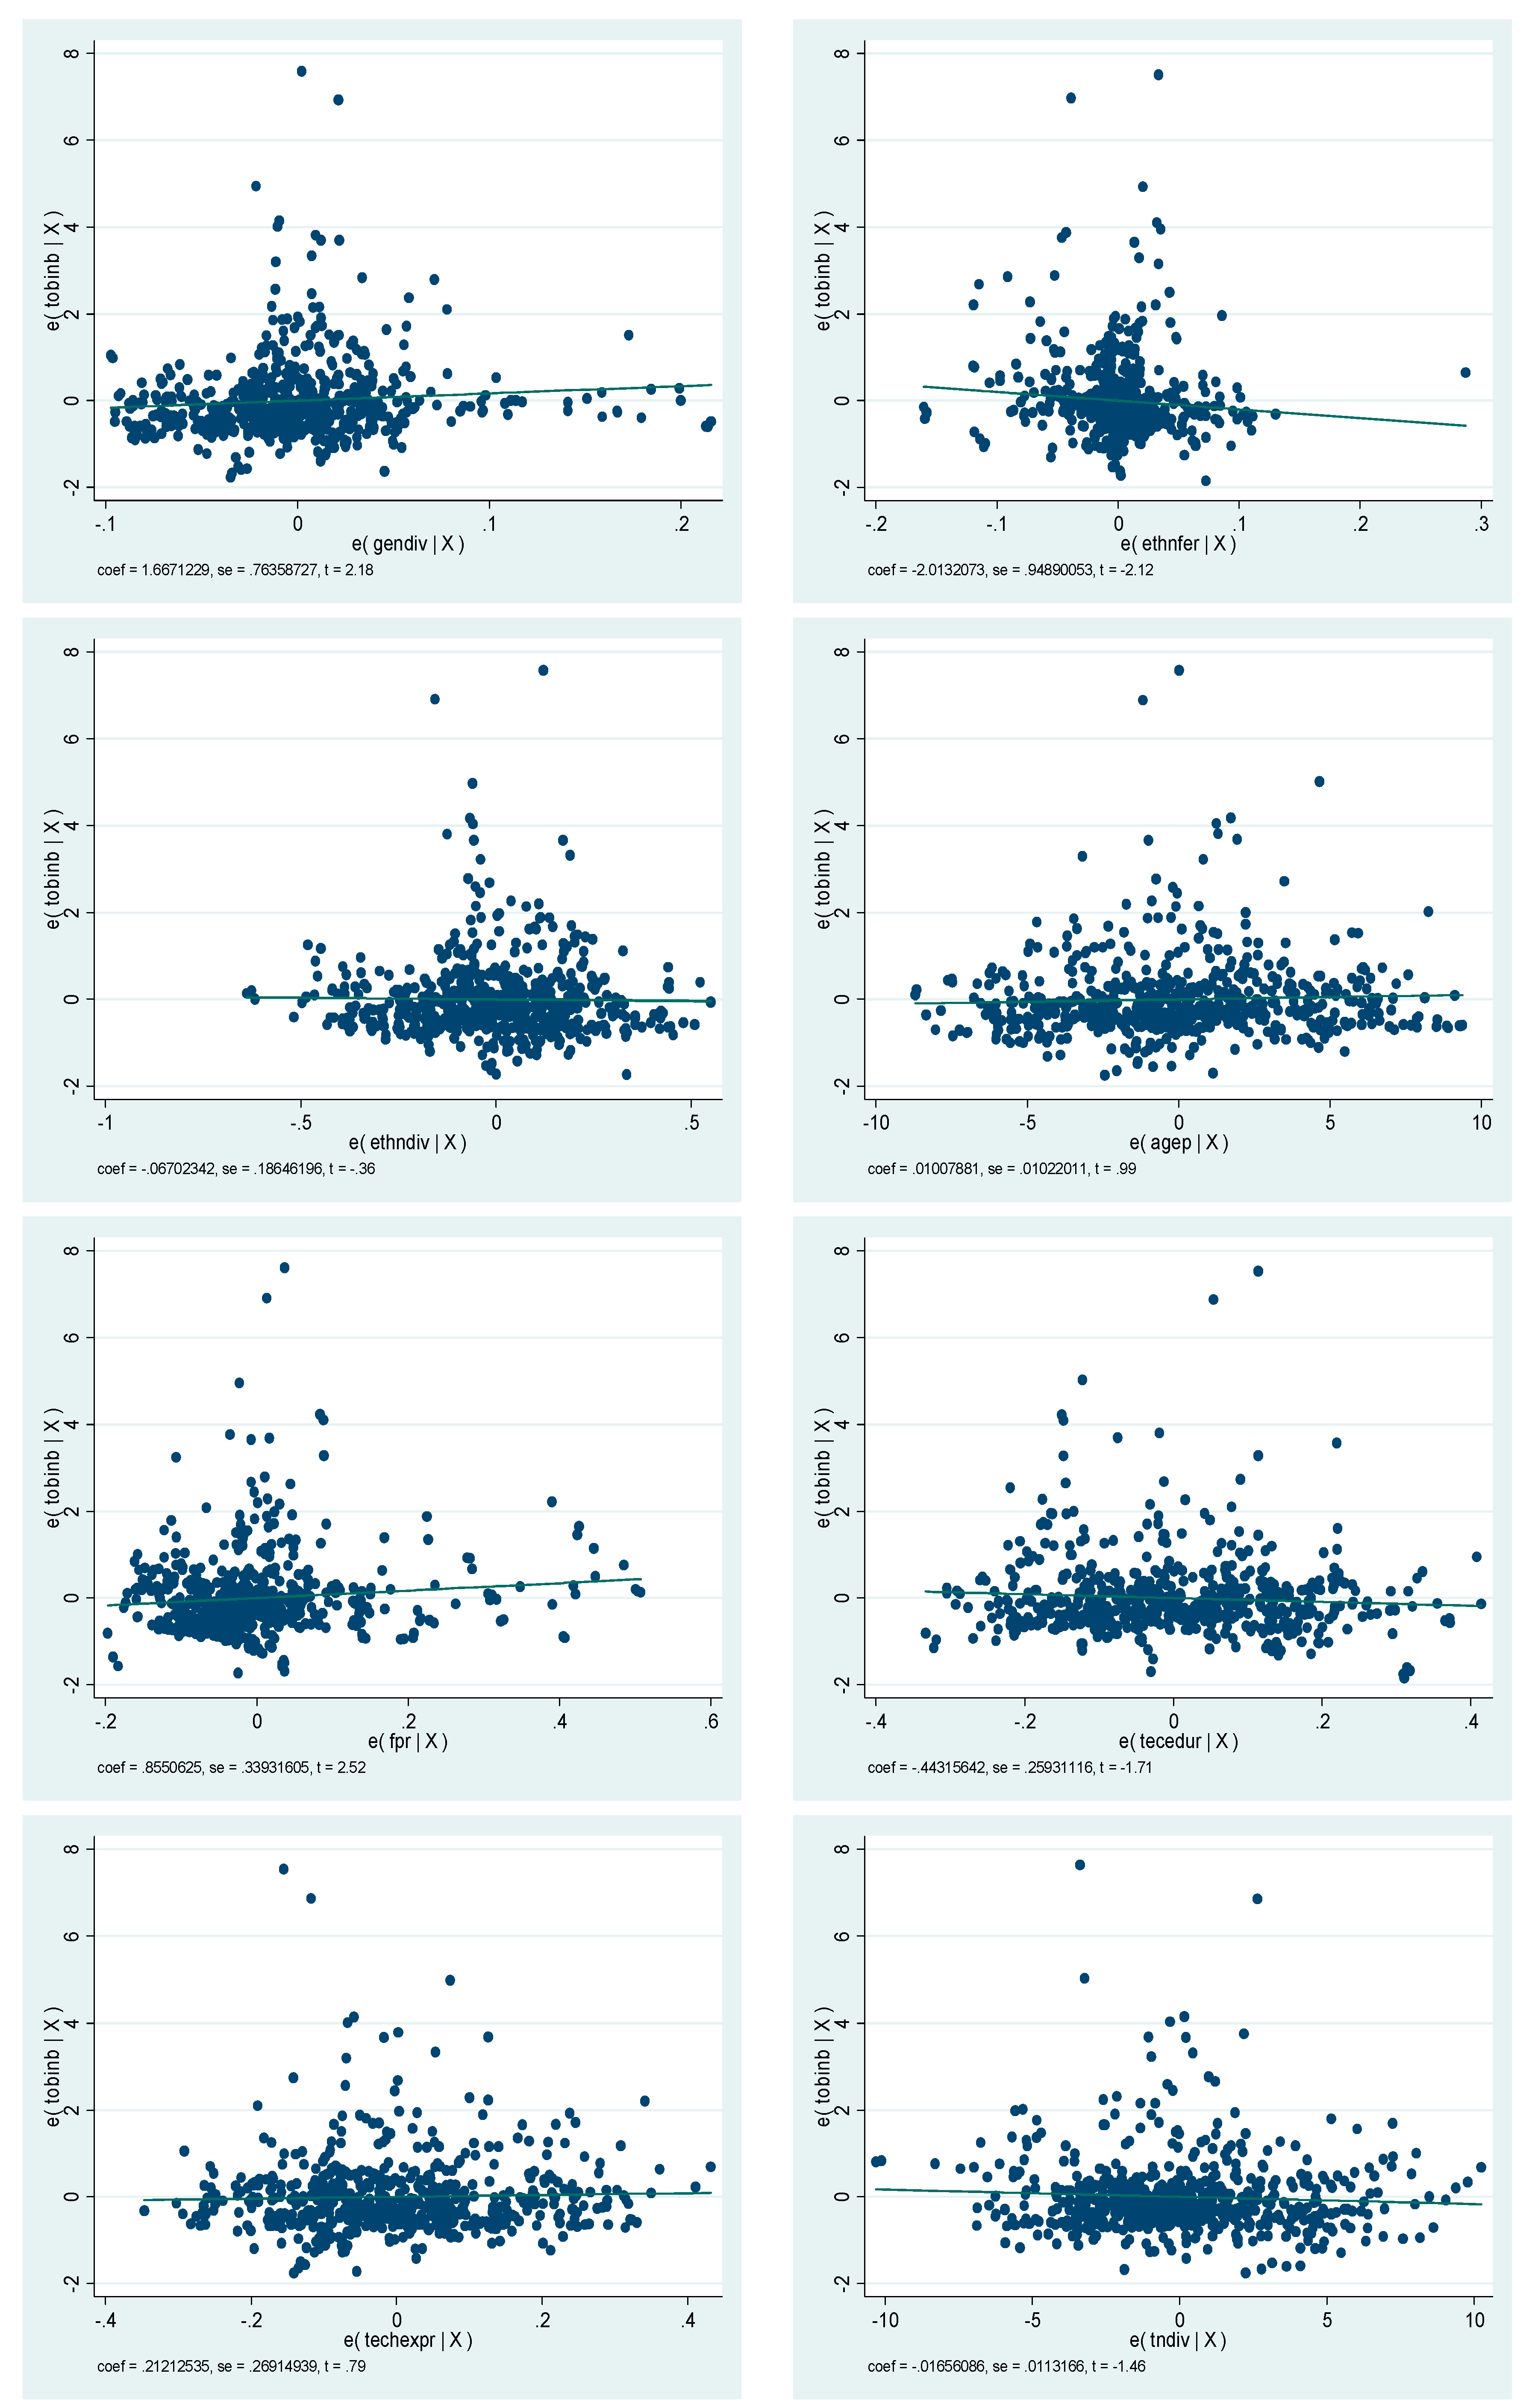
5.4. Poled OLS, Random Effect, and Fixed Effect
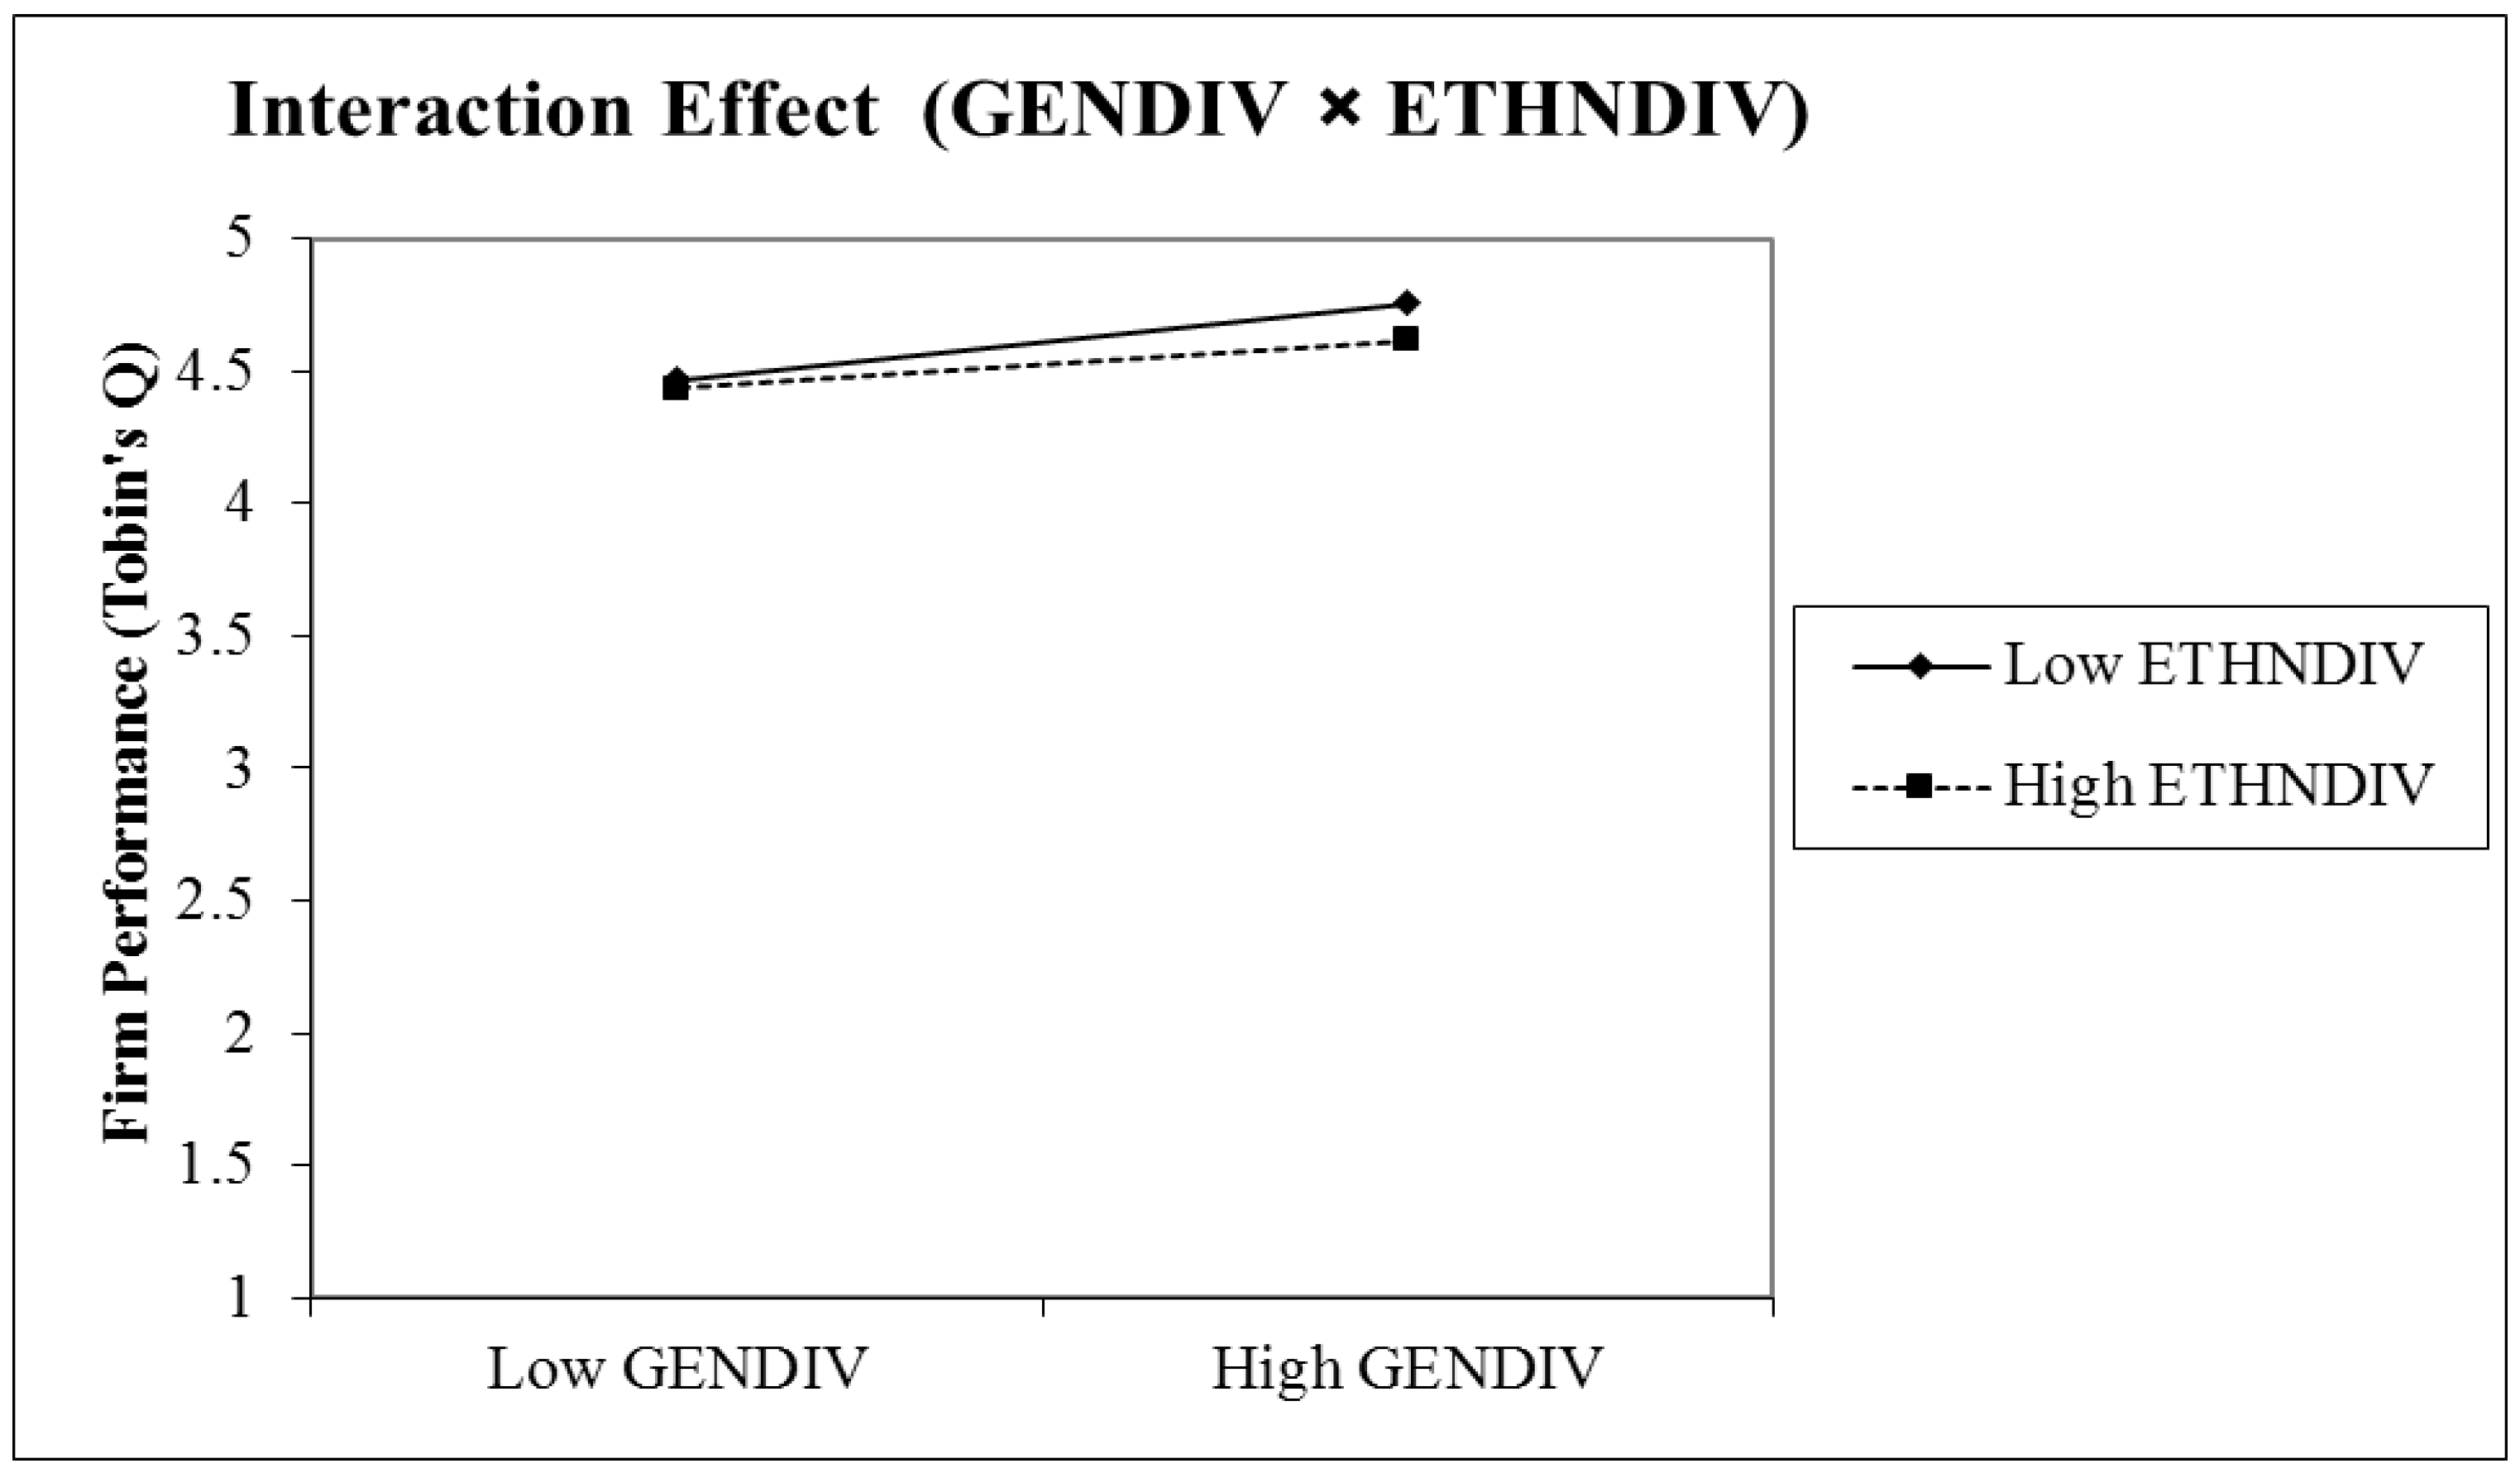
5.5. Interaction Effect
5.6. Summary of the Results
6. Discussion and Findings
6.1. Theoretical Implications and Practical Contributions
6.2. Limitations and the Pathway for Researchers
7. Conclusions
Acknowledgments
Author Contributions
Conflicts of Interest
Appendix A

| Factor “A” (Diversity in BODs) | Factor “B” (Corporate Governance) | Factor “C” (Firm Performance) | Key Findings/Outcomes | Methods/Techniques/Theories/Models | Author Name/Year |
|---|---|---|---|---|---|
| Demographic Diversity | Conceptual | ROA & ROE | There is inconsistency in previous results. | Develop a conceptual framework | Hassan et al. (2015c) |
| Women on Boards | Positive | Market capitalization | Women participation enhance firm performance | Regression, Correlation | Hassan et al. (2016) |
| Ethnic diversity | Negative | Market capitalization | Ethnic diversity is negatively associated with market performance | Regression, Correlation | Hassan et al. (2015a) |
| Demographic Diversity (Gender Diversity, Ethnic diversity, Age profile of board members) | Age has positive impact | Tobin’s Q | Demographic diversity at board level does have a relationship with market value. | Panel Data | Hassan et al. (2015b) |
| Corporate governance mechanism | Mechanism | Ownership & Control | Effective corporate governance mechanism is the best practice to reduce the ownership and control problems in the organisations | Linear Regression | Hassan and Marimuthu (2015) |
| Gender Diversity | Positive | Firm value | Women participation does have a relationship with increasing market value. | ANOVA, Linear Regression | Hassan and Marimuthu (2014) |
| Gender Diversity among BODs | Positive impact | Average effect is positive. | - Gender diversity in US firms, females have a significant impact on firm inputs & outcomes of firms. - Gender quotas for BODs can reduce the firm value. | - The source of data from annual reports. - Agent Theory - Statistical tools used for empirical analysis. | Adams and Ferreira (2009) |
| Gender Diversity among TMTs | Positive impact | The effect is positive. | - Gender diversity in Top Mgt. Effects Agency Cost. - Greater percentage of females in top management of companies, lower agency cost, - companies those have less competitive market showed the negative relation of diversity & agency cost. | - The source of data from annual reports. - Univariate/Regression analysis used - Ratio formula, Weighted moving average | Jurkus et al. (2011) |
| Gender Diversity among BODs | Good Governance | Positive | Diversity resolves problem and issues and a case of good governance. | Comparison of different studies. | Fitzsimmons (2012) |
| Gender Diversity among BODs | Positive impact on Governance | High Performance | Companies with a higher proportion of women in top mgt. Perform better. | Questionnaire or survey method used. | McKinsey & Company Report (2007) |
| Demographic diversity in TMTs | Not discussed | High Performance | - Diversity at a high level can raise conflicts & performance gain results. - Improved the decision-making and performance. | - Upper echelon theory - a longitudinal study. - Demographic Characteristics. -Homogeneity & Heterogeneity. | Carson et al. (2004) |
| Workforce Diversity (Racial) | Not discussed | Positive Impact | - Diversity is positive factor - The minority is friendly and significantly impact on results. - Diversity is economic benefits Competitive advantage & stakeholder profitability | - Cultural diversity - Financial Performance through - ROS - ROE - ROA - ROI | Von Bergen et al. (2005) |
| Workforce Diversity (Racial) | Not discussed | Positive Impact | - Diversity Driver Model” which is based on BEM. - Diversity Model has used to manage diversity and for improvement. | - Diversity Driver Model used - Self- assessment approach | Farrer (2004) |
| Demographic Diversity (Ethnic diversity and Gender diversity) | Not discussed | Positive Impact | BOD diversity has a significant impact on financial performance; TMT’s Diversity does not any impact on financial performance. | - Agency theory - Stewardship theory - ROE - Ratio tool - Non-probability sampling | Marimuthu and Kolandaisamy (2009a) |
| Diversity in TMTs | Not discussed | Positive Impact | Demographic diversity of senior management teams is positively | - Partial correlation analysis - Upper Echelon Theory | Nishii et al. (2007) |
| Diversity among BODs | Not discussed | Significant Impact | - Gender diversity has a positive influence on firm financial performance. - Women directorship may affect firm performance. | - ROA - OLS regression analysis - Random Sampling | Julizaerma and Mohamad Sori (2012) |
| Diversity (Gender) | Good Governance | Positive | Gender of the CEO matters regarding firm performance. | - ROA - T-test | Khan and Paulo Vieito (2013) |
| Diversity in BODs (Gender, Ethnic, Nationality) | Good Governance | Positive | Gender diversity was negatively linked with firm performance while board nationality and board ethnicity were positive in firm performance | - Resource dependency theory - Agency theory - Generalized Least Square (GLS) Fixed-Effect and Random-Effect models | Ujunwa et al. (2012) |
| Diversity in BODs (Gender, Ethnic, Nationality) | Good Governance | Positive Impact | Personal characteristics BODs may affect corporate performance | - Resource dependency theory - EPS, ROA | Cheng et al. (2010) |
Appendix B


References
- Abdullah, Shamsul Nahar. 2014. The causes of gender diversity in Malaysian large firms. Journal of Management & Governance 18: 1137–59. [Google Scholar]
- Adams, Renée B., and Daniel Ferreira. 2009. Women in the boardroom and their impact on governance and performance. 94: 291–309. [Google Scholar] [CrossRef]
- Al-Musali, Mahfoudh Abdul Karem Mahfoudh, and Ku Nor Izah Ku Ismail. 2015. Board diversity and intellectual capital performance: The moderating role of the effectiveness of board meetings. Accounting Research Journal 28: 268–83. [Google Scholar] [CrossRef]
- Booth, James R., Marcia Millon Cornett, and Hassan Tehranian. 2002. Boards of directors, ownership, and regulation. Journal of Banking & Finance 26: 1973–96. [Google Scholar]
- Campbell, Kevin, and Antonio Minguez Vera. 2010. Female board appointments and firm valuation: Short and long-term effects. Journal of Management & Governance 14: 37–59. [Google Scholar]
- Carson, Charles M., Don C. Mosley, and Scott L. Boyar. 2004. Performance gains through diverse top management teams. Team Performance Management: An International Journal 10: 121–26. [Google Scholar] [CrossRef]
- Carter, David A., Betty J. Simkins, and W. Gary Simpson. 2003. Corporate governance, board diversity, and firm value. Financial Review 38: 33–53. [Google Scholar] [CrossRef]
- Coles, Jeffrey L., Naveen D. Daniel, and Lalitha Naveen. 2008. Boards: Does one size fit all? Journal of Financial Economics 87: 329–56. [Google Scholar] [CrossRef]
- Cheng, Louis T.W., Ricky Y.K. Chan, and T.Y. Leung. 2010. Management demography and corporate performance: Evidence from China. International Business Review 19: 261–75. [Google Scholar] [CrossRef]
- Collin, Sven-Olof, Elin Smith, Timurs Umans, Pernilla Broberg, and Torbjörn Tagesson. 2008. Mechanisms of Corporate Governance Going International: Outlining a Theory of and an Initial Test of the Performance Effects. In Proceedings of the Annual Meeting of the Academy of Management, Anaheim, California, USA, 8–13 August. [Google Scholar]
- Dahlin, Kristina B., Laurie R. Weingart, and Pamela J. Hinds. 2005. Team diversity and information use. Academy of Management Journal 48: 1107–23. [Google Scholar] [CrossRef]
- Dalton, Dan R., Catherine M. Daily, S. Trevis Certo, and Rungpen Roengpitya. 2003. Meta-analyses of financial performance and equity: fusion or confusion? Academy of Management Journal 46: 13–26. [Google Scholar] [CrossRef]
- Darmadi, Salim. 2013. Board members’ education and firm performance: Evidence from a developing economy. International Journal of Commerce and Management 23: 113–35. [Google Scholar] [CrossRef]
- Erkut, Sumru, Vicki W. Kramer, and Alison M. Konrad. 2008. Critical mass: Does the number of women on a corporate board make a difference. In Women on Corporate Boards of Directors: International Research and Practice. Cheltenham: Edward Elgar Publishing Limited, Northampton: Edward Elgar Publishing, Inc., pp. 350–66. [Google Scholar]
- Farrer, Jane. 2004. A practical approach to diversity. Industrial and Commercial Training 36: 175–77. [Google Scholar] [CrossRef]
- Fitzsimmons, Stacey R. 2012. Women on boards of directors: Why skirts in seats aren’t enough. Business Horizons 55: 557–66. [Google Scholar] [CrossRef]
- . Gelfand, Michele, Lisa Hisae Nishii, Jana L. Raver, and Benjamin Schneider. 2004. Discrimination in organizations: An organizational-level systems perspective. In Discrimination at Work: The Psychological and Organizational Bases. Edited by R.L. Dipboye and A. Colella. Mahwah: Lawrence Erlbaum Associates, pp. 89–116. [Google Scholar]
- George, Darren. 2003. SPSS for Windows Step by Step: A Simple Study Guide and Reference, 17.0 Update, 10/e. Delhi: Pearson Education India. [Google Scholar]
- Hambrick, Donald C., and Phyllis A. Mason. 1984. Upper echelons: The organization as a reflection of its top managers. Academy of Management Review 9: 193–206. [Google Scholar]
- Hambrick, Donald C., Theresa Seung Cho, and Ming-Jer Chen. 1996. The influence of top management team heterogeneity on firms’ competitive moves. Administrative Science Quarterly 41: 659–84. [Google Scholar] [CrossRef]
- Harrison, David A., and Katherine J. Klein. 2007. What’s the difference? Diversity constructs as separation, variety, or disparity in organizations. Academy of Management Review 32: 1199–228. [Google Scholar] [CrossRef]
- Hassan, Rohail, and Maran Marimuthu. 2014. Gender Diversity on Boards and Market Performance: An Empirical Investigation on Malaysian Listed Companies. PLATFORM—A Journal of Engineering, Science and Society 10: 17–25. [Google Scholar]
- Hassan, Rohail, and Maran Marimuthu. 2015. Corporate Governance Effect on Ownership and Control in Firms: An Empirical Evidence from Pakistan. International Journal of Business and Management 10: 212–17. [Google Scholar] [CrossRef]
- Hassan, Rohail, and Maran Marimuthu. 2016. Corporate Governance, Board Diversity, and Firm Value: Examining Large Companies Using Panel Data Approach. Economics Bulletin 36: 1737–50. [Google Scholar]
- Hassan, Rohail, Maran Marimuthu, and Satirenjit Kaur Johl. 2015a. Ethnic Diversity on Boards and Market Performance: An Empirical Investigation in Malaysia. Advanced Science Letters 21: 1099–103. [Google Scholar] [CrossRef]
- Hassan, Rohail, Maran Marimuthu, and Satirenjit Kaur Johl. 2015b. Demographic diversity and firm value: A review on large companies using panel data approach. In Proceedings of the 2015 International Symposium on Technology Management and Emerging Technologies (ISTMET), Langkawai Island, Malaysia, 25–27 August 2015; pp. 197–201. [Google Scholar]
- Hassan, Rohail, Maran Marimuthu, and Satirenjit Kaur Johl. 2015c. Diversity, Corporate Governance and Implication on Firm Financial Performance. Global Business and Management Research: An International Journal 7: 28–36. [Google Scholar]
- Hassan, Rohail, Maran Marimuthu, and Satirenjit Kaur Johl. 2016. Women on Boards and Market Performance: An Exploratory Study on the Listed Companies. International Business Management 10: 84–91. [Google Scholar]
- Hassan, Rohail, Maran Marimuthu, and Satirenjit Kaur Johl. 2017. Bridging and Bonding: How Gender Diversity Influence Organizational Performance. Global Business and Management Research: An International Journal 9: 117–26. [Google Scholar]
- Hülsheger, Ute R., Neil Anderson, and Jesus F. Salgado. 2009. Team-level predictors of innovation at work: A comprehensive meta-analysis spanning three decades of research. Journal of Applied psychology 94: 1128–45. [Google Scholar] [CrossRef] [PubMed]
- Ismail, Ku, Shamsul Nahar Abdullah, and Lilach Nachum. 2013. Women on Boards of Directors of Malaysia Firms: Impact on Market and Accounting Performance. In Proceedings of the Academy of Management 2013, Orlando, Florida, USA, 9–13 August. [Google Scholar]
- Jackson, Susan E., Aparna Joshi, and Niclas L. Erhardt. 2003. Recent research on team and organizational diversity: SWOT analysis and implications. Journal of Management 29: 801–30. [Google Scholar] [CrossRef]
- Jensen, Michael C., and William H. Meckling. 1976. Agency Costs and the Theory of the Firm. Journal of Financial Economics 3: 305–60. [Google Scholar] [CrossRef]
- Julizaerma, M.K., and Zulkarnain Mohamad Sori. 2012. Gender diversity in the boardroom and firm performance of Malaysian public listed companies. Procedia-Social and Behavioral Sciences 65: 1077–85. [Google Scholar] [CrossRef]
- Jurkus, Anthony F., Jung Chul Park, and Lorraine S. Woodard. 2011. Women in top management and agency costs. Journal of Business Research 64: 180–6. [Google Scholar] [CrossRef]
- Khan, Humera, Rohail Hassan, and Maran Marimuthu. 2017. Diversity on Corporate Boards and Firm Performance: An Empirical Evidence from Malaysia. Humanities 2: 1–8. [Google Scholar]
- Khan, Walayet A., and João Paulo Vieito. 2013. CEO gender and firm performance. Journal of Economics and Business 67: 55–66. [Google Scholar] [CrossRef]
- Kiel, Geoffrey C., and Gavin J. Nicholson. 2003. Board composition and corporate performance: How the Australian experience informs contrasting theories of corporate governance. Corporate Governance: An International Review 11: 189–205. [Google Scholar] [CrossRef] [Green Version]
- Lückerath-Rovers, Mijntje. 2013. Women on boards and firm performance. Journal of Management & Governance 17: 491–509. [Google Scholar]
- Lückerath-Rovers, Mijntje, and Auke De Bos. 2011. Code of conduct for non-executive and supervisory directors. Journal of Business Ethics 100: 465–81. [Google Scholar] [CrossRef]
- McKinsey & Company. 2007. Women matter. Gender diversity, a corporate performance driver. Paris: McKinsey & Company, Available online: http://www.raeng.org.uk/publications/other/women-matter-oct-2007 (accessed on 1 June 2015).
- Marimuthu, Maran, and Indraah Kolandaisamy. 2009a. Demographic diversity in top level management and its implications on firm financial performance: An empirical discussion. International Journal of Business and Management 4: 176–88. [Google Scholar] [CrossRef]
- Marimuthu, Maran, and Indraah Kolandaisamy. 2009b. Ethnic and gender diversity in boards of directors and their relevance to financial performance of Malaysian companies. Journal of Sustainable Development 2: 139–48. [Google Scholar] [CrossRef]
- Milliken, Frances J., and Luis L. Martins. 1996. Searching for common threads: Understanding the multiple effects of diversity in organizational groups. Academy of Management Review 21: 402–33. [Google Scholar]
- Mitton, Todd. 2002. A cross-firm analysis of the impact of corporate governance on the East Asian financial crisis. Journal of Financial Economics 64: 215–41. [Google Scholar] [CrossRef]
- Monbiot, George. 2006. The denial industry. The Guardian. September 19. Available online: https://www.theguardian.com/environment/2006/sep/19/ethicalliving.g2 (accessed on 7 July 2014).
- Monks, R., and Nell Minow. 2004. Corporate Governance. Malden: Blackwell Publishing, vol. 3. [Google Scholar]
- Nishii, Lisa Hisae, Anne Gotte, and Jana L. Raver. 2007. Upper echelon theory revisited: The relationship between upper echelon diversity, the adoption of diversity practices, and organizational performance. CAHRS Working Paper #07-04, Center for Advanced Human Resource Studies, School of Industrial and Labor Relations, Cornell University, Ithaca, NY, USA. Available online: http://digitalcommons.ilr.cornell.edu/cahrswp/461 (accessed on 17 August 2015).
- Nguyen, Tuan, Stuart Locke, and Krishna Reddy. 2015. Does boardroom gender diversity matter? Evidence from a transitional economy. International Review of Economics & Finance 37: 184–202. [Google Scholar]
- OECD. 2004. Co-operation, Organisation for Economic, and Development. In OECD Principles of Corporate Governance 2004. Paris: OECD Publishing. [Google Scholar]
- Patro, Sukesh, Kenneth Lehn, and Mengxin Zhao. 2009. Determinants of the Size and Structure of Corporate Boards: 1935–2000. Financial Management 38: 747–80. [Google Scholar]
- Robinson, Gail, and Kathleen Dechant. 1997. Building a business case for diversity. The Academy of Management Executive 11: 21–31. [Google Scholar] [CrossRef]
- Rose, Caspar. 2007. Does female board representation influence firm performance? The Danish evidence. Corporate Governance: An International Review 15: 404–13. [Google Scholar] [CrossRef]
- Shukeri, Siti Norwahida, Ong Wei Shin, and Mohd Shahidan Shaari. 2012. Does board of director’s characteristics affect firm performance? Evidence from Malaysian public listed companies. International Business Research 5: 120–7. [Google Scholar] [CrossRef]
- Singh, Val, and Susan Vinnicombe. 2004. Why so few women directors in top UK boardrooms? Evidence and theoretical explanations. Corporate Governance: An International Review 12: 479–88. [Google Scholar] [CrossRef]
- Smith, Nina, Valdemar Smith, and Mette Verner. 2006. Do women in top management affect firm performance? A panel study of 2,500 Danish firms. International Journal of Productivity and Performance Management 55: 569–93. [Google Scholar] [CrossRef]
- Tarus, Daniel Kipkirong, and Federico Aime. 2014. Board demographic diversity, firm performance and strategic change. Management Research Review 37: 1110–36. [Google Scholar] [CrossRef]
- Tihanyi, Laszlo, Alan E. Ellstrand, Catherine M. Daily, and Dan R. Dalton. 2000. Composition of the top management team and firm international diversification. Journal of Management 26: 1157–77. [Google Scholar] [CrossRef]
- Torchia, Mariateresa, Andrea Calabrò, and Morten Huse. 2011. Women directors on corporate boards: From tokenism to critical mass. Journal of Business Ethics 102: 299–317. [Google Scholar] [CrossRef]
- Ujunwa, Austin, Chinwe Okoyeuzu, and Ifeoma Nwakoby. 2012. Corporate board diversity and firm performance: Evidence from Nigeria. Revista de Management Comparat International 13: 605–20. [Google Scholar] [CrossRef]
- Van Knippenberg, Daan, and Michaela C. Schippers. 2007. Work group diversity. Annual Review of Psychology 58: 515–41. [Google Scholar] [CrossRef] [PubMed] [Green Version]
- Von Bergen, C.W., Barlow Soper, and John A. Parnell. 2005. Workforce diversity and organisational performance. Equal Opportunities International 24: 1–16. [Google Scholar] [CrossRef]
- West, Candace, and Don H Zimmerman. 1987. Doing gender. Gender & society 1: 125–51. [Google Scholar]
- Yusoff, Wan Fauziah Wan. 2010. Characteristics of Boards of Directors and Board Effectiveness: A Study of Malaysian Public Listed Companies. PhD dissertation, Victoria University, Wellington, New Zealand. [Google Scholar]
- Zainal, Dalilawati, Norhayah Zulkifli, and Zakiah Saleh. 2013. Corporate board diversity in Malaysia: A longitudinal analysis of gender and nationality diversity. International Journal of Academic Research in Accounting, Finance and Management Sciences 3: 136–48. [Google Scholar]


| Variable | Acronym | Measurement |
|---|---|---|
| Dependent Variables | ||
| TOBIN’S Q | Tobin’s Q | Ratio: “BV Total Assets -BV of Equity + MV of Equity/BV of Total Asset” where BV = Book Value; MV = Market value |
| Independent Variables | ||
| Gender Diversity | GENDIV | Ratio: Total number of females (Muslim and Non-Muslim women)/Total board members [Gender diversity] |
| Ethnic Diversity | ETHNDIV | Ratio: Total Non-Bumiputera (Non-Malay)/Total board members [Ethnic diversity] |
| Ethnic Women | ETHNFER | Ratio: Total number of ethnic females/Total board members [Ethnic Women Ratio] |
| Age Profile | AGEP | “By studying the birth year of board members and average age of board members” [Age Profile Diversity] |
| Foreign Participation | FPR | Ratio: “Number of foreign members/Total board members” (Number of Foreign Directors Nationality) [Foreign Participation] |
| Gender Diversity × Ethnic Diversity | GENDIV × ETHNDIV | Gender Diversity Ratio × Ethnic Diversity Ratio [Gender Diversity × Ethnic Diversity] (Interactive Approach) |
| Gender Diversity × Foreign Participation | GENDIV × FPR | Gender Diversity Ratio × Foreign Participation Ratio [Gender Diversity × Foreign Participation Ratio] (Interactive Approach) |
| Education Diversity | EDUDIVTECH | Ratio: “Total number of board members with Technical Education/Total Board members” [Education Diversity-Technical] |
| Experience Diversity | EXPDIVTECH | Ratio: “Total number of board members with Technical Experience/Total Board members” [Experience Diversity-Technical] |
| Tenure Diversity | TNDIV | “Top level management tenure can be calculated by subtracting from the base year (2013) the year in which the executive joined the top-level management” (Number of Years spent in Board) [Tenure Diversity] |
| Control Variables | ||
| Firm Age | FAGE | “Number of years since incorporation” [Firm Age] |
| Firm Size | FSIZE | Log of total assets [Firm Size] |
| Financial Leverage | FINLEV | Total Debt/Total Asset [Financial leverage] |
| Business Risk | BR | “The standard deviation of operating income/mean of operating income” [Business Risk] |
| Growth opportunity | GROWTHOPPT | Sales0/Sales−1 [Δ Sales] |
| Variables | Abbreviations | Mean | Std. Dev. | Min | Max | Skewness | Kurtosis | ||
|---|---|---|---|---|---|---|---|---|---|
| Statistic | Std. Error | Statistic | Std. Error | ||||||
| Number of Females | FEM | 0.699 | 0.796 | 0 | 3 | 0.879 | 0.098 | −0.017 | 0.195 |
| Gender Diversity | GENDIV | 0.089 | 0.100 | 0 | 0.43 | 0.754 | 0.098 | −0.46 | 0.195 |
| Bumiputera | BUMI | 3.510 | 2.776 | 0 | 12 | 0.775 | 0.098 | −0.275 | 0.195 |
| Non-Bumiputera | NONBUMI | 4.360 | 2.556 | 0 | 12 | 0.217 | 0.098 | −0.435 | 0.195 |
| Ethnic Diversity | ETHNDIV | 0.565 | 0.305 | 0 | 1 | −0.336 | 0.098 | −1.127 | 0.195 |
| Ethnic Female | ETHNFE | 0.363 | 0.584 | 0 | 3 | 1.419 | 0.098 | 1.239 | 0.195 |
| Ethnic Women Ratio | ETHNFER | 0.048 | 0.080 | 0 | 0.43 | 1.592 | 0.098 | 1.961 | 0.195 |
| Age Profile | AGEP | 57.615 | 4.756 | 44.88 | 71.5 | 0.554 | 0.098 | 0.144 | 0.195 |
| Foreign Participation | FP | 0.594 | 1.270 | 0 | 8 | 2.966 | 0.098 | 10.182 | 0.195 |
| Foreign Participation Ratio | FPR | 0.073 | 0.144 | 0 | 0.73 | 2.27 | 0.098 | 4.815 | 0.195 |
| Gender Diversity × Ethnic Diversity | GENDIV × ETHNDIV | 0.047 | 0.065 | 0 | 0.31 | 1.462 | 0.098 | 1.66 | 0.195 |
| Gender Diversity × Foreign Participation | GENDIV × FPR | 0.005 | 0.017 | 0 | 0.16 | 4.825 | 0.098 | 31.738 | 0.195 |
| Technical Education (Members) | TEC EDU MEMB | 1.778 | 1.504 | 0 | 7 | 0.91 | 0.098 | 0.572 | 0.195 |
| Non-Technical Education (Members) | NONTEC EDU MEMB | 6.139 | 2.158 | 1 | 14 | 0.451 | 0.098 | 0.248 | 0.195 |
| Technical Education Ratio | EDUDIV TECH | 0.224 | 0.178 | 0 | 0.86 | 0.63 | 0.098 | −0.074 | 0.195 |
| Technical Experience (Members) | TEC EXP MEMB | 1.744 | 1.454 | 0 | 9 | 1.309 | 0.098 | 3.575 | 0.195 |
| Non-Technical Experience (Members) | NONTEC EXP MEMB | 6.173 | 2.366 | 1 | 14 | 0.558 | 0.098 | 0.278 | 0.195 |
| Technical Experience Ratio | EXPDIV TECH | 0.226 | 0.179 | 0 | 0.9 | 0.837 | 0.098 | 0.638 | 0.195 |
| Tenure Diversity | TNDIV | 7.804 | 4.635 | 0.5 | 25.25 | 1.032 | 0.098 | 1.044 | 0.195 |
| Board Size | BSIZE | 7.848 | 2.017 | 4 | 14 | 0.614 | 0.098 | 0.15 | 0.195 |
| Firm Age | FAGE | 30.271 | 21.166 | 1 | 103.8 | 1.559 | 0.098 | 2.628 | 0.195 |
| Firm Size | FSIZE | 13.990 | 1.661 | 4.95 | 18.41 | −0.359 | 0.098 | 4.363 | 0.195 |
| Financial Leverage | FINLEV | 0.206 | 0.169 | 0 | 0.78 | 0.724 | 0.098 | 0.036 | 0.195 |
| Business Risk | BR | −0.286 | 21.703 | −520.75 | 77.64 | −22.121 | 0.098 | 532.993 | 0.195 |
| Growth Opportunity | GROWTHOPPT | 11.775 | 28.793 | −70.7 | 364.74 | 6.518 | 0.098 | 67.234 | 0.195 |
| Tobin’s Q | TOBIN’s Q | 1.420 | 0.993 | 0.36 | 9.25 | 3.313 | 0.098 | 16.277 | 0.195 |
| Variables | 1 | 2 | 3 | 4 | 5 | 6 | 7 | 8 | 9 | 10 | 11 | 12 | 13 | 14 | 15 | 16 |
|---|---|---|---|---|---|---|---|---|---|---|---|---|---|---|---|---|
| TOBINQ | 1 | |||||||||||||||
| FAGE | −0.142 ** | 1 | ||||||||||||||
| FSIZE | −0.134 ** | 0.214 ** | 1 | |||||||||||||
| FINLIV | −0.137 ** | −0.090 * | 0.303 ** | 1 | ||||||||||||
| BR | −0.029 | 0.039 | 0.036 | 0.029 | 1 | |||||||||||
| GROWTHOPT | 0.111 ** | −0.074 | −0.051 | 0.027 | −0.047 | 1 | ||||||||||
| FPR | 0.181 ** | 0.173 ** | −0.034 | −0.203 ** | 0.022 | −0.054 | 1 | |||||||||
| ETHNFER | −0.027 | 0.017 | −0.211 ** | 0.040 | −0.031 | −0.013 | 0.030 | 1 | ||||||||
| GENDIV | 0.094 * | −0.037 | −0.125 ** | −0.009 | −0.010 | 0.031 | −0.070 | 0.668 ** | 1 | |||||||
| ETHNDIV | −0.023 | 0.010 | −0.183 ** | −0.155 ** | 0.003 | 0.065 | 0.302 ** | 0.288 ** | −0.095 * | 1 | ||||||
| AGEP | −0.082 * | 0.406 ** | 0.275 ** | −0.100 * | 0.057 | −0.086 * | 0.098 * | −0.118 ** | −0.215 ** | 0.029 | 1 | |||||
| TNDIV | −0.128 ** | 0.396 ** | 0.053 | −0.038 | 0.026 | −0.064 | 0.240 ** | 0.191 ** | −0.045 | 0.438 ** | 0.491 ** | 1 | ||||
| TECHEDUR | 0.009 | −0.098 * | −0.169 ** | −0.118 ** | −0.059 | 0.045 | 0.035 | −0.023 | −0.003 | 0.012 | −0.137 ** | −0.048 | 1 | |||
| TECHEXPR | 0.041 | −0.189 ** | −0.216 ** | −0.008 | −0.043 | 0.121 ** | −0.053 | −0.047 | −0.061 | 0.137 ** | −0.220 ** | −0.103 ** | 0.568 ** | 1 | ||
| GENDIV × ETHDIV | 0.050 | −0.044 | −0.248 ** | −0.011 | −0.006 | 0.075 | 0.045 | 0.858 ** | 0.782 ** | 0.327 ** | −0.182 ** | 0.134 ** | 0.032 | 0.053 | 1 | |
| GENDIV × FPR | 0.243 ** | 0.014 | −0.124 ** | −0.015 | 0.024 | 0.008 | 0.486 ** | 0.381 ** | 0.345 ** | 0.153 ** | −0.108 ** | 0.049 | 0.087 * | 0.042 | 0.457 ** | 1 |
| Variables | Pooled OLS (PEM) | Random Effect (REM) | Fixed Effect (FEM) | Fixed Effect with robust s.e. | Panel Corrected Standard Error |
|---|---|---|---|---|---|
| Constant | 1.876 *** | 1.471 * | 0.869 | 0.869 | 1.876 *** |
| (2.99) | (1.77) | (0.83) | (0.92) | (3.69) | |
| GENDIV | 1.667 ** | 0.831 | −0.149 | −0.149 | 1.667 *** |
| (2.18) | (1.03) | (−0.17) | (−0.25) | (6.19) | |
| ETHNDIV | −0.067 | −0.085 | −0.378 | −0.378 | −0.067 |
| (−0.36) | (−0.32) | (−0.96) | (−1.00) | (−1.11) | |
| ETHNFER | −2.013 ** | 2.091 ** | 3.470 *** | 3.470 ** | −2.013 ** |
| (−2.12) | (2.22) | (3.42) | (2.39) | (−2.35) | |
| AGEP | 0.010 | 0.011 | 0.001 | 0.002 | 0.010 *** |
| (0.99) | (0.85) | (0.12) | (0.11) | (2.84) | |
| FPR | 0.855 ** | 0.884 * | 0.039 | 0.039 | 0.855 *** |
| (2.52) | (1.94) | (0.07) | (0.06) | (3.97) | |
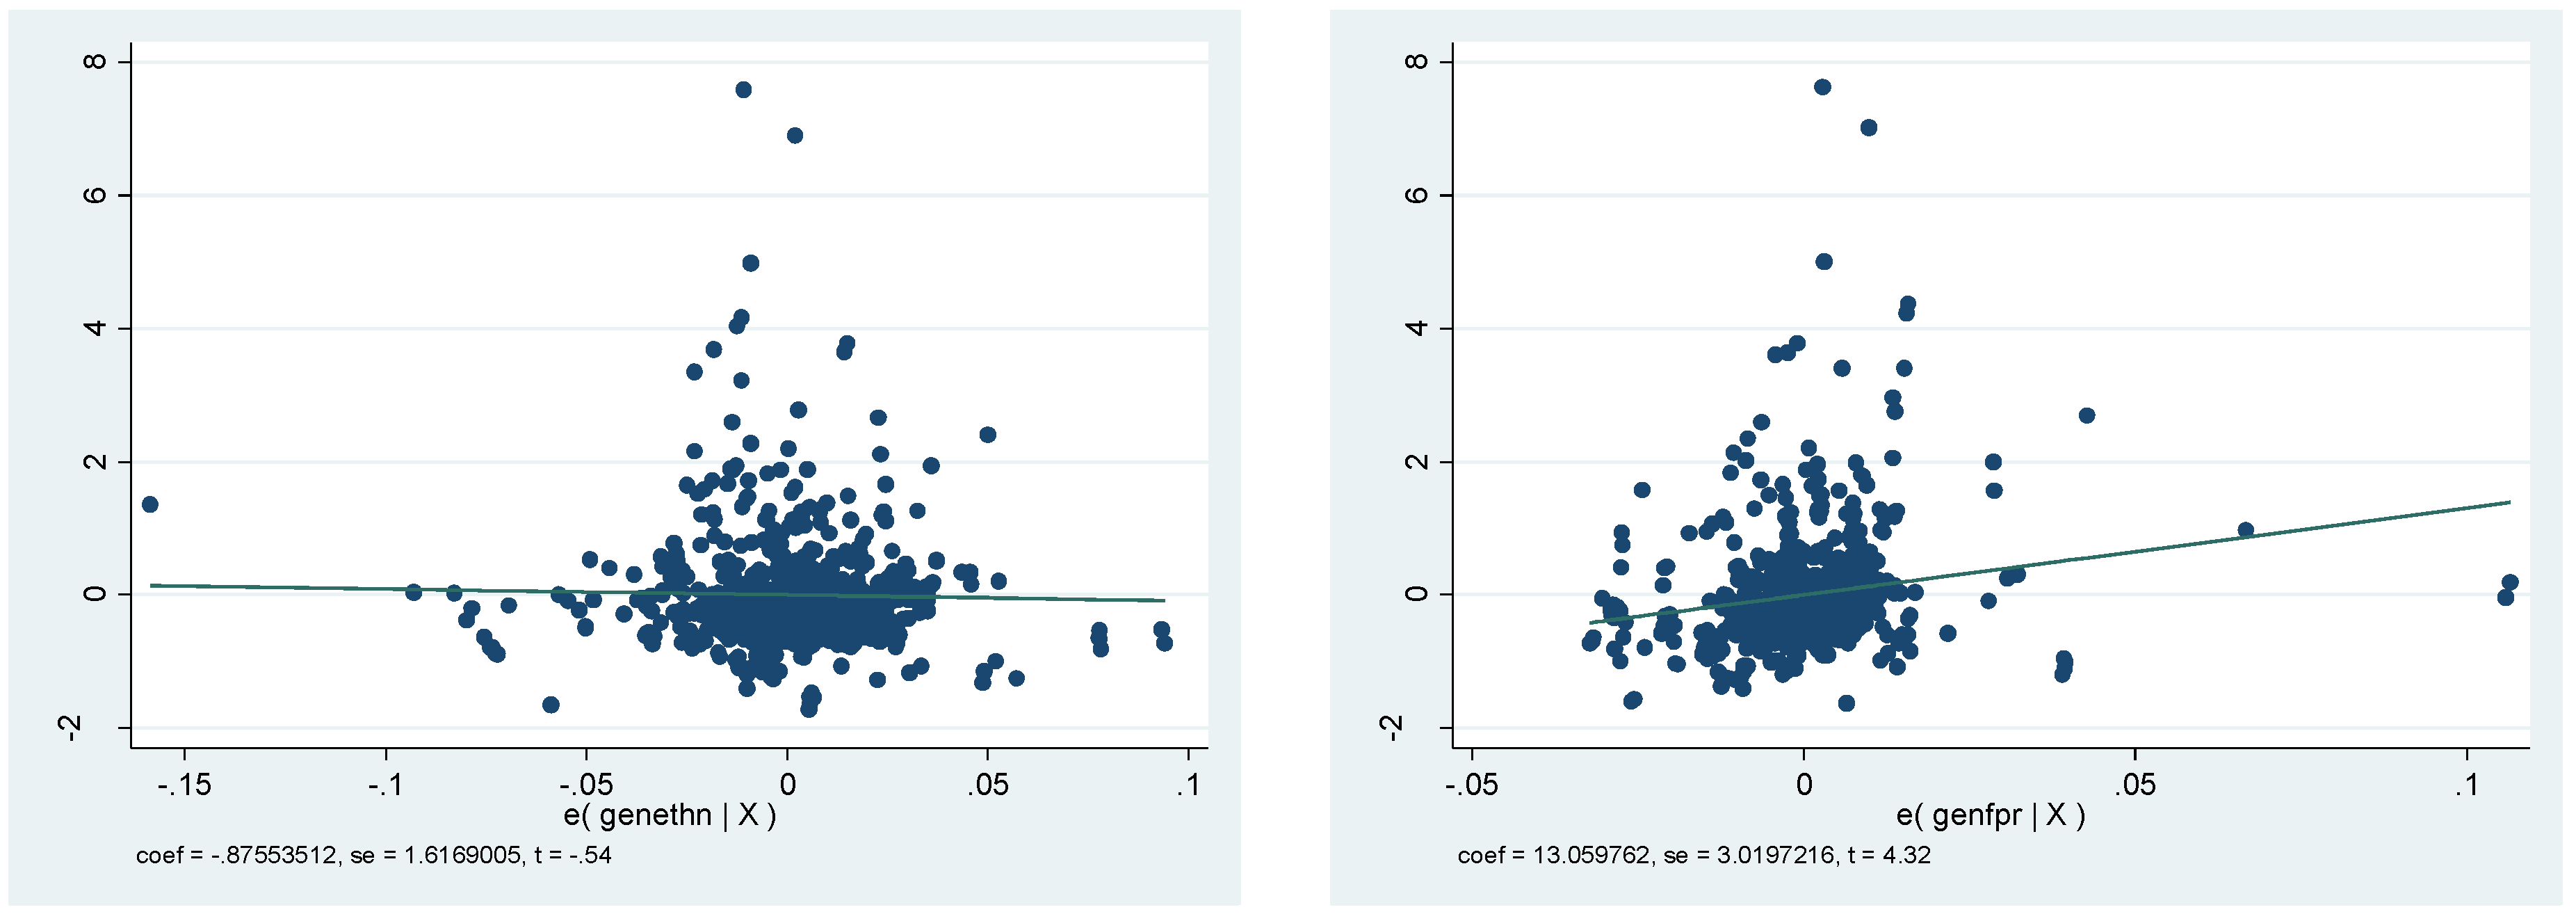
| GENDIV × ETHNDIV | −0.876 | −2.184 | −1.949 | −1.949 * | −0.876 |
| (−0.54) | (−1.33) | (−1.09) | (−1.64) | (−1.16) | |
| GENDIV × FPR | 13.060 *** | −11.549 *** | −20.326 *** | −20.326 * | 13.060 * |
| (4.32) | (−3.46) | (−5.57) | (−1.79) | (1.81) | |
| EDUDIV TECH | −0.443 * | −0.171 | −0.278 | −0.278 | −0.443 ** |
| (−1.71) | (−0.48) | (−0.61) | (−0.47) | (−2.46) | |
| EXPDIV TECH | 0.212 | −0.043 | −0.193 | −0.193 | 0.212 |
| (0.79) | (−0.12) | (−0.46) | (−0.26) | (1.12) | |
| TNDIV | −0.017 | −0.012 | −0.005 | −0.006 | −0.017 *** |
| (−1.46) | (−0.74) | (−0.26) | (−0.28) | (−4.14) | |
| FAGE | −0.006 *** | −0.053 | 0.039 ** | 0.039 | −0.006 *** |
| (−3.01) | (−1.41) | (2.36) | (2.00) | (−4.42) | |
| FSIZE | −0.050 * | −0.028 | −0.0262 | −0.026 | −0.050 * |
| (−1.88) | (−0.86) | (−0.62) | (−1.02) | (−1.7) | |
| FINLEV | −0.590 ** | 0.002 | 0.236 | 0.236 | −0.590 *** |
| (−2.34) | (0.01) | (0.87) | (0.7) | (−3.66) | |
| BR | −0.001 | −0.0007 | −0.000 | 0.000 | −0.001 ** |
| (−0.78) | (−0.67) | (−0.09) | (−0.19) | (−2.12) | |
| GROWTHOPPT | 0.003 *** | 0.0001 | −0.000 | 0.000 | 0.003 ** |
| (2.60) | (0.21) | (−0.44) | (−0.62) | (2.00) | |
| R2 | 0.155 | 0.087 | 0.132 | 0.132 | 0.155 |
| Breusch-Pagan LM test | 455.17 (0.000) *** | ||||
| Reject Ho (means RE is more appropriate) | |||||
| Hausman test | 154.42 (0.000) *** | ||||
| Reject Ho (means support FE) | |||||
| Observations | 625 | 625 | 625 | 625 | 625 |
| Diagnostic Check | |||||
| Serial correlation | 6.598 (0.001) *** | ||||
| Reject Ho (means auto prob.) | |||||
| Heteroskedasticity | 2.7 × 10⁶ (0.000) *** | ||||
| Reject Ho (means hetero prob.) | |||||
| Multicollinearity, VIF | 2.38 | ||||
| Objective: To investigate diversity at top-level management of listed companies with regard to their performance. | Status |
|---|---|
| Tobin’s Q | |
| H1: Gender diversity (Muslim and Non-Muslim women) among the board members (BODs) has a positive impact on firm performance (Tobin’s Q). | Supported (Positive Significant) |
| H2: Ethnic diversity among the board members (BODs) has a positive impact on firm performance (Tobin’s Q). | Not Supported (Insignificant) |
| H3: Ethnic women participation among the board of directors has a positive impact on firm performance (Tobin’s Q). | Not Supported (Negative Significant) |
| H4: The age profile of the board of directors has a positive impact on firm performance (Tobin’s Q). | Supported (Positive Significant) |
| H5: Foreign participation among the board of directors has a positive impact on firm performance (Tobin’s Q). | Supported (Positive Significant) |
| H6: Gender diversity with ethnic diversity (Gender Diversity × Ethnic Diversity) among board members (BODs) has a positive impact on firm performance (Tobin’s Q). | Not Supported (Insignificant) |
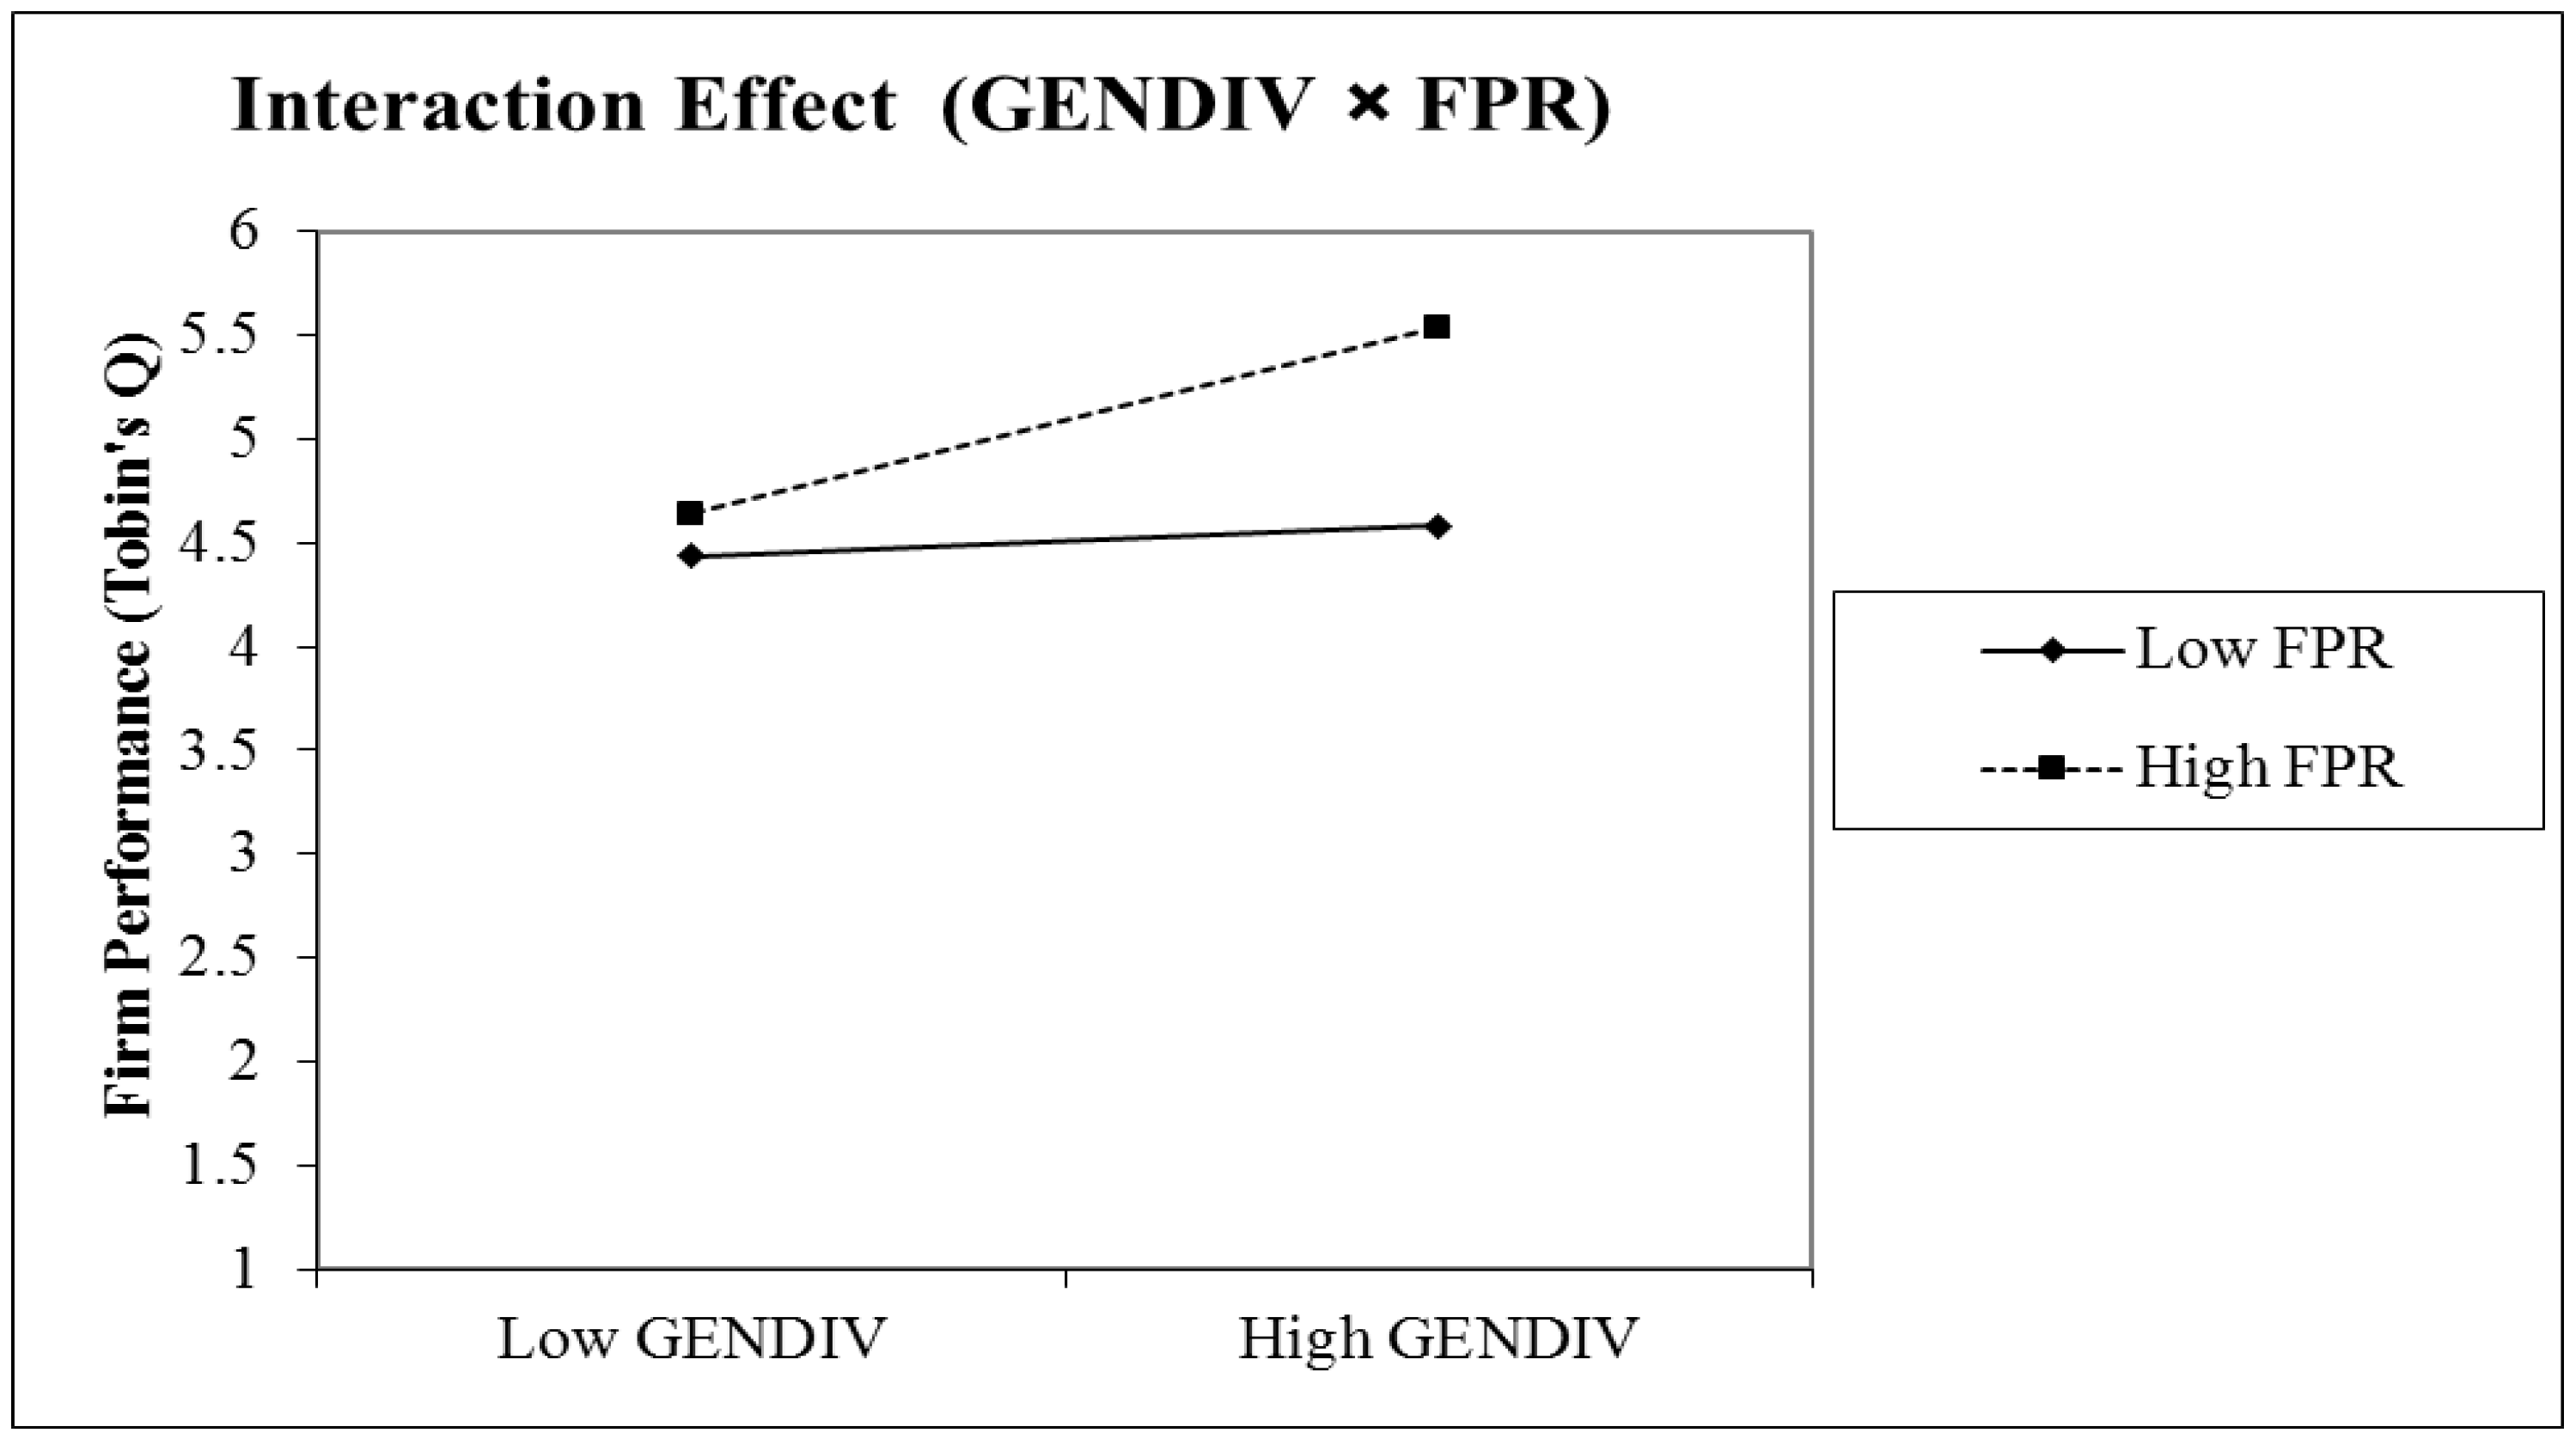
| H7: Gender diversity with foreign participation (Gender Diversity × Foreign Participation) among board members (BODs) has a positive impact on firm performance (Tobin’s Q). | Supported (Positive Significant) |
| H8: Technical Education diversity among the board of directors has a positive impact on firm performance (Tobin’s Q). | Not Supported (Negative Significant) |
| H9: Technical Experience diversity among the board of directors has a positive impact on firm performance (Tobin’s Q). | Not Supported (Insignificant) |
| H10: Tenure diversity among the board members has a positive impact on firm performance (Tobin’s Q). | Not Supported (Negative Significant) |
© 2017 by the authors. Licensee MDPI, Basel, Switzerland. This article is an open access article distributed under the terms and conditions of the Creative Commons Attribution (CC BY) license (http://creativecommons.org/licenses/by/4.0/).
Share and Cite
Hassan, R.; Marimuthu, M. Does Corporate Diversity Really Matter in the Plantation Sector? Empirical Evidence from a World Islamic Leading Country and Market Reaction. Int. J. Financial Stud. 2017, 5, 17. https://doi.org/10.3390/ijfs5030017
Hassan R, Marimuthu M. Does Corporate Diversity Really Matter in the Plantation Sector? Empirical Evidence from a World Islamic Leading Country and Market Reaction. International Journal of Financial Studies. 2017; 5(3):17. https://doi.org/10.3390/ijfs5030017
Chicago/Turabian StyleHassan, Rohail, and Maran Marimuthu. 2017. "Does Corporate Diversity Really Matter in the Plantation Sector? Empirical Evidence from a World Islamic Leading Country and Market Reaction" International Journal of Financial Studies 5, no. 3: 17. https://doi.org/10.3390/ijfs5030017