
The Market-Timing Ability of Chinese Equity Securities Investment Funds

Department of Economics, University College Cork, Cork T12YN60, Ireland
*
Author to whom correspondence should be addressed.
Int. J. Financial Stud. 2017, 5(4), 22; https://doi.org/10.3390/ijfs5040022
Submission received: 28 August 2017
/
Revised: 22 September 2017
/
Accepted: 27 September 2017
/
Published: 17 October 2017
Abstract
:This study examines the market-timing performance of Chinese equity securities investment funds during the period from May 2003 to May 2014 using the parametric tests of Treynor–Mazuy and Henriksson–Merton as well as the Jiang non-parametric test. Based on the non-parametric approach, the study finds that only one fund among the sample of 419 funds possessed statistically significant market-timing skill, while 9% of the funds were statistically significant negative market timers. Most funds do not time the market. This conclusion is robust when controlling for publicly available information in evaluating ‘private’ timing ability. Consistent with studies of other markets such as the UK, a higher prevalence of successful market timers is found by the Treynor–Mazuy and Henriksson–Merton methods compared to the non-parametric procedure.
JEL Classification:
G11; G121. Introduction
Assessment of fund performance is based on two abilities: securities selection ability and market-timing ability. The former examines whether a fund manager beats the benchmark portfolios in risk-adjusted terms (Jensen 1968; Fama and French 1993; Gruber 1996; Ferson and Schadt 1996; Carhart 1997), while the latter tests if a fund manager correctly anticipates the direction of aggregate market fluctuations by entering (exiting) a bull (bear) market (Treynor and Mazuy 1966; Henriksson and Merton 1981; Admati et al. 1986; Bollen and Busse 2001; Jiang 2003).
Market timing may be practised by: (i) tactical asset allocation that requires fund managers to successfully allocate money among different asset classes, e.g., equities versus cash, according to the anticipated future direction of the market; and (ii) adjusting the portfolio’s sensitivity to the market in response to the expected market return, i.e., increasing (decreasing) the portfolio beta in response to an anticipated bull (bear) market (Jiang 2003). The former technique examines whether the portfolio holdings anticipate market moves, which requires information on a portfolio’s composition over time. Graham and Harvey (1996) implement a portfolio-based method to test market timing using investment newsletters’ asset allocation recommendations. Holdings, however, are not often available (particularly in academic studies). On the other hand, testing whether the portfolio beta is conditional on a benchmark portfolio return only requires data on ex-post fund and market returns, which are widely available.
The question of market timing has attracted a lot of attention among studies of developed markets such as the US and UK, while the Chinese fund industry, as a newer and less-developed industry, is relatively under-explored. This study applies regression approaches, e.g., the Treynor and Mazuy (1966) model and the Henriksson and Merton (1981) model, as well as the non-parametric test of the Jiang (2003) study, to evaluate market-timing ability among individual Chinese domestic equity funds during the period May 2003 to May 2014. Conditional market-timing tests are also implemented for the Chinese data. A data set of 419 funds is evaluated in this study. This represents almost the entire Chinese domestic equity securities investment fund industry at the end of the sample period (including 5 non-surviving funds). To our knowledge, the Jiang (2003) non-parametric market-timing test, as well as tests of private timing ability conditional on publicly available information, have never been previously undertaken for the Chinese open-end securities investment fund industry.
The non-parametric methodology of Jiang (2003) has several strengths compared with the standard regression-based approaches such as, or based upon, the Treynor–Mazuy and Henriksson–Merton methods (henceforth TM and HM, respectively). First, the response function of a fund’s manager to information required by the Jiang (2003) procedure is less restrictive than the linear and binary specifications required by the TM and HM tests. This is because the Jiang (2003) approach only requires the portfolio beta, i.e., the fund’s market exposure, to be a non-diminishing function of the expected market return which, in other words, requires non-increasing absolute risk aversion. Second, a fund manager’s market-timing performance is related to both the quality of the manager’s timing information and the aggressiveness of the response. The TM and HM models fail to separate these elements of market timing. The non-parametric statistic, in contrast, is independent of the aggressiveness of the response as it simply measures the frequency of a manager predicting a market movement correctly and acting on it appropriately. Third, the TM and HM tests may be biased due to heteroscedasticity and skewness, which are common in financial data (Breen et al. 1986; Jagannathan and Korajczyk 1986; Goetzmann et al. 2000), while the asymptotic distribution of the non-parametric statistic is much more robust to either heteroscedasticity or skewness. Finally, the Jiang (2003) methodology tests for timing across all possible frequencies at which a manager may be timing the market, e.g., monthly, quarterly, annually etc., rather than only testing for timing at the sampling frequency of the data at hand.
2. Literature Review
Among parametric methods of market timing, two ‘classic’ and widely applied return-based methods of market timing are those proposed by Treynor and Mazuy (1966) and Henriksson and Merton (1981).
Treynor and Mazuy (1966) develop a conditional beta model of market timing:
where and are the fund and market excess returns respectively and abnormal timing performance is measured by the coefficient . The hypothesis of no market-timing ability implies . According to Admati et al. (1986), the model above indicates that a fund manager with constant absolute risk preference adjusts the portfolio beta at time based on a private linear signal as follow:
where is random noise.
Henriksson and Merton (1981) specify a regression function of the form:
where is defined as , which can also be interpreted as the payoff to a call option on the market portfolio with a strike price equal to the risk-free rate. In the Henriksson and Merton (1981) model, the conditional portfolio beta has two target values in a binary response function of the future market excess return, which is forecast by the fund manager. The coefficient measures market-timing ability; a significant and positive indicates a successful market timer.
The Ferson and Schadt (1996) study conditionalises both models. The authors test market timing controlling for timing skills that may be attributed to public information, by specifying the portfolio beta as a linear function of both expected future market excess return and the public information variables.
The TM and HM models as well as their conditional versions, however, may lead to many issues such as: (i) spurious timing arising from using an incorrect benchmark portfolio (Jagannathan and Korajczyk 1986; Breen et al. 1986); (ii) decomposing abnormal performance into stock-picking skills and market-timing ability (Admati et al. 1986; Grinblatt and Titman 1989); (iii) the loss of test power as a result of the difference between actual fund timing frequencies versus data sampling frequencies (Goetzmann et al. 2000; Bollen and Busse 2001); and (iv) the effects on the assessment of market timing when market volatilities and market return are timed simultaneously.
As noted by Breen et al. (1986), the TM and HM tests ignore conditional heterscedasticity. This may lead to a significant increase in falsely rejecting the true null hypothesis or failing to reject the null hypothesis too often when it is not true.
Using simulation methods, Kothari and Warner (2001) demonstrate that standard performance models (including market-timing models) are mis-specified. Randomly selecting stocks, controlling for size and value effects and periodically reforming portfolios to simulate characteristic fund turnover, the authors conclude that the abnormal performance suggested by the standard performance measures appears even when the portfolios are generated under the null hypothesis of no stock-picking and no market-timing abilities.
Bollen and Busse (2001) pick up the question of timing performance and the cash-flow hypothesis proposed by Warther (1995), Ferson and Warther (1996) and Edelen (1999). This hypothesis indicates that subscriptions to mutual funds are increased when the market return is relatively high, which leads to a high cash position and results in a relatively low portfolio return. As the market-timing coefficients in the HM model are only estimated with a positive market excess return, and thus the cash-flow hypothesis is asymmetric, Bollen and Busse (2001) argue that the timing coefficients in these parametric models are underestimated.
Another specification issue in the literature on market timing that can affect the test power and consistency is the question of distinguishing timing performance from stock-selection ability in risk-adjusted performance (Admati et al. 1986; Grinblatt and Titman 1989). Many studies find little evidence of statistically significant timing ability (particularly positive timing performance) but most of these studies also suggest that the abnormal market-timing performance is negatively correlated with abnormal stock-picking skills (Kon 1983; Chang and Lewellen 1984; Henriksson 1984; Lockwood and Kadiyala 1985). A rational explanation in the Henriksson (1984) study is that implementing a single rather than multi-factor performance model, mis-specifying the market portfolio, or error-in-variables bias may result in such empirical findings. However, Jagannathan and Korajczyk (1986) point out that the non-linear pay-off structure of options and option-like securities (such as highly leveraged stocks) may bias the conclusion of timing performance. A high payoff offered by a long position on a call option on the market portfolio in a rising market appears as positive market-timing ability, while the reduction in return caused by the option premium appears as negative security-picking skills in a falling or relatively steady market. However, the apparent abnormal timing or stock-selection performance is attributable to purchasing call options on the market regardless of whether market timing or stock picking is undertaken. Similarly, holding highly leveraged stocks (such as small firm stocks), which provide high return to equity holders only if there is a high stock return associated with a bull market, may also incur an upward bias to the timing performance.
A further specification issue reported by the Bollen and Busse (2001) study is that the results of the standard parametric timing tests as described above (i.e., the TM and HM tests), may be biased when data sampling frequencies and actual fund-timing frequencies by managers are different. The authors applied a bootstrap simulation technique to obtain synthetic fund returns which mimic the composition of actual funds by using both daily and monthly return data. Carrying out the TM and HM methods enhanced by multiple risk factors for the simulated data under the null hypothesis of zero abnormal timing performance, the authors demonstrate unbiased tests on daily data in detecting the expected number of positive, negative, significant and insignificant timing coefficients but biased tests on monthly data. However, the simulation results under the alternative hypothesis show that there is a significant improvement in the test power of daily timing relative to monthly timing. As such, Bollen and Busse (2001) suggest a downward bias to the timing performance of daily or weekly market timers when applying the TM and HM models to monthly fund return data. Goetzmann et al. (2000) draw a similar conclusion to Bollen and Busse (2001) and provide an adjustment without requiring daily fund data.
A final specification issue in the literature on market timing focuses on the question of whether the results of market-timing tests are distorted when market timing and volatility timing are undertaken simultaneously. Busse (1999) finds that, when the market is volatile, fund managers attempt to lower the portfolio beta. As a volatility timer may reduce the portfolio beta, i.e., the fund’s market exposure, when s/he anticipates that market volatility will rise, the market-timing measure may underestimate her/his timing performance if there is a positive correlation between market volatility and market return. Some studies, on the other hand, suggest that this issue should not complicate the assessment of market timing even in the presence of volatility timing, by providing the evidence of weak correlation between market volatility and return (Breen et al. 1986; Glosten et al. 1993; Busse 1999).
To address some of the specification or parametric issues discussed above, Jiang (2003) develops a non-parametric test of market timing based on a simple idea that the returns of an informed timer’s fund grow significantly in a bull market and drop slightly in a bear market. A detailed discussion of the Jiang (2003) approach is presented in Section 4 with empirical implementation for the Chinese securities investment fund industry in Section 5.
In the existing literature, the research on timing performance in the Chinese securities investment fund industry is first carried out among closed-end funds. One of the earliest studies of market timing in the Chinese fund market is that of Zhang and Du (2002). This study examines market-timing performance among 22 closed-end securities investment funds during the period 1999–2001 using the TM and HM measures, and finds little empirical evidence of significant timing performance.
Niu and Zhan (2004) replicate the Jiang (2003) non-parametric methodology to 33 closed-end funds using weekly returns between 2001 and 2003, and also draw a similar conclusion of no significant market timing ability. However, the timing assessment is different when the TM and HM models are applied, where the author demonstrates that statistically significant timing exists but is more likely to be negative among the closed-end funds on average. In addition, the study reports a negative cross-sectional correlation between the selectivity and market-timing measures of performance, which coincides with the empirical findings of many studies on the US mutual fund industry (Kon 1983; Chang and Lewellen 1984; Henriksson 1984; Lockwood and Kadiyala 1985).
Jiang and Zhao (2005) carry out a battery of tests, including both the TM and HM regression-based approaches as well as their conditional versions and the Jiang (2003) non-parametric methodology, to evaluate market-timing performance among 54 closed-end securities investment funds from 2002 to 2004. The assessment of no significant market-timing ability is largely consistent across all models and methods. Similarly, the authors report that timing performance is negatively correlated with selectivity performance, as found by Niu and Zhan (2004).
The studies described above relate to market-timing tests on the Chinese closed-end securities investment fund market. Some important and widely-cited contributions to the literature on timing performance regarding open-end equity securities investment funds are discussed here.
Zhou and Shi (2004) investigate weekly market-timing performance among 16 open-end equity securities investment funds during a one-year sample period of 2003–2004 using the TM and HM models. The empirical results from both of the approaches indicate positive but insignificant timing ability among the full sample as well as a strong negative correlation between timing and selectivity measures of performance. Du and Liao (2006) restrict their analysis to 5 open-end equity securities investment funds which survive for 3 years or more. By replicating the TM and HM tests, the authors draw a similar conclusion to that of Zhou and Shi (2004) of insignificant but positive timing performance on average.
Chen and Nie (2009) also examine the issue of market timing among Chinese open-end securities investment funds between 2004 and 2008 by carrying out the Treynor and Mazuy (1966), Henriksson and Merton (1981) and Chang and Lewellen (1984) models, augmented by multiple risk factors. The authors produce different results to Zhou and Shi (2004), where they find evidence of negative and statistically significant market-timing performance during the period 2005–2008. However, the study also reports a negative correlation between market timing and security selection skills. Similarly, Lai and Cao (2010) assess the timing performance of 181 open-end equity securities investment funds which have survived more than 52 weeks, using monthly data from 2002 to 2009. Based on standard regression-based approaches, the authors argue that the funds which show superior timing performance account for only 20% of the full sample approximately at the 5% significance level.
Overall, less research on the market-timing skills of the Chinese open-end securities investment fund market has been undertaken compared with that on the US mutual fund industry, while most studies of the Chinese open-end fund market merely apply the parametric measures. As indicated previously, the empirical findings of these studies may be spurious due to parametric or specification biases. This study, however, examines market timing using not only the standard regression-based methods but also the Jiang (2003) non-parametric test. Timing performance conditional on public information variables is also measured in this study. In addition, this paper is more comprehensive in terms of the sample length and sample size, as earlier studies on the market-timing performance of Chinese securities investment funds are based on very few funds and relatively short periods.
3. Data
3.1. Industry History
The Chinese open-end securities investment fund industry was established in December 2001 and developed extremely fast after 2003. By May 2014, there were over 1600 open-end securities investment funds, with total asset value of ¥45,374.30 billion ($6796.63 billion). In contrast to developed fund industries such as the US, between 2001 and 2014 there was significant growth in the Chinese fund industry: the total net asset value increased by almost 1400%, while the size of the US mutual fund market only doubled. As an emerging and developing fund industry, the Chinese fund industry is under-explored. This is one of the motivations for studying the Chinese market in this paper. Table 1 summarizes the historical development of the Chinese securities investment fund industry.
3.2. Industry Concentration and Fund Classes
Most of the total net asset value of the Chinese securities investment fund industry is invested in Chinese domestic equity while in 2014 only ¥495.54 billion ($74.23 billion) was invested globally. Industry concentration is high but has dropped slightly in the last four years. The five largest companies (China Asset Management, Harvest Fund Management, E Fund Management, China Southern Fund Management and Bosera Fund Management) manage 30% of the Chinese market, while the 10 largest groups account for 54%.
The Asset Management Association of China classifies all Chinese securities investment funds into five categories and defines these as follows: (i) equity funds (at least 60%1 of which is invested in Chinese domestic equity); (ii) bond funds (at least 80% of which is invested in the Chinese bond market); (iii) money market funds, solely invested in the Chinese money market; (iv) commingled funds, which are invested in stocks, bonds and money markets; and (v) QDII (Qualified Domestic Institutional Investors) funds, which are invested in global assets.
3.3. Institutional and Regulatory Framework
The Chinese fund market has witnessed significant changes in recent years. As an emerging market, the Chinese fund industry may be less developed and less efficient. The institutional and regulatory framework in China is quite different from the fund industry in developed capital markets. A distinct social and economic environment is created by the strong culture and the nation’s socialist tradition. For example, fund allocation, even by private firms, must often observe some non-market motivations, such as political motivations. In addition, there are still limitations on private firms acquiring and allocating resources and conducting operations (Peng 2001). Also, there are few experienced managers in the Chinese capital market. Thus, the institutional and regulatory environment in China provides an attractive context to study the Chinese fund industry.
3.4. Datasets Employed in This Study
This study employs a comprehensive securities investment fund dataset which consists of 419 Chinese open-end domestic equity funds. Non-surviving funds (5) are taken into consideration to control for survivorship bias. A non-surviving fund is one that has existed for some time during the sample period but has not survived for the whole sample period. Some funds may close due to mergers or takeovers, while others may have been forced to close due to poor performance. This highlights the importance of evaluating fund performance based on a dataset that is free of survivorship bias.
The securities investment fund returns data have been taken from the Morningstar Database. Fund returns are measured weekly rather than monthly in order to increase the number of observations due to the relatively short history of the Chinese fund industry. Our study is the most comprehensive to date on the Chinese fund industry in terms of the number of funds in our sample and the sample period length.
This study uses the Chinese Central Bank Bill, sourced from the RESSET Database2, as a proxy for the risk-free interest rate.
This study analyses funds investing in Chinese domestic equity and, consequently, accurate benchmark risk factor portfolios can be constructed to estimate fund risk-adjusted performance (i.e., abnormal performance). The construction and data sources of the benchmark factor portfolios are as follows:
The HuShen 300 Index (the Shanghai Stock Exchange and Shenzhen Stock Exchange largest 300 Stock Index) sourced from the RESSET Database is used as a proxy of the market portfolio. The index is the most comprehensive Chinese stock index and is measured as a value-weighted mean of 300 common stocks comprising about 60% of the market capitalization of all listed on the Shanghai Stock Exchange and Shenzhen Stock Exchange.3
The risk factor portfolio to model the size premium, SMB, is taken from the RESSET Database. It is calculated as the difference between the weekly returns on a portfolio of small cap stocks (the lowest 30% of stocks by market capitalization in the Chinese equity market) and the weekly returns on a portfolio of large cap stocks (the largest 30% of stocks by market capitalization).
The risk factor portfolio to capture the value effect, HML, is sourced from the RESSET Database. It is measured as the difference between the weekly returns on a portfolio of value stocks (the highest 30% of stocks by book-to-market ratio) and the weekly returns on the portfolio of growth stocks (the lowest 30% of stocks by book-to-market ratio).
We construct the benchmark risk factor portfolio for the momentum effect ourselves. All 2037 Chinese stocks listed on both the Shanghai stock exchange and the Shenzhen stock exchange are used to build the momentum benchmark portfolio. Weekly returns (sourced from DATASTREAM) on each of the stocks are collected. Each week all stocks are ranked by their cumulative returns over the previous 11 weeks (ranking period). Equally weighted portfolios of the best 30% of the stocks and the worst 30% of the stocks are then formed and held for one week (holding period). The momentum variable, MOM, is measured as the difference between the holding period returns on the portfolios of past high- and low-performing stocks.
This study employs five instruments in the conditional beta and conditional alpha-beta models. The definitions and data sources are as follows: (i) the Chinese 3-month Central Bank Bill rate is used as a proxy for the risk-free interest rate; (ii) the slope of the term structure is the difference between the Chinese 10-year government bond yield taken from DATASTREAM and the Chinese Central Bank Bill rate; (iii) the dividend yield of the market factor is the dividend yield on the HuShen 300 Index, which is taken from the RESSET Database; (iv) the bond-to-equity ratio is the Chinese 10-year government bond yield divided by the dividend yield on the HuSheng 300 Index; and (v) the default spread is the Chinese 10-year corporate bond yield sourced from DATASTREAM minus the Chinese 10-year government bond yield.
3.5. Number of Funds and Performance through Time
This section provides a breakdown of the numbers of funds and average risk-adjusted performance indicated by the Fama and French 3-factor model, as this model is suggested to be the ‘best-fit’ model as a risk-adjusted performance measure for the Chinese securities investment fund industry (Gao et al. 2016). The number of funds in existence grew consistently over the sample period (see Table 1). Table 2 shows the numbers of funds, average alphas from the Fama and French 3-factor model, and average standard deviation of alphas by length of fund history. For example, 386 funds exist for at least half a year (26 observations) and have an average alpha of −0.022% per week (−1.144% p.a.), while 201 funds exist for 4 years (208 observations) with an average alpha of −0.005% per week (−0.26% p.a.).
4. Non-Parametric Market-Timing Methodology
Because of the difficulties discussed above with the parametric market-timing tests, Jiang (2003) implements a non-parametric method on US mutual funds. Consider, the single factor CAPM
where is the expected excess return on fund i and denotes the expected market excess return. Under market timing, the fund’s conditional beta at time t, , depends positively on . (As before, denotes a measure of security selectivity independent of market timing).
The Jiang (2003) procedure involves randomly sampling a triad of market return observations and sorting based on size, rather than chronologically, such that . An informed market timer will maintain a higher exposure to the market, i.e., higher , over the range than in the range.
Simple (non-parametric) beta estimates for both time ranges are and . Both the precision of the market return prediction and the aggressiveness of the manager’s response are included in beta. The aggressiveness of the manager’s response is affected by risk preference. Grinblatt and Titman (1989) suggest that a fund with non-increasing absolute risk aversion and independent security selecting and market-timing abilities yields a convex fund return/market return relationship:
A sample statistic of a fund manager’s market-timing skill is constructed as:
where the sign function assumes a value of +1 (−1) if the argument is positive (negative), and a value of 0 if the argument equals zero. denotes the average sign across all triads taken from n observations. is an -consistent and asymptotically normal estimator (see: Abrevaya and Jiang 2005; Serfling 2009). Therefore, , where:
And
Given the null hypothesis of zero market timing, is asymptotically N (0,1).
Rational investors may be concerned more about the quality of the fund manager’s information regarding future market conditions rather than the aggressiveness of the manager’s response to this information, as the latter can be controlled by the investor themselves by adjusting the proportion of their wealth investing in the fund versus in cash. However, it is difficult to decompose the former from the latter using standard parametric tests (TM and HM) as discussed in the previous section. The non-parametric approach in Jiang (2003) measures how often a manger predicts the evolution of the market correctly and acts on it, regardless of how aggressively s/he acts on it; this is reflected in the fact that the sign function in Equation (6) assigns a value of +1 (−1), if the argument is positive (negative) irrespective of the size of the argument.
The non-parametric test procedure has several advantages. Firstly, it is a more comprehensive timing test when the manager’s timing frequency differs from the frequency of the sample data. It is also a more effective way to test the timing skills among managers whose timing frequency may not be uniform. The non-parametric timing statistic in Equation (6) studies timing over all triads of fund returns instead of just consecutive observations. As a result, it looks at more information than the standard parametric tests alone. Hence, the non-parametric technique allows the cross-section of managers to have different timing strategies.
Secondly, as discussed in the literature review, the HM method exhibits conditional heteroskedasticity. Breen et al. (1986) find that, as a result, the HM test falsely rejects the true null hypothesis of zero market timing too often, while the probability of failing to reject the null hypothesis when it is not true also increases significantly. The authors suggest that the TM method also suffers from these errors. Jiang (2003) argues that the asymptotic distribution of the non-parametric timing measure in Equation (6) is not affected by heteroskedasticity in fund returns.
Thirdly, the non-parametric test is less restrictive in behaviour than the regression-based tests: the non-parametric test sets as a non-decreasing function of . As demonstrated in Grinblatt and Titman (1989), this requires: (i) non-increasing absolute risk aversion; (ii) independently and identically distributed market returns; and (iii) independent security selecting and timing information. However, the requirement of non-increasing absolute risk aversion is less strict than that of the TM and HM tests which, respectively, require more specific linear and binary response functions.
Fourthly, the assumption of independently and identically distributed returns in the TM and HM tests rules out heteroskedasticity in market returns and hence volatility timing by fund managers. As already mentioned in the literature section, a fund manager is likely to lower the fund’s exposure when the market is expected to be highly volatile. As a result, the market-timing measure may underestimate the quality of the manager’s timing information, if market volatility and market return are positively correlated. However, as in Breen et al. (1986), Glosten et al. (1993) and Busse (1999), the empirical evidence based on the US data suggests a weak relationship between the market return and the volatility. The market return/volatility correlation in China is also weak: less than 0.01.
Finally, market=timing tests typically assume that timing skills and security selection ability are independent, Admati et al. (1986) and Grinblatt and Titman (1989). The non-parametric test in this study involves a similar assumption. Jagannathan and Korajczyk (1986) argue that this assumption may not hold in portfolios containing options and option-like securities with non-linear pay-off structures. Similar to the TM and HM tests, Jiang’s (2003) measure cannot distinguish market timing from spurious option-related effects. However, in our data on Chinese equity securities investment funds, the degree of options holdings is little or none.
Conditional Market Timing
It is particularly interesting to study whether fund managers’ market-timing ability extends to private-timing ability, i.e., beyond that which may be attributable to publicly available information. As public information is available to each investor, private-timing ability better justifies the service provided by fund managers, and the associated fees.
We also apply the non-parametric timing test to distinguish between public and private timing ability on the part of fund managers. As a first step, this test calculates the residuals from separate regressions of (i) the fund returns, and (ii) the market returns on a set of public information instruments. The residuals from this procedure represent the time series variation in the fund and market returns that are not explained by publicly available information. Let and denote the pairwise fund and market residuals, respectively. The conditional (upon public information) market-timing test involves applying the procedure outlined in Equation (4) to Equation (8) to these residuals:
It is worth to noticing that in Equation (6) and in Equation (9) can clearly be of different magnitudes but may also be of different sign; for instance, but could indicate a successful market-timing manager whose skill is attributable to public information.
This study examines conditional market timing using publicly available information data, which is common in the previous literature, such as Ferson and Schadt (1996). The public variables used in this study are: (i) the lagged level of the risk-free interest rate (the Chinese Central Bank Bill rate in this study); (ii) the lagged level of dividend yield on the market factor; (iii) a lagged measure of the slope of the term structure; (iv) a lagged measure of default spread in the corporate bond market; and (v) a lagged bond-to-equity ratio.
5. Empirical Results
The empirical results of unconditional market-timing tests are displayed in Table 3. The first row presents the non-parametric market-timing test statistic, . Under the null hypothesis of no market-timing ability, this test statistic is distributed asymptotically as N (0,1) and funds are presented from worst to best based on this statistic. Market-timing results are reported for funds with a minimum of 52 observations to further improve statistical reliability, which leaves 363 funds in the analysis. The market-timing coefficient, , is displayed in Row 2, corresponding to the fund in Row 1. From the z-statistic in Row 1, it is evident that all funds, apart from the top fund, do not exhibit statistically significant timing skill at the 5% significance level (one tail test). In fact, the cross-sectional (across funds) average timing test statistic is 0.778. More specifically, over 85% of funds produce negative market-timing ability, while 9% of funds are statistically significant negative market timers. Positive market timing is found for 14% of funds but this is statistically significant for only 0.3% of funds, i.e., only 0.3% of funds are skilled market timers. A histogram of the cross-sectional distribution of the test statistics is plotted in Figure 1a, which clearly shows that the distribution is centered on a value less than zero (indicating negative market-timing ability on average) with some funds in the left tail producing statistically significant negative market-timing skills.
Figure 1a–c shows histograms of the unconditional non-parametric market-timing test statistic, z, the unconditional TM test statistic, t-TM and the unconditional HM test statistic, t-HM, respectively. The figures are based on 363 funds with a minimum of 52 weekly observations.
Overall, the Jiang (2003) non-parametric test fails to find evidence in support of skilled market timers among Chinese securities investment funds. For comparison, this study also examines timing ability using the TM and HM tests. The t-statistics of the market timing coefficients of these regression tests are presented in Row 3 and Row 4 of Table 3 for the funds as ranked in Row 1. These point to stronger evidence of positive market timing compared to the non-parametric z-statistics. The histograms plotting the t-statistics of the market-timing coefficients of the TM test (Figure 1b) and the HM test (Figure 1c) also show that the distributions are centred on values greater than zero. There is a high and positive correlation between the market-timing test statistics of TM and HM measures (0.97), which is higher that the non-parametric/TM correlation coefficient (0.72) or the non-parametric/HM coefficient (0.79). The findings are similar to the findings in the Jiang (2003) study on the US fund industry and the Cuthbertson et al. (2010) study on the UK fund industry. They suggest that the higher correlation between TM and HM procedures may arise because these regression methods capture the aggressiveness of response in timing while the non-parametric methodology ignores aggressiveness of response.
Table 3 presents results for the unconditional market-timing tests. Row 1 reports the non-parametric test statistic, , and the funds are sorted from worst to best based on this statistic. Row 2 reports , the market-timing coefficient, for funds in row 1. Row 3 and row 4 show the t-statistics of the TM and HM timing coefficients, respectively, for the funds as sorted in row 1. Row 6 describes the investment objective of the sorted funds: 1 = equity income fund, 2 = general equity fund, 3 = small stock fund. Row 7 indicates whether the fund is a survivor or non-survivor fund: 1 = surviving fund, 0 = non-surviving fund. Row 8 displays the number of fund observations. Results are restricted to funds with a minimum of 52 observations, leaving 363 funds in the analysis.
Row 6 in Table 3 describes the investment objective of the sorted funds, while Row 7 indicates whether the fund is a survivor or non-survivor fund. Row 8 displays the number of fund observations. There is no significant difference in market-timing performance across different investment objectives of funds. However, it is evident that better-performing market timers are more prevalent among relatively longer-lived (over 3 years) funds.
The unconditional market-timing results for Chinese securities investment funds are broadly in line with those of the Jiang (2003) paper for the US and the Cuthbertson et al. (2010) studies for the UK. These studies suggest that US and UK mutual funds display negative market-timing ability on average. However, a slightly higher prevalence of positive timing is found among US and UK funds.
Conditional Market Timing
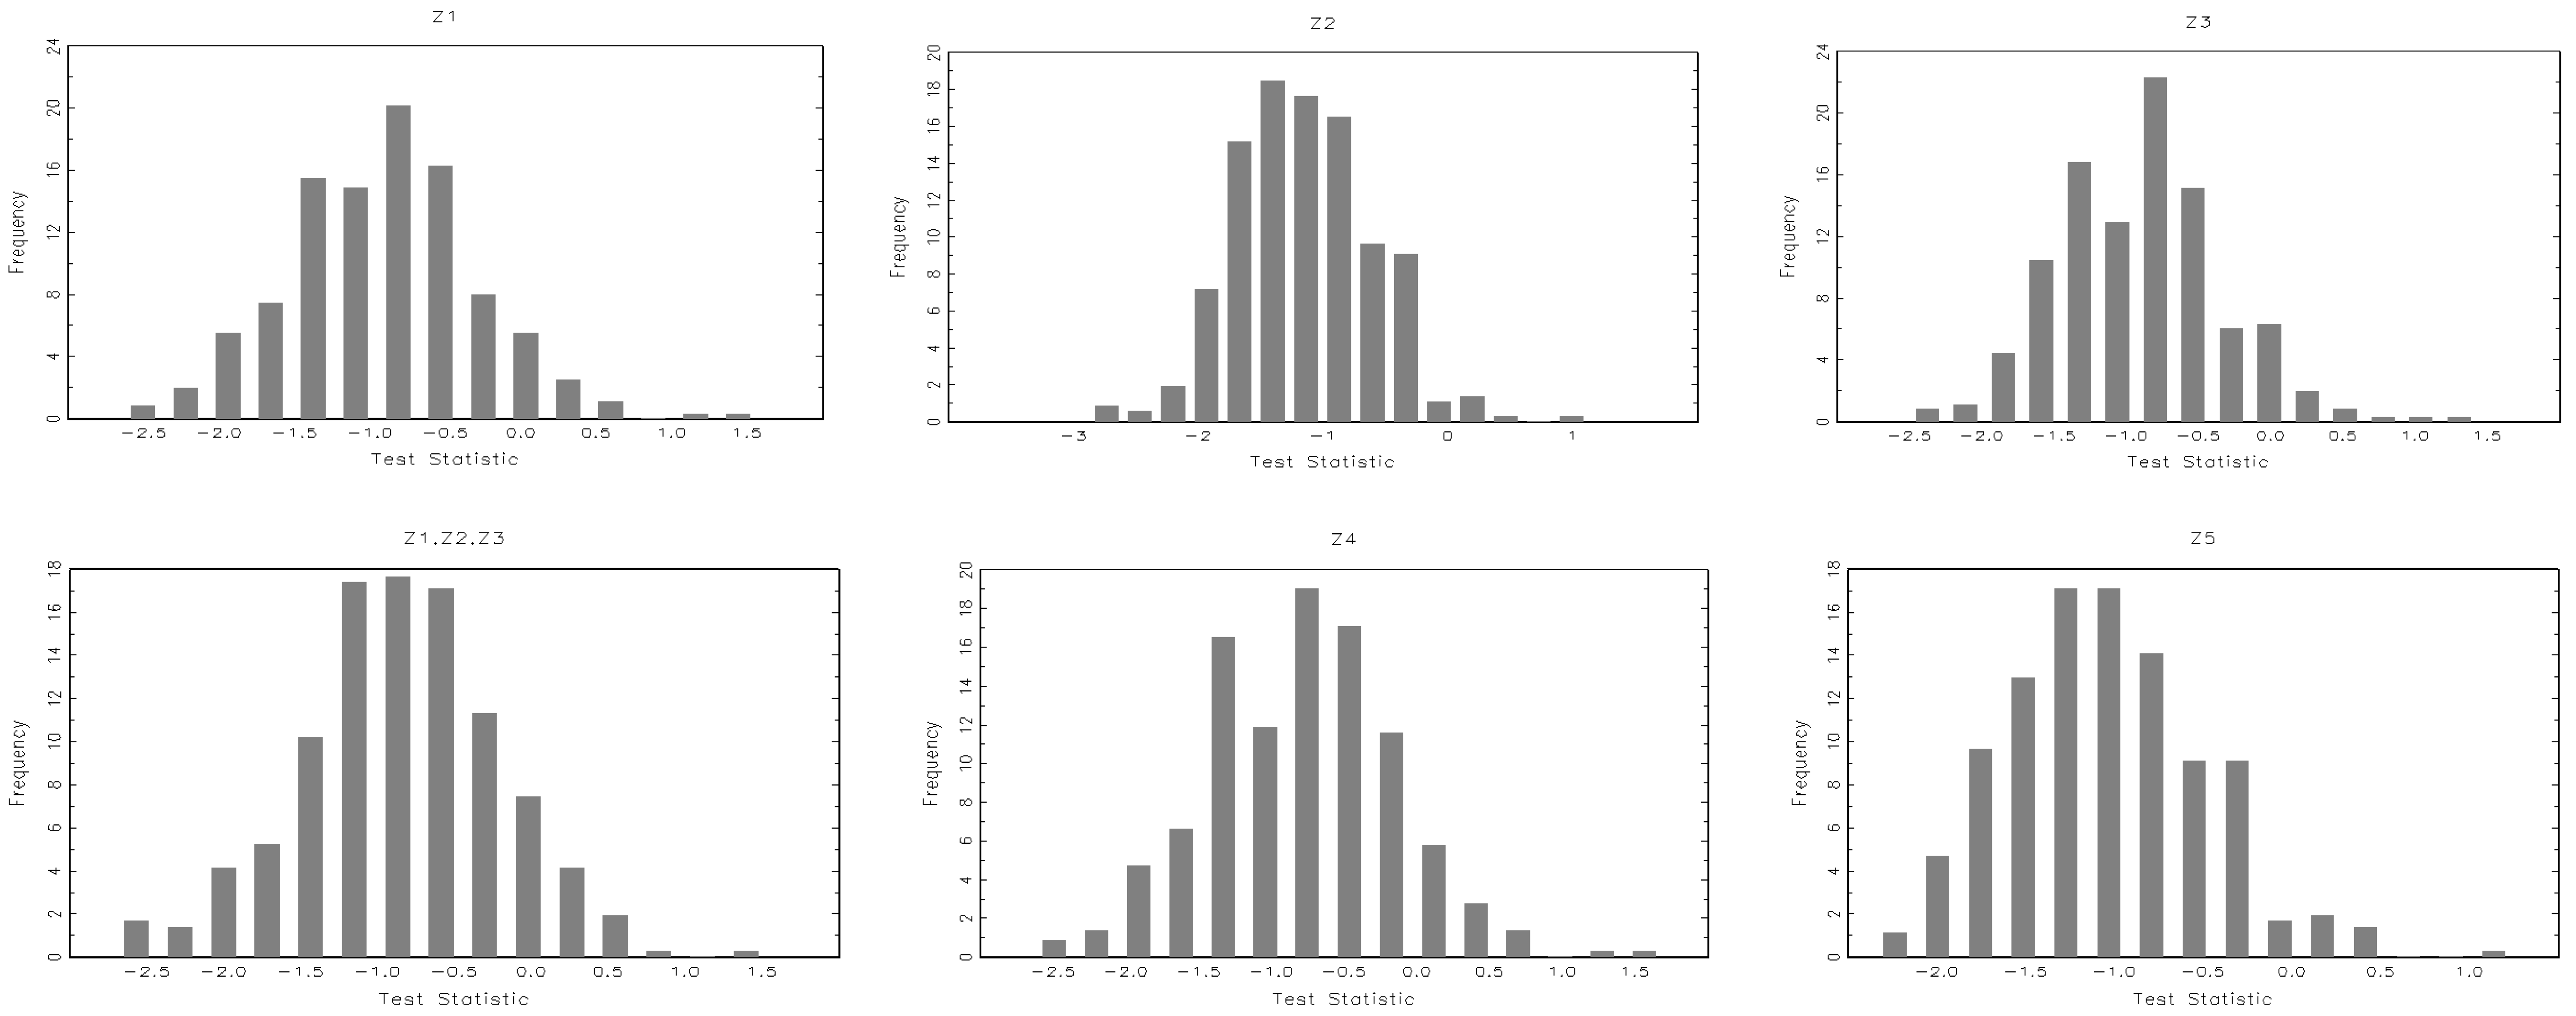
Table 4 presents a selection of representative results from conditional timing tests. For ease of comparison, Row 1 reports the unconditional test results presented in Table 4. The remaining rows report the non-parametric conditional market-timing test statistics using the public information sets, where Z1 = the Chinese Central Bank Bill rate; Z2 = the dividend yield of the market portfolio; Z3 = the slope of the term structure; Z4 = the default spread; and Z5 = the bond-to-equity ratio. The conditional test statistics are for funds as sorted in Row 1. According to the conditional market-timing results, there is evidence that the statistically significant market-timing ability of the top ranked funds by the unconditional test may be attributable to publicly available information, while the conditional test statistics are generally insignificant at the 5% level. In addition, the conditional market-timing results show more negative market timers on average, which indicates that some positive timing ability by unconditional tests may be explained by the publicly available information variables. These conclusions are qualitatively similar to the conclusion researched in Cuthbertson et al. (2010). However, Cuthbertson et al. (2010) find evidence that about 7 funds (top 1%) do have genuine market-timing skill even after controlling for public information. Histograms (in Figure 2) of the conditional market-timing test statistics using different combinations of public information variables as indicated show that the distributions of the test statistics in all cases are centred on negative values.
Table 4 presents results for the conditional market-timing tests. Rows report the non-parametric test statistic, , and funds are sorted from worst to best based on this statistic. For ease of comparison, row 1 shows the unconditional timing results as in Table 3. Row 2 to row 7 report the non-parametric test statistics of the conditional market-timing tests for the funds as sorted in row 1. Public information instruments are: Z1 = the lagged level of the risk-free interest rate (the Chinese Central Bank Bill rate in this study); Z2 = the lagged level of dividend yield on the market factor; Z3 = a lagged measure of the slope of the term structure; Z4 = a lagged measure of default spread in the corporate bond market; and Z5 = a lagged bond-to-equity ratio.
Figure 2 shows histograms of the conditional non-parametric market-timing test statistic using public information variables as indicated: Z1 = the lagged level of the risk-free interest rate (the Chinese Central Bank Bill rate in this study); Z2 = the lagged level of dividend yield on the market factor; Z3 = a lagged measure of the slope of the term structure; Z4 = a lagged measure of default spread in the corporate bond market; and Z5 = a lagged bond-to-equity ratio. The figures are based on 363 funds with a minimum of 52 weekly observations.
6. Conclusions
This study examines the market-timing performance of Chinese securities investment funds using the parametric (regression-based) tests of TM and HM as well as the non-parametric test of Jiang (2003). Overall, we find that Chinese securities investment funds do not possess significant positive market-timing skill on average. A sizeable majority of funds are shown to mis-time the market. The TM and HM tests find in favour of a slightly greater prevalence of positive market timing compared to the non-parametric methodology. This is consistent with the findings in previous studies on the Chinese fund industry (Zhou and Shi 2004; Chen and Nie 2009; Lai and Cao 2010). This result may be because these tests incorporate the aggressiveness of the fund managers’ response to timing signals while the non-parametric procedure does not. As might be expected, when we control for timing ability attributable to publicly available information, the cross-sectional distribution of market-timing performance deteriorates further.
Such poor timing performance in the Chinese securities investment fund industry may be attributed to a number of mitigating factors. First, instead of timing expected market returns, fund managers may be attempting to time market volatility (risk). This may appear as poor market return timing if there is a positive correlation between market return and volatility. However, the empirical evidence based on the Chinese data indicates a weak correlation of less than 0.01 between the market return and the volatility. This is consistent with the findings of weak market return/volatility correlations in the U.S. studies (Breen et al. 1986; Glosten et al. 1993; Busse 1999). Second, this study examines only open-end funds which may experience higher cash in-flows from investors in a rising market. This may cause a higher cash position in the short term, and hence lower market exposure and lower fund return.
Acknowledgments
We have no acknowledgements.
Author Contributions
Jun Gao, Niall O’Sullivan and Meadhbh Sherman conceived and designed the experiments; Jun Gao performed the experiments and analysed the data; Jun Gao, Niall O’Sullivan and Meadhbh Sherman discussed results and analytical methods; Jun Gao, Niall O’Sullivan and Meadhbh Sherman wrote the paper.
Conflicts of Interest
The authors declare no conflicts of interest.
References
- Abrevaya, Jason, and Wei Jiang. 2005. A nonparametric approach to measuring and testing curvature. Journal of Business & Economic Statistics 23: 1–19. [Google Scholar]
- Admati, Anat R., Sudipto Bhattacharya, Stephen A. Ross, and Paul Pfleiderer. 1986. On timing and Selectivity. Journal of Finance 41: 715–30. [Google Scholar] [CrossRef]
- Bollen, Nicolas P. B., and Jeffrey A. Busse. 2001. On the timing ability of mutual fund managers. Journal of Finance 56: 1075–94. [Google Scholar] [CrossRef]
- Breen, William, Ravi Jagannathan, and Aharon Ofer. 1986. Correcting for heteroscedasticity in tests for market timing ability. Journal of Business 59: 585–98. [Google Scholar] [CrossRef]
- Busse, Jeffrey. 1999. Volatility timing in mutual funds: Evidence from daily returns. Review of Financial Studies 12: 1009–41. [Google Scholar] [CrossRef]
- Calomiris, Charles, Raymond Fisman, and Yongxiang Wang. 2010. Profiting from government stakes in a command economy: Evidence from Chinese asset sales. Journal of Financial Economics 96: 399–412. [Google Scholar] [CrossRef]
- Carhart, Mark. 1997. On persistence in mutual fund performance. Journal of Finance 52: 57–82. [Google Scholar] [CrossRef]
- Chang, Eric C., and Wilbur G. Lewellen. 1984. Market timing and mutual fund investment performance. Journal of Business 57: 57–72. [Google Scholar] [CrossRef]
- Chen, Quanbao, and Rui Nie. 2009. Study on the Performance Evaluation of Open-end Securities Investment Fund. Working paper. Xuzhou, China: China University of Mining and Technology. [Google Scholar]
- Cuthbertson, Keith, Dirk Nitzsche, and Niall O’Sullivan. 2010. The market timing ability of UK mutual funds. Journal of Business Finance and Accounting 37: 270–89. [Google Scholar] [CrossRef]
- Du, Jinmin, and Renying Liao. 2006. Empirical analysis and evaluation on the performance of Chinese open-end funds. Academic Research 2006: 59–64. [Google Scholar]
- Edelen, Roger M. 1999. Investor flows and the assessed performance of open-end mutual funds. Journal of Financial Economics 53: 439–66. [Google Scholar] [CrossRef]
- Fama, Eugene, and Kenneth French. 1993. Common risk factors in the returns on stocks and bonds. Journal of Financial Economics 33: 3–56. [Google Scholar] [CrossRef]
- Ferson, Wayne, and Rudi Schadt. 1996. Measuring fund strategy and performance in changing economic conditions. Journal of Finance 52: 425–62. [Google Scholar] [CrossRef]
- Ferson, Wayne, and Vincent Warther. 1996. Evaluating fund performance in a dynamic market. Financial Analysts Journal 52: 20–28. [Google Scholar] [CrossRef]
- Gao, Jun, Niall O’Sullivan, and Meadhbh Sherman. 2016. An Evaluation of Chinese Securities Investment Fund Performance. Working paper. Cork, Ireland: University College Cork. [Google Scholar]
- Glosten, Lawrence, Ravi Jagannathan, and David Runkle. 1993. On the relation between the expected value and the volatility of the nominal excess return on stocks. Journal of Finance 48: 1779–801. [Google Scholar] [CrossRef]
- Goetzmann, William, Jonathan Ingersoll Jr., and Zoran Ivkovich. 2000. Monthly measurement of daily timers. Journal of Financial and Quantitative Analysis 35: 257–90. [Google Scholar] [CrossRef]
- Graham, John R., and Campbell R. Harvey. 1996. Grading the performance of market timing newsletters. Journal of Financial Economics 602001: 187–243. [Google Scholar] [CrossRef]
- Grinblatt, Mark, and Sheridan Titman. 1989. Portfolio performance evaluation: Old issues and new insights. Review of Financial Studies 2: 393–421. [Google Scholar] [CrossRef]
- Gruber, Martin. 1996. Another puzzle: The growth in actively managed mutual funds. Journal of Finance 51: 783–810. [Google Scholar] [CrossRef]
- Henriksson, Roy D. 1984. Market timing and mutual fund performance: An empirical investigation. Journal of Business 57: 73–96. [Google Scholar] [CrossRef]
- Henriksson, Roy D., and Robert C. Merton. 1981. On market timing and investment performance II: Statistical procedures for evaluating forecasting skills. Journal of Business 54: 513–33. [Google Scholar] [CrossRef]
- Jagannathan, Ravi, and Robert Korajczyk. 1986. Assessing the market timing performance of managed portfolios. Journal of Business 59: 217–35. [Google Scholar] [CrossRef]
- Jensen, Michael. 1968. The performance of mutual funds in the period 1945–1964. Journal of Finance 23: 389–416. [Google Scholar] [CrossRef]
- Jiang, Wei. 2003. A nonparametric test of market timing. Journal of Empirical Finance 10: 399–425. [Google Scholar] [CrossRef]
- Jiang, Kunying, and Zhenquan Zhao. 2005. The Studies on Performance Evaluation of Chinese Securities Funds. Jilin: Jilin University. [Google Scholar]
- Kon, Stanley. 1983. The market timing performance of mutual fund managers. Journal of Business 56: 323–47. [Google Scholar] [CrossRef]
- Kothari, S. P., and Jerold B. Warner. 2001. Evaluating mutual fund performance. Journal of Finance 56: 1985–2010. [Google Scholar] [CrossRef]
- Lai, Shuyi, and Tinggui Cao. 2010. Study on Performance Comprehensive Evaluation of Stock-Based Open-End Funds. Chengdu: Southwestern University of Finance and Economics. [Google Scholar]
- Lockwood, Larry J., and Rao K. Kadiyala. 1985. Utilization of Market Forecasts in Portfolio Management: An Empirical Analysis. Working paper. Arlington, TX, USA: College of Business Administration, University of Texas at Arlington. [Google Scholar]
- Niu, Hong, and Junyi Zhan. 2004. Non-parametric tests of market timing ability on Chinese securities investment funds. Management World 10: 29–35. [Google Scholar]
- Peng, Liang. 2001. Building a venture capital index. SSRN working paper 258599. State College, PA, USA: Smeal College of Business, The Pennsylvania State University. [Google Scholar]
- Serfling, Robert J. 2009. Approximation Theorems of Mathematical Statistics. Hoboken: John Wiley & Sons, vol. 162. [Google Scholar]
- Treynor, Jack, and Kay Mazuy. 1966. Can mutual funds outguess the market? Harvard Business Review 44: 131–36. [Google Scholar]
- Warther, Vincent A. 1995. Aggregate mutual fund flows and security returns. Journal of Financial Economics 39: 209–35. [Google Scholar] [CrossRef]
- Zhang, Xin, and Shuming Du. 2002. Did Chinese securities investment funds beat the market? Journal of Financial Research 259: 1–22. [Google Scholar]
- Zhou, Zejiong, and Benshan Shi. 2004. An empirical study of selectivity and market timing ability of open-end fund managers in China. Study of Finance and Trade 6: 92–97. [Google Scholar]
| 1 | The Asset Management Association of China published a new definition of Chinese equity securities investment funds in 2015. By the new definition, Chinese equity securities investment funds have at least 80% of the fund capital invested in Chinese domestic equity. However, this study examines the performance of Chinese equity securities investment funds during the period from 2002–2014. Hence, old definitions and classifications apply. |
| 2 | The RESSET Database is one of the most authoritative databases reporting Chinese financial data. It was established in 2006 and operated by Beijing Gildata RESSET Data Tech Co., Ltd. It provides professional Chinese financial data to more than 500 large financial institutions (e.g., China International Capital Corporation Limited, CITIC Securities, etc.) and works with many universities including Tsinghua University, Beijing University and the Massachusetts Institute of Technology. The RESSET database has also been used in academic literature, e.g., Calomiris et al. (2010). |
| 3 | The estimation results presented in Section 5 (Empirical Results) are based on the market, size and value risk factors constructed by the RESSET Database. However, to test the robustness of the results we construct the market, size and value risk factors ourselves using data from Morgan Stanley Capital International. We obtain similar findings from the estimations based on these alternative risk factors. |
Figure 1.
Distribution of the Unconditional Market-Timing Test Statistic. (a) Test Statistic of Unconditional Nonparametric Market Timing; (b) Test Statistic of Unconditional TM Market Timing; (c) Test Statistic of Unconditional HM Market Timing.
Figure 1.
Distribution of the Unconditional Market-Timing Test Statistic. (a) Test Statistic of Unconditional Nonparametric Market Timing; (b) Test Statistic of Unconditional TM Market Timing; (c) Test Statistic of Unconditional HM Market Timing.
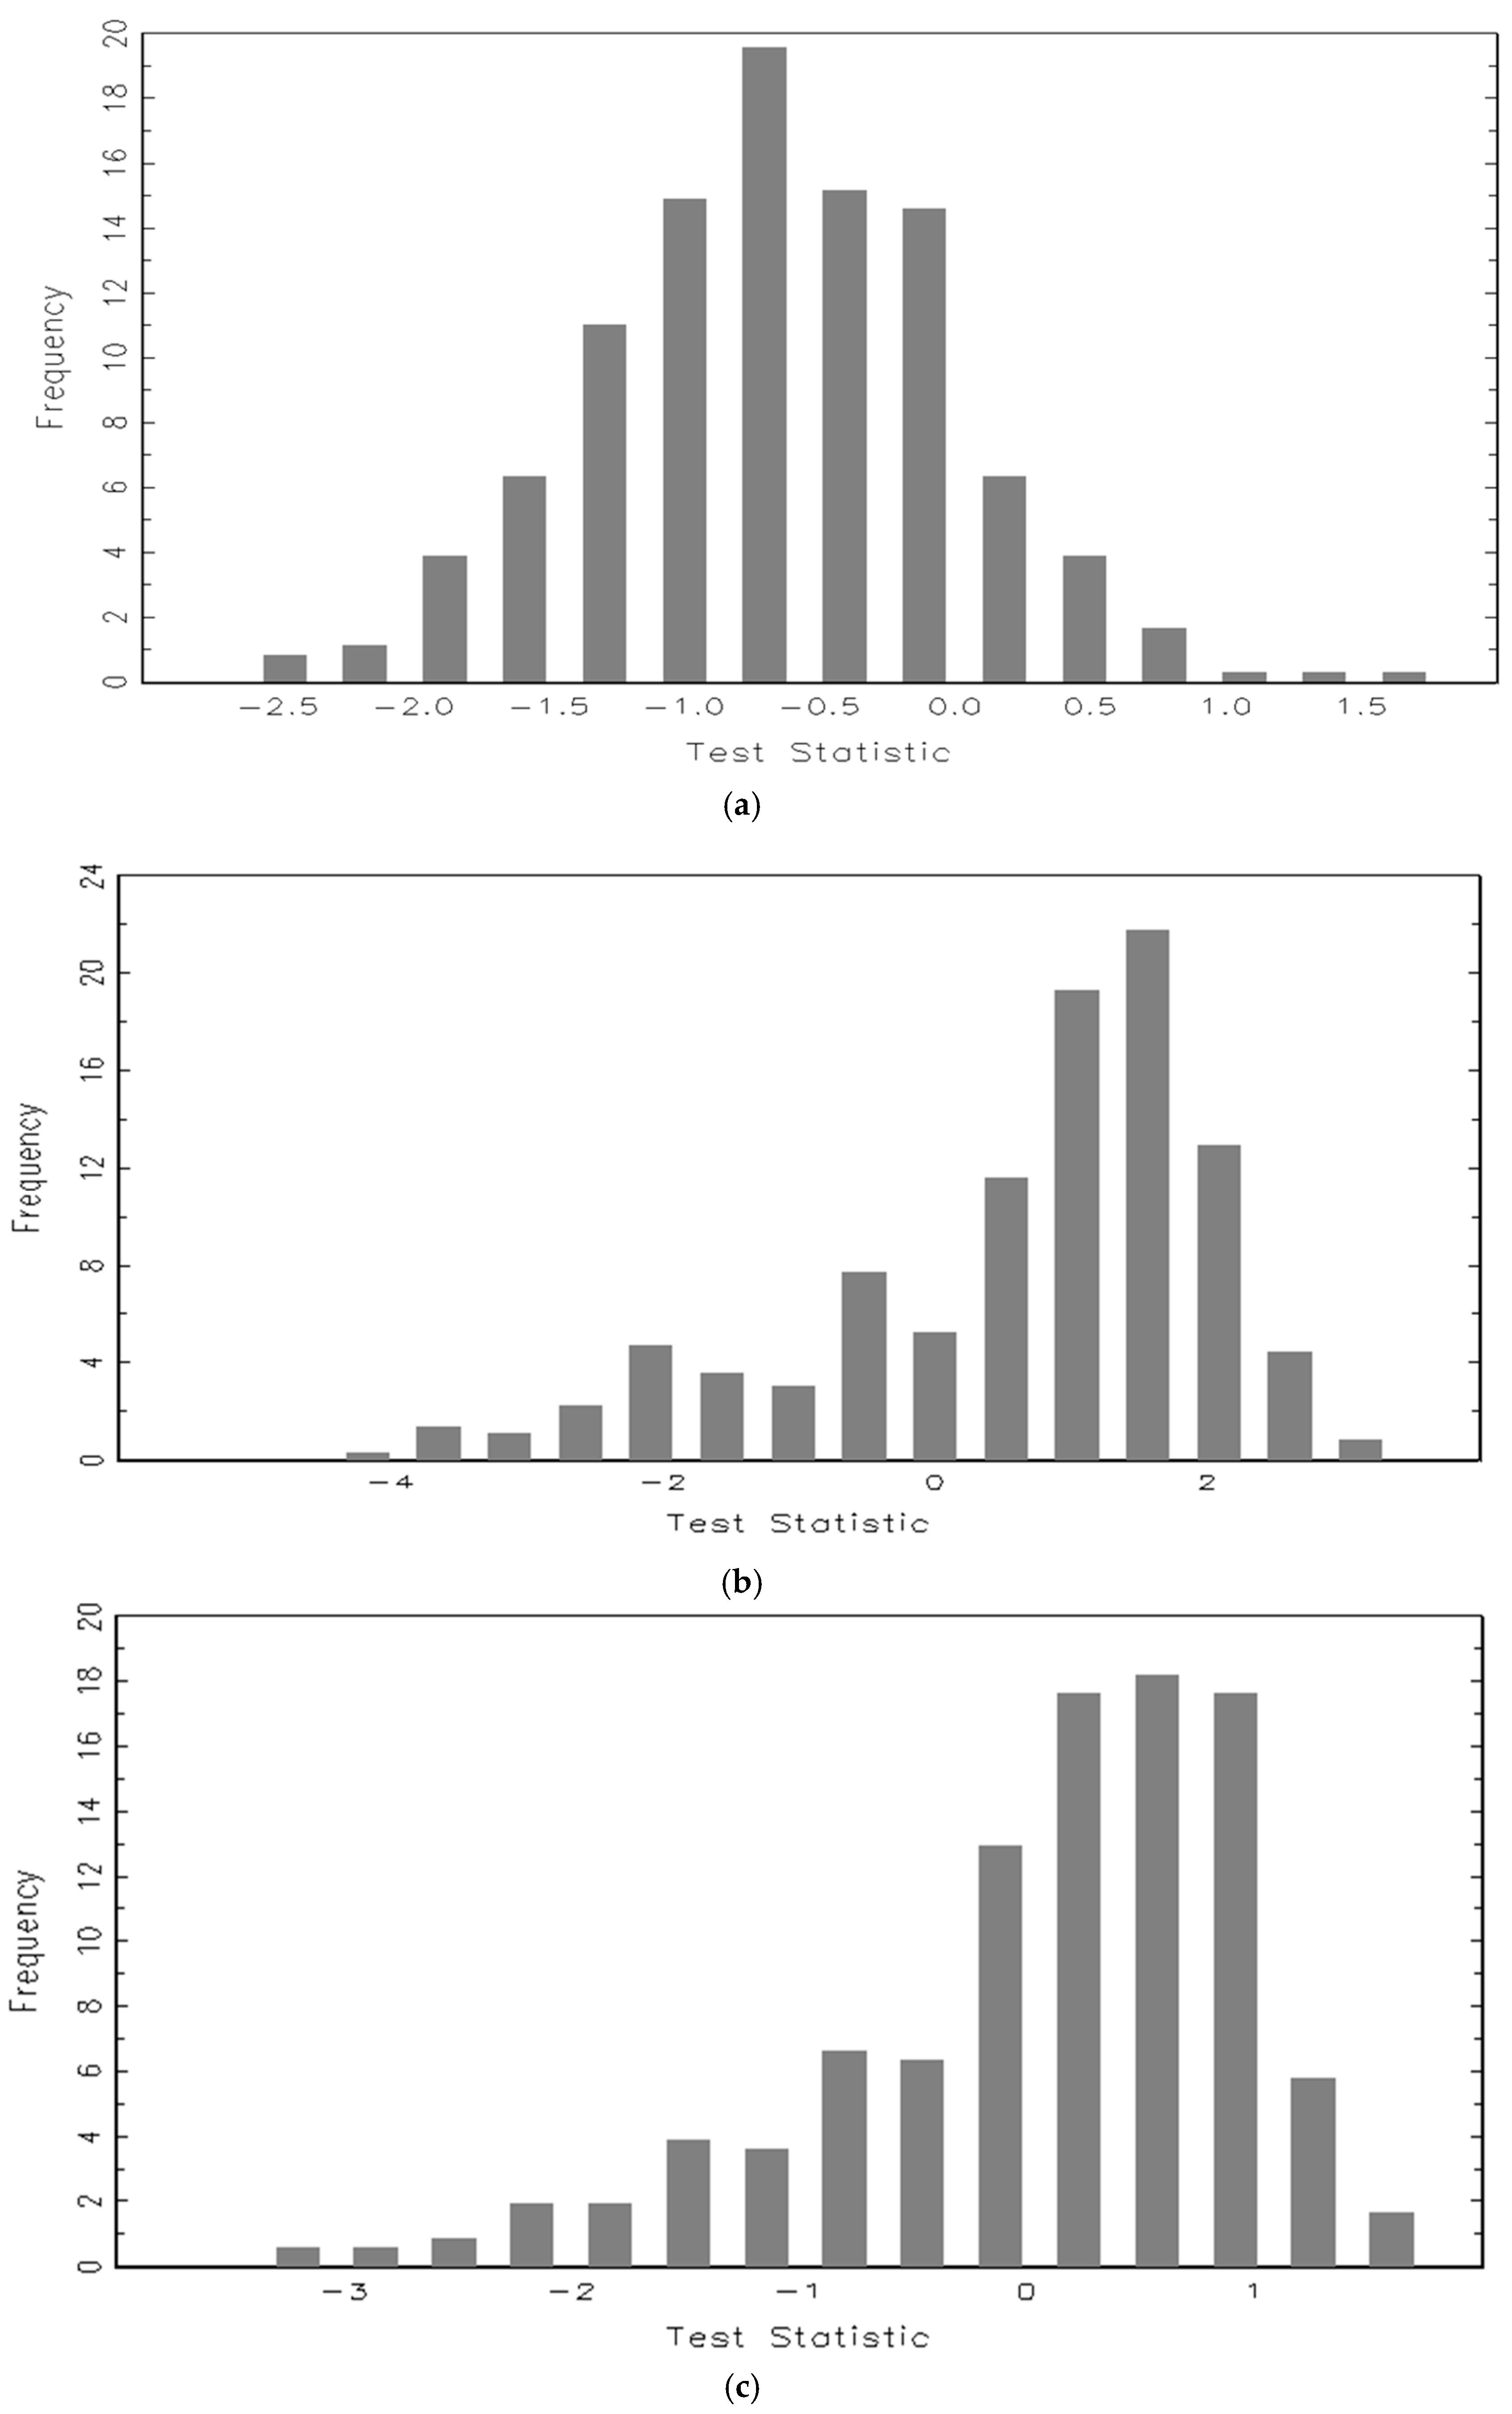
Figure 2.
Distributions of Conditional Market-Timing Test Statistics.

Table 1.
Breakdown of Historical Data of the Chinese Securities Investment Fund Industry.
| Year | No. of Funds | No. of Closed-End Funds | No. of Open-End Funds | No. of Fund Companies | Total NAV of Fund Industry (billion, ¥) | Total NAV of Fund Industry (billion, US $) |
|---|---|---|---|---|---|---|
| 1998 | 5 | 5 | 0 | 5 | ¥103.64 | $15.24 |
| 1999 | 19 | 19 | 0 | 10 | ¥484.16 | $71.20 |
| 2000 | 33 | 33 | 0 | 10 | ¥845.91 | $124.40 |
| 2001 | 51 | 48 | 3 | 14 | ¥818.10 | $120.31 |
| 2002 | 67 | 54 | 13 | 17 | ¥1112.92 | $163.66 |
| 2003 | 104 | 54 | 50 | 25 | ¥1572.74 | $231.28 |
| 2004 | 161 | 54 | 107 | 37 | ¥3246.40 | $477.40 |
| 2005 | 222 | 54 | 168 | 47 | ¥4607.48 | $677.56 |
| 2006 | 321 | 53 | 268 | 52 | ¥8552.71 | $1257.73 |
| 2007 | 366 | 35 | 331 | 57 | ¥32,853.28 | $4831.29 |
| 2008 | 474 | 33 | 441 | 59 | ¥19,427.37 | $2856.97 |
| 2009 | 621 | 33 | 588 | 60 | ¥26,829.61 | $3945.53 |
| 2010 | 785 | 31 | 754 | 60 | ¥25,275.43 | $3716.98 |
| 2011 | 835 | 31 | 804 | 71 | ¥21,918.40 | $3223.29 |
| 2012 | 1124 | 31 | 1093 | 77 | ¥28,661.00 | $4214.85 |
| 2013 | 1474 | 30 | 1444 | 85 | ¥30,020.71 | $4414.81 |
| 2014.05 | 1607 | 30 | 1577 | 96 | ¥39,241.00 | $5770.74 |
Table 2.
Breakdown of Funds by Length of Fund Histories.
| Minimum Observations | 26 | 52 | 104 | 156 | 208 |
| No. of Funds | 386 | 363 | 321 | 257 | 201 |
| Mean Alpha | −0.022 | −0.680 | −0.011 | −0.013 | −0.005 |
| Mean Stand. Dev. | 0.160 | 0.150 | 0.130 | 0.120 | 0.120 |
Table 3.
Securities Investment Fund Market-Timing Performance—Unconditional Tests.
| Unconditional Market-Timing Results | ||||||||||||||||||
|---|---|---|---|---|---|---|---|---|---|---|---|---|---|---|---|---|---|---|
| min | 5. min | min 5% | min 10% | min 40% | max 30% | max 20% | max 15% | max 10% | 20 max | 15 max | 12 max | 10 max | 7 max | 5. max | 3. max | 2. max | max | |
| Test Stat, z. | −2.625 | −2.160 | −1.776 | −1.535 | −0.835 | −0.334 | −0.114 | −0.023 | 0.126 | 0.352 | 0.440 | 0.595 | 0.620 | 0.742 | 0.896 | 0.935 | 1.313 | 1.807 |
| −0.136 | −0.087 | −0.058 | −0.050 | −0.024 | −0.009 | −0.003 | −0.001 | 0.004 | 0.011 | 0.014 | 0.017 | 0.019 | 0.023 | 0.027 | 0.029 | 0.040 | 0.051 | |
| t-TM | −3.220 | −2.198 | 0.701 | −0.002 | 0.826 | 2.507 | 1.464 | 1.576 | 1.674 | 2.731 | 1.907 | 3.383 | 1.458 | 1.471 | 1.426 | 1.932 | 2.422 | 1.257 |
| t-HM | −2.684 | −1.468 | −0.278 | −0.341 | 0.396 | 0.973 | 0.482 | 0.770 | 0.814 | 1.565 | 1.016 | 1.616 | 0.896 | 0.898 | 1.052 | 1.077 | 1.536 | 1.375 |
| Style | 2 | 2 | 2 | 2 | 3 | 2 | 3 | 2 | 2 | 2 | 2 | 2 | 2 | 2 | 2 | 2 | 2 | 2 |
| Survival | 1 | 1 | 1 | 1 | 1 | 1 | 1 | 1 | 1 | 1 | 1 | 1 | 1 | 1 | 1 | 1 | 1 | 1 |
| No. Obs. | 75 | 100 | 142 | 150 | 180 | 180 | 170 | 180 | 180 | 180 | 180 | 180 | 180 | 180 | 180 | 180 | 180 | 180 |
Table 4.
Securities Investment Fund Market-Timing Performance—Conditional Tests.
| Conditional Market Timing Results | ||||||||||||||||||
|---|---|---|---|---|---|---|---|---|---|---|---|---|---|---|---|---|---|---|
| min | 5. min | min 5% | min 10% | min 40% | max 30% | max 20% | max 15% | max 10% | 20 max | 15 max | 12 max | 10 max | 7 max | 5. max | 3. max | 2. max | max | |
| Test Stat, z | −2.625 | −2.160 | −1.776 | −1.535 | −0.835 | −0.334 | −0.114 | −0.023 | 0.126 | 0.352 | 0.440 | 0.595 | 0.620 | 0.742 | 0.896 | 0.935 | 1.313 | 1.807 |
| Z1 | −2.627 | −2.150 | −1.667 | −1.646 | −1.205 | −0.669 | −0.363 | −0.284 | −0.194 | 0.065 | 0.042 | 0.325 | 0.398 | 0.372 | 0.690 | 0.705 | 1.049 | 1.584 |
| Z2 | −2.708 | −2.188 | −1.562 | −2.225 | −1.506 | −1.240 | −0.460 | −0.775 | −0.512 | −0.358 | −0.417 | −0.223 | −0.127 | −0.082 | 0.076 | 0.159 | 0.334 | 1.129 |
| Z3 | −2.472 | −1.629 | −1.406 | −1.547 | −1.369 | −0.785 | −0.403 | −0.485 | −0.270 | −0.010 | 0.010 | 0.192 | 0.364 | 0.329 | 0.633 | 0.597 | 0.929 | 1.436 |
| Z1,Z2,Z3 | −2.227 | −2.509 | −1.133 | −2.240 | −1.199 | −0.785 | −0.178 | −0.158 | −0.049 | 0.179 | 0.098 | 0.222 | 0.386 | 0.448 | 0.508 | 0.642 | 0.607 | 1.539 |
| Z4 | −2.639 | −2.159 | −1.833 | −1.692 | −0.998 | −0.558 | −0.178 | −0.231 | 0.034 | 0.252 | 0.291 | 0.404 | 0.509 | 0.595 | 0.799 | 0.786 | 1.212 | 1.711 |
| Z5 | −2.027 | −1.737 | −1.236 | −1.892 | −0.501 | −1.195 | −0.474 | −0.727 | −0.434 | −0.241 | −0.220 | −0.028 | 0.030 | 0.068 | 0.308 | 0.337 | 0.472 | 1.258 |
© 2017 by the authors. Licensee MDPI, Basel, Switzerland. This article is an open access article distributed under the terms and conditions of the Creative Commons Attribution (CC BY) license (http://creativecommons.org/licenses/by/4.0/).
Share and Cite
MDPI and ACS Style
Sherman, M.; O’Sullivan, N.; Gao, J. The Market-Timing Ability of Chinese Equity Securities Investment Funds. Int. J. Financial Stud. 2017, 5, 22. https://doi.org/10.3390/ijfs5040022
AMA Style
Sherman M, O’Sullivan N, Gao J. The Market-Timing Ability of Chinese Equity Securities Investment Funds. International Journal of Financial Studies. 2017; 5(4):22. https://doi.org/10.3390/ijfs5040022
Chicago/Turabian StyleSherman, Meadhbh, Niall O’Sullivan, and Jun Gao. 2017. "The Market-Timing Ability of Chinese Equity Securities Investment Funds" International Journal of Financial Studies 5, no. 4: 22. https://doi.org/10.3390/ijfs5040022
Note that from the first issue of 2016, this journal uses article numbers instead of page numbers. See further details here.