The Influence of Industry Characteristics and Dynamic Capabilities on Firms’ Profitability

1
Faculty of Economics, University of Split, Cvite Fiskovića 5, 21000 Split, Croatia
2
University Department of Professional Studies, University of Split, Kopilica 5, 21000 Split, Croatia
*
Author to whom correspondence should be addressed.
Int. J. Financial Stud. 2018, 6(1), 4; https://doi.org/10.3390/ijfs6010004
Submission received: 28 September 2017
/
Revised: 17 November 2017
/
Accepted: 13 December 2017
/
Published: 27 December 2017
Abstract
:The aim of this research was to explore one of the most intriguing dimensions of every firm’s business—its performance. Aside from analysing the influence of industry’s characteristics on the firm’s performance, the authors addressed the characteristics of dynamic capabilities and their role in contribution to the firm’s ultimate success. The analysis was conducted on a sample of 118 small Croatian manufacturing companies. The application of the Structural Equation Modelling (SEM) approach revealed a statistically significant influence of both the industry’s characteristics (represented by Porter’s five forces framework) and dynamic capabilities (based on Teece’s theory) on the firm’s performance, where the influence of dynamic capabilities is proven to be larger than that of the industry.
Keywords:
performance; small business; industry’s characteristics; structural equation modelling; dynamic capabilities; manufacturing; CroatiaJEL Classification:
D22; L21; L221. Introduction
From a strategic management perspective, theoretical approaches seeking to explain a firm’s ability to outperform its competitors, among other things, include Porter’s industrial paradigm (Porter 1979, 1981) and the resource-based theory. The first approach, based on the structure-conduct-performance (SCP) paradigm, is focused on the industrial structure and ability of the firm to exploit its market power in order to obtain superior performance. Even decades after Porter’s pioneering papers, this approach is still largely applied (e.g., Rivard et al. 2006; Espallardo and Ballester 2009; Wu and Yang 2014; Leonidou et al. 2017). As opposed to the industrial organisation view, which focuses on external factors, the resource-based theory attempts to explain the heterogeneity of performance among firms based on firm-specific factors (Barney 1991). Moreover, the dynamic capabilities approach, as an extension of the resource-based view of the firm’s success, states that the sustainability of the firm’s competitive advantage and performance depends on the firm’s ability to renew resources as its external environment changes (Teece et al. 1997; Teece 2007). According to Teece (2007), capabilities that are important for the firm’s competitiveness and improved performance encompass the capability to sense and seize opportunities, and the capability to reconfigure the firm’s resources.
According to Hoskisson et al. (1999) “the field of strategic management will likely experience increasing integration of multiple theoretical paradigms” thus creating “a balance between internal and external explanations of the complex relationships in the new competitive landscape”. Since, according to the dynamic capabilities approach, possessing valuable, rare, inimitable, and non-substitutable resources without the capacity to regenerate them does not result in superior performance (Ambrosini and Bowman 2009), this research is focused on dynamic capabilities as a crucial internal factor of a firm’s success. Moreover, despite the increasing number of both theoretical and empirical studies in the field of dynamic capabilities, the importance of dynamic capabilities for a firm’s competitive advantage and performance is not completely clear (Pezeshkan et al. 2015), suggesting that additional empirical verification of the theory is still needed. This is particularly the case with companies that operate in special economic environments such as the emerging market economies. Moreover, Ambrosini and Bowman (2009) state that more work in the field of dynamic capabilities is needed to analyse, among other aspects, whether there are some patterns across the size of the firms. Consequently, the aim of the present study is to empirically analyse the importance of both industrial (external) characteristics and dynamic capabilities (internal factors) for the performance of small firms, following Teece's (2007) framework of segregation of dynamic capabilities. The analysis is based on a sample of 118 small companies operating in the manufacturing industry in Croatia, for which the data have been obtained from the questionnaire and have been analysed by applying Structural Equation Modelling (SEM).
Encompassing both industry characteristics and dynamic capabilities, this study provides an empirical contribution to the concept of the integrated research of the firm’s performance. In addition, the research adds to the literature in the field of determinants of the performance of small businesses, as well as companies operating in less developed countries.
The rest of the paper is structured as follows. The theoretical framework encompassing industrial factors of the firm’s performance, as well as dynamic capabilities is given in Section 2. Section 3 provides data, research constructs and their measurement, model specification, identification, evaluation and estimation, as well as a discussion of the results. The conclusion is given in Section 4.
2. Industry Characteristics and Dynamic Capabilities as Determinants of a Firm’s Performance
2.1. Industry and Porter’s Five Forces
Porter’s five forces model sets an analytical framework for understanding the influence of an industry’s structure on the profit potential of the firms within the industry. This framework is one of the most significant contributions to the strategic field using industrial organisation economic logic (Bridoux 2004) since, as stated by Hawawini et al. (2003), the structural characteristics of industries are the primary determinants of performance.
It builds on the structure-conduct-performance (SCP) paradigm from industrial organisation economics. The SCP paradigm argues that performance is determined by the conduct of the firms, which in turn is determined by the structural characteristics of the market (Clark 1998).
According to Porter (1979) the state of competition in an industry depends on five basic forces: the threat of new entrants, the bargaining power of customers, the bargaining power of suppliers, the threat of substitute products or services, and the rivalry among current contestants. The combined strength of these forces defines the ultimate profit potential of an industry. Specifically, when the industrial rivalry is not strong, companies have the ability to raise prices and hence earn higher profits. Likewise, the larger the bargaining power of customers/suppliers and the larger the threat of new entrants, the lower the firm’s profitability. Finally, if the substitution of a company’s products or services is fairly easy and of low cost, then the company’s power can be weakened, and the firm’s profitability can be reduced. Awareness of these forces can help the company take a position in its industry that is less vulnerable to attack. As noted by Grigore (2014), the industry’s structure, manifested in the competitive forces, sets industry profitability in the medium and long term.
The ultimate function of Porter’s competitive strategy is to explain the sustainability of profits against bargaining and against direct and indirect competition (Porter 1991).
Huang et al. (2015) tried to integrate both industrial organisation theory (IO) and the resource-based view of the firm (RBV) in order to clarify the conceptual distinction between two types of competitive advantage—the temporary and the sustainable competitive advantage. The results supported the IO theorists’ proposition that a firm’s temporary competitive advantage can be gained via strengthening its market position in an industry. However, further testing suggested that a firm’s market position in an industry had no influence on the firm’s sustainable competitive advantage outcomes, supporting an argument that the competitive advantage resulting from entry barriers or market concentration is temporary. Similarly, Rivard et al. (2006) tested an integrated model (including both a resource-based view and competitive strategy) of the contribution of IT to the firm’s performance since, as stated by Porter and Millar (1985), IT is seen as a means by which firms can gain competitive advantage by altering the competitive forces that collectively determine the industry’s profitability. The relationship between industry forces and performance suggests that greater environmental hostility is somewhat associated with lower performance in terms of market performance, but not in terms of profitability. Spanos and Lioukas (2001) have investigated the relative impact of industry- and firm-specific factors on sustainable competitive advantage, referring also to both Porter’s framework of competitive strategy and the resource-based view of the firm.
Espallardo and Ballester (2009) studied whether the effectiveness of innovation in improving a firm’s performance varies in different competitive situations, and analysed whether the competitive forces act as a motivator or as an inhibitor, finding that small firms must invest in innovation, preferably when competitive forces are more intense. Furthermore, Pecotich et al. (1999) developed an industruct, an instrument designed to measure perceptions of industry structure based on Porter’s five competitive forces formulation finding that rivalry and entry were the highest forces.
However, Porter’s work has been widely criticised and, as stated by Dobbs (2014), has laid the groundwork for an unnecessary and unfortunate battle for paradigm dominance between Porter’s five forces and the resource-based view of the firm. Despite this, Porter’s five forces model has been widely exploited and applied. For example, Lüttgens and Diener (2016) have adopted Porter’s five forces in order to analyse different threats to a business model, as well as to evaluate different business model patterns and rate them according to their impact on each of Porter’s forces. Sutherland (2014) has extended Porter’s five forces model to include nonmarket actions in the telecommunications sector, finding it a useful tool for analysing advocacy, lobbying and litigation by players in this heavily regulated market. Furthermore, Wu and Yang (2014) have applied Porter’s five forces model to gain insight into the competitive landscape of the shale gas market in China.
Taking into account all of the factors stated above, the five forces framework and the resource-based view of the firm can be considered complementary perspectives rather than adversarial, as is commonly the case (Dobbs 2014 citing (Makhija 2012; Ronda-Pupo and Guerras-Martin 2012)). Specifically, linking five forces assessments to opportunities and threats can help strategic thinkers develop powerful responses to industry pressures in order to improve competitiveness and increase profit.
With the aforementioned in mind, we formulate the following hypothesis:
H1.
The industry within which a firm operates significantly influences the firm’s performance.
2.2. Dynamic Capabilities
Alongside the external orientation, especially since the 1980s, the resource-based view has been advanced as an explanation of the determinants of a company’s success. Although the importance of the internal factors for the firm’s competitive advantage and performance was highlighted in Penrose’s theory of firm growth in the 1950s, the resource-based view has developed with the works of Wernerfelt (1984), Rumelt (1984) and, particularly, those of Barney (1986, 1991). Reviews of the empirical research in the field have been given by Barney and Arikan (2001), Crook et al. (2008), and Newbert (2008).
Resources include “all assets, capabilities, organizational processes, firm attributes, information, knowledge, etc. controlled by a firm that enabled the firm to conceive of and implement strategies that improve its efficiency and effectiveness” (Barney 1991). They encompass financial, physical, human, organisational assets (Barney 1991), as well as intellectual resources (Newbert 2008).
The resource-based theory is founded on two important assumptions: heterogeneity and immobility of resources between the firms (Barney 1991). The first assumption implies differences in resources and strategies to compete among companies that could result in competitive advantage. Immobility means that resources do not transfer from company to company, or that companies are not able to replicate resources of other companies or to implement the same strategies. In order to produce competitive advantage, the resources have to be valuable, rare, inimitable, and non-substitutable (Barney 1991). These features of resources are implemented in the widely known VRIN framework.
As an extension of the resource-based view, pioneered by the works of Teece and Pisano (1994), Teece et al. (1997), Eisenhardt and Martin (2000), and Zollo and Winter (2002), Winter (2003), and continuing with the studies of Helfat et al. (2007), Teece (2007), Wang and Ahmed (2007), Augier and Teece (2009), Teece (2014), Wang et al. (2015), Teece (2017), and many others, the concept of dynamic capabilities has advanced in order to provide additional explanation for the firm’s performance from an internal perspective. This theoretical approach tries to explain how valuable, rare, inimitable, and non-substitutable resources can be created, as well as how the resources can be restored in changing environment in which the company operates in order to generate and sustain competitive advantage (Ambrosini and Bowman 2009) and improve the firm’s performance.
According to the dynamic capabilities approach, possessing valuable, rare, inimitable, and non-substitutable resources without dynamic capabilities does not enable the firm to sustain a competitive advantage and performance. In a changing environment, resources cannot remain static and still be valuable; on the contrary, dynamic capabilities are needed to regenerate the resources (Ambrosini and Bowman 2009). With the shift from external to internal orientation in the field of strategic management, particular attention has been paid to the cognitive and behavioural processes that are important for capabilities that influence the firm’s performance (Hodgkinson and Healey 2011, p. 501).
The dynamic capabilities approach has been developed on the basis of many contributions, both theoretically and empirically. However, the concept is characterised by its fragmentation. This is true for both definitions and conceptualisations of dynamic capabilities, which has an impact on empirical research (Arend and Bromiley 2009; Vogel and Güttel 2013; Burisch and Wohlgemuth 2016).
According to Teece et al. (1997), dynamic capability is “the firm’s ability to integrate, build, and reconfigure internal and external competences to address rapidly changing environments.” Many other supporters of the dynamic capabilities perspective provide their own definitions of capabilities. Eisenhardt and Martin (2000) state that dynamic capabilities are “the firm’s processes that use resources—specifically the processes to integrate, reconfigure, gain and release resources—to match and even create market change. Dynamic capabilities are thus the organizational and strategic routines by which firms achieve new resource configurations as markets emerge, collide, split, evolve, and die”.
According to Zahra et al. (2006), dynamic capabilities are “abilities to reconfigure a firm’s resources and routines in the manner envisioned and deemed appropriate by its principal decision-maker”. Helfat et al. (2007) define dynamic capability as “the capacity of an organization to purposefully create, extend or modify its resource base”. According to Wang and Ahmed (2007) dynamic capability is “a firm’s behavioural orientation constantly to integrate, reconfigure, renew and recreate its resources and capabilities and, most importantly, upgrade and reconstruct its core capabilities in response to the changing environment to attain and sustain competitive advantage.”
Despite numerous approaches to defining dynamic capabilities, it is possible to isolate a common feature; namely, that dynamic capabilities are a firm’s processes that adopt resources in accordance with changes of environment. There are two levels of capabilities: ordinary and dynamic (Winter 2003). In comparison to operational and other ordinary capabilities that are important for the firm’s current activities, dynamic capabilities enable a change of resources and ordinary capabilities (Cepeda and Vera 2007). Hence, dynamic capabilities use the existing resources and create new resources and capabilities, aligning the organisation to the change in the environment. According to Wang and Ahmed (2007), there are three main components of dynamic capabilities: adaptive capability, absorptive capability, and innovative capability. The first one refers to the capability of the firm to identify and take the advantage of the market opportunities. The capability to identify new information, and to assimilate and exploit it is denoted as absorptive capability. Zahra and George (2002) define absorptive capacity as “a dynamic capability that influences the firm’s ability to create and deploy the knowledge necessary to build other organizational capabilities”. Innovative capability describes the capability of developing new products and/or markets.
According to Teece’s approach (2007), which is followed in this study, dynamic capabilities are divided into three components. The first one is the capacity to sense and shape opportunities and threats, implying “scanning, creation, learning, and interpretive activities” (Teece 2007). These opportunities are primarily related to markets and technologies. The processes include analysing customers (the changes of their needs and innovations), suppliers and competitors, processes aimed at directing internal research and development, and processes aimed at tapping developments in technology. Moreover, in comparison to the industrial perspective, the dynamic capabilities approach includes a more comprehensive view of the environment in which the firm operates. It encompasses the business “ecosystem”—the community of individuals and organisations, including buyers, complementors, suppliers, labour market, educational and research institutions, financial institutions, regulatory authorities, and the legal system (Teece 2007). Thus, in addition to exploring the market and technology, it is important to scan other elements of the “ecosystem”, as well. Without these activities, the firms would not be able to recognize the opportunities that could be visible to other firms (Teece 2007).
The second one is the capability to seize opportunities, which involves addressing sensed opportunities through new products, services or processes, which requires a mobilisation of resources (e.g., financial, human), investment in development, and commercialisation (Teece 2007). According to O’Reilly and Tushman (2008), this is the ability to make the right decisions and execute them, while from the organisational perspective, “this requires leaders who can craft a vision and strategy, ensure the proper organizational alignments (whether it is for exploitation or exploration), assemble complementary assets, and decide on resource allocation and timing.”
The third component refers to the capability of keeping competitiveness through enhancing, combining, protecting, and reconfiguring the company’s assets, both intangible and tangible, as well as operating capabilities. It may encompass a change in business model, mergers, acquisitions and divestments (Teece 2007). According to Helfat and Peteraf (2003), there are two forms of capability redeployment: sharing of a capability between the old and the new market, and inter-temporal transfer of capabilities from one market to another. There are numerous ways dynamic capabilities can influence the firm’s performance. Successful recognition and assessment of opportunities related to markets and technologies, as well as the design of new products and business models, can result in a competitive advantage and profitability (Teece 2007). Adapting the resource base to the changes in the business “ecosystem,” as well as shaping it (creating market change), may enhance profitability. Moreover, dynamic capabilities could improve the efficiency of the firm’s reaction to environmental dynamism, which positively affects performance. Dynamic capabilities may enhance inter-firm performance. They provide new decision options that could generate higher profitability (Wilden et al. 2013). Dynamic capabilities allow “the firm to take advantage of revenue enhancing opportunities and adjust its operations to reduce costs” (Drnevich and Kriauciunas 2011).
According to Eisenhardt and Martin (2000), dynamic capabilities do not necessarily result in increased performance, since performance is not directly related to dynamic capabilities but to the configuration of resources affected by dynamic capabilities. Some other researchers also argue that the effect of dynamic capabilities on performance is indirect, with a mediating role of the firm’s operational capabilities (Helfat and Peteraf 2003; Zahra et al. 2006; Pavlou and El Sawy 2011). Moreover, there are costs associated with dynamic capabilities that could have negative effects on the firm’s performance (Zollo and Winter 2002; Winter 2003). Zott (2003) shows that differences in performance among firms are related to the costs of dynamic capabilities.
Considering the empirical validation of the concept of dynamic capabilities, Ambrosini and Bowman (2009), and Arend and Bromiley (2009) highlight limited empirical support. Vogel and Güttel (2013) state that “the dynamic capability view still lacks consensual concepts that allow comparisons of empirical studies”. Some studies find empirical support of the dynamic capabilities approach (e.g., Zott 2003; Fang and Zou 2009; Drnevich and Kriauciunas 2011), while some papers confirm that the effect of dynamic capabilities on a firm’s competitive advantage/performance is contingent on specific factors, such as the firm’s organisational structure and the intensity of competition the firm faces (Wilden et al. 2013), or the degree of dynamism of the firm’s external environment, showing a weaker effect in the context of high and low environmental dynamism in comparison to in the context of a moderate one (Schilke 2014). In the assessment of empirical research on the relationship between dynamic capabilities and performance, Pezeshkan et al. (2015) found that the dynamic capabilities approach is confirmed empirically in 60 percent of studies. The differences in empirical support result from the type and nature of dynamic capabilities, the type of performance measures used in the analyses, whether dynamic capabilities are analysed independently or in interaction with other variables (contextual or organisational), as well as from the research design features (Pezeshkan et al. 2015).
With respect to the above-stated theoretical considerations and the results of empirical research, we formulate the second hypothesis of the present research:
H2.
Dynamic capabilities positively influence the firm’s performance.
Although supporters of both external and internal orientation approaches for explaining a firm’s performance have found empirical validation of their views, some researchers hold that an integrated view could better explain the sources of a firm’s performance (Hansen and Wernerfelt 1989; Henderson and Mitchell 1997; Hoskisson et al. 1999; Spanos and Lioukas 2001). Following this approach, in the subsequent section of the study, we empirically analyse the importance of both external or industry factors, and of dynamic capabilities, as internal factors for the firm’s success.
3. Research Methodology and Results
3.1. Data Collection, Research Constructs and Their Measurement
The data for the independent and dependent variables were collected through a web-based questionnaire that was addressed to companies’ directors and/or managers. Although some e-mail addresses were provided by Amadeus databases, most of them were obtained directly by the Central office of the Croatian Chamber of Commerce.
In line with the previously postulated hypotheses, the questionnaire provided in Appendix encompassed various elements of industry structure as well as the firm’s performance that the managers were asked to assess. Besides that, managers evaluated the firm’s abilities to integrate, build, and reconfigure internal and external competences to address rapidly changing environments (Teece et al. 1997), which is known in the literature as the firm’s dynamic capabilities.
All respondents, of which there were 118 in this study, were asked to answer questions using a five-point Likert scale. For items representing industry construct, a Likert scale ranging from “1–strongly disagree” to “5—strongly agree” was used. Porter’s five forces describing industry (industry rivalry—ind1, bargaining power of customers—ind2, bargaining power of suppliers—ind3, threat of new entrants—ind4, and threat of substitute products or services—ind5) were assessed by managers through five relevant questions, one for each of the forces. All five questions were formulated in a way so as to indicate the same direction (e.g., competition in our industry is quite strong; bargaining power of our buyers/suppliers is high, etc.). Therefore, as postulated by the theory, the higher the value on the Likert scale assessed by managers, the lower the level of the firm’s perceived profitability. All the items representing industry construct are based on relevant papers by Huang et al. (2015); Pecotich et al. (1999); Espallardo and Ballester (2009); and Leonidou et al. (2017).
The five-point Likert scale was also used to evaluate the items in the remaining two constructs (dynamic capabilities and performance), whereby the dynamic capabilities construct was based on the framework of components of the capabilities (disaggregated for analytical purposes) proposed by one of the most prominent researchers in the field of dynamic capabilities—Teece (2007). For the items in dynamic capabilities and performance constructs, the description of the scale was somewhat different, i.e., the scale ranged from “1—much worse than competitors” to “5—much better than competitors”. Again, top managers were asked to evaluate three main aspects of dynamic capabilities (sensing opportunities and threats—dc1, seizing opportunities—dc2, and reconfiguring the organisational resource base—dc3) and four financial and non-financial performance indicators (return on assets—perf1, profit margin—perf2, sales growth—perf3, and market share—perf 4).
3.2. Application of SEM Approach on Firm Performance Research Model
Structural Equation Modelling (SEM) is a statistical approach that simultaneously estimates the multiple regression equations in a single framework, i.e., it tests relationships between observed and latent variables, and as such, it is widely applied in different areas of economics, business and management. More recent research papers with the application of SEM in these areas are those of Cunningham et al. (2017), Putri et al. (2017), Khongmalai and Distanont (2017), Smaliukiene et al. (2017), and many others. Regardless of the area of the application of SEM, practitioners and theorists agree on five steps involved in testing SEM: model specification, identification, estimation, evaluation and (if needed) modification (Teo et al. 2013).
3.2.1. Model Specification
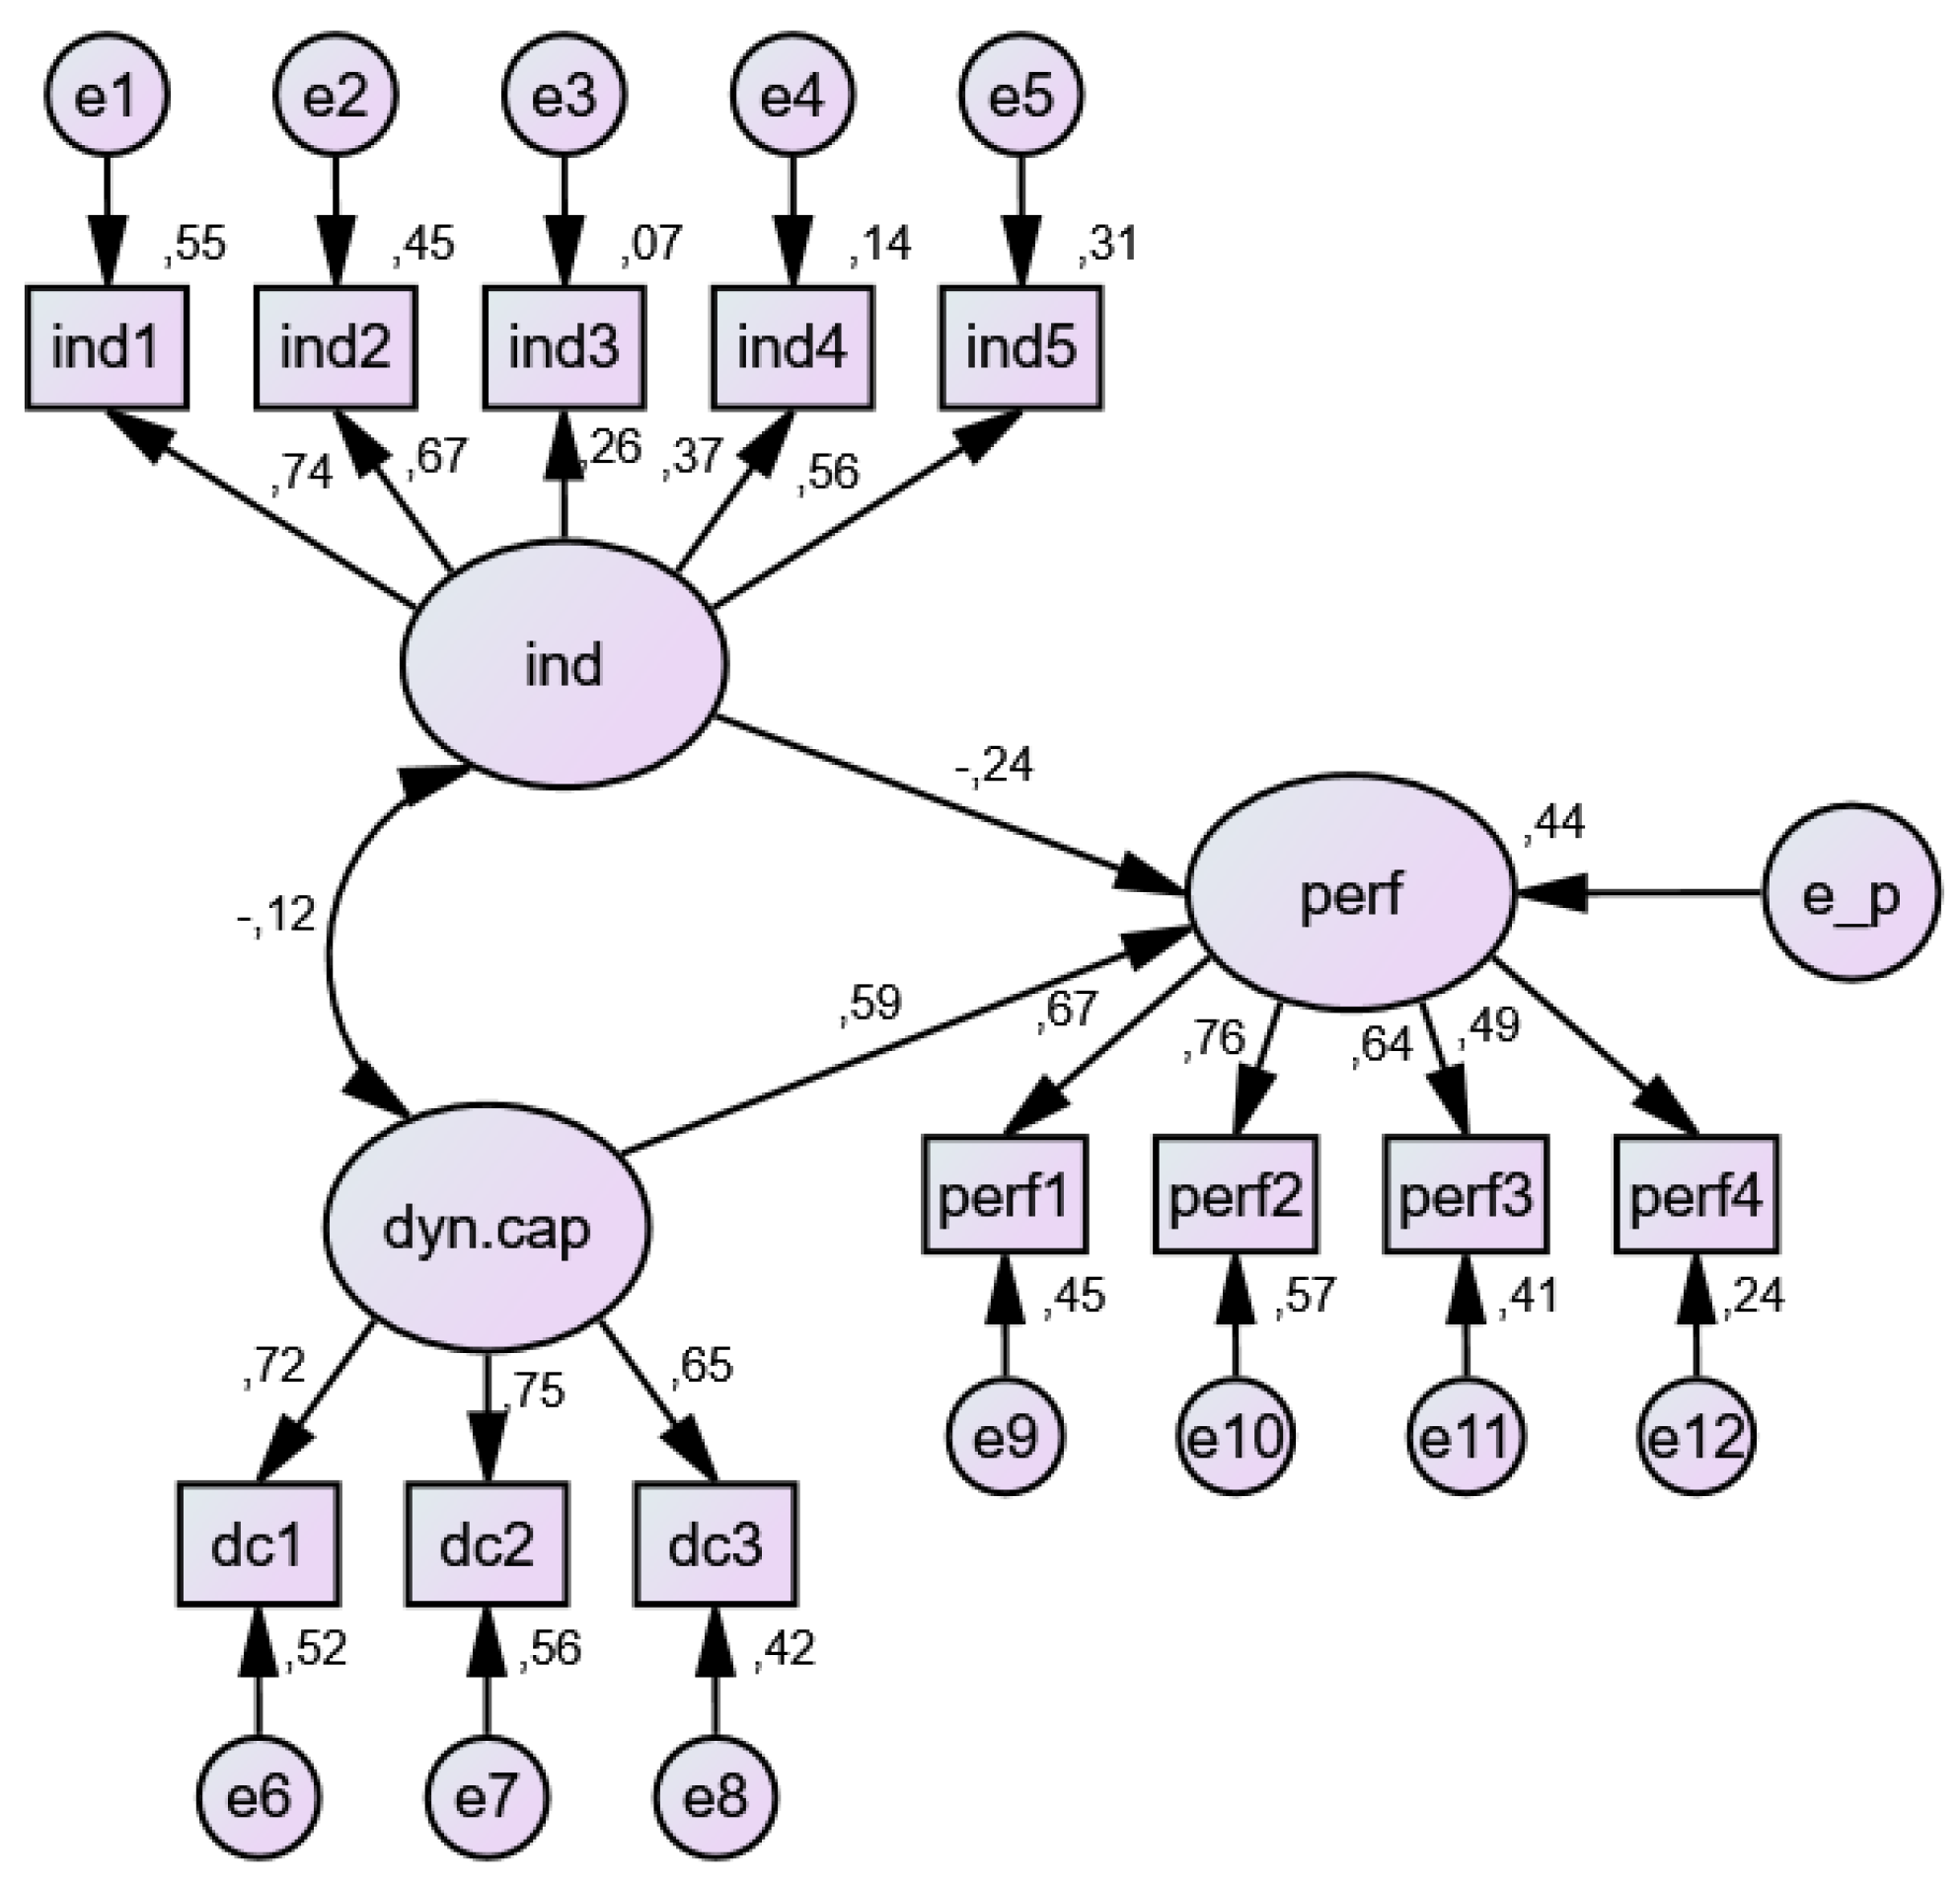
Relationships between the observed and latent variables are specified by researchers, and are represented by parameters or paths. Three types of parameters are to be specified: directional effects, variances and covariances. The directional effects in the structural model presented in Figure 1 are nine factor loadings and two path coefficients. Variances are estimated for indicator error related to the 12 manifest variables, error related to the unobserved endogenous variable (performance) and two unobserved exogenous variables (industry and dynamic capabilities). There is one covariance (non-directional relation between independent latent variables) in the analysed model.
3.2.2. Model Identification
Structural models can be overidentified, underidentified, or just-identified, depending on whether the number of the parameters to be estimated is lower, higher or equal to the number of data points (i.e., variances and covariances of the observed variables). Since only the overidentified model is of scientific use, it is important in SEM to specify the model in a way that meets the criterion of overidentification.
As presented by Figure 1, there are 27 parameters in the model. On the other hand, the application of the formula p(p + 1)/2, where p stands for the number of manifest variables, revealed the total of 12 × 13/2 = 78 data points. Thus, the analysed model is overidentified with 51° of freedom.
Another important issue in SEM is the sample size. The size of the sample influences the ability of the model to be estimated correctly, as well as the specification error to be identified. One of the most commonly used methods in SEM is the Maximum Likelihood Estimation (MLE). In order to use MLE appropriately, Ding et al. (1995) recommend a minimum sample size ranging between 100 and 150 respondents. In addition, Hoelter’s critical N is often used as a standard sample size that would make the obtained fit significant. At the 5% level of significance, the value of Hoelter’s index for our model amounts to 121, which is satisfyingly close to the value of 118, the number of respondents in our sample. The appropriateness of the sample size is also in accordance with Ding's et al. (1995) recommendation.
Before conducting SEM, the presence of outliers has to be tested. A common approach to detection of an outlier is to calculate the squared Mahalanobise distance, which measures the distance in standard deviation units between a set of scores for one case/respondents and the sample means for all the variables, i.e., centroids (Byrne 2016). The values of Mahalanobise distance for the first 10 cases are presented in Table 11.
All cases with a p1 value less than 0.05 can be considered outliers, and it is up to the researcher to decide what to do with them. Generally speaking, it is not acceptable to delete a case only because it is an outlier, as sometimes these cases are the most interesting ones. Therefore, it was decided to keep them in the analysis and, consequently, the sample consisted of 6.7% outliers.
An additional important assumption that must be checked in the SEM is that the data show a multivariate normal distribution. However, the prerequisite of this assessment is the need to evaluate univariate normality, which can be examined with skewness and kurtosis. Both of these two indicators should be below 3, since the skewness tends to influence tests of means, while kurtosis tends to have a severe impact on tests of variances and covariances. The results obtained for the data normality are presented in Table 2, from which it is clear that there is no deviation from normality.
With respect to the multivariate normality, a normalised estimate of multivariate kurtosis (i.e., C.R. value) higher than 5 indicates that the data are non-normally distributed. In the conducted analysis, z-statistics (C.R.) of 2.282 is highly suggestive that the assumption of multivariate normality for the data in the analysed set is also fulfilled.
The presence of multicollinearity causes a problem in SEM because the results of some tests may be biased. The usual practice is to compute bivariate correlation or to run the multiple regression and inspect values of tolerance and variance inflation factor (VIF). The results of the multiple regression are shown in Table 3.
VIF values for all the variables in the regression model are far below the critical level of 5; thus, there is no evidence of multicollinearity in the analysed data. Additionally, the values of Spearman correlation coefficients also confirmed the absence of multicollinearity, as its highest value (of 0.57) was quite below the undesirable level of 0.7. Some authors stress that this cut-off value could even go up to 0.85 before causing any significant problems in SEM (e.g., Kline 2011).
Before the assessment of the structural model, the reliability and validity of the measurement model must be examined. Item (construct) reliability can be assessed by factor loadings (Cronbach’s Alpha) values. As noted by Azwa Ambad and Wahab (2016), the individual item reliabilities use loadings of the items to their respective constructs, and in their standardised form, loadings should be greater than 0.5. The results of Table 6 show that all the items (except items ind3 and ind4) had satisfying loadings that were quite close to or higher than the desirable level. Furthermore, the variable/construct reliability can be assessed by Cronbach’s Alpha, which analyses the consistency of the overall participants in answering the statement-items of a particular variable/construct. The value of this indicator should generally be larger than 0.6.2 For the constructs used in our analysis (performance, industry, and dynamic capabilities), the values of Cronbach’s Alpha were 0.72, 0.64, and 0.75 respectively, as presented by Table 4, therefore confirming the reliability of the measurement model. In line with the common procedure, the next step is to investigate the validity of the measurement model, which is usually assessed with convergent and discriminant validity. Convergent validity refers to the propensity for all items to validate each other. As noted by Ylinen and Gullkvist (2014), convergent validity can be evaluated by examining composite reliability (CR) and average variance extracted (AVE), where C.R. indicates consistency of the constructs, while AVE measures the amount of variance attributed to the construct relative to the amount due to measurement error (Azwa Ambad and Wahab 2016). A composite reliability (C.R.) is calculated for every construct, and then compared with the cut-off value of 0.6 (Bagozzi and Yi 1988). The C.R. values for performance, industry, and dynamic capabilities constructs were 0.74, 0.66, and 0.75, respectively, confirming convergent validity. The average variance extracted should be higher than the minimum threshold of 0.5. However, according to Fornell and Larcker (1981), even if AVE is less than 0.5, but composite reliability is higher than 0.6, the convergent validity of the construct is still adequate. In our analysis, the obtained AVE values for performance, industry, and dynamic capabilities constructs were 0.42, 0.30, and 0.50 respectively. When taken together with the values of composite reliability (which were higher than 0.6 for each construct), we can state that convergent validity was established.
Discriminant validity for each construct was obtained by comparing the squared correlations between latent variables and the average variance extracted (AVE) scores for each of the pairwise constructs. For adequate discriminant validity, AVE should be larger than squared correlation. Since this condition was fulfilled for all three of the observed relationships (as presented in Table 5), it was concluded that the discriminant validity for the constructs had also been obtained. The assessment of the structural model is presented in following sections.
3.2.3. Model Estimation
For the purposes of parameter estimation, IBM® SPSS® Amos 23 was used, and the Maximum Likelihood Estimation (MLE) procedure was applied. MLE is suitable for data that present a multivariate normal distribution, which was proven to be the case for the data in our sample. As noted by Byrne (2016), in reviewing the parameter estimates, it is interesting to observe the following three features: feasibility of parameter estimates, appropriateness of standard errors, and statistical significance of parameter estimates. Regarding the feasibility of parameter estimates, we can conclude that all parameter estimates show a correct sign and size, and are consistent with the underlying theory (Table 6). Standard errors are also of appropriate value. Finally, AMOS reports both the unstandardised and standardised values of the estimates, which are similar to the unstandardised B weights and standardised betas in the regression analysis. It also reports critical ratio (C.R.), which operates as a z-statistic in testing that the estimated parameter is statistically different from zero. Table 6 shows both the unstandardised and standardised values of estimates, as well as the C.R. values for all parameters included in the analysed model. For all of them, the C.R. exceeded the value of ±1.96, suggesting that all the parameters in the model were statistically significant. A detailed elaboration of each of the parameters/constructs analysed in the model is given in the segment Discussions of Results.
3.2.4. Model Evaluation (Model Fit)
The main task of model fit is to provide the information about the degree to which the model fits the data. One of the measures to look at is the overall chi-square (x2), which indicates whether the observed and implied variance–covariance matrices differ (Teo et al. 2013) or not. A statistically nonsignificant value of this measure is an indicator of a good model. However, as stressed by Byrne (2016), this index has proven to be unrealistic (i.e., to be significant) in most SEM empirical research, therefore it must be considered in conjunction with other indices of model fit.3 Kline (2011) recommends reporting x2, RMSEA, GFI, and CFI indices. Still, in addition to presenting the indices suggested by Kline (2011), we report some additional indices as well (Table 7). Although the model yields a x2 value of 70.414 with a probability of 0.037, when this value is divided by the degrees of freedom, the result obtained is lower than the desirable level of 3, suggesting that the fit of the data to our model is adequate.
The Standardised Root Mean Residual (SRMR) indicates the average value across all standardised residuals, and its value can range from zero to one. Even though the SRMR indicator does not represent a standard part of the AMOS output, with the usage of the three-step process (Byrne 2016), its value can be obtained, and in our case, it amounted to 0.063, suggesting that the model explains the correlation to within an average error of 0.063%. The obtained value was lower than the cut-off point of 0.08, implying the well-fitting characteristics of the model. GFI is an absolute index of model fit and is analogous to R2 in the regression analysis (Teo et al. 2013). For a good fit, a recommended value of 0.90 or higher should be obtained, which was achieved for our research model. One of the main advantages of the IFI index (known also as Bollen’s IFI) is that it is relatively non-sensitive regarding the sample size when assessing a model’s fit. Koropp et al. (2014) recommend a value of 0.90 or higher as an adequate model-fit indicator. TLI index is used to compare a research model to the null model (Teo et al. 2013). A model with a good fit will have a value of TLI index that approaches 1. Thus, the value of 0.937 confirmed the goodness of our model’s fit. CFI is one of the most widely used incremental fit indices, and compares the independence model with the specified research model (Kline 2011). Commonly, it is argued that a value of 0.90 or higher indicates an adequate model (Lei and Wu 2007; Koropp et al. 2014). RMSEA corrects the tendency of the chi-square to reject models with large numbers of variables or with a large sample sizes. Higher values of RMSEA indicate a poor fit. The value achieved in this research was below the proposed cut-off value of 0.06 (Hu and Bentler 1999), again confirming the appropriateness of the model. Summarising all the goodness-of-fit statistics presented earlier, it can be concluded that the model fits the sample data quite well.
3.3. Discussion of Results
The results of the estimated model are graphically presented in Figure 1. In order to facilitate the interpretation of the parameters, the parameter estimates are presented in their standardised form. The unstandardised value of parameters, together with their statistical significance and standard errors, can be found in Table 6. Factor loadings from the factors of the observed variables are, on average, the highest for the dynamic capabilities (from β = 0.75 to β = 0.65). Although factor loadings for some other factors are not so high, all three measurement models of dynamic capabilities, performance, and industry were each measured well in the current data, and their reliability, convergent validity, and discriminant validity were earlier confirmed.
A squared value of factor loading indicates the proportion of variance in the manifest variable that is explained by that factor. For instance, the squared factor loading on “ind1” for “ind” indicates that “ind” explains 54.76% of the variance in “ind1” for “ind”. The remaining of the variance is explained by measurement error (e1). Accordingly, construct industry seems to explain the highest proportion of variance in the observed variable industry rivalry, followed by the bargaining power of the buyers. Likewise, the construct performance explains the highest proportion of variance for the observed variables profit margin and ROA, while the construct dynamic capabilities explains the highest proportion of the variance for the observed variable seizing opportunities. The correlation between industry and dynamic capabilities is rather low (−0.12), thus indicating no relationship between them.
The paths from the industry to the performance indicate that industry has little impact on the firm’s performance (β = −0.24). However, a quick look at Table 6 reveals that, although slight, this impact is statistically significant. Moreover, the impact of all the variables included in the model is statistically significant. Furthermore, apart from being slight but significant, the impact of industry on the performance of firms is negative. Although not presented here, the results of the Spearman correlation coefficients confirm negative relationships among all the observed, directly measured variables of performance, and those variables representing the industry construct. The results obtained are entirely in accordance with Porter’s framework. Indeed, a closer examination of the data shows that, from the industry point of view, the strength of industrial competition (the first force of Porter’s model) plays the most important role in determining small Croatian firms’ performance. It seems that the majority of the sampled firms operate in industries with fairly intense competition, which, according to Hill and Jones (2010), arises from four main factors: (1) the industry’s competitive structure, which is defined by the number and size distribution of the firms within an industry; (2) demand (growth or decline) conditions in the industry—in growing demand industries, all the companies can sell more without reducing the market share of other competitors; (3) cost conditions—in industries with high fixed costs, firms must have high sales volume in order to be profitable; and (4) the height of industry exit barriers—high exit barriers prevent companies from exiting a particular industry easily. Similar findings have been obtained by Jiang and Kattuman (2010), who have found that intense competition would rapidly disperse any short-run quasi-rents enjoyed by any company, and force each to revert to its own ‘normal’ level of profitability. Furthermore, Acquaah (2003) has found that the effectiveness of corporate management capabilities has a larger influence on the sustainability of the firm’s abnormal profitability for firms in minimally competitive or monopolistic industries than the firms in highly competitive industries.
Bargaining power of buyers, as the second-most important influential factor on small Croatian firms’ performance, probably arises because of the nature and the size of the firms analysed. The analysed sample consisted only of small firms that do not have enough strength to impose “playing rules” on the market; rather, they are “playing by the rules” imposed by larger players. It is well known that the bargaining power of buyers arises when there are few large buyers and many small sellers, when the buyers of a company are large customers (i.e., they purchase large quantities), and when buyers can easily switch suppliers at low cost. These findings are similar to those of Gosman and Kohlbeck (2009), who found that, as sales to major customers increase, supplier gross margins and return on assets decrease. Moreover, as stated by Maloni and Benton (2000), exploitation of the supply chain by the powerful partner may lead to dissension and underperformance. Research by Schumacher (1991) has also found that highly concentrated buyers exhibit significant power to impair profitability, especially in oligopolistic consumer goods industries.
As for the rest of the Porter’s forces, it seems that small Croatian firms are facing moderate bargaining power of suppliers, moderate to low threat of new entrants, and moderate threat of substitute products or services. When all these variables are taken together as indicators for the industry latent variable, it emerges that industry construct has a statistically significant negative influence on the firm’s performance; hence, the first research hypothesis can be accepted.
Figure 1 reveals positive and statistically significant influence of dynamic capabilities on firm performance (0.59). It also indicates that dynamic capabilities have a stronger influence on the firms’ performance than industry. When taken together, these constructs explain 44% of the variance of the latent variable performance (R2 = 44). Regarding dynamic capabilities, one can observe that sensing opportunities and threats and seizing opportunities play a very important role in determining Croatian firms’ success. Thus, superior performance can be seen in the firms that are able to identify the technological and market opportunities and threats, and take advantage of the opportunities. These firms are able to assess how technology will evolve, and how and when competitors, suppliers, and customers will respond (Teece 2007), as well as developments of other elements of the environment the firm competes in (i.e., the business “ecosystem”). They possess resources and processes for collecting and analysing information. They seize the sensed opportunities through investments in development and commercialisation that result in new products, services or processes. In this way, the firms are able to satisfy their customers and to develop mechanisms to capture value. Consequently, small Croatian firms that seize revenue-enhancing opportunities and/or change their activities in order to reduce costs achieve superior performance. Thus, the second research hypothesis is confirmed. When we compare the results of the research related to positive effects of dynamic capabilities to the firm’s performance with the results of the recent studies based on the sample of small and medium-sized companies, the results are partially in accordance with the results of Nedzinskas et al. (2013) when non-financial relative organisational performance (innovations developed and new processes created) are considered, but not in case of financial relative organisational performance (credit risk). The results correspond to the results of Naldi et al. (2014) with the difference in the performance measure (innovative performance), in encompassing only the capabilities of sensing and seizing, as well as in the non-linear relationship between the capabilities and the performance.
In comparing the results of this study with those that encompass the relationship between dynamic capabilities and performance of the firms operating in emerging economies, besides the above mentioned study of Nedzinskas et al. (2013), it can be seen that they correspond to the results of the research of Malik and Kotabe (2009), in which organisational learning, reverse engineering and manufacturing flexibility are taken as dynamic capabilities, and Zhou et al. (2017) with the difference of the inclusion of a mediating role for innovation in the relationship between dynamic capabilities (sensing and reconfiguration, but not integration capability) and the firm’s financial performance.
4. Conclusions
This research examines the influence of industries’ characteristics and dynamic capabilities on the firm’s performance. In order to fulfil the main aim of this research, structural equation modelling (SEM) was applied on a sample of 118 small Croatian firms operating in the manufacturing sector. Data were inspected for the presence of outliers, multivariate normality and multicollinearity, while the reliability and validity of the constructs were assessed by Cronbach’s Alpha, convergent and discriminant validity. The results of the conducted analysis supported the relationships hypothesised by the research model. More precisely, industry affects firm performance negatively, thus verifying Porter’s framework. Moreover, industry rivalry, followed by the bargaining power of the buyers, was proven to play, at the industry level, the most important role in determining a firms’ performance. On the other hand, significant and positive influence of dynamic capabilities on firm performance confirmed the importance of sensing opportunities and threats, and seizing opportunities in contributing to the firm’s prosperity and success.
The entrepreneurs and managers of small Croatian companies should focus on the processes important for recognising, collecting and analysing information related to changes in the market (responds of customers, competitors and suppliers), developments of technology as well as other elements of the business “ecosystem”. They should develop the ability to interpret this information in order to learn about the behaviour of the market participants, technological opportunities and changes related to all other subjects that could affect the firm and its customers. In order to develop capabilities of sensing opportunities and threats, managerial understanding and vision are required. In addition, they should evaluate both existing and new capabilities, and invest in technology. It is expected that, by adapting these strategies, small companies operating in the Croatian manufacturing industry could achieve superior performance.
Acknowledgments
This work has been fully supported by the Croatian Science Foundation under the project UIP-2014-09-1745. Any opinions, findings, and conclusions or recommendations expressed in this material are those of the authors and do not necessarily reflect the views of Croatian Science Foundation.
Author Contributions
Maja Pervan contributed to this research by conducting empirical analysis of the influence of industry characteristics and dynamic capabilities on firms’ profitability. Marijana Curak provided review of dynamic capabilities literature while Tomislava Pavic Kramaric provided review of industry and Porter’s Five Forces literature. All authors were involved in discussion of the results and in drawing and formulating conclusions.
Conflicts of Interest
The authors declare no conflict of interest.
Appendix A
QUESTIONNAIRE
1. Name and identification number of the company (fill in or leave empty) Name:______________Identification number:______________
2. E-mail if you want to receive the results of the survey (fill in or leave empty):____________
3. National industrial classification number and foundation year: NACE 2007:______ Year:_______
If your company is engaged in a large number of activities, answer all the following questions only for your main or most important business.
INDUSTRY
4. Rate the extent to which you agree/disagree with the statements on the business activity (sector) you are active in using 1 to 5 response scales (1—strongly disagree; 5—strongly agree). Put zero (0) if you consider the statement of not being applicable.
| Industry | Rate |
| The intensity of rivalry in our industry is high. | |
| The bargaining power of buyers in our industry is intense; therefore they can exert pressure to provide lower prices of our products. | |
| Our suppliers can easily, due to their bargaining position, increase the price or reduce the quality of their products. | |
| New companies can easily enter our industry, thus the threat from new potential entrants is high. | |
| The substitutes available in our industry are high. |
DYNAMIC CAPABILITIES
5. Rate the capabilities of your company compared with the most important competitors using 1 to 5 response scale (1—much worse than competitors; 5—much better than competitors). Put zero (0) if you consider the statement of not being applicable.
| Capability | Rate |
| Sensing opportunities (identification and evaluation of new market and technological changes arising from the changes in the environment) | |
| Seizing opportunities (initiative in seizing opportunities and adequacy of organisational structure and procedures in seizing opportunities) | |
| Managing threats and reconfiguring the resources/competences of the company (continuous adapting, renewing and reintegration of resources as an answer to changes in the environment) |
PERFORMANCE MEASURES
6. Rate the following elements of your company’s business results compared with the most important competitors using 1 to 5 response scale (1—much worse than competitors; 5—much better than competitors).
| Factor | Rate | Factor | Rate |
| Return on assets (ROA) | Sales growth | ||
| Profit margin | Market share |
References
- Acquaah, Moses. 2003. Corporate Management, Industry Competition and the Sustainability of Firm Abnormal Profitability. Journal of Management and Governance 7: 57–85. [Google Scholar] [CrossRef]
- Ambrosini, Véronique, and Cliff Bowman. 2009. What are dynamic capabilities and are they a useful construct in strategic management? International Journal of Management Reviews 11: 29–49. [Google Scholar] [CrossRef] [Green Version]
- Arend, Richard J., and Phillip Bromiley. 2009. Assessing the dynamic capabilities view: Spare change, everyone? Strategic Organization 7: 75–90. [Google Scholar] [CrossRef]
- Augier, Mie, and David J. Teece. 2009. Dynamic Capabilities and the Role of Managers in Business Strategy and Economic Performance. Organization Science 20: 410–21. [Google Scholar] [CrossRef]
- Azwa Ambad, Sylvia Nabila, and Kalsom Abdul Wahab. 2016. The Relationship between Corporate Entrepreneurship and Firm Performance: Evidence from Malaysian Large Companies. International Journal of Business and Society 17: 259–80. [Google Scholar]
- Bagozzi, Richard P., and Youjae Yi. 1988. On the evaluation of structural equation models. Journal of the Academy of Marketing Science 16: 74–94. [Google Scholar] [CrossRef]
- Barney, Jay B. 1986. Strategic Factor Markets: Expectations, Luck and Business Strategy. Management Science 32: 1231–41. [Google Scholar] [CrossRef]
- Barney, Jay B. 1991. Firm resources and sustained competitive advantage. Journal of Management 17: 99–120. [Google Scholar] [CrossRef]
- Barney, Jay B., and Asli M. Arikan. 2001. The resource-based view: Origins and implications. In The Blackwell Handbook of Strategic Management. Edited by Michael A. Hitt, R. Edward Freeman and Jeffrey S. Harrison. Oxford: Blackwell, pp. 124–88. ISBN 978-0-631-21860-9. [Google Scholar]
- Bridoux, Flore. 2004. A resource-based approach to performance and competition: An overview of the connections between resources and competition. IAG Working Papers 2: 1–21. [Google Scholar]
- Burisch, Robert, and Veit Wohlgemuth. 2016. Blind spots of dynamic capabilities: A systems theoretic perspective. Journal of Innovation & Knowledge 1: 109–16. [Google Scholar]
- Byrne, Barbara M. 2016. Structural Equation Modeling with Amos, 3rd ed.New York: Routledge, Taylor & Frances, pp. 40–131. ISBN 10-1138797030. [Google Scholar]
- Cepeda, Gabriel, and Dusya Vera. 2007. Dynamic capabilities and operational capabilities: A knowledge management perspective. Journal of Business Research 60: 426–37. [Google Scholar] [CrossRef]
- Chakrapani, Chuck. 2004. Statistics in Market Research. London: John Wiley and Sons Ltd., pp. 1–221. ISBN 10-0340763973. [Google Scholar]
- Clark, Timothy. 1998. The Market Provision of Management Services, Information Asymmetries and Service Quality—Some Market Solutions: An Empirical Example. British Journal of Management 4: 235–51. [Google Scholar] [CrossRef]
- Crook, Russell T., David. J. Ketchen, James G. Combs, and Samuel Y. Todd. 2008. Strategic resources and performance: A meta-analysis. Strategic Management Journal 29: 1141–54. [Google Scholar] [CrossRef]
- Cunningham, James, Claire Seaman, and David McGuire. 2017. Perceptions of Knowledge Sharing Among Small Family Firm Leaders: A Structural Equation Model. Family Business Review 30: 160–81. [Google Scholar] [CrossRef]
- Ding, Lin, Wayne F. Velicer, and Lisa L. Harlow. 1995. Effects of estimation methods, number indicators per factor, and improper solutions on structural equation modeling fit indices. Structural Equation Modeling 2: 119–44. [Google Scholar] [CrossRef]
- Dobbs, Michael E. 2014. Guidelines for applying Porter’s five forces framework: A set of industry analysis templates. Competitiveness Review 24: 32–45. [Google Scholar] [CrossRef]
- Drnevich, Paul, and Aldas Kriauciunas. 2011. Clarifying the conditions and limits of the contributions of ordinary and dynamic capabilities to relative firm performance. Strategic Management Journal 32: 254–79. [Google Scholar] [CrossRef]
- Eisenhardt, Kathleen M., and Jeffrey A. Martin. 2000. Dynamic Capabilities: What Are They? Strategic Management Review 21: 1105–21. [Google Scholar] [CrossRef]
- Espallardo, Miguel H., and Elena D. Ballester. 2009. Product innovation in small manufacturers, market orientation and the industry’s five competitive forces: Empirical evidence from Spain. European Journal of Innovation Management 12: 470–91. [Google Scholar] [CrossRef]
- Fang, Eric, and Saoming Zou. 2009. Antecedents and consequences of marketing dynamic capabilities in international joint ventures. Journal of International Business Studies 40: 742–61. [Google Scholar] [CrossRef]
- Fornell, Claes, and David F. Larcker. 1981. Evaluating structural equation models with unobservable variables and measurement error. Journal of Marketing Research 18: 39–50. [Google Scholar] [CrossRef]
- Gefen, David, Detmar Straub, and Marie-Claude Boudreau. 2000. Structural Equation Modeling and Regression: Guidelines for Research Practice. Communications of the Association for Information Systems 4: 1–70. [Google Scholar]
- Gosman, Martin L., and Mark J. Kohlbeck. 2009. Effects of the Existence and Identity of Major Customers on Supplier Profitability: Is Wal-Mart Different? Journal of Management Accounting Research 21: 179–201. [Google Scholar] [CrossRef]
- Grigore, Ana-Maria. 2014. Book Publishing Business in Romania—An Analysis from the Perspective of Porter’s Five Force Model. Review of International Comparative Management 15: 31–47. [Google Scholar]
- Hansen, Gary, and Birger Wernerfelt. 1989. Determinants of firm performance: The relative importance of economic and organizational factors. Strategic Management Journal 10: 399–411. [Google Scholar] [CrossRef]
- Hawawini, Gabriel, Venkat Subramanian, and Paul Verdin. 2003. Is Performance Driven by Industry- or Firm-Specific Factors? A New Look at the Evidence. Strategic Management Journal 24: 1–16. [Google Scholar] [CrossRef]
- Helfat, Constance E., and Margaret A. Peteraf. 2003. The dynamic resource-based view: Capability lifecycles. Strategic Management Journal 24: 997–1010. [Google Scholar] [CrossRef]
- Helfat, Constance E., Sydney Finkelstein, Will Mitchell, Margaret Peteraf, Harbir Singh, David Teece, and Sidney G. Winter. 2007. Dynamic Capabilities: Understanding Strategic Change in Organizations. New York: John Wiley & Sons, ISBN 978-1-4051-3575-7. [Google Scholar]
- Henderson, Rebecca, and Will Mitchell. 1997. The interactions of organizational and competitive influences on strategy and performance. Strategic Management Journal 18: 5–14. [Google Scholar] [CrossRef]
- Hill, Charles W. L., and Gareth R. Jones. 2010. Strategic Management Theory: An Integrated Approach, 9th ed. Mason: South-Western Cengage Learning, pp. 46–47. ISBN 978-0-538-75107-0. [Google Scholar]
- Hinton, Perry R., Isabelly McMurray, and Charlotte Brownlow. 2014. SPSS Explained. New York: Routledge, p. 351. ISBN 978-1-315-79729-8. [Google Scholar]
- Hodgkinson, Gerard P., and Mark P. Healey. 2011. Psychological foundations of dynamic capabilities: Reflexion and reflection in strategic management. Strategic Management Journal 32: 1500–16. [Google Scholar] [CrossRef]
- Hoskisson, Robert E., Martin A. Hitt, William P. Wan, and Daphne Yiu. 1999. Theory and research in strategic management: Swings of a pendulum. Journal of Management 25: 417–56. [Google Scholar] [CrossRef]
- Hu, Li-tze, and Peter M. Bentler. 1999. Cutoff criteria for fit indexes in covariance structure analysis: Conventional criteria versus new alternatives. Structural Equation Modeling 6: 1–55. [Google Scholar] [CrossRef]
- Huang, Kuo-Feng, Romano Dyerson, Lei-Yu Wu, and G. Harindranath. 2015. From temporary competitive advantage to sustainable competitive advantage. British Journal of Management 26: 617–36. [Google Scholar] [CrossRef]
- Jiang, Neng, and Paul A. Kattuman. 2010. Intensity of competition in China: Profitability dynamics of Chinese listed companies. Asia Pacific Business Review 16: 461–81. [Google Scholar] [CrossRef]
- Khongmalai, Orapan, and Anyanitha Distanont. 2017. Corporate governance model in Thai state-owned enterprises: structural equation modelling approach. Corporate Governance-The International Journal of Business in Society 17: 613–28. [Google Scholar] [CrossRef]
- Kline, Rex B. 2011. Principles and Practice of Structural Equation Modeling, 3rd ed.New York: Guilford Press, pp. 1–427. ISBN 10: 1606238760. [Google Scholar]
- Koropp, Christian, Franz W. Kellermanns, Dietmar Grichnik, and Laura Stanley. 2014. Financial decision making in family firms: An adaptation of the theory of planned behavior. Family Business Review 27: 307–27. [Google Scholar] [CrossRef]
- Lei, Pui-Wa, and Quiong Wu. 2007. Introduction to Structural Equation Modeling: Issues and Practical Considerations. Educational Measurement Issues and Practice 26: 33–43. [Google Scholar] [CrossRef]
- Leonidou, Leonidas C., Paul Christodoulides, Lida P. Kyrgidou, and Dayananda Palihawadana. 2017. Internal drivers and performance consequences of sm all firm green business strategy: Moderating role of external forces. Journal of Business Ethics 144: 401–15. [Google Scholar] [CrossRef]
- Lüttgens, Dirk, and Kathleen Diener. 2016. Business Model Patterns Used as a Tool for Creating (new) Innovative Business Models. Journal of Business Models 4: 19–36. [Google Scholar]
- Makhija, Mona. 2012. Comparing the Resource-Based and Market-Based Views of the Firm: Empirical Evidence from Czech Privatization. Strategic Management Journal 24: 433–51. [Google Scholar] [CrossRef]
- Malik, Omar, and Masaaki Kotabe. 2009. Dynamic Capabilities, Government Policies, and Performance in Firms from Emerging Economies: Evidence from India and Pakistan. Journal of Management Studies 46: 421–50. [Google Scholar] [CrossRef]
- Maloni, Michael, and W. C. Benton. 2000. Power Influences in the Supply Chain. Journal of Business Logistics 21: 49–73. [Google Scholar]
- Naldi, Lucia, Patrik Wikström, and Bjørn M. Von Rimscha. 2014. Dynamic Capabilities and Performance. International Studies of Management & Organization 44: 63–82. [Google Scholar] [Green Version]
- Nedzinskas, Šarūnas, Asta Pundiziene, Solveiga Buožiūtė-Rafanavičienė, and Margarita Pilkienė. 2013. The impact of dynamic capabilities on SME performance in a volatile environment as moderated by organizational inertia. Baltic Journal of Management. Baltic Journal of Management 8: 376–96. [Google Scholar] [CrossRef]
- Newbert, Scott. 2008. Value, rareness, competitive advantage, and performance: A conceptual-level empirical investigation of the resource-based view of the firm. Strategic Management Journal 29: 745–68. [Google Scholar] [CrossRef]
- O’Reilly, Charles O., and Michael L. Tushman. 2008. Ambidexterity as a dynamic capability: Resolving the innovator’s dilemma. Research in Organizational Behavior 28: 185–206. [Google Scholar] [CrossRef]
- Pavlou, Paul A., and Omar A. El Sawy. 2011. Understanding the elusive black box of dynamic capabilities. Decision Sciences Journal 42: 239–73. [Google Scholar] [CrossRef]
- Pecotich, Anthony, John Hattie, and Li Peng Low. 1999. Development of Industruct: A Scale for the Measurement of Perceptions of Industry Structure. Marketing Letters 10: 409–22. [Google Scholar] [CrossRef]
- Pezeshkan, Amir, Stav Fainshmidt, Anil Nair, Fraizer Lance, and Edward Markowski. 2015. An empirical assessment of the dynamic capabilities–performance relationship. Journal of Business Research 69: 2950–56. [Google Scholar] [CrossRef]
- Porter, Michael E. 1979. How Competitive Forces Shape Strategy. Harvard Business Review 57: 137–45. [Google Scholar]
- Porter, Michael E. 1981. The Contributions of Industrial Organization to Strategic Management. The Academy of Management Review 6: 609–20. [Google Scholar]
- Porter, Michael E. 1991. Towards Dynamic Theory of Strategy. Strategic Management Journal 12: 95–117. [Google Scholar] [CrossRef]
- Porter, Michael E., and Victor E. Millar. 1985. How information gives you competitive advantage. Harvard Business Review 63: 149–60. [Google Scholar]
- Putri, Nilda Tri, Shari Mohd Yusof, Alizar Hasan, and Haesti Sujita Darma. 2017. A structural equation model for evaluating the relationship between total quality management and employees’ productivity. International Journal of Quality & Reliability Management 34: 1138–51. [Google Scholar]
- Rehman, Wasim U., Nabila Asghar, and Khalil Ahmad. 2015. Impact of KM Practices on Firms’ Performance: A Mediating Role of Business Process Capability and Organizational Learning. Pakistan Economic and Social Review 53: 47–80. [Google Scholar]
- Rivard, Suzanne, Louis Raymond, and David Verreault. 2006. Resource-based view and competitive strategy: An integrated model of the contribution of information technology to firm performance. Journal of Strategic Information Systems 15: 29–50. [Google Scholar] [CrossRef]
- Ronda-Pupo, Guillermo A., and Luis A. Guerras-Martin. 2012. Dynamics of the Evolution of the Strategy Concept 1962–2008: A Co-Word Analysis. Strategic Management Journal 33: 162–88. [Google Scholar] [CrossRef]
- Rumelt, Richard P. 1984. Towards a Strategic Theory of the Firm. In Competitive Strategic Management. Edited by Robert B. Lamb. Englewood Cliffs: Prentice-Hall, pp. 556–70. ISBN 13-978-0131549722. [Google Scholar]
- Schilke, Oliver. 2014. On the contingent value of dynamic capabilities for competitive advantage: The nonlinear moderating effect of environmental dynamism. Strategic Management Journal 35: 179–203. [Google Scholar] [CrossRef]
- Schumacher, Ute. 1991. Buyer Structure and Seller Performance in U.S. Manufacturing Industries. The Review of Economics and Statistics 73: 277–84. [Google Scholar] [CrossRef]
- Smaliukiene, Rasa, Svajone Bekesiene, Eugenijus Chlivickas, and Marius Magyla. 2017. Explicating the Role of Trust in Knowledge Sharing: A Structural Equation Model Test. Journal of Business Economics and Management. Journal of Business Economics and Management 18: 758–78. [Google Scholar] [CrossRef]
- Spanos, Yiannis E., and Spiros Lioukas. 2001. An examination into the causal logic of rent generation: Contrasting Porter’s competitive strategy framework and the resource-based perspective. Strategic Management Journal 22: 907–34. [Google Scholar] [CrossRef]
- Sutherland, Ewan. 2014. Lobbying and litigation in telecommunications markets—Reapplying Porter’s five forces. Digital Policy, Regulation and Governance 16: 1–18. [Google Scholar] [CrossRef]
- Teece, David J. 2007. Explicating Dynamic Capabilities: The Nature and Microfoundations of (Sustainable) Enterprise Performance. Strategic Management Journal 28: 1319–50. [Google Scholar] [CrossRef]
- Teece, David J. 2014. The Foundations of Enterprise Performance: Dynamic and Ordinary Capabilities in an (Economic) Theory of Firms. The Academy of Management Perspectives 28: 328–52. [Google Scholar] [CrossRef]
- Teece, David J. 2017. Business models and dynamic capabilities. Long Range Planning, 1–10. [Google Scholar] [CrossRef]
- Teece, David J., and Gary Pisano. 1994. The dynamic capabilities of firms: An introduction. Industrial and Corporate Change 3: 541–44. [Google Scholar] [CrossRef]
- Teece, David J., Gary Pisano, and Amy Shuen. 1997. Dynamic Capabilities and Strategic Management. Strategic Management Journal 18: 509–33. [Google Scholar] [CrossRef]
- Teo, Timothy, Liang Ting Tsai, and Chih-Chien Yang. 2013. Applying Structural Equation Modeling (SEM) in Educational Research: An Introduction. In Application of Structural Equation Modeling in Educational Research and Practice. Edited by Myint Swe Khine. Rotterdam: Sense Publishers, pp. 3–21. ISBN 978-90-8790-787-7. [Google Scholar]
- Vogel, Rick, and Wolfgang H. Güttel. 2013. The dynamic capability view in strategic management: A bibliometric review. International Journal of Management Reviews 15: 426–46. [Google Scholar] [CrossRef]
- Wang, Catherine. L., and Perviaz K. Ahmed. 2007. Dynamic capabilities: A review and research agenda. International Journal of Management Reviews 9: 31–51. [Google Scholar] [CrossRef]
- Wang, Catherine L., Chaminda Senaratne, and Mohammed Rafiq. 2015. Success, Traps, Dynamic Capabilities and Firm Performance. British Journal of Management 26: 26–44. [Google Scholar] [CrossRef] [Green Version]
- Wernerfelt, Birger. 1984. A Resource-Based View of the Firm. Strategic Management Journal 5: 171–80. [Google Scholar] [CrossRef]
- Wilden, Ralf, Siegfried P. Gudergan, Bo Bernhard Nielsen, and Ian Lings. 2013. Dynamic capabilities and performance: Strategy, structure and environment. Long Range Planning 46: 72–96. [Google Scholar] [CrossRef] [Green Version]
- Winter, Sidney G. 2003. Understanding dynamic capabilities. Strategic Management Journal 24: 991–95. [Google Scholar] [CrossRef]
- Wu, Yunna, and Yisheng Yang. 2014. The competition situation analysis of shale gas industry in China: Applying Porter’s five forces and scenario model. Renewable & Sustainable Energy Reviews 40: 798–805. [Google Scholar]
- Ylinen, Miks, and Benita Gullkvist. 2014. The effects of organic and mechanistic control in exploratory and exploitative innovations. Management Accounting Research 25: 93–112. [Google Scholar] [CrossRef]
- Zahra, Shaker A., and Gerard George. 2002. Absorptive capacity: A review, reconceptualization and extension. Academy of Management Review 27: 185–203. [Google Scholar]
- Zahra, Shaker A., Harry Sapienza, and Per Davidsson. 2006. Entrepreneurship and dynamic capabilities: A review, model and research agenda. Journal of Management Studies 43: 917–55. [Google Scholar] [CrossRef] [Green Version]
- Zhou, Steven S., Abby J. Zhou, Feng Junzhang, and Shisong Jiang. 2017. Dynamic capabilities and organizational performance: The mediating role of innovation. Journal of Management and Organization 23: 1–17. [Google Scholar] [CrossRef]
- Zollo, Maurizio, and Sidney G. Winter. 2002. Deliberate learning and the evolution of dynamic capabilities. Organization Science 13: 339–51. [Google Scholar] [CrossRef]
- Zott, Christoph. 2003. Dynamic capabilities and the emergence of intraindustry differential firm performance: Insights from a simulation study. Strategic Management Journal 24: 97–125. [Google Scholar] [CrossRef]
| 1 | In AMOS output, all the cases are sorted in accordance with their respective p1 value, from the smallest to the largest one. Thus, the presentation of the first 10 cases is suitable for this purpose. |
| 2 | Some authors argue that Cronbach’s Alpha above 0.5 is also acceptable (Hinton et al. 2014; Chakrapani 2004). |
| 3 | A brief description of the most commonly reported model fit indicators can be found in Byrne (2016) and Teo et al. (2013). |
Figure 1.
Structural Performance Model—Standardised Estimate.


Table 1.
Values of the squared Mahalanobise distance (d2).
| Observation Number | Mahalanobis d-Squared | p1 | p2 |
|---|---|---|---|
| 14 | 26.471 | 0.009 | 0.664 |
| 33 | 24.349 | 0.018 | 0.636 |
| 25 | 23.927 | 0.021 | 0.446 |
| 27 | 23.248 | 0.026 | 0.360 |
| 67 | 23.143 | 0.027 | 0.205 |
| 16 | 22.927 | 0.028 | 0.120 |
| 3 | 21.908 | 0.039 | 0.172 |
| 95 | 21.848 | 0.039 | 0.094 |
| 5 | 20.944 | 0.051 | 0.152 |
| 7 | 20.378 | 0.060 | 0.175 |
Source: Authors’ calculation. Note: p1 (p2)—probabilities that the observation is far from the centroid.
Table 2.
Assessment of univariate and multivariate normality.
| Variable | Min | Max | Skew | C.R. | Kurtosis | C.R. |
|---|---|---|---|---|---|---|
| perf1 | 1.000 | 5.000 | 0.034 | 0.150 | −0.053 | −0.116 |
| perf2 | 1.000 | 5.000 | 0.144 | 0.638 | 0.494 | 1.096 |
| perf3 | 1.000 | 5.000 | −0.047 | −0.207 | −0.076 | −0.169 |
| perf4 | 1.000 | 5.000 | 0.078 | 0.348 | −0.600 | −1.331 |
| dc1 | 1.000 | 5.000 | −0.498 | −2.209 | −0.249 | −0.551 |
| dc2 | 1.000 | 5.000 | −0.474 | −2.100 | −0.319 | −0.708 |
| dc3 | 1.000 | 5.000 | −0.146 | −0.646 | −0.231 | −0.511 |
| ind5 | 1.000 | 5.000 | −0.134 | −0.594 | −0.792 | −1.755 |
| ind4 | 1.000 | 5.000 | 0.127 | 0.565 | −1.051 | −2.331 |
| ind3 | 1.000 | 5.000 | −0.054 | −0.239 | −1.123 | −2.490 |
| ind2 | 1.000 | 5.000 | −0.666 | −2.953 | −0.624 | −1.384 |
| ind1 | 1.000 | 5.000 | −0.565 | −2.505 | −0.636 | −1.410 |
| Multivariate | 7.702 | 2.282 |
Source: Authors’ calculation; Note: skew–skewness; C.R.–critical ratio.
Table 3.
Results of the values for tolerance and VIF from multiple regression analysis.
| Model | Collinearity Statistics | |
|---|---|---|
| Tolerance | VIF | |
| Const. | ||
| ind1 | 0.621 | 1.611 |
| ind2 | 0.626 | 1.597 |
| ind3 | 0.845 | 1.183 |
| ind4 | 0.802 | 1.247 |
| ind5 | 0.718 | 1.393 |
| dc1 | 0.624 | 1.602 |
| dc2 | 0.645 | 1.551 |
| dc3 | 0.657 | 1.523 |
Source: Authors’ calculation. Note: VIF–variance inflation factor.
Table 4.
Reliability and convergent validity.
| Constructs | Ind1 | Cronbach’s Alpha | Composite Reliability (CR) | Average Variance Extracted (AVE) |
|---|---|---|---|---|
| industry | ind1 | 0.64 | 0.66 | 0.303 |
| ind2 | ||||
| ind3 | ||||
| ind4 | ||||
| ind5 | ||||
| dynamic capabilities | dc1 | 0.75 | 0.75 | 0.504 |
| dc2 | ||||
| dc3 | ||||
| performance | perf1 | 0.72 | 0.74 | 0.419 |
| perf2 | ||||
| perf3 | ||||
| perf4 |
Source: Authors’ calculation. Note: Factor loadings are presented in Table 6 and therefore are omitted here.
Table 5.
Discriminant validity.
| Factor Correlation | Comparison of Squared Correlation with AVE | Discriminant Validity | |
|---|---|---|---|
| ind <--> dyn.cap | −0.116 | 0.013 < AVE | Established |
| ind <--> perf | −0.312 | 0.097 < AVE | Established |
| dyn.cap <--> perf | 0.621 | 0.386 < AVE | Established |
Source: Authors’ calculation.
Table 6.
Regression Weights (Unstandardized and Standardized).
| Unstandardized Estimate | S.E. | C.R. | P | Standardized Estimate | |||
|---|---|---|---|---|---|---|---|
| perf | <--- | ind | −0.147 | 0.074 | −1.998 | 0.046 | −0.243 |
| perf | <--- | dyn.cap | 0.413 | 0.114 | 3.626 | *** | 0.593 |
| ind1 | <--- | ind | 1.000 | 0.740 | |||
| ind2 | <--- | ind | 0.955 | 0.191 | 4.999 | *** | 0.672 |
| ind3 | <--- | ind | 0.398 | 0.169 | 2.348 | 0.019 | 0.259 |
| ind4 | <--- | ind | 0.560 | 0.172 | 3.259 | 0.001 | 0.368 |
| ind5 | <--- | ind | 0.791 | 0.172 | 4.611 | *** | 0.561 |
| dc3 | <--- | dyn.cap | 0.786 | 0.138 | 5.713 | *** | 0.651 |
| dc2 | <--- | dyn.cap | 1.015 | 0.167 | 6.093 | *** | 0.749 |
| dc1 | <--- | dyn.cap | 1.000 | 0.724 | |||
| perf4 | <--- | perf | 1.000 | 0.492 | |||
| perf3 | <--- | perf | 1.170 | 0.269 | 4.341 | *** | 0.640 |
| perf2 | <--- | perf | 1.267 | 0.275 | 4.614 | *** | 0.758 |
| perf1 | <--- | perf | 1.233 | 0.278 | 4.430 | *** | 0.670 |
Source: Authors’ calculation. Note: *** stands for values lower than 0.001; C.R.—critical ratio; S.E.—standard error; P—probability.
Table 7.
Fit indices for the performance model.
| Fit Index | This Research | Recommended Values | Source |
|---|---|---|---|
| x2 (p-value) | 0.037 | ≥0.05 | Byrne (2016) |
| CMIN/df | 1.381 | ≤3 | Gefen et al. (2000) |
| SRMR | 0.063 | ≤0.08 | Hu and Bentler (1999) |
| GFI | 0.918 | ≥0.9 | Rehman et al. (2015) |
| IFI | 0.938 | ≥0.9 | Koropp et al. (2014) |
| TLI | 0.916 | ≥0.9 | Lei and Wu (2007) |
| CFI | 0.935 | ≥0.9 | Lei and Wu (2007) |
| RMSEA | 0.057 | ≤0.06 | Hu and Bentler (1999) |
Source: Authors’ compilation. Note: CMIN—minimum discrepancy; df—degrees of freedom; SRMR—Standardized Root Mean Square Residuals; GFI—Goodness of Fit Index; IFI—Index of Fit; TLI—Tucker-Lewis Index; CFI—Comparative Fit Index; RMSEA—Root Mean Square Error of Approximation.
© 2017 by the authors. Licensee MDPI, Basel, Switzerland. This article is an open access article distributed under the terms and conditions of the Creative Commons Attribution (CC BY) license (http://creativecommons.org/licenses/by/4.0/).
Share and Cite
MDPI and ACS Style
Pervan, M.; Curak, M.; Pavic Kramaric, T. The Influence of Industry Characteristics and Dynamic Capabilities on Firms’ Profitability. Int. J. Financial Stud. 2018, 6, 4. https://doi.org/10.3390/ijfs6010004
AMA Style
Pervan M, Curak M, Pavic Kramaric T. The Influence of Industry Characteristics and Dynamic Capabilities on Firms’ Profitability. International Journal of Financial Studies. 2018; 6(1):4. https://doi.org/10.3390/ijfs6010004
Chicago/Turabian StylePervan, Maja, Marijana Curak, and Tomislava Pavic Kramaric. 2018. "The Influence of Industry Characteristics and Dynamic Capabilities on Firms’ Profitability" International Journal of Financial Studies 6, no. 1: 4. https://doi.org/10.3390/ijfs6010004
Note that from the first issue of 2016, this journal uses article numbers instead of page numbers. See further details here.