Performance of Exchange Traded Funds during the Brexit Referendum: An Event Study

1
Department of Economics, University of Nebraska at Omaha, 6708 Pine Street, Omaha, NE 68182, USA
2
Department of Business, Finance and Law, University of Milano-Bicocca, 20126 Milan, Italy
*
Author to whom correspondence should be addressed.
Int. J. Financial Stud. 2018, 6(3), 64; https://doi.org/10.3390/ijfs6030064
Submission received: 21 June 2018
/
Revised: 3 July 2018
/
Accepted: 3 July 2018
/
Published: 13 July 2018
(This article belongs to the Special Issue Impact of Brexit on Financial Markets)
Abstract
:In today’s interrelated economies, financial information travel at speed of light to reach investors around the globe. Global financial markets experience regular shocks that transmit negative waves to other equity markets and different asset classes. Given the unique characteristics of exchange-traded funds (ETFs), this paper examines how different ETFs that are traded on London Financial center reacted to the Brexit event in 23 June 2016. The unexpected referendum result the day after is viewed as the next significant financial event since 2008. The paper employs an event study market model on daily and abnormal returns of the selected ETFs with respect to FTSE 250 around the event date. Contrary to what is expected, the world equities fund experienced significant positive abnormal return on the event day. Emerging markets again proved to be a preferred investment destination in times of financial turmoil; the emerging equities fund gained 3% while enjoying an 11.5% positive significant abnormal returns. The US T-Bond fund recorded a 9% return with a significant 7.2% abnormal return. The gold fund soared as much as 4% as investors seeks refuge from Brexit, and the oil fund retraced 1% amid concerns of slowing global demand.
Keywords:
exchange-traded funds (ETFs); event study model; emerging markets; commodities; world equities; abnormal returnsJEL Classifications:
G10; G14; G151. Introduction and Literature Review
According to the European Central Bank, the global economy has witnessed a deepening of trade and financial integration and associated increase in the relevance of spillovers to the domestic economy from shocks in other economies.1 The liberalization of the capital markets help to enhance market integration, which in effect increase the transmission of market turbulence (Assidenou 2011).
Given the increased interrelation among world economies, this paper focuses on the recent Brexit event and how it affected the performance of certain exchange-traded funds (ETFs). The Brexit sent waves of shocks across the global financial system. Global stock markets wiped about $2 trillion in value. The FTSE 100 retraced about nine percent and the FTSE 250, which is mainly composed of medium-sized companies, declined 7%. The United States (US) equity market followed the rhythm in the Unites Kingdom’s (UK’s) market; the Dow Jones plummeted 3.5%, the NASDAQ composite index dropped by 4%, and the S&P 500 ended the day 3.5% lower.
The Euro Stoxx 600 that tracks stocks in the European continent declined 7%. Germany Dax index closed down nearly 7%. The pound sterling dropped to its lowest level in 30 years. Some currencies proved again to be safe haven, such as the Japanese Yen and Swiss Franc, with the Japanese Yen rallying as much as 6.5%. The banking sector was the most to feel the panic across Europe and USA. In London, Barclays dropped about 17%, Lloyd’s banks decreased 19%, Royal bank of Scotland nosedived 17%, and the German Deutche bank dropped 14%. HSBC recorded a 7% decline; Standard Charted (SCBFF) lost 9% during the trading hours. US banks also declined in value following the Brexit (Quaye et al. 2016).
The road to Brexit was paved in January 2013 when the former prime minister of UK David Cameron declared a referendum on EU membership. It was clearly a tough decision for UK voters to decide to leave or stay under the EU umbrella. Furthermore, the EU is the largest trading partner; almost fifty percent of Britain’s good are traded with Europe. Some researchers argue that the Brexit is the next big financial event since the 2008 financial crisis.
The main question in this paper is to identify how specific ETFs traded in London reacted to the Brexit. An exchange-traded fund (ETF) is a marketable security that tracks an index, such as the S&P 500. An ETF trades like a common stock on a stock exchange. ETFs experience price changes throughout the day as they are bought and sold.
The motivation for selecting this topic is that the Brexit is relatively new event that raised eyebrows on British economic and financial policies. Nowadays, Britain’s economic performance is capturing the attention of policymakers, institutions, and investors alike. Furthermore, event studies are increasingly used in the financial economic research to measure the impact of various economic events and announcements. Economic uncertainties do affect financial markets and countries credit ratings. Countries with lower credit ratings are more negatively affected from economic uncertainties than higher rated countries. For instance, when there is uncertainty surrounding European economic policy, Greece (a lower rated country) is expected to get a major credit “hit” from rating agencies. This case is evident during the period of 2008–2013, when Greece was continuously downgraded on the rise of policy uncertainty (Boumparis et al. 2017). The United Kingdom enjoys a strong triple “A” rating for the past 35 years.2 Although the Brexit uncertainty downgraded the UK rating and its outlook, such a rating was not severe given the strong economy of the UK. In our view, the Brexit resulted in a short-term shock to the British financial market and the Sterling Pound. However, in the long-run we do not view such an event to cause a recession or a collapse in the market. The financial literature is abundant with studies about economic news and financial markets integration; several studies focus on monetary policies of certain countries and how they affect asset classes, while others focus on financial crises and how investors react and behave. However, the majority of the studies test the impact of economic events on stocks or equity indices, very few analyze mutual or exchange traded funds.
Studies on the return and covariance relationships between stock-stock and stock-bond are well established in the financial literature. Connolly et al. (2007) find that cross country stock return comovement tends to be stronger following high implied volatility days and in days in high changes in implied volatility, whereas, within country stock-bond return comovement tends to be positive following low implied volatility days and days with small changes in the implied volatility. On the other hand, Scruggs and Paskalis (2003) investigate both the return and covariance of stock and bond returns, they show that bond variance responds symmetrically to bond return shocks, but not to stock return socks, whereas, stock variance responds asymmetrically to both stock and bond return shocks. In this regard, our study includes not only financial assets but also we test the movement of commodity ETFs around the Brexit referendum extent.
Sathyanarayana and Gargesha (2016) employ an event study methodology to gauge the effect of Brexit on the Indian stock indices; they find significant abnormal return on the event day and on twelve days after the event. Such finding highlights the pronounced effect of the Brexit on the both indices, particularly on the event date. The British economy was the center of the storm during the referendum as it witnessed severe losses. The Brexit produce varying effects on different industries, banks, and financial services were the most affected, with a cumulative abnormal return (CAR) of almost −15% for the banking sector (Ramiah et al. 2016).
The British Pound depreciated around 15% relative to the US-dollar. A research conducted by Plakandaras et al. (2017) tries to model the exchange rate behavior with respect to the Brexit uncertainty. Using the economic policy uncertainty (EPU) index provides a better estimate to predict the impact of Brexit on exchange rate, ex-ante. Stracca (2013) analyzes the global effects of the euro debt crisis during 2010–2013 while using a panel fixed-effect regression. The main results are that the crisis produce sizeable effects on global financial markets outside the Euro area; global risk aversion increased, equities (particularly in the financial sector), and even in safe haven countries, such as Germany and the US, exhibited negative returns and the euro currency depreciated.
Madura and Richi (2004) examine the overreaction of exchange-traded funds during the bubble of 1998–2002 period and find that ETFs experience substantial overreaction during normal trading hours (9:30 a.m. to 4:00 p.m.). At the same time, overreaction was more pronounced for international ETFs. The economic literature goes beyond analyzing financial markets to examining commodities markets. Only few papers have investigated the impact of macroeconomic news on commodities market in general and oil market in particular (Belgacem et al. 2015). Such an implication is important since we are including a commodity ETF in our analysis and testing how it reacts to Brexit.
Belgacem et al. (2015) find oil prices significantly responded to some US macroeconomic news; confirming previous literature findings and supporting the claim that foreign investors rely on US data to analyze the oil market. Event studies are increasingly used in economic literature to see how economic events affect asset prices around event dates. Emerging financial markets; particularly China, are attracting the attention of scholars and researches.
A study conducted by Baren and Ma (2002) aims to test whether the Chinese stock prices reflect the announcement of public information instantaneously and without bias; a situation that is called semi-market efficiency (Fama 1970). The authors find that Chinese stocks responded positively to the announcement of bonus shares. Additionally, both A-shares stocks (domestic) and B-shares (for foreign residents) attract positive return around the announcement date.
Zheng and Osmer (2013) empirically examine the pricing of ETFs that focus on China; they conclude that the dollar Renminbi exchange rate has a big impact in explaining ETF discounts. An appreciation of the US dollar against the Renminbi has a positive and significant effect of the ETF discount. Second, the coefficient of the S&P 500 has also a positive and significant effect on the discount of the ETF.
Despite the plethora of research about the topic of financial markets reaction to economic events, to the best of our knowledge, no author has discussed how certain ETFs, such as world equities, commodities, and emerging markets have reacted to the recent Brexit event. Prior studies mainly discussed financial markets integration, volatility spillover, and reaction of certain assets to macroeconomic news. This paper analyzes eight ETFs that represent different asset classes. Since the event occurred on the British soil and in order to avoid any time lags issues, we have carefully chosen funds that are incorporated and traded in the UK or Ireland. Further, all of the time series regression models have been tested and corrected for presence of unit root, serial correlation in the residuals, and heteroscedasticity.
2. Methodology and Data
2.1. Data
Daily data are obtained from Bloomberg terminal from the period 1 January 2010 until 24 June 2016. It is worth noting here that the Brexit referendum was on Thursday, 23 June, but the results were released on Friday, 24th and both are trading days, and therefore, in this study we assume that day 0 is the results’ day. The event study model requires an estimation period before the event date along with an event window. In this paper, the estimation period is chosen from 1 January 2010 until 14 June 2016 (ten days before the Brexit results). Therefore, the estimation period is labeled (t = −1626, …, −10). The event window is chosen to be ten days before the event, the event day, and ten days after the event. The event window is labeled as (t = −10, …, 0, …, +10). The event day is labeled (t = 0). Table 1 provides a brief summary of each ETF that is used in the study. Table 2 presents a summary statistics for the variables along with the Unit root tests. The FTSE 250 index mean return across the estimation period is 0.037% with a 0.98% standard deviation. The world equity ETF has a mean return of 0.045% with a standard deviation of 0.92%.
Dealing with time series data requires checking for stationarity. We employ the Augmented-Dickey Fuller and the Phillips-Perron tests to check for the presence of unit root in all of the return series. All of the daily logarithmic returns appear to be stationary as both the Augmented-Dickey Fuller and the Phillips-Perron tests reject the null hypothesis of the existence of unit root.
Table 3 provides a correlation matrix for the return series. There is a high correlation between the FTSE 250, world equity, European, emerging, and private equity, with a correlation coefficient of 0.757, 0.793, 0.710, and 0.744, respectively. The correlation between the FTSE 250 index and the S&P 500 core fund is very low and negative with a coefficient of −0.006. US T-bond ETF has a negative correlation with the FTSE of −0.468, confirming the cross-country stock return and within country stock-bond return relationships, as in Connolly et al. (2007), who highlight the diversification implications among various asset classes. Oil ETF has a 0.380 correlation coefficient, while gold ETF has a 0.072 correlation with FTSE 250 index. World equity ETF is highly correlated with the European, emerging, and private equity ETFs.
2.2. Event Study Market Model and Specifications
Binder (1998) explains the event study in the classical work of Fama, French, Jensen, and Roll (FFJR). FFJR propose the event study methodology for measuring the effects of actions and events on security prices. FFJR examine how a certain stock “i” behave when there are splits announcements using a sample of monthly stock returns from 1926–1960, including the period containing the desired event. FFJR use the market model to estimate the parameters for the stock i with the general market index as. In their study, FFJR define the event period from 29 months before the split is announced to 30 months after. The month of the event itself “the split” is defined as s = 0, whereas the event period runs from s = −29 to s = 30. The market model is used to estimate the abnormal return of the security during the specific window. FFJR use the residual to capture the abnormal return. In our paper, we follow a similar approach, although we focus on daily returns, not monthly.
The aim of the event study is to identify the abnormal returns of the financial security around the event date. According to Mackinaly (1997), and following FFJR seminal work, given any security i at time t, the market model is
where and are the daily return of the financial security and the market, respectively, and . is the residual term, where returns are calculated, according to the following equation;
where . and . are the prices of the security or market at a certain day and the previous day. This paper employs eight market models in which the daily log returns of the respected ETF is the dependent variable and the daily log returns of the FTSE 250 is the independent variable. We choose the FTSE 250 as it offers a reliable representation of the British economy.3 The paper employs an ordinary least square regression (OLS) for each ETF, while detecting and correcting for the presence of serial correlation and heteroscedasticity.
In the presence of serial correlation (as in the world equity and private equity models), we utilize the Prais regression that uses the generalized least square estimation (GLS) and in the presence of autocorrelation in the regression residuals. The robust regression model is used when the residuals exhibit heteroscedasticity pattern (as in the case of the gold ETF). Finally, when the model suffers from both serial correlation and heteroscedasticity, we rely on the Newey-West estimator to obtain reliable estimates (as in the case of the oil and EU equity funds).
After specifying the correct regression model, we use it to generate the expected or estimated returns in the event window. After that, we calculate the abnormal returns as the actual return minus the expected returns. We employ a student t-test in order to measure the significance of the abnormal returns during the event window.
where is the abnormal return, . is the actual return, and . is the expected return unconditional on the event but is conditional on a separate information set.
3. Empirical Results
Preliminary Results
Table 4 reports the event study regression models for the equity funds. For the model involving the world equity against the FTSE 250, the OLS model has a serial correlation in the residuals as the Durbin-Watson (DW) statistics is 2.24, which is far from two. Further, the OLS model has no heteroscedasticity problem. As a result, we rely on the Prais regression model to obtain the coefficient and standard error. The FTSE 250 has a significant positive relation with world equity fund return with a coefficient of 0.799. The story is different for the S&P 500 core returns, in which the coefficient is low and insignificant.
The OLS model involving the European equities fund has both serial correlation and heteroscedasticity. As a result, we use the Newey-West regression, which corrects for autocorrelation and heteroscedasticity, and yields a strong positive and significant coefficient. According to the model, a one percent increase in the FTSE 250 index would yield a 1.057 percent increase in the European equity fund; this shows how both of the indexes are highly correlated and that that EU equity ETF overreacts with respect to FTSE. The emerging equity fund model has a positive and significant coefficient of 0.991.
Table 5 presents the event study regression models for the private equity, US T-bonds, and commodities ETFs. The Prais regression model involving the private-equity returns has a significant positive coefficient of 0.959. The US T-bond OLS model, on the other hand, has significant negative coefficient of −0.288; indicating the negative relationship between UK equities and US treasuries. Finally, the robust model with the gold ETF and the Newey-West model with the oil ETF both have significant coefficients of 0.117 and 0.458, respectively.
4. Main Results
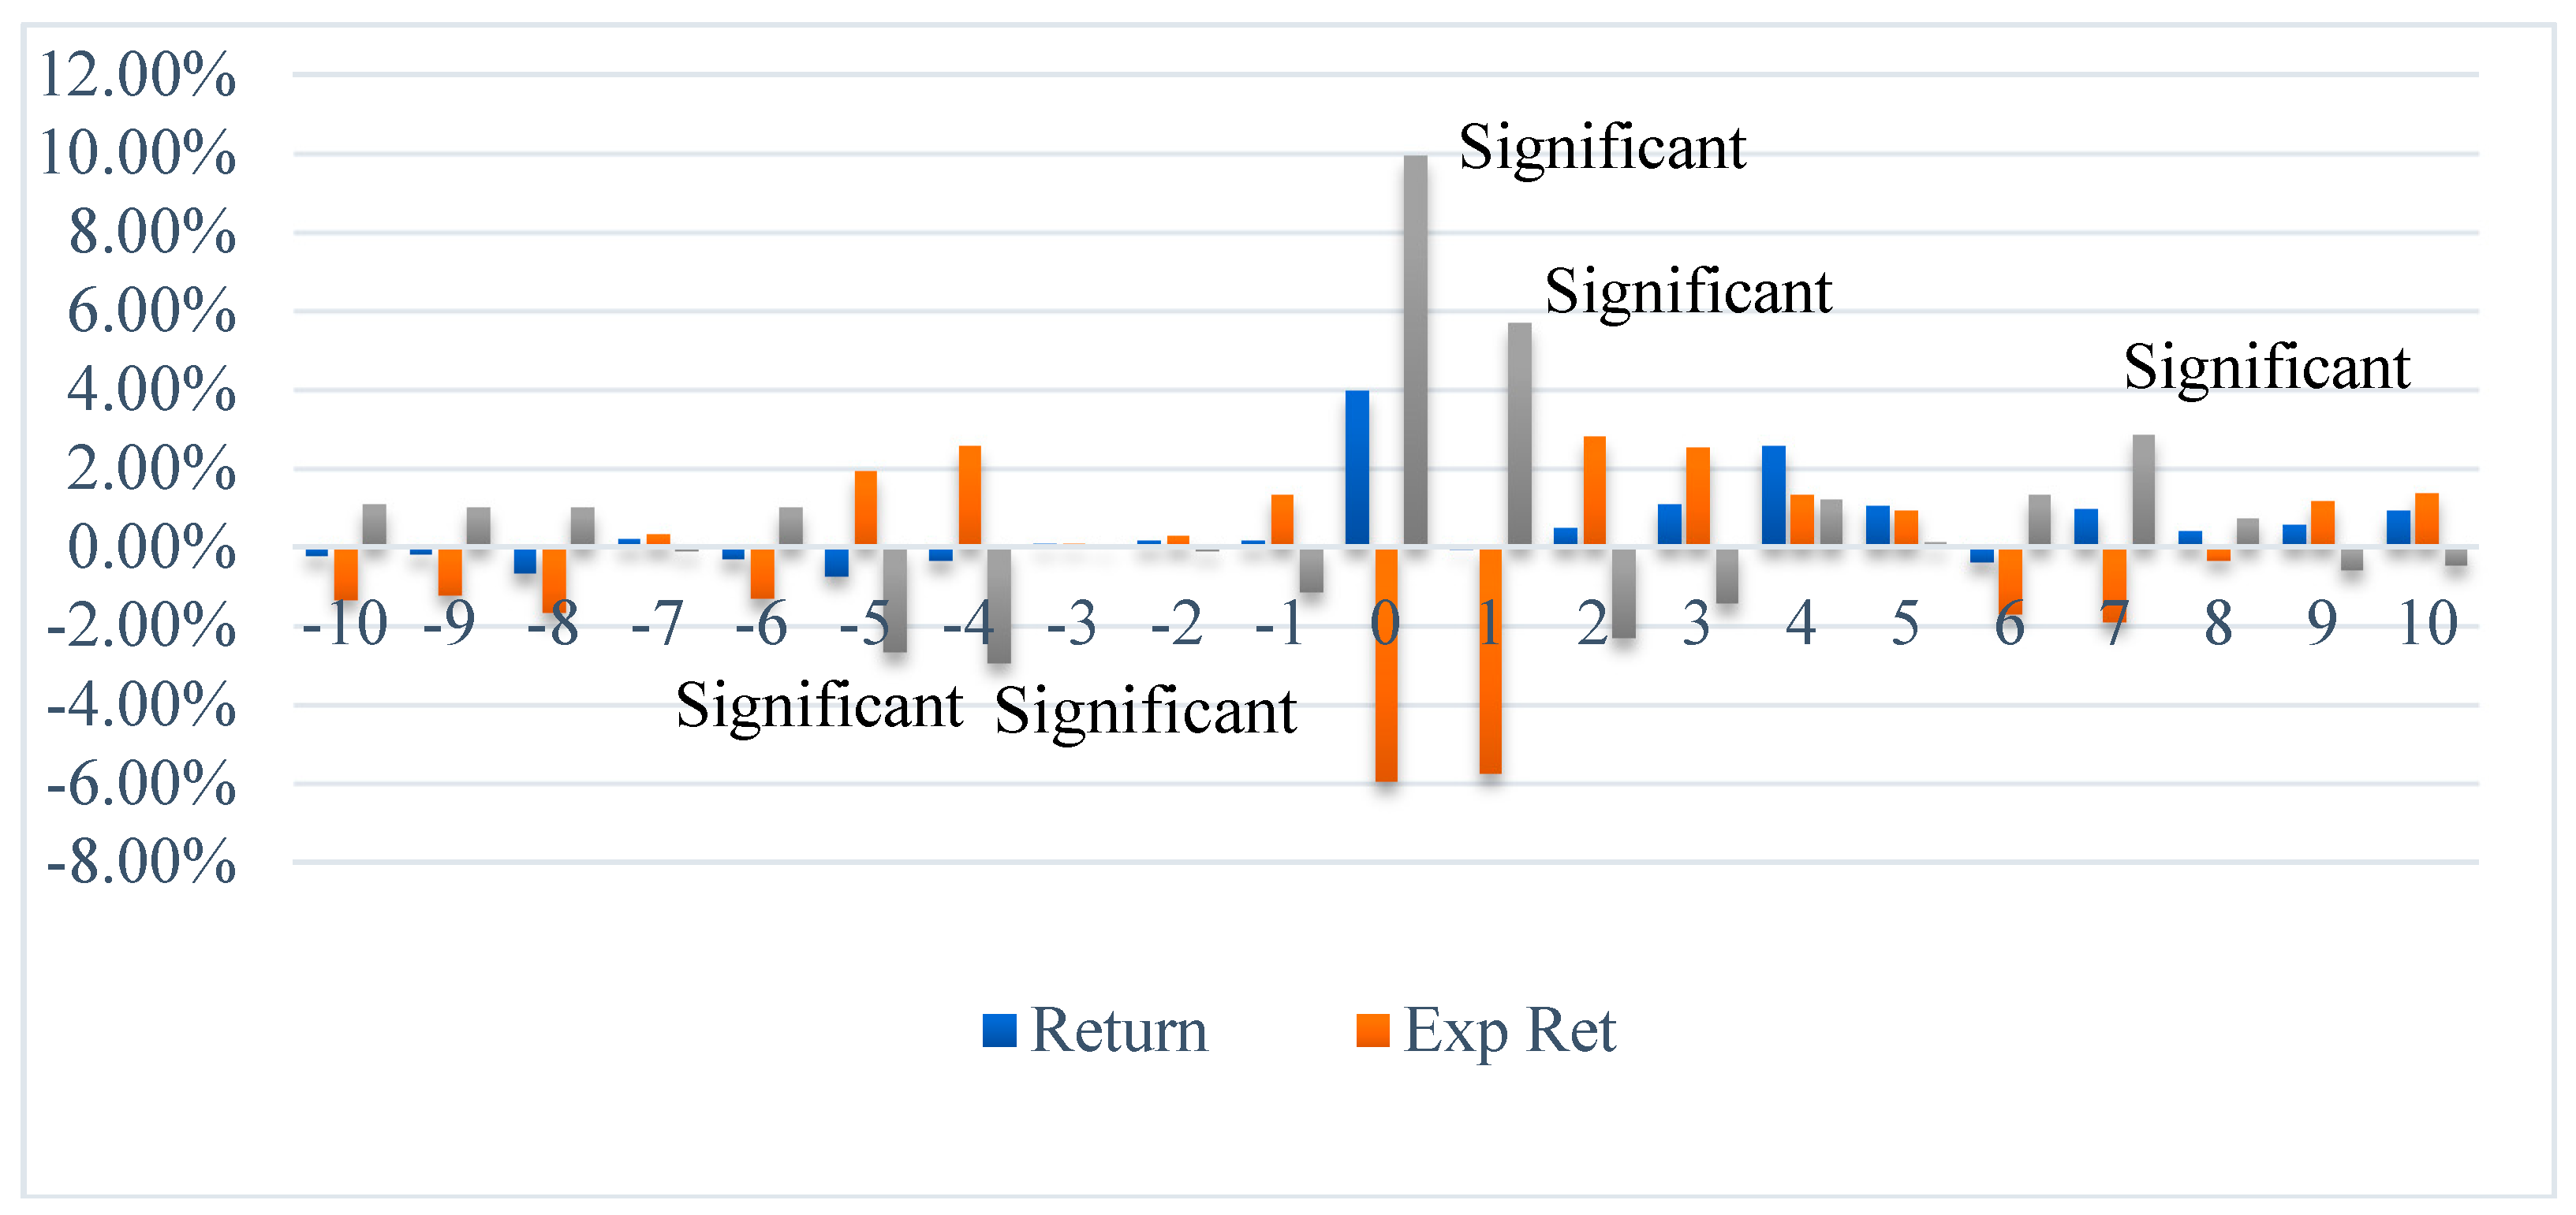
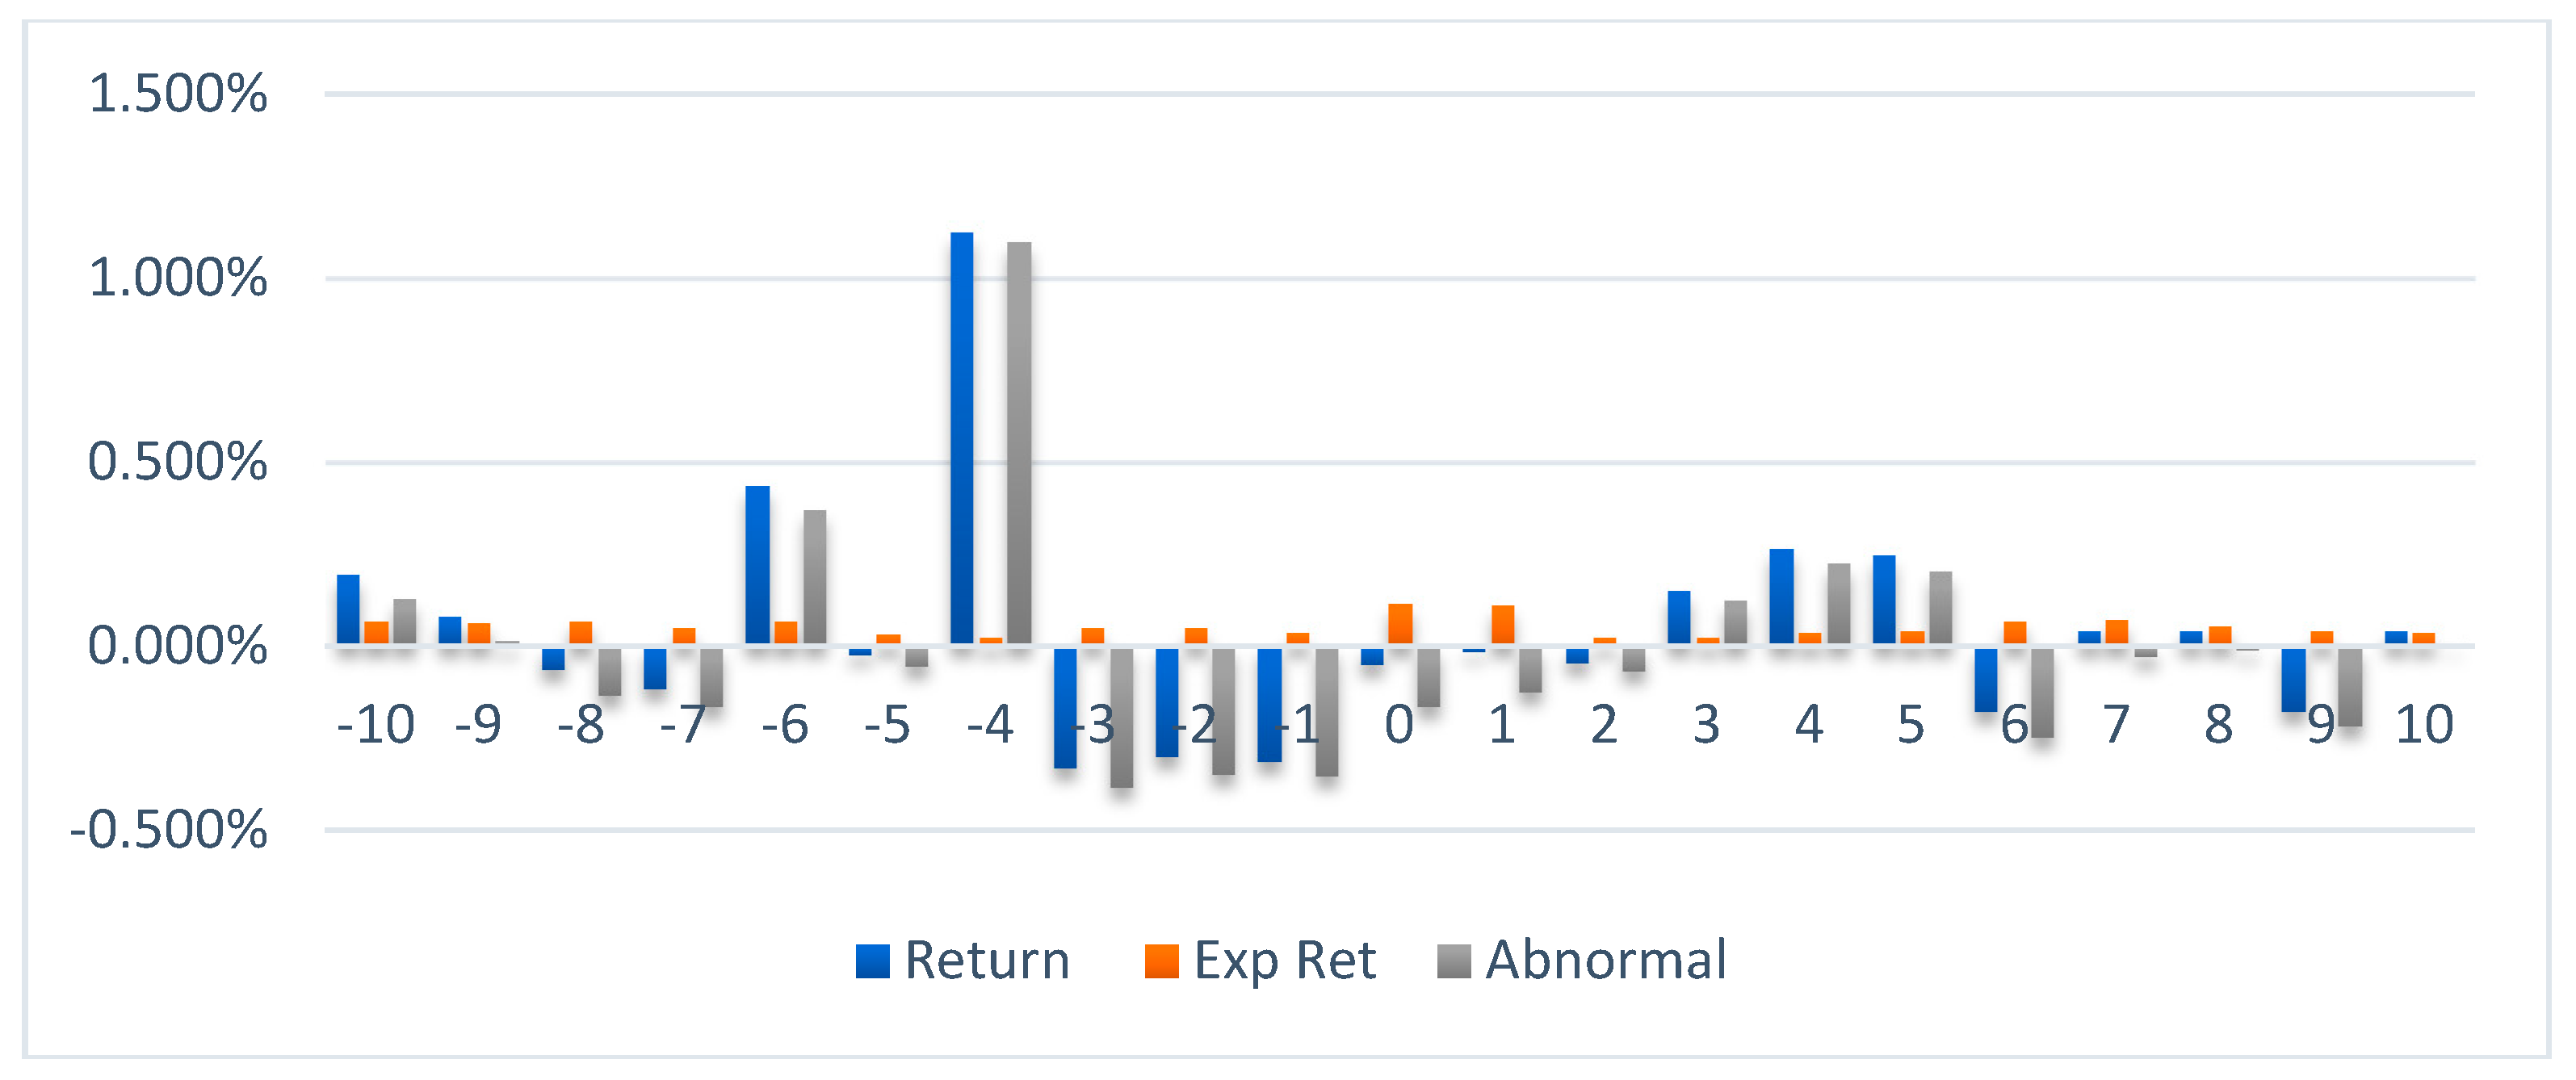
Figure 1, Figure 2, Figure 3, Figure 4, Figure 5, Figure 6, Figure 7 and Figure 8 show the returns, expected returns, and the abnormal returns (AR) of each respected ETF during the event window, while Table 6 shows the ETFs with significant abnormal return around the event day, this results in six ETFs out of eight experienced abnormal returns on different dates around the event day. The graph displays a significance note above the abnormal return in the case that the t-stat of the abnormal return is higher than the critical value. The world equity ETF shows significant negative abnormal returns five and four days before the event. On the Brexit day and a day later, the world equity ETF enjoyed a positive significant AR. The actual returns on the world equity fund witnessed 4% gain on the event day. The S&P 500 core fund did not show any signs of significant abnormal returns during the overall event window. The story is different for the European, emerging equities, and private equity funds, as they all experienced significant abnormal returns on and after a day of the referendum.
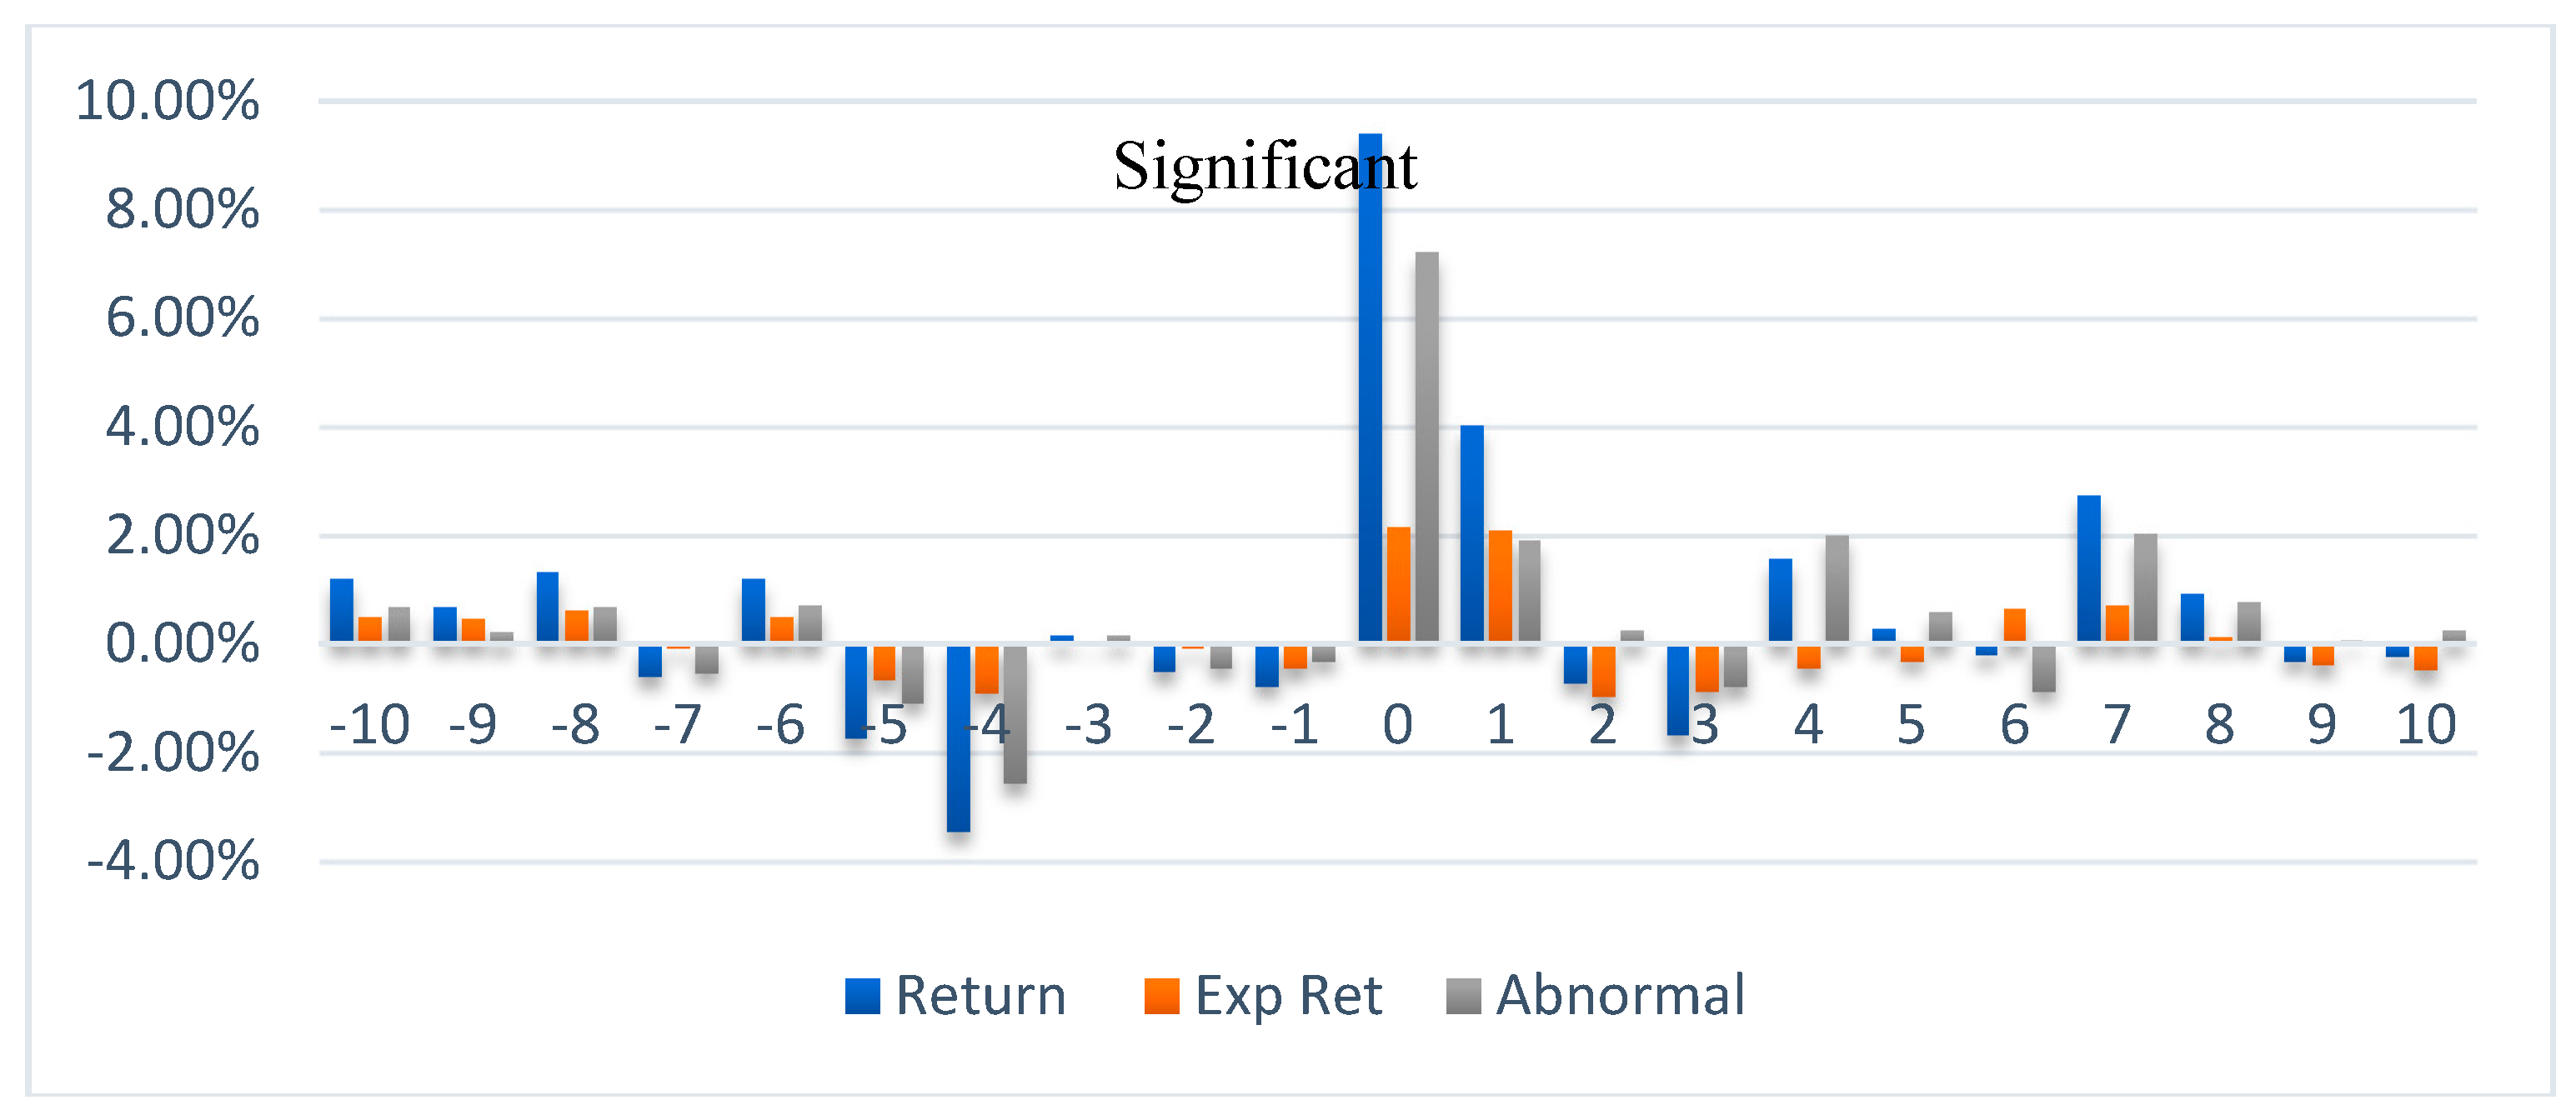
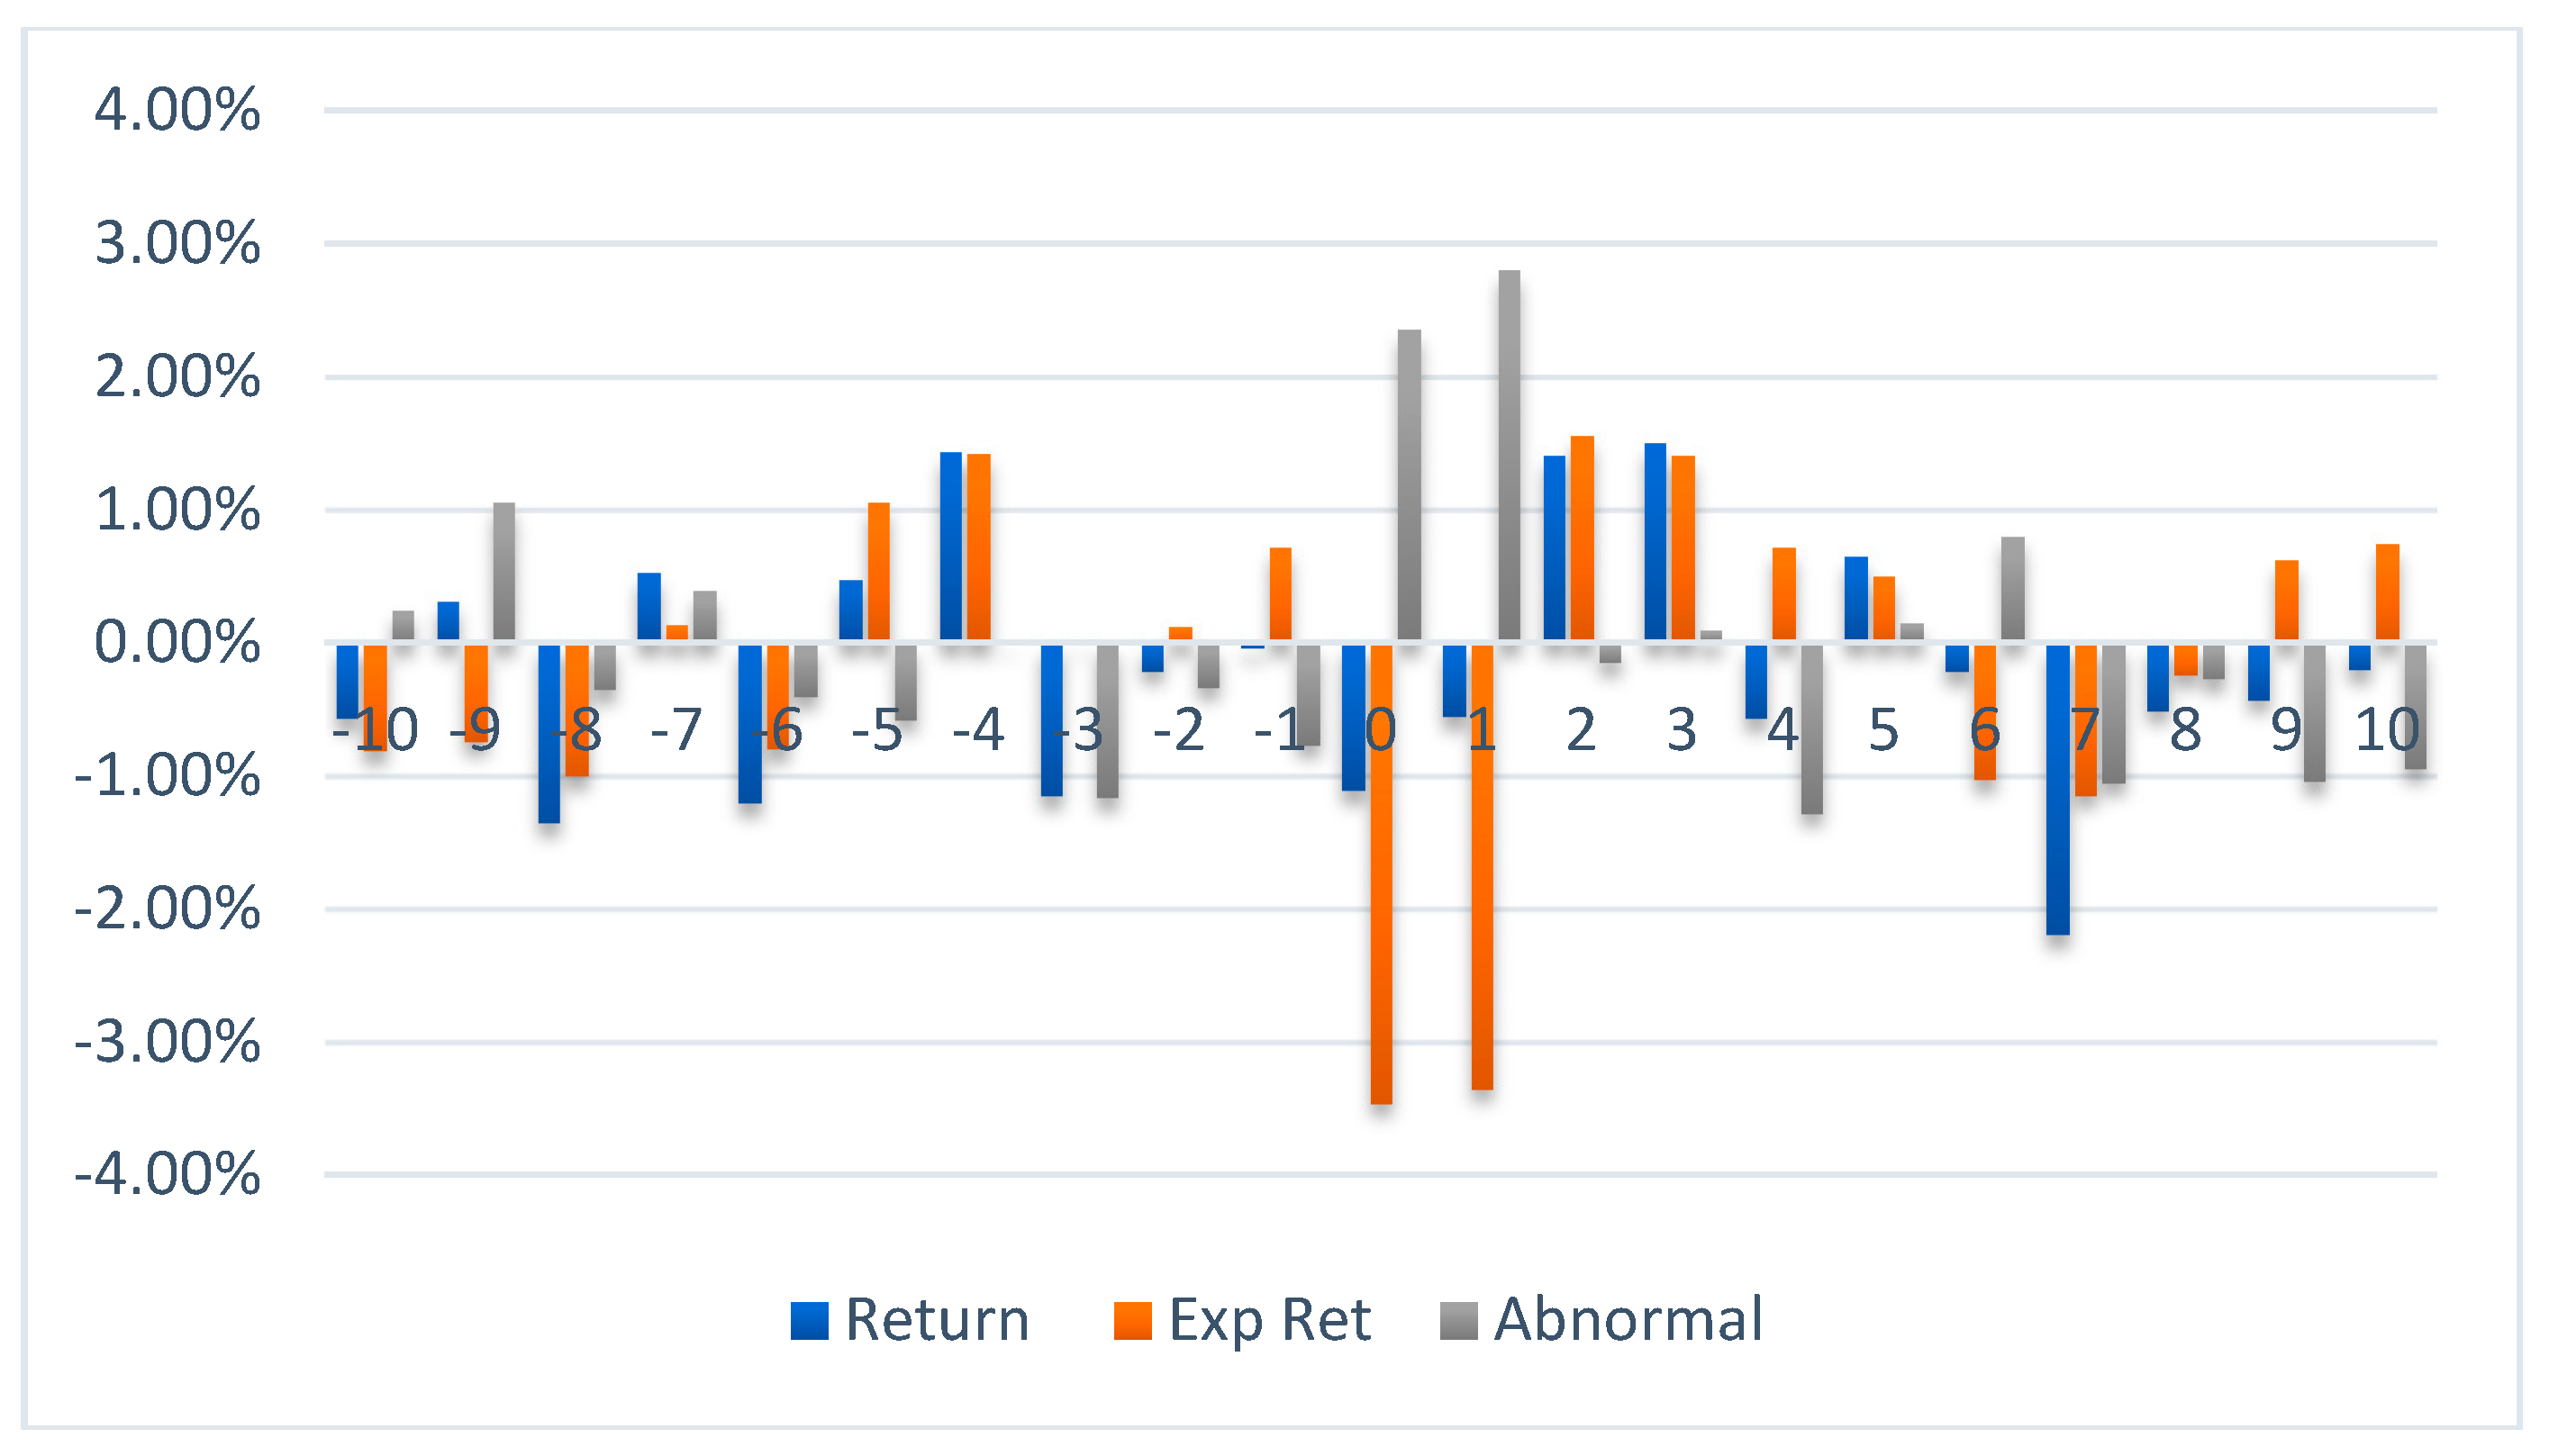
On the day of the Brexit, the US treasuries decline about 30 basis points (bp) to 1.4%; its lowest level since 2012. Given the inverse relation between bond prices and yield to maturities, the US T-bond fund recorded a 9.4% gain and 7.2% significant abnormal return. Gold experienced a noticeable glow during the Brexit; it climbed to around 8%. The gold ETF incorporated in England earned 4.12%. However, such return was not enough to produce significant AR. The Brexit referendum spread fears and concerns of a broader economic slowdown that made oil prices to decline by 5%. The England oil ETF recorded a 1.1% loss on the referendum day, with no significant abnormal returns.
5. Conclusions and Implications
This paper attempts to empirically examine certain ETFs reaction to the Brexit referendum that occurred on 24 June 2016. The paper applies the event study model in order to calculate the abnormal returns ten days before the event date, the event day, and ten days after the event date. World equities, emerging markets, and commodities ETFs are the main interest in this paper, as they represent wide range of asset classes.
World equity’s ETFs significantly respond to the event by having significant positive abnormal return on the event date. An important observation is the presence of significant negative abnormal returns five and four days before the event date, which could indicate information leakage. At the same time, positive abnormal returns were spotted on the day and a day after the Brexit in the world equities funds. Such observation could mean that the ETF fund managers were able to predict a stock market decline in England and used proper hedging strategies.
Investors often choose to invest in commodities, such as gold and silver, in order to hedge against inflation and to diversify their portfolio and to seek a shelter in the case of possible negative outcome in the stock market. In this analysis, the gold ETF experienced a 4% positive actual return on the day of Brexit and 5% positive abnormal return. Oil fund traded in the UK plummeted 1% over concerns that the Brexit would slow down demand. Oil was able to achieve a positive abnormal return of 2.35% on the day of Brexit.
As indicated by Scruggs and Paskalis (2003) and Connolly et al. (2007), different asset classes respond differently to return shocks and that cross country stock return and within country stock-bond diversifications are still valid, this study shows how various ETFs react differently with respect to an event. Closely connected ETFs (geographically, commercially, and financially), such as EU equity and the emerging markets equity, show their high response to the Brexit results. An important implication of these results is related to the proper diversification; liberalization of world’s markets made it easier to access global markets, but at the same time, has put more pressure on investors to for a proper portfolio diversification since world’s markets are more connected. We show that even though markets are highly correlated, diversification among other asset classes, such as commodities, or with US markets is still viable for a proper portfolio management.
Author Contributions
Both authors contributed in all phases of the paper, in particular, A.A. contributed mainly in developing the literature, data, and running the analysis, while M.H. contributed mainly in model development, commenting on results, and proof reading.
Acknowledgments
The authors are very grateful for the two anonymous reviewers for their valuable comments, they also thankful to the participants in the “Applied Marco and Empirical Finance “conference held at the University of Macedonia-Greece in April 2018. Authors also acknowledge the institutions through the Knowledge Unlatched for covering the publication costs.
Conflicts of Interest
The authors declare no conflict of interest.
References
- Assidenou, Komlavi. 2011. Cointegration of Major Stock Market Indices during the 2008 Global Financial Distress. International Journal of Economic and Finance 3: 212–22. [Google Scholar] [CrossRef]
- Baren, Michelle L., and Shiquang Ma. 2002. The Behavior of China’s Stock Prices in Response to the Proposal and Approval of Bonus Issues. SSRN Electronic Journal. [Google Scholar] [CrossRef]
- Belgacem, Aymen, Anna Creti, Khaled Guesmi, and Amine Lahiani. 2015. Volatility Spillovers and Macroeconomic Announcements: Evidence from Crude Oil Markets. Journal of Applied Economics 47: 2974–84. [Google Scholar] [CrossRef]
- Binder, John. 1998. The event study methodology since 1969. Review of Quantitative Finance and Accounting 11: 111–37. [Google Scholar] [CrossRef]
- Boumparis, Periklis, Costas Milas, and Theodore Panagiotidis. 2017. Economic Policy Uncertainty and Sovereign Credit Rating Decisions: Panel Quantile Evidence for the Eurozone. Journal of International Money and Finance 79: 39–71. [Google Scholar] [CrossRef]
- Connolly, Robert, Chris Stivers, and Licheng Sun. 2007. Commonality in the time-variation of stock-stock and stock-bond return comovements. Journal of Financial Markets 10: 192–218. [Google Scholar] [CrossRef]
- Fama, Eugene. 1970. Efficient Capital Markets: A Review of Theory and Empirical Work. Journal of Finance 25: 383–417. [Google Scholar] [CrossRef]
- MacKinaly, Craig. 1997. Event Studies in Economics and Finance. Journal of Economic Literature 35: 13–39. [Google Scholar]
- Madura, Jeff, and Nivine Richi. 2004. Overreaction of Exchange-Traded Funds during the Bubble of 1998–2002. Journal of Behavioral Finance 5: 91–104. [Google Scholar] [CrossRef]
- Plakandaras, Vasilios, Rangan Gupta, and Mark E. Wohar. 2017. The Depreciation of the Pound Post-Brexit: Could it have been predicted? Finance Research Letters 21: 206–13. [Google Scholar] [CrossRef]
- Ramiah, Vikash, Huy Pham, and Imad Mousa. 2016. The Sectoral Effects of Brexit on the British Economy: Early Evidence from the Reaction of the Stock Market. Applied Economics 49: 2508–14. [Google Scholar] [CrossRef]
- Sathyanarayana, S., and Sudhindra Gargesha. 2016. Impact of BREXIT Referendum on Indian Stock Market. IRA-International Journal of Management & Social Science 5: 104–20. [Google Scholar]
- Scruggs, John, and Glabadanidis Paskalis. 2003. Risk Premia and the Dynamic Covariance between Stock and Bond Returns. Journal of Financial and Quantitative Analysis 38: 295–316. [Google Scholar] [CrossRef]
- Stracca, Livio. 2013. The Global Effects of the Euro Debt Crisis. ECB Working Paper No. 1573. Available online: https://ssrn.com/abstract=2302515 (accessed on 25 June 2018).
- Quaye, Issac, Mu Yinpig, Abudu Braimah, and Agyare Ramous. 2016. Review of Stock Markets’ Reaction to New Events: Evidence from Brexit. Journal of Financial Risk Management 5: 281–314. [Google Scholar] [CrossRef]
- Zheng, Yao, and Eric Osmer. 2013. The Pricing of China Region ETFs—An Empirical Analysis. Journal of Finance and Accountancy 12: 1–10. [Google Scholar]
| 1 | “Determinants of Global Spillovers from US Monetary Policy”, ECB working paper series, 2015. |
| 2 | “UK credit rating downgraded over Brexit uncertainty” Financial Times article, 2017. |
| 3 | According to the Daily Telegraph Article “Why we should be at the FTSE 250 and not the FTSE 100 to gauge the impact of the Brexit”. |
Figure 1.
World Equity ETF.

Figure 2.
S&P 500 ETF.

Figure 3.
European Equity ETF.
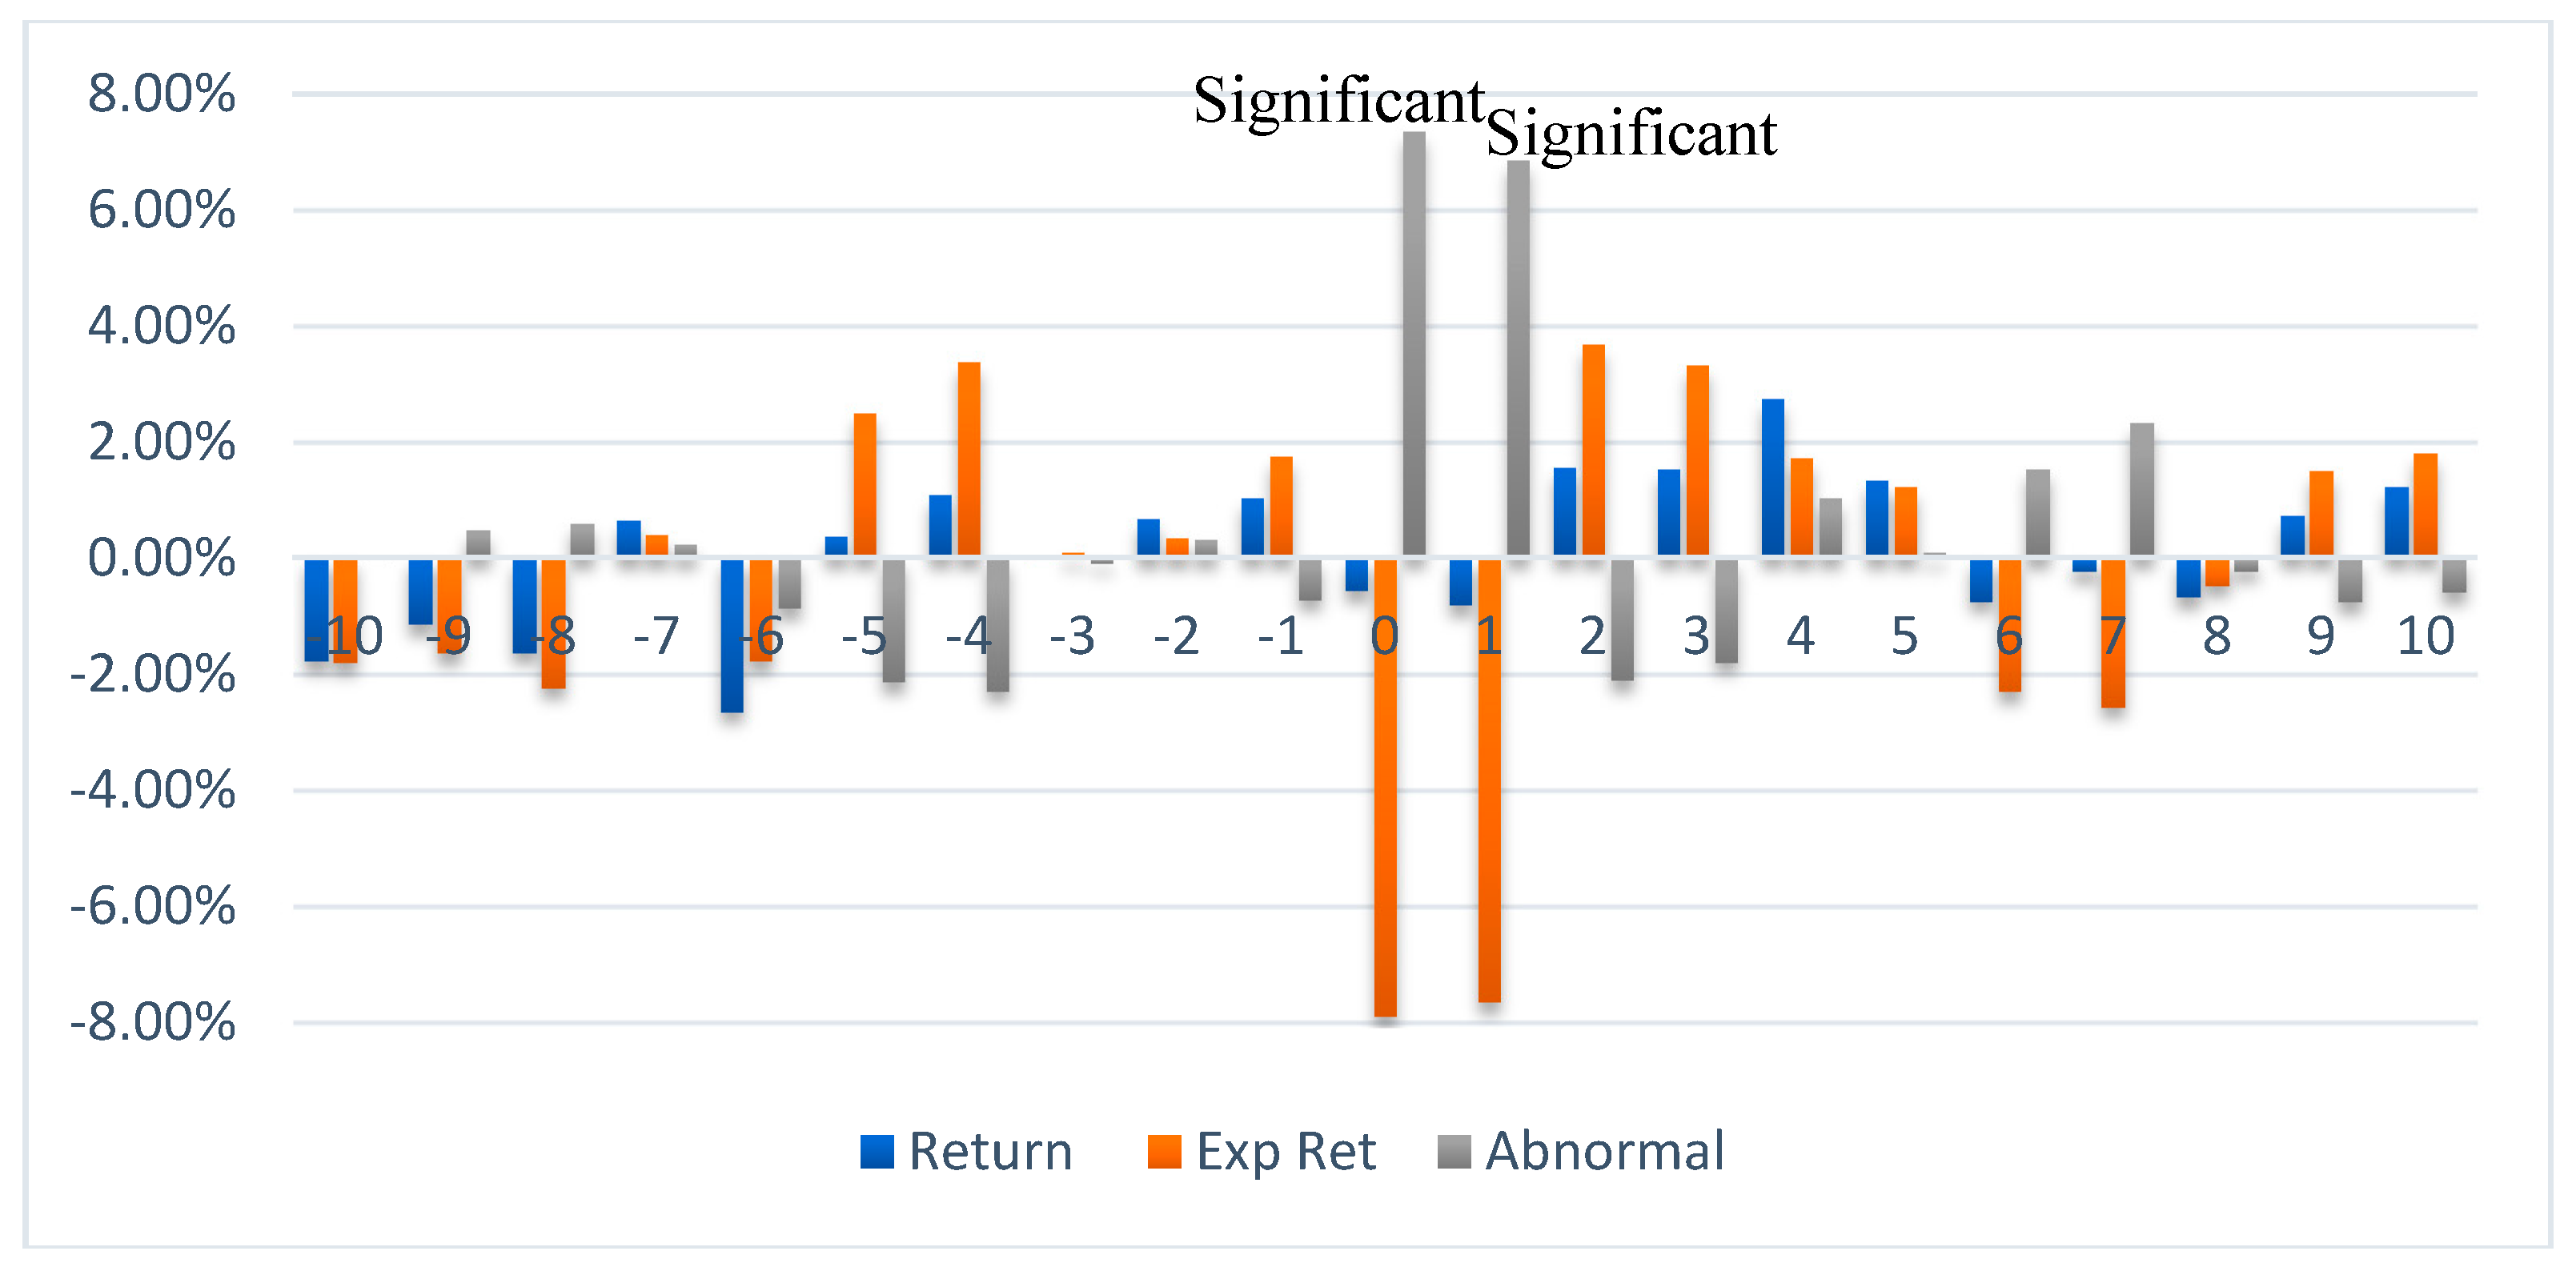
Figure 4.
Emerging Equity ETF.
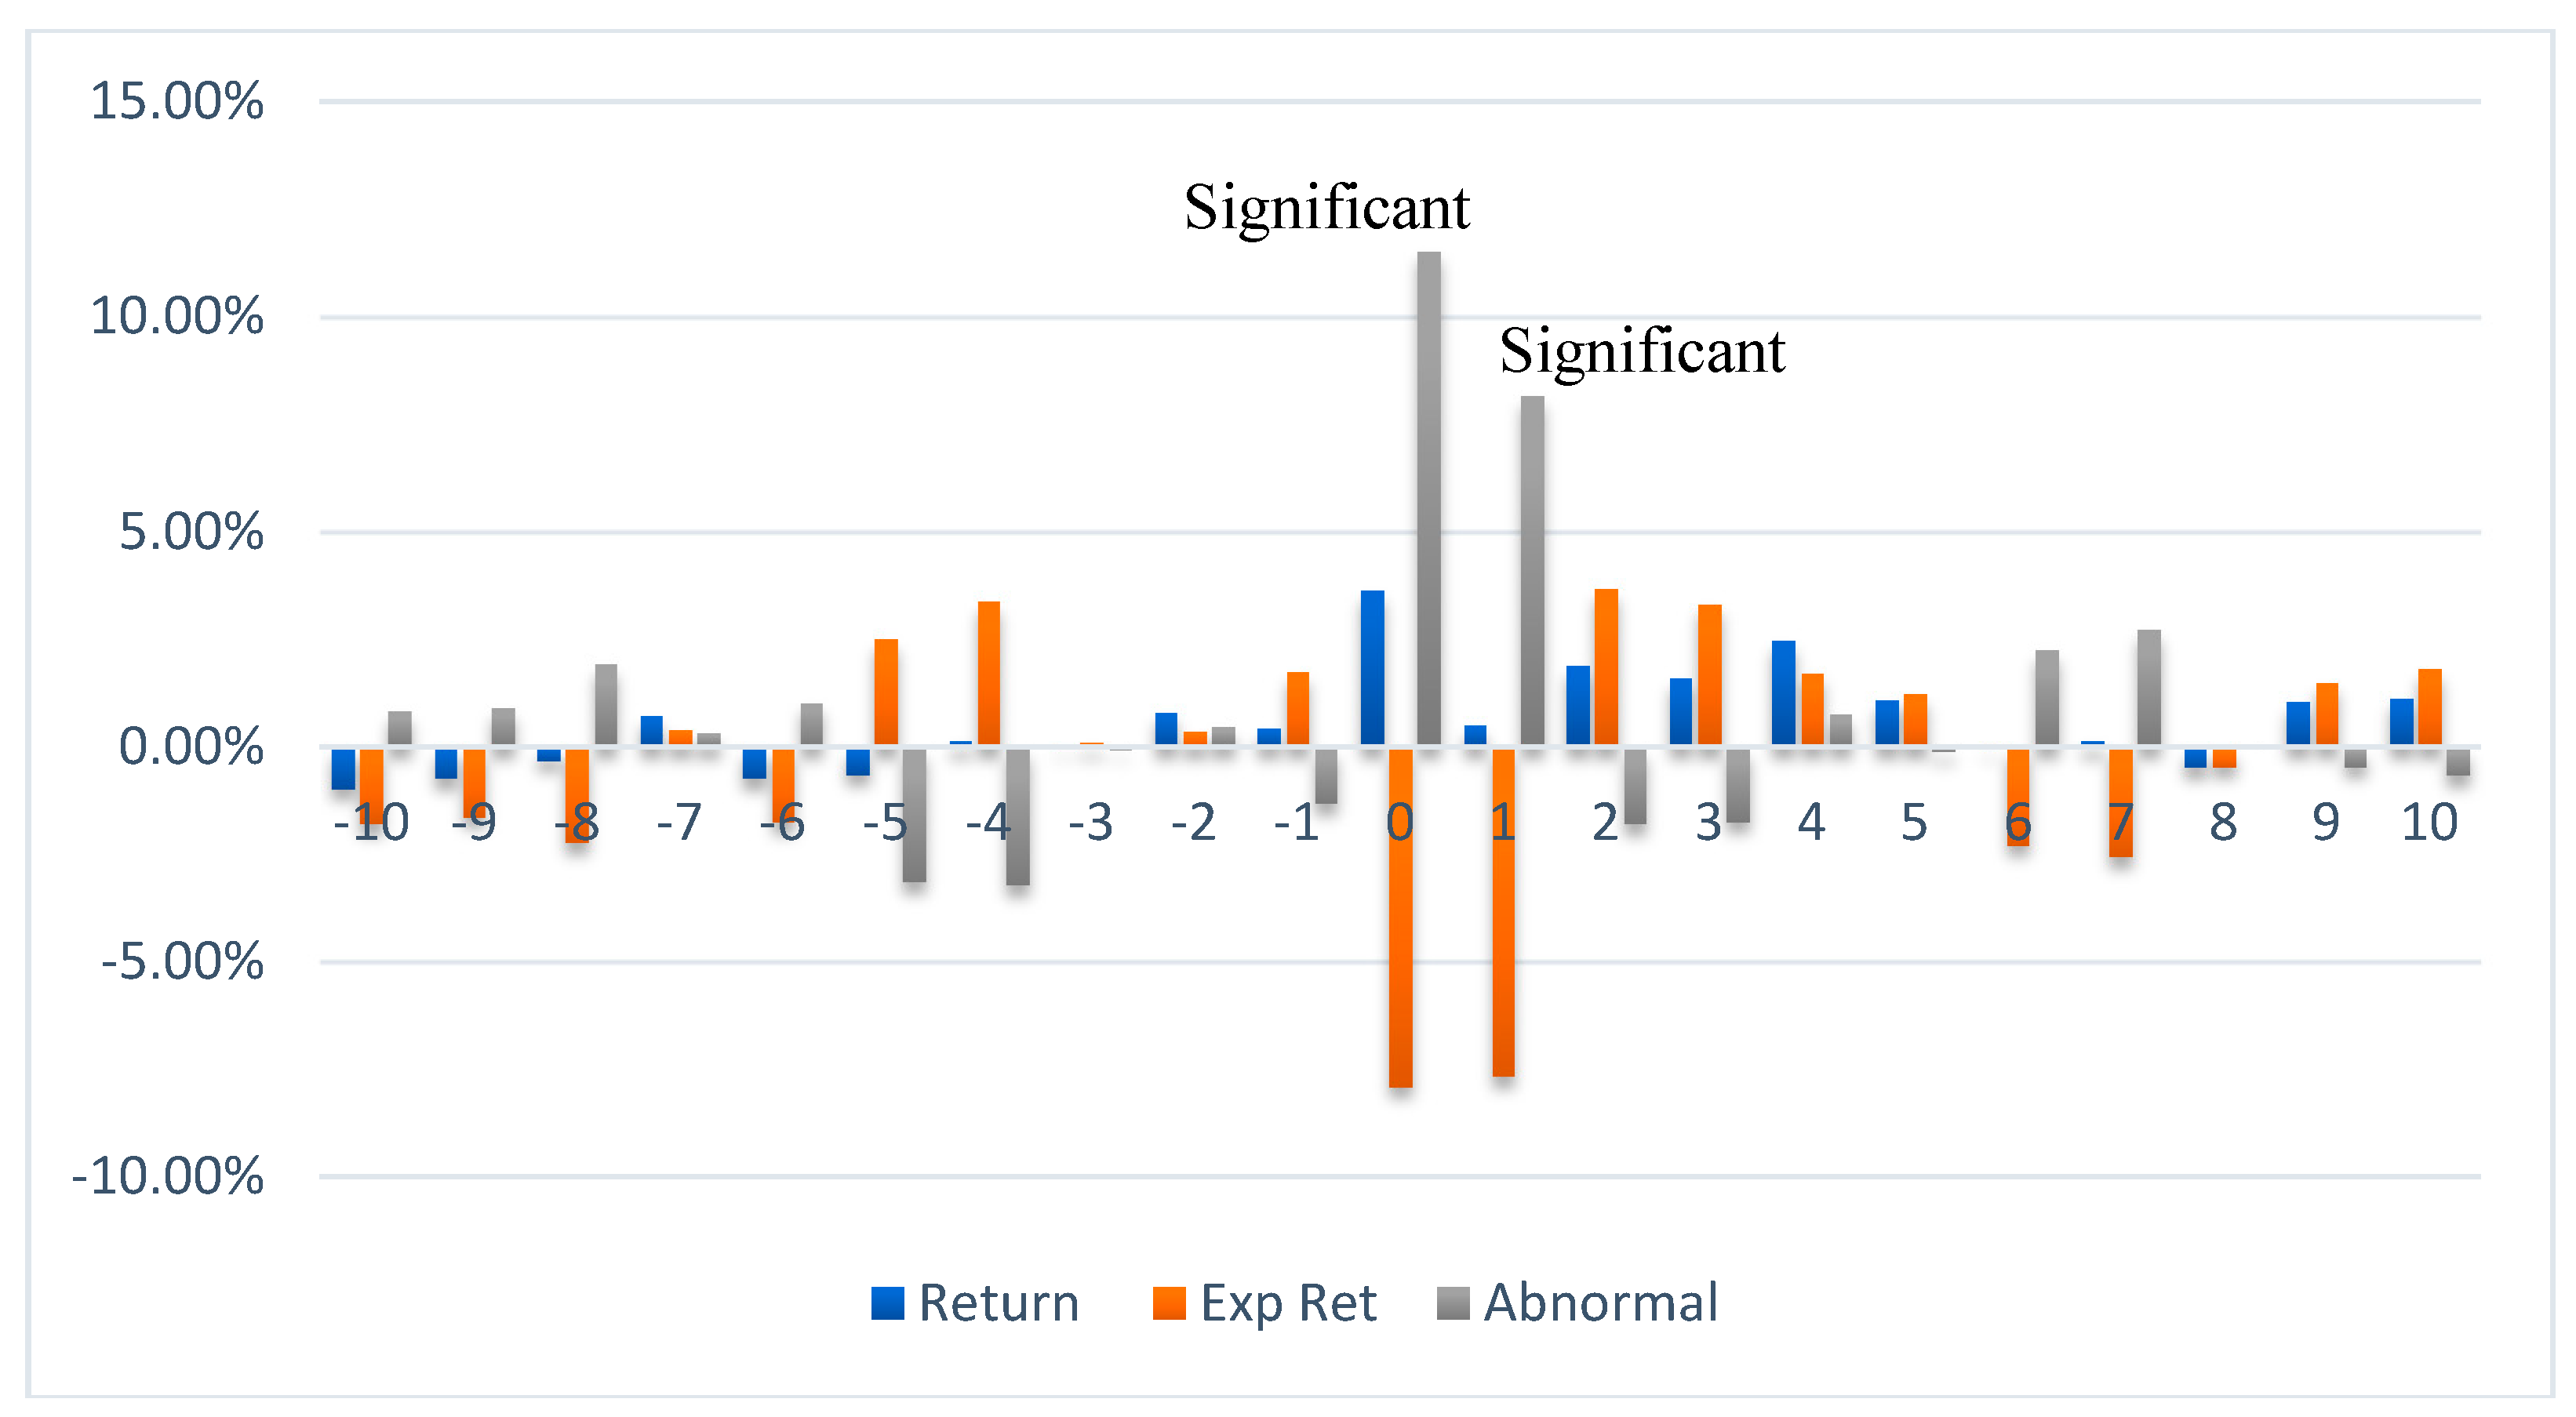
Figure 5.
Private Equity ETF.
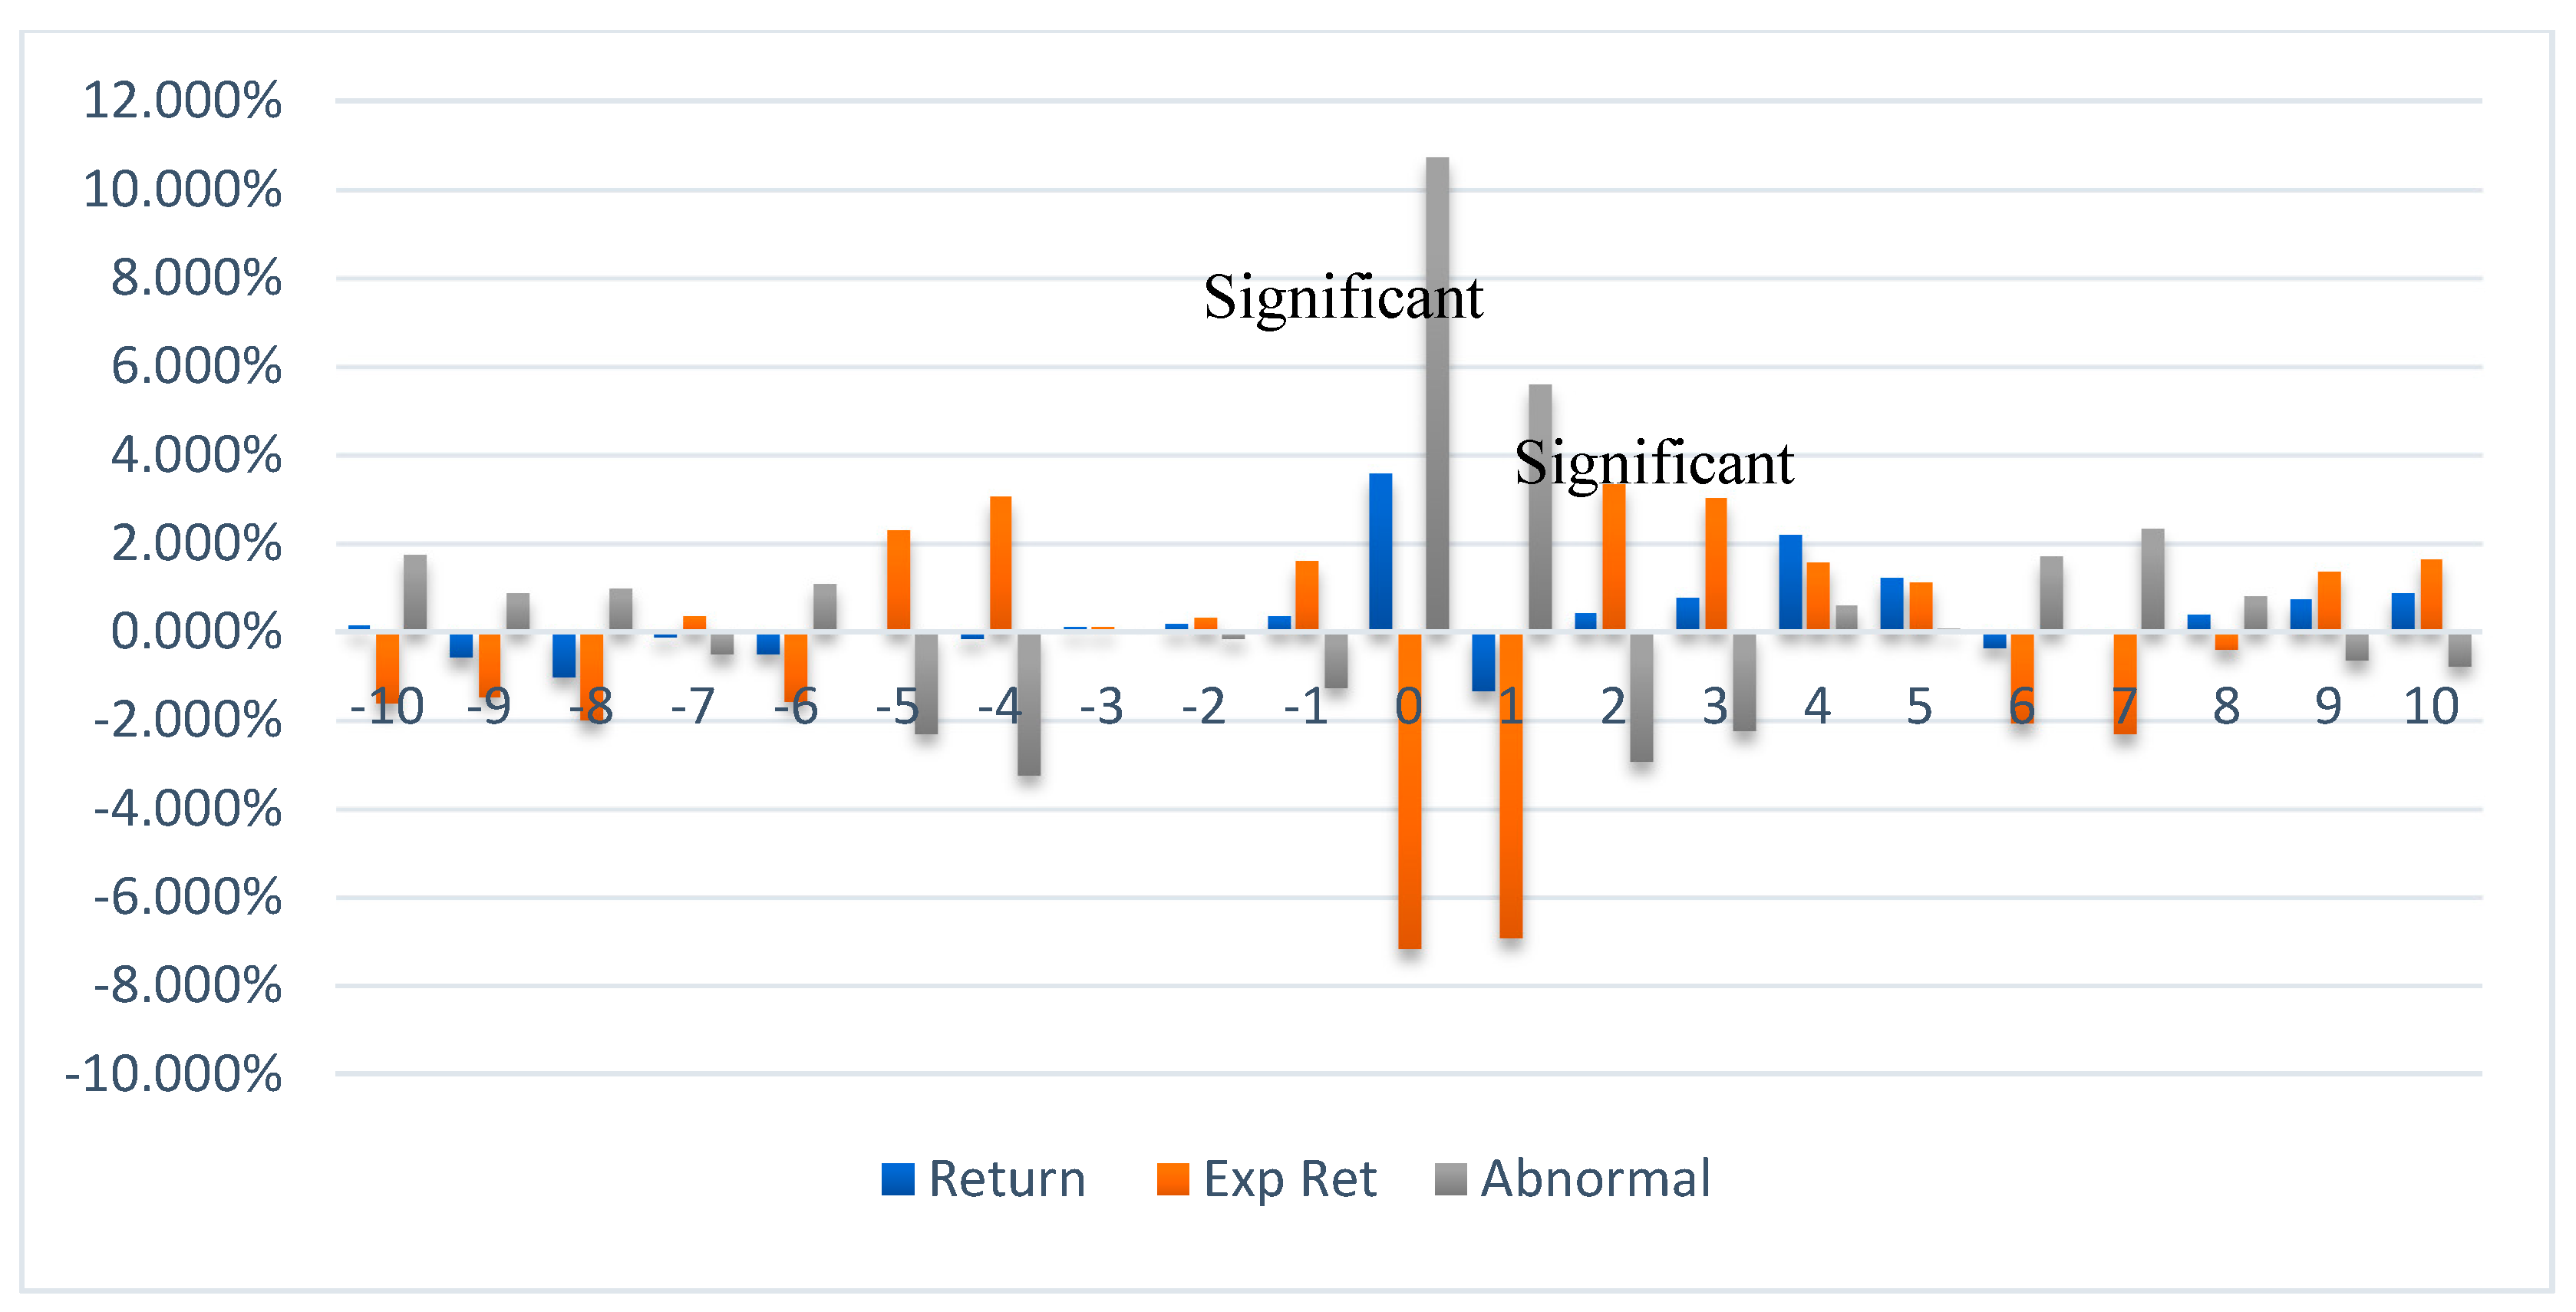
Figure 6.
US T-Bond ETF.

Figure 7.
Gold ETF.
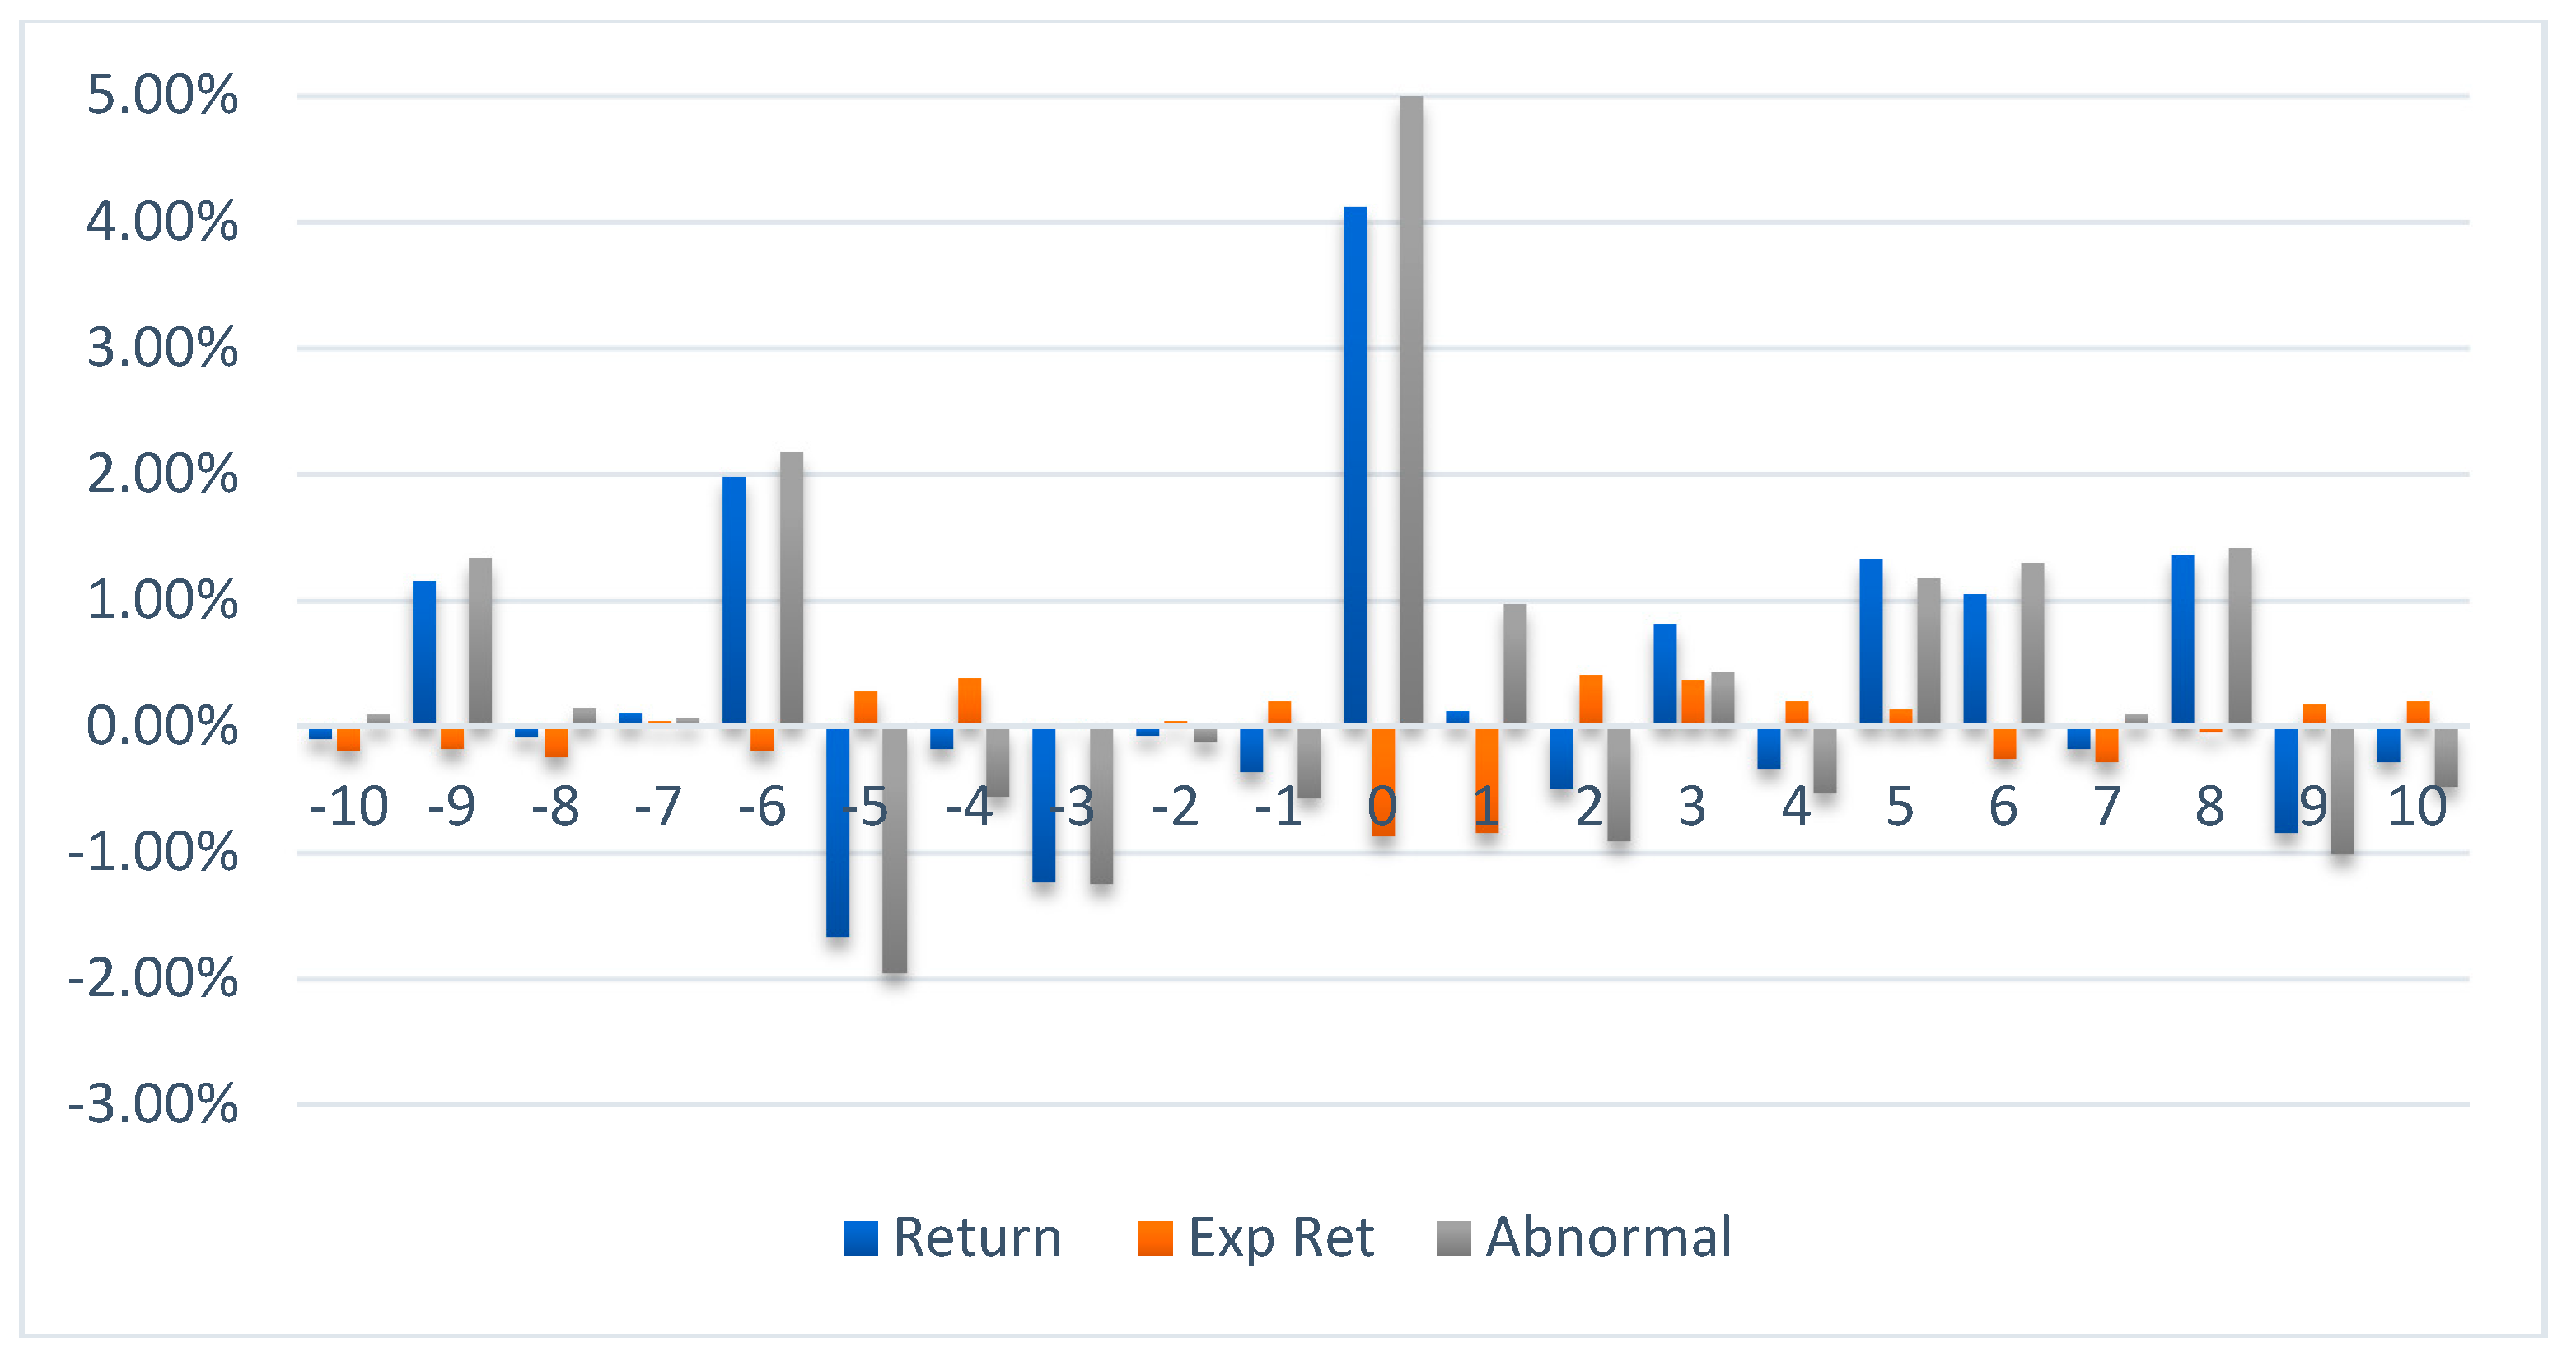
Figure 8.
Oil ETF.


Table 1.
Exchange-traded funds (ETFs) Descriptions.
| ETF | Issuer | Benchmark | Launch Date | Net Assets |
|---|---|---|---|---|
| World Equity | iShares Core MSCI World ETF | MSCI World Index | 2009 | $13.9 Billion |
| US Treasury | iShares US T-Bond 7–10 Year ETF | ICE US T-Bond 7–10 Year Bond Index | 2006 | $2.5 Billion |
| Euro Equities | iShares MSCI Europe ex-UK ETF | MSCI Europe ex-UK Index | 2006 | $2.4 Billion |
| Emerging Equities | iShares MSCI Emerging Markets ETF | MSCI Emerging Markets ETF | 2005 | $6.3 Billion |
| Private Equity | iShares Listed Private Equity ETF | S&P Listed Private Equity Index | 2007 | $460 Million |
| Gold | ETFS Physical Securities Limited | Spot Gold LMBA Specification | 2007 | |
| Oil | ETFS Commodity Securities Limited | Bloomberg Petroleum Sub index | 2006 |
Table 2.
Descriptive Statistics and Unit Root Tests.
| (1) | (2) | (3) | (4) | (5) | (6) | (7) | |
|---|---|---|---|---|---|---|---|
| Variables | N | Mean | sd | Min | Max | ADF Test | Phillips-Perron |
| FTSE | 1626 | 0.000376 | 0.00982 | −0.0746 | 0.0526 | −38.053 *** | −42.063 *** |
| World Eq | 1626 | 0.000458 | 0.00922 | −0.0498 | 0.0413 | −42.043 *** | −39.880 *** |
| S&P 500 | 1626 | 0.000523 | 0.00892 | −0.0560 | 0.0438 | −39.725 *** | −42.006 *** |
| EU Equity | 1626 | 0.000170 | 0.0121 | −0.0565 | 0.0580 | −41.922 *** | −41.190 *** |
| Emrg Equity | 1626 | 9.37 × 10⁻⁵ | 0.0124 | −0.0658 | 0.0614 | −41.201 *** | −39.071 *** |
| Private Equity | 1626 | 0.000392 | 0.0112 | −0.0555 | 0.0502 | −39.161 *** | −40.833 *** |
| US T-Bond | 1626 | 0.000237 | 0.00728 | −0.0346 | 0.0940 | −40.859 *** | −40.859 *** |
| Oil | 1626 | −0.000294 | 0.0111 | −0.187 | 0.188 | −51.426 *** | −51.426 *** |
| Gold | 1626 | 3.99 × 10⁻⁵ | 0.0108 | −0.0853 | 0.0578 | −42.525 *** | −42.525 *** |
*** p < 0.01, ** p < 0.05, * p < 0.1.
Table 3.
Correlation Matrix of Log Returns.
| Variable | FTSE | World Eq | S&P 500 | EU Equity | Emrg | Private | US T-Bond | Oil | Gold |
|---|---|---|---|---|---|---|---|---|---|
| FTSE | 1 | ||||||||
| World Eq | 0.757 | 1 | |||||||
| S&P 500 | −0.006 | 0.002 | 1 | ||||||
| EU Equity | 0.793 | 0.865 | 0.004 | 1 | |||||
| Emrg Equity | 0.710 | 0.854 | 0.003 | 0.768 | 1 | ||||
| Private Equity | 0.744 | 0.882 | 0.001 | 0.771 | 0.772 | 1 | |||
| US T-Bond | −0.468 | −0.129 | −0.036 | −0.315 | −0.173 | −0.154 | 1 | ||
| Oil | 0.380 | 0.333 | −0.003 | 0.369 | 0.396 | 0.324 | −0.342 | 1 | |
| Gold | 0.072 | 0.028 | −0.046 | 0.087 | 0.155 | 0.025 | −0.079 | 0.370 | 1 |
Table 4.
Regression Models-Equity Funds.
| World Equity | World Equity | S&P Core | EU Equity | EU Equity | Emerging Equity | |
|---|---|---|---|---|---|---|
| (1) | (2) | (3) | (4) | (5) | (6) | |
| Variables | OLS | Prais | OLS | OLS | Newey-West | OLS |
| FTSE Return | 0.802 *** | 0.799 *** | −0.00836 | 1.057 *** | 1.057 *** | 0.991 *** |
| (0.0138) | (0.0135) | (0.0232) | (0.0184) | (0.0244) | (0.0211) | |
| Constant | 6.59 × 10⁻⁵ | 6.49 × 10⁻⁵ | 0.000526 ** | −0.000295 * | −0.000295 * | −0.000419 ** |
| (0.000132) | (0.000118) | (0.000223) | (0.000176) | (0.000177) | (0.000202) | |
| Observations | 1624 | 1623 | 1624 | 1624 | 1624 | 1624 |
| R-squared | 0.675 | 0.684 | 0.000 | 0.671 | 0.671 | 0.577 |
| DW Stat | 2.224 | 2.020 | 1.959 | 2.131 | 2.051 | |
| Hetero Prob | 0.763 | 0.0983 | 0.000 | 0.780 |
Standard errors in parentheses: *** p < 0.01, ** p < 0.05, * p < 0.1.
Table 5.
Regression Models- Private Equity, US T-Bond, and Commodity Funds.
| Private Equity | Private Equity | US T-Bond | Gold | Gold | Oil | Oil | |
|---|---|---|---|---|---|---|---|
| (1) | (2) | (3) | (4) | (5) | (6) | (7) | |
| Variables | OLS | Prais | OLS | OLS | Robust | OLS | Newey-West |
| FTSE Return | 0.953 *** | 0.959 *** | −0.288 *** | 0.117 *** | 0.117 *** | 0.458 *** | 0.458 *** |
| (0.0182) | (0.0179) | (0.0159) | (0.0284) | (0.0399) | (0.0275) | (0.0287) | |
| Constant | −8.46 × 10⁻⁵ | −9.54 × 10⁻⁵ | 0.000304 ** | 1.90 × 10⁻⁵ | 1.90 × 10⁻⁵ | −0.000477 * | −0.000477 * |
| (0.000174) | (0.000161) | (0.000152) | (0.000272) | (0.000275) | (0.000263) | (0.000260) | |
| Observations | 1624 | 1623 | 1624 | 1624 | 1624 | 1624 | 1624 |
| R-squared | 0.629 | 0.639 | 0.168 | 0.010 | 0.010 | 0.146 | |
| DW Stat | 2.156 | 2.011 | 1.988 | 2.004 | 2.460 | ||
| Hetero Prob | 0.088 | 0.674 | 0.000 | 0.000 |
Standard errors in parentheses: *** p < 0.01, ** p < 0.05, * p < 0.1.
Table 6.
Significant Abnormal Returns—percentages.
| Days −5 | Days −4 | Days 0 | Days +1 | Days +7 | |||||||||||
|---|---|---|---|---|---|---|---|---|---|---|---|---|---|---|---|
| R | E (R) | AR | R | E (R) | AR | R | E (R) | AR | R | E (R) | AR | R | E (R) | AR | |
| World Equity | −0.80 | 2 | −2.80 | −0.25 | 2.80 | −3.05 | 4 | −6 | 10 | −0.05 | 5.85 | −5.90 | 1 | −2 | 3 |
| EU Equity | −0.55 | −8 | 7.45 | −0.65 | −7.80 | 7.15 | |||||||||
| Emerging Equity | 3.60 | −7.80 | 11.40 | 0.50 | −7.70 | 8.20 | |||||||||
| Private Equity | 3.80 | −7.30 | 11.10 | −1.10 | −7 | 5.80 | |||||||||
| US T-Bond | 9.30 | 2.10 | 7.20 | ||||||||||||
© 2018 by the authors. Licensee MDPI, Basel, Switzerland. This article is an open access article distributed under the terms and conditions of the Creative Commons Attribution (CC BY) license (http://creativecommons.org/licenses/by/4.0/).
Share and Cite
MDPI and ACS Style
Alkhatib, A.; Harasheh, M. Performance of Exchange Traded Funds during the Brexit Referendum: An Event Study. Int. J. Financial Stud. 2018, 6, 64. https://doi.org/10.3390/ijfs6030064
AMA Style
Alkhatib A, Harasheh M. Performance of Exchange Traded Funds during the Brexit Referendum: An Event Study. International Journal of Financial Studies. 2018; 6(3):64. https://doi.org/10.3390/ijfs6030064
Chicago/Turabian StyleAlkhatib, Akram, and Murad Harasheh. 2018. "Performance of Exchange Traded Funds during the Brexit Referendum: An Event Study" International Journal of Financial Studies 6, no. 3: 64. https://doi.org/10.3390/ijfs6030064
Note that from the first issue of 2016, this journal uses article numbers instead of page numbers. See further details here.