Estimating Potential Methane Emission from Municipal Solid Waste and a Site Suitability Analysis of Existing Landfills in Delhi, India

Abstract
:1. Introduction
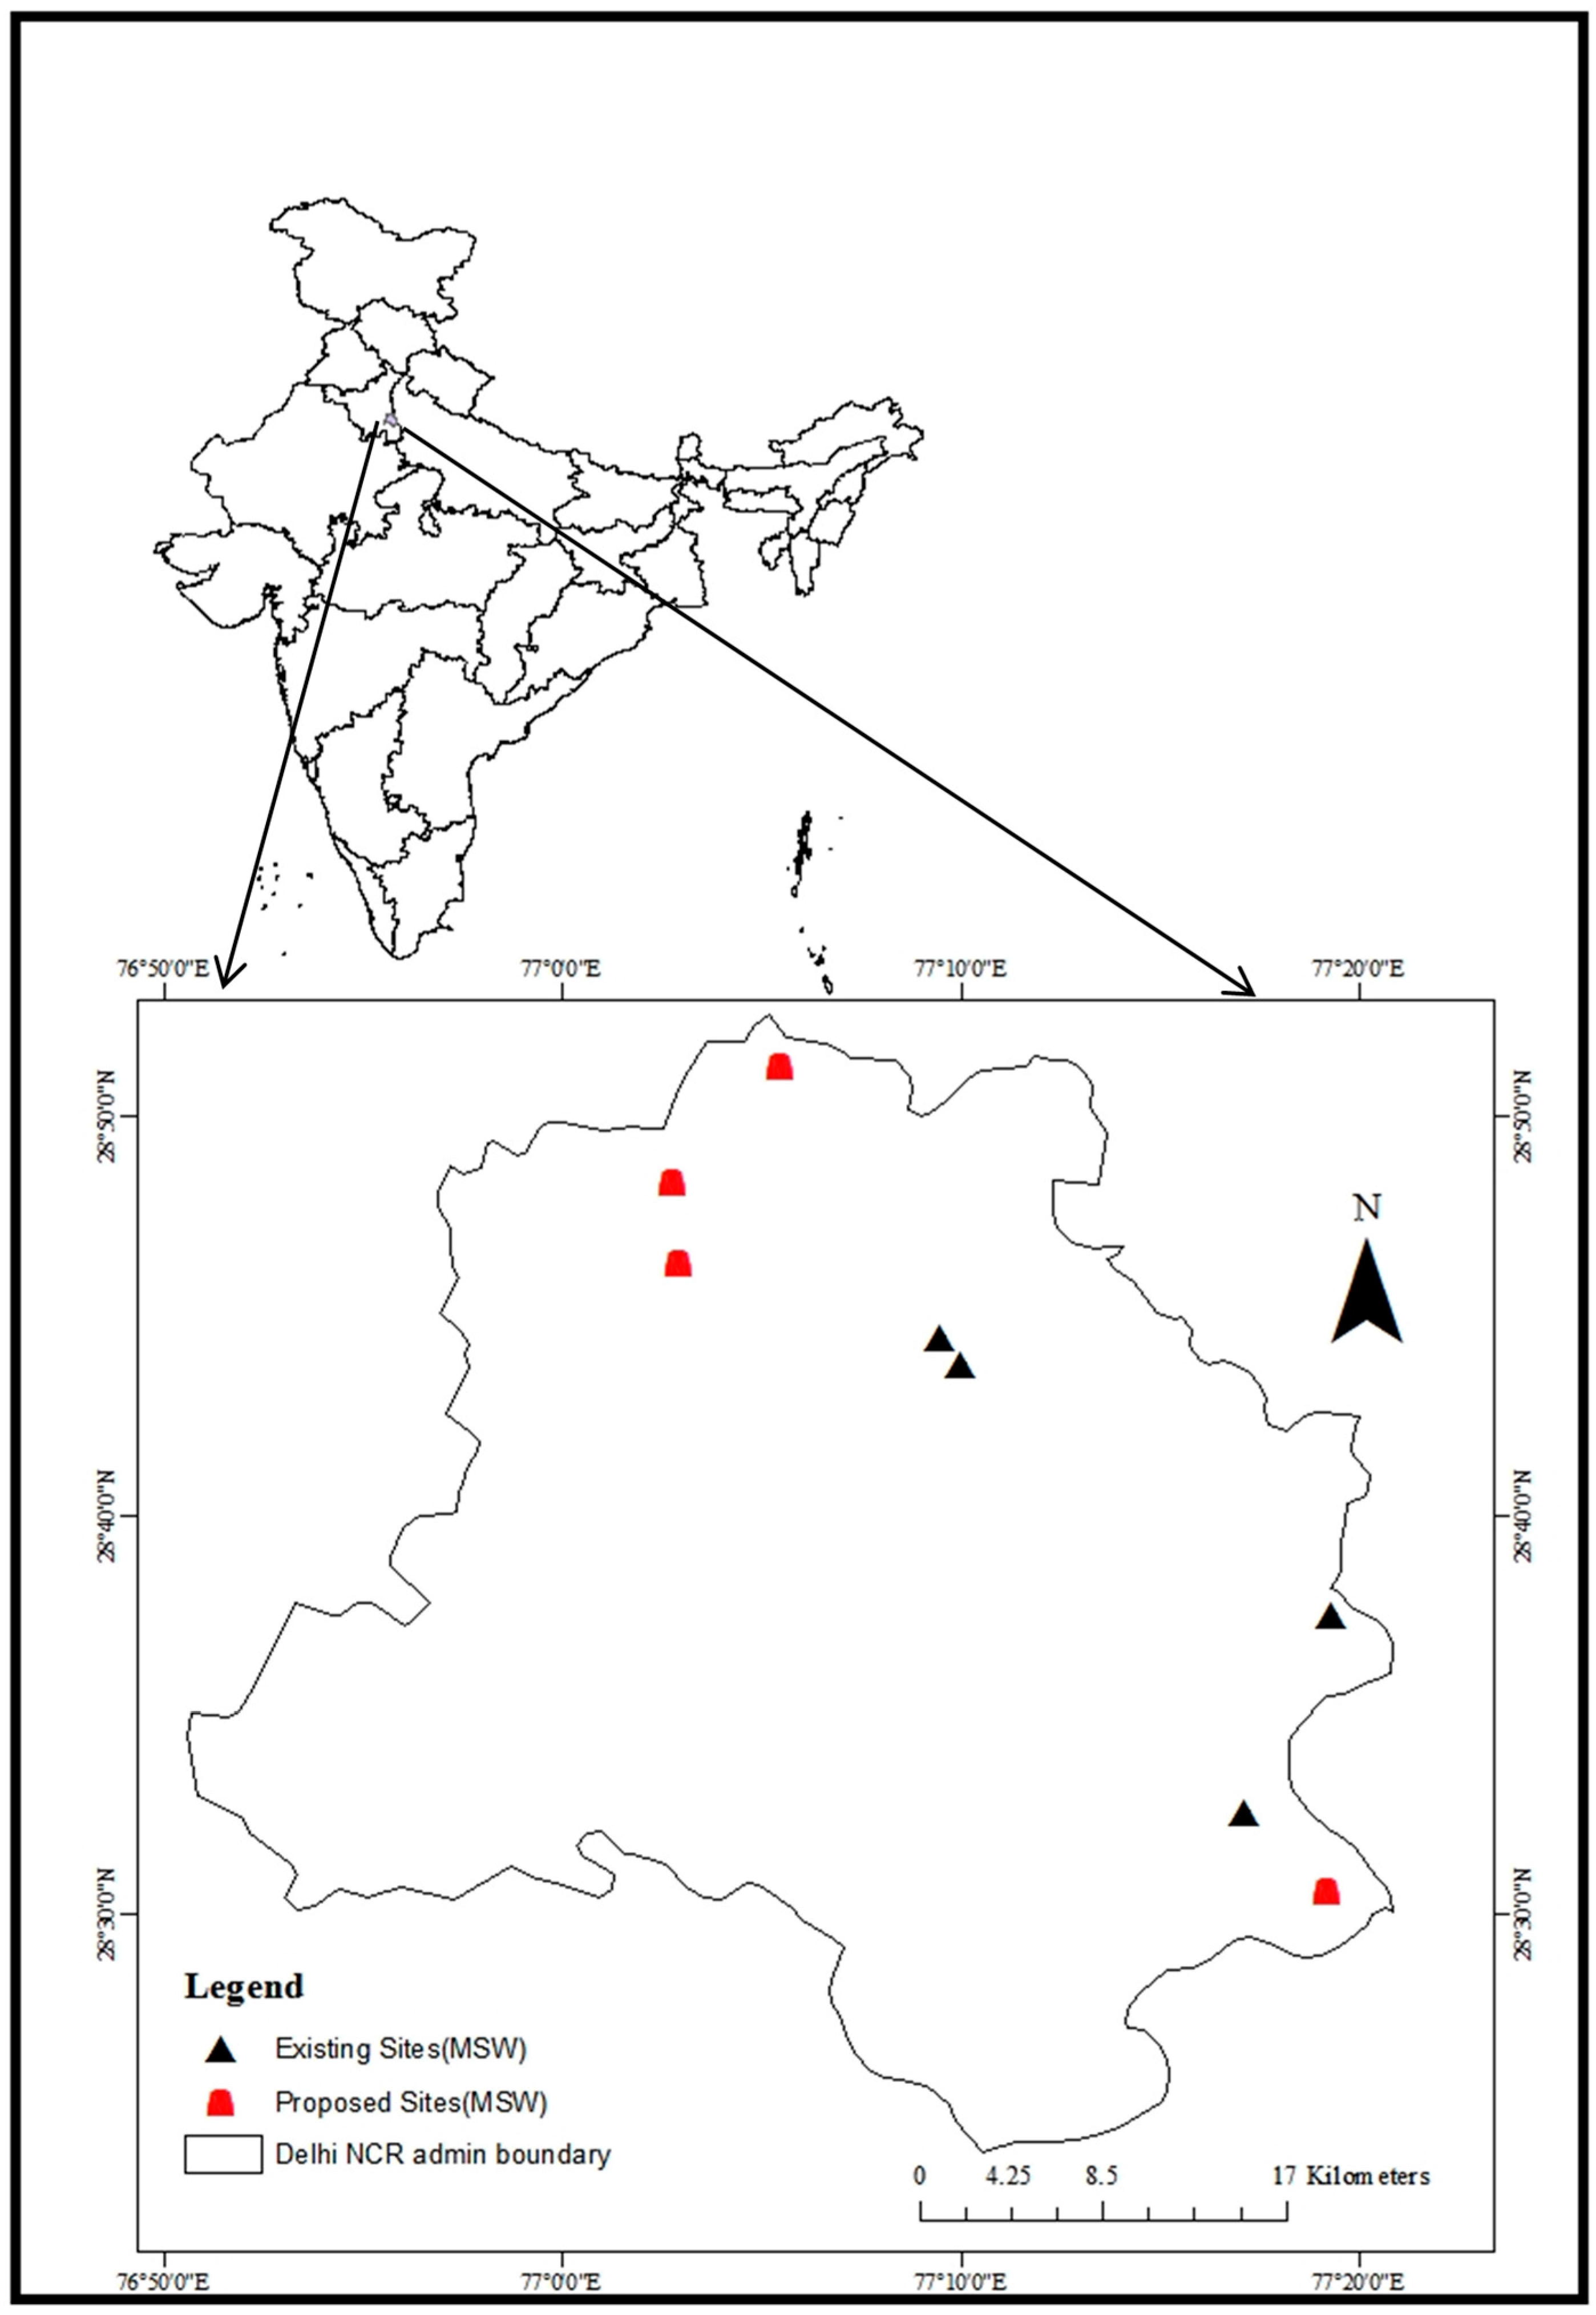
2. Study Area
2.1. Geographical Location
2.2. Status of Municipal Authority in Delhi
3. Methodology
3.1. Landfill Site Suitability
3.2. Estimation of CH4 from Landfill
- (1)
- Uncertainty in the model: The modified methodology assumes that the waste disposal is not incremental, i.e., a constant amount is added each year and the methane emission accounts for the same year. Thus, temporal increment at the landfills is not accounted for in calculation; therefore, the methane emission is overestimated. The amount of waste disposed is a highly sensitive parameter in default methodology.
- (2)
- Uncertainty in the data used in the model: The data required for the estimation of methane emission might have uncertainties. In this methodology, uncertainties in the estimates of MSWT and MSWF would be responsible for higher uncertainties in the total methane emission estimates. The model is also sensitive to parameters such as waste composition; DOC content is sensitive to small variations in the assumed values of DOC, which thus change the overall methane emission.
4. Results and Discussion
4.1. Site Suitability of Landfills
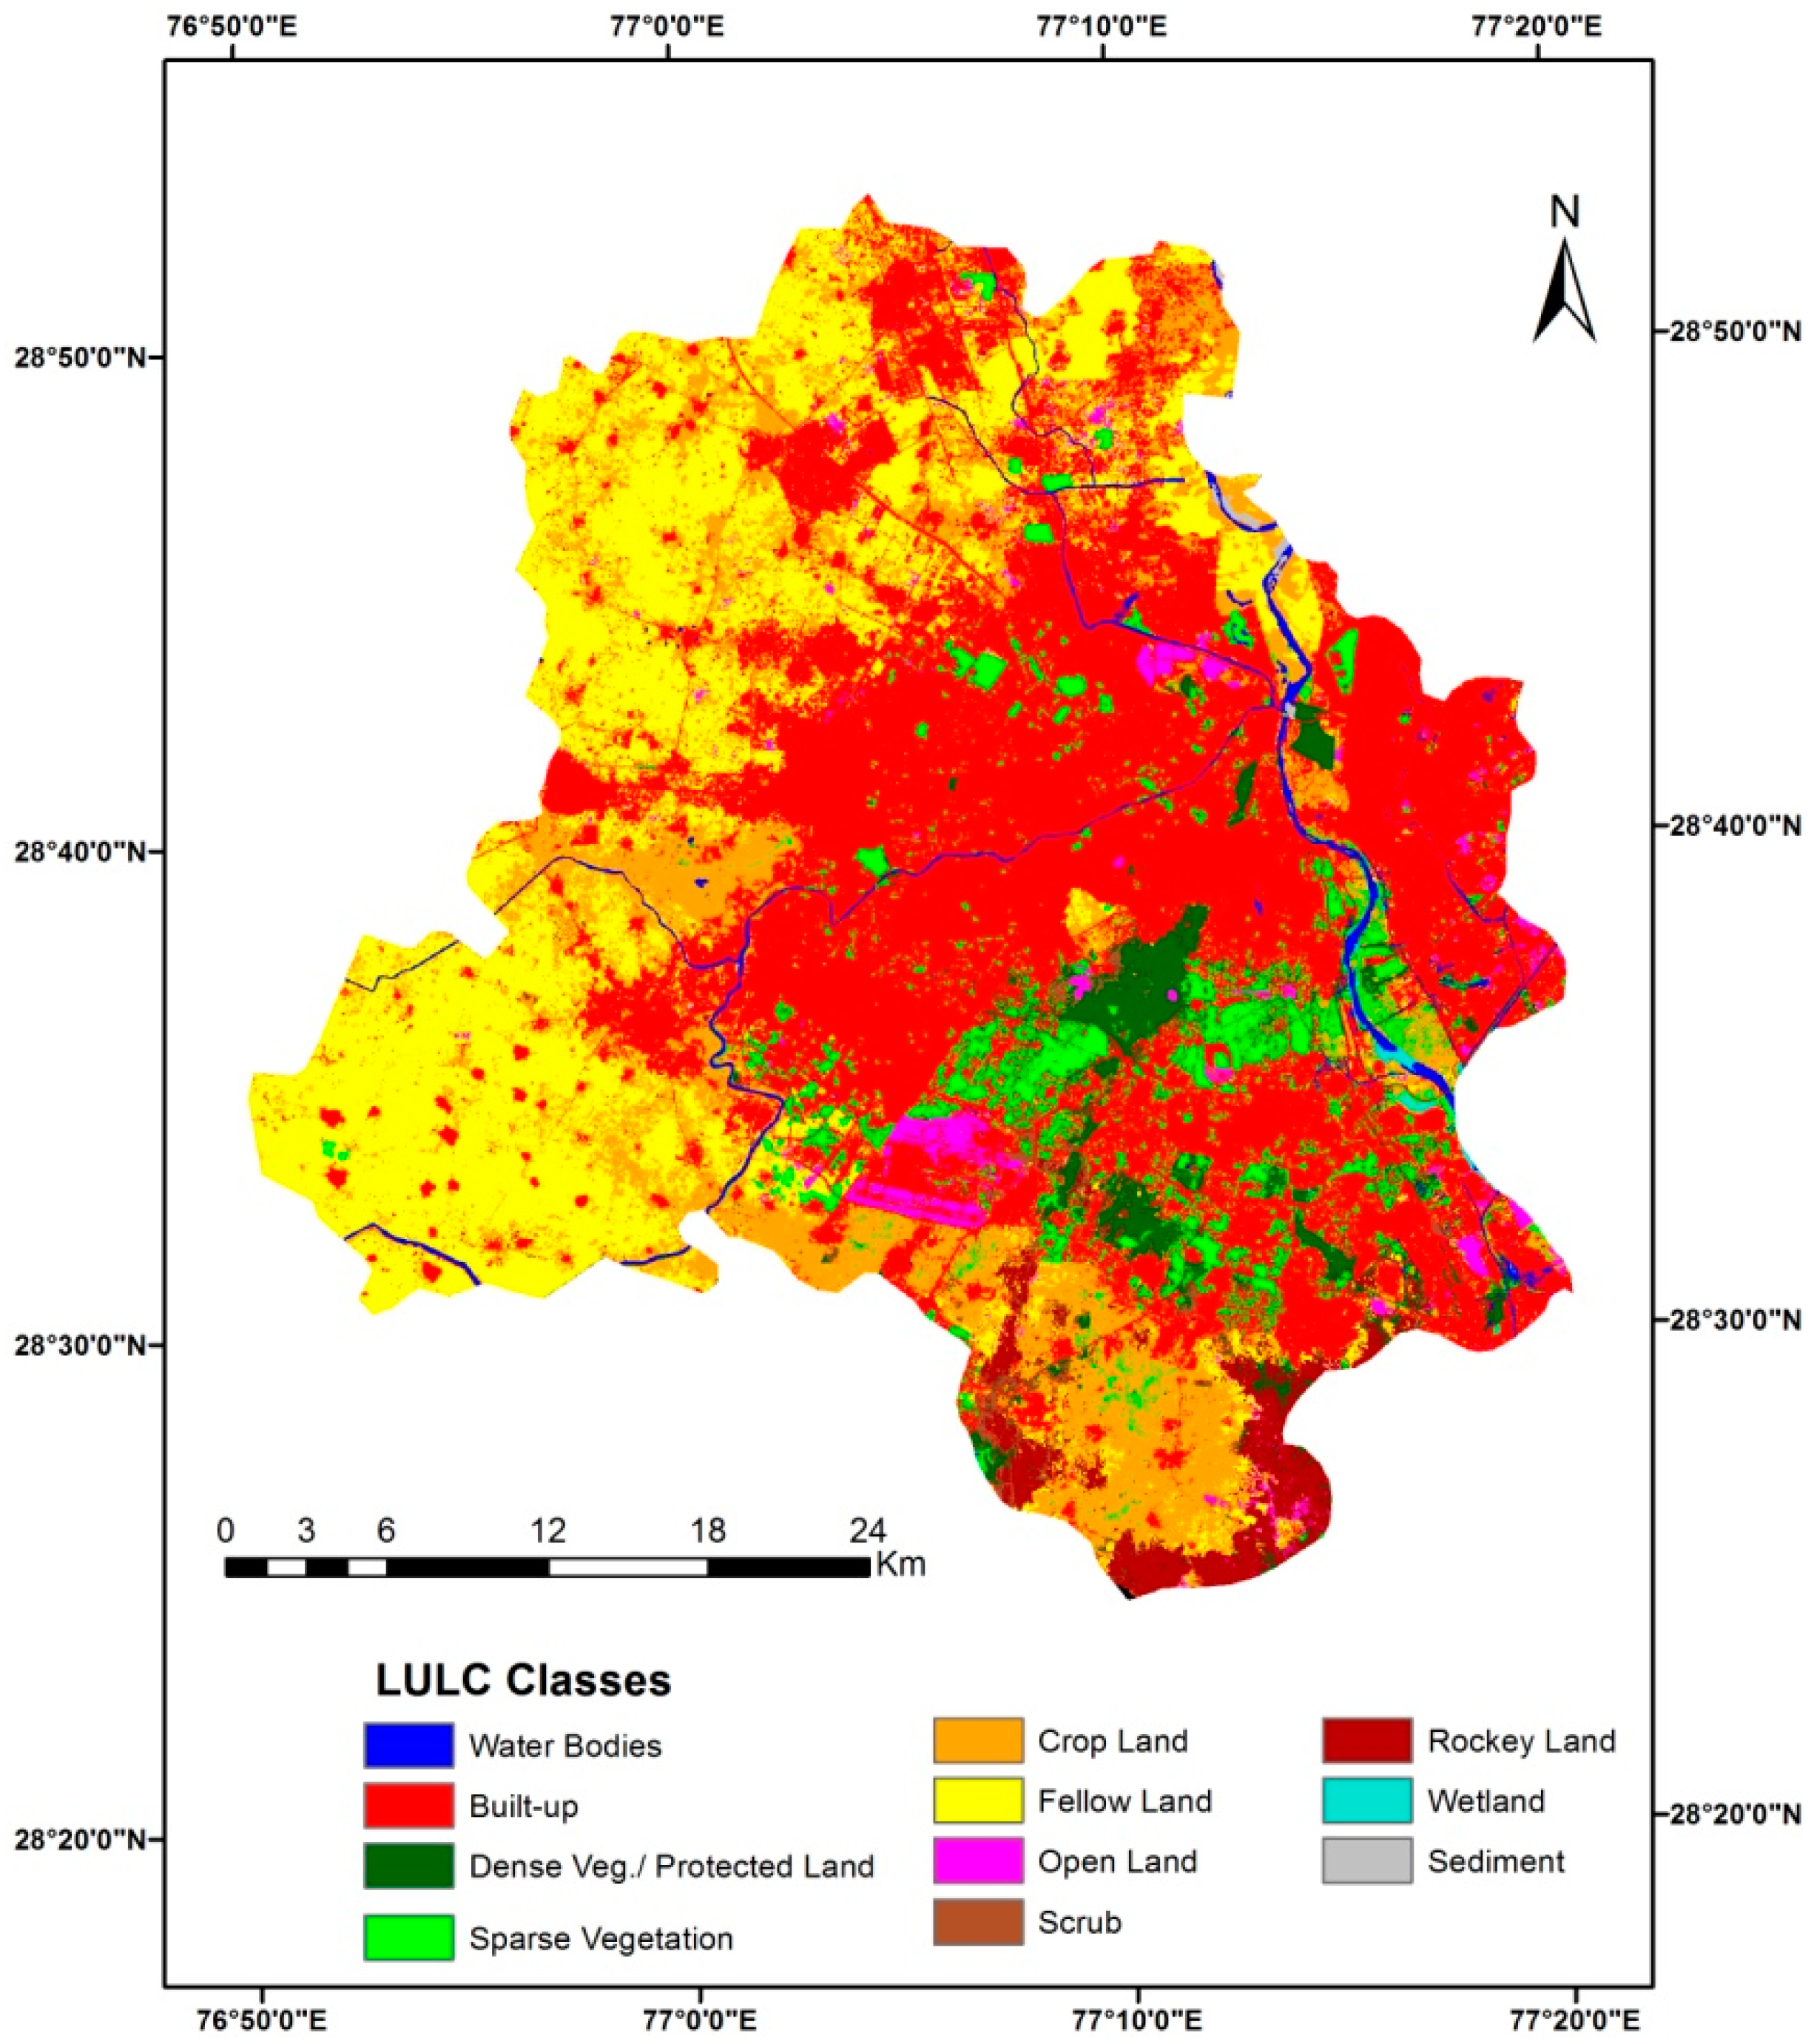
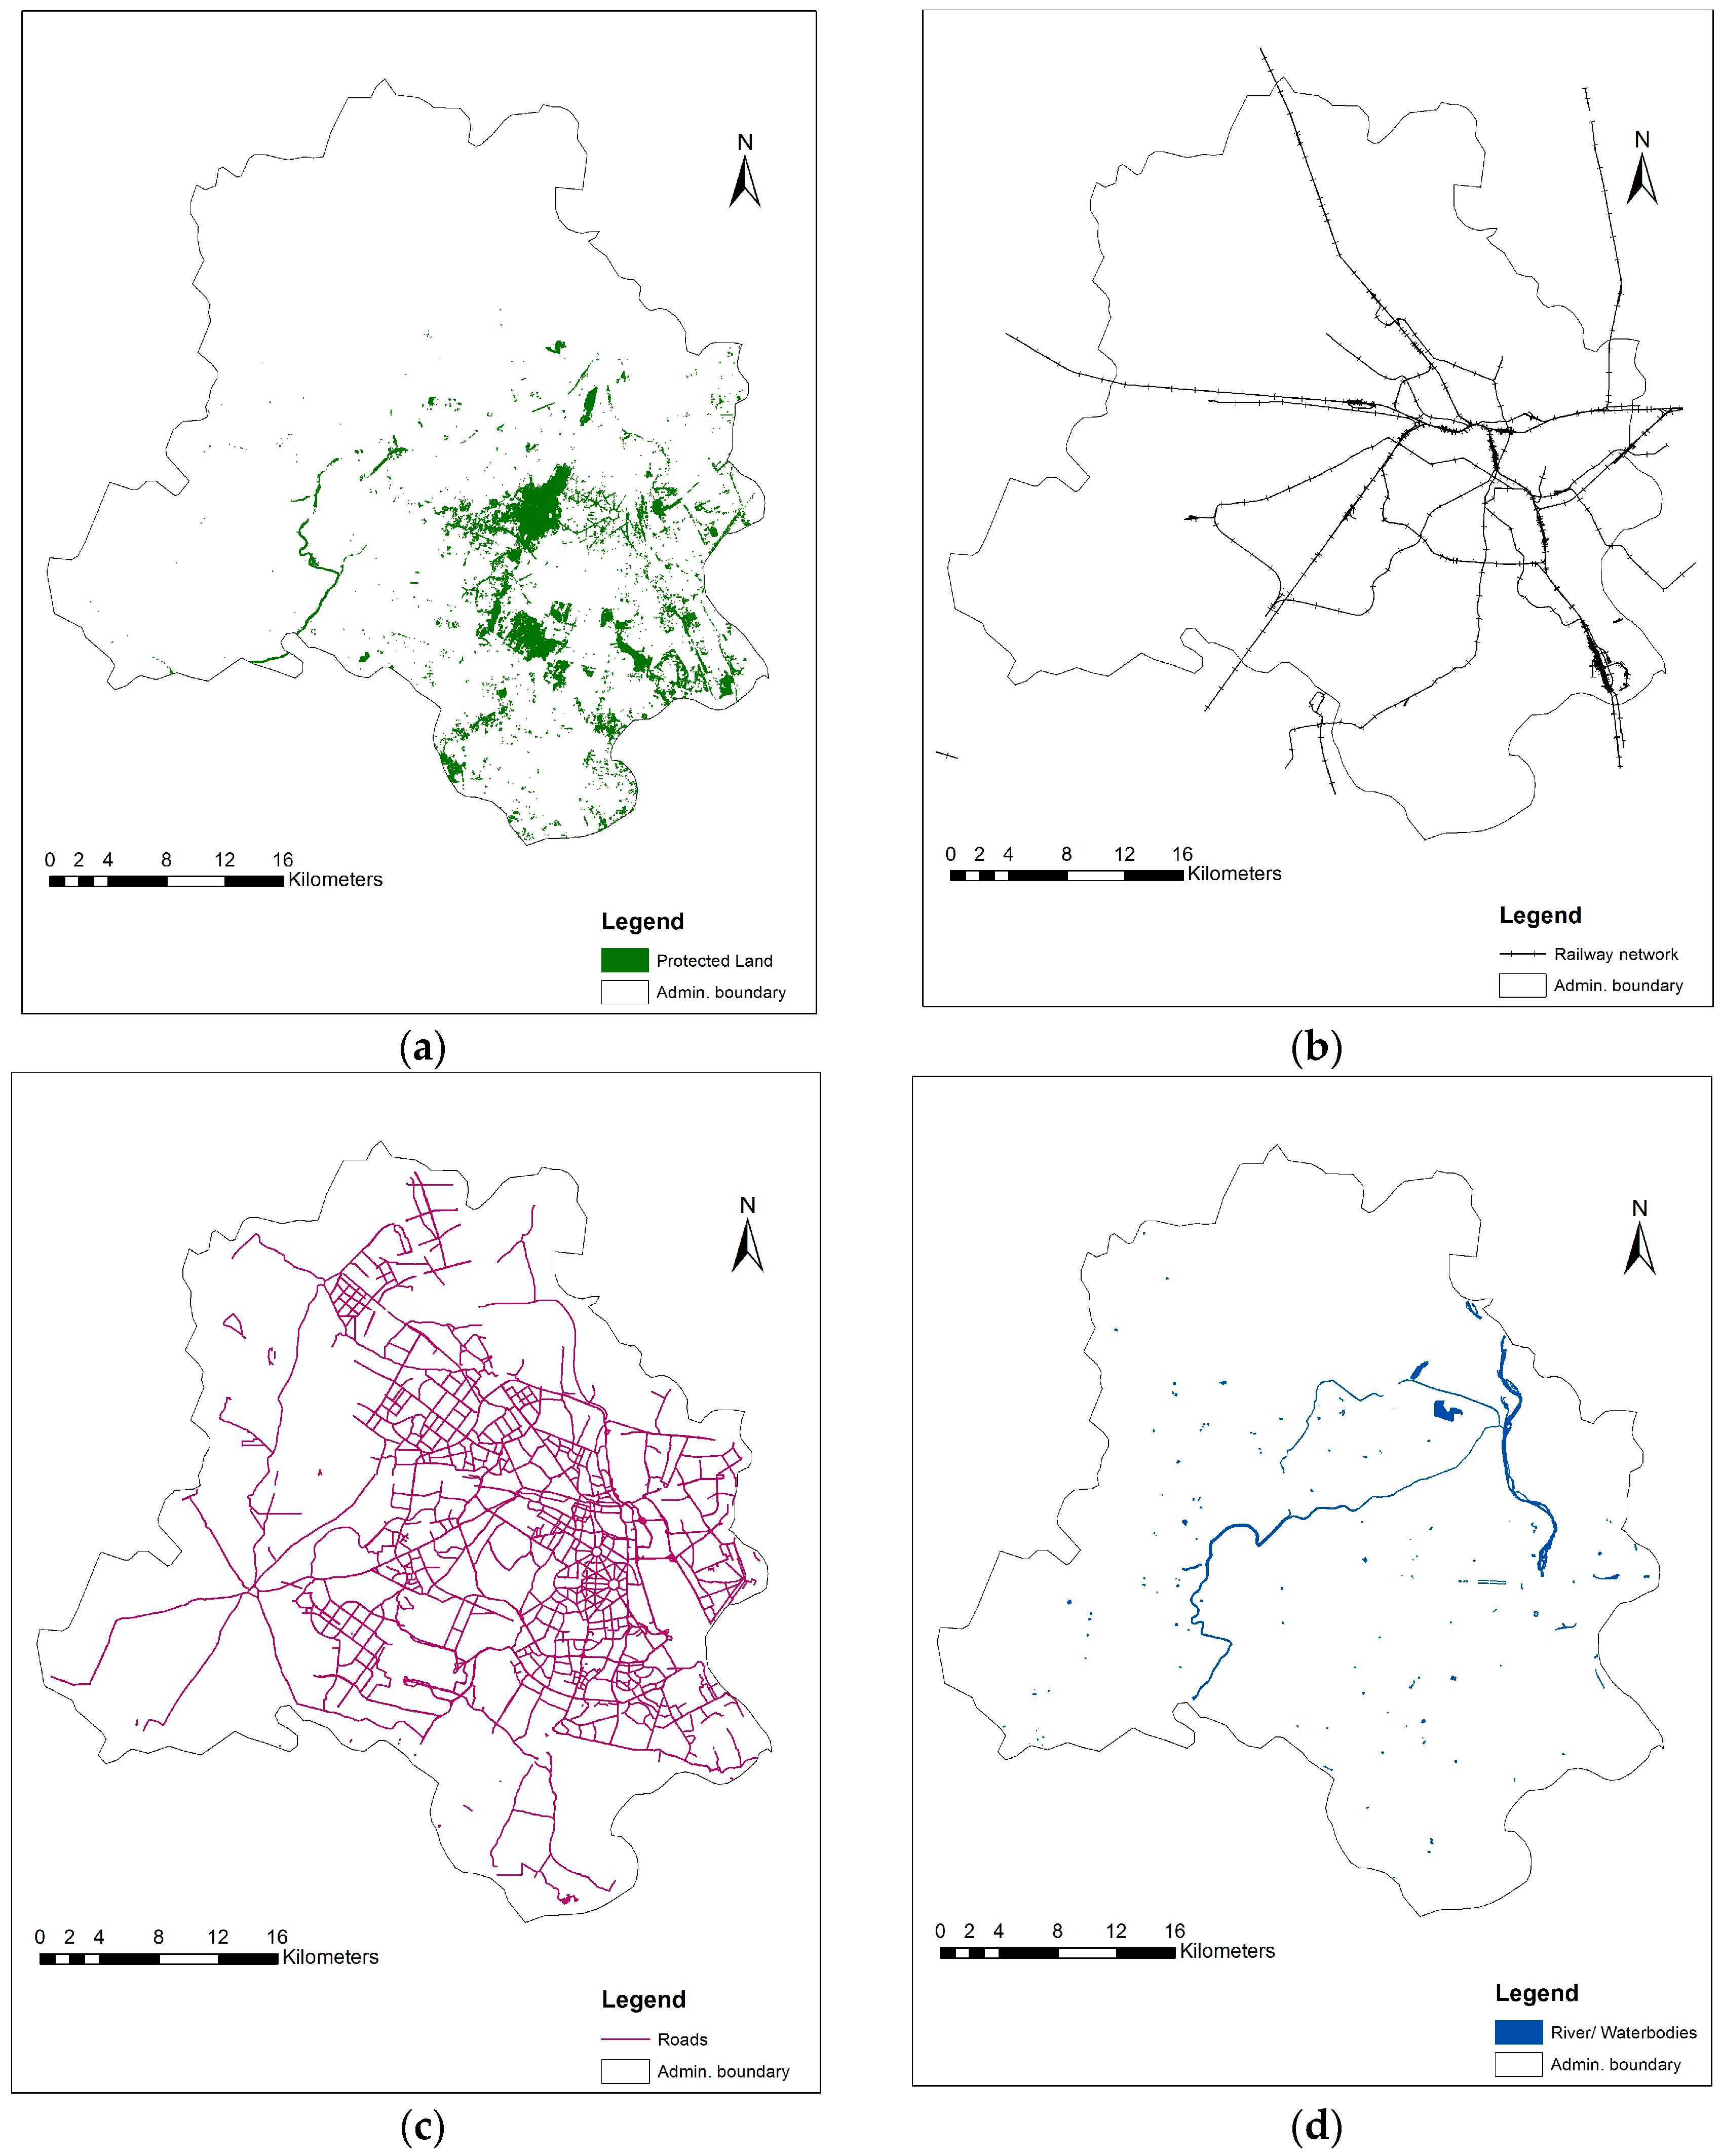
4.1.1. Land Use/Land Cover (LULC)
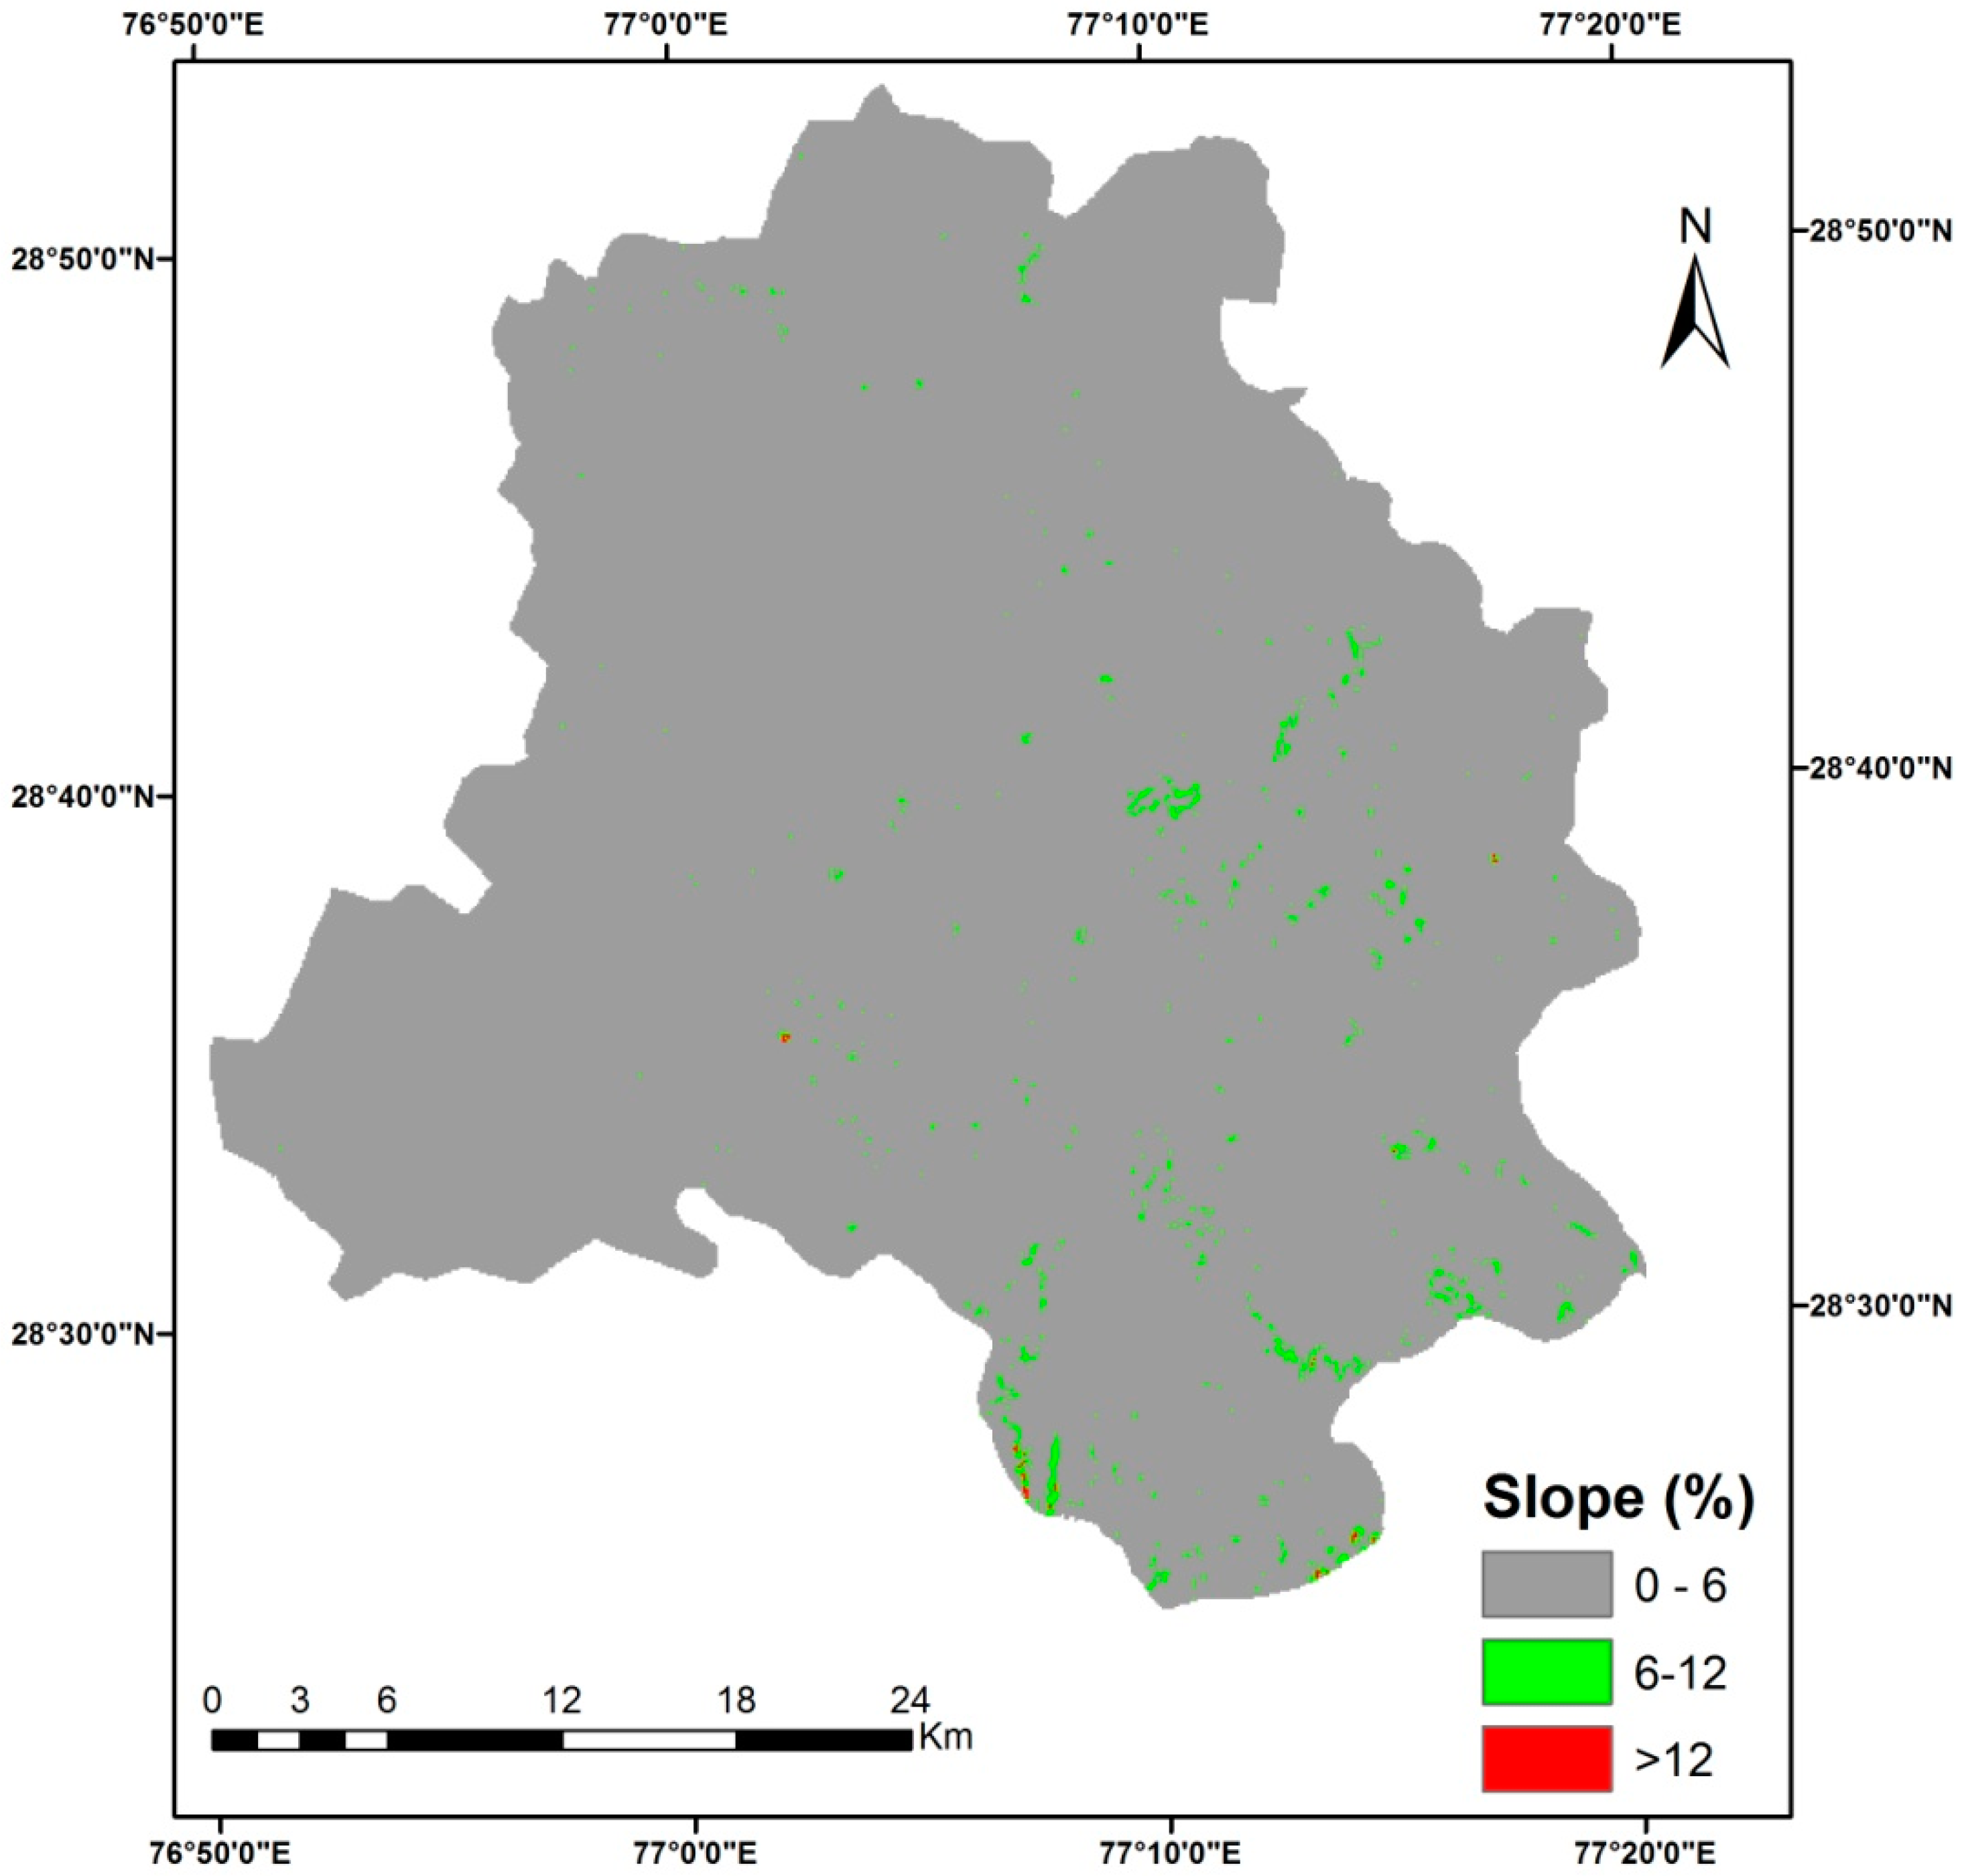
4.1.2. Slope and Soil Characteristics
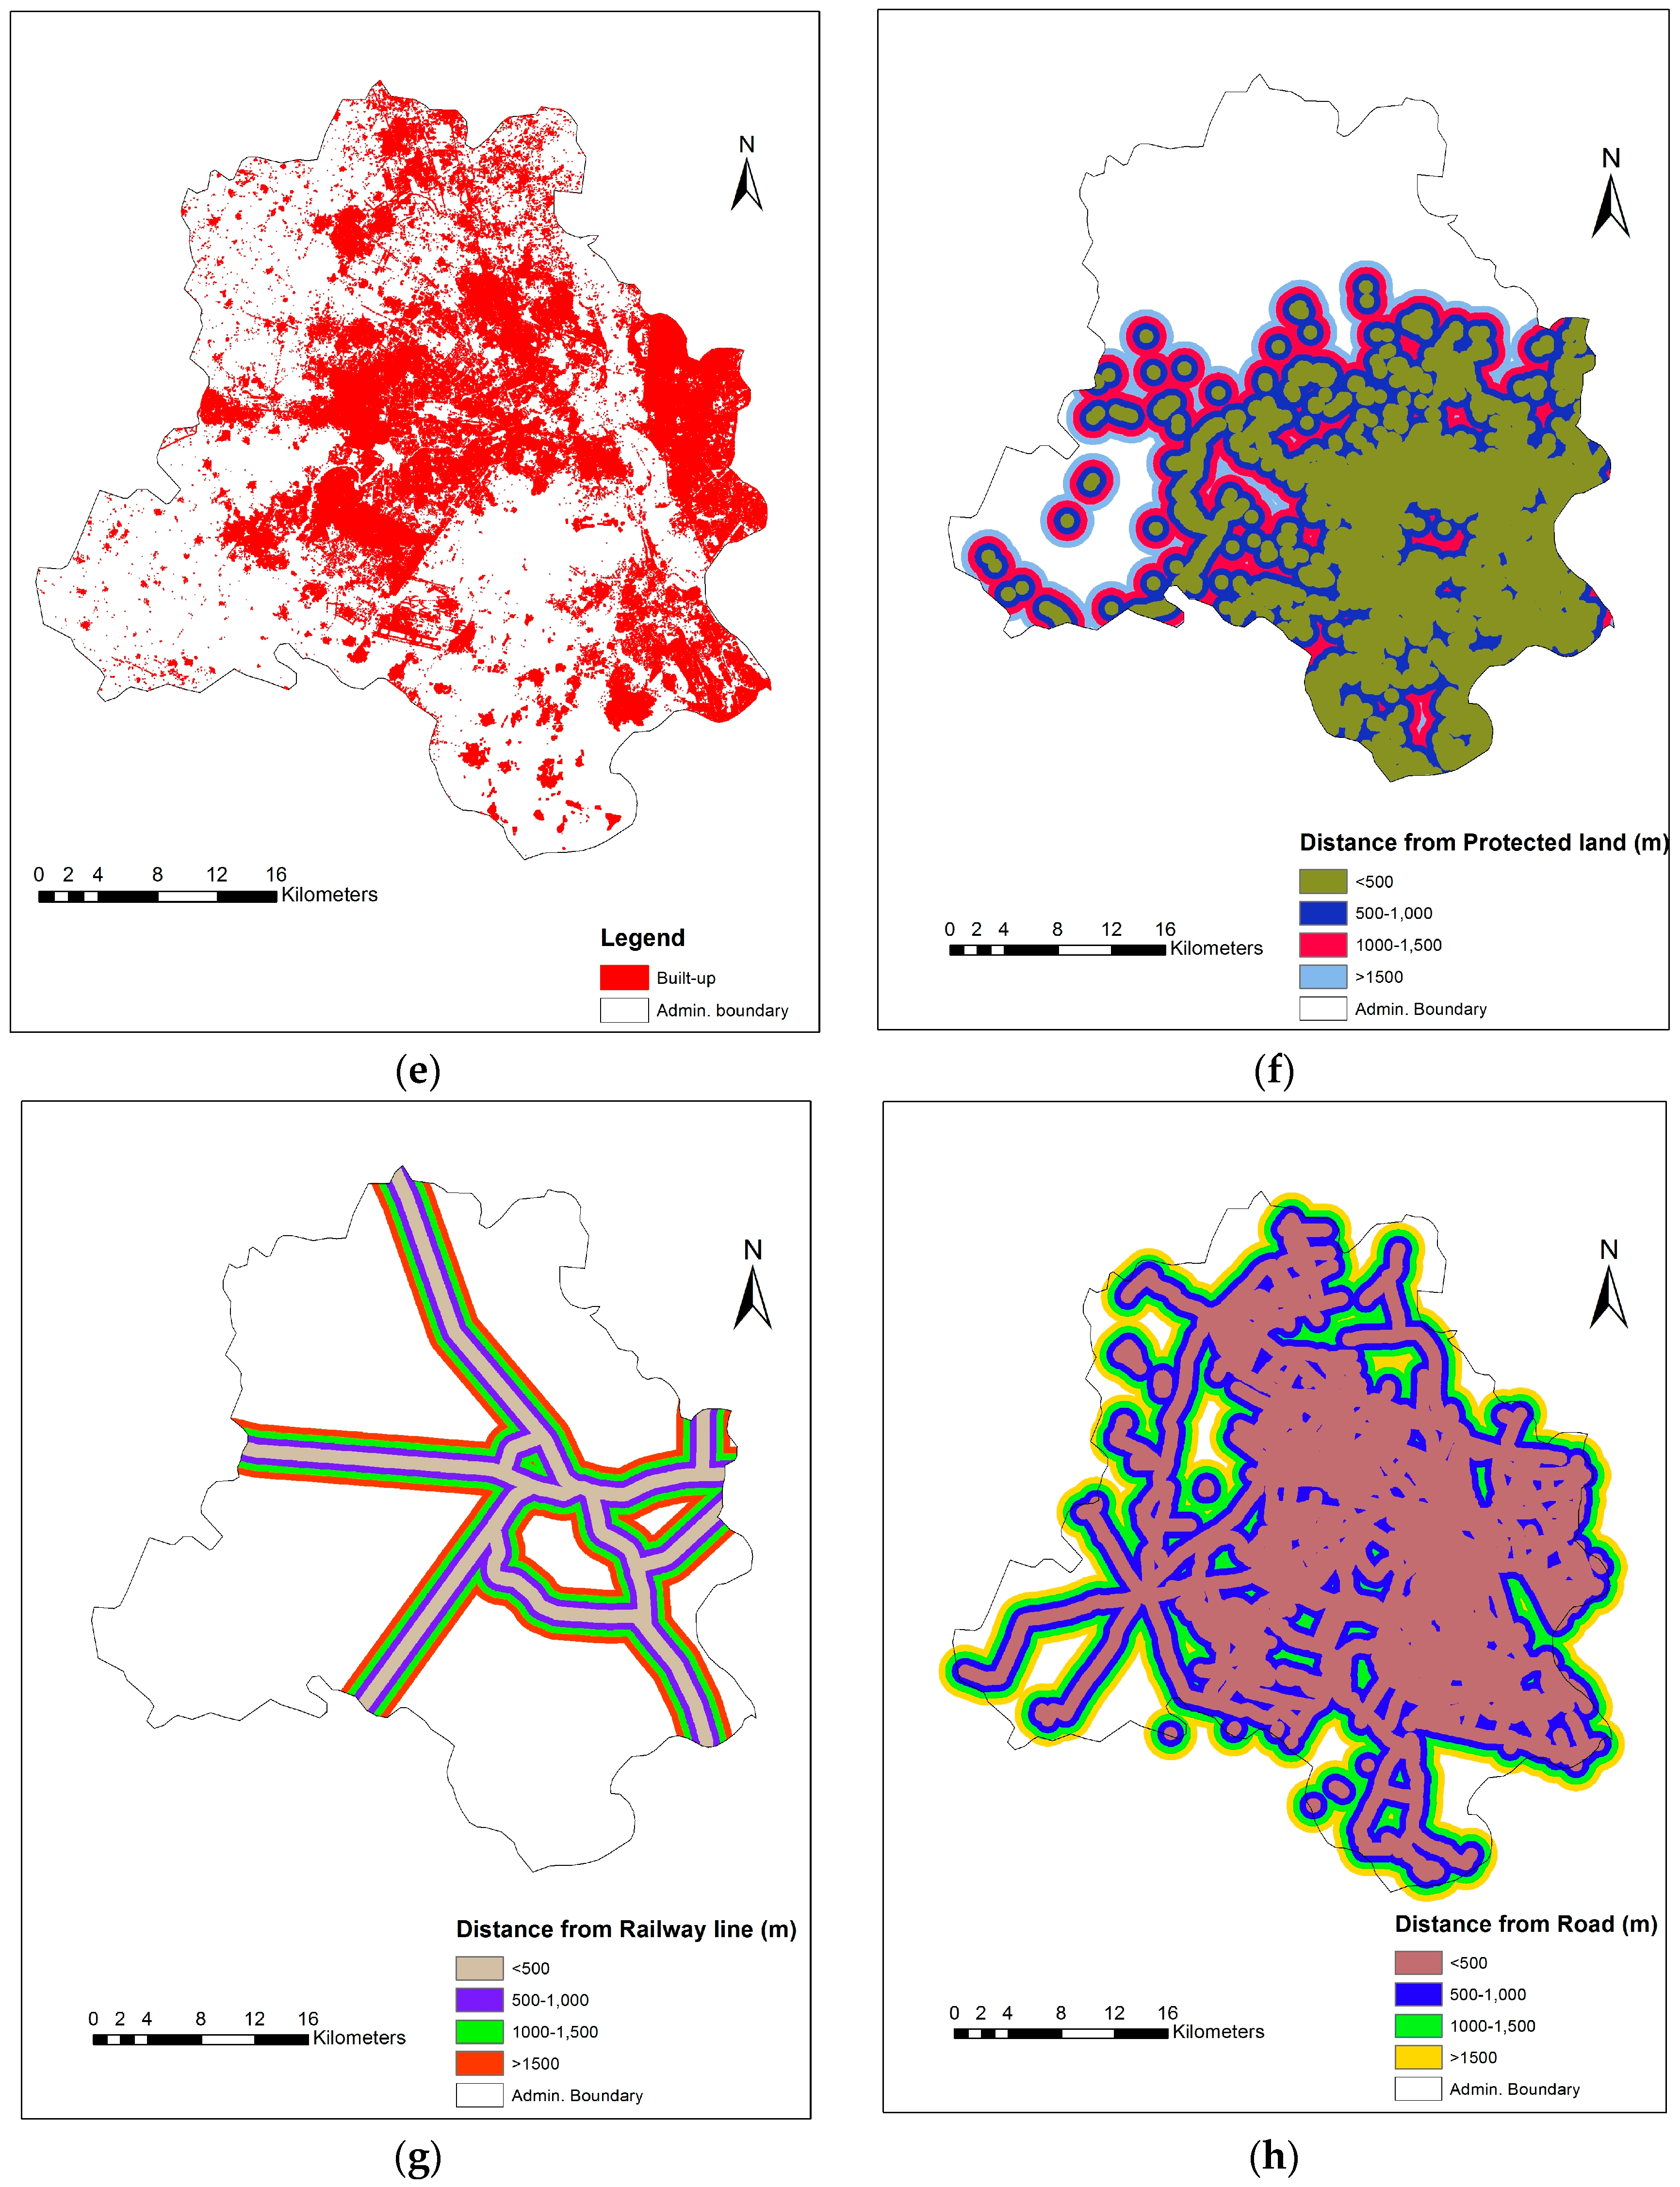
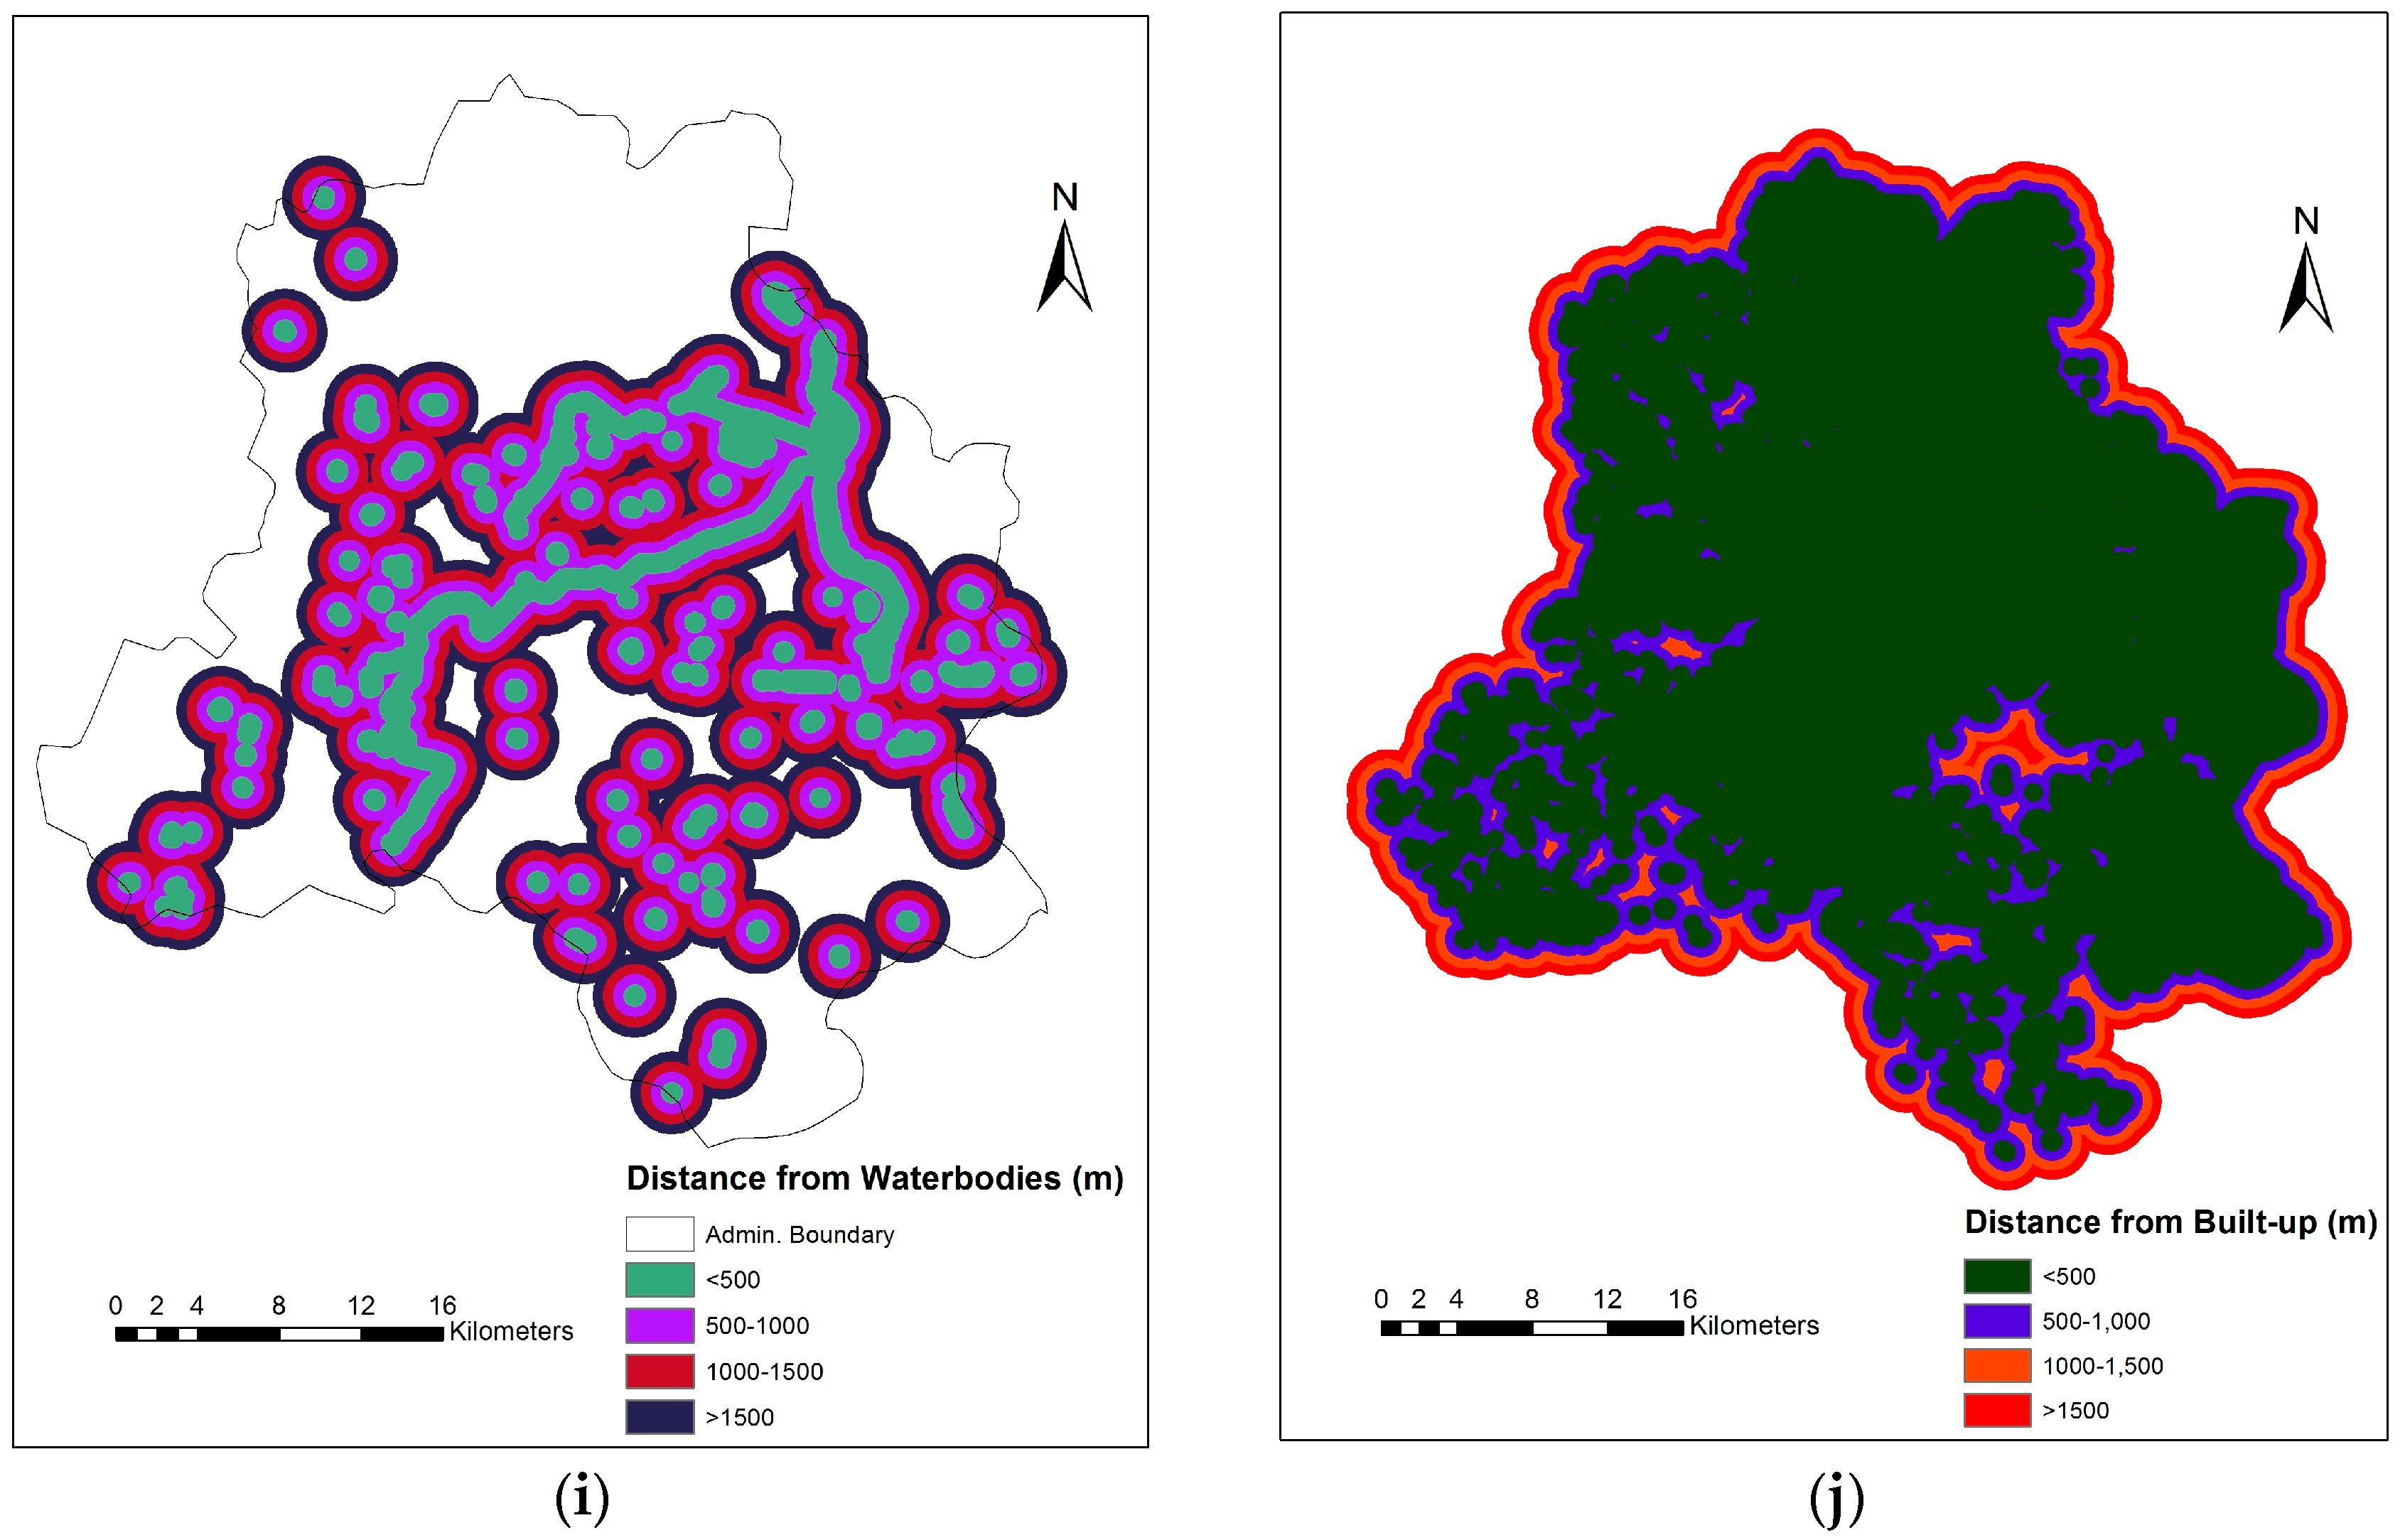
4.1.3. Distance Buffer Map
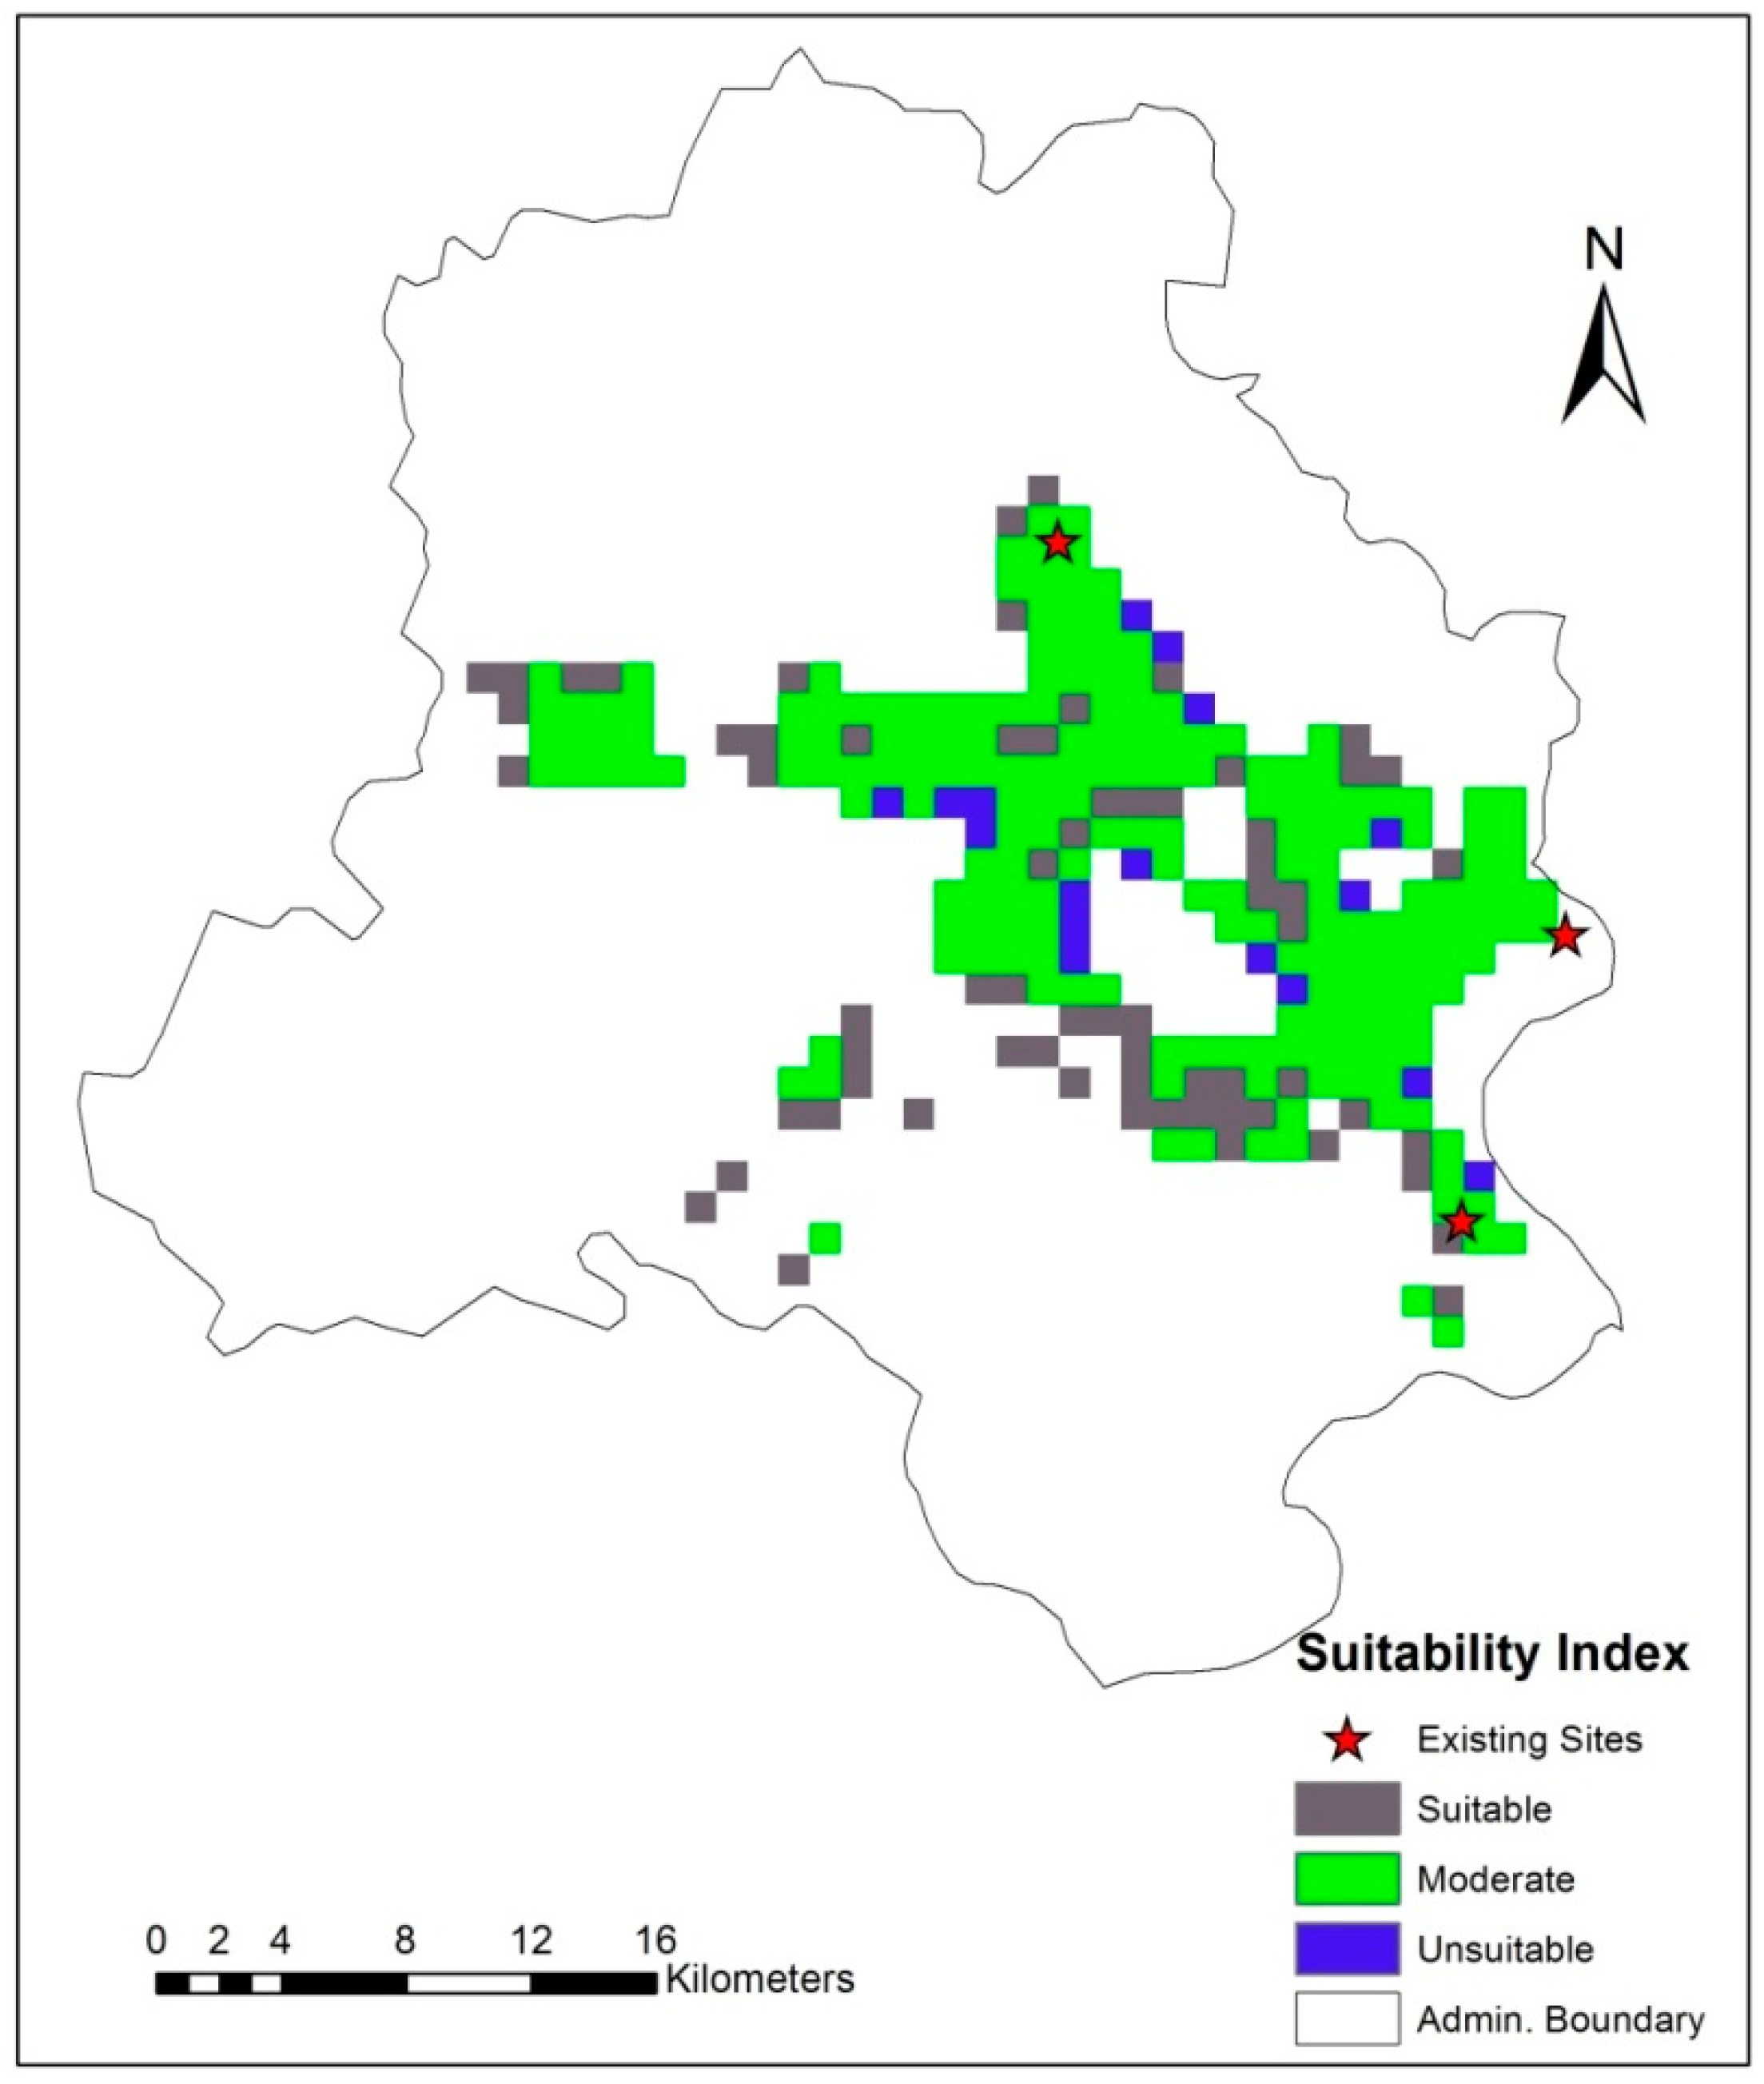
4.1.4. Overlay and Final Suitability Map
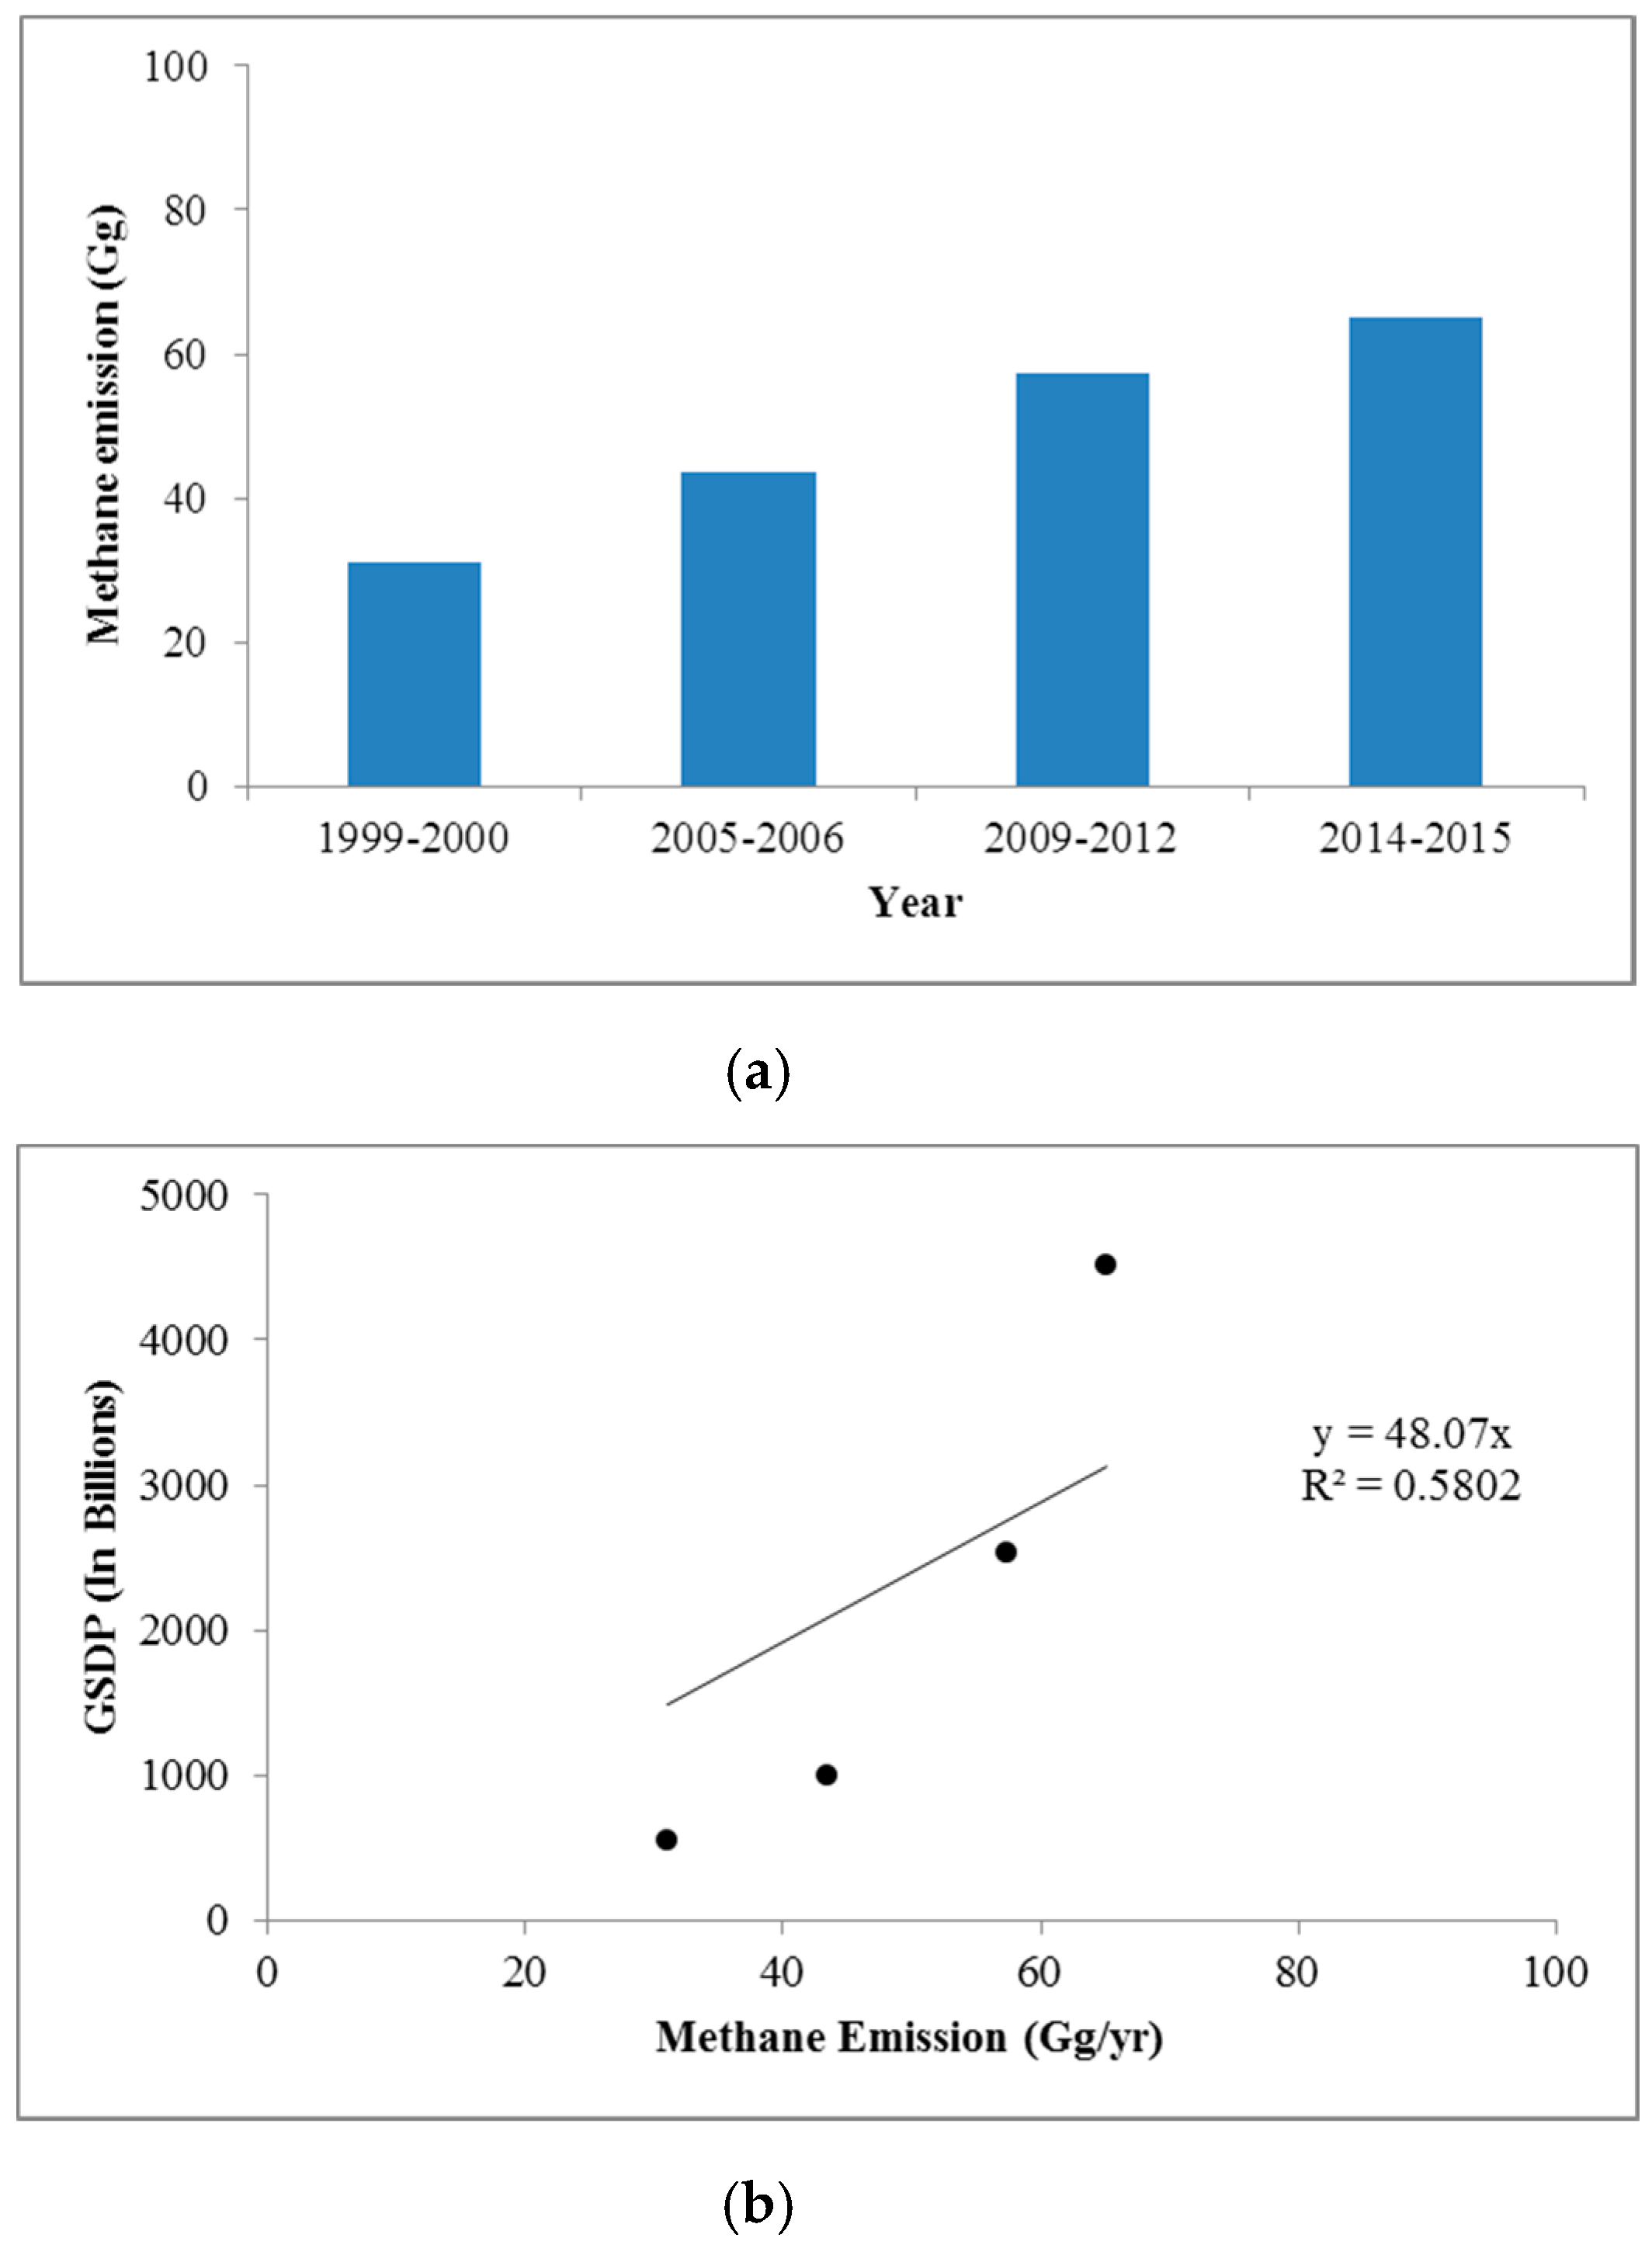
4.2. Environmental Impacts of Landfills and CH4 Emission
5. Conclusions and Recommendation
Acknowledgments
Author Contributions
Conflicts of Interest
References
- Rajkumar, N.; Subramani, T.; Elango, L. Groundwater contamination due to municipal solid waste diposal—A GIS based study in Erode City. Int. J. Environ. Sci. 2010, 1, 39–55. [Google Scholar]
- Zhu, D.; Asnani, P.U.; Zurbrugg, C.; Anapolsky, S.; Mani, S. Improving Solid Waste Management in India: A Sourcebook for 740. Policy Makers and Practitioners; WBI Development Studies; World Bank Institute, The World Bank: Washington, DC, USA, 2008; pp. 739–741. [Google Scholar]
- Government of India. Solid Waste Management Rules. Available online: http://www.moef.nic.in/content/so-1357e-08-04-2016-solid-waste-management-rules-2016 (accessed on 11 August 2017).
- Du, M.; Peng, C.; Wang, X.; Chen, H.; Wang, M.; Zhu, Q. Quantification of methane emissions from municipal solid waste landfills in China during the past decade. Renew. Sustain. Energy Rev. 2017, 78, 272–279. [Google Scholar] [CrossRef]
- Tchobanoglous, G.; Kreith, F. Handbook of Solid Waste Management; McGraw-Hill: New York, NY, USA, 2002. [Google Scholar]
- Sastry, D.B.S.S.R. Composition of Municipal Solid Waste-Need for Thermal Treatment in Present Indian Context; Ramky Energy & Environment Ltd.: Hyderabad, India, 2012. [Google Scholar]
- Ghobadi, M.H.; Taheri, M.; Taheri, K. Landfill site selection with GIS-based multi-criteria evaluation technique. A case study in Béni Mellal-Khouribga Region, Morocco. Environ. Earth Sci. 2017, 76, 413. [Google Scholar] [CrossRef]
- Municipal Corporation of Delhi. Feasibility Study and Master Plan for Optimal Waste Treatment and Disposal for the Entire State of Delhi Based on Public Private Partnership Solutions; Municipal Solid Waste Characterisation Report; Municipal Corporation of Delhi: Delhi, India, 2004; Volume 6.
- Central Pollution Control Board. Status Report on Municipal Solid Waste Management; Central Pollution Control Board: Delhi, India, 2013. [Google Scholar]
- Gemitzi, A.; Tsihrintzisb, V.A.; Christouc, O.; Petalasb, C. Use of GIS in sitting stabilization pond facilities for domestic wastewater treatment. J. Environ. Manag. 2007, 82, 155–166. [Google Scholar] [CrossRef] [PubMed]
- Finn, M.P.; Usery, E.L.; Scheidt, D.J.; Jaromack, G.M.; Krupinski, T.D. An Interface between the Agricultural Non-Point Source (AGNPS) Pollution Model and the ERDAS Imagine Geographic Information System (GIS). Geogr. Inf. Sci. 2006, 12, 9–20. [Google Scholar] [CrossRef]
- Twumasi, Y.A. Use of geo-spatial data for sustainable management of solid waste in Niamey, Niger. J. Sustain. Dev. Afr. 2000, 8, 203–215. [Google Scholar]
- Pandey, P.C.; Sharma, L.K.; Nathawat, M.S. Geospatial strategy for sustainable management of municipal solid waste for growing urban environment. Environ. Monit. Assess. 2011, 184, 2419–2431. [Google Scholar] [CrossRef] [PubMed]
- Mallick, J.; Singh, C.K.; Al-Wadi, H.; Ahmed, M.; Rahman, A.; Shashtri, S.; Mukherjee, S. Geospatial and geostatistical approach for groundwater potential zone delineation. Hydrol. Process. 2015, 29, 395–418. [Google Scholar] [CrossRef]
- Talyan, V.; Dahiya, R.P.; Sreekrishnan, T.R. State of municipal solid waste management in Delhi, the capital of India. Waste Manag. 2008, 28, 1276–1287. [Google Scholar] [CrossRef] [PubMed]
- Cowen, D. GIS versus CAD versus DBMS: What are the differences? Photogramm. Eng. Remote Sens. 1988, 54, 1551–1555. [Google Scholar]
- Malczewski, J. GIS-based multicriteria decision analysis: A survey of the literature. Int. J. Geogr. Inf. Sci. 2006, 20, 703–726. [Google Scholar] [CrossRef]
- Ishizaka, A.; Labib, A. Review of the main developments in the analytic hierarchy process. Expert Syst. Appl. 2011, 38, 14336–14345. [Google Scholar] [CrossRef] [Green Version]
- Abdalla, F. Mapping of ground water prospective zones using remote sensing and GIS techniques: A case study from the Central Eastern Desert, Egypt. J. Afr. Earth Sci. 2012, 70, 8–17. [Google Scholar] [CrossRef]
- Avtar, R.; Singh, C.K.; Shashtri, S.; Singh, A. Identification and analysis of ground water potential zones in Ken-Betwa River linking area using remote sensing and GIS. Geocarto Int. 2010, 25, 379–396. [Google Scholar] [CrossRef]
- Sharma, L.K.; Pandey, P.C.; Nathawat, M.S. Assessment of land consumption rate with urban dynamics change using geospatial techniques. J. Land Use Sci. Taylor Francis. 2011, 7, 135–148. [Google Scholar] [CrossRef]
- Ratnapriya, E.A.S.K.; De Silva, R.P. Location optimization of wastewater treatment plants using GIS: A case study in Upper mahaweli Catchment, Sri Lanka. In Proceedings of the Applied Geoinformation for Society and Environment; Stuttgart University of Applied Sciences: Stuttgart, Germany, 2009; pp. 20–25. [Google Scholar]
- Ananda, J.; Herath, G. A critical review of multi-criteria decision making methods with special reference to forest management and planning. Ecol. Econ. 2009, 68, 2535–2548. [Google Scholar] [CrossRef]
- Srivastava, S.K.; Ramanathan, A.L. Geochemical assessment of groundwater quality in vicinity of Bhalswa landfill, Delhi, India, using graphical and multivariate statistical methods. Environ. Geol. 2008, 53, 1509–1528. [Google Scholar] [CrossRef]
- Taylor, G.; Berggren, D.; Bergkvist, B.; Folkenson, L.; Ruhling, A. Soil acidification and metal solubility of forest of southern Sweden. In Effect of Atmospheric Pollution on Forest, Wet Land and Agricultural Ecosystem; Hutchinson, T.C., Meena, K.M., Eds.; NATO ASI Series; Springer: Berlin, Germany, 1987; Volume G16, pp. 347–359. [Google Scholar]
- Shivhare, R.L.; Pandey, G.S. Effluent–effluent interaction. Corrective effects in some tannery combination of effluent. Indian J. Environ. Health 1996, 38, 233–238. [Google Scholar]
- Oonkay, H.S. Literature Review: Methane from Landfills Methods to Quantify Generation, Oxidation and Emission; Oonkay: Apeldoorn, The Netherlands, 2010. [Google Scholar]
- Kirschke, S.; Bousquet, P.; Ciais, P.; Saunois, M.; Canadell, J.G.; Dlugokencky, E.J.; Bergamaschi, P.; Bergmann, D.; Blake, D.R.; Bruhwiler, L.; et al. Three decades of global methane sources and sinks. Nat. Geosci. 2013, 6, 813–823. [Google Scholar] [CrossRef]
- Scheehle, E.; Godwin, D.; Ottinger, D.; DeAngelo, B. Global Anthropogenic Non-CO2 Greenhouse Gas Emissions: 1990–2020; Revised Version; Report No. 430-R-06-003; U.S. Environmental Protection Agency: Washington, DC, USA, 2006.
- Themelis, N.J.; Ulloa, P.A. Methane generation in landfills. Renew. Energy 2007, 32, 1243–1257. [Google Scholar] [CrossRef]
- GMI. International Best Practices Guide for Landfill Gas Energy Projects. 2012. Available online: http://www.globalmethane.org/tools-resources/tools.aspx#three (accessed on 20 August 2017).
- Intergovernmental Panel on Climate Change (IPCC). Report of the Twelfth Season of the Intergovernmental Panel on Climate Change; IPCC: Mexico City, Mexico, 1996.
- USGS Earth Explorer. Available online: https://earthexplorer.usgs.gov/ (accessed on 10 July 2017).
- Moeinaddini, M.; Khorasani, N.; Danekar, A.; Darvishefat, A.A.; Zeinalyan, M. Siting MSW landfill using weighted linear combination and analytical hierarchy process (AHP) methodology in GIS environment (case study: Karaj). Waste Manag. 2010, 30, 912–920. [Google Scholar] [CrossRef] [PubMed]
- Saaty, T.L.; Vargas, L.G. Models, Methods, Concepts and Applications of the Analytic Hierarchy Process; Kluwer Academic Publishers: Norwell, MA, USA, 2001. [Google Scholar] [CrossRef]
- Saaty, T.L. Multicriteria Decision making: The Analytic Hierarchy Process. McGrawHill: New York, NY, USA, 1980. [Google Scholar]
- Satty, T.L. Homogenity and clustering in AHP ensure the validity of the scale. Eur. J. Oper. Res. 1994, 72, 598–601. [Google Scholar] [CrossRef]
- Bingemer, H.Q.; Crutzen, P.J. Production of methane from solid waste. J. Geophys. Res. 1987, 87, 2181–2187. [Google Scholar] [CrossRef]
- Kumar, S.; Gaikwad, S.A.; Sekdar, A.V.; Kshirsagar, P.S.; Singh, R.N. Estimation method for national methane emission from solid waste landfills. Atmos. Environ. 2004, 38, 3481–3487. [Google Scholar] [CrossRef]
- Chakarborti, M.; Sharma, C.; Pandey, J.; Singh, N.; Gupta, P.K. Methane emission estimation from landfills in Delhi: A comparative assessment of different methodologies. Atmos. Environ. 2011, 45, 7135–7142. [Google Scholar] [CrossRef]
- Shams, S.; Sahu, J.N.; Rahman, S.M.S.; Ahsan, A. Sustainable waste management policy in Bangladesh for reduction of greenhouse gas. Sustain. Cities Soc. 2017, 33, 18–26. [Google Scholar] [CrossRef]
- Kumar, S.; Mondal, A.N.; Gaikwad, S.A.; Devotta, S.; Singh, R.N. Qualitative assessment of methane emission inventory from municipal solid waste disposal sites: A case study. Atmos. Environ. 2004, 38, 4921–4929. [Google Scholar] [CrossRef]


| S.No | Data | Source |
|---|---|---|
| 1 | Digital Elevation Model | United States Geological Survey-Earth Explorer |
| 2 | Landsat-8 Data | USGS-Earth Explorer |
| 3 | Soil Data | Soil Survey of India |
| 4 | Road | Open Street Map |
| 5 | Rail | Open Street Map |
| 6 | Protected land | Landuse/Landcover derived from Landsat 8 image |
| 7 | Urban Area | Landuse/Landcover derived from Landsat 8 image |
| 8 | Water bodies | Landuse/Landcover derived from Landsat 8 image |
| 9 | Slope | Shuttle Radar Topographic Mission Digital Elevation Model |
| Criteria | Distance | Ranking | Gradient of Suitability | Weightage % |
|---|---|---|---|---|
| Distance from road | <500 | 1 | Highly suitable | 10.55 |
| 500–1000 | 2 | Suitable | ||
| 1000–1500 | 3 | Moderate | ||
| >1500 | 4 | Unsuitable | ||
| Distance from rail | <500 | 1 | Highly suitable | 6.95 |
| 500–1000 | 2 | Suitable | ||
| 1000–1500 | 3 | Moderate | ||
| >1500 | 4 | Unsuitable | ||
| Distance from water bodies | <500 | 4 | Unsuitable/restricted | 35.05 |
| 500–1000 | 3 | Moderate | ||
| 1000–1500 | 2 | Suitable | ||
| >1500 | 1 | Highly suitable | ||
| Distance from Urban | <500 | 4 | Unsuitable/restricted | 23.75 |
| 500–1000 | 3 | Moderate | ||
| 1000–1500 | 2 | Suitable | ||
| >1500 | 1 | Highly suitable | ||
| Distance from protected land | <500 | 4 | Unsuitability/restricted | 15.9 |
| 500–1000 | 3 | Moderate | ||
| 1000–1500 | 2 | Suitable | ||
| >1500 | 1 | Highly suitable | ||
| Slope | 0–9 Degree | 1 | Highly Suitable | 3.188 |
| Soil | Loam | 2 | Suitable | 4.613 |
| Total | 100 | |||
| Pairwise Matrix | |||||||
|---|---|---|---|---|---|---|---|
| Factors | Distance Water Bodies | Urban | Protected Land | Distance Road | Distance Rail | Soil | Slope (%) |
| Distance Water bodies | 1.00 | 2.00 | 3.00 | 4.00 | 5.00 | 6.00 | 7.00 |
| Urban | 0.50 | 1.00 | 2.00 | 3.00 | 4.00 | 5.00 | 6.00 |
| Protected land | 0.33 | 0.50 | 1.00 | 2.00 | 3.00 | 4.00 | 5.00 |
| Distance Road | 0.25 | 0.33 | 0.50 | 1.00 | 2.00 | 3.00 | 4.00 |
| Distance Rail | 0.20 | 0.25 | 0.33 | 0.50 | 1.00 | 2.00 | 3.00 |
| Soil | 0.17 | 0.20 | 0.25 | 0.33 | 0.50 | 1.00 | 2.00 |
| Slope (%) | 0.14 | 0.17 | 0.20 | 0.25 | 0.33 | 0.50 | 1.00 |
| Total | 2.59 | 4.45 | 7.28 | 11.08 | 15.83 | 21.50 | 28.00 |
| Factors | Distance Water Bodies | Distance from Urban Area | Distance Protected Land | Distance from Road | Distance from Rail | Soil | Slope (%) | Weights | Weights % |
|---|---|---|---|---|---|---|---|---|---|
| Distance Water bodies | 0.386 | 0.449 | 0.412 | 0.361 | 0.316 | 0.279 | 0.250 | 0.351 | 35.051 |
| Distance from Urban | 0.193 | 0.225 | 0.275 | 0.271 | 0.253 | 0.233 | 0.214 | 0.238 | 23.754 |
| Distance Protected land | 0.129 | 0.112 | 0.137 | 0.181 | 0.190 | 0.186 | 0.179 | 0.159 | 15.901 |
| Distance from Road | 0.097 | 0.074 | 0.069 | 0.090 | 0.126 | 0.140 | 0.143 | 0.105 | 10.548 |
| Distance from Rail | 0.077 | 0.056 | 0.045 | 0.045 | 0.063 | 0.093 | 0.107 | 0.070 | 6.960 |
| Soil | 0.064 | 0.045 | 0.034 | 0.030 | 0.032 | 0.047 | 0.071 | 0.046 | 4.613 |
| Slope (%) | 0.055 | 0.038 | 0.027 | 0.023 | 0.021 | 0.023 | 0.036 | 0.032 | 3.189 |
| Total | 1 | 100 | |||||||
| S.No | Results of AHP Matrix | Values |
|---|---|---|
| 1 | No. of factors (N) | 7 |
| 2 | Maximum principle Eigen vector (λmax) | 7.1965716 |
| 3 | Consistency Index (CI) | 0.0327619 |
| 4 | Relative Index (RI) | 1.32 |
| 5 | Consistency Ratio (CR) | 0.0248196 |
© 2017 by the authors. Licensee MDPI, Basel, Switzerland. This article is an open access article distributed under the terms and conditions of the Creative Commons Attribution (CC BY) license (http://creativecommons.org/licenses/by/4.0/).
Share and Cite
Singh, C.K.; Kumar, A.; Roy, S.S. Estimating Potential Methane Emission from Municipal Solid Waste and a Site Suitability Analysis of Existing Landfills in Delhi, India. Technologies 2017, 5, 62. https://doi.org/10.3390/technologies5040062
Singh CK, Kumar A, Roy SS. Estimating Potential Methane Emission from Municipal Solid Waste and a Site Suitability Analysis of Existing Landfills in Delhi, India. Technologies. 2017; 5(4):62. https://doi.org/10.3390/technologies5040062
Chicago/Turabian StyleSingh, Chander Kumar, Anand Kumar, and Soumendu Shekhar Roy. 2017. "Estimating Potential Methane Emission from Municipal Solid Waste and a Site Suitability Analysis of Existing Landfills in Delhi, India" Technologies 5, no. 4: 62. https://doi.org/10.3390/technologies5040062