Bushfire Disaster Monitoring System Using Low Power Wide Area Networks (LPWAN)


School of Information Technology, Deakin University, Burwood VIC 3125, Australia
*
Author to whom correspondence should be addressed.
Technologies 2017, 5(4), 65; https://doi.org/10.3390/technologies5040065
Submission received: 21 September 2017
/
Revised: 2 October 2017
/
Accepted: 2 October 2017
/
Published: 8 October 2017
Abstract
:Some applications, including disaster monitoring and recovery networks, use low-power wide-area networks (LPWAN). LPWAN sensors capture data bits and transmit them to public carrier networks (e.g., cellular networks) via dedicated gateways. One of the challenges encountered in disaster management scenarios revolves around the carry/forward sensed data and geographical location information dissemination to the disaster relief operatives (disaster relief agency; DRA) to identify, characterise, and prioritise the affected areas. There are network topology options to reach its destination, including cellular, circuit switched, and peer-to-peer networks. In the context of natural disaster prediction, it is vital to access geographical location data as well as the timestamp. This paper proposes the usage of Pseudo A Number (PAN), that is, the calling party address, which is used by every network to include the location information instead of the actual calling party address of the gateway in LPWAN. This PAN information can be further analysed by the DRA to identify the affected areas and predict the complications of the disaster impacts in addition to the past history of damages. This paper aims to propose a solution that can predict disaster proceedings based on propagation and the velocity of impact using vector calculation of the location data and the timestamp, which are transmitted by sensors through the PAN of the gateway in LPWAN.
1. Introduction
The need for disaster monitoring and recovery mechanisms has arisen as long as natural disasters and their adverse effects have been known to humankind. The long list of natural and man-made disasters include: floods; heavy snowfalls; wild/bush fires; storms/hurricanes; tsunamis; earthquakes; pandemics, and; nuclear disasters [1,2]. Despite there being a strong need to implement communications between a disaster-stricken area and the disaster managing offices in local or global agencies such as the United Nations and the European Commission, the goal is to secure the necessary communications to support first responder activities with a strategy to restore network services in the initial aftermath [3]. As the internet is emerging with prevalent technologies such as big data, cloud computing, the Internet of Things (IoT), and 5G cellular networks, it is now feasible to provide low-cost networks that cover a wide area such as long-range (LoRa) networks as a type of low-power wide-area network (LPWAN) [4,5]. These technologies allow sensors to be deployed and managed with a low-power (e.g., 25 mW), wide-area client and up to a 25-km test link for the operating areas for sensor networks [6]. When IoT networks, estimated by Cisco to have 50 billion connected devices by 2020 [7], are deployed and converged with these sensor networks, it may be possible to monitor virtually all habitable areas without requiring additional managing systems. That is, through self-communications amongst devices such as machine-to-machine (M2M) interfaces and device-to-device (D2D) communication technologies [8]. For example, a mobile device communicates with a peer-to-peer wireless communications network via D2D communication when the device is out of range of the cellular network. In an emergency situation, it sends a message from the device to a network element if a network connection between the mobile device and network element exists. If this connection does not exist, the device sends the message to a second mobile device, which will connect to the third mobile device via D2D communication [8]. M2M communication technology is used in IoT for various applications, such as an alarm notification to mobile tower monitoring systems [9] and in mobile health (mHealth) alarming applications via the analysis of personal sensor device-sensed health data, as well as utilising intelligent functions such as inference system in body sensor devices [10,11,12,13]. As LPWAN transmits small volumes of data to save battery power, an inference system can also be used to reduce the data size and the frequency of transmission [14]. In disaster monitoring, it is crucial to identify the affected areas and their progression into other areas in order to predict the potential impact and damage. For this, it is required to know the geographical location information of individual sensor nodes, which may relay the information (sensor measurements and location identification; LID) through the network until it has been received by the LPWAN gateway, which will eventually be reached by the disaster relief agency (DRA) through the public network using IP Multimedia System (IMS)- or Voice over IP (VoIP)-based networks, depending on the country or regions. This may present a challenge of carrying data (LID and sensor measurements) to the final destination, as it may cross various networks that support different technologies and have different signalling formats. To solve this problem, we propose to use the calling party address (a number in a setup message to contain LID), which is used by all network technologies, along with the called party address (B number) by replacing the A number field (real calling party address) by a Pseudo A Number (PAN), including LID.
There have been tools and risk assessment system recognised by Council of Australian Government (COAG), such as the Bushfire Risk Management Model developed by the Bushfire cooperative research centre. This model directly relates the impact of various management strategies to changes in fire characteristics across the landscape [15], and we added a variant of wind to demonstrate the solution using PAN to be used by fire agencies, town planners and policymakers.
The benefit of this proposal is that it does not require a significant modification or addition of a field to carry the LID within an existing signalling system. However, it may require minimal changes of the A number handling by a carrier network, whilst the actual A number is not required for accounting during the call setup, as it will be regarded as an emergency call. If it is normal to be charged, charging arrangements by the carrier may also be required when provisioning the service. To deliver the PAN, the existing calling line identification presentation (CLIP) feature can be used for data management by the DRA. For implementation of the calling party numbers in multiple networks, it will require collective co-operation among the network operators and service providers in a region or country. Currently, there is no known activity of standardising emergency call handling among countries, whilst there are rules on how to handle emergency numbers such as 000 and 911 in Australia, for instance. For developing countries, this proposal may be useful to monitor disaster status with minimal modifications in their carrier networks. Figure 1 shows the network topology of LPWAN and carrier networks.
2. Peer-To-Peer (P2P) and Ad-Hoc Networks
In a disaster situation and when the public network is not available due to the impact, P2P networks such as LPWAN, ad hoc and balloon networks can be used to deliver the sensor data. Those networks may be connected to IoT devices, which can forward the information through the internet where available. A P2P network is created when multiple nodes connect and communicate with one another without a server connection such as a client server network. It can be operated at a large scale in which special protocols and applications are used to connect directly with other networks such as LPWAN gateways [16].
2.1. Ad Hoc Networks
In many cases, network connections cannot be preserved in a disaster situation, and ad hoc networks can allow the rapid deployment of connectivity. There are multiple wireless mobile nodes dynamically forming a temporary network without using the existing network infrastructure such as cellular or circuit switched networks. As this ad hoc network has the limitations of wireless network interfaces, multiple hops are required, which also require routing protocols [17]. Since the protocol should consider transmission range, limited buffer space for message storage and hardware constraints, various mobility models have been developed [18]. However, disaster sensors are mostly located in fixed locations despite being able to be moved by disasters. This is a unique trait, as disaster sensors are not mobile. Therefore, it is required to consider the mobility when designing networks for disaster recovery networks. If disaster sensors are moved by natural causes such as heavy rain, storms, or strong winds, the location ID of those sensors shall be adjusted accordingly and updated in the DRA system. If required, additional sensors may be added to fill gaps in areas during scheduled or regular maintenance works of LPWAN networks and devices. Some disaster sensors may be out of service due to an empty battery and may need to be replaced in a timely manner; for example, every year, 10% of sensors are replaced when the battery lifetime is 10 years.
2.2. Balloon Networks
As a special type of ad hoc networks, aerial and hierarchical balloon networks proved feasible from testing [19] and include optical and radio frequency links between balloons, which consist of super-nodes and sub-nodes. Each super-node balloon comprises a free-space optical communication system for data communications with one or more other super-node balloons, which comprises a radio-frequency communication system operable for data communications [20,21]. A wireless telecommunications system with a base station positioned on an airborne platform is provided and can communicate with satellite-based routing processes [22]. The system can also utilise a ground-based wireless switching system to communicate with a plurality of airborne base stations positioned above a geographic area, as well as the balloons’ geographic zones [23].
2.3. LPWANs
LPWANs basically provides low power-driven clients (devices) for longer range coverage comparing to existing Wireless Area Network (WAN) technologies, whilst existing IoT protocols can work with short-range protocols such as Bluetooth, Zigbee and Wi-Fi. There are existing protocols and vendors (e.g., LoRa, NWave, OnRamp, Platanus, SIGFOX, Telensa, Weightless, Amber Wireless and M2M Spectrum Networks) for current standards, standards-in-progress or proprietary examples [24] with different aspects and traits. However, all of them aim to provide low-cost-driven solutions for longer range coverage, which is suitable for disaster monitoring networks. LPWANs are unlikely to be controlled, owned or managed by public carrier network operators. Instead, a separate entity such as a private network service provider can control the LPWAN network except the gateway interconnection to the public carrier networks in case that the network operators do not use licensed spectrums such as LoRa and Random Phase Multiple Access (RPMA). In this case, security issues will be limited to the LPWAN operators, and will not be an issue for the carrier networks. LPWAN sensors are progressively triggered in a disaster situation based on time changes, for example, from T1, T2 to T3, the sensors are triggered in a timely manner by each affected area. In this paper, LPWANs are used to demonstrate an application scenario to forward location information and the timestamp to the gateway, which may then connect to peer-to-peer networks or public carrier networks.
A few technologies and platforms are proposed for the next generation disaster recovery systems [2]:
Self-Power Wireless Communication Platform (SPWC): A self-deployable system, which can be used in unmanned aerial vehicles (UAV), providing protections through flying objects, which use Low Altitude Platform (LAP) [25].
LTE-A: This provides an all-IP connectivity between devices and devices and infrastructures, supporting Quality of Service (QoS)-ready Multimedia Priority Services (MPS), suitable for public protection and disaster relief (PPDR) scenarios.
Point-of-Care-ready Small-World Networks: This uses wireless handheld devices to optimize patient care during disaster relief operations [26].
Smart Cities for disaster management systems: It provides efficient city-wide emergency responses and resilience using intelligent transportation systems, vehicular ah hoc networks and cloud computing networks [27].
Table 1 depicts various technologies using licensed and unlicensed spectrums. The long-term evolution for machines (LTE-M), simplified for the long term evolution for machine-type communications (LTE-MTC) low-power wide-area (LPWA) technology standard published by the third generation partnership project (3GPP), is likely to migrate 2G and 3G M2M devices for higher bandwidth, but with lower power consumption to extend battery life [28]. As shown in Table 1, LPWAN networks provided by technologies such as LTE-M and NarrowBand Internet of Things (NB-IoT) using licensed spectrums are likely to be operated by public carrier network operators.
3. Design and Implementation
This section describes methodologies and implementation for the generation and forwarding of LID utilising PAN within LPWANs and transferring towards DRA. Types of calls and networks as well as call setups are also described to show how the actual information flows from the origination to the destination in case of an emergency.
3.1. Data Collection and Transmission in LPWANs
Deployed sensors capture data such as temperature, humidity, air condition, and so forth, and transmit them to neighbouring devices which forward/relay them towards the gateway, which is meant to collect data in its own network. There can be multiple gateways, which are aggregated by a customer edge (CE) to communicate with a base station (BS). Whilst the internal communications can be done by LPWAN protocols, the interface from the CE to BS is done by the public network such as 3G or 4G LTE.
3.2. Location ID
There are various formats for location such as GPS coordinates which can be used as an LID, such as in the example below:
- degrees minutes seconds: 40°26′46″ N 79°58′56″ W.
- degrees decimal minutes: 40°26.767′ N 79°58.933′ W.
- decimal degrees: 40.446° N 79.982° W.
There are benefits of using real-time GPS information in PAN, such as obtaining accurate LIDs in the lack of cell/Wi-Fi signalling areas, however, there are associated disadvantages such as an increased battery power consumption as well as security issues to consider. As deployed sensors will not change their location in most cases, it is not required to contact satellites to constantly update the LID in situations where the sensors’ computational capacity is limited. If the capacity allows, the sensor can communicate with satellites to maintain an accurate location information on a regular basis, e.g., monthly or annually, and the connection to GPS may otherwise be limited to conserve battery power. Otherwise, the LID can be pre-programmed when deployed. In the example above, when the GPS coordinate is used for the LID (but not necessarily to connect to satellites), the format should be defined on how to conform the content to the carrier network. For example, when International Telecommunication Union Telecommunication Standardization Sector (ITU-T) E.164 is used, the format can be as shown in Table 2 to accommodate the LID, for example, XY4044679982 (12 digits), where XY can be an identification of the network, whilst each country has its own national numbering plan, and therefore the XY format should follow the scheme. The number structure for global service by the E.164 also suggests three digits for the country code and 12 digits for the global subscriber number [29]. Alternatively, the LID can also be a proprietary format as long as it can traverse the networks without being rejected. In this way, the number of 12 digits can be further granulised as it does not have to include the degree portion of the GPS coordinate, which saves four digits for other information, for example, sensor measurements.
3.3. Gateways
Whilst sensors transmit data to gateways, the collected data is converted into a proper format at the gateway (or aggregation gateway as a customer edge). There are two key data which are processed at the gateway: (1) LID: location information such as the GPS coordinate or proprietary location data format being used by the DRA is converted into the A party address format in the signalling field consisting of XY (network ID) and 10 digits of numeric data for the location, as shown in Table 3, for instance; (2) sensor measurements are included in the data (payload) field, which is kept short to conserve battery power. The gateway plays a key role in performing data collection from the sensors, instructing the network to change the status to an emergency mode when triggered, forming the PAN field from data received from the sensors, and connecting to carrier or peer-to-peer networks. It also interacts with other gateways in the LPWAN for routing if required.
3.4. Call Setup in Mobile Station
There are normal setup and emergency setup procedures described by 3GPP 24.008. Depending on the subsequent network interconnecting from the cellular network, a proper setup process can be used. In any case, every call should have the calling party address in a proper format. When a gateway connects to a cellular network, it should format the setup message to generate and include the PAN in the A number field, which will be used by the cellular network to forward to the destination. Between mobile and circuit switched network, proper procedures are described for the setup and for the emergency setup. For example, Table 9.54/3GPP TS 24.008 [30] summarises the messages for circuit-switched call control.
3.5. PAN (Calling Party Numbers)
In many networks, the calling party numbers are controlled by the carrier and cannot be changed by the subscriber. Sometimes networks have screening/filtering configuration applied to the switch/base station so that their calling party numbers need to conform to certain number ranges or be positively vetted against a list of known numbers. For example, a carrier exchange system or switch may reject the incoming call based on a calling party number, which has been classified as invalid digits when analysing the calling party number by digit analysis. This needs to be worked out with carriers such that certain number ranges can be added to be in the digit analysis processes for those disaster related calls. To present a PAN to the carrier network, an example is shown in Table 3 provided it still requires conforming of a carrier’s numbering scheme for calling party numbers.
3.6. Call Types
When a call has arrived at the carrier network for the first time from the LPWAN, it should be classified as an emergency call type, as it is an emergency in the case of a disaster situation. However, when it is not an emergency, the call may be treated as a normal call. To differentiate the calls, there are three types of calls from the LPWAN to the carrier network.
- (1)
- Scheduled calls: LPWAN sensors transmit sensed data on a regular basis as pre-programmed, for example, every hour, for checking of the sensor status.
- (2)
- Urgent calls: When a disaster situation occurs, LPWAN sensors will trigger the gateway with sensed data as compared to the predefined threshold values. The gateway in this case transmits the emergency data to the destination.
- (3)
- Recovery calls: When sensors capture measurements that have become within the normal ranges against the threshold values, they transmit the data as recovered and the gateway transmits them to the disaster centre to be marked as normal.
The type of call can also be in the form of short message service (SMS), PSTN or Mobile termination, Answered or Not answered, emergency call (000), and so on.
3.7. Network Types for Origination and Termination
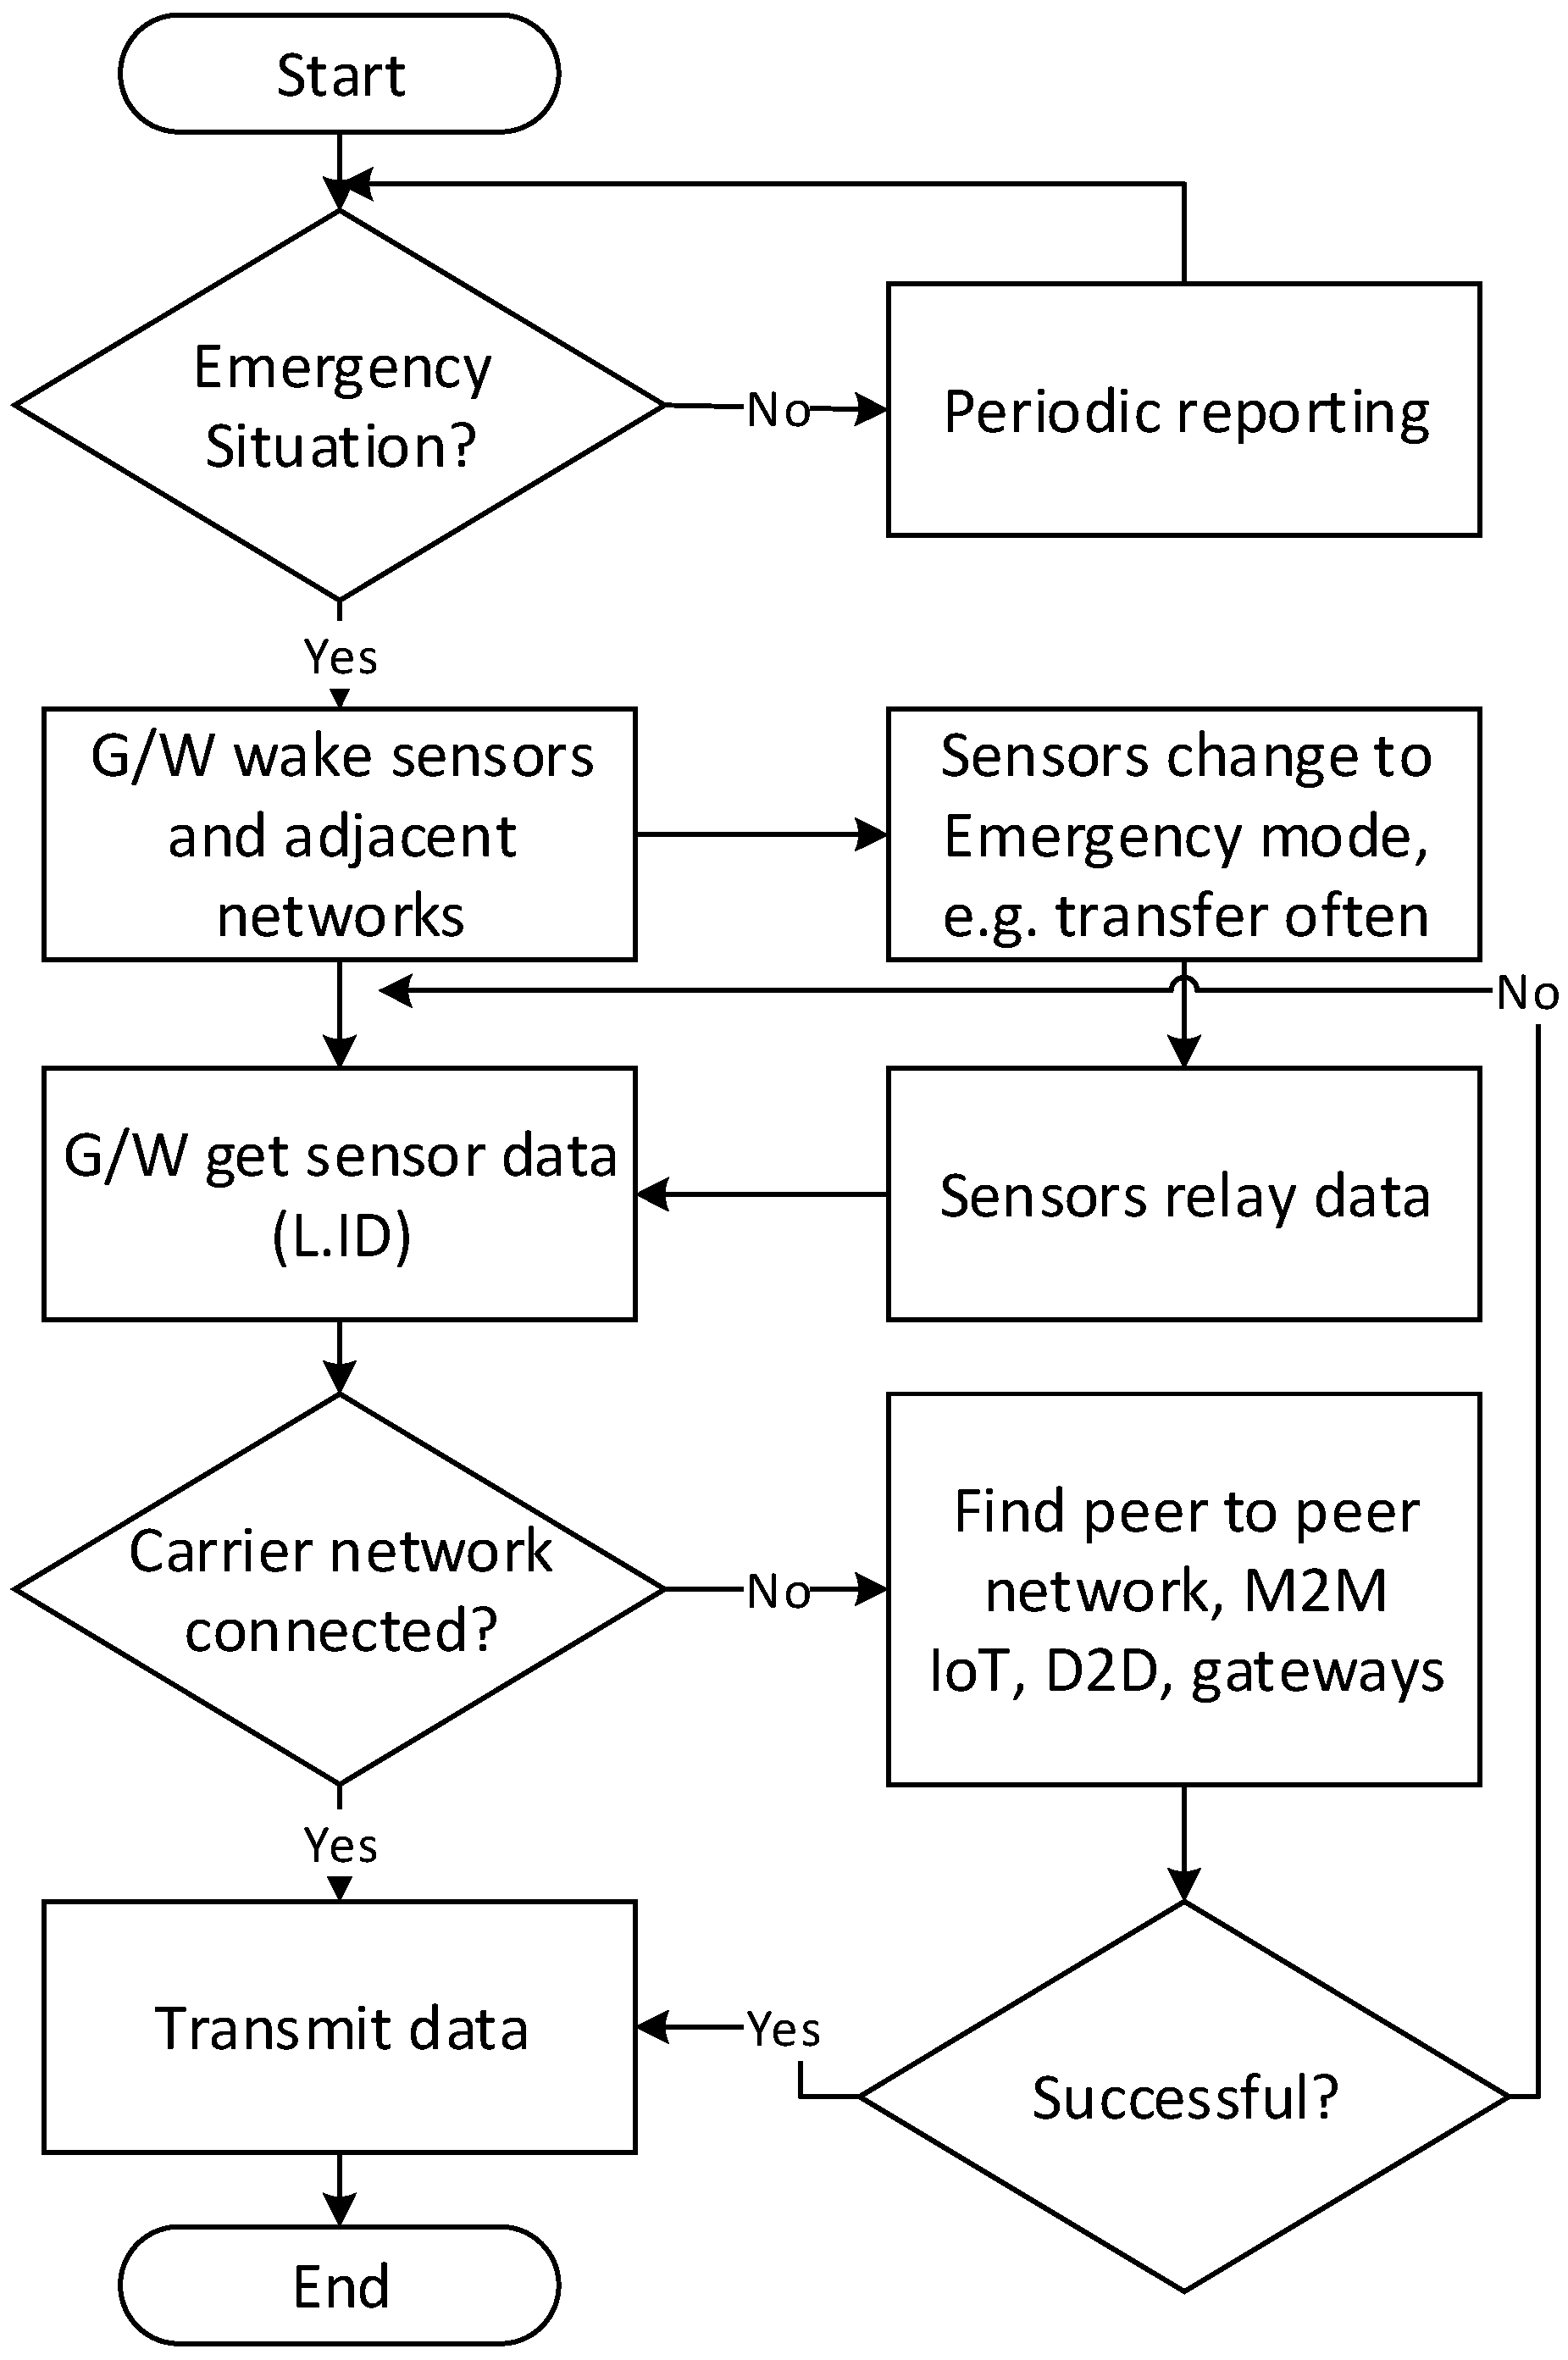
LPWAN gateways may transmit the calls to cellular or other networks as needed and as applicable. For example, some areas may not be covered by mobile networks but are covered by circuit switched networks. In the case of a disaster situation, some or all of the networks may not be available, and the LPWAN may connect to peer networks such as the IoT network. In any case, the destination network where the disaster centre is connected to is likely to be in a carrier network such as 3G mobile or PSTN numbers, depending on what number has been dialled by the gateway. Figure 2 shows emergency procedures of a gateway and sensors in an LPWAN.
4. Application
A series of bushfires known as Black Saturday burned across the state of Victoria, Australia, on 7 February 2009 during extreme weather conditions. Around midday, wind speeds reached their peak and along with arid conditions, sparked a bushfire that became the deadliest and most intense firestorm ever experienced in Australia’s history. This disaster resulted in the deaths of 173 people, with 414 injured, 450,000 hectares of area burned and an economic loss of more than $4 billion USD [31,32].
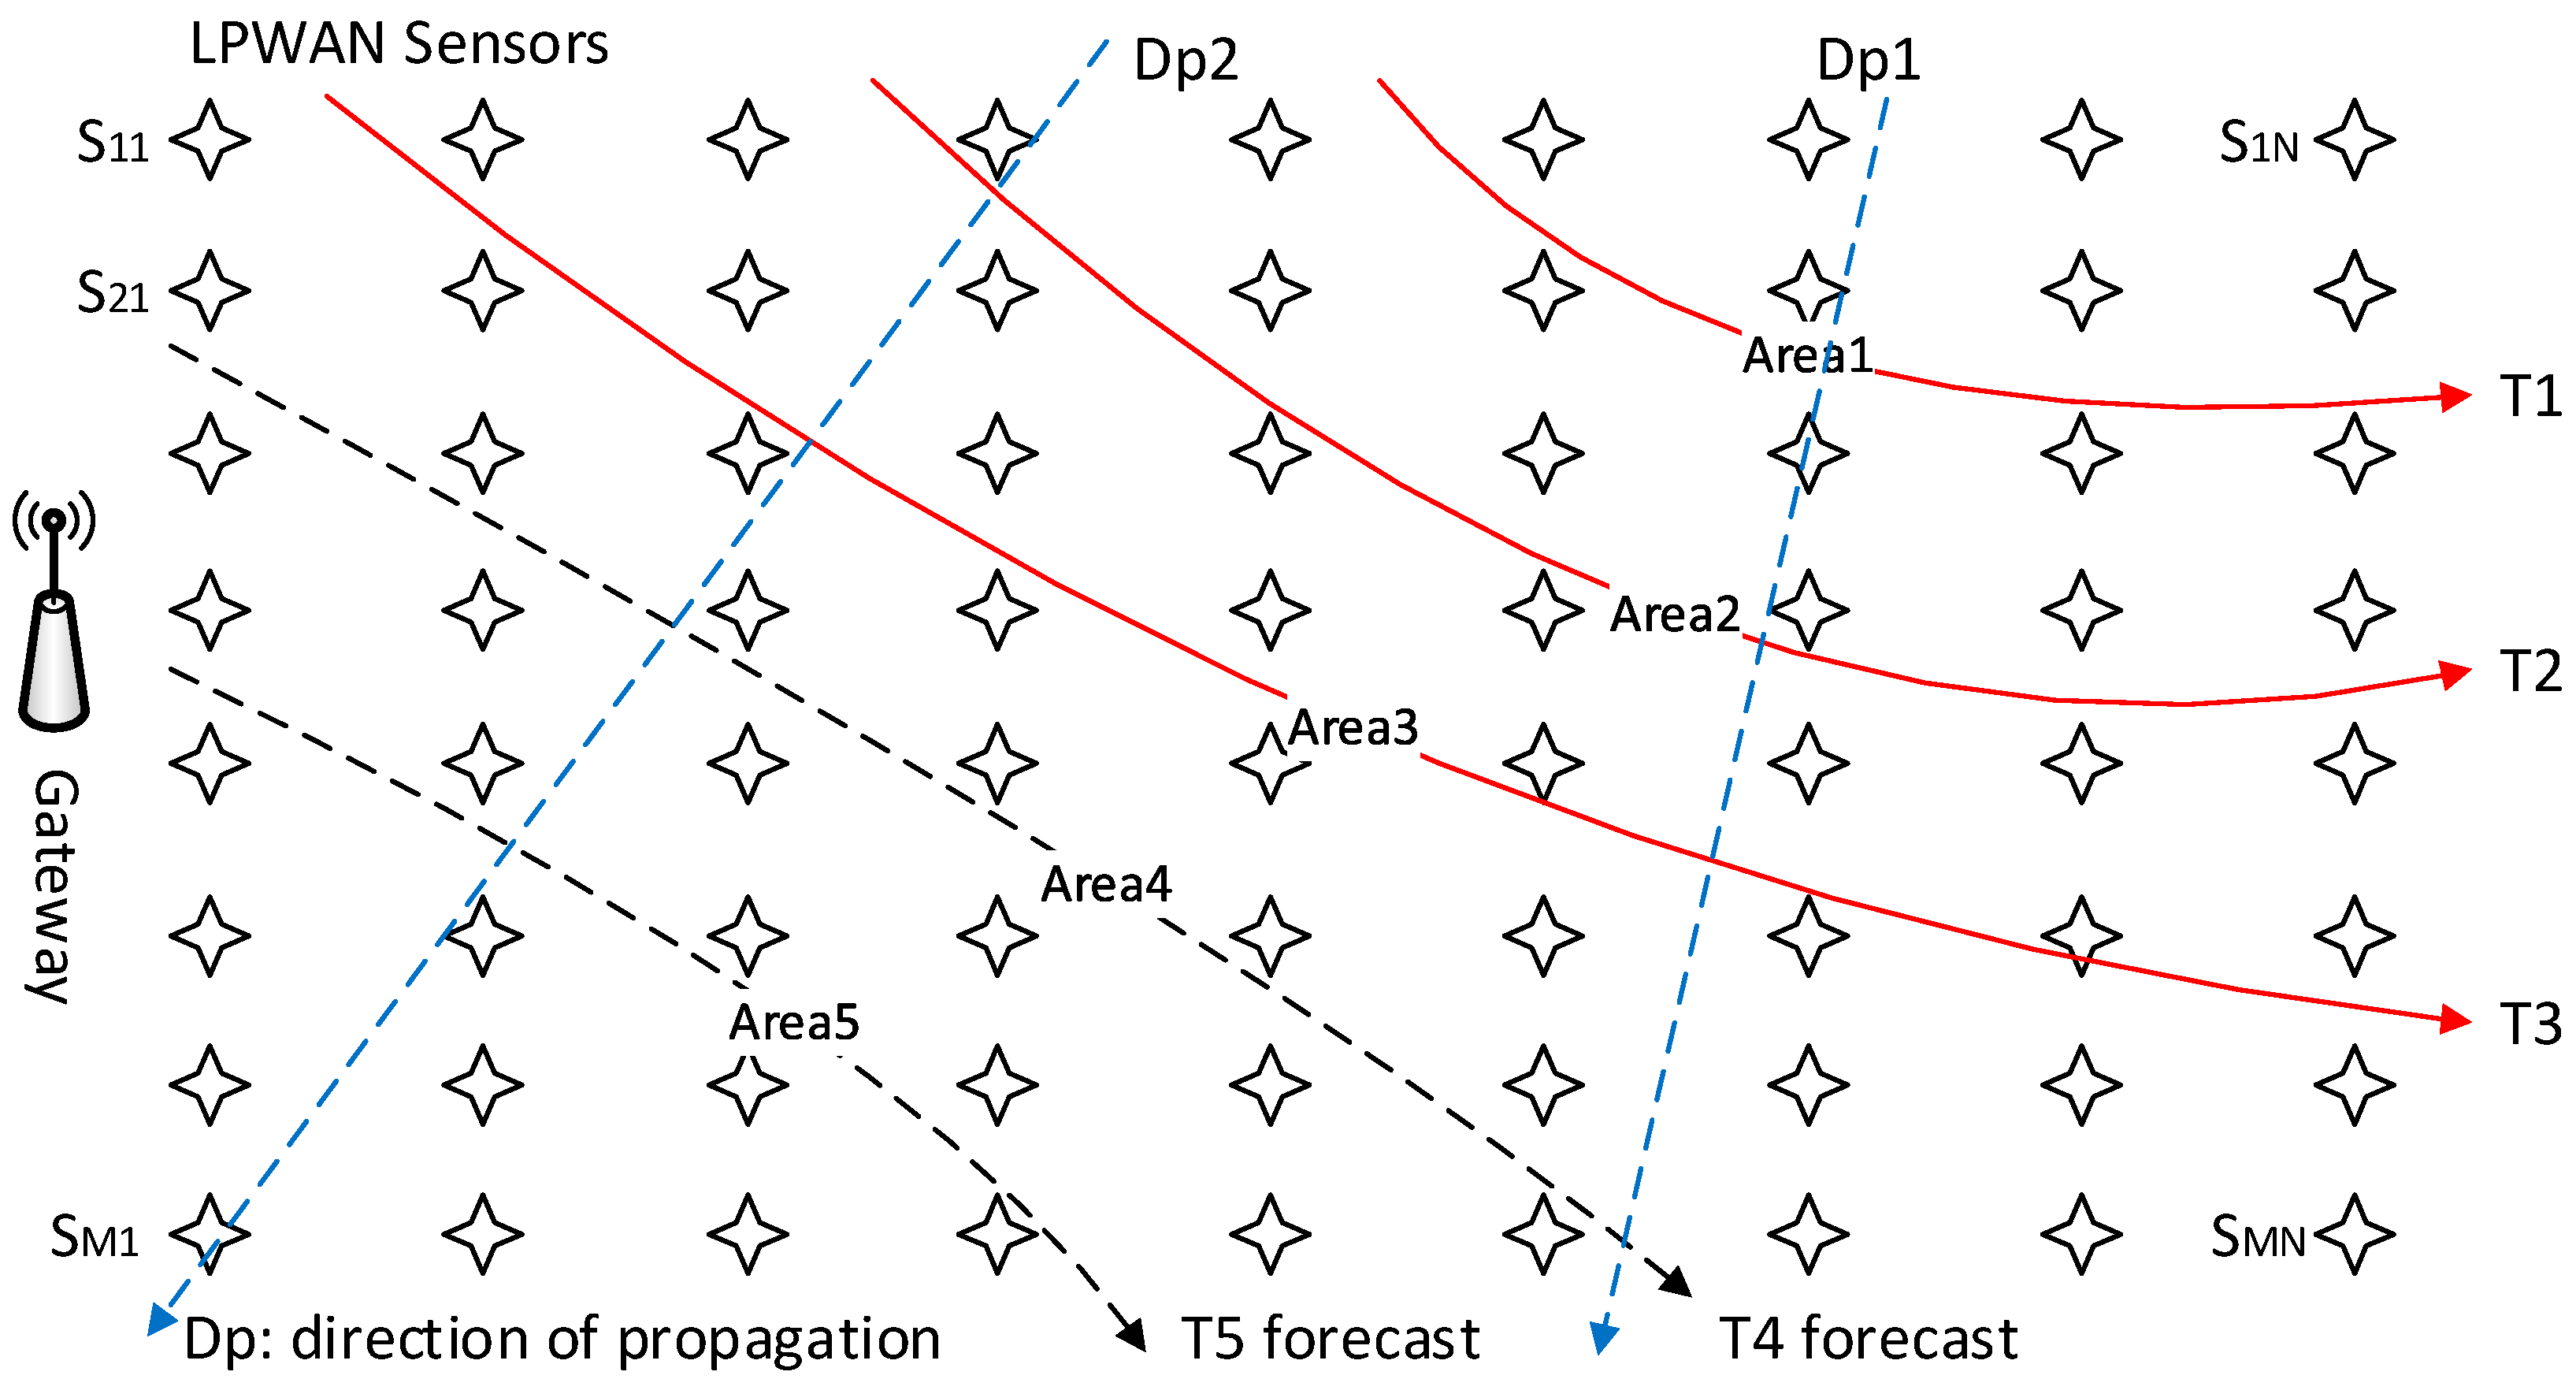
For the purposes of demonstration, a bushfire scenario is considered to simulate sensed data collection by gateways for transmission to the DRA, where the data can be analysed for predicting areas that may be further impacted. Sensed data within LPWANs may be aggregated at a gateway independently from public networks. The original sensor’s (triggered sensor) LID and timestamp is relayed to the next sensor until it reaches a gateway. Figure 3 demonstrates that at a particular time T1, Area1 is affected by the disaster, and by T2, it has spread to Area2. Eventually at T3 and its affected area, our aim is to forecast the Area4 at T4 using the previous data, that is, Areas (location information), at times T1, T2 and T3. The directions of propagation are constantly calculated and reflected in the forecast, which will be recalculated for each subsequent time period. In other words, the estimated area of Area4 and the area that is actually affected at T4 are used to forecast Area5 at T5.
Bushfire behaviour is rather complex. It varies widely depending on variables such as air temperature, humidity, wind speed and direction, terrain, fuel load in the form of dry vegetation, as well as many other factors. Theoretical models for fire prediction which take these into account have been designed and are being constantly improved. One of the most high-resolution methods of bushfire measurements for monitoring and theoretical model verification purposes rely on expensive surveys using on-board infrared equipment on aircraft flying over the fire, which are unable to provide continuous data for extended periods of time. It should be mentioned that the sensor network approach relies on actual measurements received from the sensors at regular intervals, which allows for timely correction of any differences between measured and predicted data.
LID and timestamp information, as well as signal status, are vital information in identifying areas affected by the disaster. For example, sensor S1N as shown in Figure 3 is considered to be affected when the gateway loses its signal in comparison to the previous time it was online [T = TN − (TN−1)]. The prediction of areas of future impact can be calculated as follows. The parameters of interest from each sensor can be represented by a matrix that mirror sensor locations.
In bushfire monitoring for instance, the parameter of interest PMN is the air temperature at each sensor. When the number of sensors returning parameter values exceeding the threshold allowed is reached, the disaster response is triggered. The direction of propagation, its rate of change and its velocity can be calculated by knowing the geographical position (xy coordinates) of the triggered sensors (xMN, yMN), the time this occurred (T1), and then tracking the propagation of the increased parameter values to the surrounding sensors at T2.
Considering an ambient temperature of 25 °C, a contour plot example of the temperature distribution that has been read from the sensor networks is shown in Figure 4. The location of each sensor has been shown as an overlay. At T1, a number of sensors that have exceeded the trigger temperature (Ptr) are shown by the red zone. Zones that have medium and low impact respectively have been shown in yellow and blue. Zones that are still at ambient temperature and that have not been affected are shown in white. Isovalue contours (points with the same temperature) could be plotted from sensor data for the creation of a 2D map of parameter values, determination of the disaster propagation front, directions of disaster propagation and the calculation of affected areas. The direction of disaster propagation is perpendicular to the propagation front and is different at each location.
The subsequent changing of impact status at each location at T2 is shown in Figure 5. The rate of change of the parameter (temperature) at each sensor location can be shown as
where parameter measurements P are obtained from a particular sensor at successive moments in time (in our example, TN = T2 and TN−1 = T1). The rate of parameter change, R, can be represented in a matrix to reflect values at each sensor as
where RMN are rate of change values for individual sensors. As an example, the following reflects the rate of parameter change at sensor S11.
Temperature rise at T3 can be predicted at each sensor location. Sensors closer to the fire would be affected to a greater extent and experience a greater rate of temperature change until the maximum temperature is reached or the sensor goes offline [33]. Parameter values at time TN+1 at each sensor can be predicted as
The 2D impact map is then updated to reflect the new parameter values at each sensor and the new impact zones are reallocated accordingly. The predicted value can be compared with the actual value measured at time TN+1, and the rate of change for the next prediction at T4 can be corrected as
where
While this method can be used to predict temperature at a particular sensor, it cannot be applied to sensors that have not yet been affected without some degree of extrapolation. In estimating the future parameter values for these sensors, a 2D vector map of the disaster propagation velocities should be established. As a vector quantity, velocity is characterized by both magnitude as well as direction. For a rectangular array of sensors, the velocity of disaster propagation can be calculated along each of the horizontal (x axis) and vertical (y axis) directions as
where dx and dy are the distance between the sensors in x and y directions, and t is the time taken for the second sensor to reach the same value as the first. To calculate the total velocity at a location, both the vector sum of horizontal and vertical components of velocity should be used
Distances dx and dy can be thought of as distances by which a selected isovalue contour has shifted along a horizontal or vertical direction per measured time interval. The total velocity direction should coincide with the direction of disaster propagation, which is perpendicular to the isovalue contour at each sensor location. Figure 4 and Figure 5 show the directions of disaster propagation for a few sensors. The spread of the disaster into a new location can be predicted by calculating the distance the fire will progress along each horizontal and vertical direction
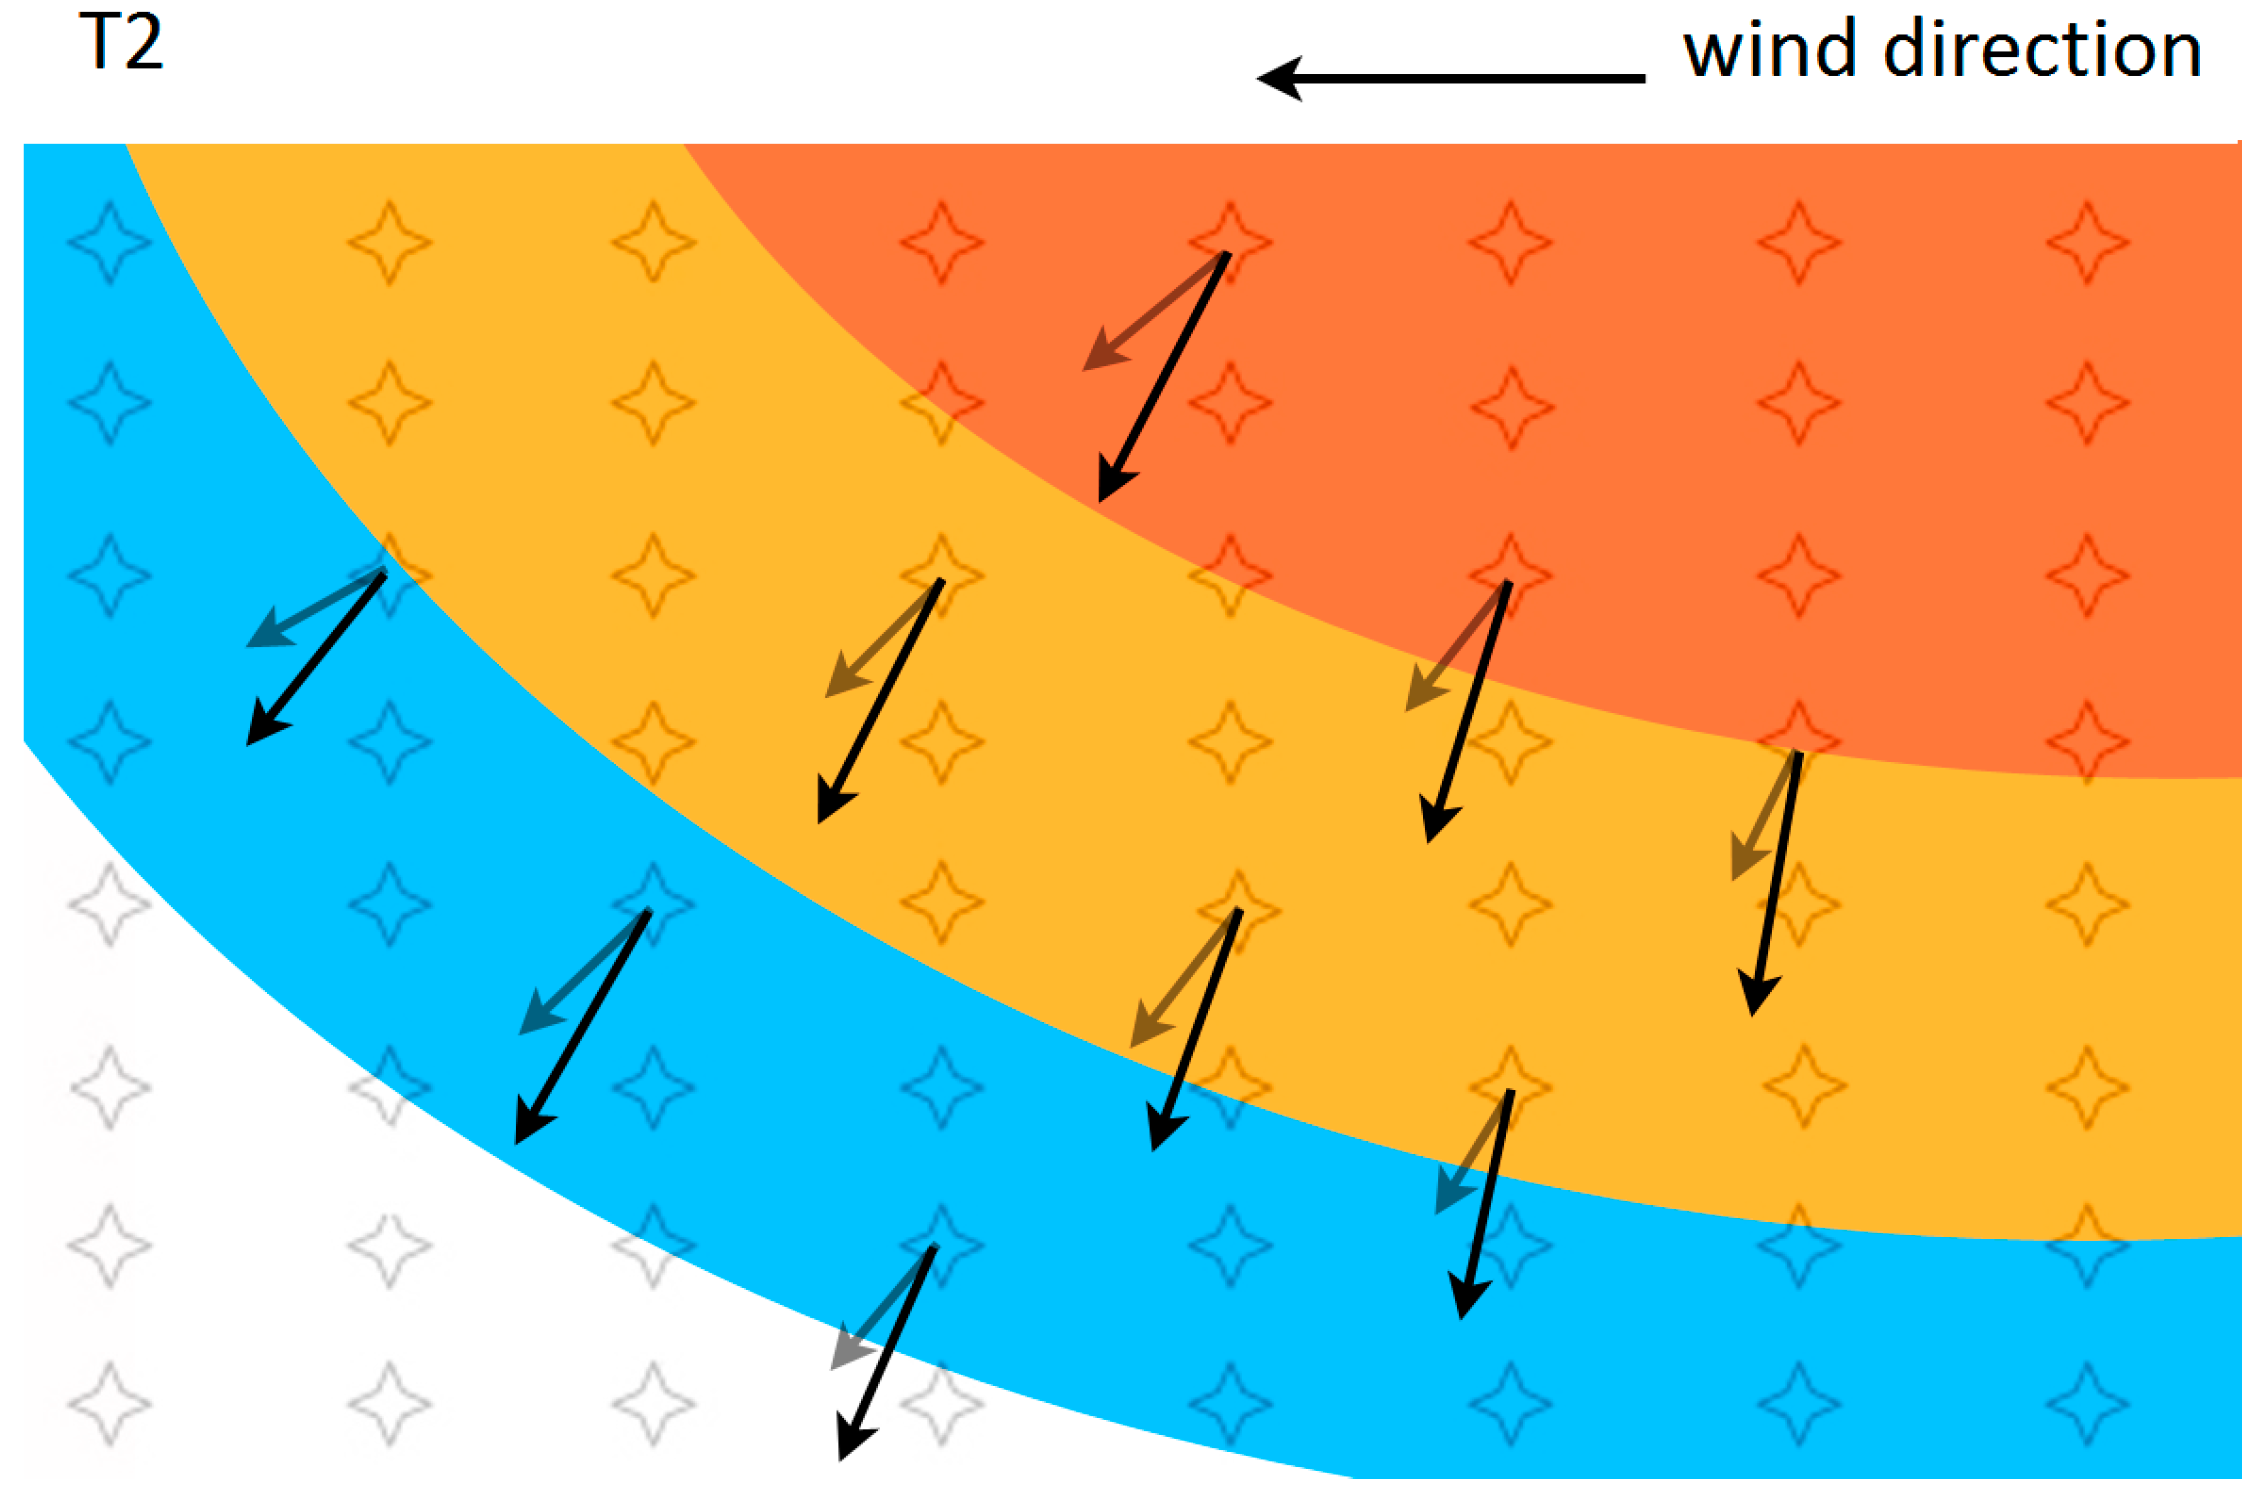
where (x0, y0) are coordinates of the initial fire location and (x, y0) to (x0, y) are the fire spread locations. Factors such as wind speed and direction will influence the bush fire behaviour, and an example of the effect of wind on fire propagation has been shown in Figure 6. A westerly wind direction (right to left) results in a faster velocity of propagation in the horizontal direction, as compared to Figure 5, which shows fire propagation without the wind variable.
where vyw is fire velocity with wind, vy is the original fire velocity and k is the coefficient of proportionality reflecting the contribution of wind velocity to the original velocity of fire propagation. The result is a change in both the magnitude and direction of the velocity, which is reflected by a distortion of the propagation front as compared to without the wind variable. Both the direction for cases with the wind and without have been shown in the figure to demonstrate the effect of rotation of all propagation fronts. However, there is no need to change the calculation approach. The same formulas can be used to calculate the fire propagation velocity. As the data are taken from real time sensor measurements, the effect of wind and other factors are already reflected in the parameter values PN used for calculations.
5. Conclusions
LPWAN is an emerging technology, which may connect to the IoT and public carrier networks for disaster monitoring and recovery networks. We proposed to use calling party numbers (PAN) to forward location information (and measurements of sensors) of individual sensors to a destination such as a disaster centre (e.g., DRA) in order to be analysed and processed for disaster management. This can be done by minimal changes to carrier networks to allow the PAN to go through the networks. Despite the fact that it may require additional configuration in carrier networks, it will be useful in developing countries where there are less sophisticated network technologies. Using the PAN carrying the location and timestamp data of sensors, we showed an application of the idea in a bushfire situation. This is shown by utilising isovalue contours and calculations of matrices for the rate of temperature change at each sensor, as well as the velocities and directions of disaster propagation at each impact zone. The calculations for prediction the spread to further areas of impact in time were suggested. It can potentially be useful in remote areas utilising LPWAN for several hundred kilometres of coverage through a single gateway. For future study, a verification of this project by real tests should be conducted. In addition, more comprehensive disaster scenarios reflecting variables such as wind speed and direction, humidity, density of flora and temperature may be developed and modelled to help real disaster situations.
Author Contributions
James Jin Kang conceived and designed the solution and application, and wrote the paper. Sasan Adibi reviewed and provided guidance.
Conflicts of Interest
The authors declare no conflict of interest.
References
- Schuster, M. National and International Disaster Response; Austrian Armed Forces NBC-Defence School: Vienna, Austria, 2011. [Google Scholar]
- Adibi, S. A mobile health network disaster management system. In Proceedings of the 2015 Seventh International Conference on Ubiquitous and Future Networks (ICUFN), Sapporo, Japan, 7–10 July 2015; pp. 424–428. [Google Scholar]
- Gomes, T.; Tapolcai, J.; Esposito, C.; Hutchison, D.; Kuipers, F.; Rak, J.; de Sousa, A.; Iossifides, A.; Travanca, R.; André, J.; et al. A survey of strategies for communication networks to protect against large-scale natural disasters. In Proceedings of the 2016 8th International Workshop on Resilient Networks Design and Modeling (RNDM), Halmstad, Sweden, 13–15 September 2016; pp. 11–22. [Google Scholar]
- Xiong, X.; Zheng, K.; Xu, R.; Xiang, W.; Chatzimisios, P. Low power wide area machine-to-machine networks: Key techniques and prototype. IEEE Commun. Mag. 2015, 53, 64–71. [Google Scholar] [CrossRef]
- Petäjäjärvi, J.; Mikhaylov, K.; Hämäläinen, M.; Iinatti, J. Evaluation of LoRa LPWAN technology for remote health and wellbeing monitoring. In Proceedings of the 2016 10th International Symposium on Medical Information and Communication Technology (ISMICT), Worcester, MA, USA, 20–23 March 2016; pp. 1–5. [Google Scholar]
- Nolan, K.E.; Guibene, W.; Kelly, M.Y. An evaluation of low power wide area network technologies for the Internet of Things. In Proceedings of the 2016 International Wireless Communications and Mobile Computing Conference (IWCMC), Paphos, Cyprus, 5–9 September 2016; pp. 439–444. [Google Scholar]
- Evans, D. The Internet of Things—How the Next Evolution of the Internet Is Changing Everything; CISCO IBSG: San Jose, CA, USA, 2011; pp. 1–11. [Google Scholar]
- Adibi, S.; Labrador, C.; Simmons, S. Method and System for Peer-to-Peer (P2P) Ad-Hoc Location Determination Routing Protocol. U.S. Patent 8,843,104 B2, 23 Septrember 2014. [Google Scholar]
- Dalela, P.K.; Yadav, A.; Sachdev, S.; Yadav, A.; Basu, S.; Tyagi, V. Alarm notification to tower monitoring system in oneM2M based IoT networks. In Proceedings of the 2016 International Conference on Advances in Computing, Communications and Informatics (ICACCI), Jaipur, India, 21–24 September 2016; pp. 2405–2409. [Google Scholar]
- Kang, J.J.; Luan, T.H.; Larkin, H. Alarm Notification of Body Sensors Utilising Activity Recognition and Smart Device Application. In Proceedings of the 14th International Conference on Advances in Mobile Computing and Multi Media, Singapore, 28–30 November 2016. [Google Scholar]
- Kang, J.J.; Larkin, H. Inference of Personal Sensors in the Internet of Things. Int. J. Inf Commun. Technol. Appl. 2016, 2, 1–23. [Google Scholar] [CrossRef]
- Kang, J. An Inference System Framework for Personal Sensor Devices in Mobile Health and Internet of Things Networks. Ph.D. Thesis, School of Information Technology, Deakin University, Burwood Victoria, Australia, 2017. [Google Scholar]
- Kang, J.J.; Luan, T.; Larkin, H. Data Processing of Physiological Sensor Data and Alarm Determination Utilising Activity Recognition. Int. J. Inf. Commun. Technol. Appl. 2016, 2, 108–131. [Google Scholar]
- Kang, J.J.; Larkin, H.; Luan, T.H. Enhancement of Sensor Data Transmission by Inference and Efficient Data Processing. In Applications and Techniques in Information Security; Batten, L., Li, G., Eds.; Springer: Singapore, 2016; pp. 81–92. [Google Scholar]
- Tolhurst, K.; Shields, B.; Chong, D. Phoenix: Development and application of a bushfire risk management tool. Aust. J. Emerg. Manag. 2008, 23, 47. [Google Scholar]
- Dongare, A.; Hesling, C.; Bhatia, K.; Balanuta, A.; Pereira, R.L.; Iannucci, B.; Rowe, A. OpenChirp: A Low-Power Wide-Area Networking architecture. In Proceedings of the 2017 IEEE International Conference on Pervasive Computing and Communications Workshops (PerCom Workshops), Kona, HI, USA, 13–17 March 2017; pp. 569–574. [Google Scholar]
- Broch, J.; Maltz, D.A.; Johnson, D.B.; Hu, Y.-C.; Jetcheva, J. A performance comparison of multi-hop wireless ad hoc network routing protocols. In Proceedings of the 4th Annual ACM/IEEE International Conference on Mobile Computing and Networking, Dallas, TX, USA, 25–30 October 1998; pp. 85–97. [Google Scholar]
- Camp, T.; Boleng, J.; Davies, V. A survey of mobility models for ad hoc network research. Wirel. Commun. Mobile Comput. 2002, 2, 483–502. [Google Scholar] [CrossRef]
- Walsh, B.W. Balloon Network Test Successful. Taylor University News, 11 May 2007. [Google Scholar]
- DeVaul, R.W.; Teller, E.; Biffle, C.L.; Weaver, J. Balloon Network with Free-Space Optical Communication between Super-Node Balloons and RF Communication between Super-Node and Sub-Node Balloons. U.S. Patent 20,130,177,321, 11 July 2013. [Google Scholar]
- Campbell, J.S. Aerial Communications Network Including a Plurality of Aerial Platforms. U.S. Patent 6,167,263, 26 December 2000. [Google Scholar]
- Teller, E.; Cassidy, M.; Biffle, C.L.; DeVaul, R.W. Use of Satellite-Based Routing Processes with a Balloon Network. U.S. Patent 8,918,047, 23 December 2014. [Google Scholar]
- Teller, E.; DeVaul, R.W.; Biffle, C.L.; Weaver, J. Virtual Pooling of Local Resources in a Balloon Network. U.S. Patent 8,996,024, 31 March 2015. [Google Scholar]
- Moyer, B. Low Power, Wide Area, A Survey of Longer-Range IoT Wireless Protocols. Available online: http://www.eejournal.com/article/20150907-lpwa/ (accessed on 21 May 2017).
- Premkumar, R. Wireless Networks for Disaster Relief. Available online: http://www.cse.wustl.edu/~jain/cse574-14/ftp/disaster.pdf (accessed on 8 October 2017).
- Jimmy, N.Y.; Brock, T.K.; Mecozzi, D.M.; Tran, N.K.; Kost, G.J. Future connectivity for disaster and emergency point of care. Point Care 2010, 9, 185–192. [Google Scholar]
- Alazawi, Z.; Alani, O.; Abdljabar, M.B.; Altowaijri, S.; Mehmood, R. A smart disaster management system for future cities. In Proceedings of the 2014 ACM International Workshop on Wireless and Mobile Technologies for Smart Cities, Philadelphia, PA, USA, 11 August 2014; pp. 1–10. [Google Scholar]
- Kramer, B. LPWAN—Licensed vs. Unlicensed. Available online: http://www.korewireless.com/blog/lpwan-licensed-vs.-unlicensed (accessed on 28 September 2017).
- ITU-T. Complement to ITU-T Recommendation E.164 (11/2010). In Annex to ITU Operational Bulletin No. 991—1.XI.2011; International Telecommunication Union: Geneva, Switzerland, 2010. [Google Scholar]
- 3GPP. Mobile Radio Interface Layer 3 Specification; Core Network Protocols; Stage 3; 3GPP: Nice, France, 2016. [Google Scholar]
- Shahparvari, S.; Chhetri, P.; Abbasi, B.; Abareshi, A. Enhancing emergency evacuation response of late evacuees: Revisiting the case of Australian Black Saturday bushfire. Trans. Res. Part E Logist. Transp. Rev. 2016, 93, 148–176. [Google Scholar] [CrossRef]
- Teague, B.; McLeod, R.; Pascoe, S. Victorian Bushfires Royal Commission Final Report; Parliament of Victoria: Melbourne, Australia, 2010.
- Zhao, H.; Ladommatos, N. Optical diagnostics for soot and temperature measurement in diesel engines. Prog. Energy Combust. Sci. 1998, 24, 221–255. [Google Scholar] [CrossRef]
Figure 1.
End-to-end network topology for low-power wide-area network (LPWAN) and carrier networks. LID (Location ID) is carried within LPWAN to the gateway, which connects to public networks in the form of calling party address (PAN) of existing signalling systems such as public switched telephone network (PSTN) or cellular networks.
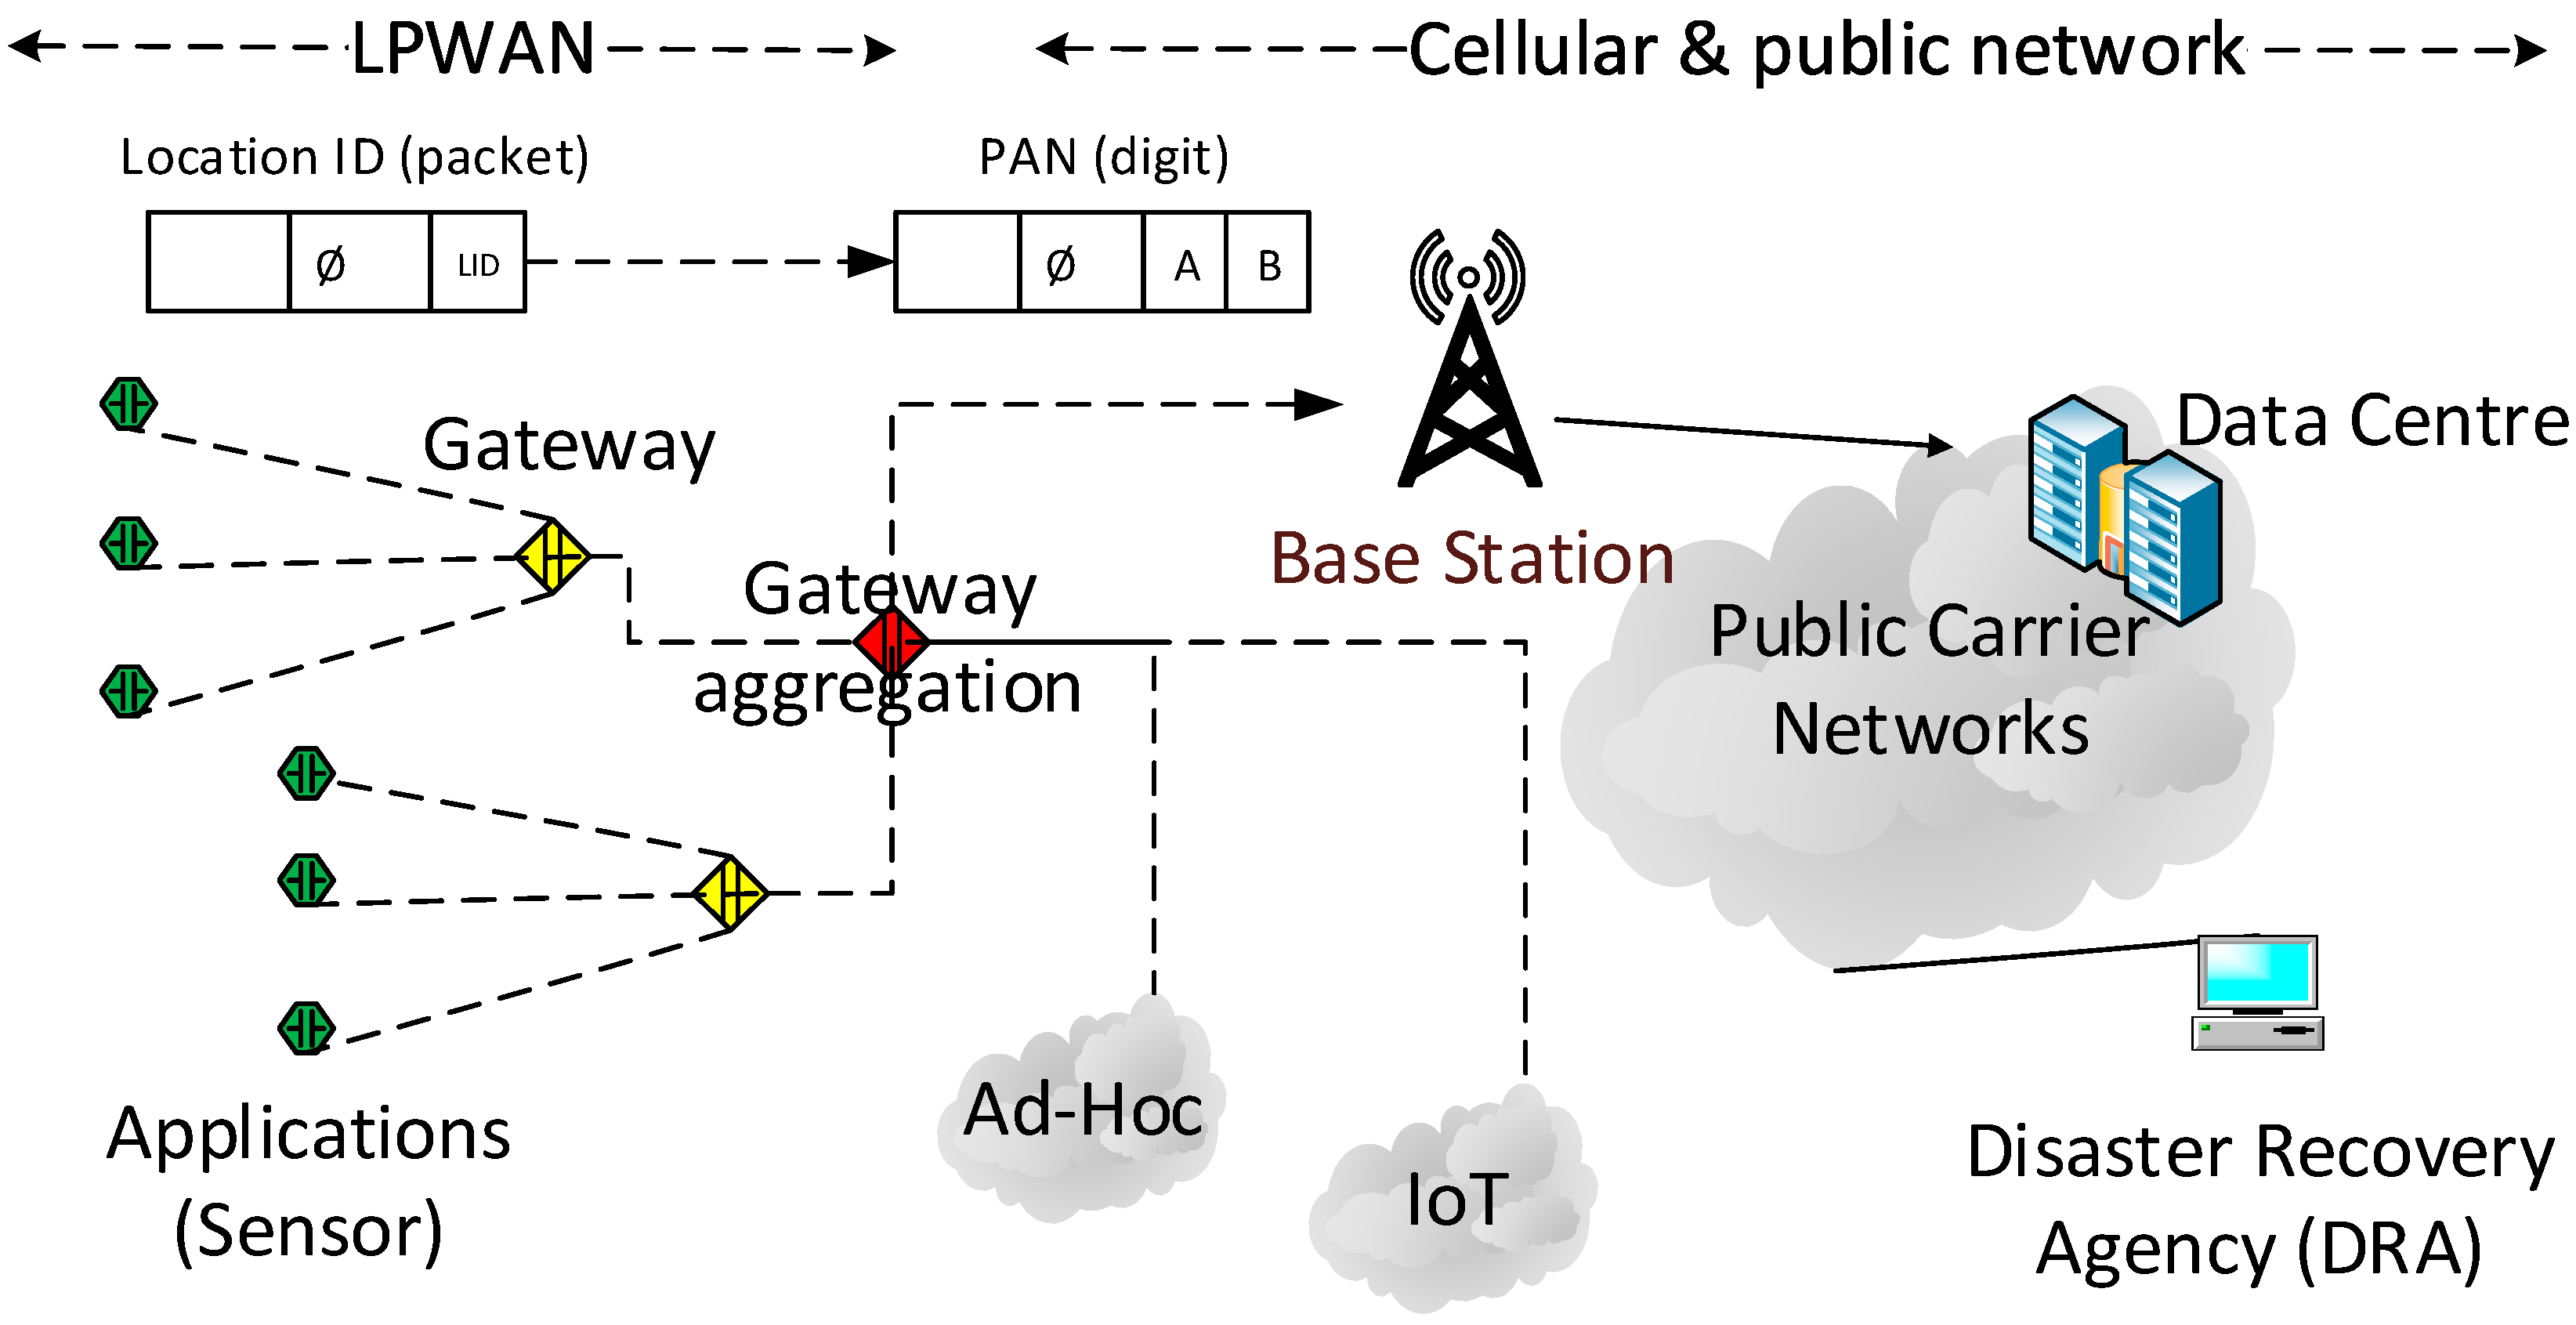
Figure 2.
Emergency procedures of LPWAN gateways.

Figure 3.
LPWAN sensors and gateway triggered in a timely manner. Triggered sensors are grouped geographically at each time (Tn), and the LID and timestamp are used to calculate the map of impact. Direction of propagation (Dp) is used to predict the future impact.
Figure 3.
LPWAN sensors and gateway triggered in a timely manner. Triggered sensors are grouped geographically at each time (Tn), and the LID and timestamp are used to calculate the map of impact. Direction of propagation (Dp) is used to predict the future impact.

Figure 4.
An example contour plot of the temperature distribution of the sensor network at time T1. The locations of sensors are overlaid on the plot. Direction of disaster propagation is shown with arrows at selected sensors.
Figure 4.
An example contour plot of the temperature distribution of the sensor network at time T1. The locations of sensors are overlaid on the plot. Direction of disaster propagation is shown with arrows at selected sensors.
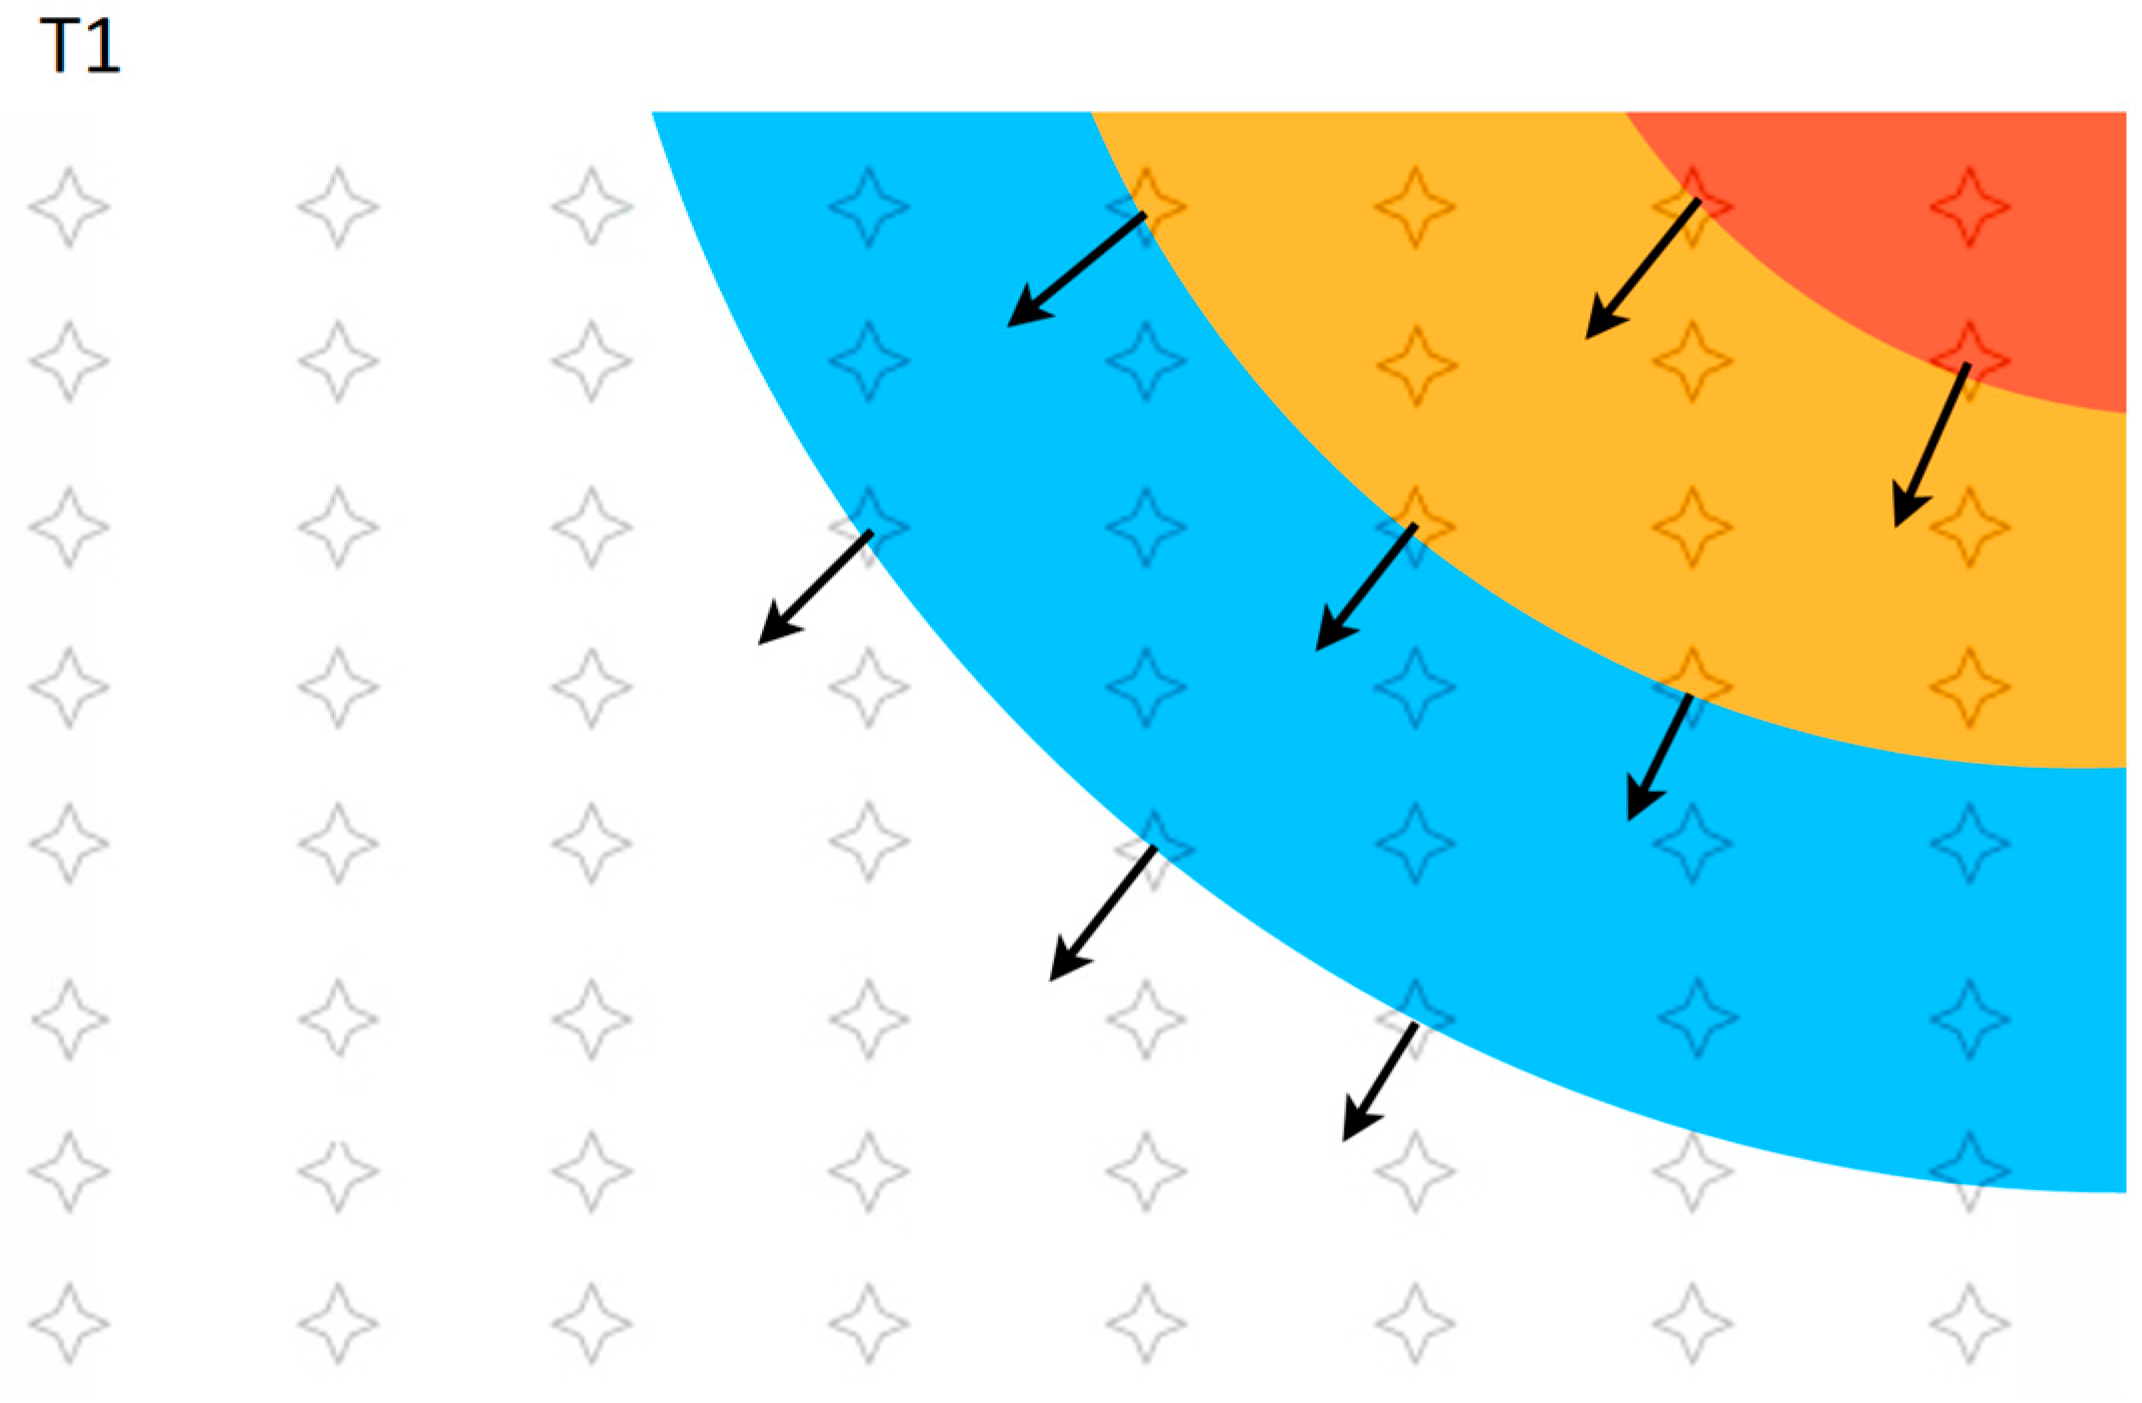
Figure 5.
An example contour plot of the temperature distribution of the sensor network at time T2. The locations of sensors are overlaid on the plot. Direction of disaster propagation is shown with arrows at selected sensors.
Figure 5.
An example contour plot of the temperature distribution of the sensor network at time T2. The locations of sensors are overlaid on the plot. Direction of disaster propagation is shown with arrows at selected sensors.
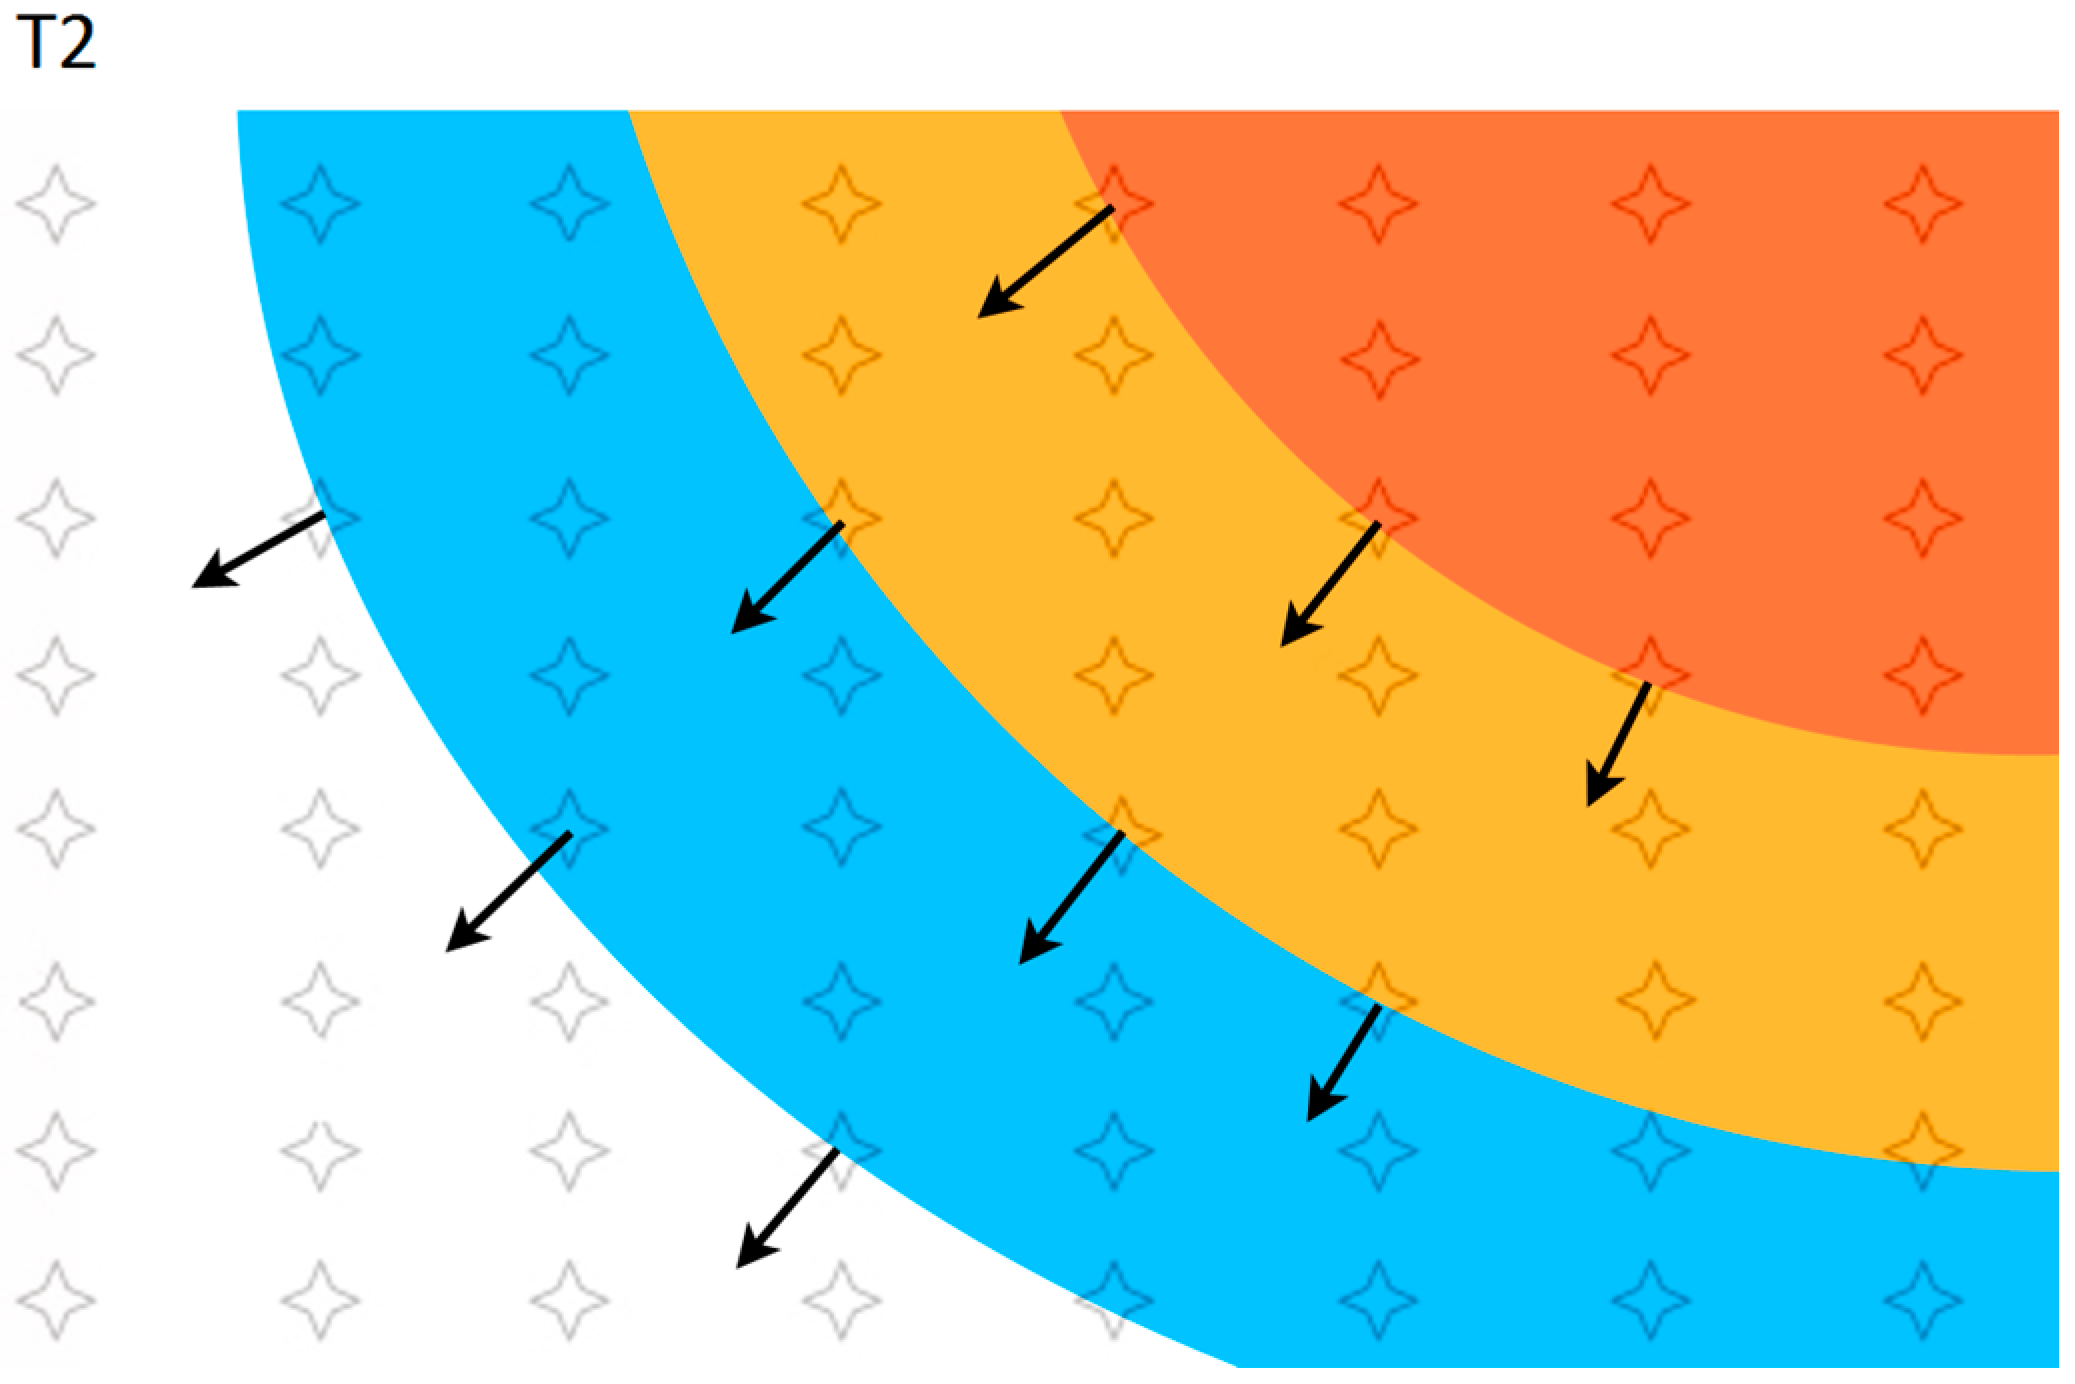
Figure 6.
An example contour plot of the temperature distribution from the sensor network at time T2, with the effect of wind. The locations of sensors are overlaid on the plot. The direction of disaster propagation for selected sensors is shown by the black arrows. The grey arrows show the direction of disaster propagation from Figure 5 without the effect of wind for comparison.

Table 1.
Licensed and unlicensed spectrum technology option (adapted from [28]). Long-term evolution for machines (LTE-M); (NB-IoT); Random Phase Multiple Access (RPMA); long-range (LoRa); Location-based service (LBS); Global Positioning System (GPS).
Table 1.
Licensed and unlicensed spectrum technology option (adapted from [28]). Long-term evolution for machines (LTE-M); (NB-IoT); Random Phase Multiple Access (RPMA); long-range (LoRa); Location-based service (LBS); Global Positioning System (GPS).
| Requirements | Licensed Spectrum | Unlicensed Spectrum | |||
|---|---|---|---|---|---|
| LTE-M | NB-IoT | SigFox | LoRa | RPMA | |
| Coverage | 160 dB | 164 dB | 149 dB | 157 dB | 177 dB |
| Bandwidth | 1 MHz | 180 KHz | 100 Hz | 125 KHz | 1 MHz |
| Battery Life | 10+ years | 10+ years | 10+ years | 10+ years | 10+ years |
| Throughput | 1 Mbps | 250 Kbps | 100 bps | 290 bps–50 Kbps | 624 Kbps |
| 2 Way Data TX | Yes | Yes | No | Depends | Yes |
| Security | 3GPP (128–256 bit) | 3GPP (128–256 bit) | 16 bit | 32 bit | AES 128 bit |
| Scalability | High | High | Low | Medium | High |
| Mobility Support | Connected & Idle mode | Idle mode | No | Yes | Yes |
| LBS Support | Requires GPS | Requires GPS | No | Yes | Requires GPS |
Table 2.
Number structure for geographical area (adapted from [29]).
Table 2.
Number structure for geographical area (adapted from [29]).
| Country Code | National Destination Code (Optional) | Subscriber Number |
|---|---|---|
| National (Significant) | ||
| cc = 1-3 digits | maximum = 15-cc = 12 to 14 digits | |
| International public telecommunication number for geographic areas (maximum 15 digits) | ||
Table 3.
PAN Presentation Numbering Scheme: Example (12 digits). X (1st digit for network ID), Y (2nd digit for application ID), ACBDE (3rd to 7th digits), JKLMN (8th to 12th digits)
Table 3.
PAN Presentation Numbering Scheme: Example (12 digits). X (1st digit for network ID), Y (2nd digit for application ID), ACBDE (3rd to 7th digits), JKLMN (8th to 12th digits)
| X (1) | Y (1) | ABCDE (5) | JKLMN (5) |
|---|---|---|---|
| Network ID (0–9) | Application ID (0–9) | North Coordinate | West Coordinate |
| Degrees + minutes + seconds | Degrees + minutes + seconds | ||
| Minutes + seconds | Minutes + seconds | ||
| Proprietary LID | Proprietary LID |
© 2017 by the authors. Licensee MDPI, Basel, Switzerland. This article is an open access article distributed under the terms and conditions of the Creative Commons Attribution (CC BY) license (http://creativecommons.org/licenses/by/4.0/).
Share and Cite
MDPI and ACS Style
Kang, J.J.; Adibi, S. Bushfire Disaster Monitoring System Using Low Power Wide Area Networks (LPWAN). Technologies 2017, 5, 65. https://doi.org/10.3390/technologies5040065
AMA Style
Kang JJ, Adibi S. Bushfire Disaster Monitoring System Using Low Power Wide Area Networks (LPWAN). Technologies. 2017; 5(4):65. https://doi.org/10.3390/technologies5040065
Chicago/Turabian StyleKang, James Jin, and Sasan Adibi. 2017. "Bushfire Disaster Monitoring System Using Low Power Wide Area Networks (LPWAN)" Technologies 5, no. 4: 65. https://doi.org/10.3390/technologies5040065
Note that from the first issue of 2016, this journal uses article numbers instead of page numbers. See further details here.