Article

Quantification of Feto-Maternal Heart Rate from Abdominal ECG Signal Using Empirical Mode Decomposition for Heart Rate Variability Analysis

by
Abdullah Bin Queyam
*,†,
Sharvan Kumar Pahuja
and
Dilbag Singh
Department of Instrumentation and Control Engineering, Dr. B. R. Ambedkar National Institute of Technology, Jalandhar, Punjab 144011, India
*
Author to whom correspondence should be addressed.
These authors contributed equally to this work.
Technologies 2017, 5(4), 68; https://doi.org/10.3390/technologies5040068
Submission received: 12 September 2017 / Revised: 10 October 2017 / Accepted: 18 October 2017 / Published: 21 October 2017

Abstract

:
In this paper, a robust method of feto-maternal heart rate extraction from the non-invasive composite abdominal Electrocardiogram (aECG) signal is presented. The proposed method is based on the Complete Ensemble Empirical Mode Decomposition with Adaptive Noise (CEEMDAN) method, in which a composite aECG signal is decomposed into its constituent frequency components called Intrinsic Mode Functions (IMFs) or simply “modes”, with better spectral separation. Decomposed IMFs are then selected manually according to probable maternal and fetal heart rate information and are processed further for quantification of maternal and fetal heart rate and variability analysis. The proposed method was applied to aECG recordings collected from three different sources: (i) the PhysioNet (adfecgdb) database; (ii) the PhysioNet (nifecgdb) database; and (iii) synthetic aECG signal generated from mathematical modeling in the LabVIEW software environment. An overall sensitivity of 98.83%, positive diagnostic value of 97.97%, accuracy of 96.93% and performance index of 96.75% were obtained in the case of Maternal Heart Rate (MHR) quantification, and an overall sensitivity of 98.13%, positive diagnostic value of 97.62%, accuracy of 95.91% and performance index of 95.69% were obtained in case of Fetal Heart Rate (FHR) quantification. The obtained results confirm that CEEMDAN is a very robust and accurate method for extraction of feto-maternal heart rate components from aECG signals. We also conclude that non-invasive aECG is an effective and reliable method for long-term FHR and MHR monitoring during pregnancy and labor. The requirement of manual intervention while selecting the probable maternal and fetal components from “n” number of decomposed modes limits the real-time application of the proposed methodology. This is due to the fact that the number of modes “n” produced by the CEEMDAN decomposition is unpredictable. However, the proposed methodology is well suited for applications where a small time-delay or offset in feto-maternal monitoring can be acceptable. In future, application-specific modification of the CEEMDAN algorithm can be implemented to eliminate manual intervention completely and will be suitable for long-term feto-maternal monitoring.

1. Introduction

Electronic Fetal Monitoring (EFM) is an essential requirement when assessing the health state of the fetus and its overall growth and development inside the uterus during pregnancy and labor [1]. In high-risk conditions like an Intra-Uterine Growth Retarded (IUGR) fetus or pregnancies complicated by pathologies like diabetes, infections, pre-eclampsia or placental abruption, etc., long-term fetal monitoring is required [2]. Fetal Heart Rate (FHR) analysis using the Cardiotocograph (CTG) or by direct fetal scalp ECG are the most effective techniques for fetal well-being assessment [3]. However, CTG is not suitable for long-term monitoring and requires highly experienced medical personnel for the interpretation of FHR traces. Fetal scalp Electrocardiogram (ECG) recordings are considered to be the gold standard in FHR monitoring, but can only be applied when the membrane has been ruptured [4]. Considering the above limitations, a non-invasive alternative for FHR monitoring is abdominal ECG (aECG) recordings. In the aECG method, electrodes are placed on the mother’s abdomen, which acquire a composite ECG signal, which consists of both fetal ECG (fECG) and maternal ECG (mECG) [5] along with other artifacts like muscle contraction noise, power line interferences, various electrical noise, fetal movement and uterine contractions [6]. The interpretation of morphology, magnitude and frequency of fECG helps physicians to identify overall fetal health state [7]; however, the magnitude of fECG signals is usually overwhelmed by the magnitude of mECG signals, and significant frequency overlaps with other artifacts make the Signal to Noise Ratio (SNR) of the fECG signal very low. Therefore, advanced signal processing techniques are required for the extraction of fECG from the aECG signal [8].
Researchers have been working in this direction and successfully evaluated various advanced signal processing methods. Kanjilal et al. proposed a method based on Singular Value Decomposition (SVD) for extraction of fECG from the single channel aECG signal by decomposing it into orthogonal modes and then selecting the most dominant periodic component by Singular Value Ratio (SVR) spectrum analysis [9]. Based on the Artificial Neural Network (ANN) technique, Hasan et al. used the supervised Multilayer Perception (MLP) network [10]; Jia et al. used the adaptive linear neural network [11]; and Golzan et al. used the multi-layer perceptron neural network model for extraction of fECG [12]. Based on the Adaptive Noise Cancellation (ANC) technique, Zhang et al. used a combination of SVD and Smooth Window (SW) techniques to build a reference signal in an ANC, which is done to eliminate the limitation of having a similar thoracic mECG waveform as that present in acquired the aECG waveform [13], and Zeng et al. proposed a Recursive Least Squares (RLS)-based ANC approach for fECG extraction by elimination of the mECG signal [14]. Based on Principal Component Analysis (PCA), Rahmati et al. detected morphological ECG features like FHR, fetal R-peaks and RR interval from maternal aECG recordings collected from the PhysioNet/Computing in Cardiology Challenge 2013 (CinC2013) [15], Lipponen et al. also used the principal component model for removing the maternal ECG from aECG recordings for the purpose of fetal QRS detection [16], and Petrolis et al. used multistage PCA for the subtraction of mECG from aECG signals, leaving behind a signal with a higher energy of fECG components; they also tested their methodology on the database collected from PhysioNet/CinC2013 [17]. Based on the Blind Source Separation (BSS) technique, He et al. proposed a method of mECG and fECG separation from a single channel abdominal signal. They also used the Empirical Mode Decomposition (EMD) method to decompose the collected single channel signal into multiple Intrinsic Mode Function (IMF) mapping single channels [18]. Ghazdali et al. proposed an approach for denoising of the observed ECG signals using a Bilateral Total Variation (BTV) filter and then minimizing the Kullback–Leibler divergence [19] between copula densities to separate the fECG signal from the mECG [20]. Sato et al. proposed a modified blind source separation with the reference signal (BSSR) for fECG extraction by cancellation of the mECG component [21]. Zarzoso et al. tested three methods for fECG extraction PCA, Higher-Order Singular-Value Decomposition (HOSVD) and Higher-Order Eigenvalue Decomposition (HOEVD) and found that HOEVD was the best amongst them [22]; in a consecutive study, they implemented higher-order statistics and Widrow’s multireference ANC approach for more robust BSS performance in the fECG extraction problem [23]. Based on the Adaptive Neuro-Fuzzy Inference System (ANFIS), Assaleh et al. demonstrated the use of the ANFIS network to identify the nonlinear relationship that exists between the mECG signal acquired from thorax and the mECG component derived from the aECG signal, thus helping in the fECG extraction process by subtracting the aligned version of the mECG signal from the aECG signal [24]. Panigrahy et al. implemented ANFIS along with the Differential Evolution (DE) algorithm and the Extended Kalman Smoother (EKS) for fECG extraction, requiring some degree of operator interaction for assigning the parameters and the EKS state equations [25]. Su et al. applied a nonlinear time-frequency analysis technique called de-shape Short Time Fourier Transform (STFT) on PhysioNet (adfecgdb) database and CinC2013 database for fECG extraction [26]. Almeida et al. validated the Wavelet Transform (WT)-based QRS algorithm for localization of the fetal QRS complex in aECG signals acquired from the PhysioNet database [27].
Recently, researchers have been involved in techniques like Empirical Mode Decomposition (EMD) for denoising of ECG signals [28,29], baseline wander removal [30], Power Line Interference (PLI) removal [31,32,33], QRS complex detection [34,35], extraction of the respiratory signal from ECG recordings [36,37], etc. EMD has emerged to be an essential tool for decomposing a nonlinear and non-stationary signal into its constituent frequency components with higher temporal and spatial resolution as compared to Fourier-based and wavelet-based time-frequency methods. Several improvements in basic EMD have been proposed like Ensemble Empirical Mode Decomposition (EEMD) [38] and Complete Ensemble Empirical Mode Decomposition with Adaptive Noise (CEEMDAN) [39] for minimizing the limitations of basic EMD like the “end-effect” and “mode-mixing”. However, very limited research has been done on the topic of the extraction of fetal heart rate information from the aECG signal using EMD [40,41,42].
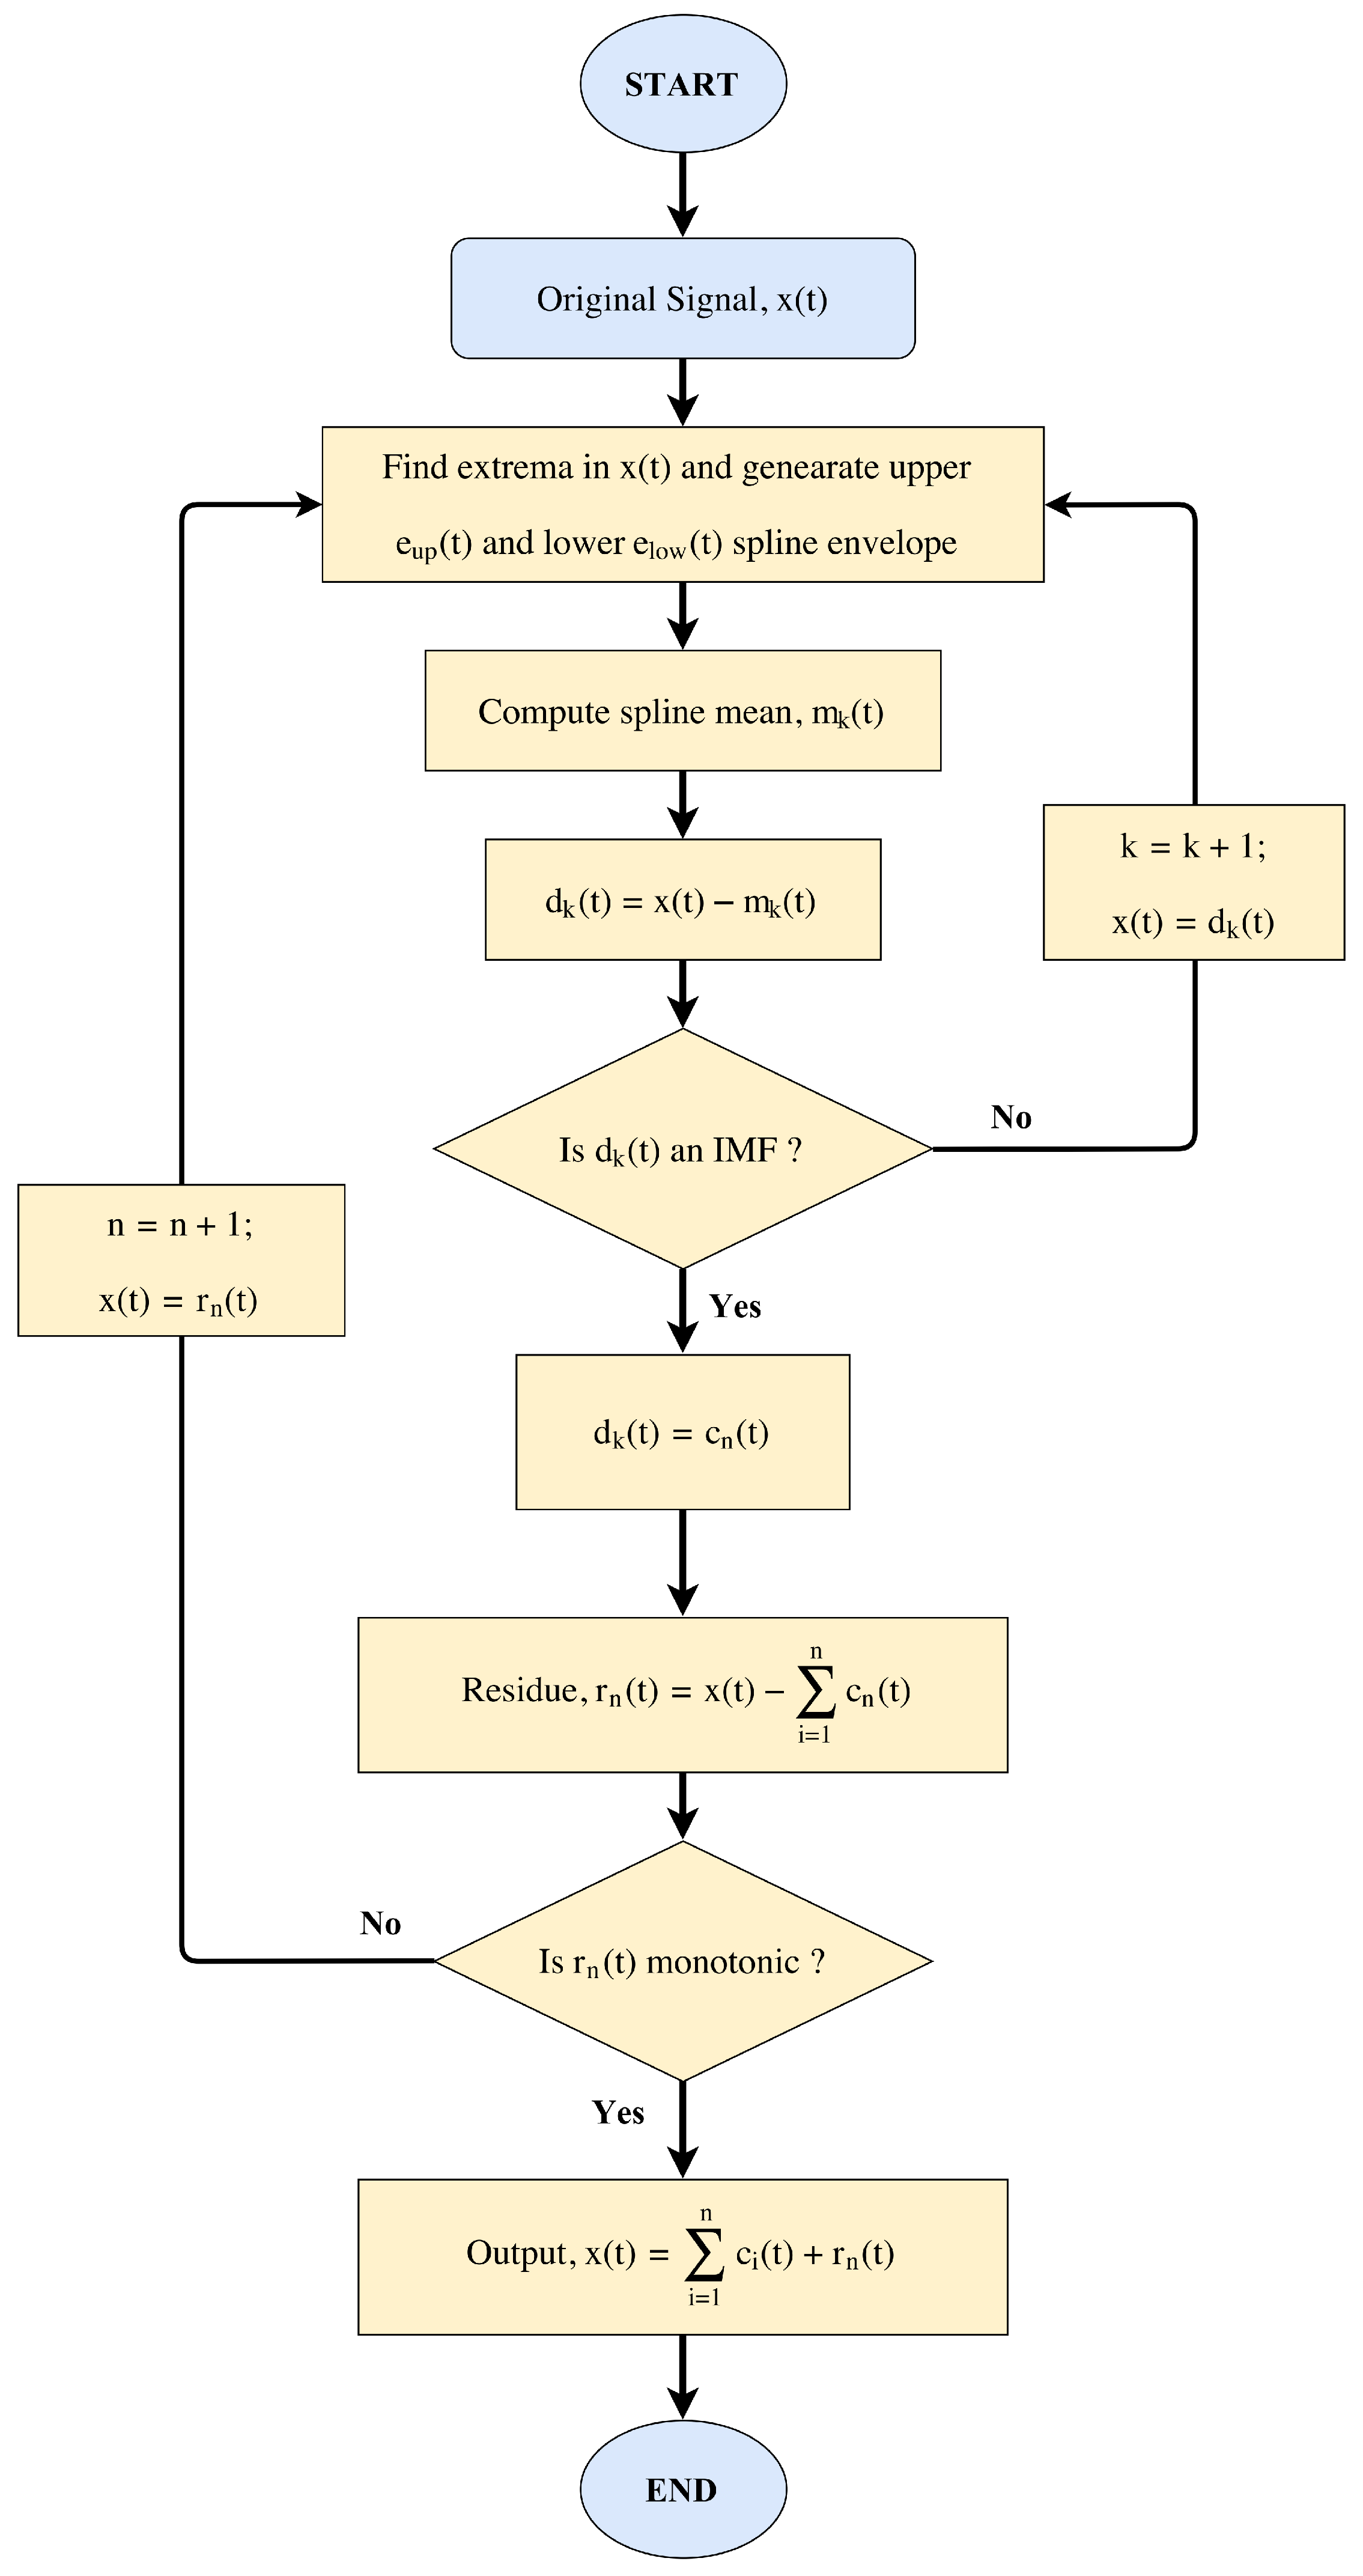
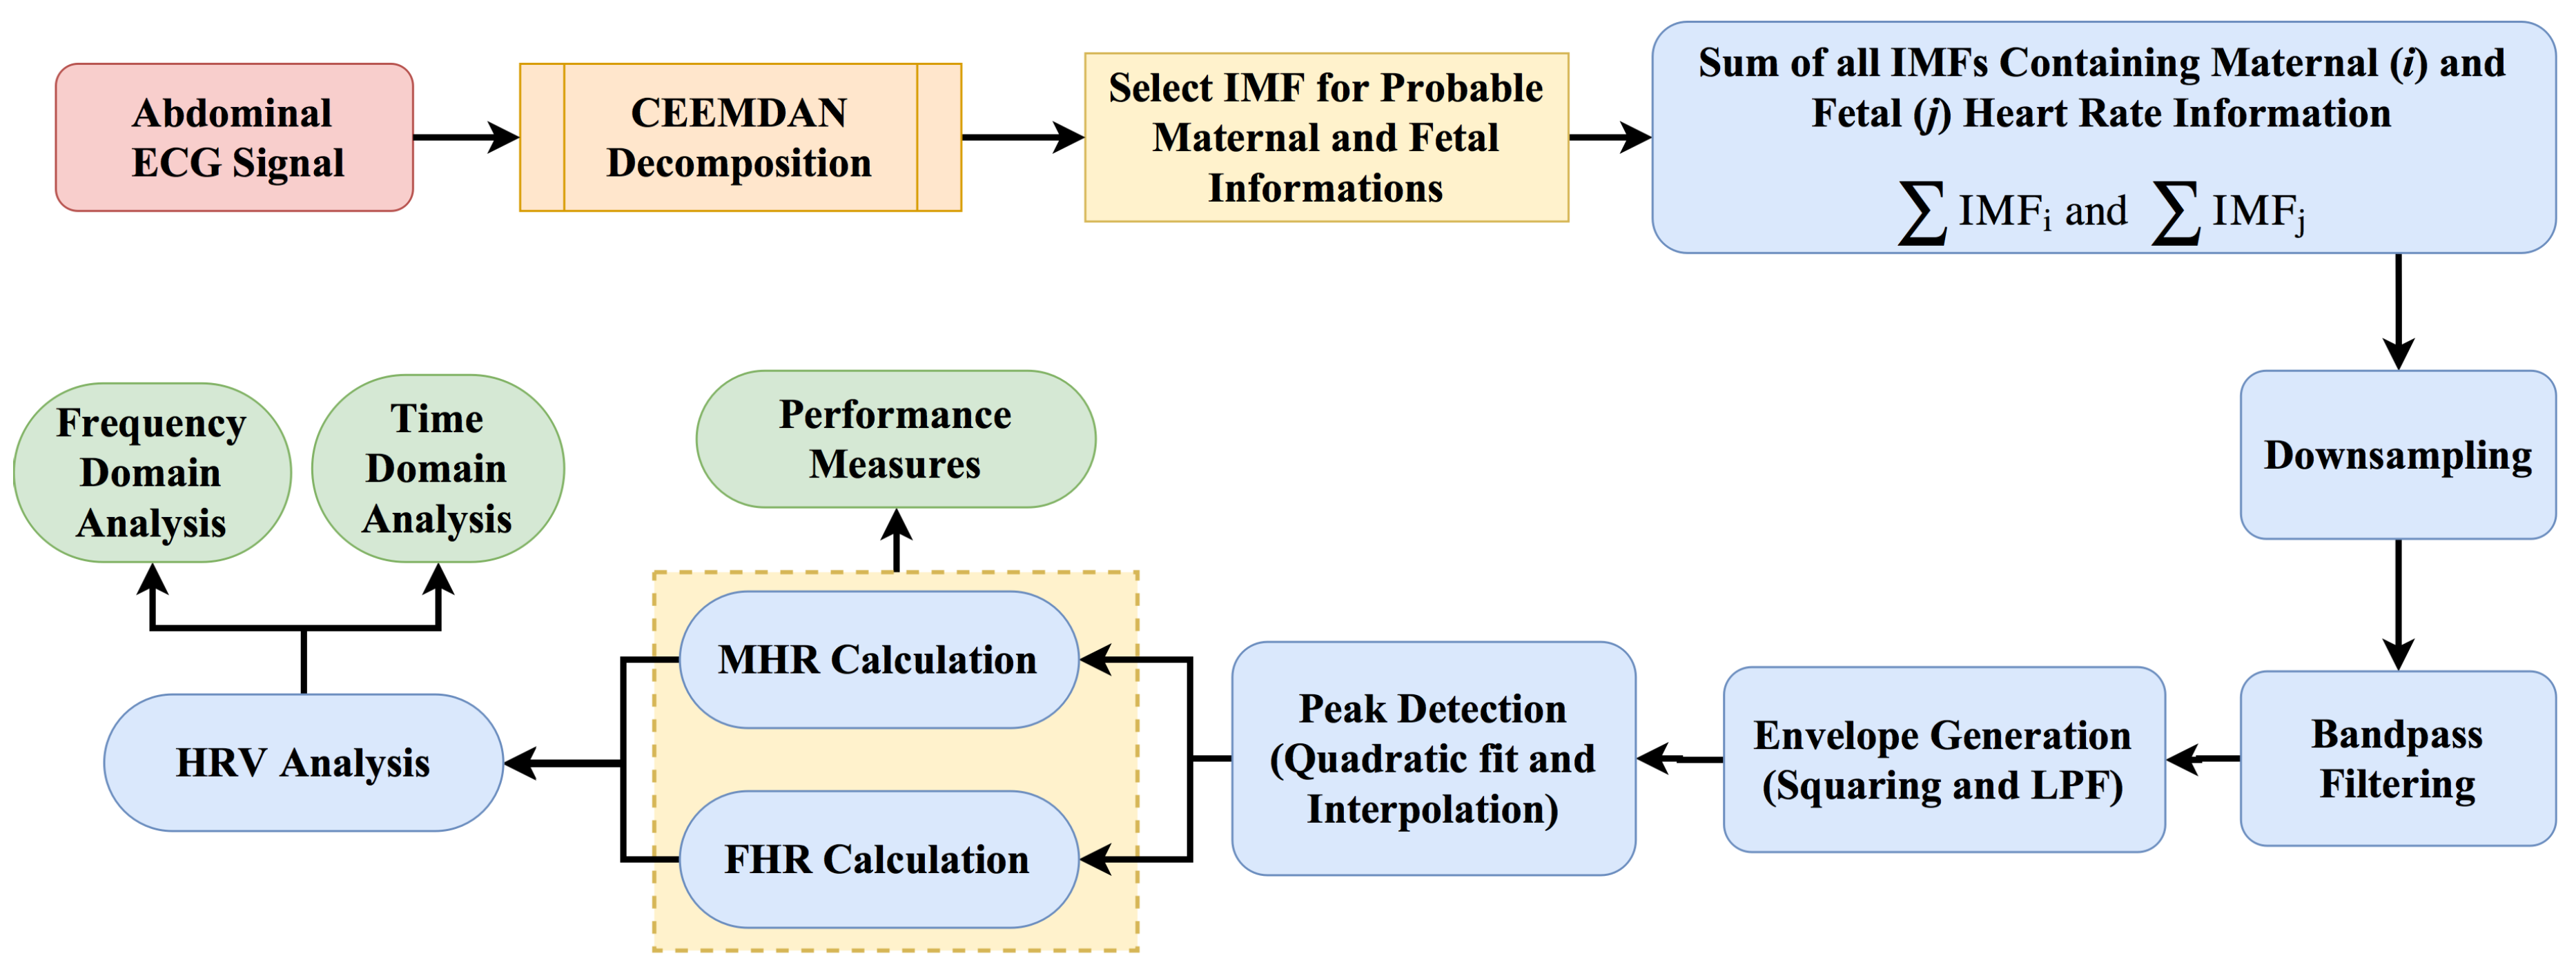
In this paper, we propose the CEEMDAN-based method for reliable extraction of both maternal and fetal heart rate information from the composite aECG signal. The aECG signal datasets used in this research are acquired from three different publicly available online sources. The CEEMDAN technique decomposes the composite aECG signal into a finite number of components separated by instantaneous frequencies called modes [43,44]. Careful selection of the modes according to both maternal and fetal components and post-processing for valid R-peak detection results in the extraction of FHR, MHR and their Heart Rate Variability (HRV). Feto-maternal HRV analysis helps the clinician to predict the overall health state of the fetus along with the cardiac autonomic regulation of the fetal heart.
The remainder of the paper is structured as follows: In Section 2, the review of the EMD technique and its improved versions like EEMD and CEEMDAN is presented. The datasets and proposed methodology are described in Section 3. In Section 4, experimental results are presented. In Section 5, the discussion about the results is presented, and finally, in Section 6, the main conclusions are pointed out.

2. Review of EMD, EEMD and CEEMDAN

2.1. Empirical Mode Decomposition

EMD is an adaptive signal processing method developed by Huang et al. in 1998 [45], which is used for decomposing a non-linear and non-stationary temporal signal into a finite set of Intrinsic Mode Functions (IMFs). IMFs or “modes” are a set of Amplitude- and Frequency-Modulated (AM-FM) oscillating components intrinsic to the signal, as shown in Equation (1), and are the bases of the decomposition.
u k t = A k t cos ϕ k t ,
where the phase ϕ k t is a non-decreasing function, ϕ k t 0 , the envelope is non-negative A k t 0 and both the envelope A k t and the instantaneous frequency ω k t = ϕ k t vary much slower than the phase ϕ k t [46,47].
An IMF should satisfy two basic conditions:
  • The number of extrema (minima and maxima) and the number of zero crossings must be the same or differ at most by one
  • At any point, the mean value of the envelope defined by local extrema (minima and maxima) should be zero
The basic principle (also known as the shifting process) required for decomposing a signal x t into its intrinsic oscillatory components (IMFs) is as follows:
  • The first step is to find all the local maxima and minima of the original signal x t .
  • Use cubic spline interpolation to connect all the identified maxima and minima of the original signal x t to form an upper envelope e u p t and a lower envelope e l o w t .
  • The mean m 1 t of the upper and lower envelope is calculated:
    m 1 t = e u p t + e l o w t 2 ,
  • The difference d 1 t between the original signal x t and the mean m 1 t is calculated:
    d 1 t = x t m 1 t ,
  • If the difference d 1 t satisfies the two criteria of IMF, then it is considered as the first IMF component of the original signal x t and defined as c 1 t . The first IMF c 1 t contains the highest frequency component present in the original signal x t .
  • If the difference d 1 t does not satisfies the two criteria of IMF, then the shifting process described in Steps (1)–(4) is repeated on d 1 t considering it as the original signal.
  • The residue is calculated as r 1 t = x t c 1 t , which is treated as the original signal for the next iteration for higher order IMF calculation.
  • Repeat the above process “n” number of times to extract “n” IMFs along with the final residue r n t .
  • The shifting process is terminated when r n t becomes a monotonic function from which no more IMFs can be extracted. Certain boundary condition like the Normalized Standard Deviation (NSD) can be imposed for terminating the shifting process.
    N S D = i = 1 T x i t x i t + 1 2 x i t 2 ,
    when the value of NSD is less than a particular threshold “T”, then the decomposition process is terminated. In this scenario, the residual r n t is either a constant, or a monotonic slope, or a function with only one extremum [48].
  • At the end of the decomposition process, the original signal x t is represented as:
    x t = i = 1 N c n t + r n t ,
    where c n t is the “n-th” order IMF and r n t is the final residue or mean trend of the original signal x t . By this convention, as the order of the IMF increases, the frequency content of the IMF decreases. A flowchart of the EMD decomposition process is shown in Figure 1.

2.2. Ensemble Empirical Mode Decomposition

A major drawback with EMD is frequent “mode-mixing”, which occurs when a specific signal may not be separated into the same IMFs every time or when a signal of the same frequency is obtained from different modes. To solve this problem, Wu et al. in 2009 proposed a noise-assisted data analysis method, called EEMD [38]. In EEMD, a white noise series is added to the original data. Then, this signal is decomposed into IMFs repeatedly with different white noise series each time and obtaining the (ensemble) means of corresponding IMFs of the decompositions as the final result.

2.3. Complete Ensemble Empirical Mode Decomposition with Adaptive Noise

EEMD successfully addresses the problem of mode-mixing by adding white noise into the signal, but this also leads to a problem that the added noise cannot be eliminated fully and may produce additional spurious modes. To resolve this problem, Torres et al. in 2011 proposed the CEEMDAN algorithm, which provides good spectral separation of the modes [39]. Hence, it gives an exact reconstruction of the original signal with a lower computational cost. The following are the steps involved in the decomposition process by the CEEMDAN algorithm:
  • Decompose signal x ( t ) + ω 0 ε i ( t ) to obtain the first mode by using EMD algorithm.
    c 1 t = 1 N i = 1 N c 1 i t , i 1 , , N
    where ω 0 is the ratio of the standard deviation of the added white noise, ε i ( t ) is the white noise with unit variance under the condition of the i-th ensemble number, N is the total ensemble number and c 1 i ( t ) is the first mode obtained after EMD decomposition.
  • Compute the difference signal:
    r 1 t = x t c 1 t ,
  • Decompose r 1 t + ω 1 E 1 ε i t to obtain the first mode, and define the second mode by:
    c 2 t = 1 N i = 1 N E 1 r 1 t + ω 1 E 1 ε i t ;
    here, E 1 and ε i t stand for a function to extract the first IMF decomposed by EMD and the white noise with unit variance, respectively.
  • For k = 2 , , K , calculate the k-th residue, and obtain the first mode. Define the ( k + 1 ) -th mode as follows:
    c k + 1 t = 1 N i = 1 N E 1 r k t + ω k E k ε i t ,
    where E k ( · ) is a function to extract the k-th IMF decomposed by EMD.
  • Repeat Step (4) until the residue contains no more than two extremes. The residual mode is then defined as:
    R t = x t k = 1 K c k t ,
    therefore, the signal x t can be expressed as follows:
    x t = k = 1 K c k t + R t

2.4. Example

A typical noisy heart pulse signal and its resulting IMFs after CEEMDAN decomposition are shown in Figure 2. This noisy heart pulse signal was obtained via an infra-red Photoplethysmograph (PPG) sensor (Heartbeat Pulse Sensor–1260, Sunrom Electronics, Ahmedabad, Gujarat, India) placed on the finger tip of a healthy subject, and the sampling rate was fixed at 1000 Hz. The PPG sensor was connected with a National Instruments (NI) myRIO–1900 data acquisition device (myRIO Student Embedded Device Model 1900 with bundled LabVIEW 2015, National Instruments Corporation, Austin, TX, USA) which captures the PPG recording and saves it in a PC (running on Windows 7 operating system with intel core i3 processor and 4GB of RAM memory) installed with NI LabVIEW software (2015 licensed version, National Instruments Corporation, Austin, TX, USA). A segment of recorded PPG data with 4000 samples is shown in Figure 3 (Top), and it can be seen that the recorded PPG signal is full of noise due to power line interference and other ambient noise. Applying CEEMDAN to the noisy PPG signal and upon observing the obtained IMFs in Figure 2, it can be ascertained that most of the high frequency noise components are present in lower order IMFs, and the clinically important heart pulse information is present in higher order IMF 9 and IMF 10 (approximately). Therefore, the addition of the oscillating components present in IMF 9 and IMF 10 results in a denoised version of the PPG signal, as shown in Figure 3 (Bottom). Heart rate information from the denoised PPG signal can easily be extracted by the application of a peak detection algorithm. This proves that CEEMDAN is a very robust method for denoising a physiological signal without much loss of clinical information.

3. Materials and Methods

3.1. Data Acquisition

To evaluate the performance of the proposed method for quantification of fetal and maternal heart rate information contained within the composite abdominal ECG signal, we have collected data from three different sources as mentioned below:
The first dataset was collected from the PhysioNet [49] website entitled “Abdominal and Direct Fetal Electrocardiogram Database” (adfecgdb), which contains multichannel fECG recordings obtained from 5 different women in labor, between 38 and 41 weeks of gestation [50,51,52]. Each recording consists of a reference direct fECG signal registered directly from the fetal scalp and four differential signals acquired by placing Ag-AgCl electrodes around the navel region of the maternal abdomen surface. The researchers who contributed to this database state that these recordings are an excellent material for testing the credibility of new signal processing algorithms like maternal ECG suppression, extraction of fetal QRS complexes from abdominal recordings and evaluating the fetal heart rate variability for detecting overall fetal health state. Data were collected at a sampling rate of 1000 Hz with a resolution of 16 bits and were already digitally filtered for removal of power line interference of 50 Hz and baseline drift. Therefore, these datasets comprise an excellent choice for evaluating the application of the CEEMDAN technique for the separation of fetal and maternal heart beat information. Data from each subject consist of a 5-min recording of the direct fECG signal and four single channel recordings of 5 min each from the abdomen at a sampling rate of 1000 Hz, resulting in total of 3,00,000 samples from each subject per channel. In our experiment, we have selected the 4th channel from all the recordings (r0104, r0404, r0704, r0804 and r1004) and taken only one-tenth of the samples from the beginning, i.e., 30,000 samples (30 s of the recording), to reduce the computational complexity of the decomposition algorithm.
The second dataset was also collected from the PhysioNet [49] website entitled “Non-Invasive Fetal Electrocardiogram Database” (nifecgdb), which contains a series of 55 multichannel abdominal non-invasive fECG recordings, taken from a single subject from 21st week to 40th week of pregnancy. The researchers who contributed to this database state that these recordings may be very useful for testing signal separation algorithms. Each recording consists of 2 thoracic mECG signals and 3 or 4 aECG signals. The database states that the recordings were collected using a Ag-AgCl transducer, pre-amplified and filtered with a 50-Hz notch filter having a bandwidth of 0.01–100 Hz and a sampling rate of 1000 Hz at 16-bit resolution. We collected this database in CSV (Comma Separated Value) format via the PhysioBank ATM services. The whole database consisted of 55 records, but none of them contained fetal QRS annotations; only maternal QRS annotations were present. To determine the fetal QRS complex manually, we applied bandpass filtering (low cut-off frequency of approximately 60 Hz and high cut-off frequency of approximately 100 Hz), envelope generation and peak detection process on all of the recordings. We found clear and distinguished fetal R-peaks in only 6 of the records (nif0403, nif0404, nif0904, nif1003, nif1703, nif3403). Figure 4 shows the process of finding the fetal R-peaks in one of the records (nif0404). In the rest of the records, either the noise level was too high or the fetal QRS amplitude was too small. Although it was mentioned in the preamble of the “nifecgdb” database that the analog amplifier used to collect the recordings also includes a 50-Hz notch filter, in our analysis, we encountered the significant presence of power line interference at 50 Hz, which eventually distorts the fetal QRS complex. The fetal R-peaks obtained from the above process were considered as reference fetal QRS annotations in our research, and their locations were used as reference to calculate the true positive cases after application of the CEEMDAN-based methodology. We have taken 30,000 samples from the beginning of the recording data (30 s of the signal) to reduce the computational complexity of the CEEMDAN decomposition algorithm.
The third dataset was generated from a synthetic Bio-Physiological Signal Generator (BPSG), which is a type of Virtual Instrument (VI) created by the authors in the LabVIEW software environment and was inspired by McSharry’s dynamical ECG model [53]. The VI generates a synthetic abdominal ECG signal from a combination of synthetic maternal and fetal ECG signals with added power line interference, baseline wander and Gaussian white noise. Signals were synthesized at a sampling rate of 500 Hz with respiration (12 respiration per minute with an amplitude of 0.15 mV) induced baseline wander. A comparison between a real aECG signal acquired from PhysioNet and a synthetically-simulated aECG signal using mathematical equations given in (10)–(13) is shown in Figure 5. The BPSG VI front panel contains various user-defined controls for varying the model parameters like MHR, FHR, the amplitude of white noise, maternal respiration rate, RR interval and heart rate standard deviation. The best selected model parameters for mECG and fECG modeling are shown in Table 1 and Table 2, respectively. The maternal QRS annotations and fetal QRS annotations were known from the synthetic maternal and fetal ECG signals used to synthesize the abdominal ECG signal. We have taken 20,000 samples from the beginning of the synthetic signal (40 s of the signal) to reduce the computational complexity of the CEEMDAN decomposition algorithm. To check the dependency of the CEEMDAN decomposition algorithm on feto-maternal heart rates, we have generated 5 synthetic abdominal signals (syn0101, syn0201, syn0301, syn0401, syn0501) with variable maternal and fetal heart rates, as shown in Table 3, and used these signals in our research.
m E C G ( t ) = i P , Q , R , S , T a i exp t c i 2 2 b i 2 + A sin ( 2 π f 2 t ) + White   Noise + Power   Noise
f E C G ( t ) = i P , Q , R , S , T a i exp t c i 2 2 b i 2 + Effect   of   UC   and   GA + Noise
F H R ( G A ) = 0.065 G A + 152.503 , R 2 = 0.0016
a E C G ( t ) = m E C G ( t ) + f E C G ( t )
where a i , b i and c i are the amplitude, width and center of the Gaussian term, respectively. f 2 is the respiratory frequency, which is used to create baseline wander, and A is the amplitude of the respiratory sinusoid. The effect of gestation age (GA) and uterine contraction (UC) on FHR are also implemented in the simulator.

3.2. Proposed Methodology

The steps present in the proposed methodology are discussed below, and a flowchart of the process is shown in Figure 6.

3.2.1. CEEMDAN

Abdominal ECG datasets acquired from PhysioNet (sampled at 1000 Hz), as well as datasets synthetically generated by BPSG (sampled at 500 Hz) were decomposed into their respective IMF components using the CEEMDAN method in the LabVIEW software environment. Figure 7 shows the result of the CEEMDAN process.

3.2.2. Probable IMF Selection

The CEEMDAN process decomposes the aECG signal into various high and low frequency components. It can be observed from Figure 7 that most of the high frequency components are present in lower order IMFs and most of the low frequency components are present in higher order IMFs. Application of CEEMDAN to the PhysioNet dataset yields 12 IMF components, while that of synthetic dataset yields 11 IMF components. After careful examination, we have selected some lower order IMFs as probable candidates for containing most of the maternal heart rate information and selected some higher order IMFs as probable candidates for containing most of the fetal heart rate information from the decomposed datasets. In our research, the step of manual intervention for the selection of IMFs is required because we have performed our research on recordings collected from a variety of databases. Some recordings were collected from different subjects (adfecgdb), some at different times from a single subject (nifecgdb) and some at variable maternal and fetal heart rates (synthetic signals). Hence, to deal with this, we have introduced an additional step of IMF selection. The summation of the selected IMFs for maternal and fetal heart rate information was done to form a composite signal for further processing as shown in Figure 8 and Figure 9.

3.2.3. Downsampling

Downsampling of the selected maternal and fetal IMF components was done to reduce the number of samples and to speed up the computation of heart rate. Proper precaution must be taken before downsampling the signal to avoid the aliasing affect. The addition of an anti-aliasing filter before downsampling prevents undesired signals or noise to alias into the desired signal band. Downsampling is an optional step in our proposed method.

3.2.4. Bandpass Filtering

Filtering a signal introduces a delay, i.e., the output signal is shifted in time with respect to the input signal. Therefore, a smart filter subVI is constructed in LabVIEW, which consists of two Butterworth filters, which completely eliminates the time shift in the output filtered signal. This smart filter is used for various low-pass and bandpass filtering operations required in our proposed work. The frequency of the aECG signal ranges approximately from 0.1–150 Hz [54,55]. In order to remove unwanted frequencies that lie outside this range and preserve the frequencies of interest, we have applied bandpass filtering.

3.2.5. Envelope Generation

The envelope of the band passed signal is extracted to find out the actual periodicity of the heart beat. We have examined two different methods of envelope generation: the first uses a squaring and low pass fliter (LPF) method, and the second uses Hilbert transform and the LPF method. We found squaring and the LPF method to be slightly more accurate and to contain less ripples. Hence, we have selected this method for envelope generation. Generation of the envelope is essential because the envelope represents the energy of the signal at that instant of time.

3.2.6. Peak Detection

Peak detection is one of the essential time-domain analyses performed in signal processing. In LabVIEW, we have examined both the wavelet-based peak detection method and the quadratic fit and interpolation-based peak detection method. Both methods serve this purpose very efficiently by defining the proper threshold value. We have selected the quadratic fit and interpolation-based method because its subVI contains output for the number of peaks, location of peaks and amplitude of peaks. Accurate information about the location of the detected R-peaks is necessary for the identification of true positive cases.

3.2.7. Heart Rate Calculation

PhysioNet “adfecgdb” dataset contains the direct fECG signal acquired from fetal scalp along with its respective fetal QRS annotations. As the PhysioNet “nifecgdb” dataset does not contain any information about fetal QRS, we have manually extracted fetal QRS annotations by the process already mentioned in Section 3.1. These fetal QRS annotations are considered as a reference in our proposed method for identifying the true positive cases in heart rate detection. The number of peaks detected by our proposed method was directly compared with reference fetal QRS annotations for calculating various performance measures of the proposed methodology.

3.2.8. Heart Rate Variability Analysis

Heart Rate Variability (HRV) is a bio-physiological phenomenon of variation in the time interval between successive heart beats (RR interval) primarily due to two fluctuations, Respiratory Sinus Arrhythmia (RSA wave) and baroreceptor reflexes (Mayer wave). HRV analysis is a method to estimate autonomic regulation of the heart through quantification of these fluctuations. The frequency domain analysis shows that the low frequency band (0.04–0.15 Hz) includes physiologic oscillations associated with Mayer waves, and the high frequency band (0.15–0.40 Hz) is associated with RSA. The powers in these bands reflects the overall autonomic function of that individual.

4. Experiment and Results

We have used the PhysioNet aECG dataset, as well as the synthetic aECG dataset to evaluate the performance of CEEMDAN for the process of maternal and fetal heart rate extraction from a composite aECG signal. The performance of the proposed method was evaluated by the following measures:
  • Sensitivity ( Se ) = T P T P + F N ,
  • Positive Diagnostic Value ( PDV ) = T P T P + F P ,
  • Accuracy ( Acc ) = T P T P + F P + F N ,
  • Performance Index ( PI ) = N F P F N N , and
  • F 1 Score ( F 1 ) = 2 × S e × P D V S e + P D V
where FN (False Negative) indicates that the proposed method failed to detect a real heart beat, FP (False Positive) indicates that the proposed method detects a heart beat when their is no actual beat present, TP (True Positive) indicates that the real heart beat was detected accurately and N is the total number of the actual QRS complexes present in the reference signal. The F1 score is calculated based on sensitivity and positive diagnostic value and varies between [0,1]. A value of “1” represents the optimal recognition capability of the proposed method, and a value of “0” represents that the proposed method is incapable of recognition. Table 4 and Table 5 present the values of performance measures obtained after applying the proposed CEEMDAN-based feto-maternal heart rate extraction algorithm on all collected aECG datasets. For PhysioNet datasets, we assumed that a maternal R-wave and a fetal R-wave are considered to be True Positives (TP) if they are detected within ±10 ms from the reference peak. At a sampling rate of 1000 Hz, ±10 ms corresponds to a difference of 10 samples between the reference peak and the detected peaks. For the synthetic database, we have considered a 
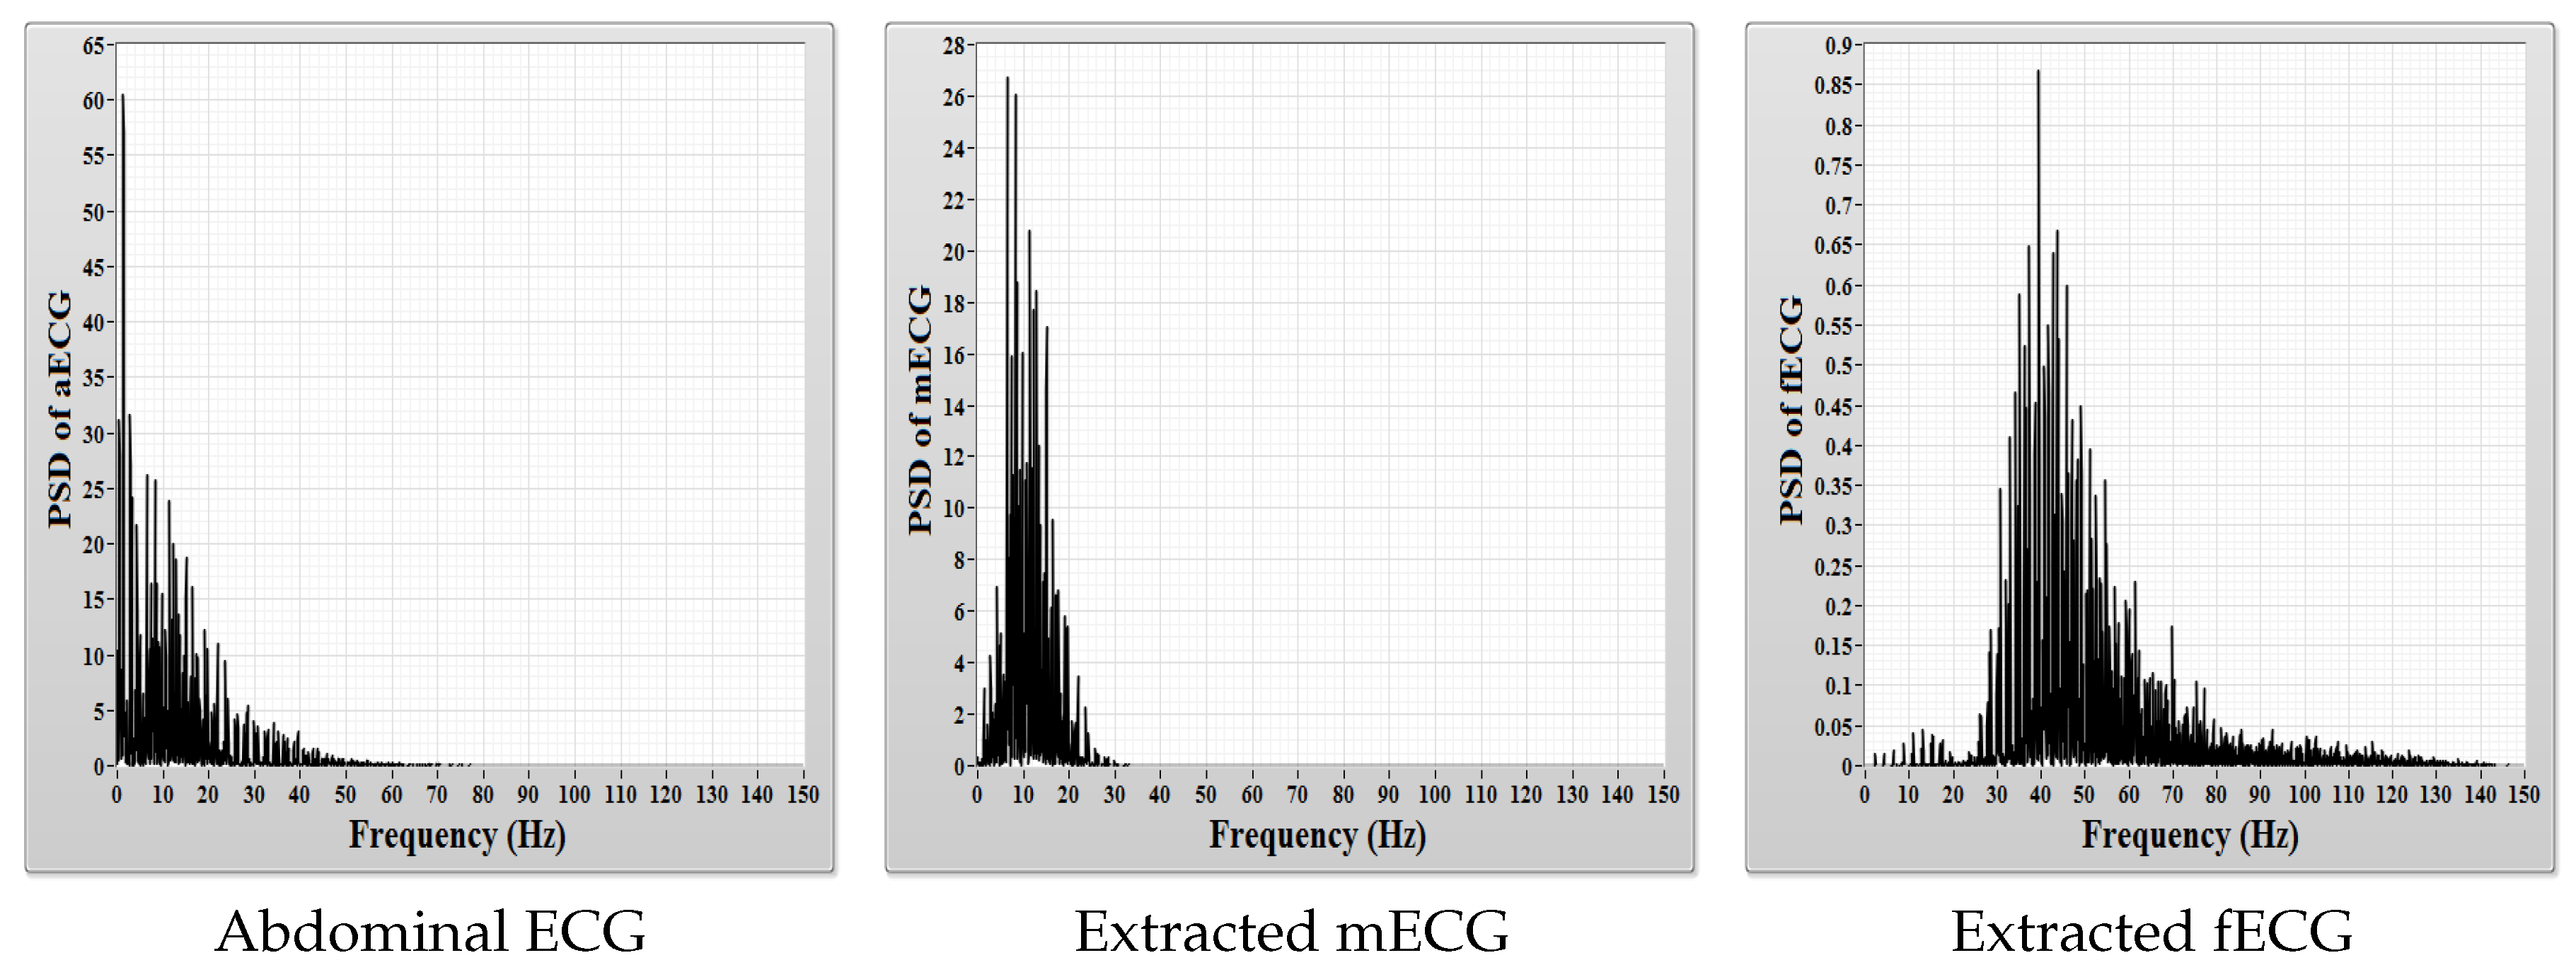
TP case when a peak is detected within a difference of five samples between the reference peak and the detected peaks. The quality of feto-maternal heart rate separation depends on the overlap between their frequency spectrum in the composite abdominal ECG signal. Less frequency overlap means that it is easier to extract feto-maternal heart rate information from aECG signal using decomposition techniques like CEEMDAN. A comparison between the power spectral density of the aECG, mECG and fECG signals is shown in Figure 10, and the difference between the magnitude of power contained within the mECG signal and within the fECG signal can clearly be observed.
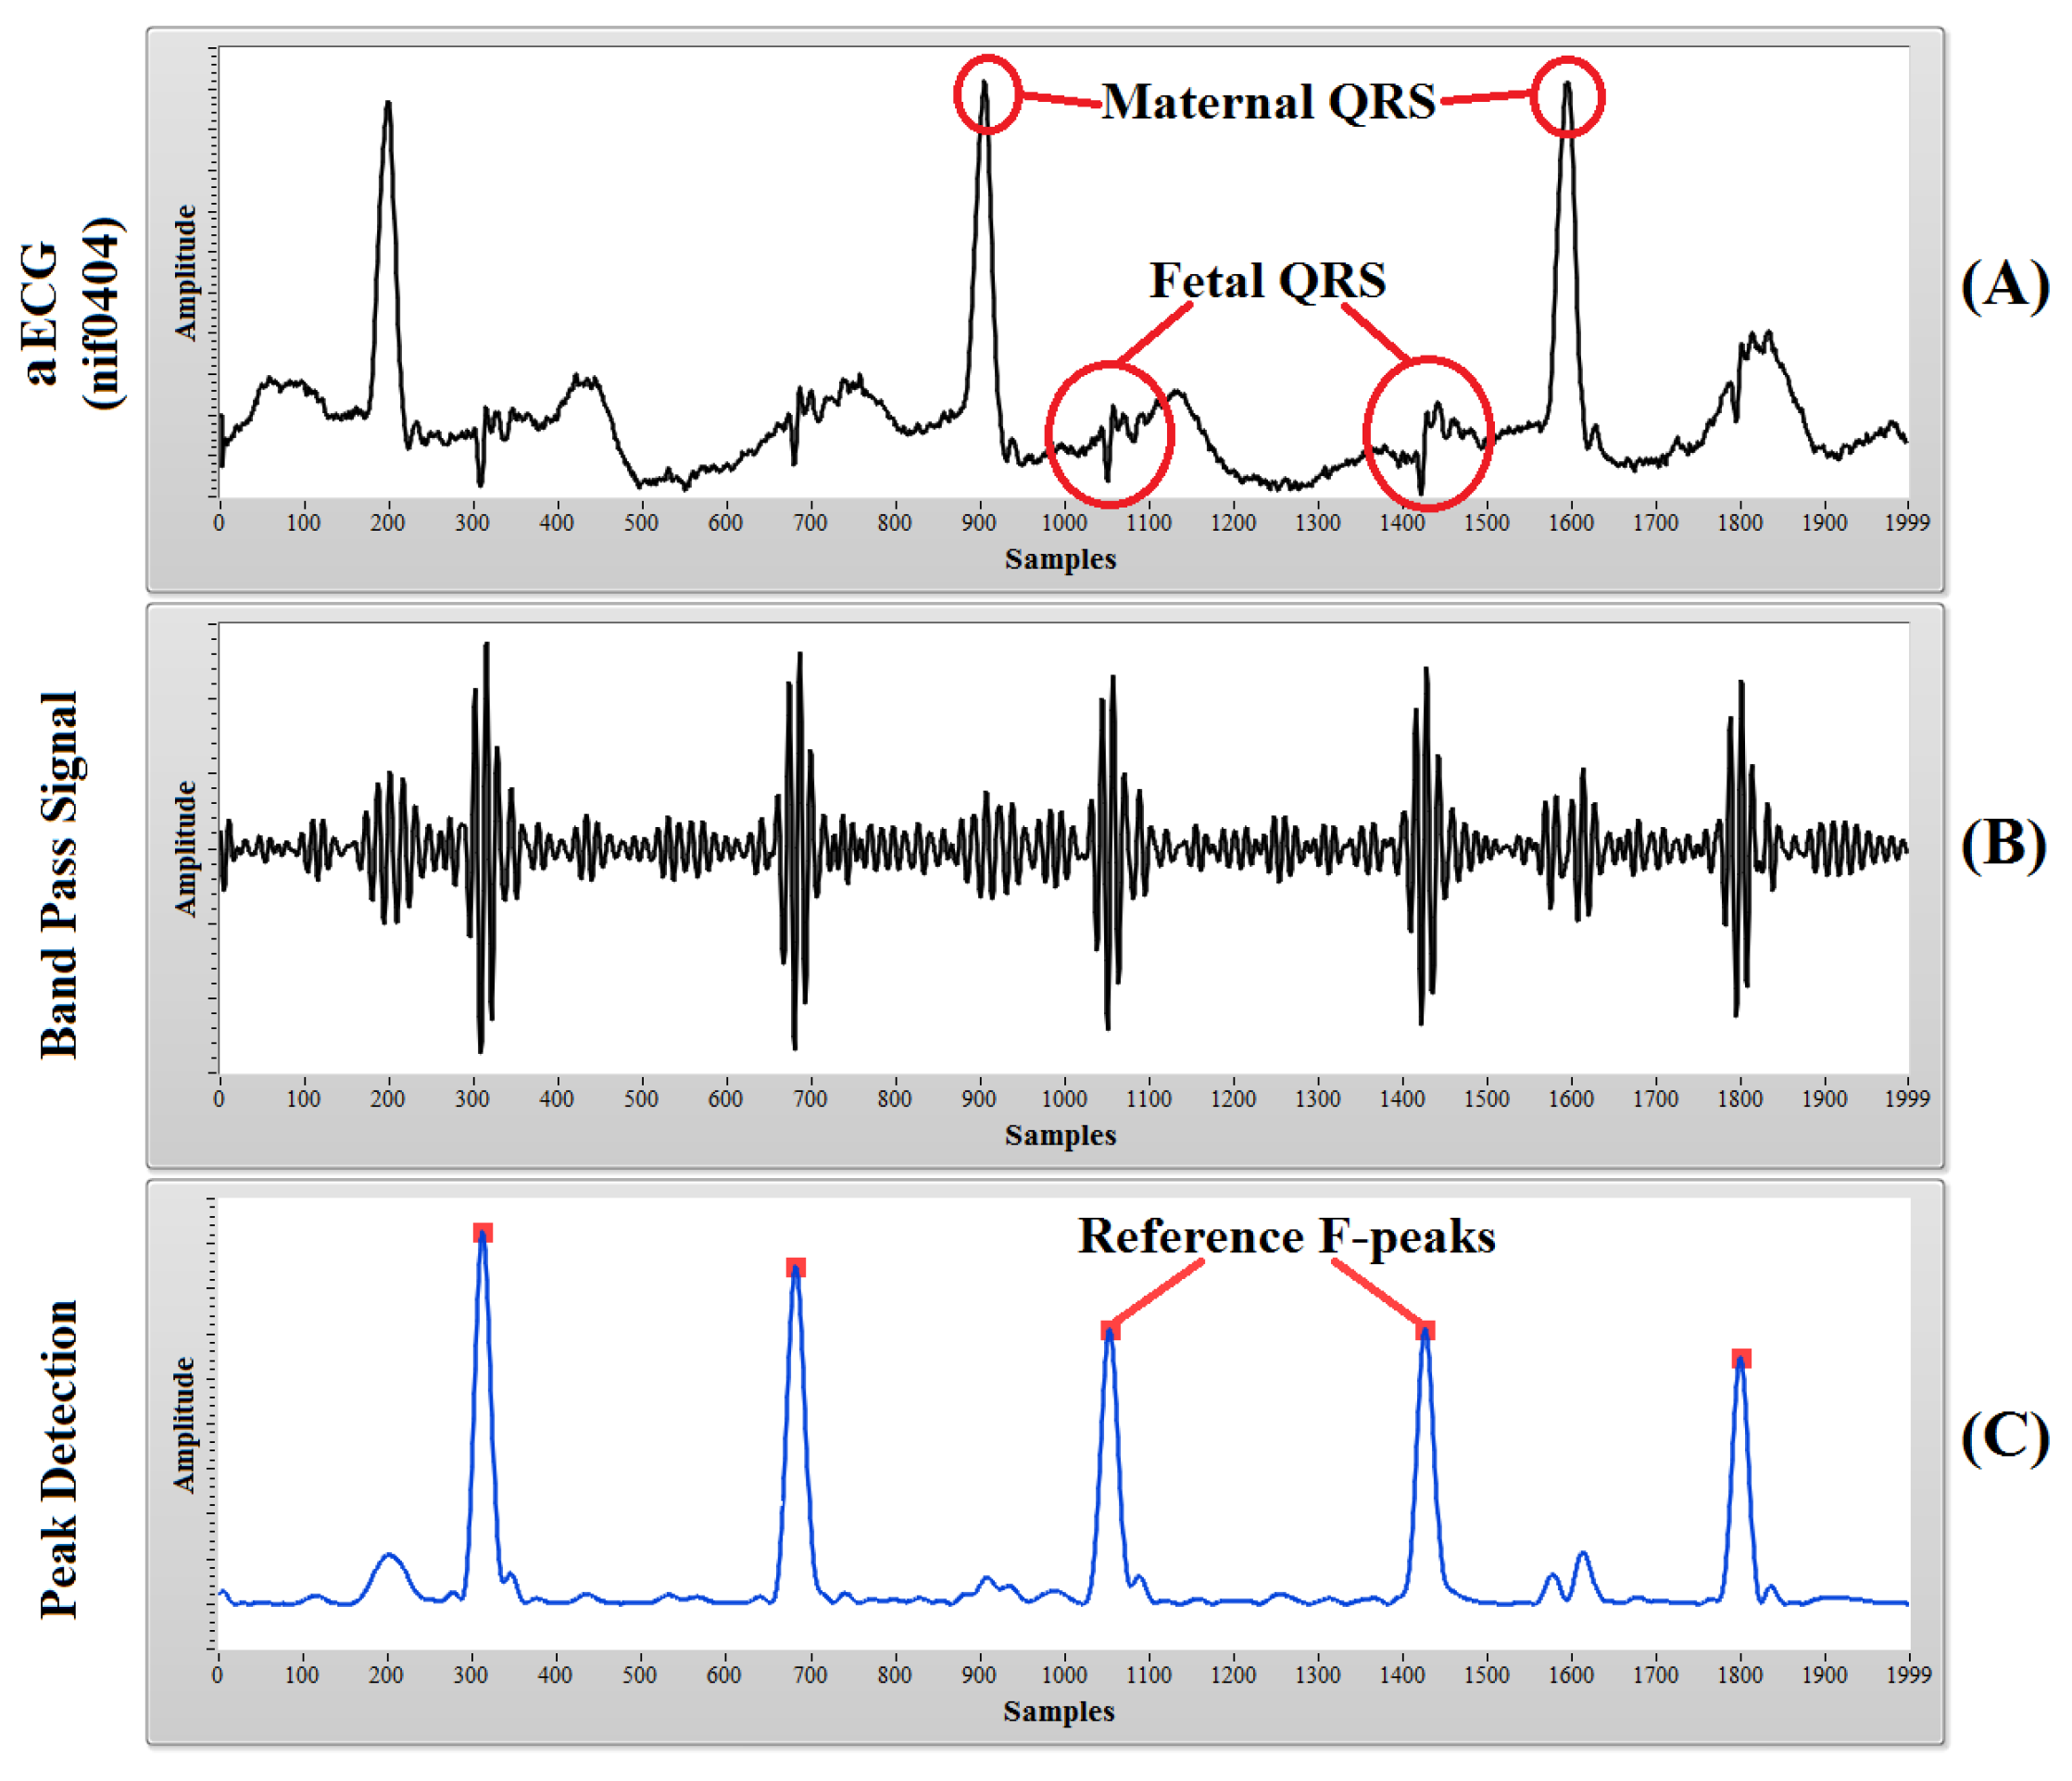
In the case of fetal heart rate detection, from among a total number of 727 maternal QRS complexes recognized in the reference signals, 718 complexes were detected accurately, only nine complexes (1.24%) were missed, whereas the number of detected false complexes was only 16 (2.2%). The mean sensitivity of 98.83%, positive diagnostic value of 97.97%, accuracy of 96.93%, performance index of 96.75% and F1 score of 0.98 were obtained while detecting the maternal QRS complexes after the application of the proposed methodology as shown in Table 4.
In the case of fetal heart rate detection, from among a total number of 1231 fetal QRS complexes recognized in the reference signals, 1210 complexes were detected accurately, only 21 complexes (1.71%) were missed, whereas the number of detected false complexes was only 28 (2.28%). The mean sensitivity of 98.13%, positive diagnostic value of 97.62%, accuracy of 95.91%, performance index of 95.69% and F1 score of 0.98 were obtained as shown in Table 5.
We further studied the HRV analysis of the corresponding maternal and fetal heart rate intervals (RR intervals) determined from reference R-peaks and detected R-peaks after the CEEMDAN process. Table 6, presents the time domain results, while Table 7 and Table 8 present the frequency domain results. 
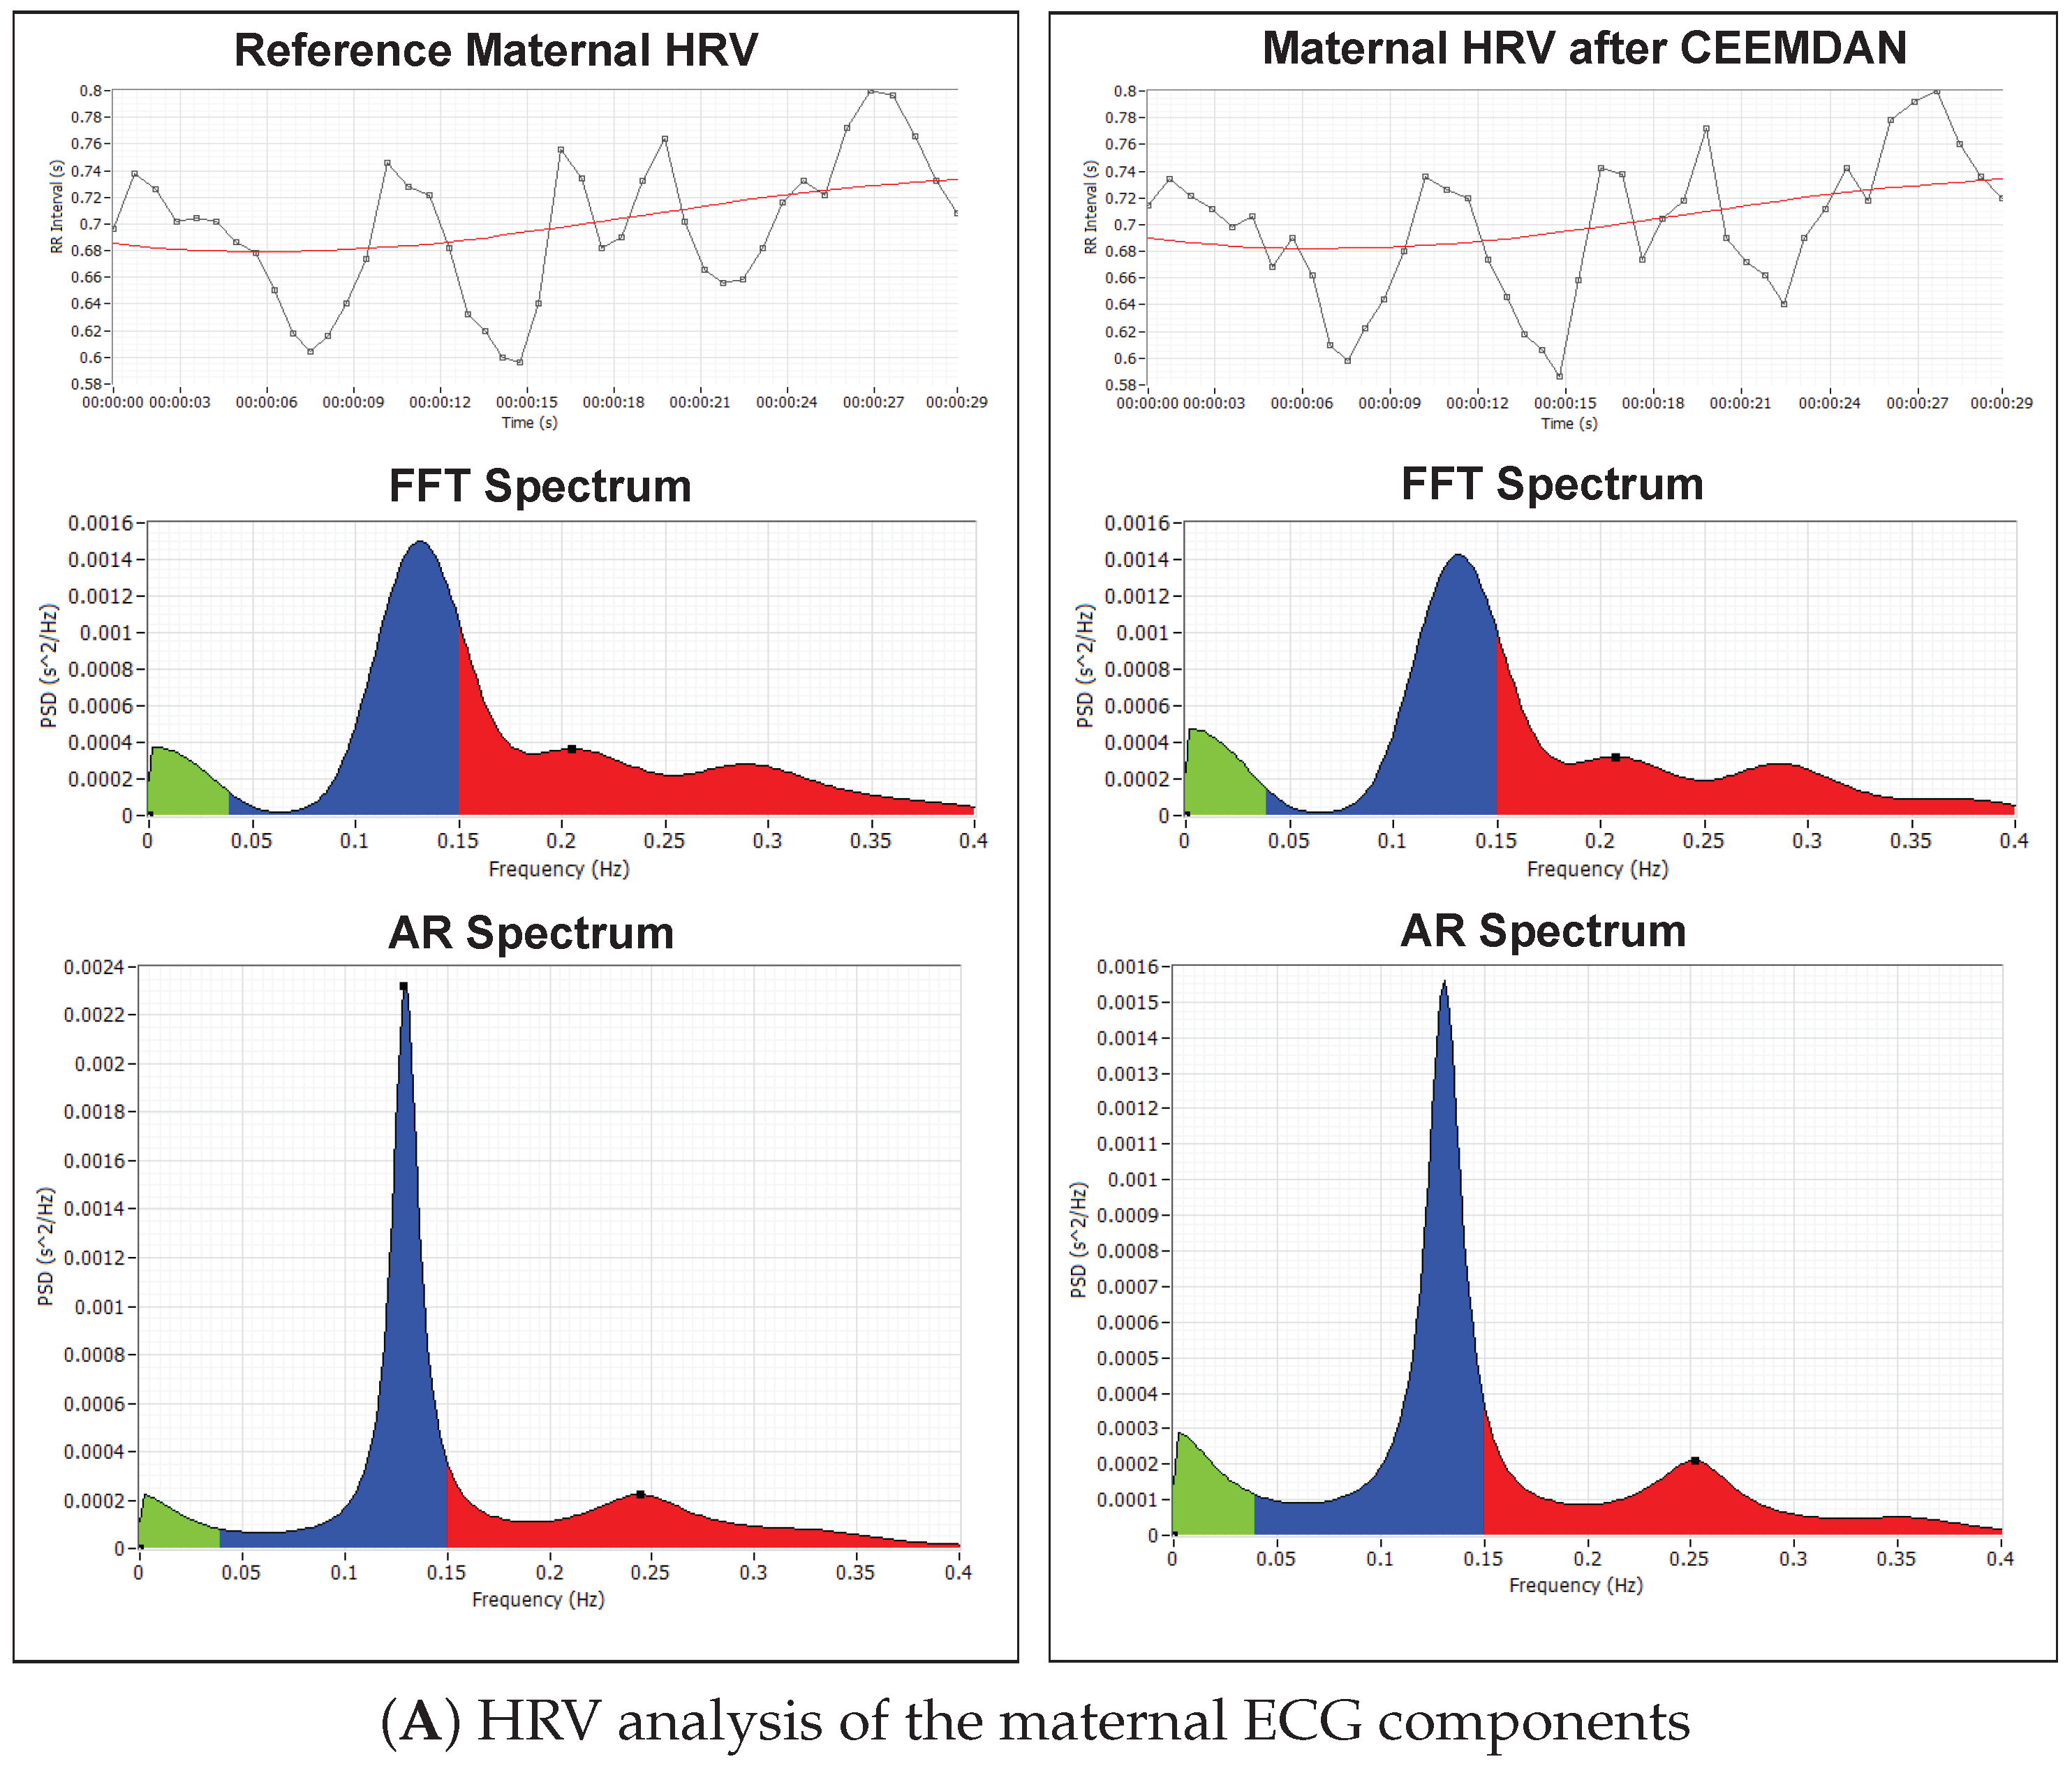
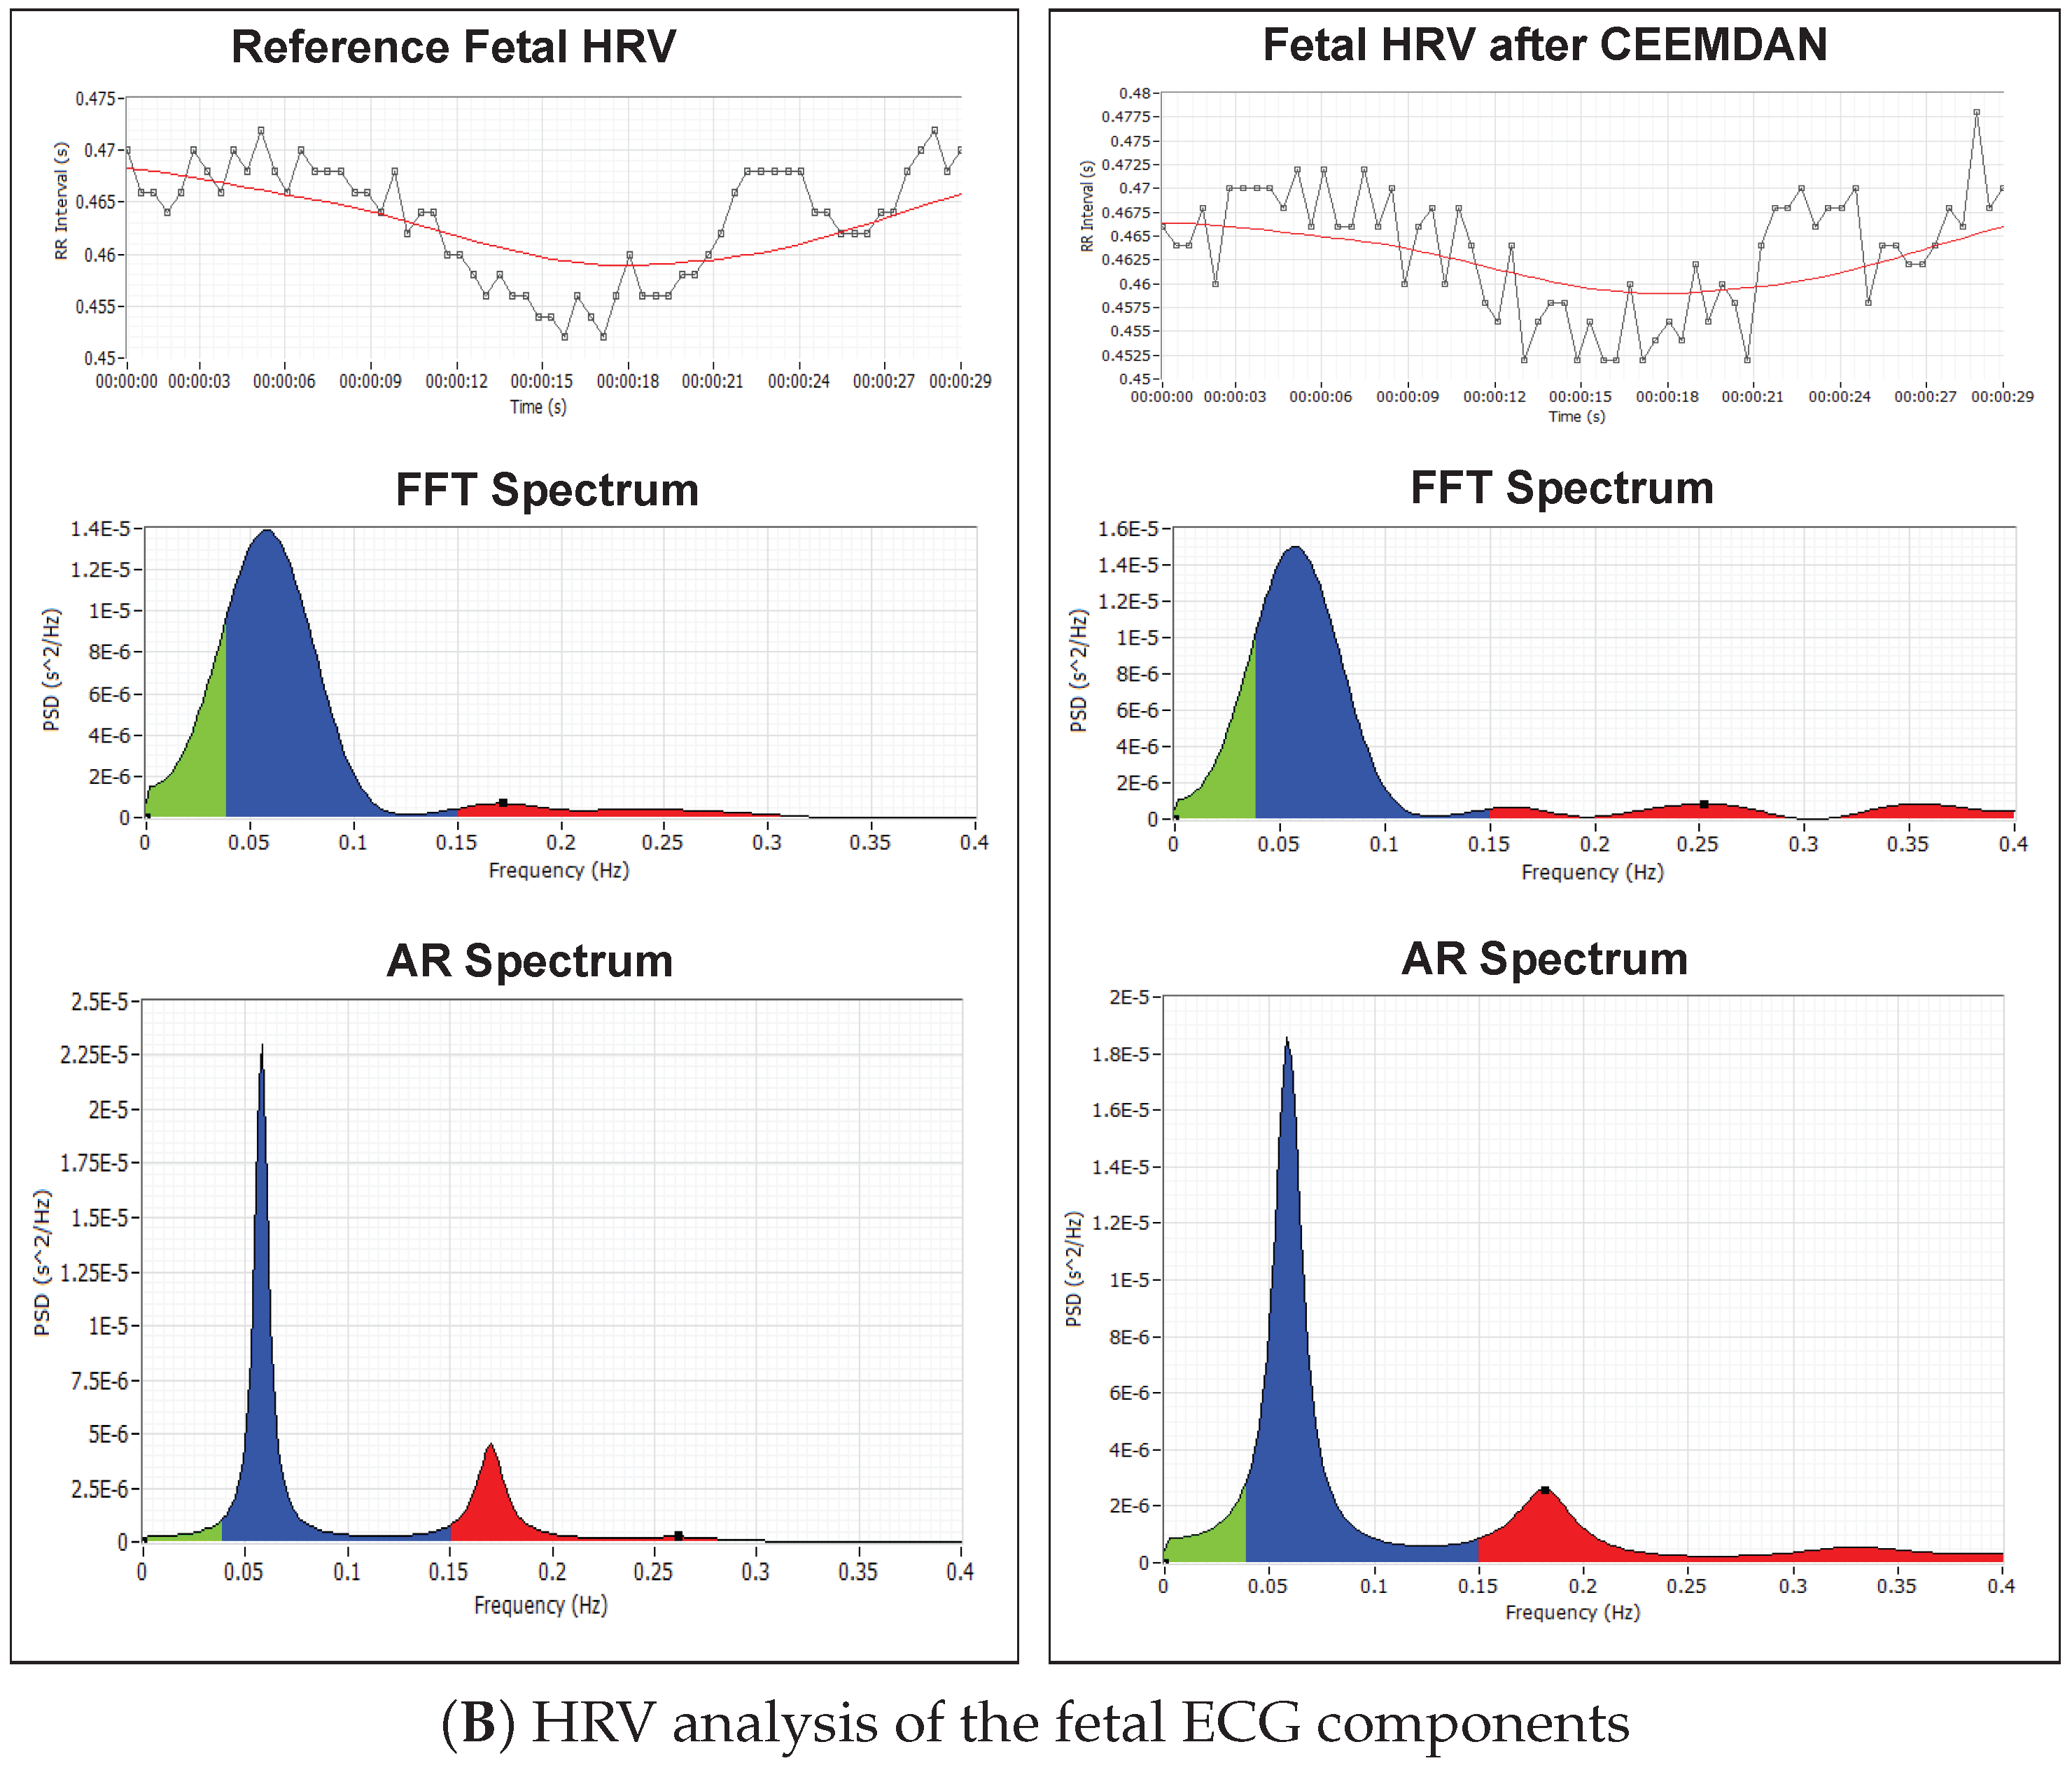
Figure 11 shows the RR intervals plot (tachogram) for both MHR signals and FHR signals derived from the reference signal and the signal obtained after the CEEMDAN process.
Figure 11A shows the RR-tachogram obtained from the reference mECG signal and extracted mECG signal and their corresponding Fast Fourier transform (FFT) spectrum and Autoregressive (AR) power spectrum plots. Various studies in the past have been done to evaluate the relationship between maternal HRV and fetal HRV during pregnancy-related pathologies like hypertension and pre-eclampsia [56,57]. The influence of maternal Respiratory Sinus Arrhythmia (RSA) on maternal HRV and fetal autonomic nervous regulation in normal gestation is also investigated by researchers [57].
Figure 11B shows the RR-tachogram obtained from the reference fECG signal and extracted fECG signal and their corresponding FFT spectrum and Autoregressive (AR) power spectrum plots. The energy content in the frequency range of up to 0.2 Hz indicates the long-term variability, and the frequency range up to 1.5 Hz indicates the short-term variability. Long-term and short-term FHR variability are often related to fetal conditions [58,59]. Fetuses also exhibit HRV analogous to an adult subject [60]; therefore, detailed analysis of fetal HRV can give sensitive information about the autonomic nervous system and cardiovascular system development of the fetus [60].

5. Discussion

From the results listed in Table 4 and Table 5, the following important points can be made:
  • The selection of IMF for containing probable maternal and fetal frequency components depends on the subject, the recording conditions and the placement of the abdominal electrodes. In our research, manual intervention for IMF selection is required because we have applied the CEEMDAN methodology on the database acquired from various sources and acquired in different recording conditions. The proposed methodology can be automated for long-term patient-specific monitoring when there is no significant variation in recording conditions during the procedure.
  • The selection of IMF does not depend on the variation of maternal or fetal heart rates. As seen from the results of the CEEMDAN decomposition of the synthetic database, where a combination of variable maternal and fetal heart rates (given in Table 1) were examined, still the selected IMF were similar (Mode 7 + 8 for the maternal component and Mode 4 for the fetal component).
  • In the PhysioNet “nifecgdb” dataset, the location of the fetal R-peaks obtained via the alternate process of band pass filtering (explained in Section 3.1) was assumed as reference fetal R-peaks for identifying TP cases. A mean accuracy of approximately 95% was obtained between the reference peaks and detected peaks, which indicates that the alternate method can be implemented for remaining records present in “nifecgdb” for which fetal QRS annotations are not defined.
Some limitations and challenges were also encountered during this research work and are listed below:
  • Although the CEEMDAN-based decomposition method provides exact reconstruction of the original signal with better frequency separation between the decomposed IMFs [44], like EMD and EEMD, it is a very time-consuming process due to its iterative nature [61,62] and is very difficult to implement in a real-time environment [63].
  • The requirement of manual intervention for the purpose of feto-maternal IMF selection after CEEMDAN decomposition restricts our methodology to be implemented in real time. In the future, this limitation can be eliminated by introducing an automated IMF selection step in the algorithm.
  • Implementing the methodology in the LabVIEW software environment instead of MATLAB makes the research a bit tedious. However, the graphical programming approach was found to be more suitable for our application.

6. Conclusions

Monitoring of fetal and maternal heart rate variability provides critical diagnostic information about the health state of the mother and her fetus. Long-term FHR monitoring is crucial in high-risk pregnancies, which can be accomplished only by a non-invasive method like aECG. Although CTG and ultrasound are extensively employed diagnostic tools for non-invasive monitoring of various physiological and morphological parameters of the fetus inside the uterus, it is not preferred for long-term bedside monitoring due to some degree of inconvenience to the patient and the need for frequent attendance by an experienced medical professional.
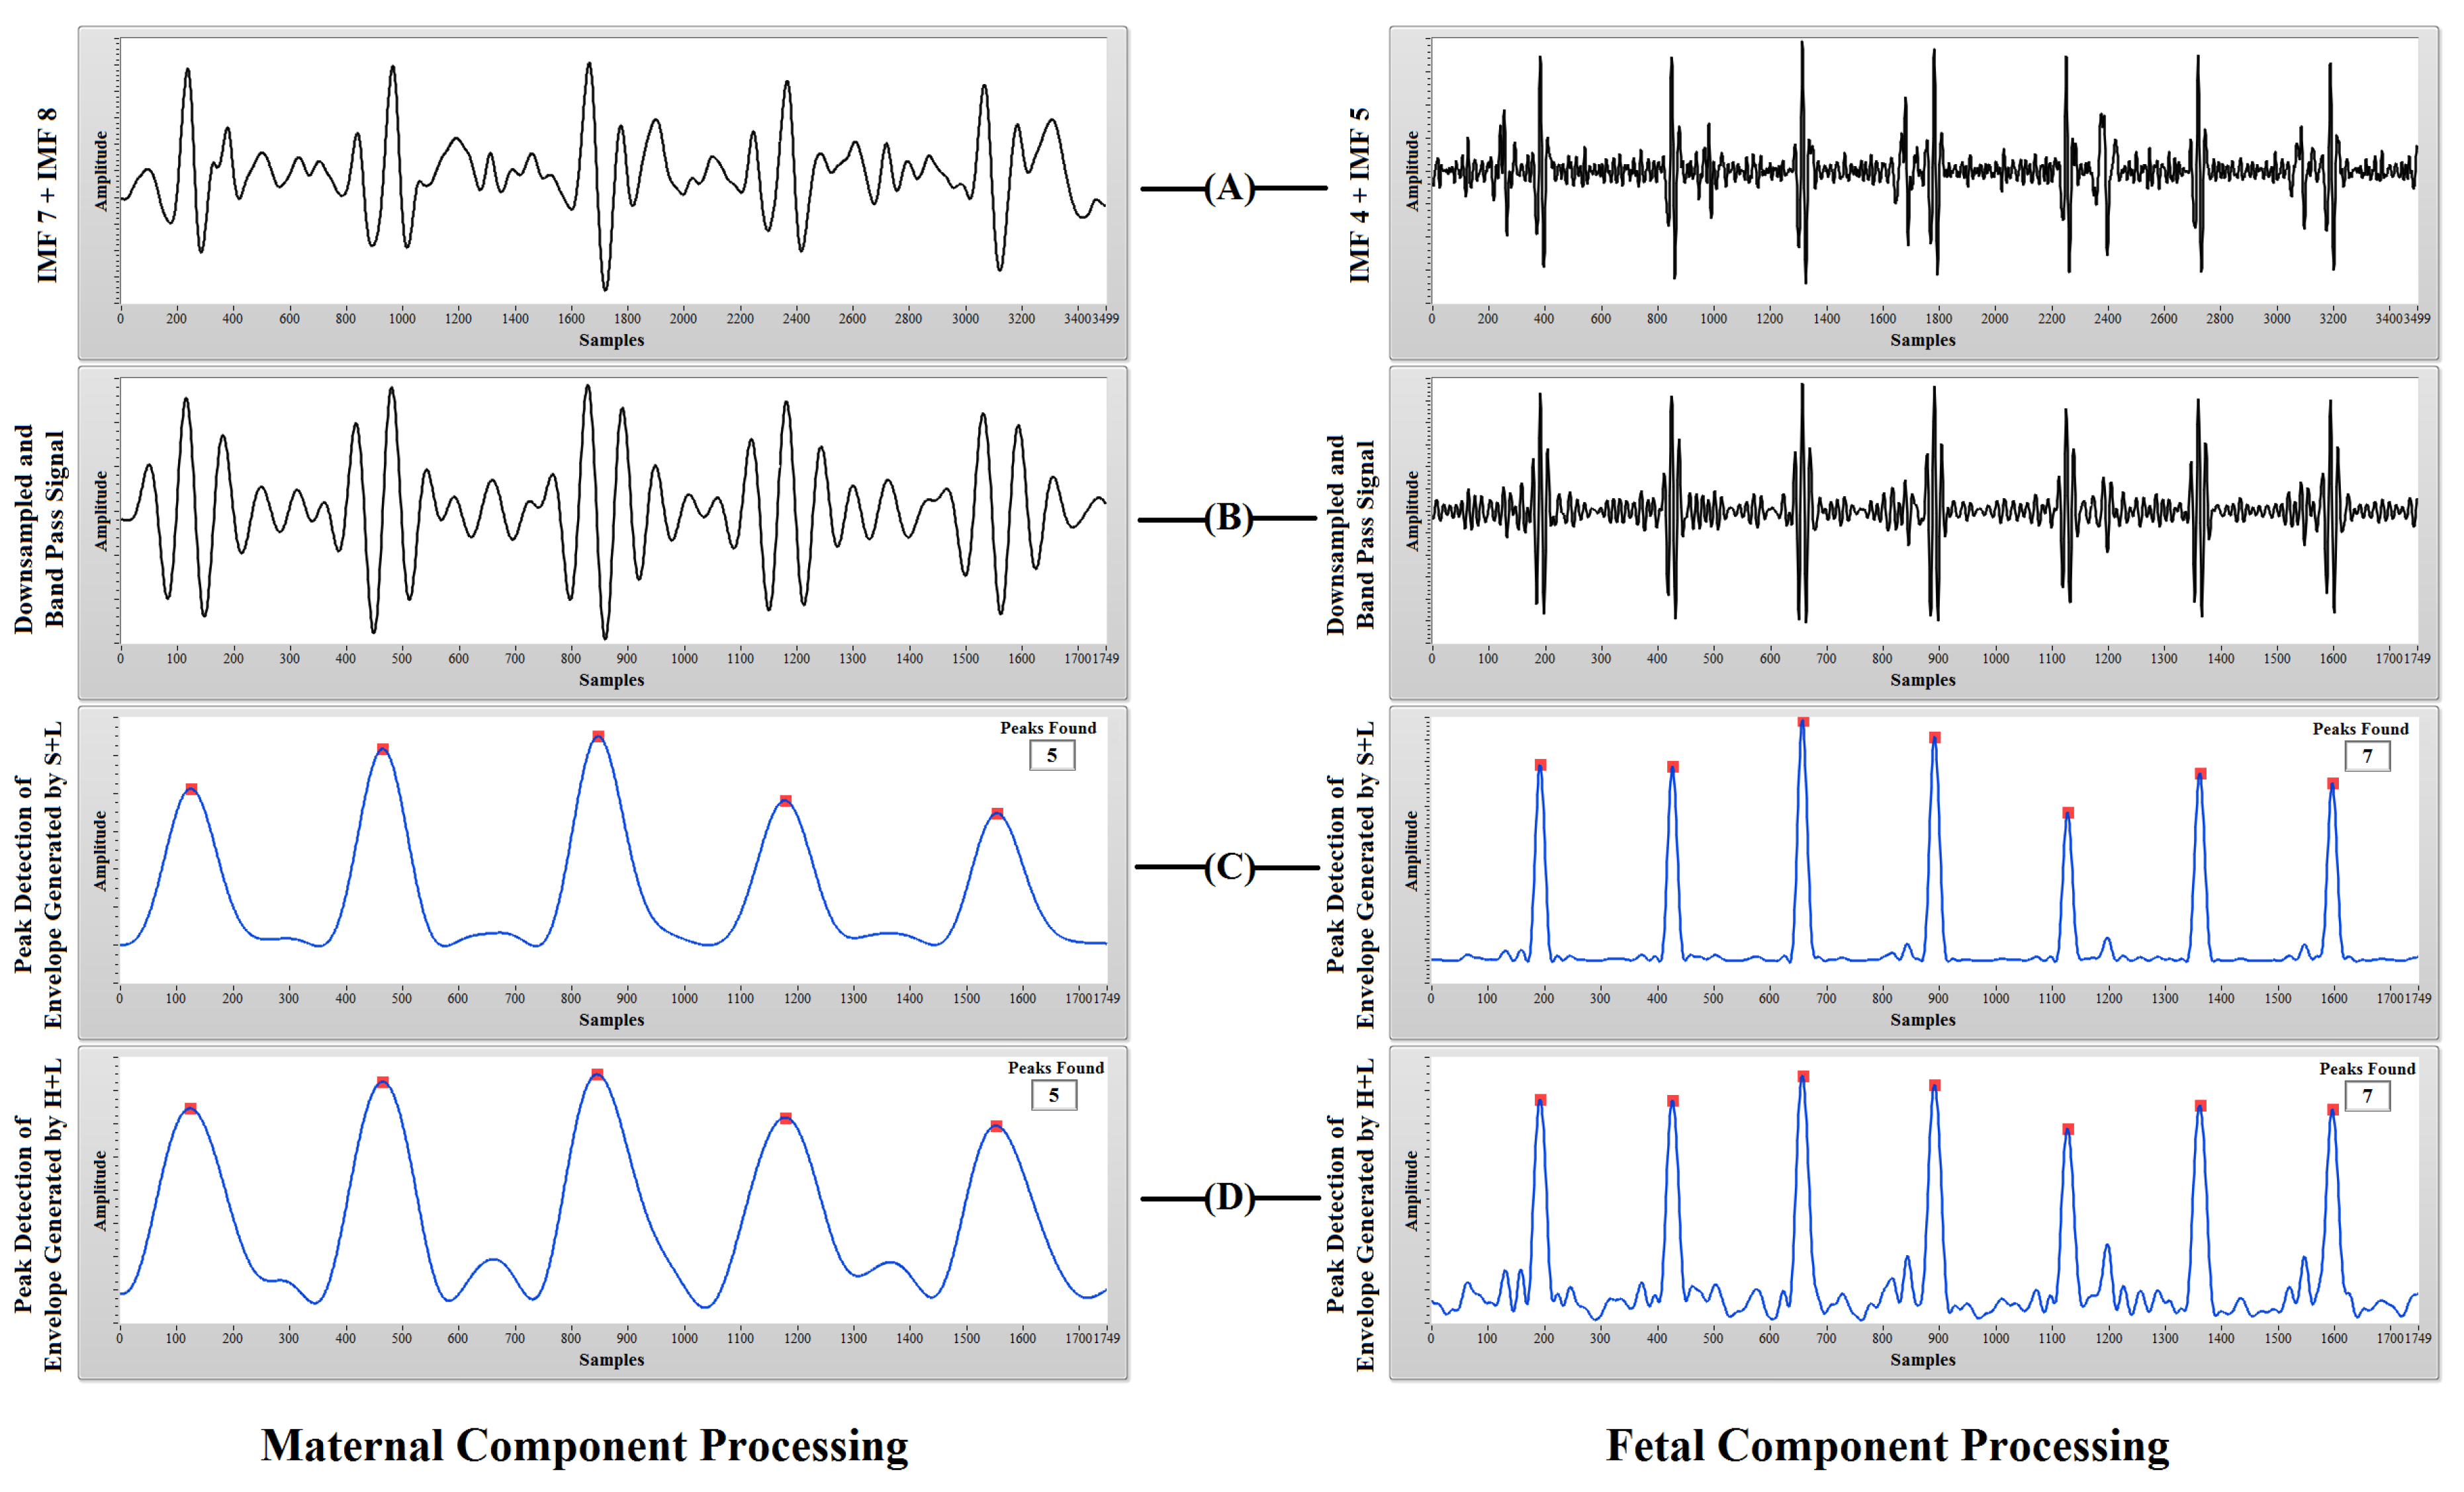
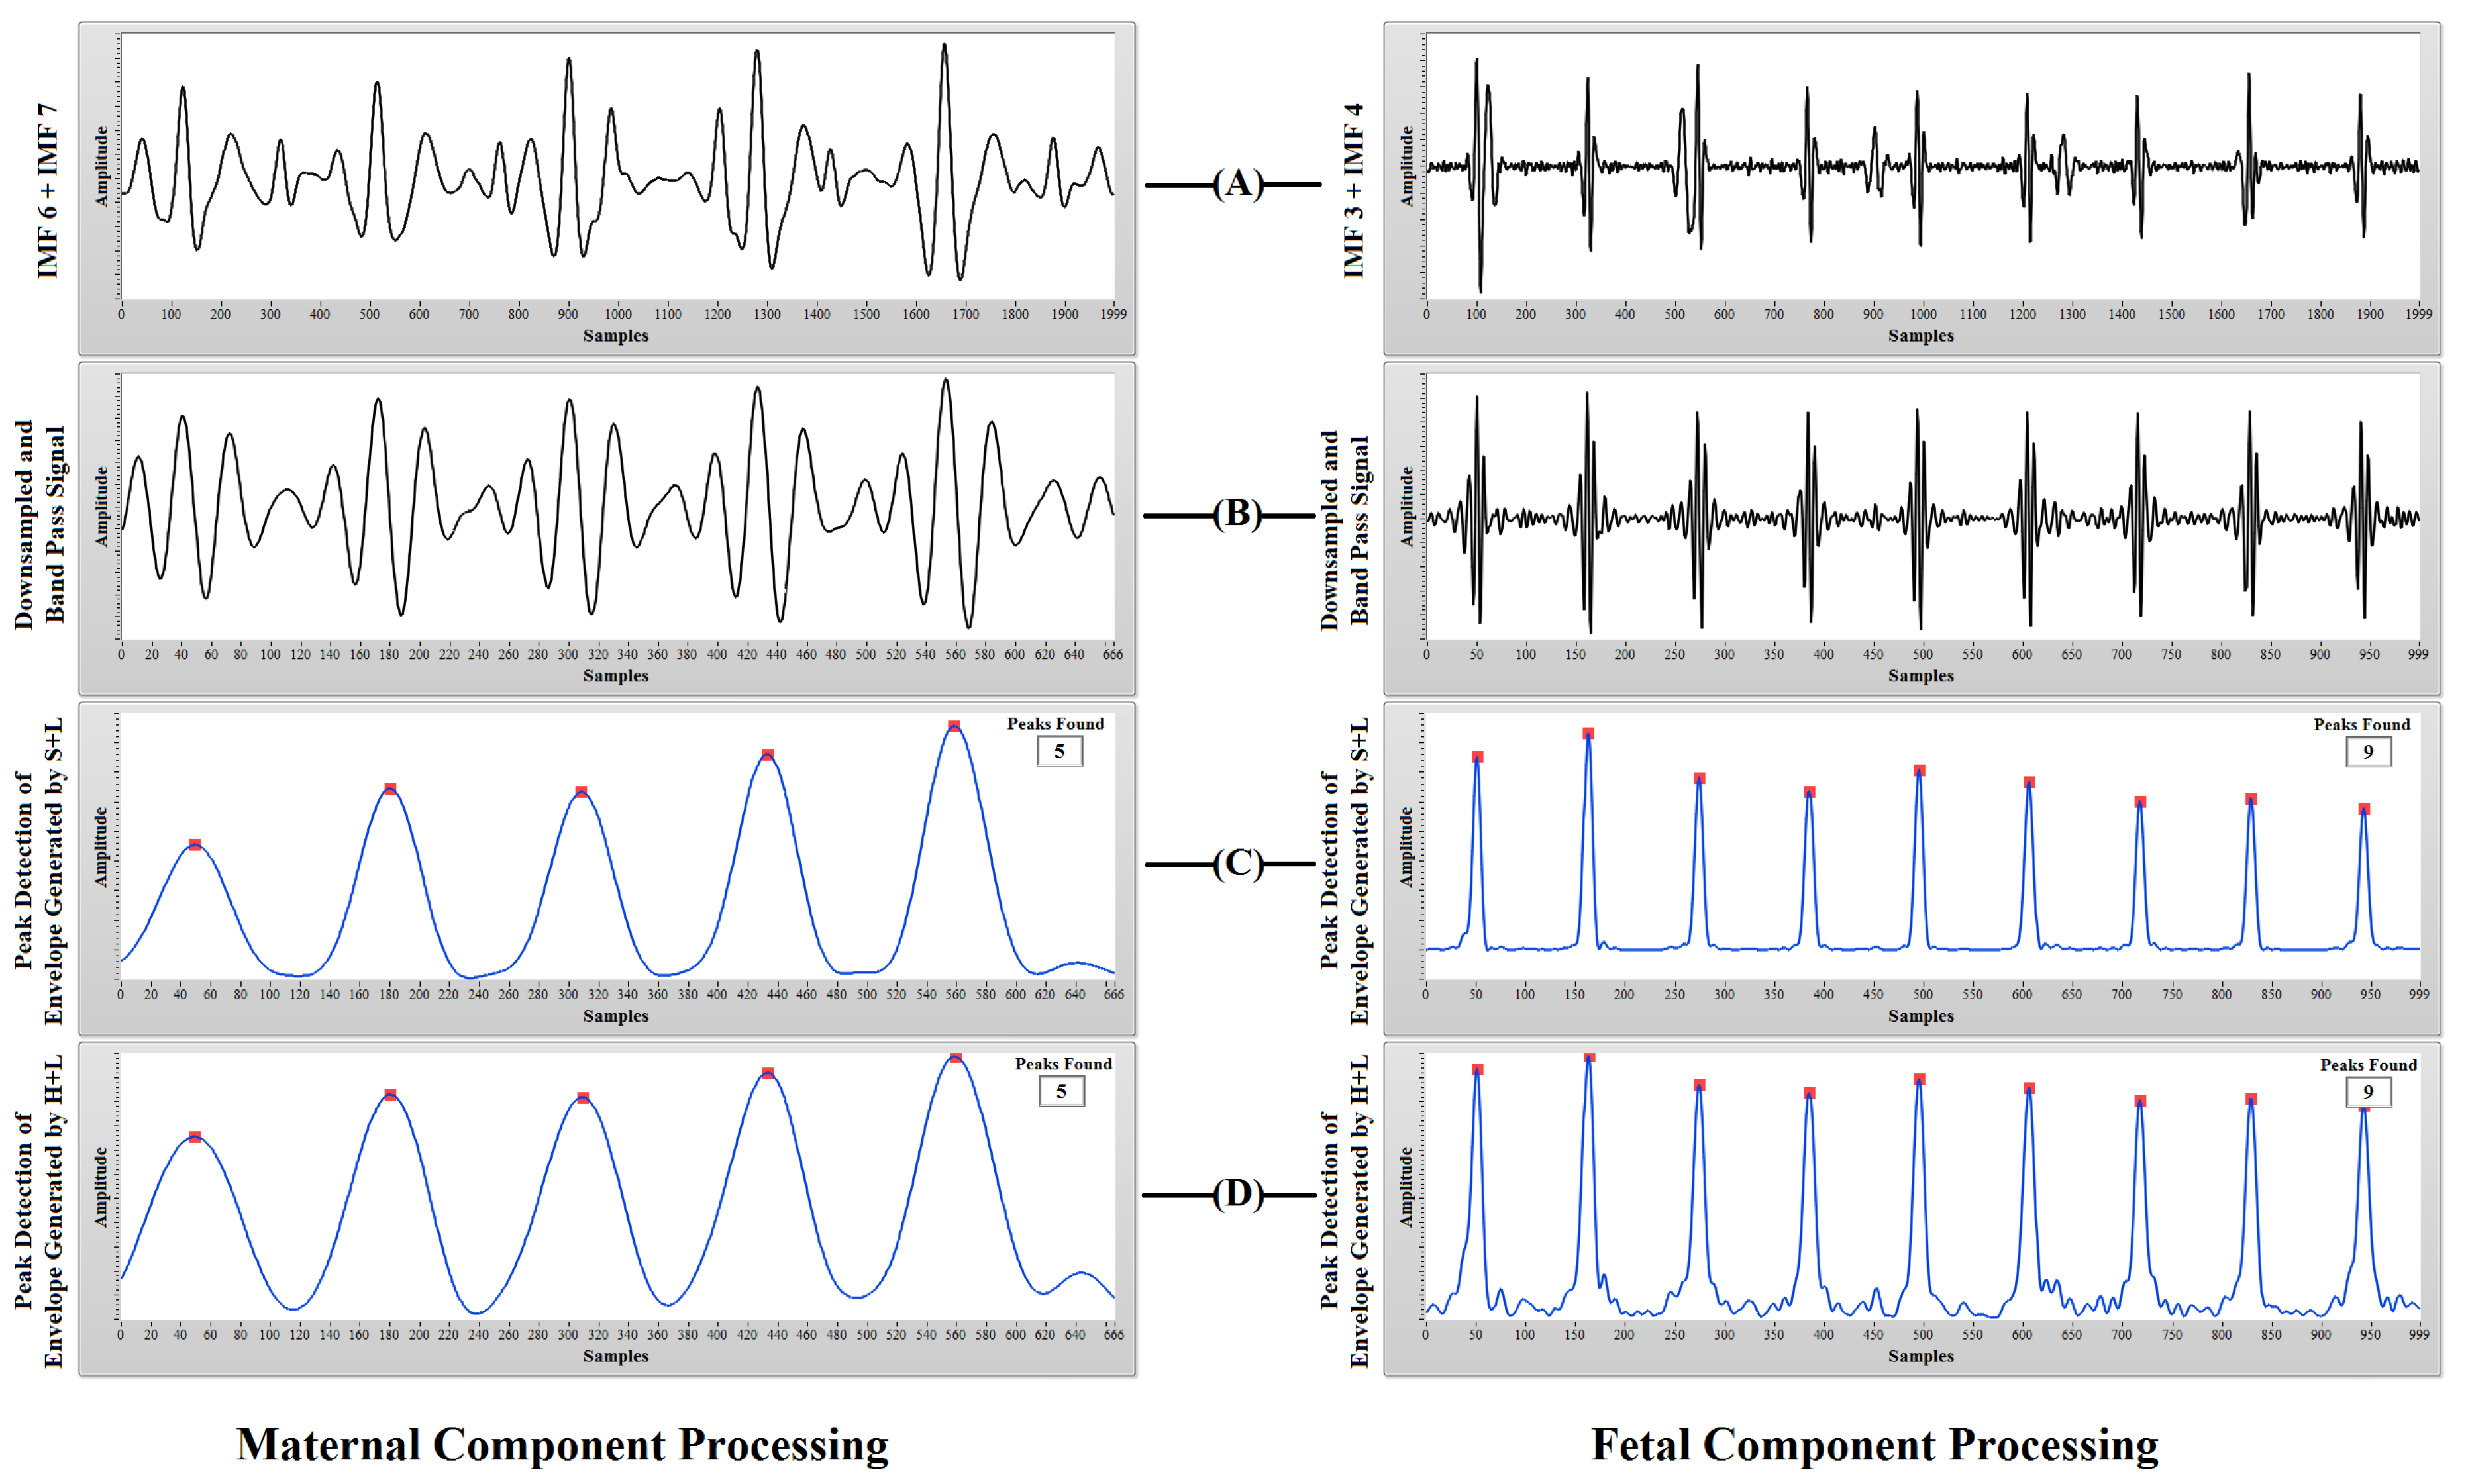
A CEEMDAN-based approach for extraction of both fetal and maternal heart rates from composite aECG recordings is presented in this research. The proposed method is based on the fact that in most of the cases, there is a frequency difference between maternal ECG components and fetal ECG components. CEEMDAN is a robust technique to decompose a composite signal into its respective frequency components called IMFs. CEEMDAN decomposition of the aECG signal produces IMFs in which the lower order IMFs contain higher frequency components (fetal ECG) and higher order IMFs contain lower frequency components (maternal ECG). Manually selecting the IMFs according to probable maternal and fetal components and taking the summation of theses components produces a signal for further post-processing. Post-processing involves downsampling, band pass filtering, envelope generation and peak detection. The detected peaks for both maternal and fetal cases were compared with the reference peaks for identifying TP, FP and FN cases. A TP case is considered when a detected R-peak is within ±10 ms from the reference R-peak. An overall sensitivity of 98.83%, a positive diagnostic value of 97.97%, an accuracy of 96.93% and a performance index of 96.75% were obtained in the case of MHR quantification, and an overall sensitivity of 98.13%, a positive diagnostic value of 97.62%, an accuracy of 95.91% and a performance index of 95.69% were obtained in the case of FHR quantification. The obtained results prove that the proposed CEEMDAN-based methodology is a very robust way of separating maternal and fetal components with good accuracy and sensitivity. It also confirms that an abdominal ECG recording is indeed a very useful technique for fetal heart rate extraction when long-term monitoring of a pregnant woman is required. Furthermore, the CEEMDAN method produces the best results when there is less overlap between the spectral components to be separated. Some limitations like manual selection of IMFs and time consumption during the decomposition process limit the usage of the proposed CEEMDAN-based methodology in a real-time environment. In the future, patient-specific modification of the proposed methodology can eliminate these limitations and can be used in real-time feto-maternal heart rate assessment applications.

Acknowledgments

This research was partially funded by the Technical Education Quality Improvement Programme - Phase Two (TEQIP-II) grant of Ministry of Human Resource Development (MHRD), Government of India, with Reference No. NITJ/TEQIP-II/R&D/1825.

Author Contributions

Abdullah Bin Queyam, Sharvan Kumar Pahuja and Dilbag Singh conceived and designed the experiments; Abdullah Bin Queyam performed the experiments; Abdullah Bin Queyam analyzed the data; Abdullah Bin Queyam and Sharvan Kumar Pahuja contributed reagents/materials/analysis tools; Abdullah Bin Queyam wrote and edited this manuscript. All authors have read and approved the final manuscript.

Conflicts of Interest

The authors declare no conflict of interest.

References

  1. Stout, M.J.; Cahill, A.G. Electronic Fetal Monitoring: Past, Present, and Future. Clin. Perinatol. 2011, 38, 127–142. [Google Scholar] [CrossRef] [PubMed]
  2. Graatsma, E.; Jacod, B.; van Egmond, L.; Mulder, E.; Visser, G. Fetal electrocardiography: Feasibility of long-term fetal heart rate recordings. BJOG 2009, 116, 334–338. [Google Scholar] [CrossRef] [PubMed]
  3. Euliano, T.Y.; Darmanjian, S.; Nguyen, M.T.; Busowski, J.D.; Euliano, N.; Gregg, A.R. Monitoring Fetal Heart Rate during Labor: A Comparison of Three Methods. J. Pregnancy 2017, 2017, 1–5. [Google Scholar] [CrossRef] [PubMed]
  4. Westgate, J.; Keith, R.D.F.; Curnow, J.S.H.; Ifeachor, E.C.; Greene, K.R. Suitability of fetal scalp electrodes for monitoring the fetal electrocardiogram during labour. Clin. Phys. Physiol. Meas. 1990, 11, 297–306. [Google Scholar] [CrossRef] [PubMed]
  5. Clifford, G.D.; Silva, I.; Behar, J.; Moody, G.B. Non-invasive fetal ECG analysis. Physiol. Meas. 2014, 35, 1521–1536. [Google Scholar] [CrossRef] [PubMed]
  6. Vullings, R.; Peters, C.; Mischi, M.; Sluijter, R.; Oei, G.; Bergmans, J. Artifact reduction in maternal abdominal ECG recordings for fetal ECG estimation. In Proceedings of the 29th Annual International Conference of the IEEE Engineering in Medicine and Biology Society, Lyon, France, 22–26 August 2007; pp. 43–46. [Google Scholar]
  7. Neilson, J.P. Fetal electrocardiogram (ECG) for fetal monitoring during labour. In Cochrane Database of Systematic Reviews; Neilson, J.P., Ed.; John Wiley & Sons, Ltd.: Chichester, UK, 2015. [Google Scholar]
  8. Ibrahimy, M.; Ahmed, F.; Ali, M.; Zahedi, E.; Uddin, J. Real-time signal processing for fetal heart rate monitoring. IEEE Trans. Biomed. Eng. 2003, 50, 258–262. [Google Scholar] [CrossRef] [PubMed]
  9. Kanjilal, P.; Palit, S.; Saha, G. Fetal ECG extraction from single-channel maternal ECG using singular value decomposition. IEEE Trans. Biomed. Eng. 1997, 44, 51–59. [Google Scholar] [CrossRef] [PubMed]
  10. Hasan, M.A.; Reaz, M.B.I.; Ibrahimy, M.I. Fetal electrocardiogram extraction and R-peak detection for fetal heart rate monitoring using artificial neural network and Correlation. In Proceedings of the 2011 International Joint Conference on Neural Networks, San Jose, CA, USA, 31 July–5 August 2011; pp. 15–20. [Google Scholar]
  11. Jia, W.; Yang, C.; Zhong, G.; Zhou, M.; Wu, S. Fetal ECG extraction based on adaptive linear neural network. In Proceedings of the 2010 3rd International Conference on Biomedical Engineering and Informatics, Yantai, China, 16–18 October 2010; pp. 899–902. [Google Scholar]
  12. Golzan, S.M.; Hakimpour, F.; Toolou, A. Fetal ECG Extraction Using Multi-Layer Perceptron Neural Networks with Bayesian Approach; Springer: Berlin, Germany, 2009; pp. 311–317. [Google Scholar]
  13. Zhang, N.; Zhang, J.; Li, H.; Mumini, O.; Samuel, O.; Ivanov, K.; Wang, L. A Novel Technique for Fetal ECG Extraction Using Single-Channel Abdominal Recording. Sensors 2017, 17, 457. [Google Scholar] [CrossRef] [PubMed]
  14. Zeng, Y.; Liu, S.; Zhang, J. Extraction of Fetal ECG Signal via Adaptive Noise Cancellation Approach. In Proceedings of the 2008 2nd International Conference on Bioinformatics and Biomedical Engineering, Shanghai, China, 16–18 May 2008; pp. 2270–2273. [Google Scholar]
  15. Karimi Rahmati, A.; Setarehdan, S.K.; Araabi, B.N. A PCA/ICA based Fetal ECG Extraction from Mother Abdominal Recordings by Means of a Novel Data-driven Approach to Fetal ECG Quality Assessment. J. Biomed. Phys. Eng. 2017, 7, 37–50. [Google Scholar] [PubMed]
  16. Lipponen, J.A.; Tarvainen, M.P. Principal component model for maternal ECG extraction in fetal QRS detection. Physiol. Meas. 2014, 35, 1637–1648. [Google Scholar] [CrossRef] [PubMed]
  17. Petrolis, R.; Gintautas, V.; Krisciukaitis, A. Multistage principal component analysis based method for abdominal ECG decomposition. Physiol. Meas. 2015, 36, 329–340. [Google Scholar] [CrossRef] [PubMed]
  18. He, P.J.; Chen, X.M.; Liang, Y.; Zeng, H.Z. Extraction for fetal ECG using single channel blind source separation algorithm based on multi-algorithm fusion. MATEC Web Conf. 2016, 44, 01026. [Google Scholar] [CrossRef]
  19. Polani, D. Kullback-Leibler Divergence. In Encyclopedia of Systems Biology; Dubitzky, W., Wolkenhauer, O., Cho, K.H., Yokota, H., Eds.; Springer: New York, NY, USA, 2013; pp. 1087–1088. [Google Scholar]
  20. Ghazdali, A.; Hakim, A.; Laghrib, A.; Mamouni, N.; Raghay, S. A new method for the extraction of fetal ECG from the dependent abdominal signals using blind source separation and adaptive noise cancellation techniques. Theor. Biol. Med. Model. 2015. [Google Scholar] [CrossRef] [PubMed]
  21. Sato, M.; Kimura, Y.; Chida, S.; Ito, T.; Katayama, N.; Okamura, K.; Nakao, M. A Novel Extraction Method of Fetal Electrocardiogram From the Composite Abdominal Signal. IEEE Trans. Biomed. Eng. 2007, 54, 49–58. [Google Scholar] [CrossRef] [PubMed]
  22. Zarzoso, V.; Nandi, A.K.; Bacharakis, E. Maternal and foetal ECG separation using blind source separation methods. IMA J. Math. Appl. Med. Biol. 1997, 14, 207–225. [Google Scholar] [CrossRef] [PubMed]
  23. Zarzoso, V.; Nandi, A. Noninvasive fetal electrocardiogram extraction: Blind separation versus adaptive noise cancellation. IEEE Trans. Biomed. Eng. 2001, 48, 12–18. [Google Scholar] [CrossRef] [PubMed]
  24. Assaleh, K.; Al-Nashash, H. A Novel Technique for the Extraction of Fetal ECG Using Polynomial Networks. IEEE Trans. Biomed. Eng. 2005, 52, 1148–1152. [Google Scholar] [CrossRef] [PubMed]
  25. Panigrahy, D.; Sahu, P.K. Extraction of fetal ECG signal by an improved method using extended Kalman smoother framework from single channel abdominal ECG signal. Australas. Phys. Eng. Sci. Med. 2017, 40, 191–207. [Google Scholar] [CrossRef] [PubMed]
  26. Su, L.; Wu, H.T. Extract Fetal ECG from Single-Lead Abdominal ECG by De-Shape Short Time Fourier Transform and Nonlocal Median. Front. Appl. Math. Stat. 2017. [Google Scholar] [CrossRef]
  27. Almeida, R.; Gonçalves, H.; Bernardes, J.; Rocha, A.P. Fetal QRS detection and heart rate estimation: A wavelet-based approach. Physiol. Meas. 2014, 35, 1723–1735. [Google Scholar] [CrossRef] [PubMed]
  28. Han, G.; Lin, B.; Xu, Z. Electrocardiogram signal denoising based on empirical mode decomposition technique: An overview. J. Instrum. 2017, 12, P03010. [Google Scholar] [CrossRef]
  29. Chang, K.M. Arrhythmia ECG Noise Reduction by Ensemble Empirical Mode Decomposition. Sensors 2010, 10, 6063–6080. [Google Scholar] [CrossRef] [PubMed]
  30. Blanco-Velasco, M.; Weng, B.; Barner, K.E. ECG signal denoising and baseline wander correction based on the empirical mode decomposition. Comput. Biol. Med. 2008, 38, 1–13. [Google Scholar] [CrossRef] [PubMed]
  31. Suchetha, M.; Kumaravel, N.; Jagannath, M.; Jaganathan, S.K. A comparative analysis of EMD based filtering methods for 50 Hz noise cancellation in ECG signal. Inform. Med. Unlocked 2017, 8, 54–59. [Google Scholar] [CrossRef]
  32. Suchetha, M.; Kumaravel, N. Empirical mode decomposition based filtering techniques for power line interference reduction in electrocardiogram using various adaptive structures and subtraction methods. Biomed. Signal Process. Control 2013, 8, 575–585. [Google Scholar] [CrossRef]
  33. Zhao, Z.; Ma, C. A novel cancellation method of powerline interference in ECG signal based on EMD and adaptive filter. In Proceedings of the 11th IEEE International Conference on Communication Technology, Hangzhou, China, 10–12 November 2008; pp. 517–520. [Google Scholar]
  34. Hadj Slimane, Z.E.; Naït-Ali, A. QRS complex detection using Empirical Mode Decomposition. Digital Signal Process. 2010, 20, 1221–1228. [Google Scholar] [CrossRef]
  35. Pal, S.; Mitra, M. QRS Complex detection using Empirical Mode Decomposition based windowing technique. In Proceedings of the 2010 International Conference on Signal Processing and Communications (SPCOM), Bangalore, India, 18–21 July 2010; pp. 1–5. [Google Scholar]
  36. Campolo, M.; Labate, D.; La Foresta, F.; Morabito, F.; Lay-Ekuakille, A.; Vergallo, P. ECG-derived respiratory signal using Empirical Mode Decomposition. In Proceedings of the 2011 IEEE International Workshop on Medical Measurements and Applications, Bari, Italy, 30–31 May 2011; pp. 399–403. [Google Scholar]
  37. Wang, F.T.; Chan, H.L.; Wang, C.L.; Jian, H.M.; Lin, S.H. Instantaneous Respiratory Estimation from Thoracic Impedance by Empirical Mode Decomposition. Sensors 2015, 15, 16372–16387. [Google Scholar] [CrossRef] [PubMed]
  38. Wu, Z.; Huang, N.E. Ensemble Empirical Mode Decomposition: A Noise-Assisted Data Analysis Method. Adv. Adapt Data Anal. 2009, 1, 1–41. [Google Scholar] [CrossRef]
  39. Torres, M.E.; Colominas, M.; Schlotthauer, G.; Flandrin, P. A complete Ensemble Empirical Mode decomposition with adaptive noise. In Proceedings of the 2011 IEEE International Conference on Acoustics, Speech and Signal Processing (ICASSP), Prague, Czech Republic, 22–27 May 2011; pp. 4144–4147. [Google Scholar]
  40. Romano, M.; Faiella, G.; Clemente, F.; Iuppariello, L.; Bifulco, P.; Cesarelli, M. Analysis of Foetal Heart Rate Variability Components by Means of Empirical Mode Decomposition; Springer: Cham, Switzerland, 2016; pp. 71–74. [Google Scholar]
  41. Gupta, P.; Sharma, K.; Joshi, S. Fetal heart rate extraction from abdominal electrocardiograms through multivariate empirical mode decomposition. Comput. Biol. Med. 2016, 68, 121–136. [Google Scholar] [CrossRef] [PubMed]
  42. Ortiz, M.; Bojorges, E.; Aguilar, S.; Echeverria, J.; Gonzalez-Camarena, R.; Carrasco, S.; Gaitan, M.; Martinez, A. Analysis of high frequency fetal heart rate variability using empirical mode decomposition. Comput. Cardiol. 2005, 32, 675–678. [Google Scholar]
  43. Luukko, P.J.J.; Helske, J.; Räsänen, E. Introducing libeemd: A program package for performing the ensemble empirical mode decomposition. Comput. Stat. 2016, 31, 545–557. [Google Scholar] [CrossRef]
  44. Colominas, M.A.; Schlotthauer, G.; Torres, M.E.; Flandrin, P. Noise-Assisted EMD Methods in Action. Adv. Adapt. Data Anal. 2012. [Google Scholar] [CrossRef]
  45. Huang, N.E.; Shen, Z.; Long, S.R.; Wu, M.C.; Shih, H.H.; Zheng, Q.; Yen, N.C.; Tung, C.C.; Liu, H.H. The empirical mode decomposition and the Hilbert spectrum for nonlinear and non-stationary time series analysis. R. Soc. Lond. A Math. Phys. Eng. Sci. 1998, 454. [Google Scholar] [CrossRef]
  46. Daubechies, I.; Lu, J.; Wu, H.T. Synchrosqueezed wavelet transforms: An empirical mode decomposition-like tool. Appl. Comput. Harmonic Anal. 2011, 30, 243–261. [Google Scholar] [CrossRef]
  47. Gilles, J. Empirical Wavelet Transform. IEEE Trans. Signal Process. 2013, 61, 3999–4010. [Google Scholar] [CrossRef]
  48. Wu, Z.; Huang, N.E. A study of the characteristics of white noise using the empirical mode decomposition method. R. Soc. Lond. A Math. Phys. Eng. Sci. 2004. [Google Scholar] [CrossRef]
  49. Goldberger, A.L.; Amaral, L.A.N.; Glass, L.; Hausdorff, J.M.; Ivanov, P.C.; Mark, R.G.; Mietus, J.E.; Moody, G.B.; Peng, C.K.; Stanley, H.E. PhysioBank, PhysioToolkit, and PhysioNet. Circulation 2000, 101, e215–e220. [Google Scholar] [CrossRef] [PubMed]
  50. Jezewski, J.; Matonia, A.; Kupka, T.; Roj, D.; Czabanski, R. Determination of fetal heart rate from abdominal signals: Evaluation of beat-to-beat accuracy in relation to the direct fetal electrocardiogram. Biomed. Tech. (Berl.) 2012, 57, 383–394. [Google Scholar] [CrossRef] [PubMed]
  51. Matonia, A.; Jezewski, J.; Kupka, T.; Horoba, K.; Wrobel, J.; Gacek, A. The influence of coincidence of fetal and maternal QRS complexes on fetal heart rate reliability. Med. Biol. Eng. Comput. 2006, 44, 393–403. [Google Scholar] [CrossRef] [PubMed]
  52. Kotas, M.; Jezewski, J.; Horoba, K.; Matonia, A. Application of spatio-temporal filtering to fetal electrocardiogram enhancement. Comput. Methods Programs Biomed. 2011, 104, 1–9. [Google Scholar] [CrossRef] [PubMed]
  53. McSharry, P.; Clifford, G.; Tarassenko, L.; Smith, L. A dynamical model for generating synthetic electrocardiogram signals. IEEE Trans. Biomed. Eng. 2003, 50, 289–294. [Google Scholar] [CrossRef] [PubMed]
  54. Sameni, R.; Clifford, G.D. A Review of Fetal ECG Signal Processing; Issues and Promising Directions. Open Pacing Electrophysiol. Ther. J. 2010, 3, 4–20. [Google Scholar] [CrossRef] [PubMed]
  55. Kligfield, P.; Gettes, L.S.; Bailey, J.J.; Childers, R.; Deal, B.J.; Hancock, E.W.; van Herpen, G.; Kors, J.A.; Macfarlane, P.; Mirvis, D.M.; et al. Recommendations for the Standardization and Interpretation of the Electrocardiogram. J. Am. Coll. Cardiol. 2007, 49, 1109–1127. [Google Scholar] [CrossRef] [PubMed]
  56. Brown, C.A.; Lee, C.T.; Hains, S.M.J.; Kisilevsky, B.S. Maternal Heart Rate Variability and Fetal Behavior in Hypertensive and Normotensive Pregnancies. Biol. Res. Nurs. 2008, 10, 134–144. [Google Scholar] [CrossRef] [PubMed]
  57. Lakhno, I. Autonomic imbalance captures maternal and fetal circulatory response to pre-eclampsia. Clin. Hypertens. 2017, 23. [Google Scholar] [CrossRef] [PubMed]
  58. Abboud, S.; Sadeh, D. Power spectrum analysis of fetal heart rate variability using the abdominal maternal electrocardiogram. J. Biomed. Eng. 1990, 12, 161–164. [Google Scholar] [CrossRef]
  59. Salamalekis, E.; Hintipas, E.; Salloum, I.; Vasios, G.; Loghis, C.; Vitoratos, N.; Chrelias, C.; Creatsas, G. Computerized analysis of fetal heart rate variability using the matching pursuit technique as an indicator of fetal hypoxia during labor. J. Matern. Fetal Neonatal Med. 2006, 19, 165–169. [Google Scholar] [CrossRef] [PubMed]
  60. Cerutti, S.; Civardi, S.; Bianchi, A.; Signorini, M.G.; Ferrazzi, E.; Pardi, G. Spectral analysis of antepartum heart rate variability. Clin. Phys. Physiol. Meas. 1989, 10, 27–31. [Google Scholar] [CrossRef] [PubMed]
  61. Lahmiri, S.; Boukadoum, M. Physiological signal denoising with variational mode decomposition and weighted reconstruction after DWT thresholding. In Proceedings of the 2015 IEEE International Symposium on Circuits and Systems (ISCAS), Lisbon, Portugal, 24–27 May 2015; pp. 806–809. [Google Scholar]
  62. Niang, O.; Thioune, A.; Gueirea, M.C.E.; Delechelle, E.; Lemoine, J. Partial Differential Equation-Based Approach for Empirical Mode Decomposition: Application on Image Analysis. IEEE Trans. Image Process. 2012, 21, 3991–4001. [Google Scholar] [CrossRef] [PubMed]
  63. Liu, Y.; Zhang, X.; Yu, Y. A fast entropy assisted complete ensemble empirical mode decomposition algorithm. In Proceedings of the 2014 2nd International Conference on Systems and Informatics (ICSAI), Shanghai, China, 15–17 November 2014; pp. 697–701. [Google Scholar]
Figure 1. Flowchart of the Empirical Mode Decomposition (EMD).
Technologies 05 00068 g001
Figure 2. Intrinsic mode functions (IMFs) obtained after Complete Ensemble Empirical Mode Decomposition with Adaptive Noise (CEEMDAN) decomposition of a noisy Photoplethysmograph (PPG) signal.
Technologies 05 00068 g002
Figure 3. A noisy PPG signal (Top) and its denoised version (Bottom).
Technologies 05 00068 g003
Figure 4. The process of finding the reference fetal R-peaks: (A) aECG signal of 2000 samples from record nif0404; (B) band passed signal (60–100-Hz band); (C) detected fetal R-peaks, which are considered as reference fetal QRS annotations for the “nifecgdb” dataset.
Technologies 05 00068 g004
Figure 5. An example of: (A) a noisy aECG signal obtained from PhysioNet (adfecgdb) database; (B) a noisy synthetic aECG signal simulated in LabVIEW using the Bio-Physiological Signal Generator (BPSG) virtual instrument.
Technologies 05 00068 g005
Figure 6. Flowchart of the proposed methodology. HRV, Heart Rate Variability; LPF, Low Pass Filter.
Technologies 05 00068 g006
Figure 7. (A) A noisy aECG signal (r0104) collected from the PhysioNet database (adfecgdb) (Top) and its 12 IMFs after CEEMDAN decomposition; (B) a noisy synthetic aECG signal generated from BPSG (Top) and its 11 IMFs after CEEMDAN decomposition.
Technologies 05 00068 g007
Figure 8. PhysioNet aECG processing: (A) sum of the selected IMFs for probable MHR and FHR information; (B) downsampled and bandpass signal; (C) peak detection of the envelope generated using squaring and low-pass filtering (S+L); (D) peak detection of the envelope generated using Hilbert transform and low-pass filtering (H+L).
Technologies 05 00068 g008
Figure 9. Synthetic aECG processing: (A) sum of the selected IMFs for probable MHR and FHR information; (B) downsampled and bandpass signal; (C) peak detection of the envelope generated using squaring and low-pass filtering (S+L); (D) peak detection of the envelope generated using Hilbert transform and low-pass filtering (H+L).
Technologies 05 00068 g009
Figure 10. Comparison of the Power Spectral Density (PSD).
Technologies 05 00068 g010
Figure 11. HRV analysis of the RR tachogram obtained from the reference signal and the signal extracted using CEEMDAN decomposition: (A) analysis of the maternal ECG components; (B) analysis of the fetal ECG components.
Technologies 05 00068 g011aTechnologies 05 00068 g011b
Table 1. Maternal ECG (mECG) model parameters.
Index (i)PQRST
a i ( mV ) 0.2−0.251.5−0.40.5
b i ( s ) 0.030.010.0140.010.05
c i ( s ) 0.30.470.50.530.75
f 2 12 cycles per minute
A0.15 mV
Table 2. Fetal ECG (fECG) model parameters.
Index (i)PQRST
a i ( mV ) 0.1−0.21.4−1.20.06
b i ( s ) 0.040.020.020.0150.08
c i ( s ) 0.20.480.50.520.8
Table 3. Combination of maternal and fetal heart rates used to generate synthetic (syn) abdominal signals. MHR, Maternal Heart Rate; FHR, Fetal Heart Rate.
syn0101syn0201syn0301syn0401syn0501
MHR (in bpm)7281836668
FHR (in bpm)131143122119148
Table 4. Results of the maternal R-peak detection and its various performance measures. Se, Sensitivity; PDV, Positive Diagnostic Value; PI, Performance Index; r, recording.
Database TypeRecord NameSelected IMFReference Maternal R-peaks (N)Detected Maternal R-peaksPerformance Measures
TPFPFNSe (%)PDV (%)Acc (%)PI (%)F1
PhysioNet (adfecgdb), 30,000 Samples @1000 Hzr01047 + 8 + 943423197.6793.3391.3090.700.95
r04047 + 8 + 93838001001001001001
r07047 + 8 + 93535001001001001001
r08047 + 8 + 94342119897.6795.4595.350.98
r10047 + 8 + 95353001001001001001
PhysioNet (nifecgdb), 30,000 Samples @1000 Hznif04036 + 7 + 84444001001001001001
nif04046 + 7 + 84444001001001001001
nif09046 + 7 + 84444001001001001001
nif10036 + 7 + 84444001001001001001
nif17036 + 7 + 84747001001001001001
nif34036 + 7 + 84646001001001001001
Synthetic Signals, 20,000 Samples @500 Hzsyn01017 + 84845339493.7588.2487.500.94
syn02017 + 85453419892.9891.3890.740.95
syn03017 + 85553229696.3692.9892.730.96
syn04017 + 844433197.7393.4891.4990.910.96
syn05017 + 84545001001001001001
Mean Value of Performance Measures72771816998.8397.9796.9396.750.98
The nomenclature of the record name indicates the database to which it belongs; the first 2 digits indicate the record number and the last 2 digits indicate the channel number (for example, nif0403 belongs to the “nifecgdb” database with Record Number 4 and selected abdominal Channel 3).
Table 5. Results of the fetal R-peak detection and its various performance measures.
Database TypeRecord NameSelected IMFReference Fetal R-peaks (N)Detected Fetal R-peaksPerformance Measures
TPFPFNSe (%)PDV (%)Acc (%)PI (%)F1
PhysioNet (adfecgdb), 30,000 Samples @1000 Hzr01044 + 56565001001001001001
r04044 + 563603395.2495.2490.9190.480.95
r07044 + 564612395.3196.8392.4292.190.96
r08044 + 563605395.2492.3188.2487.300.94
r10043 + 464621296.8898.4195.3895.310.98
PhysioNet (nifecgdb), 30,000 Samples @1000 Hznif0403479777297.4791.6789.5388.610.94
nif0404479765396.2093.8390.4889.870.95
nif0904479772297.4797.4795.0694.940.97
nif100347878001001001001001
nif170347878001001001001001
nif3403479772297.4797.4795.0694.940.97
Synthetic Signals, 20,000 Samples @500 Hzsyn010148787001001001001001
syn020149595001001001001001
syn030148181001001001001001
syn0401479781198.7398.7397.5097.470.99
syn050149898001001001001001
Mean Value of Performance Measures12311210282198.1397.6295.9195.690.98
The nomenclature of the record name indicates the database to which it belongs; the first 2 digits indicate the record number, and the last 2 digits indicate the channel number (for example, r1004 belongs to the “adfecgdb” database with Record Number 10 and selected abdominal Channel 4).
Table 6. Time domain statistics.
MaternalFetal
mReff.mExtr.fReff.fExtr.
RR mean695 ms695 ms463 ms463 ms
RR std.47 ms46 ms3.9 ms5 ms
Heart rate mean87 bpm87 bpm130 bpm130 bpm
Heart rate std.6.7 bpm6.7 bpm1.5 bpm1.8 bpm
RMSSD35 ms36 ms2.5 ms5.6 ms
NN505800
pNN50121900
RR triangular index10.88.61.92.1
TINN140.7 ms120.8 ms0 ms7.2 ms
RR = Consecutive R-peak interval in milliseconds (ms); mReff. = Reference maternal RR interval; mExtr. = Extracted maternal RR interval; fReff. = Reference fetal RR interval; fExtr. = Extracted fetal RR interval; NN = normal R-peak to normal R-peak intervals; RMSSD = square root of the mean of the sum of the squares of differences between adjacent NN intervals; SDNN = standard deviation of all NN intervals; NN50 = number of pairs of adjacent NN intervals differing by more than 50 ms; pNN50 = the ratio of the number of NN50 intervals and the number of all NN intervals; TINN = triangular interpolation of NN interval.
Table 7. Fast Fourier Transform (FFT) spectrum; frequency domain statistics.
MaternalFetal
mReff.mExtr.fReff.fExtr.
VLF power11 ms214 ms20.18 ms20.17 ms2
LF power65 ms261 ms20.61 ms20.63 ms2
HF power66.8 ms260.4 ms20.064 ms20.12 ms2
VLF7.90%10%21%19%
LF46%45%72%68%
HF47%44%7.50%13%
LF norm47.8 n.u.48.4 n.u.82.4 n.u.57.6 n.u.
HF norm49 n.u.47.6 n.u.8.62 n.u.10.9 n.u.
LF/HF0.9819.65.3
mReff. = Reference maternal RR interval; mExtr. = Extracted maternal RR interval; fReff. = Reference fetal RR interval; fExtr. = Extracted fetal RR interval; VLF, very low frequency; LF, low frequency; HF, high frequency; ms2 = units of spectral power; n.u. = normalized units.
Table 8. Autoregressive (AR) spectrum; frequency domain statistics.
MaternalFetal
mReff.mExtr.fReff.fExtr.
VLF power5.8 ms28 ms20.018 ms20.055 ms2
LF power52 ms245 ms20.28 ms20.42 ms2
HF power29 ms224.8 ms20.115 ms20.169 ms2
VLF6.70%10%4.40%8.50%
LF60%58%68%65%
HF35%34%26%19%
LF norm62.2 n.u.61.2 n.u.62.9 n.u.47.2 n.u.
HF norm33.5 n.u.32 n.u.27.6 n.u.26.4 n.u.
LF/HF1.81.82.52.5
mReff. = Reference maternal RR interval; mExtr. = Extracted maternal RR interval; fReff. = Reference fetal RR interval; fExtr. = Extracted fetal RR interval; VLF, very low frequency; LF, low frequency; HF, high frequency; ms2 = units of spectral power; n.u. = normalized units.

