Behavior Drift Detection Based on Anomalies Identification in Home Living Quantitative Indicators †


Department of Electronics, Information and Bioengineering, Politecnico di Milano, Piazza L. da Vinci 32, 20133 Milano, Italy
*
Author to whom correspondence should be addressed.
†
This paper is an extended version of our paper in Proceedings of AAATE2017 Congress, Sheffield, UK, 13–14 September 2017.
Technologies 2018, 6(1), 16; https://doi.org/10.3390/technologies6010016
Submission received: 15 December 2017
/
Revised: 9 January 2018
/
Accepted: 24 January 2018
/
Published: 25 January 2018
(This article belongs to the Special Issue Selected Papers from AAATE2017 Congress)
Abstract
:Home Automation and Smart Homes diffusion are providing an interesting opportunity to implement elderly monitoring. This is a new valid technological support to allow in-place aging of seniors by means of a detection system to notify potential anomalies. Monitoring has been implemented by means of Complex Event Processing on live streams of home automation data: this allows the analysis of the behavior of the house inhabitant through quantitative indicators. Different kinds of quantitative indicators for monitoring and behavior drift detection have been identified and implemented using the Esper complex event processing engine. The chosen solution permits us not only to exploit the queries when run “online”, but enables also “offline” (re-)execution for testing and a posteriori analysis. Indicators were developed on both real world data and on realistic simulations. Tests were made on a dataset of 180 days: the obtained results prove that it is possible to evidence behavior changes for an evaluation of a person’s condition.
1. Introduction
The design of smart environment solutions is an area that in recent years has been expanding its presence on the market, thanks to the many possible applications [1]. Thanks to this, we can now benefit from consumer appliances and devices that are are gaining embedded information, computation power and communication technologies: this promises enhanced functionality, connectivity and manageability [2]. Concerning the instrumentation of domestic environments, we talk about Smart Home and Home Automation referring to the installation of non-intrusive sensors that detect specific events that happen in the home (e.g., door/window openings, motion, etc.). This is interesting both as a commodity and a way to collect information in home environments: part of current research is focused in monitoring everyday life of fragile people, such as older seniors, enabling us to recognize important happenings in their behavior. The main goal is to promote in-place aging of older people through Assistive Technologies, preserving their independence for as long as possible. This means to detect sudden domestic accidents (e.g., falls, emergencies, etc.) as well as long term changes (e.g., dementia symptoms), giving caregivers the opportunity to intervene with on-demand quick and specific actions, only if necessary. In this way, the current health care paradigm could be changed, moving from a reactive to a proactive one as fostered by the Active and Assisted Living [1]; as result, this research impacts on the society reducing the costs of population aging and improving the older seniors’ quality of life.
Stream reasoning techniques [3] applied to Home Automation (HA) data make possible the identification of undesired conditions in a continuous manner. This enables the family or the carers to receive notification about the person’s status and to intervene in case of need. In this work we report a method to design quantitative indicators suitable for everyday domestic life monitoring, which we believe are significant for tracking the human routine, obtained by applying continuous querying to streaming HA data. Moreover these indicators are implemented in a Behavior Drift Detection (BDD) [4] System based on Esper Complex Event Processing engine [5], their values undergo a combination of two statistical tests to evidence anomalies. The results of the overall system are hereby presented.
This paper is an extension of the work presented by Veronese et al. [6]; in the following section we analyze the literature concerning relevant works on domestic behavior changes detection. The rest of this work is structured as follows: Section 3 reports the quantitative indicators; Section 4 describes the system implementation; while Section 5 describes the experimental results of the system testing; Finally, Section 6 introduces the automatic detection of anomalies; Section 7 reports the results of the anomaly detection system; and Section 8 concerns conclusions and future works.
2. State of the Art
The research on monitoring technologies in Smart Environments addresses several challenges that range from the development of physical devices to system design in specific applications. We hereby report the state of the art concerning the use of Smart Homes and Ambient Assisted Living (AAL) [7] technologies to monitor the inhabitants; behavioral deviations are often related to changes in Activities of Daily Living (ADL) [8]. In the second subsection, we will report the most relevant research results regarding indicators for Behavioral Drift Detection: these methods are intended to extract useful information from a Home Automation dataset though quantitative measures. Finally, the section closes with a review of complex event processing systems to provide the reader with a proper perspective on the technologies available for stream reasoning.
2.1. Smart Home Monitoring
In order to collect data from a dwelling and monitor its inhabitant(s) an instrumented house is necessary. As already mentioned, this topic has attracted a lot of attention in the last years in the most varied fields. Moreover, the scientific community has focused his attention specifically on monitoring through smart home data. These studies implied the installation of the system, exploring the technological issues related to Smart Environments such as sensor selection and household invariance. Indeed, Debes et al. [9] report that cost, performances, installation issues (e.g., wiring, power, etc.), and obsolescence of the considered devices play an important role in the design phase of a Smart Home; the household invariance refers instead to the possibility to design generic smart home monitoring systems that can be invariant to the house configuration, and so to easily find application in a real context. This factor significantly impact on the overall success of the proposed solution [10].
Atallah et al. [11] classify the research related to human monitoring according to the involved sensors and report two broad categories: monitoring system using wearable sensors and monitoring systems using environmental sensors. The first category directly measure physical, biological and psychical conditions of the dweller, but it requires users to wear and interact with them [2,12]. Since asking people to actively carry the sensors can be invasive and unpleasant [13], our research considers only ambient sensors that have the peculiarity of capturing relevant information about the environment and, therefore, information about people living in the environment. To limit the invasiveness of the system and to avoid maintenance issues, the same assumption was made by several research projects involving smart home monitoring:
- CASAS (Center for Advanced Studies in Adaptive Systems) from Washington State University is a very active research group in the field of Activity Recognition in Smart Environments. They have collected and published several datasets of Home Automation data with ground truth labels related to Activities of Daily Living for one or more residents [14];
- ARAS (Activity Recognition with Ambient Sensing) is a dataset collected by Alerndar et al. [15]. It refers to the daily living of two single people for 30 days each; it also contains ground truth labels regarding the performed activities;
- GERHOME is a project conducted by Zouba [16] during witch an home automation dataset has been collected. It refers to the performance of specific tasks in a home automation laboratory;
- MIT Dataset is a dataset collected over two Smart Homes by Tapia et al. [17]. It has been used to perform Activity Recognition using Home Automation data;
- KASTEREN Dataset is a dataset collected by a group of the University of Amsterdam [18] to perform Activity Recognition. It contains data from three Smart Homes and it is accompanied by ground truth labels annotated by volunteers;
Having a large amount of data is the first step to achieve Behavioral Drift Detection. Moreover, it is important to emphasize the importance of having good quality data, possibly with the addition of ground truth labels. The next section is devoted to a brief analysis of the work done to design quantitative indicators to describe human behavior.
2.2. Indicators for Behavioral Drift Detection
A step toward BDD of people living in a smart environment can be the usage of quantitative indicators, that transform raw data streaming concerning sensors activation to more significant data.
A first system for Ambient Intelligence Prediction in a smart home is proposed by Suryadevara et al. [21,22]. The method consists of two equations that evaluate the level of abnormality in an activity of daily living, observing the usage of a given appliance. Subsequently, a batch procedure computes the score of different segment of the dataset, and it compares them in order to highlight changes. The presented results refer to data collected by few volunteers in a week, and do not report significant validation metrics for the proposed indicators.
A more structured analysis from Yang et al. [23] outlines four measures that can be used in a Smart Home to evaluate the activity profile of the dweller every 24 hours:
- Activity time ratio denotes the frequency of the performance of an activity during a day;
- Activity ratio adds the concept of intensity of activity to the previous index;
- Daily activity rate denote the intensity of the activity of a given day;
- Coefficient of variance of daily activities denotes the distribution of activities during the day using the standard distribution.
The system was tested on the field, recording a few unexpected happenings as well as identifying different habits on weekdays and weekends.
The system proposed by Jain et al. [24] detects and classifies drifts in three categories: cyclic, descendant, chaotic. Their method evaluates the correlation between time periods related to different portions of a dataset to perform classification.
Other interesting research refer to systems that use wearable sensors. For example, Candás et al. [25] use an accelerometer embedded in a wristband to detect behavioral changes in dwellers. The proposed method requires as input acceleration measurements that have been collected while the person performs ADLs. Data processing is based on the Jerk-based Inactivity Magnitude and it is performed on different time periods to detect changes. Even in this case, the testing phase involved few volunteers, who manually annotated their ADLS to provide ground truth labels. A flaw in the results provided by this research is the lack of a clear definition of Abnormal Behavior. Finally, Eagle et al. [26] introduce the concept of entropy to analyze data coming from wearable devices such as GPS positioning and Bluetooth activity. The proposed method aims to measure the level of predictability of the behavior of a person, trying to discover human behavioral patterns that may be relevant for routine monitoring.
2.3. Complex Event Processing
A responsive monitoring system should be capable to immediately react when relevant data are collected. Most of the projects hereby reported apply batch approaches and, when needing to perform live tests of the proposed methods, they rely on custom software implementation. Complex event processing (CEP) engines have been developed to collect and analyze stream data live, thus we believe they are better suited for such a task. In the following we analyze the available literature concerning CEP engines.
A first generation of CEP engines followed the traditional Publish-Subscribe model [27]. In this kind of system, one or more publisher(s) send messages to one or more subscriber(s), while a set of rules called subscriptions are responsible for extracting the relevant content from the data stream.
Hereafter, other models have been developed to extend CEP engines; some of the most relevant for the proposed work will be reported hereby.
Rapide [28] is one of the first CEP engines which is capable to process data according to the history and the relationships among events. It exploits a set of operators like conjunction, disjunction, negation, sequence and iteration to create patterns. This model does not contemplate the usage of absolute time references.
Padres [29] uses a publish-subscribe model to notify the relevant data triggered by a pattern-based language. It introduce the usage of logical operations and fixed time windows.
DistCED [30] improves Padres by adding the possibility of sliding time windows customizable by the user. It is implemented as a finite state automaton that processes rules to produce an output.
Sase [31] has been developed to analyze Radio-Frequency IDentification (RFID) stream data. It uses a syntax based on three clauses: “event” to specify what should be extracted, “where” for the subscriptions and “within” to define the temporal windows. This model allows us to recognise sequences of events but not to aggregate them. Sase+ improves Sase adding the possibility to aggregate and iterate events with a drawback in the algorithm complexity.
Cayuga [32] is based on CEL (Cayuga Event Language) whose main instructions are: select, from and publish. Since it does not allow us to specify time windows, nested instructions should be used to process complex events.
NextCEP [33] is very similar to Cayuga but it has been optimized to work as a distributed system.
RTEC [34] is a CEP engine based on the logical formalism Event Calculus and developed in the frame of Big Data. It goes beyond the traditional paradigm of databases in order to specialize in the management of events in time.
ruleCore [35] is a recent tool designed for CEP. It uses a tree data structure where leaves represent simple events while nodes stand for operators. The resulting value of these operators propagate from the leaves to the root and finally, when one of the root becomes true, the related pattern is triggered.
T-Rex [36] is system developed for CEP based on TESLA querying language [37]. It represents a trade-off between expressiveness and efficiency. It implemented in C++ and it defines rules incrementally.
Esper developed by EsperTech Inc. [5] is an open source Java library software. In order to trigger some actions based on the incoming events it applies queries written in EPL (Event Processing Language): an SQL-like language capable of standard operators (join, union etc.) with extensions to handle time windows and patterns. It also provides timers and gives the developer the possibility to implement extra functionalities directly inside the engine with Java pieces of code.
Thanks to those characteristics, and since the amount of incoming data was not so demanding, we chose Esper as the CEP engine to be used in this work.
3. Home Living Quantitative Indicators
With the intent of describing the inhabitant’s behavior through a set of quantities able to follow its changes, the starting point is the home automation data stream. In the following we report the set of Quantitative Indicators used in this work, grouping them in four main groups, based on their mathematical background and complexity.
3.1. Sensor Activation Time
The simplest way to produce a quantitative descriptor based on a sensor datum is considered its binary activity, related to everyday actions. Considering the amount of time such a sensor (e.g., a door/window sensor, a motion detector, a bed or sofa pressure mat, etc.) is active, with respect to a significant time window (e.g., an hour, a day, a week). Such an indicator, named SAT (Sensor Activation Time) can be applied to many aspects; in its most basic context it can track the sleep/rest habits by representing the bed sensor activity.
Despite its simplicity, the SAT indicator can still represent some significant yet simple changes in the person’s behavior. As an example it can be applied to track the time spent by the person relaxing (or performing some social interactions with guests) rather than performing other activities: considering a binary sensor placed on the sofa, its active time is proportional to the time spent performing such activities.
3.2. Complex Data Extraction
Rising the complexity level of the SAT indicator it enhances the significance of its changes. By considering the resources correlated to the quantities sensed by some of the house sensors (e.g., electricity, heat, water) and estimating their consumptions, it is possible to reconstruct some information related to the ADLs where such resources are involved. Considering the water usage it is possible to picture a meaningful example. Tracking the daily water consumption pattern reflects the changes in habits involving the usage of the shower, the sinks, the washing machine, the Water Cabinet (WC), etc. It is worth remembering that the same effectiveness can still be achieved by estimating the consumption at every usage cycle (or per second of usage) and keeping track of them, thanks to cheaper and simpler sensors (rather than those measuring water flow).
From the Resource Consumption (RC) complex indicator reporting the water usage (as briefly detailed in the former example) one can derive information about hygiene and housekeeping habits. It is expected, as experimental results reported in Section 5, that a change in such habits is reflected by the numeric value of the indicator.
3.3. Pattern Recognition
Some contexts require more specificity to detect a certain ADL in the sensors activations, by recognizing a given sequence of activations at some environmental conditions. As a representative example the reader might consider the detection and tracking of the time spent exclusively watching TV. This activity is interesting to monitor as index of inactivity and an excess represents a possible symptom of depression or other medical conditions.
The application of stream processing enables a live computation of the Activity Daily Time (ADT). In general, to identify the activity itself it is indeed necessary to recognize its initiating or resuming conditions as well as the terminating or pausing schemes. Each homogeneous segment duration can then be cumulated to a daily total time. Considering the watching TV activity example, the action is started when the person sits on the sofa and the TV is (turned) on, while no other significant activity is recorded by other sensors.
Indeed, the main application of such kinds of indicator is to track a particular daily activity. To report an example, Alzheimer’s Disease (AD) or dementia have among their symptoms an elongation of the duration of passive or complex activities [38]: monitoring the time spent in such tasks can be meaningful when evaluating early stages or checking the disease progression.
3.4. Entropy Based
The last family of indicators is Entropy Based (EB). Considering the concept of information contained in a binary sensor data stream, it is possible to assimilate it to the Information Theory concept of Entropy [39]: the information content of a binary variable. From this perspective, the entropy of a sensor describes the meaningfulness of its activity, rather than the activation time (as computed in SAT indicators). For sake of clarity, the Entropy of the sensor s is computed as:
where is the probability of the sensor to switch to the i-th status, computed in the considered interval (t-th day), with the granularity of 1 s.
Entropy can be applied not only to a single sensor, but also to the whole house at once, analyzing not a single aspect but the overall activity of the full set of sensors. In detail, building a vectorial binary variable out the instantaneous sensors statuses, and conveniently converting such binary “word” to a decimal number, it is possible to compute its Entropy. The Entropy of such a variable can be computed with a formula similar to Equation (1) considering all the possible decimal values corresponding to the original binary statuses:
where is the sensors number.
Regarding non-binary sensors, they can still be considered when computing entropy by a quantization of their value range. In such case the conversion of the whole house status to a decimal number it is possible by only admitting enough “binary digits” to represent all the levels of such a sensor. Just to report a simple example, let us suppose to include a temperature sensor in the indicator measure. In place of having just one binary digit describing its state, we could arbitrarily define four levels of temperature (low—under 17 °C, comfortable—from 17 °C to 19 °C, warm—from 19 °C to 22 °C, and hot—over 22 °C) which requires not only one bit (as a binary sensor would), but two, encoding of the states as: 00, 01, 10, and 11.
As reported in Section 5 the EB indicator on the whole house is resilient to mild changes, being thus more useful to detect broad changes involving the whole environment (e.g., changes in working routine, vacations, illness, etc.).
4. Design and Implementation
The design of the BDD system based on quantitative indicators faced three main issues: the data collection, the live detection of anomalies, and the reproducibility of the results. In the following we describe the structure of the system, as well as how these challenged were approached.
4.1. Home Automation Data Collection
In order to implement the system, it was necessary an experimental setting of a smart home with an inhabitant undergoing a behavioral drift, recording data for a long time. These conditions are very challenging to achieve and replicate: it is not given that any volunteering person will experience a significant behavioral drift, and its analysis and identification requires extensive study by physicians. In place of running a long term project with years of running time and tens or hundreds of involved volunteers, we exploited realistic synthetic data obtained by a simulator.
Thus, all the setup acted on available datasets, but provided as a stream to the CEP engine. In particular it was needed to include time information in events, so make possible to stream data faster than real time. This enabled to test and develop the quantitative indicator using ARAS [15] real world dataset. Hence it was possible to avoid the smart home installation costs, the acquisition time delay, and the other drawbacks of a real installation still developing a system able to operate also in those conditions.
4.2. Complex Even Processing Engine
The chosen technology to perform the live processing of the data is Esper [5]. This CEP engine has two important features making particularly suited for the settings we have drawn: it is purposefully designed to describe complex conditions and events (as needed for RC indicators), patterns (as necessary for ADT indexes), relieving the effort necessary to describe them; and it enables to integrate functions programmed in Java (as needed for Entropy).
Further, the time windowing necessary for all of the indicators it is natively provided by Esper. However, to obtain results in reduced computation times data was not streamed live, but at higher speed (up to 100 times faster), requiring to explicitly specify time boundary in the query.
4.3. Behavior Drift and Repeatability
In a second development phase, to have custom data including a behavior drift we chose to use a simulator. The data were generated using SHARON [40], enabling us to maintain the ARAS dataset environment (house, sensors, etc.). Two datasets of approximately three months each were generated, including the domestic activity of a person living alone as detected by the set of virtual sensors. While the first dataset comprises the normal routine, the second contains the behavioral drift which could be generated by the occurrence of AD [38]. In particular, the simulated symptoms comprise an erratic sleep pattern, an increased duration of complex activities (e.g., having a shower, meals, etc.) and an anomalous augmentation of passive activities (e.g., watching TV, relaxing, etc.).
5. Quantitative Indicators Preliminary Results
As briefly explained in the previous sections, the system was tested on both real-world datasets and on simulated data. For sake of relevance here we report the results obtained with the two simulated datasets, for each of the indicators presented in Section 3.
5.1. Datasets Characteristics
The experiments were performed on a dataset of 180 days. They include data obtained by activating sensors in a virtual environment, reproducing the settings of the ARAS datasets [15]. In order to improve the significance of the experiments the daily routine was designed ex-novo, including weekly routine variations, as described in the following.
The data were generated with two different configurations, enabling the second 90 days to include a continuous linear variation of the need and activity parameters, in order to change the behavior of the simulated inhabitant. The aim was to emulate the conditions of AD, increasing the duration of complex activities (preparing and eating meals, using the toilet, having shower) and of passive activities (watching TV, relaxing, napping). Finally, the sleeping pattern was made irregular and less predictable, which is realistic for AD cases.
5.2. Sensor Activation Time—SAT
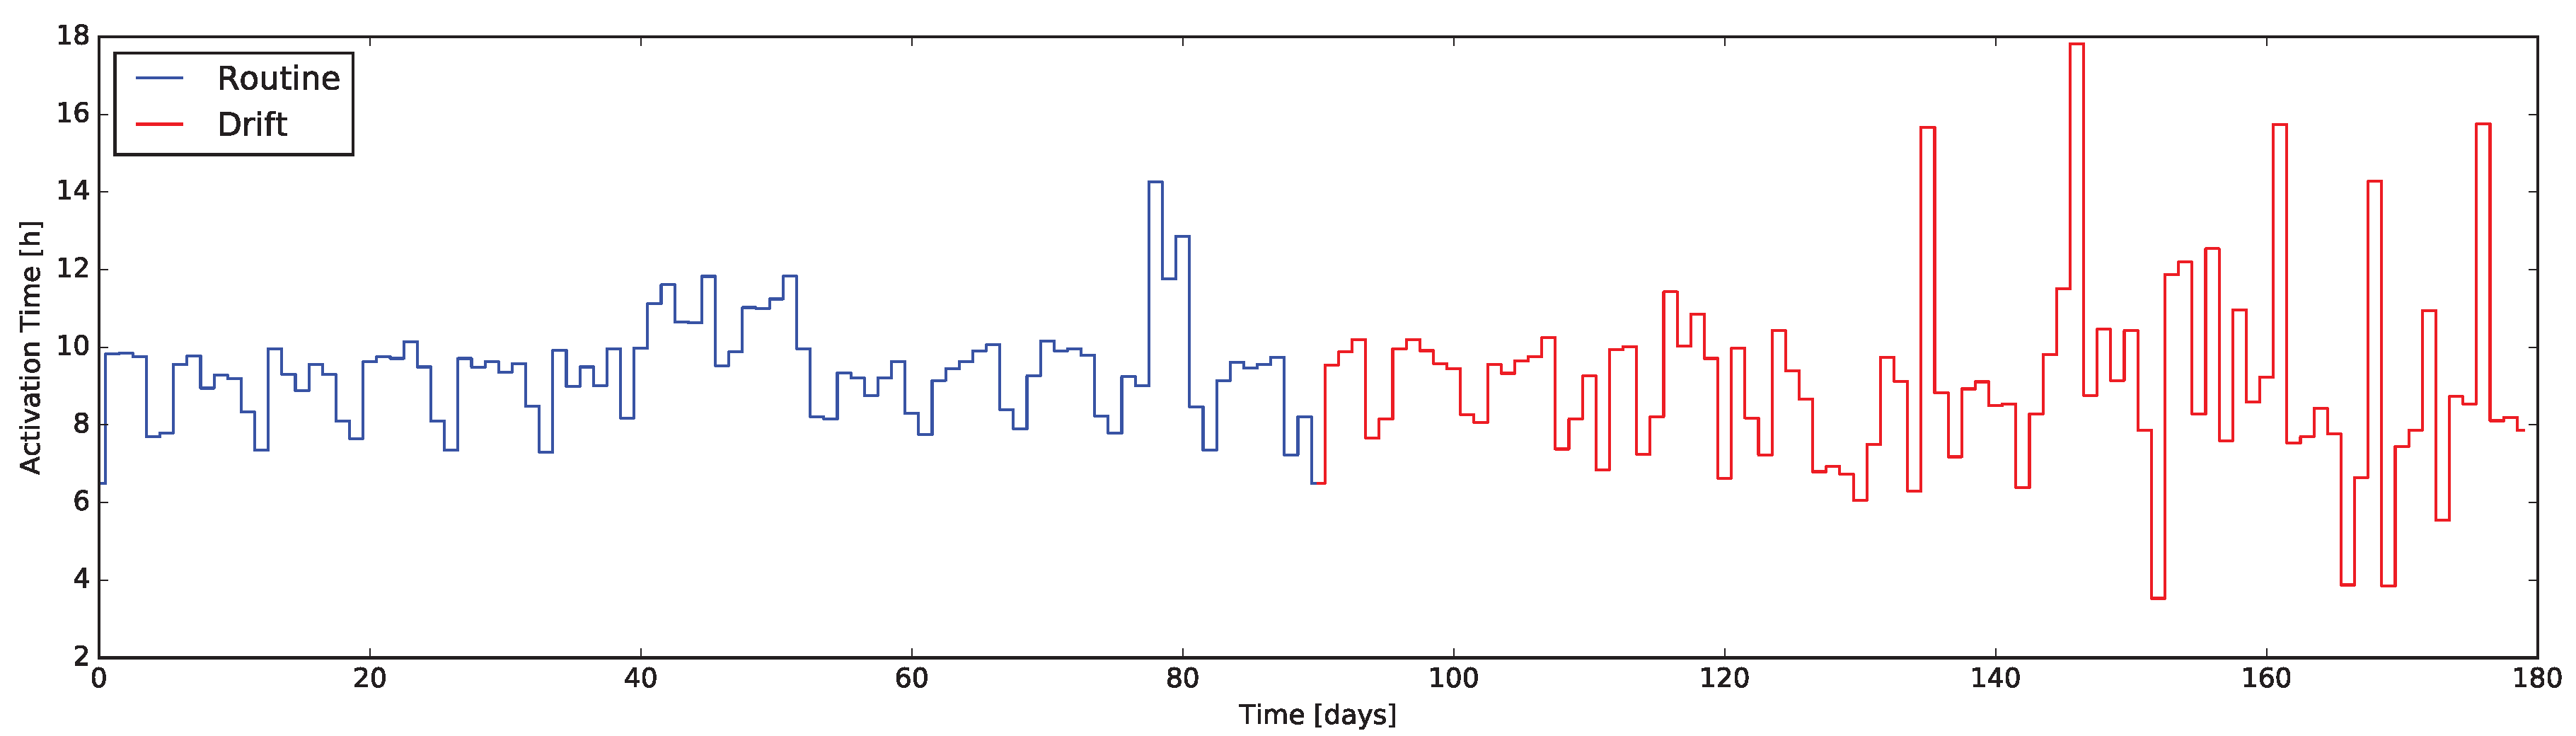
The SAT indicator was tested on the bed sensor, enabling to track quantitatively the changes in sensor activations. Given the variations of the sleeping pattern on weekdays and workdays, as well as the BD-induced spikes, it is possible to appreciate the indicator evidences in Figure 1.
5.3. Resource Consumption—RC
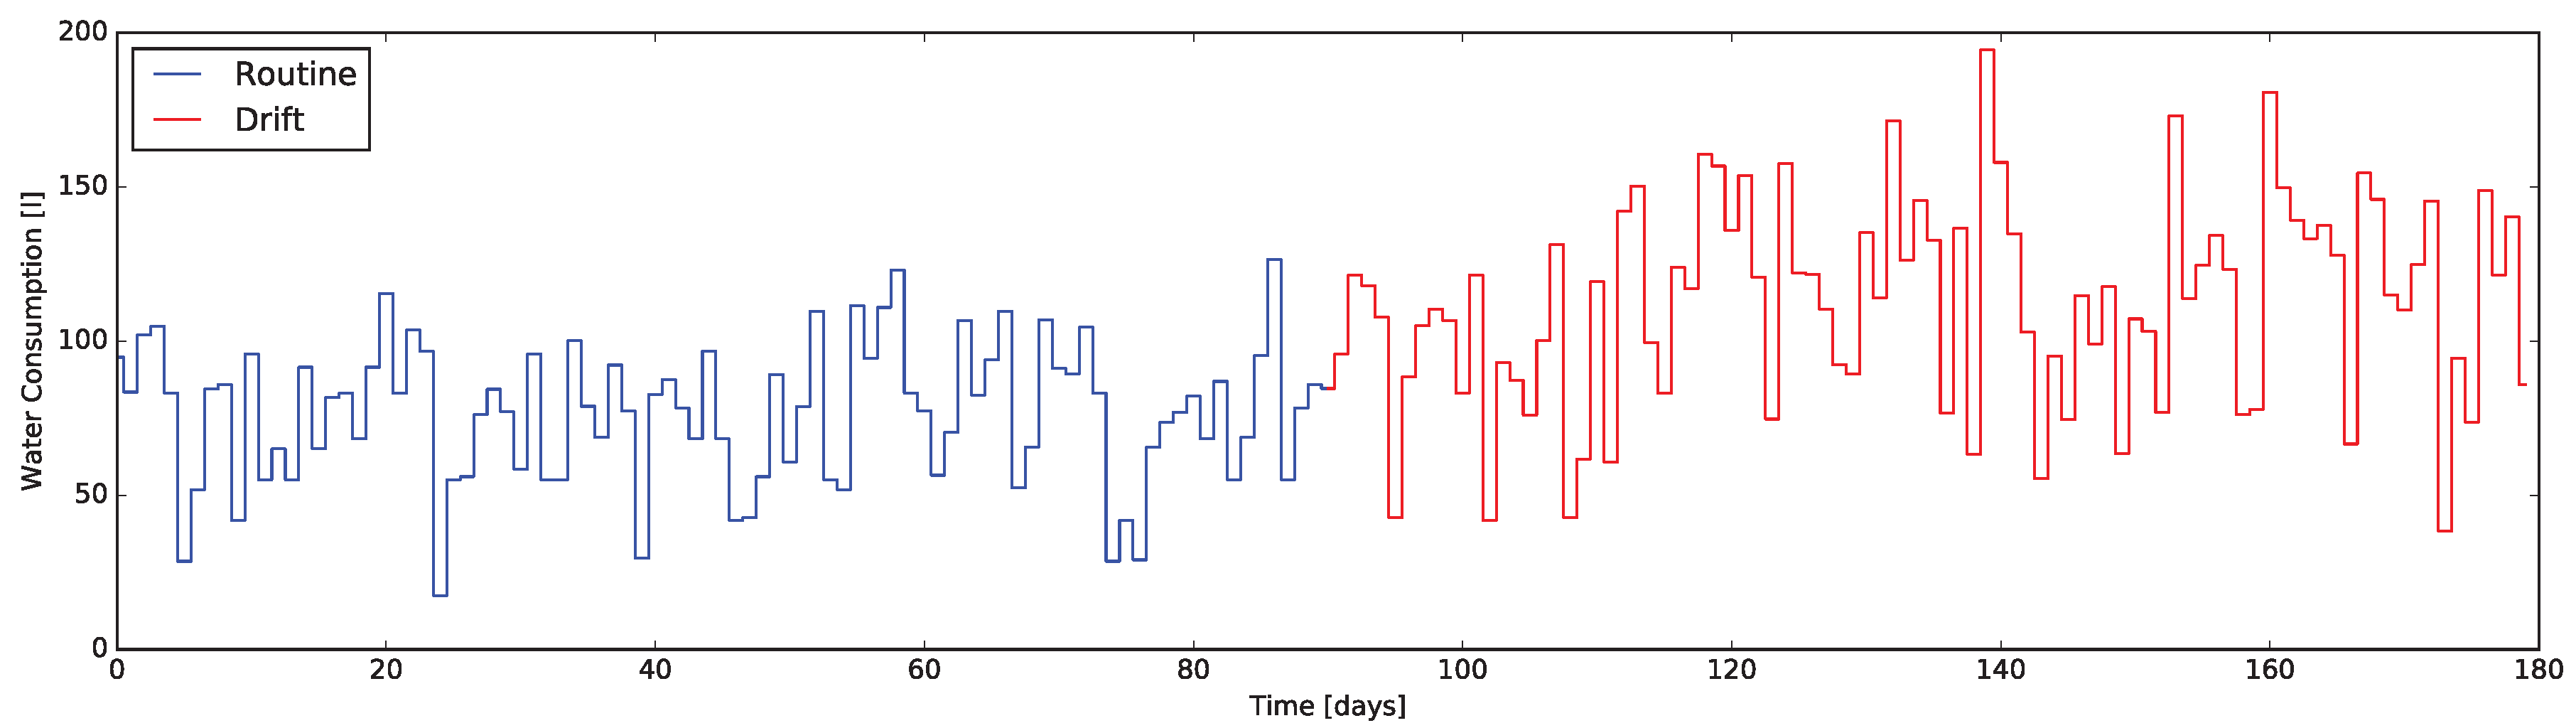
For sake of simplicity and significance, the experiments were performed adopting the same choices of the example detailed in the previous sections. The RC indicator was indeed applied to the water resource. As it might be intuitive, the elongation of the hygiene and housekeeping tasks involving water, affected the overall resource consumption. Moreover, as it appears clear in Figure 2, the consumption becomes more irregular also due to the changes in sleeping pattern.
5.4. Activity Daily Time—ADT
As in the previous indicator case, the ADT indicator was tested on the example settings. Aiming to detect the “watching TV” activity, the recognition of the activity start/finish patterns was tested first. The results were obtained evaluating the ground truth provided by SHARON. As reported in Figure 3 the overall values were 0.95 Precision (Pre) and 0.92 Recall (Rec).
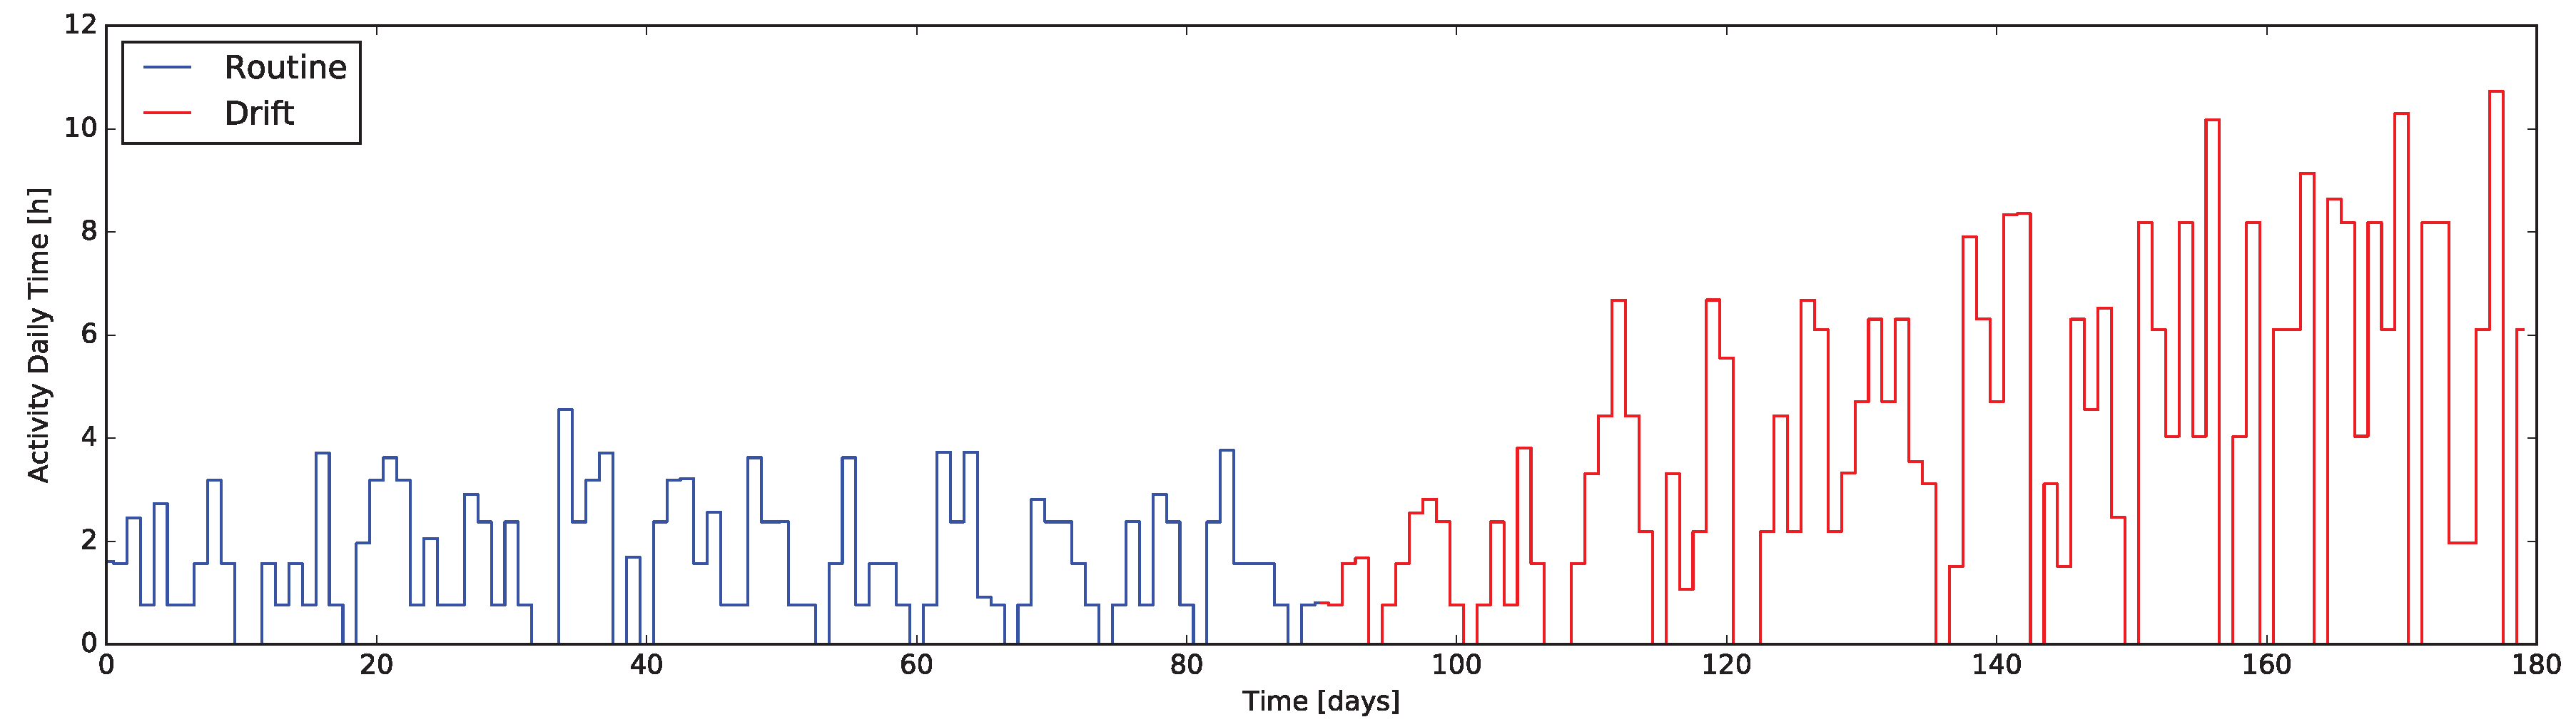
In Figure 4 the daily variations of the normal routine emerge clearly, as well as the linear increase due to the variation induced by the BD. This happens in accordance to the dataset variations, where watching TV duration is augmented.
5.5. Entropy Based—EB
The induced irregularity of the sleeping pattern is collected by the EB indicator of the bed sensor as represented in Figure 5. It is interesting to notice that the more the pattern becomes irregular, the more the EB indicator value decreases. Such detail is noticeable also in correlation with the data coming from the SAT indicator, from which the drift is still evident, even if it is evident only after 40 days of the drift dataset.
The overall house EB indicator, as it appears from Figure 6, reports only a small change in their trend, with a single wide negative spike. This reflects a singular behavior of the inhabitant who remains in bed for 18 out of 24 h. This reflects how such an indicator is suitable to evidence abrupt and broad changes in the routine or unexpected happenings, affecting the whole house.
6. Automatic Detection of Anomalies
The results of the experiments on realistic data proved that an induced change in habits and needs balance of the simulated person can be recognized in the quantitative indicators values. However it would be more efficient to design an automatic method, based on few parameters, for the detection of significant changes in their values.
Given the system application, it is reasonable to discard a supervised machine learning approach, in place of a strategy that extracts the information on a moving (and growing) data window. Indeed the necessity to detect behavior changes, in other words to identify undesired abrupt changes (i.e., anomalies) in indicators value, on one hand should adapt to normal modifications of the person’s routine, on the other should provide results as soon as possible. The machine learning technique requires a training phase, during which it is not possible to obtain any result. To avoid this issue and address the requirements, we propose a method for anomalies detection based on two coupled statistic tests.
We named the method Q-test, based on the two criteria it is composed of. Since the aim is to detect and qualify the unexpected events, we designed a three-fold classification: warning, alarm, and not labeled. Given that it is expected to be in normal conditions, we will consider all unlabeled data as normal, while flag warning and alarm will denote a mild and high degree of attention required respectively.
In both cases the labels are extracted based on a moving time window composed of the last 28 days (where available – reserving not to produce results with less than 7 days) , to provide a set compatible with the weekly cyclical nature of the person routine. Concerning the warning labeling, the method relies on a test based on the standard deviation and mean (i.e., and ) of the indicator, estimated over the data window . Let be the value of the indicator at day t, and thus (In case less than 28 but more than 7 days are available, the window is composed accordingly):
where is a coefficient determining how much the data is expected to change without rising a warning. If fails, than the considered datum has to be marked as warning. For the above-mentioned aim, the value was empirically determined, but might be differently tuned in order to set the method strictness.
The counterpart which is determining the alarm label relies on Dixon’s Q-test [41]. In particular, since this test aim is to determine if a sample is an outlier in a set of measurements, we leverage it to flag data with the higher attention label. In detail, according to Rorabacher’s work [42], we applied a two-tailed Q-test, with confidence level of 95%. Since the Q-test flags as outliers just the minimum or the maximum element of the set, in our settings we assume that the window is consolidated, and we examine just the last added element (i.e., ). This assumption results in changing marginally the original Q-test statement. Let be the maximum and the minimum of respectively:
where values can be found in Rorabacher’s work [42]. If test fails then the corresponding datum is marked as alarm. This implies also that alarm samples are dropped from the distribution of the values—being outliers. Such exclusion means that slow trends could be “silent” (not revealing any anomaly) whenever the new sample stands in the distribution described by the moving window samples, and inside the interval. This is intended by design.
The test described in this section it is designed with the same vision of the quantitative indicators, thus it is able to operate on-line as data are fed directly to it.
7. Anomalies Detection Results
To verify the characteristics the -test when applied to the daily data coming form the indicators presented in this work, we exploited the same dataset used to evaluate the indicators themselves. In particular, the dataset containing routine and drift was considered as an unique dataset of 180 days, exposing a behavior change at day 90. This composite dataset was then fed into the system computing the quantitative indicators day-by-day and executing the -test along them.
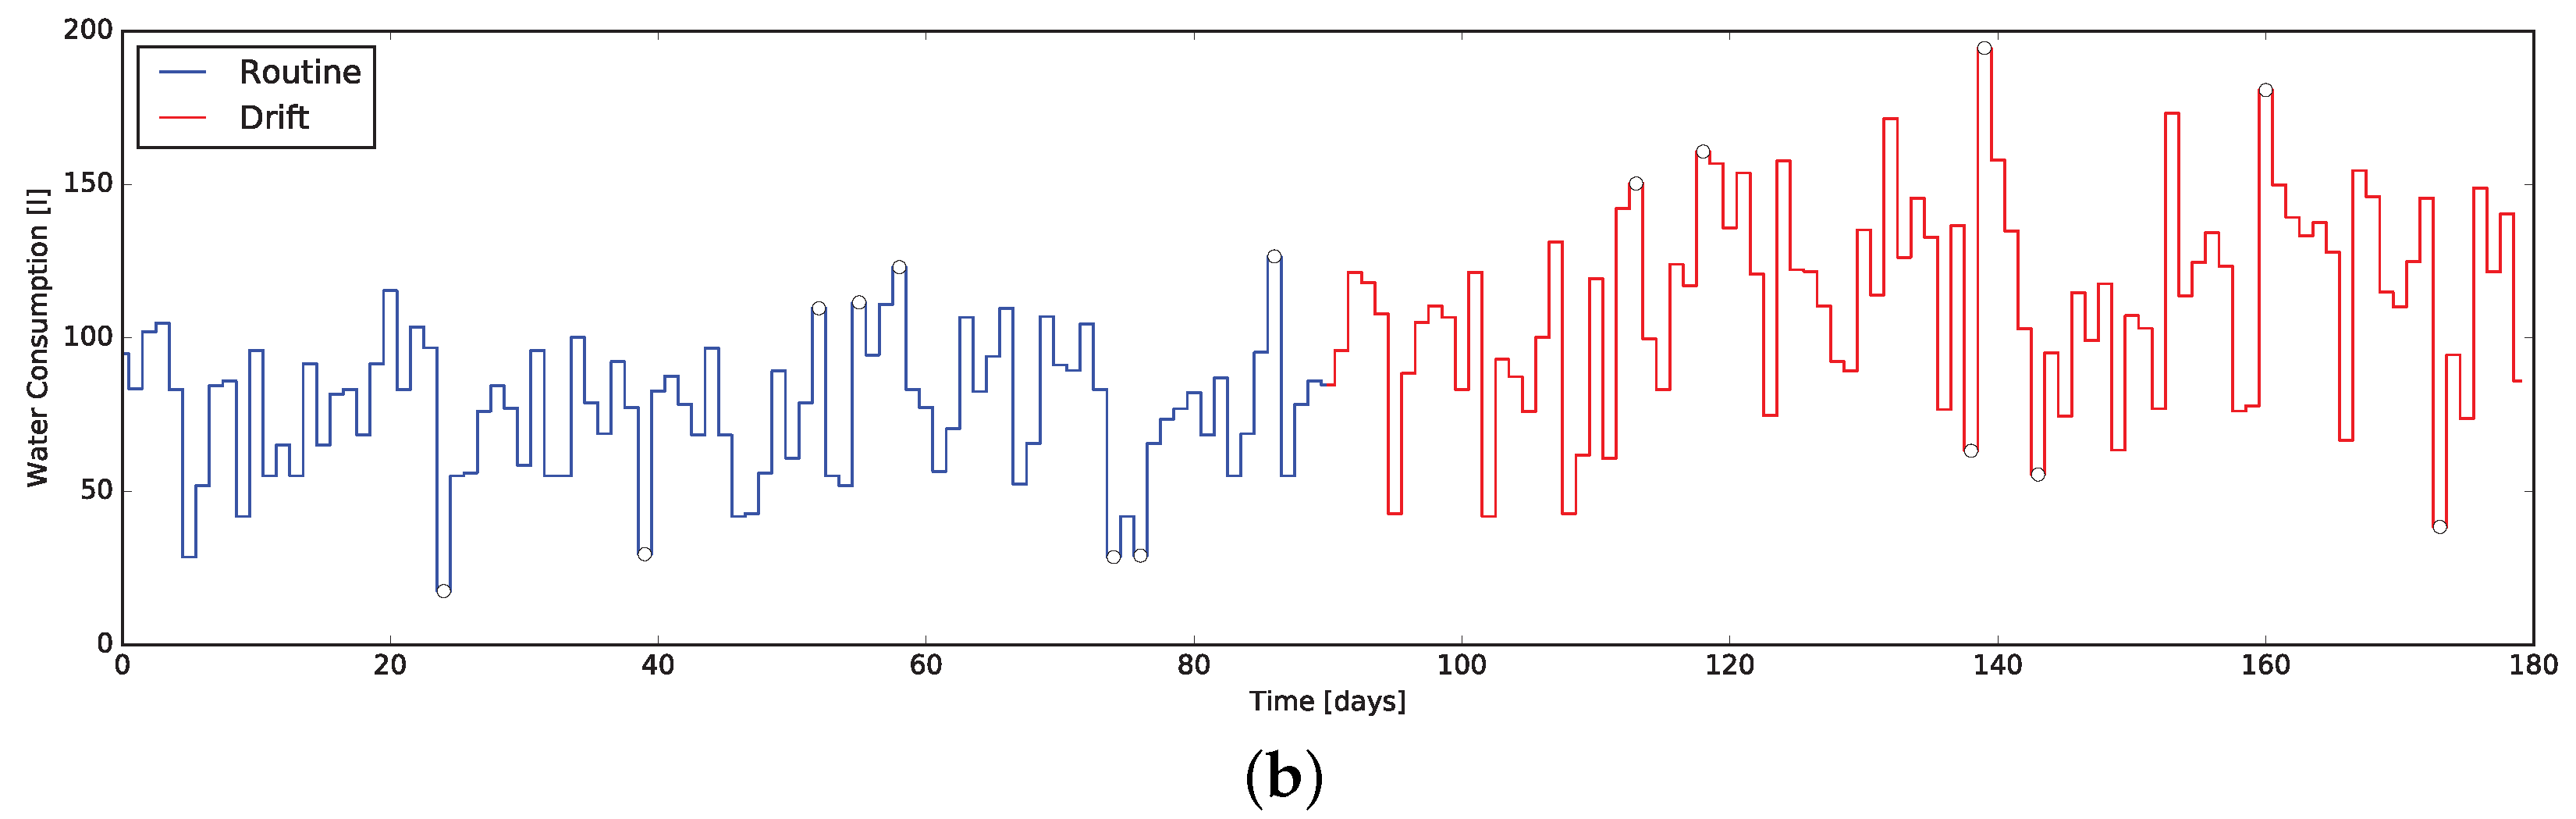
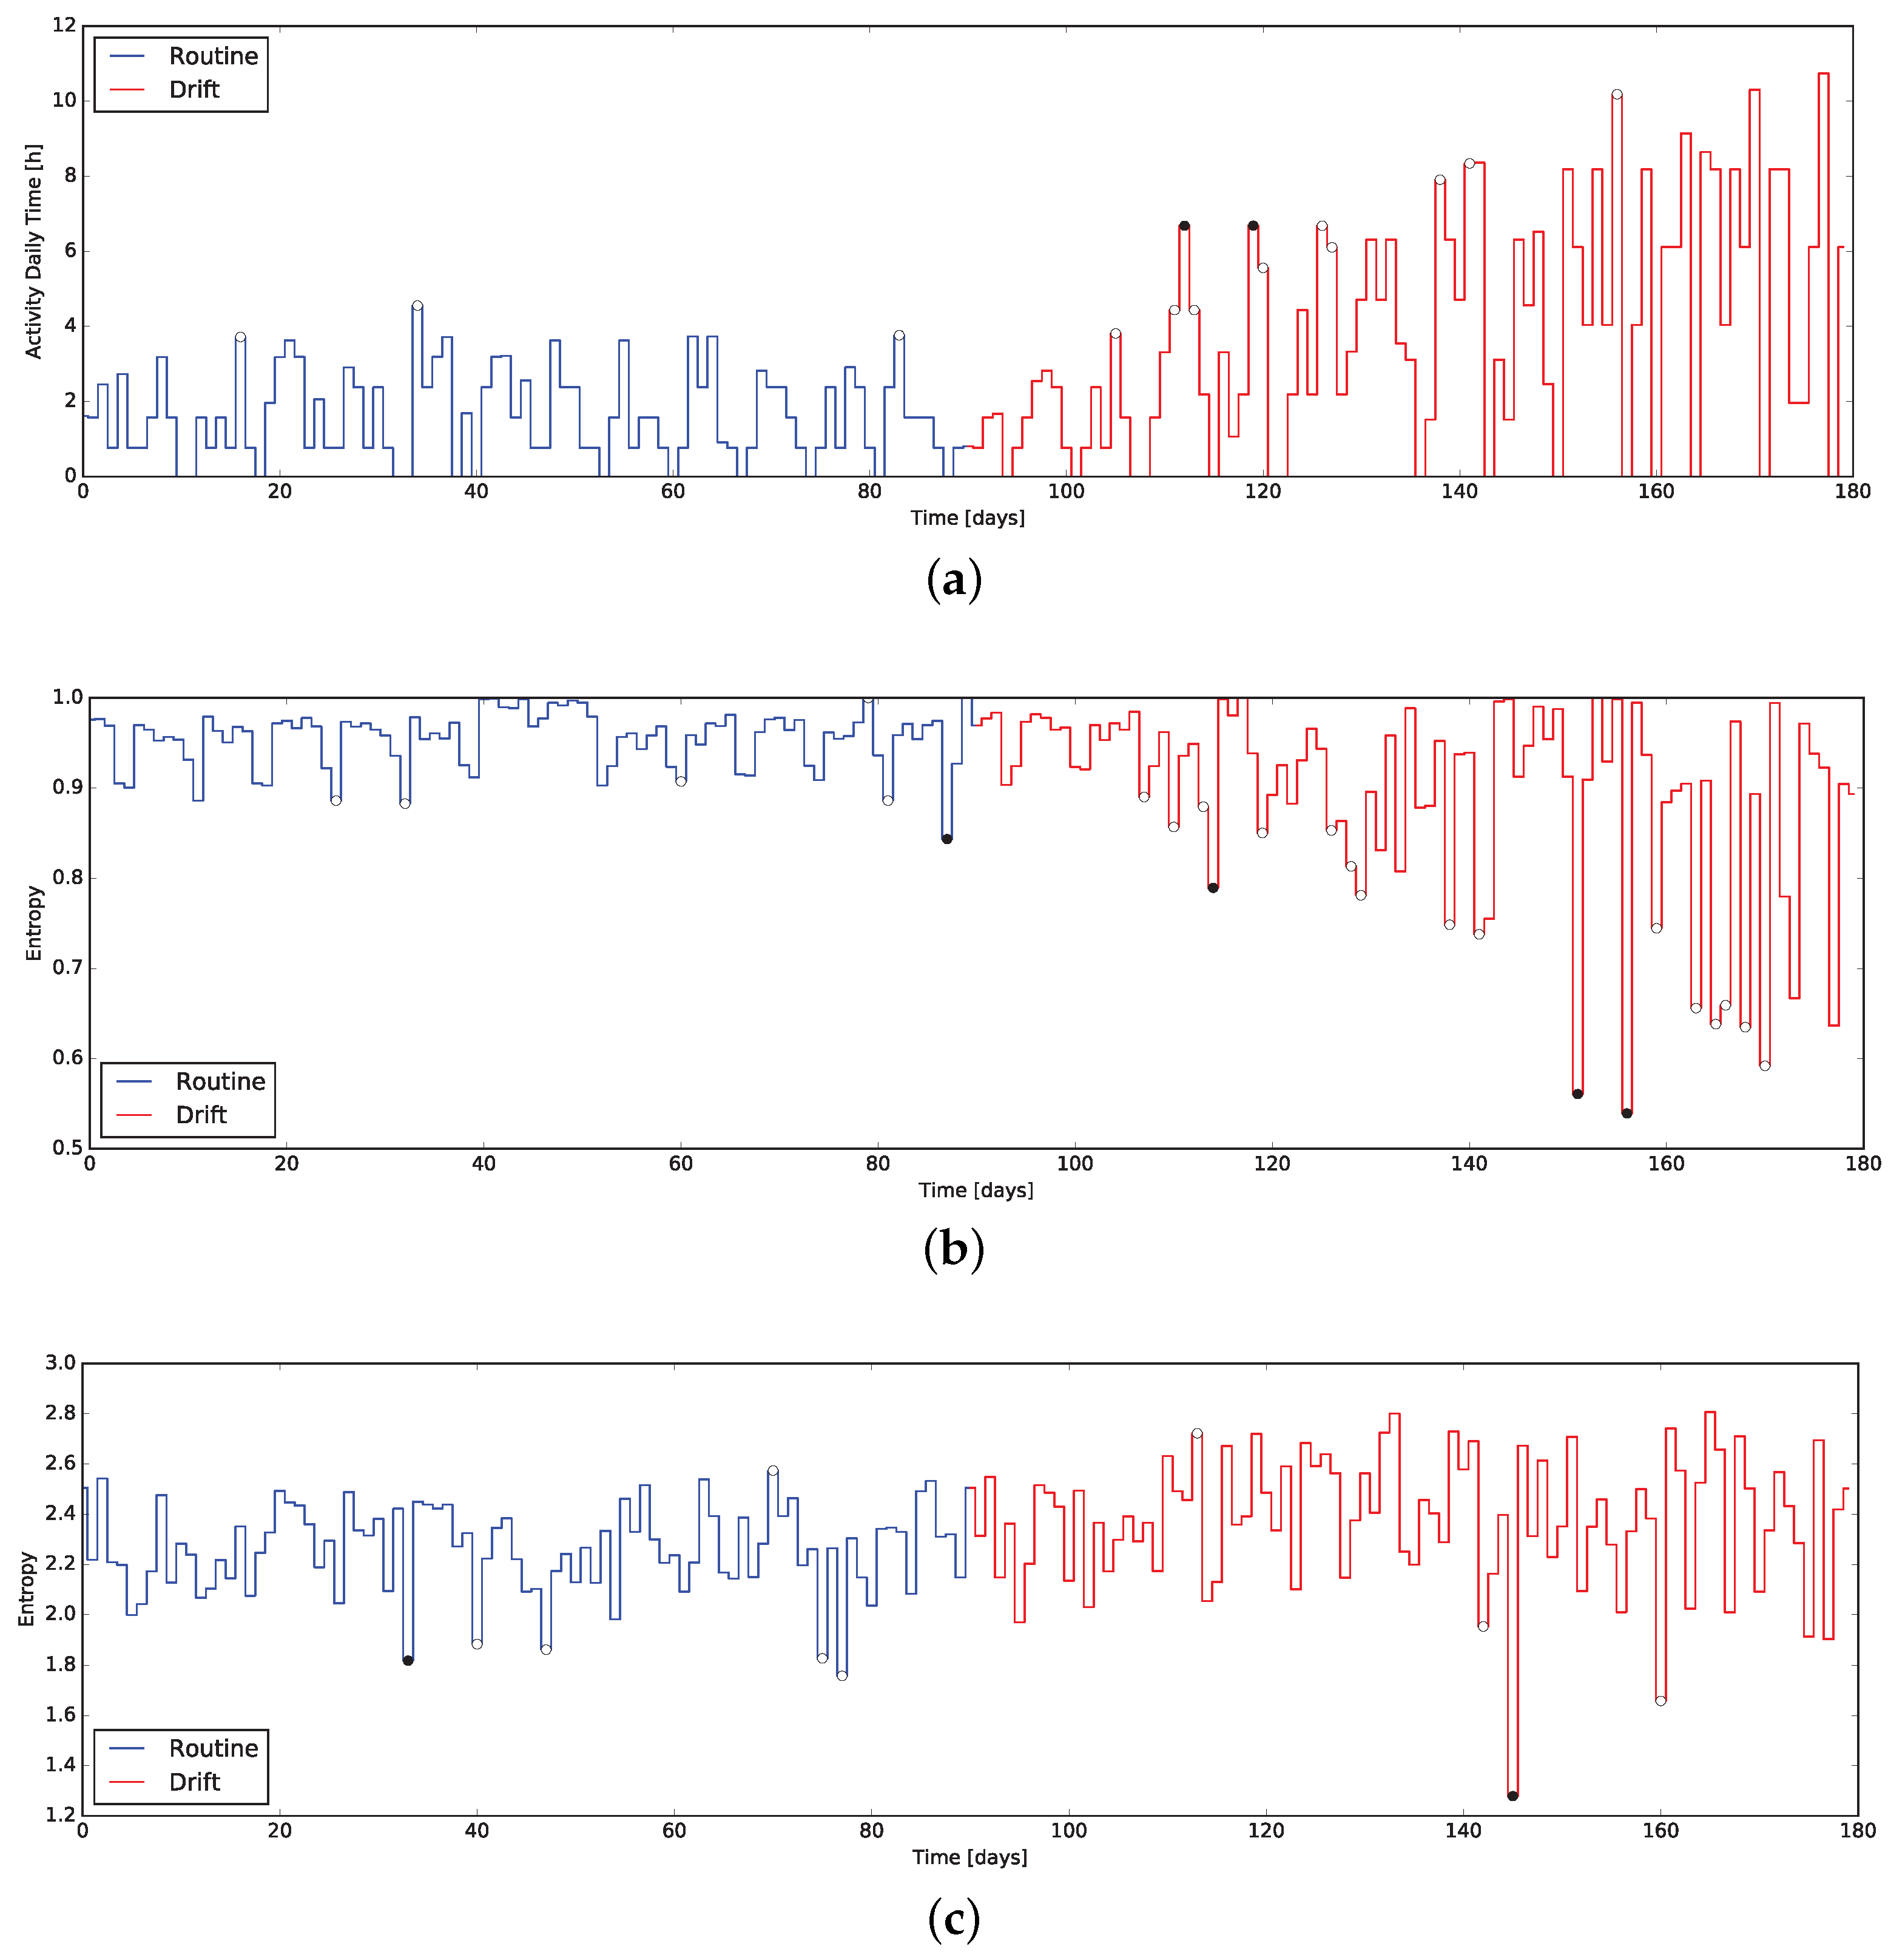
The results are presented in Figure 7 and Figure 8, where markers flag the unexpected events as warning or alarm. It emerges that the Q-test behave as desired, providing alerts where changes are unexpected considering the window of the value preceding them. Moreover, erratic values resulting from the routine data are correctly evidenced, proving the validity of the approach: we consider it acceptable to raise “false positive” alerts demanding the interpretation of their meaning by professionals (e.g., psychologists, carers).
Concerning “smooth” changes in indicators, we believe their significance is more subtle. Indeed, human behavior is prone to small continuous changes as time passes, due to changes in environmental conditions, in social environment, due to aging itself, to experience, and many other factors acting on human personality. Their identification and interpretation might be a further challenge addressed by future works.
8. Conclusions
Four methods to design quantitative indicators based on Home Automation data streams were reported. The analysis of the variation of those indicators—implemented using the Esper CEP engine—turns out to be relevant to identify behavioral drifts. In order to get around the lack of real datasets containing a behavioral drift, the validation has been performed using simulated data: the induced drift—compatible to many symptoms of Alzheimer’s Disease—was evident in all the indicators, with some limitations only in the whole house EB descriptor.
An algorithm for automatic detection of unexpected events (-test) was proposed. Its purpose is to flag indicator daily changes as warnings or alarms, based on two different statistical criteria computed on a moving time-window. The experimental results prove the possibility to leverage this method for BDD. Moreover, thanks to the choice of implementing the system leveraging Esper, the BDD will be soon provided with a notification module to provide customized warnings and alarms to the caregivers.
A main limitation of the reported system is that it has been validated using a simulated dataset: in the near future, the indicators system will be integrated in the BRIDGe [20] system. Therefore, it will be possible to use real world data from an instrumented Smart Home to feed the system and validate the BDD method. Moreover, datasets will be published for open usage and validation in a forthcoming work, we invite readers to contact the authors for further details.
Author Contributions
Fabio Veronese, Fabio Salice and Sara Comai conceived and designed the experiments; Fabio Veronese and Andrea Masciadri performed the experiments and analyzed the data; Andrea Masciadri, Fabio Veronese and Matteo Matteucci wrote the paper. All authors have read and approved the final manuscript.
Conflicts of Interest
The authors declare no conflict of interest.
References
- AAL Programme—Catalogue of Projects. Available online: http://www.aal-europe.eu/wp-content/uploads/2015/09/15-1805_AAL_Catalogue_2015_ONLINE.pdf (accessed on 9 January 2018).
- Wilson, C.; Hargreaves, T.; Hauxwell-Baldwin, R. Smart homes and their users: A systematic analysis and key challenges. Pers. Ubiquitous Comput. 2015, 19, 463–476. [Google Scholar] [CrossRef] [Green Version]
- Della Valle, E.; Ceri, S.; Barbieri, D.F.; Braga, D.; Campi, A. A first step towards stream reasoning. Future Internet Sympos. 2008, 5468, 72–81. [Google Scholar]
- Masciadri, A.; Trofimova, A.A.; Matteucci, M.; Salice, F. Human Behavior Drift Detection in a Smart Home Environment. Stud. Health Technol. Inform. 2017, 242, 199–203. [Google Scholar] [PubMed]
- Esper Software for Complex Event Processing (CEP). Available online: http://www.espertech.com/esper/ (accessed on 9 January 2018).
- Veronese, F.; Masciadri, A.; Comai, S.; Matteucci, M.; Salice, F. Quantitative Indicators for Behaviour Drift Detection from Home Automation Data. Stud. Health Technol. Inform. 2017, 242, 208–215. [Google Scholar] [PubMed]
- Cavallo, F.; Marletta, V.; Monteriù, A.; Siciliano, P. Ambient Assisted Living: Italian Forum 2016; Springer: New York, NY, USA, 2017; Volume 426. [Google Scholar]
- Foti, D.; Koketsu, J.S. Activities of daily living. Pedretti’s Occup. Ther. Pract. Skills Phys. Dysfunct. 2013, 7, 157–232. [Google Scholar]
- Debes, C.; Merentitis, A.; Sukhanov, S.; Niessen, M.; Frangiadakis, N.; Bauer, A. Monitoring Activities of Daily Living in Smart Homes: Understanding human behavior. IEEE Signal Process. Mag. 2016, 33, 81–94. [Google Scholar] [CrossRef]
- Saidinejad, H.; Radaelli, J.; Veronese, F.; Salice, F. Mixed Technical and Market Evaluation of Home Automation Networks for AAL Solutions. Assist. Technol. Res. Pract. Assist. Technol. Res. Ser. 2013, 33, 865–870. [Google Scholar]
- Atallah, L.; Yang, G.Z. The use of pervasive sensing for behaviour profiling—A survey. Pervasive Mob. Comput. 2009, 5, 447–464. [Google Scholar] [CrossRef]
- Peetoom, K.K.; Lexis, M.A.; Joore, M.; Dirksen, C.D.; De Witte, L.P. Literature review on monitoring technologies and their outcomes in independently living elderly people. Disabil. Rehabil. Assist. Technol. 2015, 10, 271–294. [Google Scholar] [CrossRef] [PubMed]
- Veronese, F.; Comai, S.; Saidinejad, H.; Salice, F. Elderly Monitoring and AAL for Independent Living at Home: Human Needs, Technological Issues, and Dependability. Optim. Assist. Technol. Aging Popul. 2015, 154–181. [Google Scholar] [CrossRef]
- Cook, D.J. Learning setting-generalized activity models for smart spaces. IEEE Intell. Syst. 2010. [Google Scholar] [CrossRef] [PubMed]
- Alemdar, H.; Ertan, H.; Incel, O.D.; Ersoy, C. ARAS human activity datasets in multiple homes with multiple residents. In Proceedings of the 2013 7th International Conference on Pervasive Computing Technologies for Healthcare and Workshops, Venice, Italy, 5–8 May 2013; pp. 232–235. [Google Scholar]
- Zouba, N.; Bremond, F.; Thonnat, M.; Anfosso, A.; Pascual, É.; Mallea, P.; Mailland, V.; Guerin, O. Assessing computer systems for monitoring elderly people living at home. In Proceedings of the 19th IAGG World Congress of Gerontology and Geriatrics, Paris, France, 5–9 July 2009. [Google Scholar]
- Tapia, E.M.; Intille, S.S.; Larson, K. Activity recognition in the home using simple and ubiquitous sensors. In Proceedings of the International Conference on Pervasive Computing, Newcastle, UK, 18–22 June 2004; pp. 158–175. [Google Scholar]
- Van Kasteren, T.; Englebienne, G.; Kröse, B.J. Activity recognition using semi-markov models on real world smart home datasets. J. Ambient Intell. Smart Environ. 2010, 2, 311–325. [Google Scholar]
- Assistive Technology Group (ATG) of Politecnico di Milano. Available online: http://www.atg.deib.polimi.it (accessed on 9 January 2018).
- Mangano, S.; Saidinejad, H.; Veronese, F.; Comai, S.; Matteucci, M.; Salice, F. Bridge: Mutual reassurance for autonomous and independent living. IEEE Intell. Syst. 2015, 30, 31–38. [Google Scholar] [CrossRef]
- Suryadevara, N.K.; Mukhopadhyay, S.C. Wireless sensor network based home monitoring system for wellness determination of elderly. IEEE Sens. J. 2012, 12, 1965–1972. [Google Scholar] [CrossRef]
- Suryadevara, N.K.; Mukhopadhyay, S.C.; Wang, R.; Rayudu, R. Forecasting the behavior of an elderly using wireless sensors data in a smart home. Eng. Appl. Artif. Intell. 2013, 26, 2641–2652. [Google Scholar] [CrossRef]
- Yang, C.C.; Hsu, Y.L. Remote monitoring and assessment of daily activities in the home environment. J. Clin. Gerontol. Geriatr. 2012, 3, 97–104. [Google Scholar] [CrossRef]
- Jain, G.; Cook, D.J.; Jakkula, V. Monitoring health by detecting drifts and outliers for a smart environment inhabitant. In Proceedings of the 4th International Conference on Smart Homes and Health Telematics, Wuhan, China, 25–27 May 2006; Volume 19, p. 114. [Google Scholar]
- Candás, J.L.C.; Peláez, V.; López, G.; Fernández, M.Á.; Álvarez, E.; Díaz, G. An automatic data mining method to detect abnormal human behaviour using physical activity measurements. Pervasive Mob. Comput. 2014, 15, 228–241. [Google Scholar] [CrossRef]
- Eagle, N. Using Mobile Phones to Model Complex Social Systems, 2005. Available online: http://www.oreillynet.com/pub/a/network/2005/06/20/MITmedialab.html (accessed on 9 January 2018).
- Mühl, G.; Fiege, L.; Pietzuch, P. Distributed Event-Based Systems; Springer Science & Business Media: New York, NY, USA, 2006. [Google Scholar]
- Luckham, D.C. Rapide: A language and toolset for simulation of distributed systems by partial orderings of events. In Proceedings of the DIMACS Workshop on Partial Order Methods in Verification, Princeton, NJ, USA, 24–26 July 1996; pp. 329–357. [Google Scholar]
- Li, G.; Jacobsen, H.A. Composite subscriptions in content-based publish/subscribe systems. In Proceedings of the ACM/IFIP/USENIX International Conference on Distributed Systems Platforms and Open Distributed Processing, Sydney, Australia, 27–29 July 2005; pp. 249–269. [Google Scholar]
- Pietzuch, P.R.; Shand, B.; Bacon, J. A framework for event composition in distributed systems. In Proceedings of the ACM/IFIP/USENIX 2003 International Conference on Middleware, Rio de Janeiro, Brazil, 16–20 June 2003; pp. 62–82. [Google Scholar]
- Wu, E.; Diao, Y.; Rizvi, S. High-performance complex event processing over streams. In Proceedings of the 2006 ACM SIGMOD International Conference on Management of Data, Chicago, IL, USA, 27–29 June 2006; pp. 407–418. [Google Scholar]
- Brenna, L.; Demers, A.; Gehrke, J.; Hong, M.; Ossher, J.; Panda, B.; Riedewald, M.; Thatte, M.; White, W. Cayuga: A high-performance event processing engine. In Proceedings of the 2007 ACM SIGMOD International Conference on Management of Data, Beijing, China, 11–14 June 2007; pp. 1100–1102. [Google Scholar]
- Schultz-Møller, N.P.; Migliavacca, M.; Pietzuch, P. Distributed complex event processing with query rewriting. In Proceedings of the Third ACM International Conference on Distributed Event-Based Systems, Nashville, TN, USA, 6–9 July 2009; p. 4. [Google Scholar]
- Alevizos, E.; Artikis, A. Being logical or going with the flow? A comparison of complex event processing systems. In Proceedings of the Hellenic Conference on Artificial Intelligence, Ioannina, Greece, 15–17 May 2014; pp. 460–474. [Google Scholar]
- RuleCore Project Website. Available online: http://www.sourceforge.net/projects/rulecore (accessed on 9 January 2018).
- Cugola, G.; Margara, A. Complex event processing with T-REX. J. Syst. Softw. 2012, 85, 1709–1728. [Google Scholar] [CrossRef]
- Cugola, G.; Margara, A. TESLA: A formally defined event specification language. In Proceedings of the Fourth ACM International Conference on Distributed Event-Based Systems, Cambridge, UK, 12–15 July 2010; pp. 50–61. [Google Scholar]
- McKhann, G.M.; Knopman, D.S.; Chertkow, H.; Hyman, B.T.; Jack, C.R.; Kawas, C.H.; Klunk, W.E.; Koroshetz, W.J.; Manly, J.J.; Mayeux, R.; et al. The diagnosis of dementia due to Alzheimer’s disease: Recommendations from the National Institute on Aging-Alzheimer’s Association workgroups on diagnostic guidelines for Alzheimer’s disease. Alzheimer’s Dement. 2011, 7, 263–269. [Google Scholar] [CrossRef] [PubMed]
- Shannon, C.E. A mathematical theory of communication. ACM Sigmob. Mob. Comput. Commun. Rev. 2001, 5, 3–55. [Google Scholar] [CrossRef]
- Veronese, F.; Proserpio, D.; Comai, S.; Matteucci, M.; Salice, F. SHARON: A Simulator of Human Activities, ROutines and Needs. Stud. Health Technol. Inform. 2014, 217, 560–566. [Google Scholar]
- Dean, R.B.; Dixon, W. Simplified statistics for small numbers of observations. Anal. Chem. 1951, 23, 636–638. [Google Scholar] [CrossRef]
- Rorabacher, D.B. Statistical treatment for rejection of deviant values: Critical values of Dixon’s “Q” parameter and related subrange ratios at the 95% confidence level. Anal. Chem. 1991, 63, 139–146. [Google Scholar] [CrossRef]
Figure 1.
Sensor Activation Time (SAT) indicator: bed activation time. The irregularity introduced in the behavior drift appears as spikes in the indicator value.
Figure 1.
Sensor Activation Time (SAT) indicator: bed activation time. The irregularity introduced in the behavior drift appears as spikes in the indicator value.

Figure 2.
Resource Consuming (RC) indicator: water consumption computed over the whole house. Affecting the duration of complex actions like showering, toileting, etc., the resource consumption inevitably changes.
Figure 2.
Resource Consuming (RC) indicator: water consumption computed over the whole house. Affecting the duration of complex actions like showering, toileting, etc., the resource consumption inevitably changes.

Figure 3.
Results of Watching TV detection in both datasets, Precision and Recall represented in a box plot. Red line depicts the expected value, the blue box contains data from the 25th to 75th percentiles, the whiskers mark the most extreme datapoints, and the outliers are marked individually.
Figure 3.
Results of Watching TV detection in both datasets, Precision and Recall represented in a box plot. Red line depicts the expected value, the blue box contains data from the 25th to 75th percentiles, the whiskers mark the most extreme datapoints, and the outliers are marked individually.
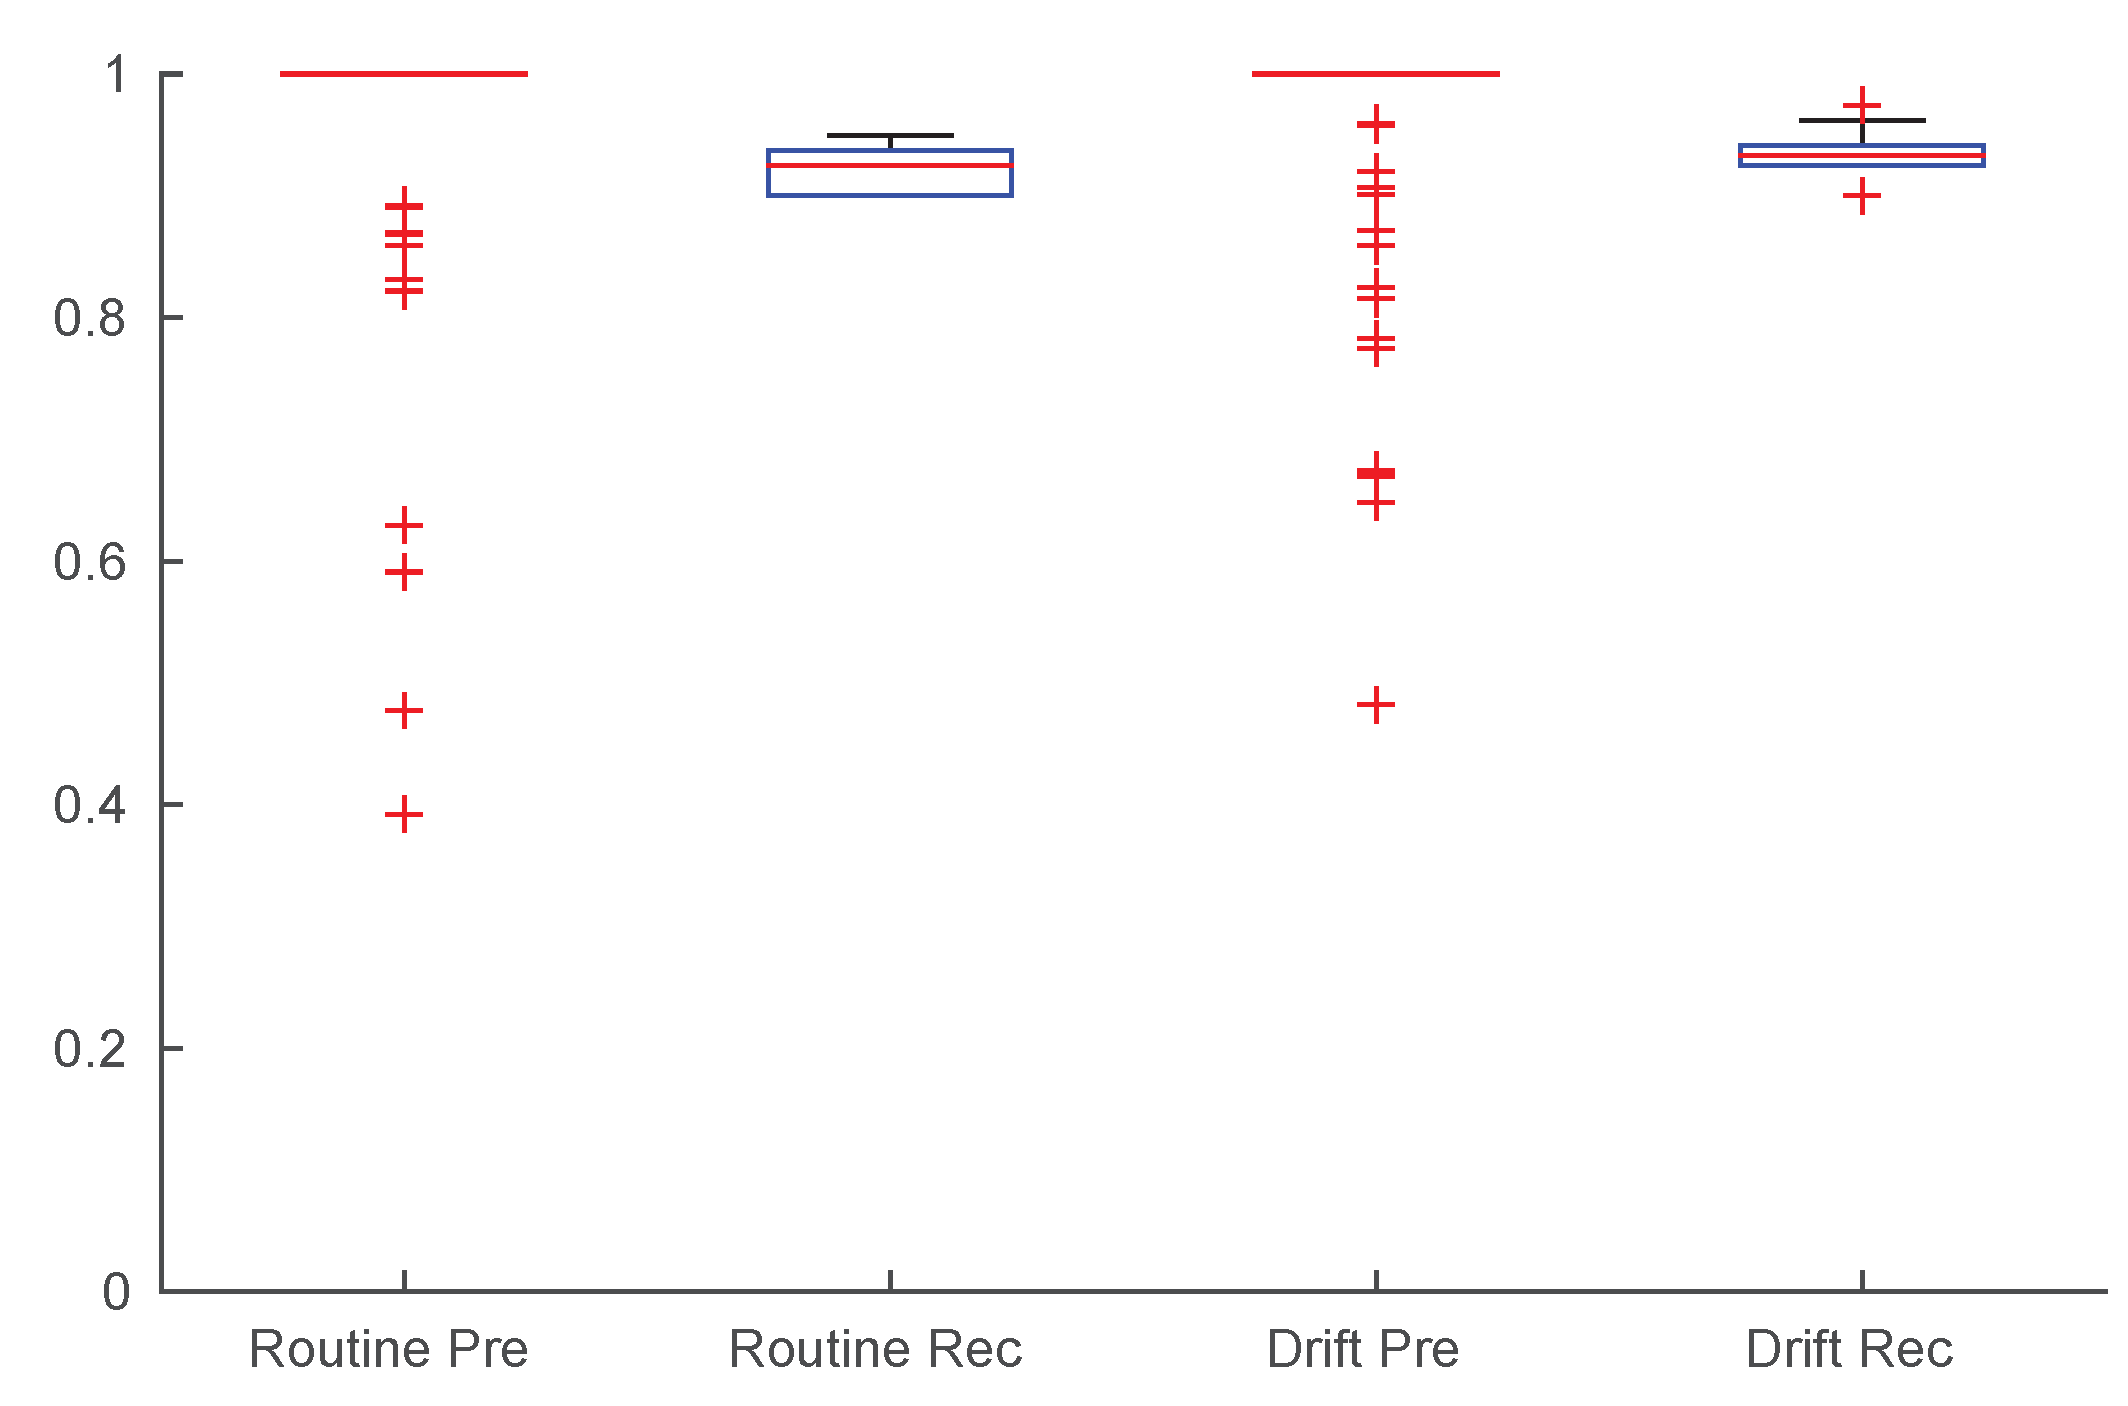
Figure 4.
The “watching TV” Activity Daily Time (ADT) indicator: It is evident how the indicator tracks the behavioral change ad its value rises over 5 h in the drift-affected portion.
Figure 4.
The “watching TV” Activity Daily Time (ADT) indicator: It is evident how the indicator tracks the behavioral change ad its value rises over 5 h in the drift-affected portion.

Figure 5.
Bed Entropy Based (EB) indicator: the entropy represent different information with respect to the behavior of the indicator. In the picture it is already possible to identify consistent changes in the sleep pattern between days 30 and 40.
Figure 5.
Bed Entropy Based (EB) indicator: the entropy represent different information with respect to the behavior of the indicator. In the picture it is already possible to identify consistent changes in the sleep pattern between days 30 and 40.
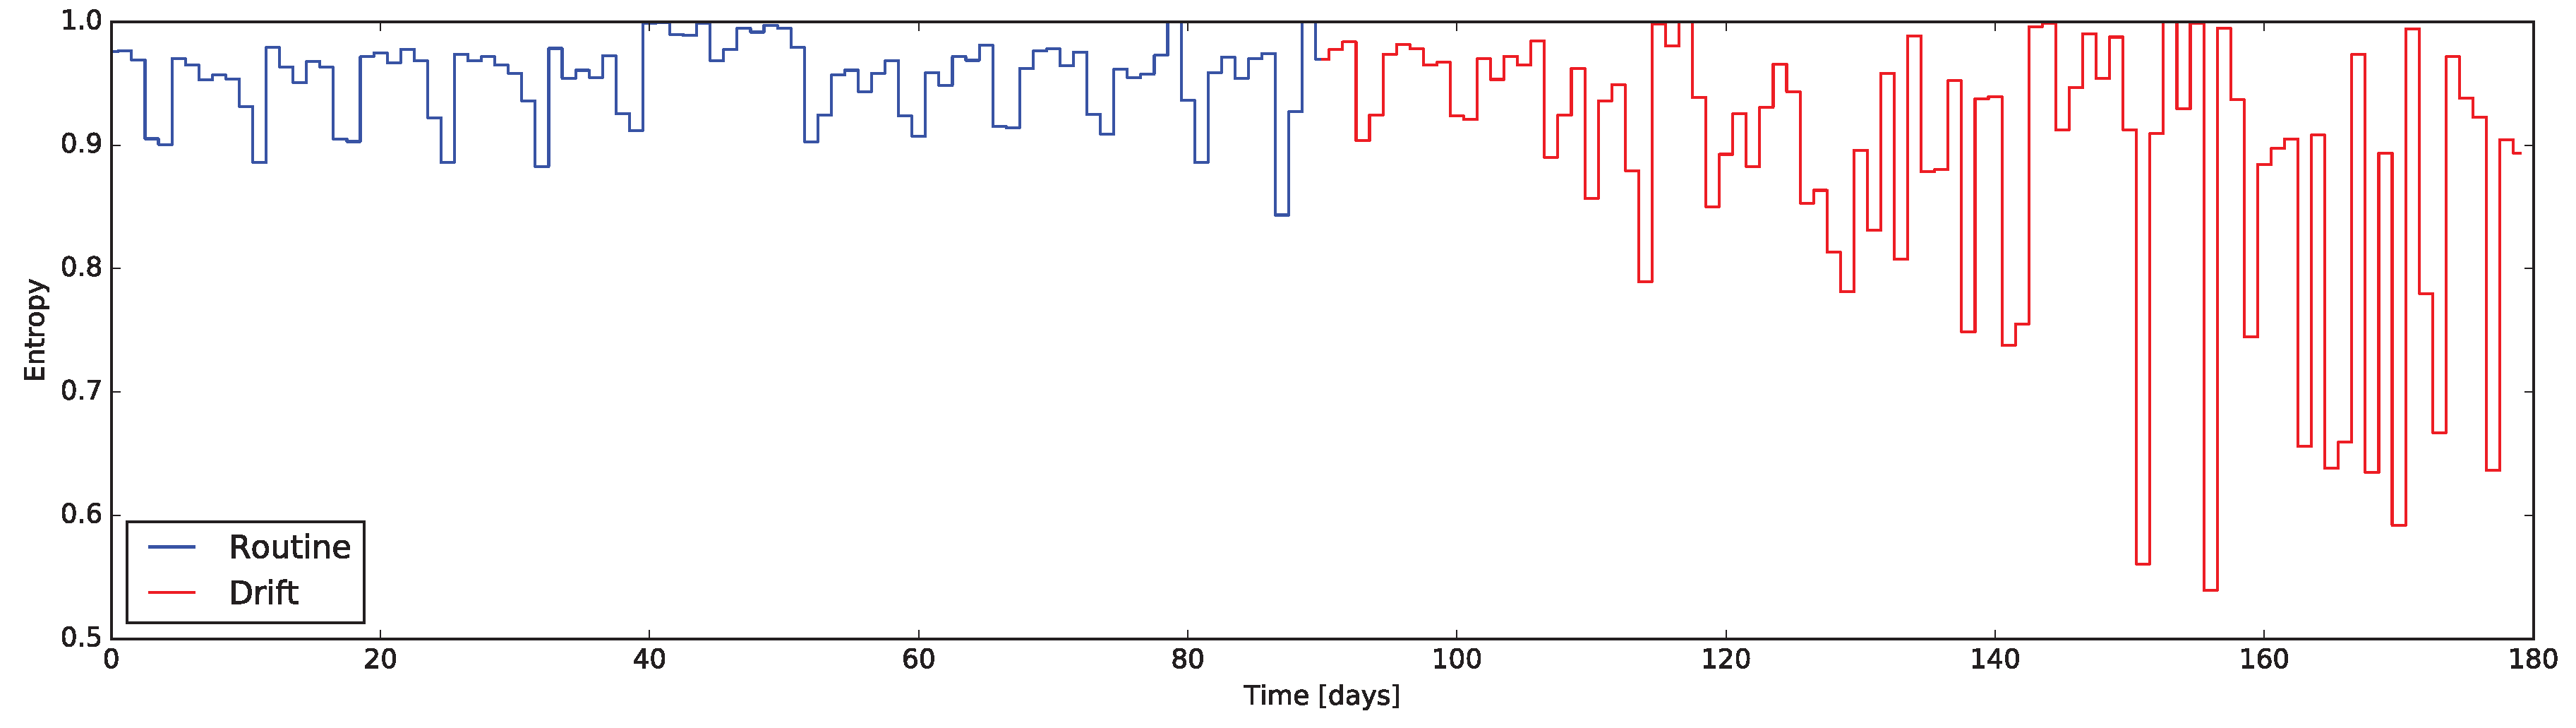
Figure 6.
Whole house Entropy Based (EB) indicator: even if the drift barely noticeable, a set of sudden spikes in entropy are present after day 50. It is reasonable that the impact on the overall house EB indicator is limited since the person is still living his/her life without extreme changes.
Figure 6.
Whole house Entropy Based (EB) indicator: even if the drift barely noticeable, a set of sudden spikes in entropy are present after day 50. It is reasonable that the impact on the overall house EB indicator is limited since the person is still living his/her life without extreme changes.
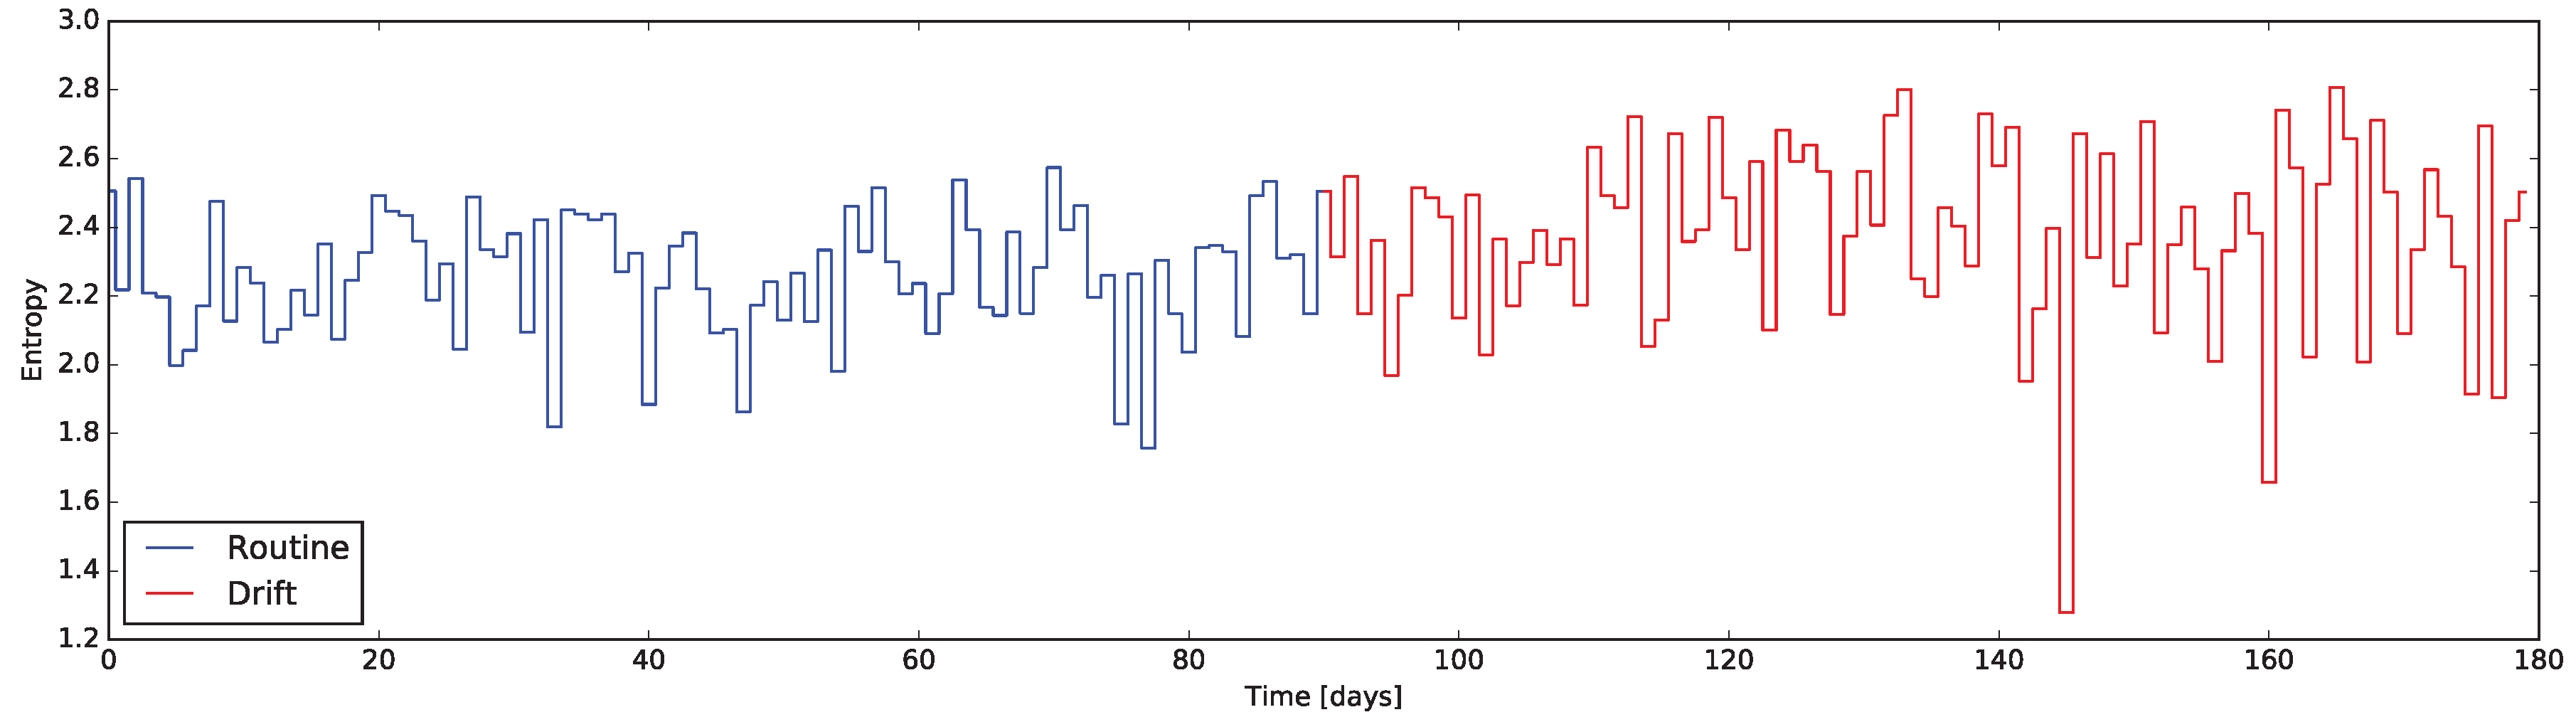
Figure 7.
Results of the σQ-test on (a) SAT for the bed sensor; and (b) RC for the water. The unexpected events are flagged with circles: white markers represent warnings, while black alarms. It is evident how abrupt changes are flagged correctly with markers, which tend to be more frequent after the induced change in routine, while the behavioral drift happens.
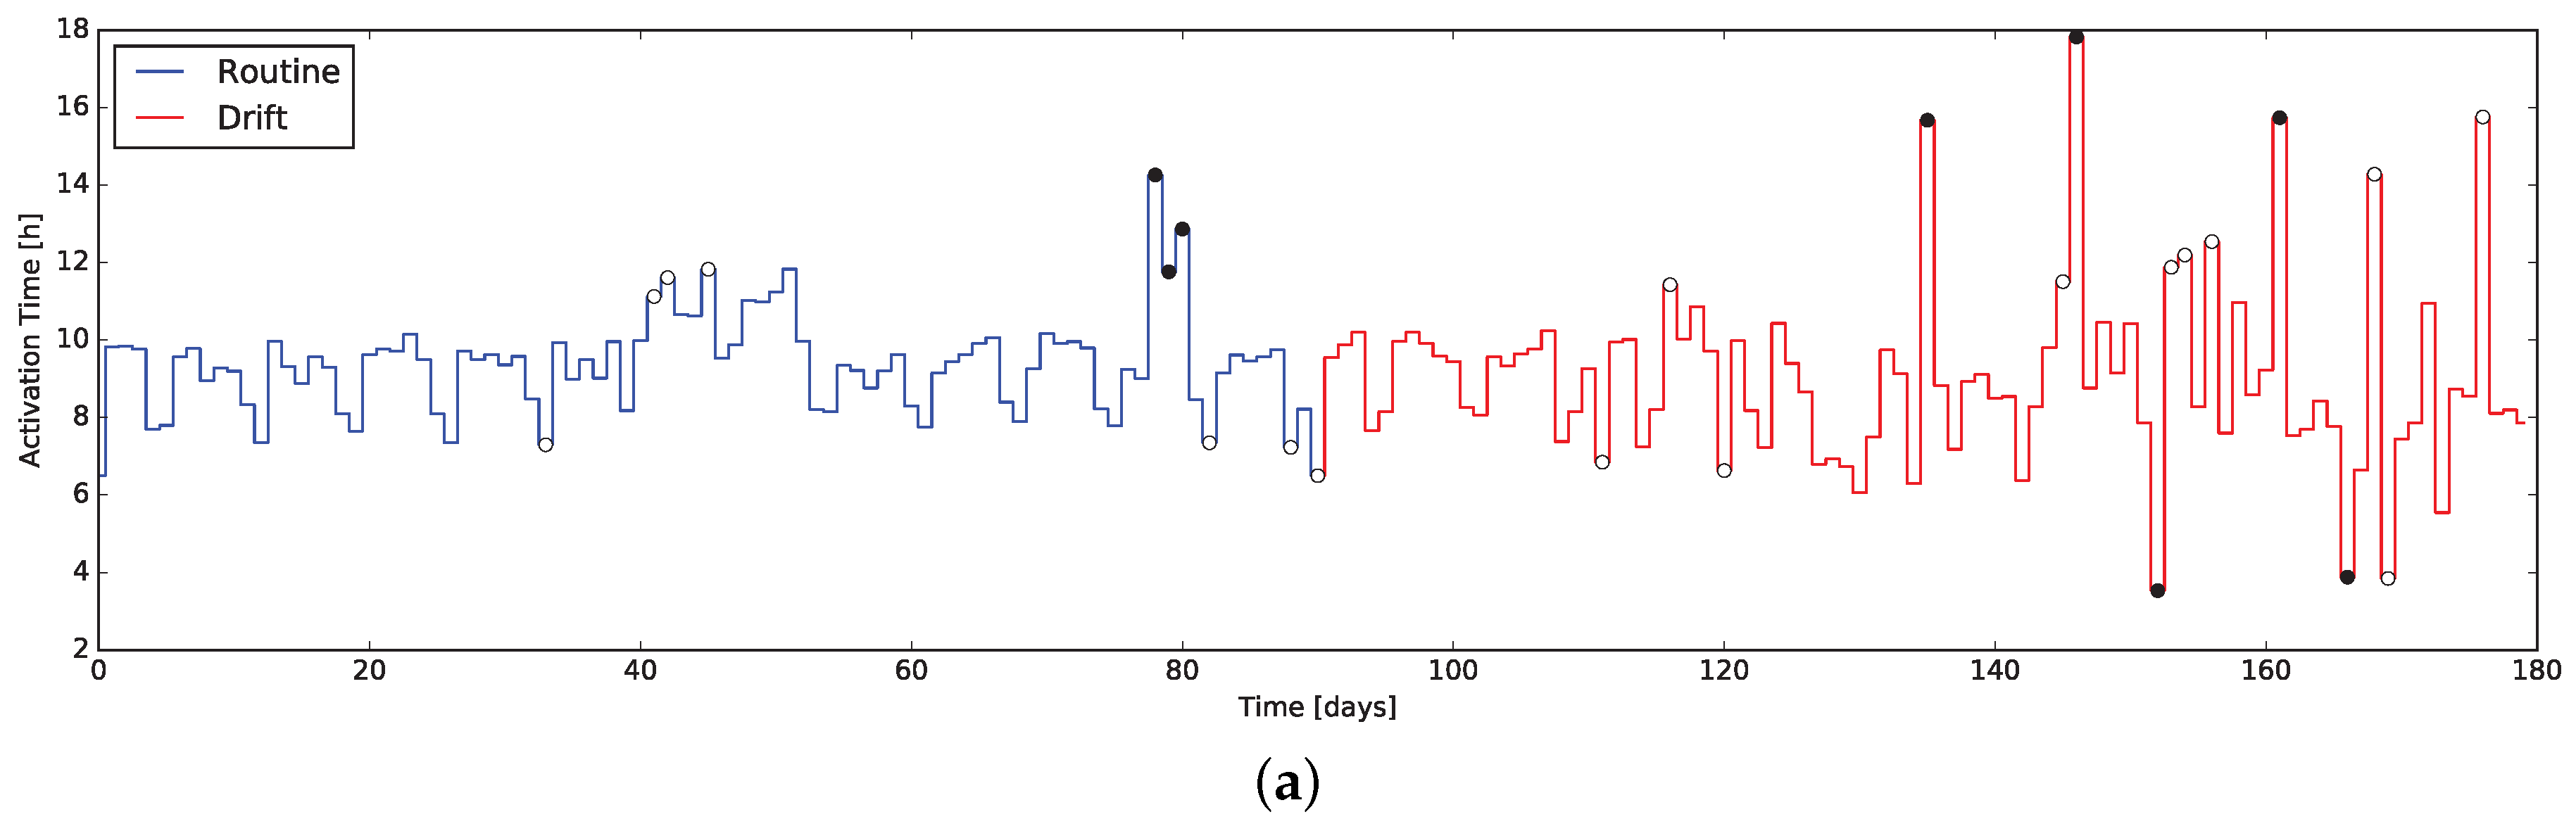

Figure 8.
Results of the -test on (a) Activity Daily Time (ADT) for “watching TV”; (b) Entropy Based (EB) for the bed sensor; and (c) EB for the whole house. The unexpected events are flagged with circles: white markers represent warnings, while black alarms. It is evident how abrupt changes are flagged correctly with markers, which tend to be more frequent after the induced change in routine, while the behavioral drift happens.

© 2018 by the authors. Licensee MDPI, Basel, Switzerland. This article is an open access article distributed under the terms and conditions of the Creative Commons Attribution (CC BY) license (http://creativecommons.org/licenses/by/4.0/).
Share and Cite
MDPI and ACS Style
Veronese, F.; Masciadri, A.; Comai, S.; Matteucci, M.; Salice, F. Behavior Drift Detection Based on Anomalies Identification in Home Living Quantitative Indicators. Technologies 2018, 6, 16. https://doi.org/10.3390/technologies6010016
AMA Style
Veronese F, Masciadri A, Comai S, Matteucci M, Salice F. Behavior Drift Detection Based on Anomalies Identification in Home Living Quantitative Indicators. Technologies. 2018; 6(1):16. https://doi.org/10.3390/technologies6010016
Chicago/Turabian StyleVeronese, Fabio, Andrea Masciadri, Sara Comai, Matteo Matteucci, and Fabio Salice. 2018. "Behavior Drift Detection Based on Anomalies Identification in Home Living Quantitative Indicators" Technologies 6, no. 1: 16. https://doi.org/10.3390/technologies6010016
Note that from the first issue of 2016, this journal uses article numbers instead of page numbers. See further details here.