Concept Paper

Emergency Response Cyber-Physical Framework for Landslide Avoidance with Sustainable Electronics

1
Departamento de Engenharia de Telecomunicações, Universidade Federal Fluminence, Rio de Janeiro 25086-132, Brazil
2
Departamento de Eletrônica Aplicada, Instituto Tecnologico de Aeronautica, São José dos Campos 12228-900, Brazil
3
Department of Electrical and Computer Engineering, The University of Campinas (UNICAMP), Campinas 13083-970, Brazil
4
Department of Electrical and Computer Engineering, Karunya University, Coimbatore 641114, India
5
Department of Computer Science and Engineering (CSE), National Institute of Technology (NIT), Durgapur 713209, India
*
Author to whom correspondence should be addressed.
This paper is an extended version of our paper published in Proceedings of the 10th International Conference on PErvasive Technologies Related to Assistive Environments (PETRA ‘17), Island of Rhodes, Greece, 21–23 June 2017.
Technologies 2018, 6(2), 42; https://doi.org/10.3390/technologies6020042
Submission received: 15 March 2018 / Revised: 10 April 2018 / Accepted: 11 April 2018 / Published: 18 April 2018

Abstract

:
An Emergency Response (ER) Cyber-Physical System (CPS) to avoid landslides and survey areas located on or near slopes is introduced that handles two problems: electronic waste disposal, and environmental disasters. Uncomplicated detection circuits using salvaged components can pinpoint floods in impoverished regions. CPSs simplify hazard prediction and mitigation in disaster supervision. Nonetheless, few green practices and efforts have been accomplished in this regard. Recent technical advances help landslides studies and the evaluation of suitable risk alleviation measures. This work addresses in situ meters, and cameras to observe ground movements more accurately. The ER-CPS identifies and can help mitigate landslides using techniques based on motion detection that can productively predict and monitor the zone conditions to classify it, and the landslide-related data can be transmitted to inspecting stations to lessen the erosion/sedimentation likelihood while increasing security.

1. Introduction

Geological disasters can cause extensive destruction of properties, and impact businesses, resulting in physical injuries and deaths. A landslide is any geologic phenomenon in which gravity causes rock, soil, non-natural fill, or a mixture of the three to descend a slope. Several factors, such as deep infiltration over high-standing terrain, can trigger landslides, as well as the slow weathering of rocks including soil erosion, earthquakes, and volcanic activity. Landslides’ severe impact on communities are usually caused by the loss in equilibrium of the solid mass in a particular area. These changes can be modeled by various parameters like rainfall, solid wetness, debris, vegetation, and so on. However, rainfall and man-made miscalculations are the most common reason for landslides in Brazil [1,2,3].
Advection is the transference of heat or bulk mass by fluid flow (like atmospheric flow, buoyant flow, boundary layer flow, pipe flow, and so on). Establishing the initial and boundary conditions (natural state) that prompt the two types of advective flow described below is advantageous when modeling landslides [4,5]:
(i)
Cold advection involves water descending due to the gravity force to a deep lower level; and
(ii)
Hot advection comprises condensation of hot magmatic gases.
Concomitant causes, such as erosion, shear strength reduction instigated by rainfall, and anthropic activities, can prompt landslides. Frequently, individual phenomena contribute to instability over time, complicating the study of the landslide evolution. Landslide hazard alleviation measures can be characterized according to the slope stabilization scheme used as follows:
  • Geometric techniques alter the slope geometry;
  • Hydrogeological approaches attempt to decrease the groundwater, to lessen the liquid content or humidity of the problematic area; and
  • Both mechanical as well as chemical procedures try to increase the unsteady volume shear strength. Active forces from rocks, anchors, and ground nailing, and passive forces from structural wells, piles and reinforced soil, to cite a few, can be employed to neutralize the threatening forces.
Mathematical models are also vital when estimating states and in decision-making, because they allow the observation of process states, parameters, and characteristic quantities [6,7] via closed-loop control to model systems with threat detecting sensors and actuators, as opposed to simulating geohazards [7,8,9] (refer to Figure 1a), where y is the output of the structures under control.
This paper proposes an Emergency Response (ER) Cyber-Physical System (CPS) based on images and other sensors.
Landslide detection (LD) techniques require process models with parameter and state estimation procedures to handle statistical decision methods. Regardless of whether the faults already exist or appear unexpectedly, they should be detected by the LD framework. LD methods need to consider the following aspects:
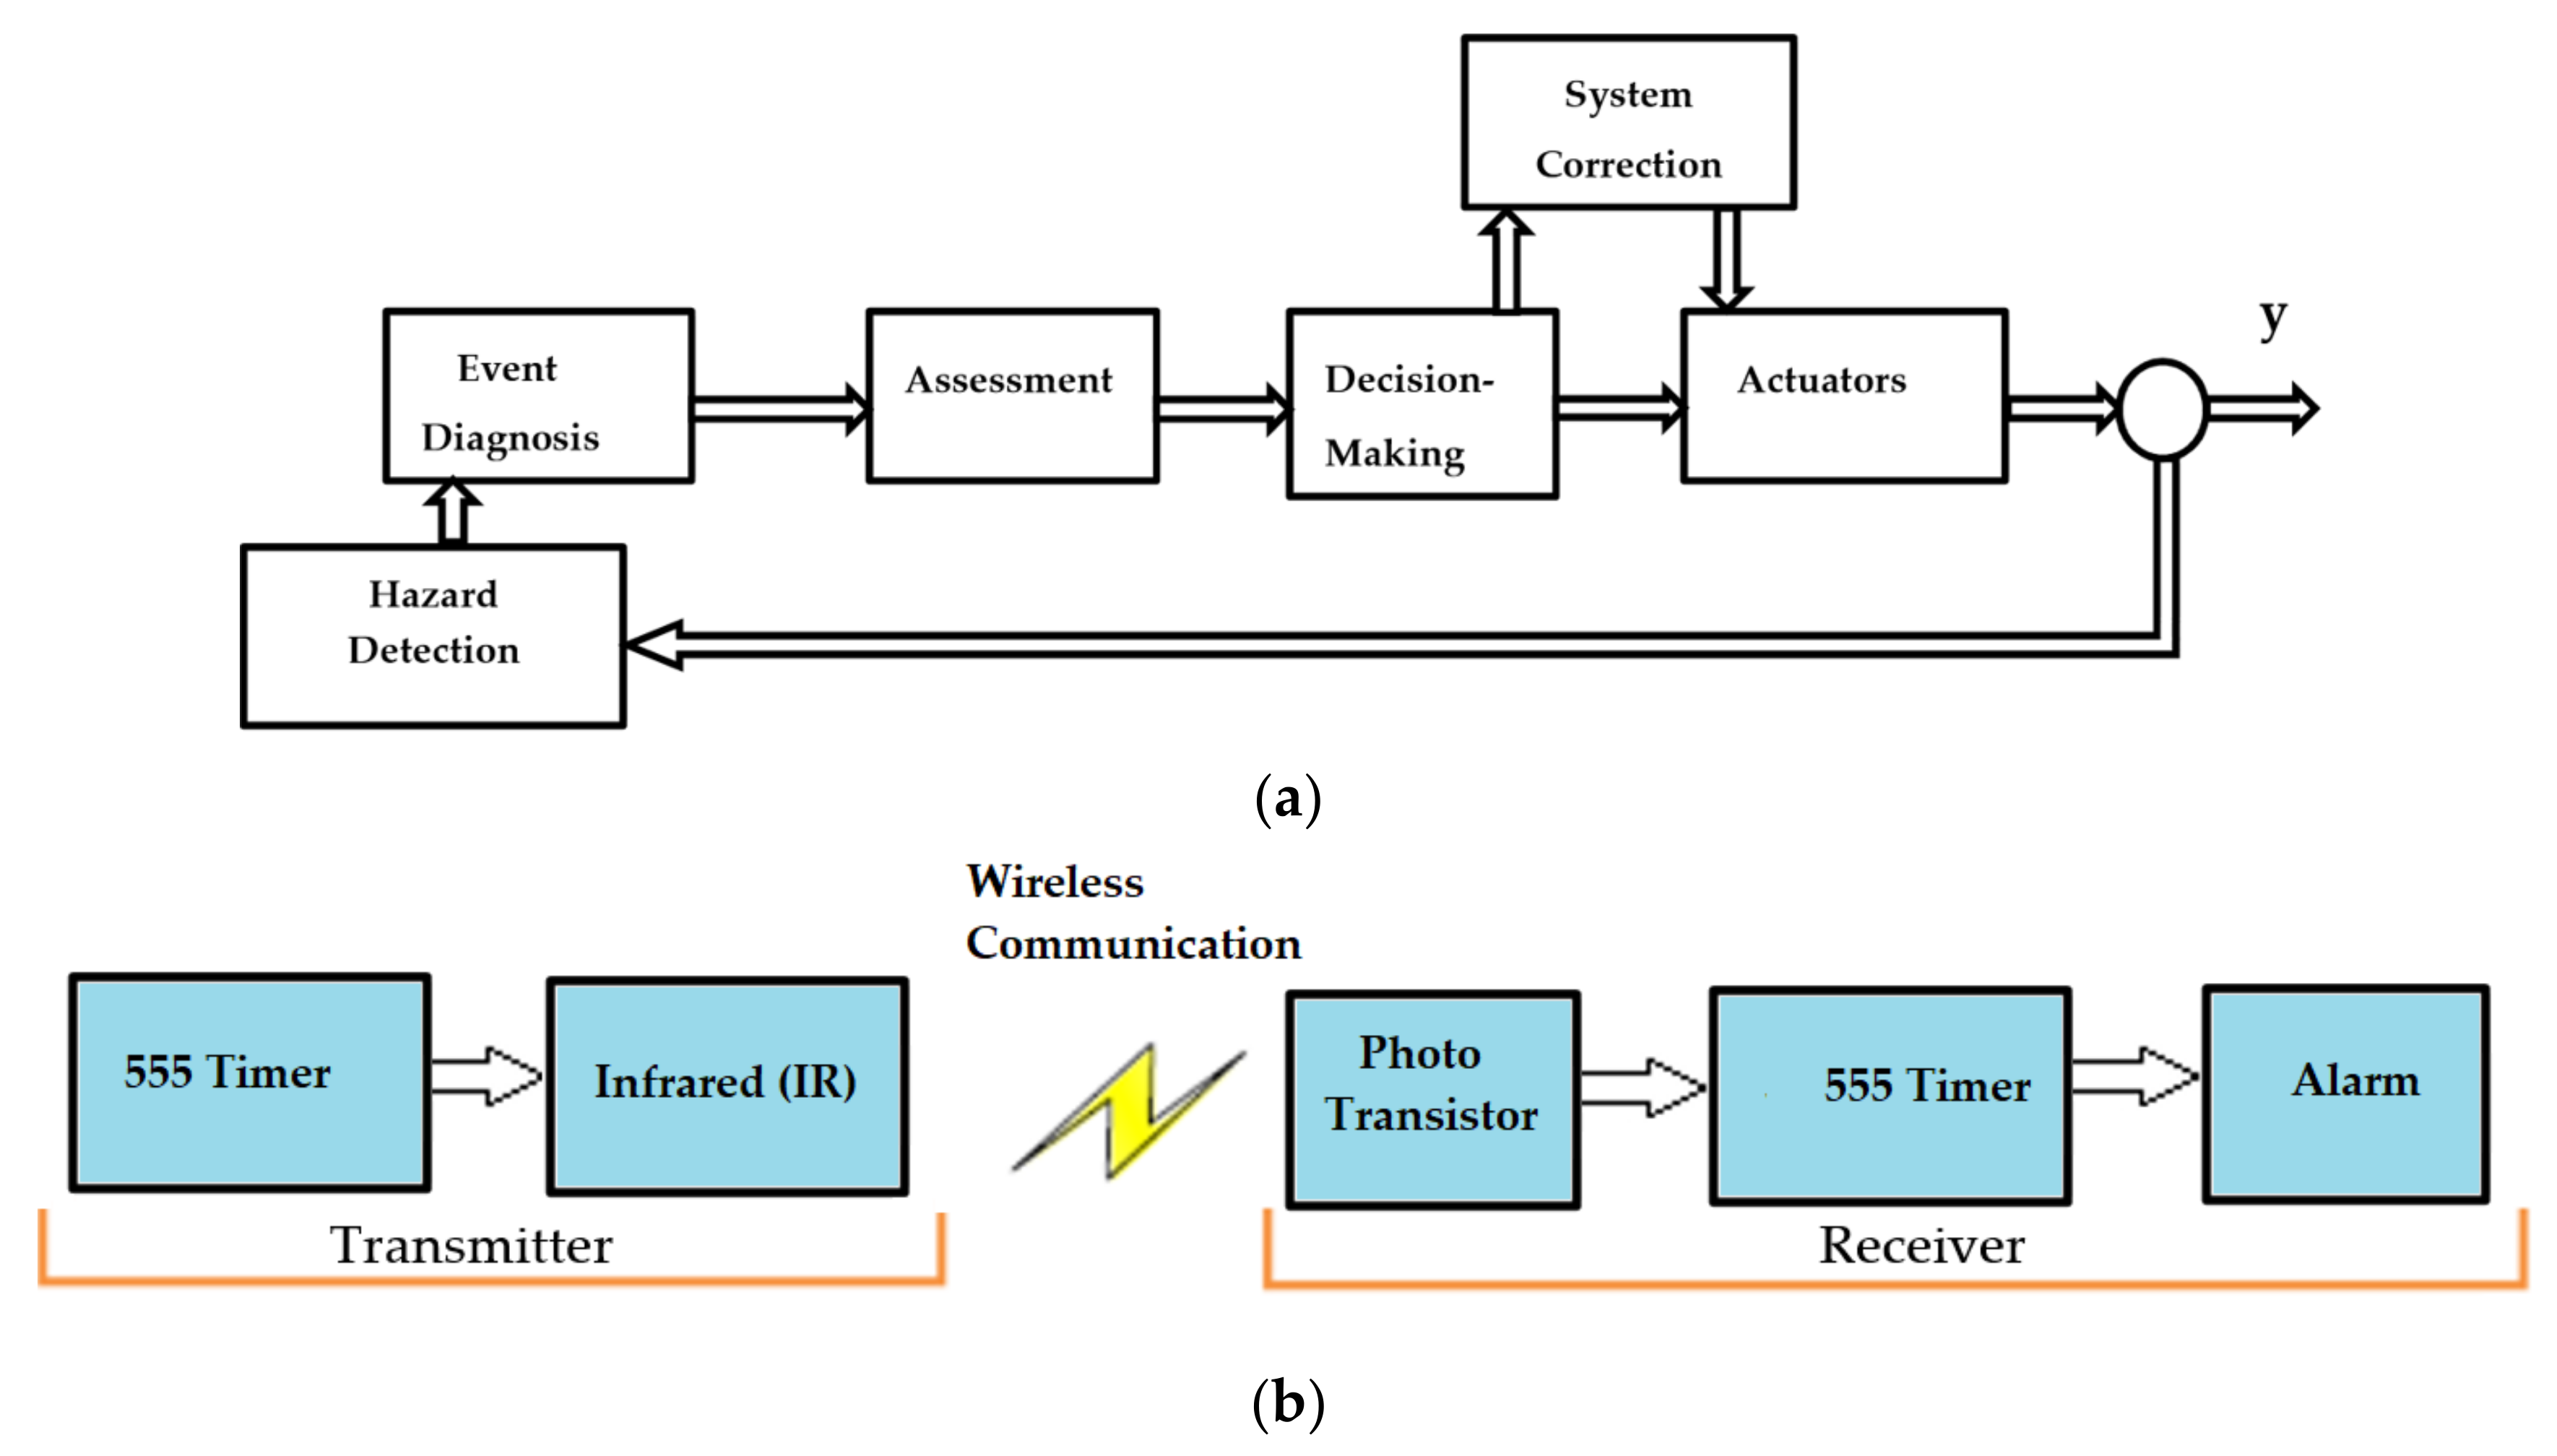
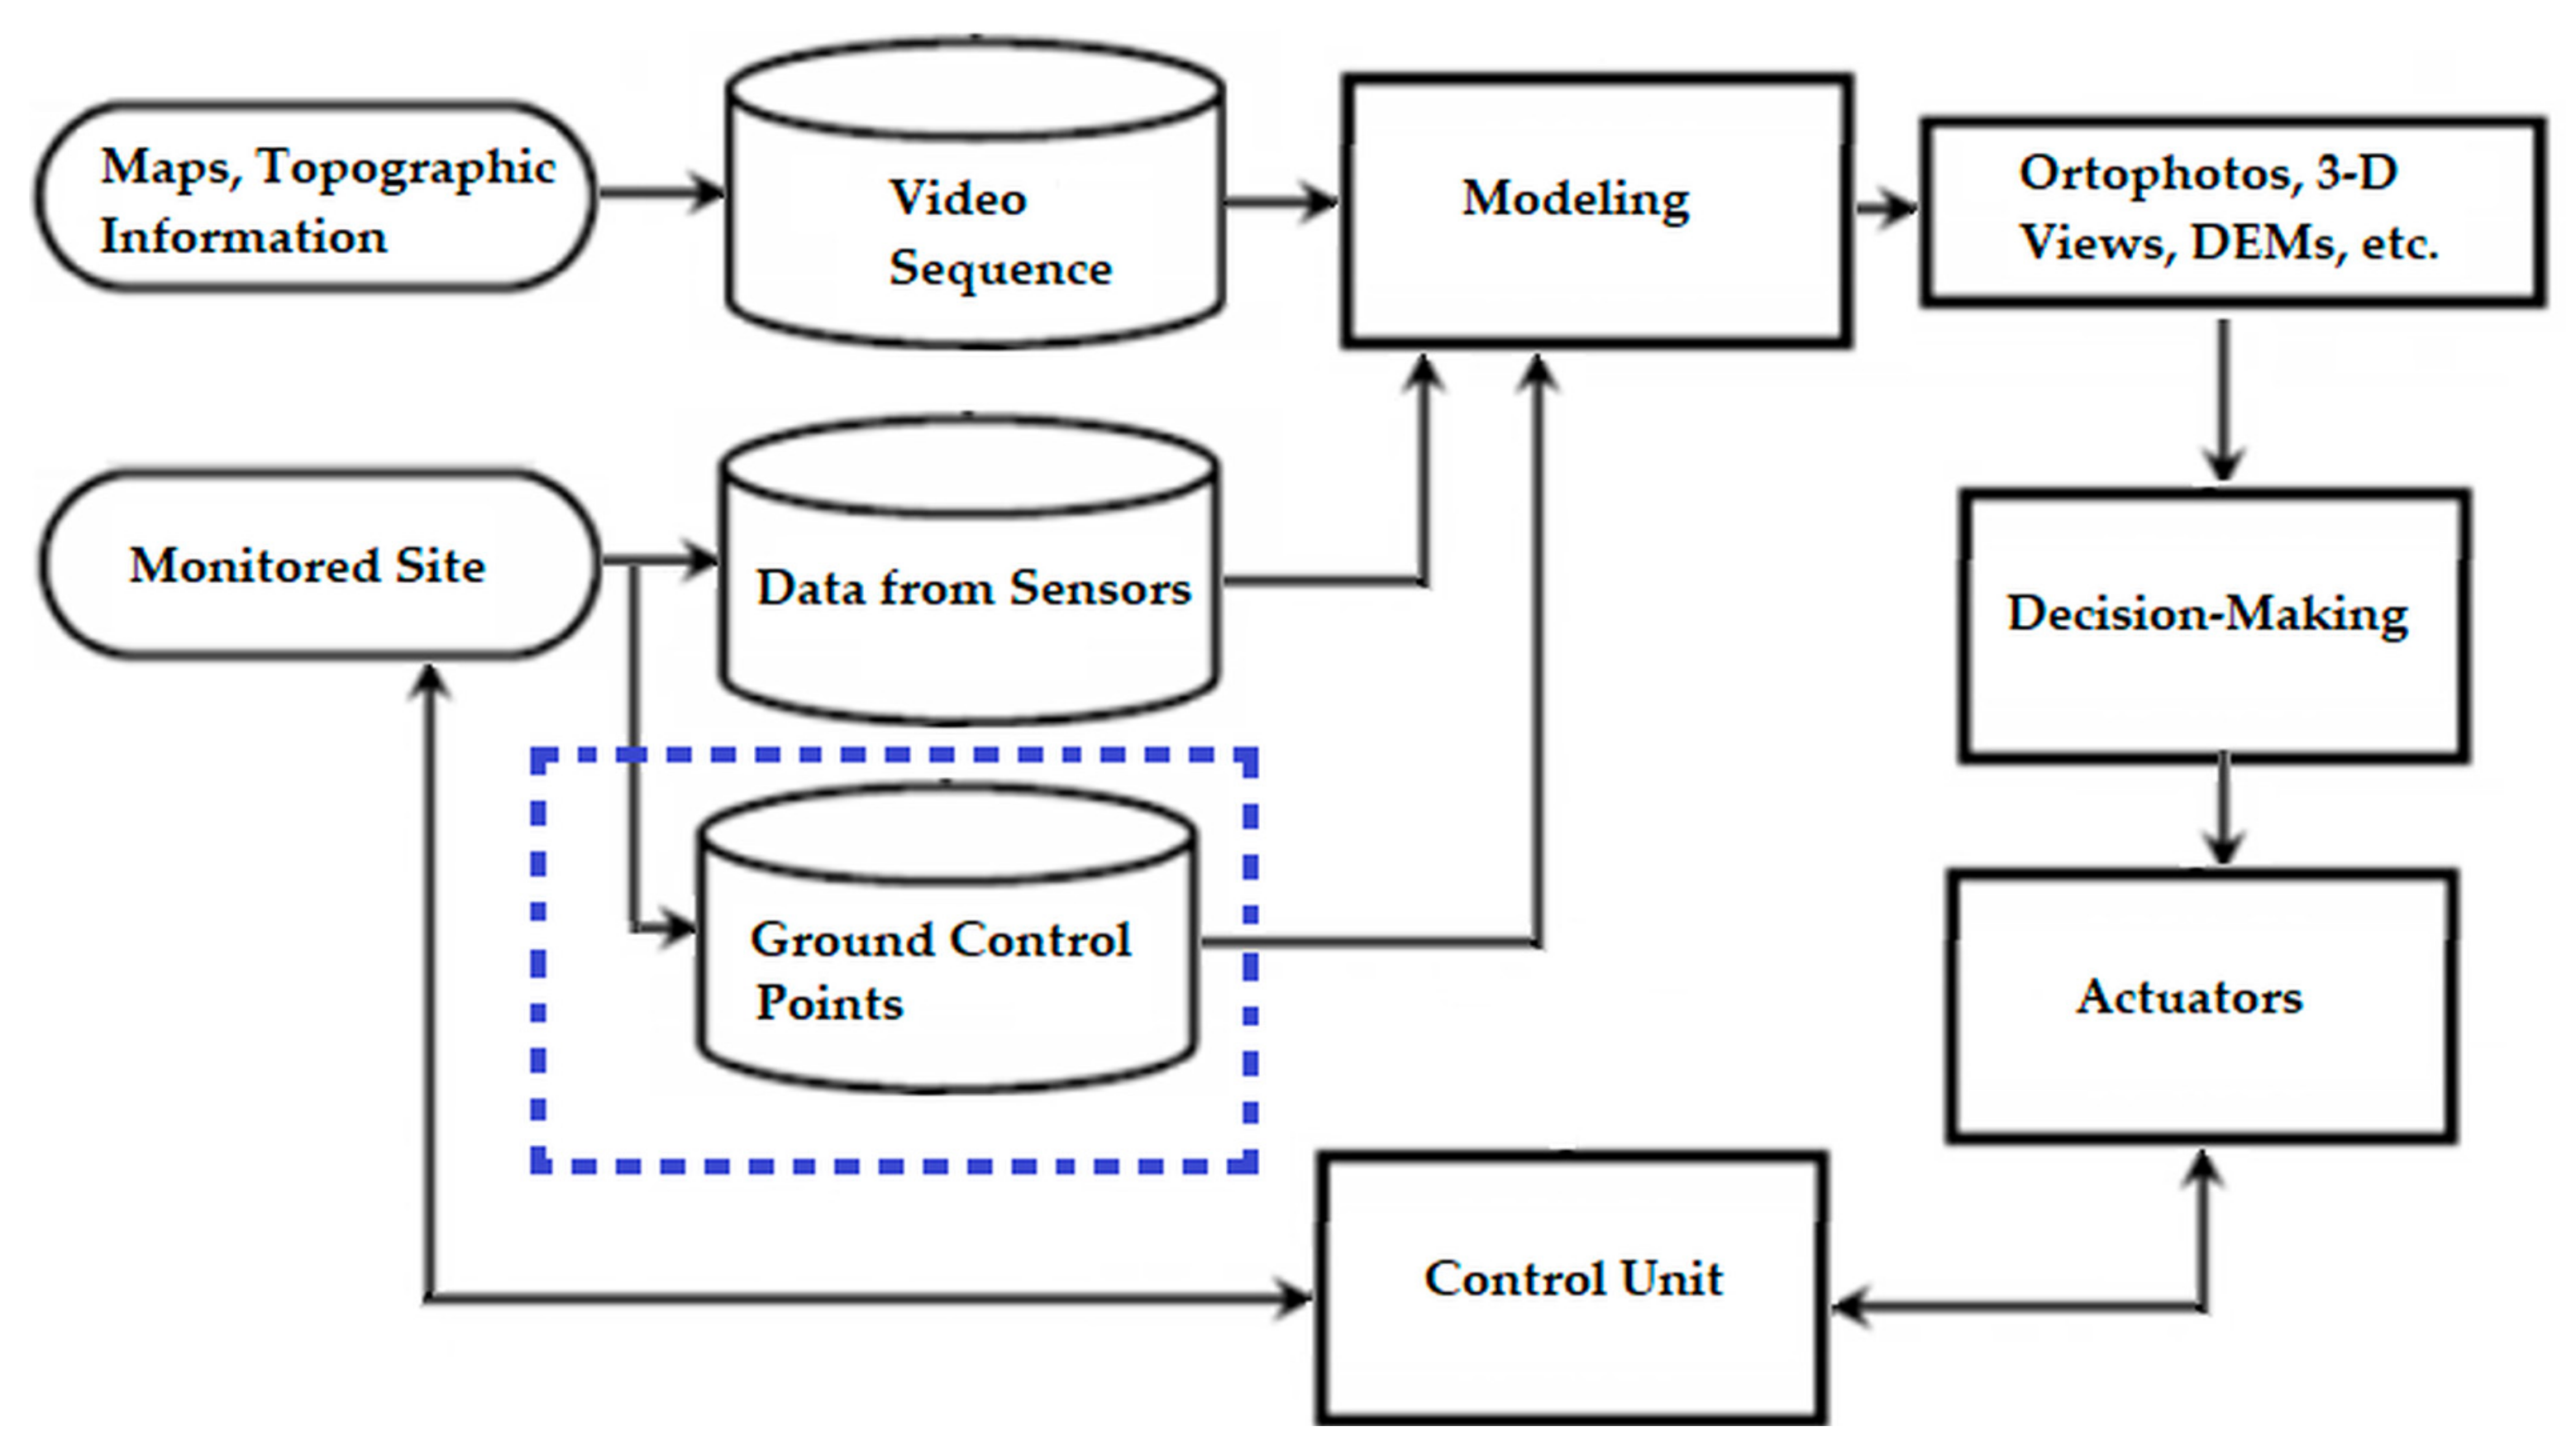
  • Process models: Signal processing along with control system theory can help to model an LD system where sensors estimate errors or deviations from a normality situation and processed by a subsystem called actuator to produce the necessary feedback to restore the system stability.
  • Parameter and state estimation: The fault detection system needs to acquire and process signals to generate the data for decision-making.
  • Performance Control: Fault detection strategies must be sensitive to problems, while robust to noise, modeling errors, operating points, normal signal fluctuations, and so on, because these requirements can be conflicting:
    (i)
    The size of a fault must be sensed accordingly with the due detection time;
    (ii)
    The LD time must be compatible with the fault appearance speed;
    (iii)
    The speed of fault appearance must trigger the adequate actuator response time;
    (iv)
    The parameter changes must be tracked and handled adequately timewise; and
    (v)
    The detection time must be extremely fast while having a small false alarm rate.
  • Redundancy: Several detection methods may be used simultaneously to guarantee redundancy in LD systems.
  • Reliability: An LD system needs to be reliable, with safe backup structures to guarantee smooth work to avoid false alarms while having a low probability of missing true alarms.
  • Self-Testing: An LD system must check if the system is working correctly via error detection and fault identification techniques to improve the total system reliability and safety.
Section 2 acquaints the reader with the basics of optical and infrared (IR) ISSs for motion detection (MD), including mice sensors and cameras for displacement estimation. Section 3 explains the use of the optical flow in terrain modeling and analysis. The hardware and software architectures of the proposed Emergency Response (ER) Cyber-Physical System (CPS) appear in Section 4. Section 5 weaves all the aspects discussed in previous sections to discuss the design of a visual sensor actuator node (VSAN), as seen from the instrumentation level. Section 6 introduces some cases studies that will be used when discussing the ER-CPS design. Section 7 discusses the whole work. Finally, Section 8 draws some conclusions.

2. Optical and IR Sensors for In Situ Motion Detection

Environmental and human protection with simple, inexpensive, rapid characterization and remediation, and fast analysis systems for initial in situ screening, should be prioritized. An in situ sensor (ISS) gathers data about an item in place or from close range. In this work, the concept of in situ sensing encompasses proximal sensing. Meteorological stations, for instance, can use ISS networks.
Intelligent sensors and wireless telecommunication technologies are modernizing networks rapidly. It is more and more viable to deliver high-quality real-time data to users through the internet containing results from data fusion and fast model assimilation [9].
An electronic motion detector (MD) contains sensors, a transmitter, and a receiver. However, a passive ISS detects radiation from the changing target, or from other sources, such as the sun. Changes in the optic, microwave, or acoustic properties can be interpreted by the electronics. Most low-cost MDs can handle distances of at least 4.5 m.
MDs that measure position, speed, and acceleration of moving objects are often part of an automatic system that signals or warns a user about motion in an area through convenient outputs. These indicators can be combined with other meters to help decision-making, creating security components that can send automated controls to regulate energy efficiency, turn on lights, and other useful disaster prevention and/or mitigation structures in the nearby areas, forming a protective grid.

2.1. Types of Motion Sensors

MDs can estimate the distance between points and other quantities (e.g., temperature, velocity, acceleration, and pressure). There are several different kinds of MDs, whose sophistication ranges from simple to extremely elaborate [10,11,12]. Other examples are potentiometers, strain gages, linear variable differential transformers (LVDT), and an assortment of sensors to detect capacitance, sound, light, temperature, and radiation among other physical/chemical properties. Laser, and radioactive sensors can also be employed. This work will deal with sensors relying on optical features: passive optical devices, and video cameras.

2.1.1. Passive Optical Devices

Passive devices (PDs), such as photodetectors and infrared (IR) elements, can detect motions if something crosses and interrupts a visible or IR beam within the surrounding environment, provided it is dark enough. A PD detects the moving object via emission or reflection of a signal. For instance, a photo resistor is a PD sensitive to light that does not emit energy.

2.1.2. Optical and IR Video Cameras

Sensors help landslides studies and to devise suitable risk alleviation actions. Since this paper examines the application of onsite/in situ sensors to delineate landslides more clearly, and to monitor ground movements over large areas with increasing accuracy, the most important advances are linked to the visualization of mudslides and related processes. With the spread of low-cost cameras and their availability from legacy equipment, they can be used to detect motion in their field of view (FoV), which is particularly attractive when dealing with motion caught by video cameras and a computer. Near-infrared (NIR) allows for sensing motion in the dark.
A region can be monitored using a single or a full angle camera. The video can be processed in a control and processing unit, to detect individuals and to control light fixtures and other smart equipment to warn people.

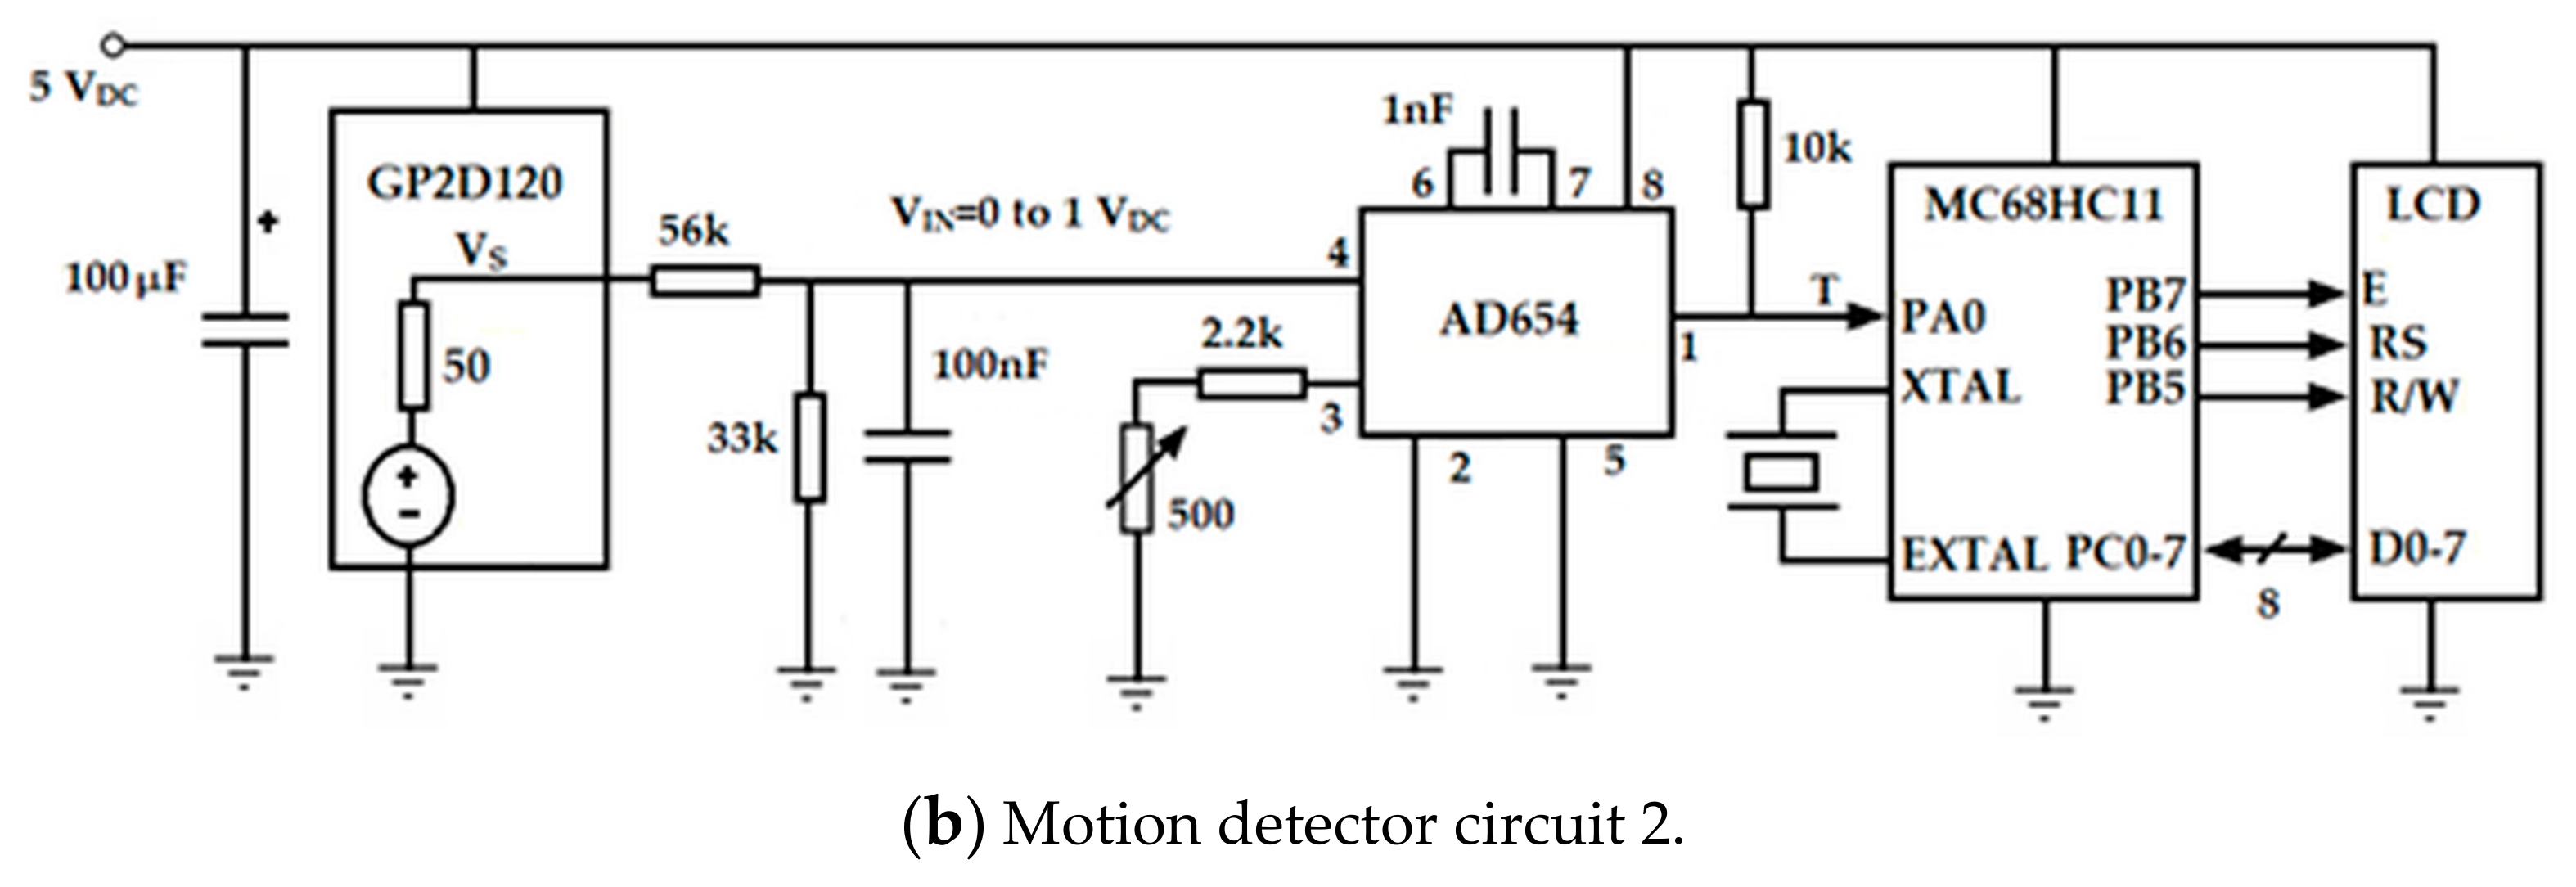
2.2. Motion Detection Hardware Rationale

An example of an MD system using only salvaged components is shown in Figure 1b. The MD sensor detects the displacements of the objects, and gives the proper output consistent with the circuit [13]. This simple circuit uses an IR node to send an IR beam and photo transistor for reception of this IR signal (Figure 1b). Any interference or disturbance in the middle of the transmitting and the receiving parts of the system, means an intrusion, and sets the alarm on. This is low-cost circuit is an easy to build motion detector. The IR node will produce the high-frequency beam, which reaches the photo transistor with the help of 555 timer at the transmitter. When this high-frequency beam is disturbed, the photo transistor will trigger the 555 receiver timer to give an alert. Without motion, there will be no output (alarm).

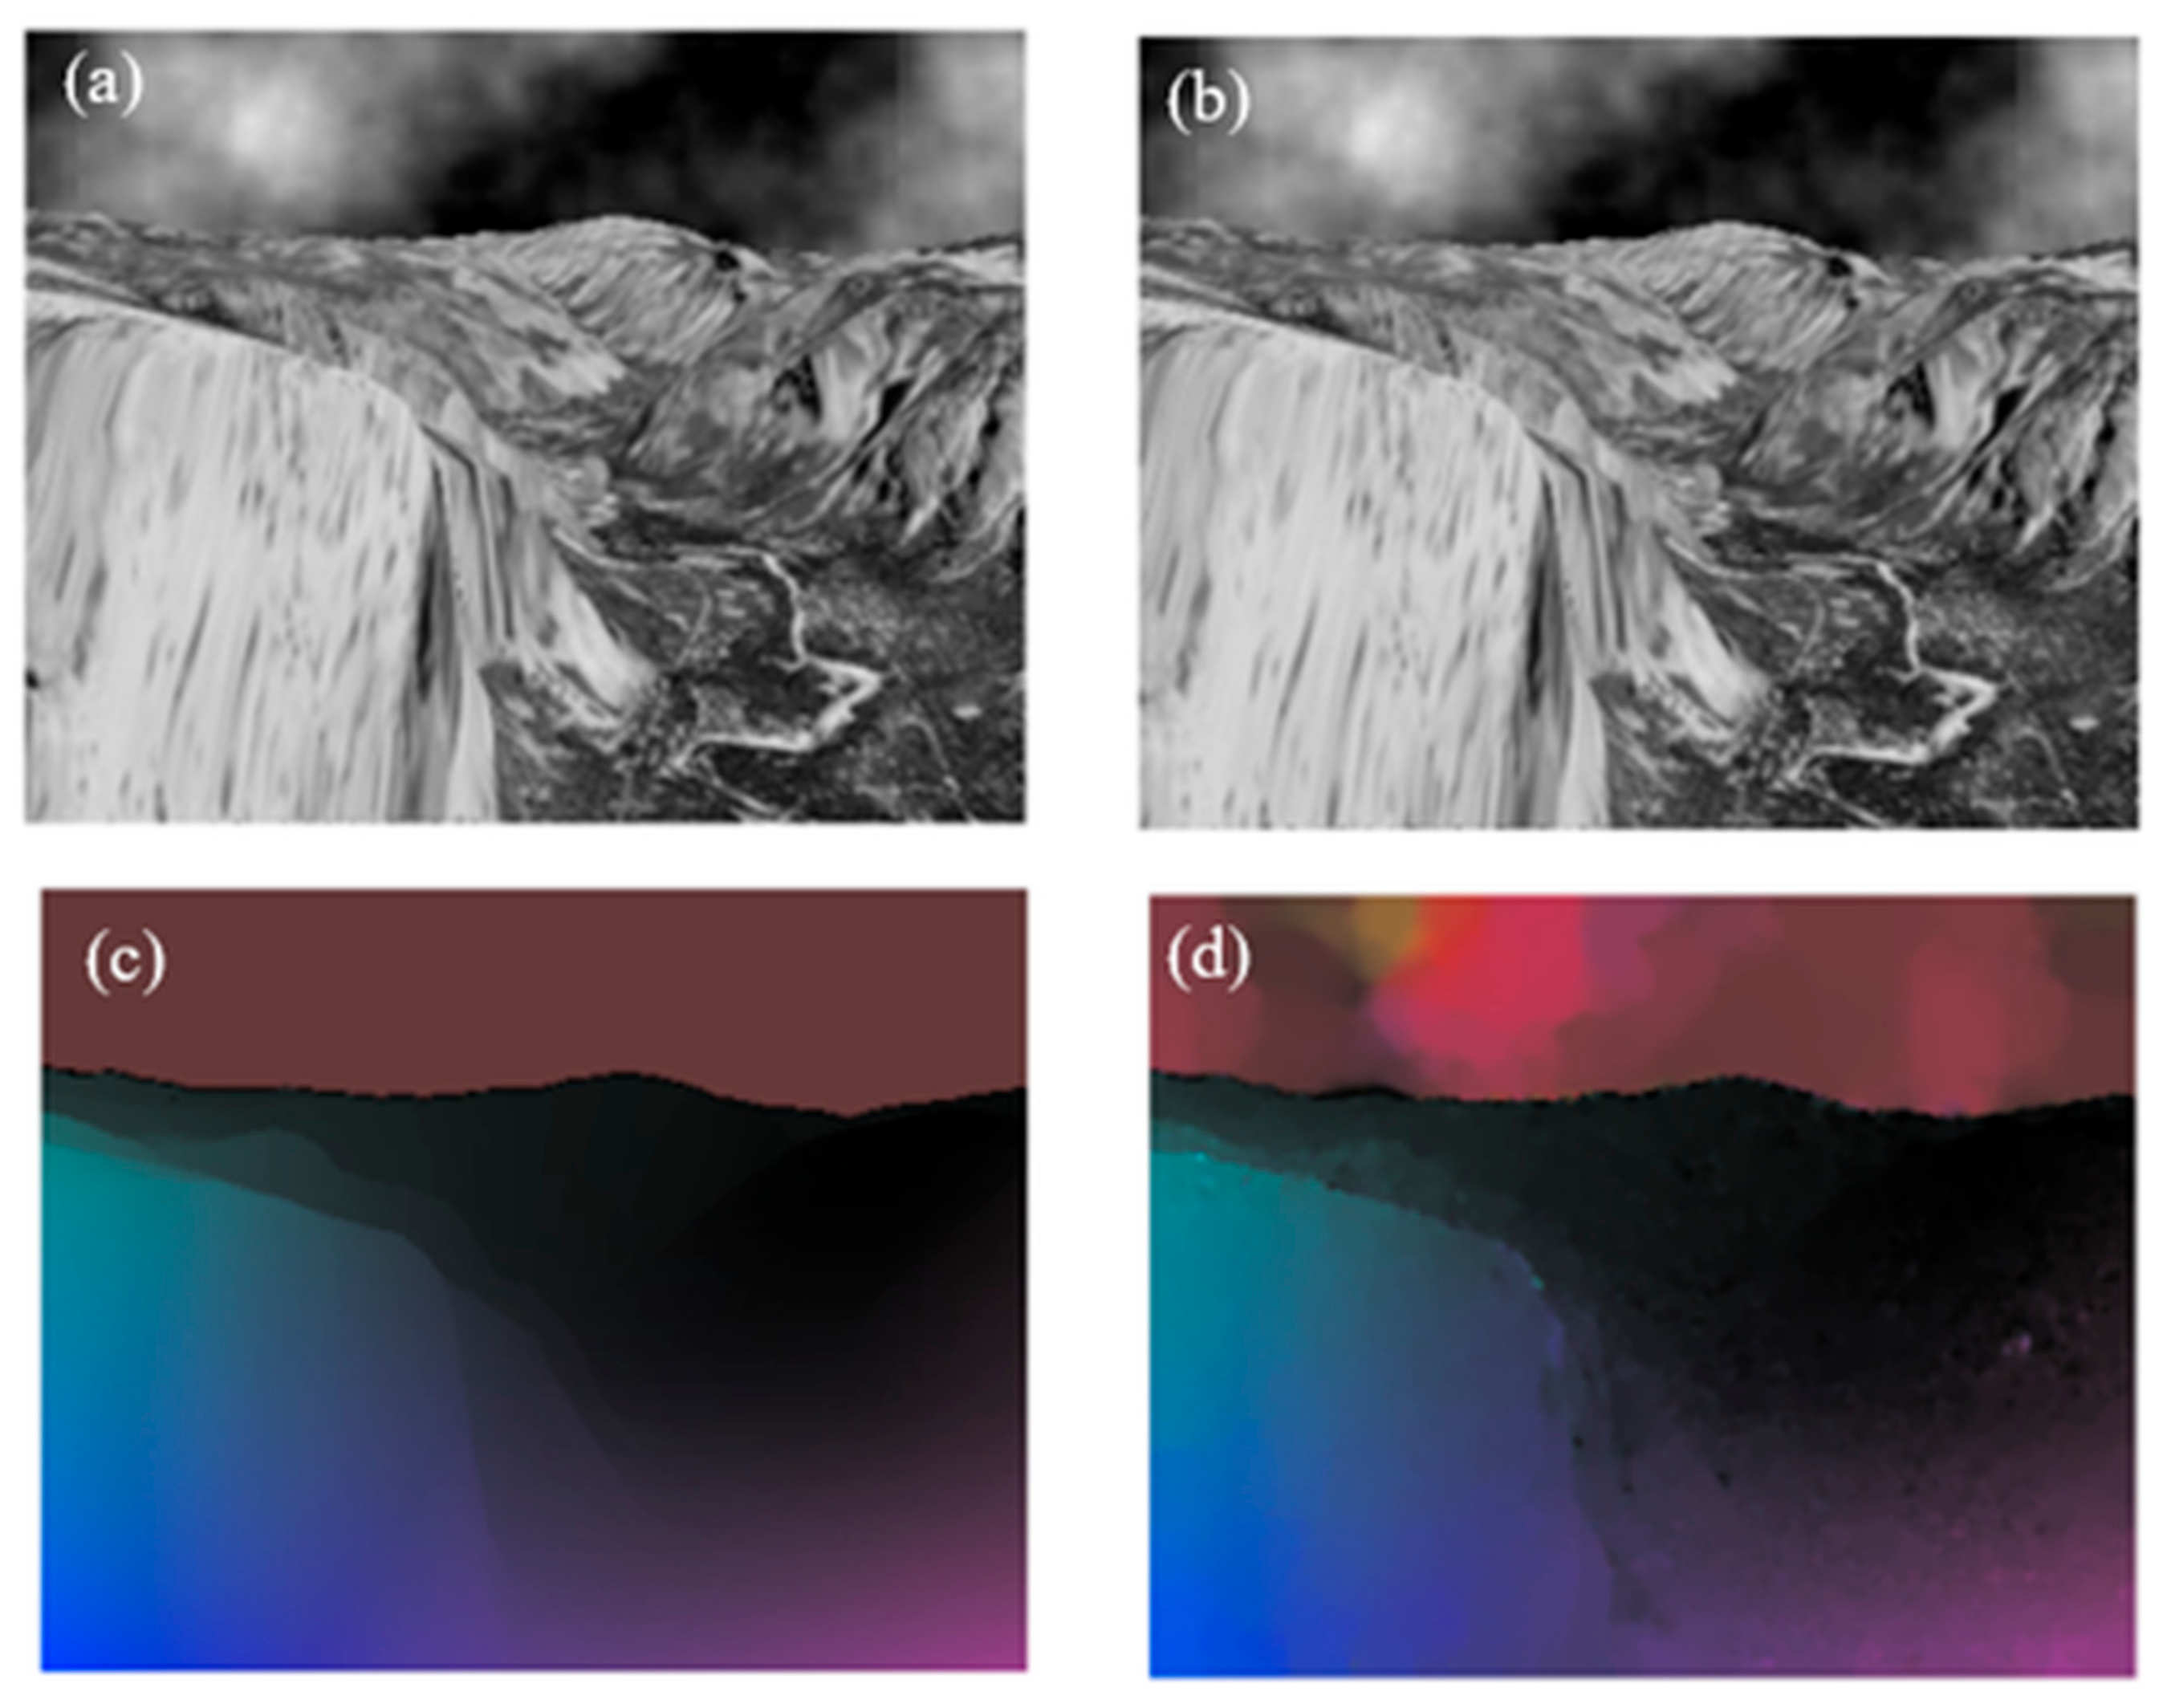
3. Optical Flow Applications in Terrain Modeling and Analysis
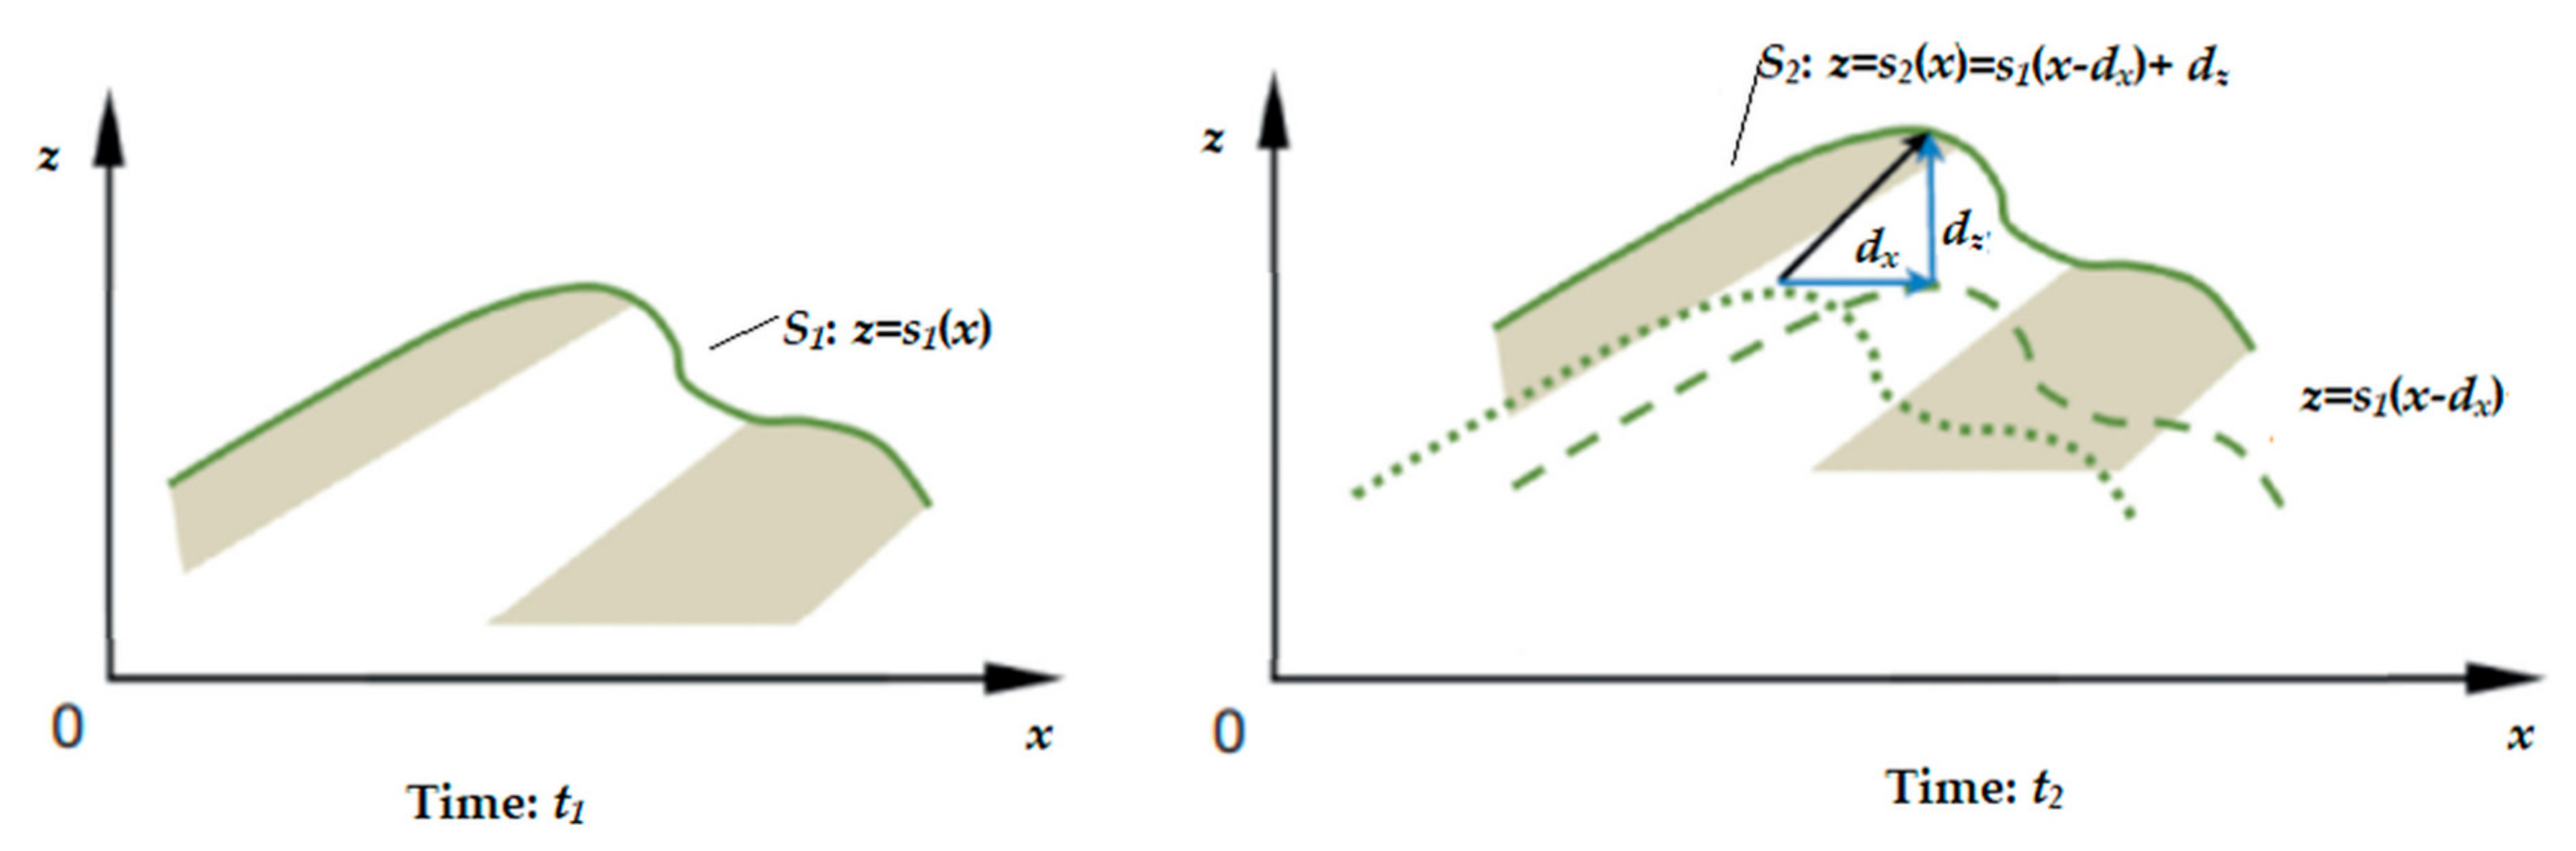
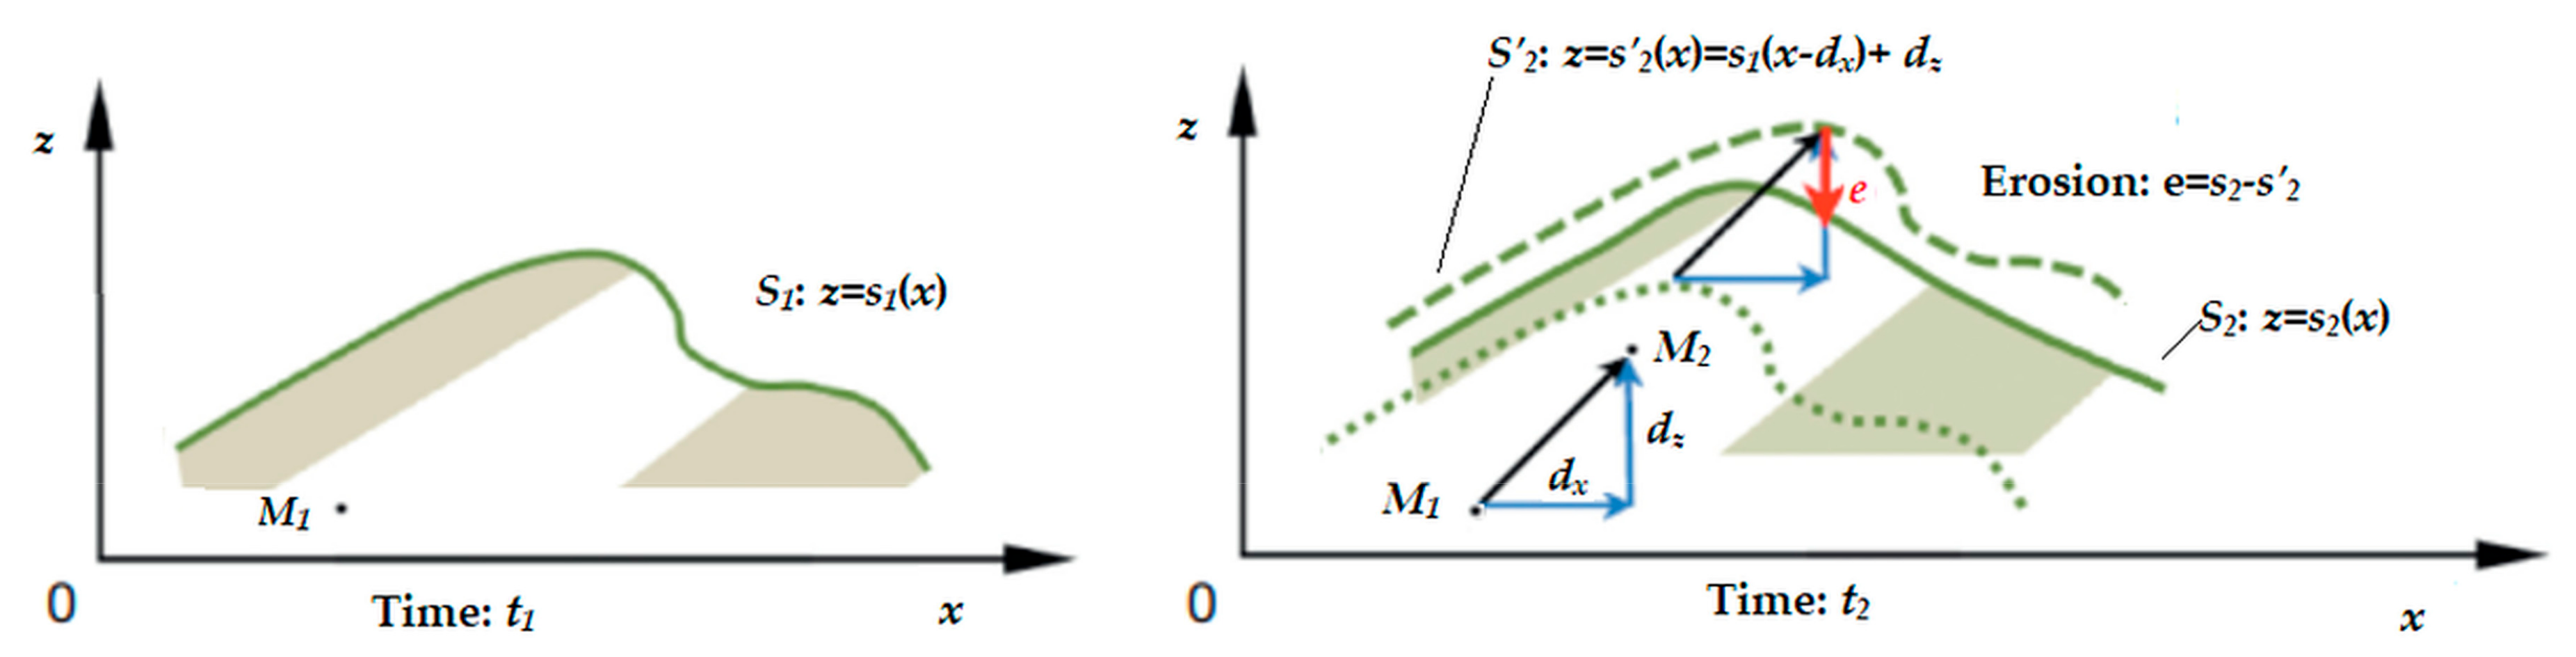
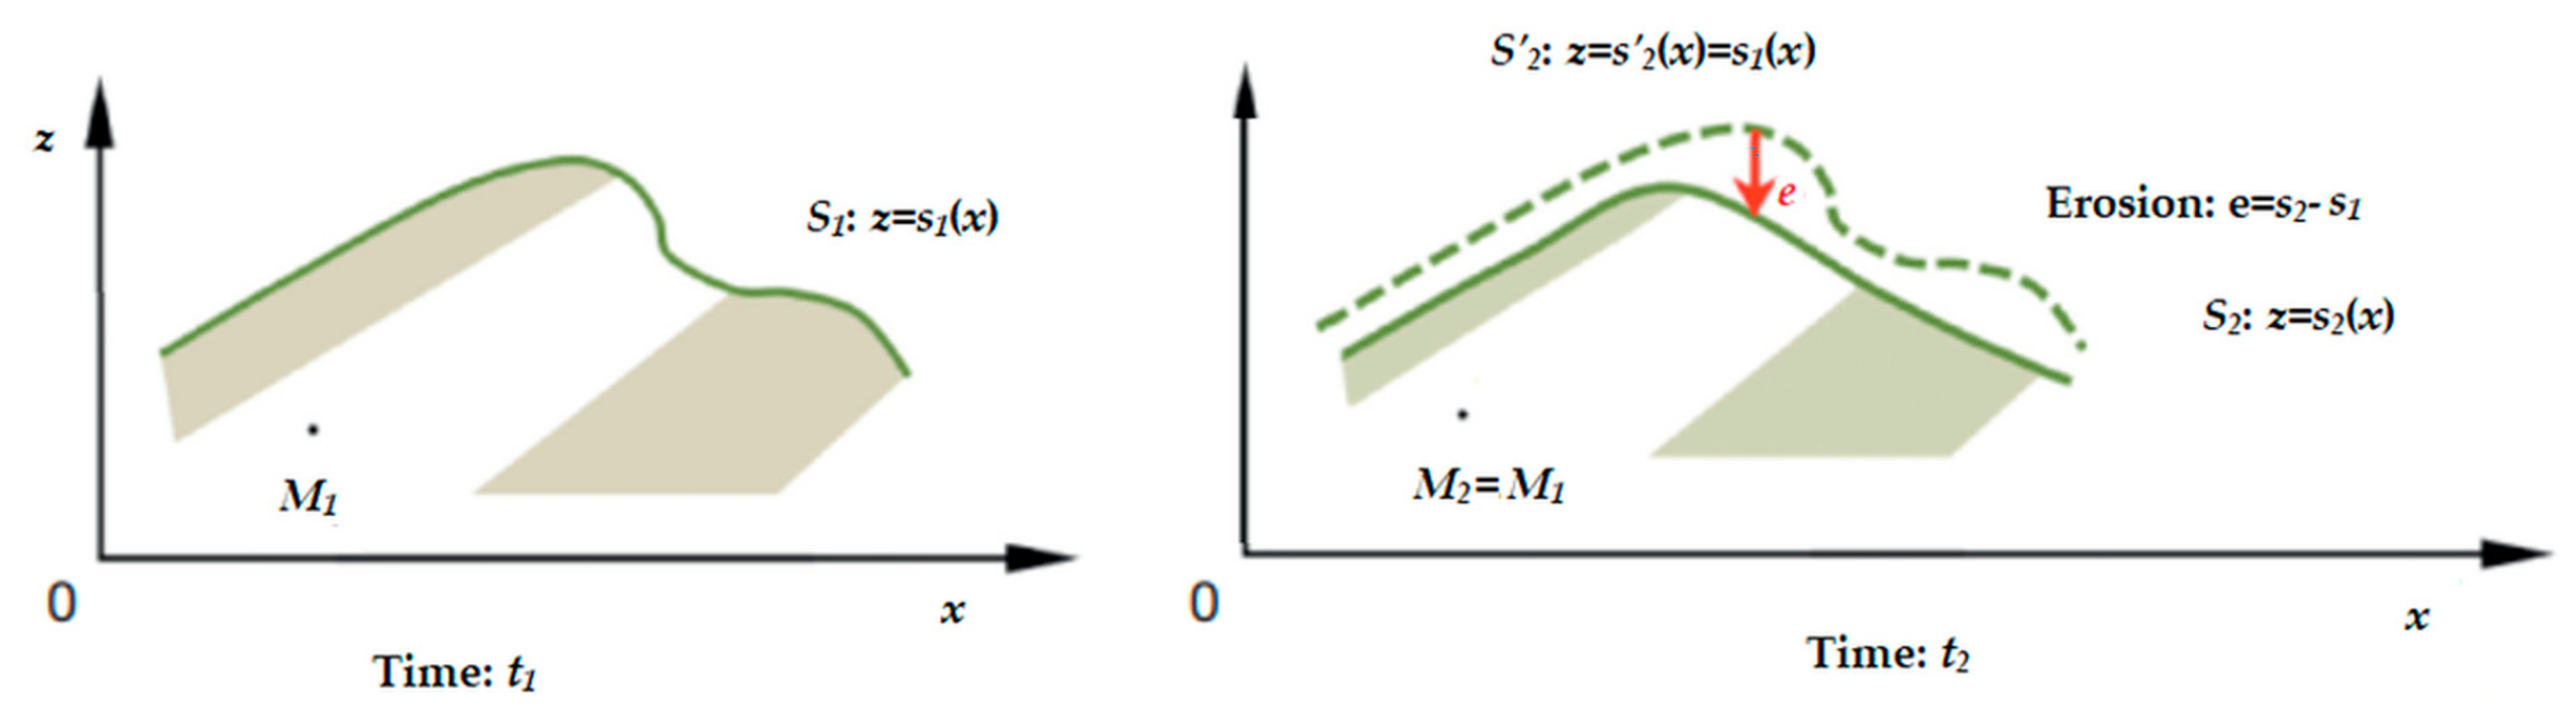
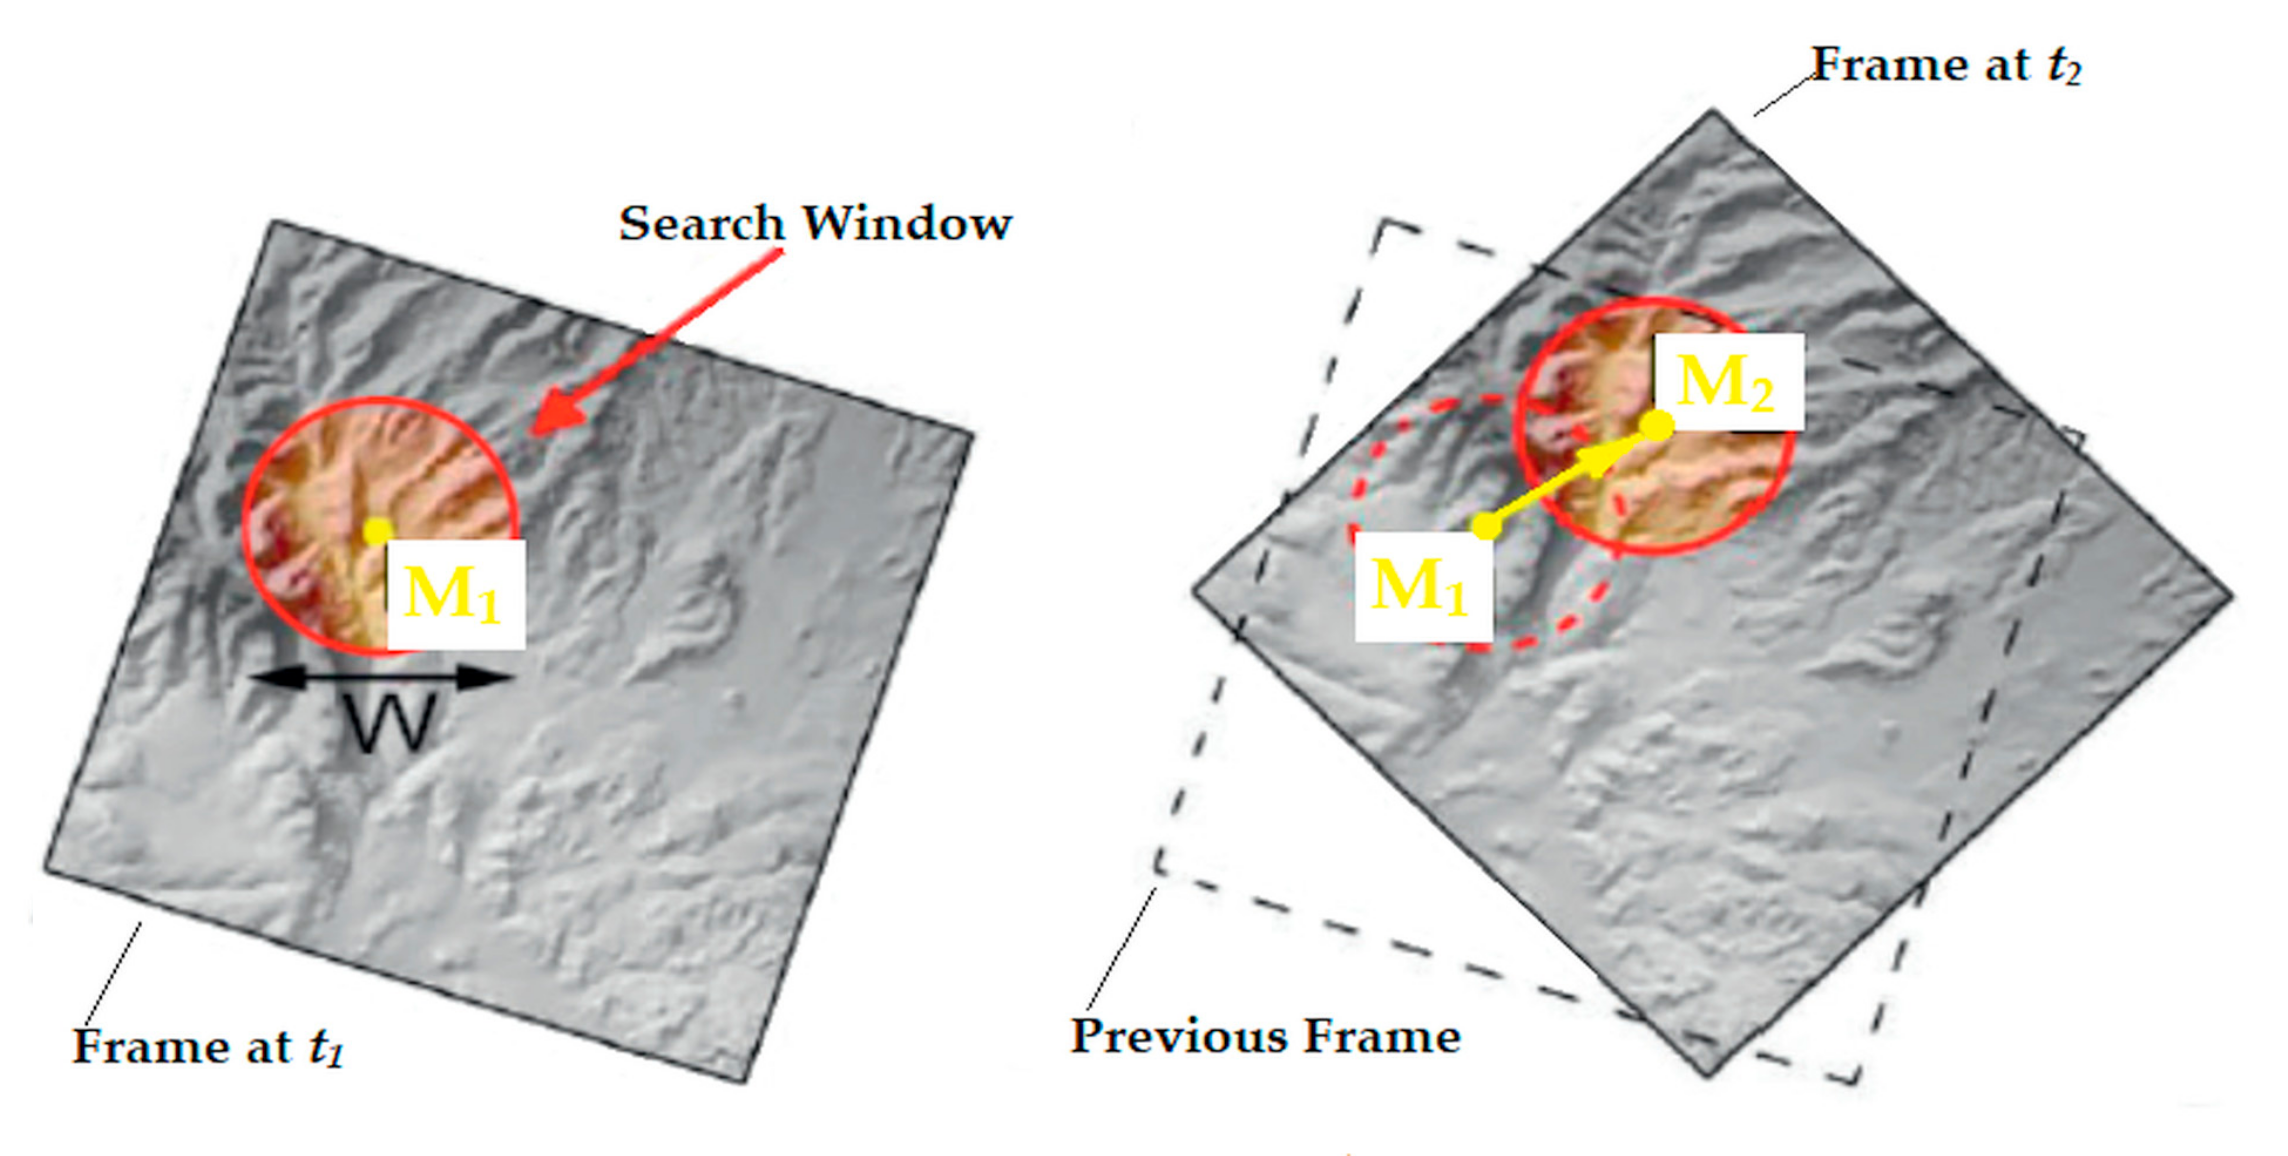
3.1. Optical Flow

Optical flow (OF) methods have many different implementations (e.g., [14,15,16,17,18]). They rely on radiometric differences between adjacent frames from a scene, assuming constant intensity changes or corrected factors, such as the imaging system and scene illumination. Let us consider the intensity at an image frame k at a pixel location r = (x, y):
Ik(x, y) = Ik−1(xdx, ydy),
where d = (dx, dy) is the displacement or disparity vector (DV), also known as the motion vector (MV) in the 2-D space, describing the image transformation mapping Ik onto Ik−1. For small offsets d and using a Taylor series expansion,
I k ( x , y ) I k 1 ( x , y ) d x ( x , y ) I k 1 ( x , y ) x d y ( x , y ) I k 1 ( x , y ) y ,
which demonstrates that the change between two adjacent frames relies on the brightness differences. It is an ill-posed problem, as only the parallel component to the image brightness gradient ( I k 1 ( x , y ) / x , I k 1 ( x , y ) / y ) of the MV can be found. Using a local window, the problem can be regularized, supposing that the DV field (DVF) is constant over a given area (smoothness constraint) or by means of a global regularization methodology. In an ideal world, the performance should only be restricted by the radiometric noise. The OF technique can measure strain from photogrammetry, but it fails for images obtained with different viewing angles, the surface roughness at the pixel scale is large (say, with high-resolution (HR) imaging of essential areas) or when the DVF is locally discontinuous. OF methods are very sensitive to intensity variations, and they can model higher-order deformations, mostly, to measure neighboring affine distortions and to represent minor contrast variations [19,20,21,22,23]. The digital elevation model (DEM) represents a discretized version of the topography with a regular or irregular sampling grid.
Landslide detection can use quantitative characterization of topographic changes between two image acquisitions (Figure 2). The data help to render of the site’s surface, that is, S1 and S2 at times t1 and t2, correspondingly. Si is the surface at time ti regarding a geodetic reference (Figure 2 show the x- and z-axes) linked to a datum and its reflective properties. The surface cover (e.g., vegetation and other structures) and the substrate determines these properties.
The goal is to characterize quantitatively geometric changes of the site’s surface between t1 and t2. S1 and S2 refer to the site’s surface at t1 and t2, correspondingly, with a geodetic reference frame xy. The site’s surface may change due to the subsurface dislocation, designated by the DV M1M2, or as a result of the scalar quantity, where e represents erosion (e < 0) or sedimentation (e > 0).
Given a subsurface point M1 at t1, it appears as M2 at t2, with respect to the reference frame. The ground DV d = (dx, dy, dz) is due to processes such as landslides or man-made damage. S1 and S2 exemplify the surface topography at t1 and t2. Between t1 and t2, S1 may change as a consequence of erosion or sedimentation. Hence, advection produces a surface S02, which differs from the topography at time t2 (refer to Figure 2). The elevation difference between S02 and S2 quantifies the evolution of the topography attributable to erosion (s2(x, y) < s02(x, y)) or sedimentation (s2(x, y) > s02(x, y)). A measurement of topographic variation is the difference between s2 and s02 or the DVF d. The knowledge from sensing the surface changes with imaging systems is still insufficient to solve for both the elevation change of the topography and the ground DV. Theoretically, any erosion or sedimentation e should disturb the measured difference in elevation d.
Geodetics assumes that the deformed topography moves as a passive marker to allow matching the topography at t1 and t2, as long as it has not changed between the two times.
In video editing, MVs help to compress video by recording the modifications from an image frame to the next frame. The process involves a 2-D pointer that tells the decoder how much it is from left or right and from up or down, the estimated macroblock has its position given consistent with its instance in the reference frame macroblock.

3.2. Measurement Using OF

Examining optically a site’s surface at two time instants, then these data produce perfectly-registered DEMs representing the surface’s properties at t1 and t2. s1 and s2 are the functions describing the surface at t1 and t2, in that order, where the DEMs are discrete versions of these functions. In general, the elevation change is the difference between the surfaces, s2(x, y) − s1(x, y), shows the outcome of advection and erosion, e(x, y) (Figure 2):
s2(x, y) − s1(x, y) = [s1(xdx, y − dy) + dz(x, y) − s1(x, y) − s1(x, y)] + e(x, y)
The term α = [s1(xdx, ydy) + dz(x, y) − s1(x, y) − s1(x, y)] side is the elevation variation. Approximating (3) by a first-order Taylor expansion yields
s 2 ( x , y ) s 1 ( x , y ) d z ( x , y ) d x ( x , y ) δ s 1 δ x ( x , y ) d y ( x , y ) δ s 1 δ y ( x , y ) + e ( x , y ) .
Ignoring ground displacements, changes are most simply characterized by the difference between the two surfaces:
e = s2(x, y) − s1(x, y).
The site’s surface may change due to e.
The measurement requires resampling the two DEMs on a common grid that takes into account that the DEMs have resampling errors (misregistration). Thus, differences between the surfaces may be biased due to registration errors. Figure 2 illustrates this issue for the DVF d = (dx, dy, dz) and misregistration ε = (εx, εy, εz), where Equation (5) becomes
s2(x, y) − s1(x, y) = s1(xεx, yεy) − s1(x, y) + e(x, y).
or, in its Taylor expansion form:
s 2 ( x , y ) s 1 ( x , y ) e ( x , y ) + ε x ( x , y ) ε x ( x , y ) δ s 1 δ x ( x , y ) ε y ( x , y ) δ s 1 δ y ( x , y )
The data analysis requires precise co-registration of the DEMs to minimize the bias, which assumes that some regions do not change topographically (s2(x, y) − s1(x, y) = 0) or it uses a priori constraints on the displacements, such as some ground control points (GCP). This reflects the misregistration, resampling errors, along with advective transport (Figure 3). The 3-D DVF between two times may be retrieved from matching the two 3-D DEMs, and finds a d satisfying
s2(x, y) = s1(xdx, ydy) + dz(x, y),
or, after a Taylor expansion
s 2 ( x , y ) s 1 ( x , y ) d z ( x , y ) d x ( x , y ) δ s 1 δ x ( x , y ) d y ( x , y ) δ s 1 δ y ( x , y ) .
The surfaces are matched at t1 and t2 to find the DF. Equation (9) describes an ill-posed problem, since only the displacement along the gradient can be found without ambiguity. Hence, to fully characterize the displacement vector, regularization is needed with some additional assumptions.
To regularize the DF matching problem, the DVF is assumed to be continuous and smooth (continuously differentiable). So, the horizontal DV at point M1 can be established from matching between two windows of size w centered on M1 in s1 and on M2 in s2 (Figure 4). The window must be sufficiently large so as the direction of gradient differs considerably inside the window. Hence, the DVF always requires lower spatial resolution than the original DEM. Natural scenes usually need larger windows.
When the DEMs result from stereoscopic pairs, matching DEMs may not work, because DEMs do not portray exactly the data from the original topographic knowledge. The radiometry of one pixel depends on the surface’s properties and local topography. If the texture is transported by advection, then it is a richer knowledge source about the ground displacement than the DEM itself. Therefore, ground dislocations can be obtained more accurately by matching the image textures, like measuring parallax offsets to calculate DEMs (Figure 4). Mathematically, matching the radiometry is the same as matching the topography, and both are equivalent ill-posed problems that may require regularization [14,15,16,17,18,19,20,21,22,23,24,25,26].
To measure the displacements from images collected at different instants depends on the matching algorithm. Matching methods yield a DVF estimate that best matches a window centered on that point that has a corresponding window in the second frame. The output of the matching procedure is a DVF, corresponding to a shaded representation of the horizontal and vertical 3-D components.
Landslide detection in the direction of movement can be solved by implementing an OF method to acquired image frames. The solution is sensitive to the DVF bordering values. A region subjected to landslide can be related to one or more regions of interest (ROIs), which helps determining the important portions of the frames. Only changes in the ROI image are used in the calculation, and other areas are ignored.
Once the ROI is defined, series of sequential operations are applied to the preprocessing landslide detection system (such as gray conversion, normalization, etc.) to lessen noise and processing complexity. Figure 5 illustrates the matching (8)–(9) between frames acquired at different instants, and the analogous problem is essentially ill-posed, and as is the case with OF, the offset vector is obtained by optimizing the matching between windows centered on point M1 (the ROI) acquired at t1, and a same size search window in the second frame. The window must be sufficiently large to contain enough texture to solve the matching problem, i.e., to find the vector d associated with the segment M1M2.
Aboveground images help landslide studies [27] and terrain interpretation, for both qualitative, and quantitative information analysis.
To recognize landslides, the interpretation relies on morphology, flora, and drainage. Diagnostic surface procedures can be related to certain motion types, the degree of activity, and the movement depth. The study of image frames can provide data on the progressive evolution of landslides and improve the knowledge about their causes [27]. GIS facilitates image archiving, and the production of maps that stem from the data interpretation. Modern photogrammetric software encourages a greater use of above the ground images for the creation of high-quality differential DEMs that will quantify landslide movements.
Terrestrial-based digital photography is also an efficient method to create DEMs and capture geological structures of rock slopes. The DEMs can produce sections, as well as estimate volumes to help to devise remedial measures. This technology saves time and effort, but it does not replace field mapping. The technique works best for slopes without vegetation and, under good conditions, can yield DEM’s equivalent to those created by LiDAR systems [28,29,30,31,32].

4. Emergency Response (ER) System Design Issues

Figure 6 illustrates an Emergency Response (ER) scheme following the Cyber-Physical System (CPS) model called ER-CPS. Sensors observe the environment and actuators alleviate natural and human made disasters in underprivileged regions [20]. The ER-CPS can use salvaged electronic parts and assist distant and underprivileged locations [19,20].
ER has to handle threats against health, public security, welfare, environment protection, and infrastructure. Still, this reaction requires the nodes to cooperatively assess the conditions and rapidly notify the responsible systems, authorities and experts [19,28] on significant events.
Figure 7 illustrates the data processing stages of an ER-CPS. Stage 1 collects, manages, and fuses data from sensors, maps, DEM data, field observations, among other information, to generate input data integration, reports, some assessment, and data visualization. Stage 2 develops a more detailed geotechnical model containing mined knowledge combined with the Stage 1 outputs. Stage 3 uses the output from the previous stage for decision-making that will control the VSAN nodes.
Landslide hazards are largely ignored or under considered during planning [33]. A way to decrease the landslide impacts is to intensify awareness via warning systems (Figure 8). Effective and opportune landslide monitoring can cut the casualties and economic loss [32,34]. The effectiveness of landslide monitoring systems is highly sensitive to the detection and monitoring methods used. Therefore, incorrect observation increases the number of false alarms. To diminish the loss of human lives and assets, an ER-CPS can also apply image processing to the images captured by a camera mounted in the site that is exposed to mudslide.
Since landslides affect the normal community life, potential threats rise. This phenomenon may influence safety and may also reduce the bearing pressure of some slopes’ sections. As proper and timely warnings increase the immediate response efficiency from the manager, energy consumption and environmental damage can be reduced.
Landslide warning approaches rely on meticulous site-specific studies and motion monitoring [35], or on statistical models [36,37], in which a minimum or maximum threshold level of some quantity is set for a phenomenon to occur [38]. This conceptually or empirically set threshold relates to the solid moisture, rainfall, or hydrological conditions that, once reached or exceeded, cause landslides [17,39,40,41].
Although statistical analysis indicates that the rainfall and the intensity-duration thresholds have the power to spot rainfall conditions that can prompt landslides, factors such as storm, type of soil, ground vibration, and so on reduce reliance and degrade data quality [42,43]. Furthermore, deficiencies in homogeneity and completeness, mudslide timing, rainfall data resolution, and rain measurement location significantly influence the data quality and cause false alarms [44]. Proper reaction to landslide is the most important key for a disaster management scheme. In that matter, timely data acquisition from reliable sources is a crucial requirement. Consequently, the traditional manual monitoring methods cannot be efficient, because of the lack of real-time evidence. For instance, radio, and internet can broadcast the warning messages to some sites [42].
The ER-CPS aims at reducing the disaster likelihood and increasing landslide safety by refining the detection and surveillance phases via image processing of the area subjected to landslide. To perceive the landslide, a program investigates the image frames, observes the area conditions and sends data to the control center according to the landslide degree. Figure 8 presents the flowchart of the ER-CPS software architecture.
The ER-CPS is twofold: (a) landslide detection involves sensing and categorizing the landslide impacts; and (b) data dissemination delivers the landslide information about items that can influenced by a landslide. The distance between the camera and observed zone hinges on the camera lenses.
Once the total variations surpassed fixed thresholds, cautioning messages will be sent where these thresholds are set on based on engineering knowledge and the landslide possible effects.
The evaluations have four landslide scenarios of varying impact levels whose messages were termed No Risk (NR), Slight Risk (SR), Moderate Risk (MR), as well as High Risk (HR), respectively.
Nowadays, a large number of applications and approaches in landslide watching have focus on the internet for information dissemination about the specific ROI. The VSANs need appropriate network connections, due to the multipurpose features leading to landslide. The proposed ER-CPS may commonly be classified into two main types of services: (i) warning services, including data on environmental conditions, announcements, video streaming, and internet services; and (ii) security related services, comprising site closure data and, usually, urgent information systems. Hence, in the ER-CPS, the warning message is to be broadcasted to places in the second cluster. This ER-CPS does not deeply concentrate on the propagation of warning messages, but focuses mostly on the detection stage.
The side units (SUs) are the closest to the management center. Once a landslide is detected, an alert has been to be sent to the target area to reduce disaster likelihood and increase security. Besides, landslide data are sent to the management center for supplementary actions consisting of four levels of messages (NR, SR, MR, and HR) to immediate response.
Broadcast packet delivery in the proposed the ER-CPS takes into consideration that several assets can be affected by the landslide hazards, and that there are several types of warning messages (Figure 8). The warning message procedure starts by detecting a landslide in target area. A packet structure contains Message Type (MT), Packet ID (PID), and Area Coordination ID (ACID).
The message type specifies the purpose of this cautionary message, to avoid any conflict with other broadcasted messages. The PID is a numeric value that is incrementally increased. The ACID specifies the 2-D coordination (latitude–longitude) of the start point and the end point of the targeted area where landslide occurred.
A landslide is a multifaceted process. Handling complexity customarily involves simplification into a process model (PM) that captures the essential features. Establishing the right process depends both on the site and the project specifications, which reinforces the importance of geotechnical engineering. This stage calls on interpretation of a number of related processes and undertakings.
Recently, new tools using geomechanical models have been applied to site characterization. Risk assessment and management tools evolve quickly because they are valuable for dealing with landslides both in local and regional settings. The uncertainty in geotechnical analyses can anticipate the environment behavior in engineered facilities [29].
The PM’s greatest uncertainties when modeling landslides rise from inadequacies in site characterization. ER and disaster management (DM) require information technologies, social media, strong collaboration/cooperation among multidisciplinary experts, local and national authorities, as well as community involvement. Effective forewarning, response, and recovery tools are called for in such systems [30]. The ER-CPS can have a huge number of sensor nodes (Figure 9) that interact rapidly and inform the control station about the changing conditions with robustness, effective resource deployment, adaptively, and correctly [31].

5. Design Considerations for Visual Sensor Actuator Nodes (VSANs)

For a given region, the ER-CPS can show the main existing threats, access their impacts, and inform imminent events. This analysis will also show the individuals and infrastructures that are most at jeopardy, and will permit evaluations of humanitarian and economic costs of possible events. This will permit the development of remediation policies and the identification of cases where remediation and daily activities can support each other. Figure 9 depicts sensor and actuator nodes (SANs) with a built-in controller that decides which actuators will perform a particular action, and how they interact properly [20]. Inherent functionality allows low-cost tools to detect particular environmental situations if off-the-shelf frameworks are not available. Efficient low-cost environmental monitoring technologies help to expand ER and DM.
Remote communication is related to the way devices share information, and developing a device that interacts with a user’s smartphone or tablet is attractive, which enables a low-cost device to monitor particular environmental conditions if such a tool is not available in the market. The real-time clock (RTC) functionality is important to guarantee that each data point can have a date/time stamp for future examinations when in search of correlations or associations with data from other instruments. The proliferation of high-quality low-cost environmental observing equipment helps to better understand disasters.

5.1. Sensors

Besides the sensor performance characteristics, understanding the target application and operating environment helps to develop smart systems regarding communications, power, and processing capacity. Energy harvesting technologies, together with low-power sensors and control units, like microcontrollers, allow reliable and robust environmental monitoring to supervise the conditions continuously.
When choosing a sensor for environmental applications, some important requirements are how frequently a reading should occur, if there is need for date/time stamps, human interface with the sensors for operation/maintenance, and to calibrate performance parameters of the sensors at the instrumentation level [45,46,47,48]. A flood detector senses motion and send alerts to prevent damage [49,50,51,52,53].
Figure 10 illustrates simple in situ motion detectors [10,11,12,49].
Figure 10a shows a PIR motion detector interfacing with an 8051 microcontroller to monitor local environment where if there is motion, then a LED becomes ON.
Figure 10b shows another type of in situ sensor that uses legacy components. The sensor and the MC68HC11 are interfaced by the AD654 VFC to ensure a linear relationship between the pulse period and the distance. The LCD can be of a generic type. Popular inexpensive distance sensors can integrate an IR emitting diode, a linear CCD array, and the microcontroller. The DC voltage VS depends on the distance D to be detected in a nonlinear manner [46].
Optical mouse (OM) integrated circuits (ICs) (OMICs) (please, refer to Figure 11) are used to measure OF [13,45,47,48]. ICs that exploit OF to detect motions using computer mice OMICs are used in navigation of small flying robots. The OF concept uses image textures as motion cues and are motivated largely by the vision systems and brains of insects.
OF is very effective to avoid obstacles and to control altitudes and speeds in robots. Previous experiments using OF in navigation involved HR image sensors, and computers tailored for image processing. These large, complex, and computationally expensive systems were not readily scalable. When OMICs are paired with adequate lenses, the result are precise, small, light, fast, and cheap motion sensors.
The present development (Figure 11) exploits the recent proliferation and commercial availability of OMICs. Each OMIC includes a low-resolution (16 × 16) array of photo sensors, and circuitry that compares adjacent image frames to compute the 2-D OF, similarly to that of an element in an insect’s compound eye. The OF is used to track the computer mouse movement. In a drone, the OF serves as a measure of the 2-D velocity relative to nearby surfaces and objects. OMICs offers advantages such as low mass, compactness, low power demand, low cost, redundancy, high speed, and parallel processing.

5.2. Actuators

Sound and visual alarms, water drainage systems, servo-mechanisms that interact with the environment, message broadcasting units, unmanned aerial vehicles (UAVs), pan/tilt cameras, robotic arms, etc. are examples of actuators that can help ER and DM.
An important characteristic of actuator scheduling in CPSs is the reversibility or preemption of operations. If an actuation is performed using erroneous data, it may be often very challenging or impossible to undo the activity [54]. Moreover, non-reversibility disturbs real-time scheduling when several jobs are managed on the same shared platform. Even inflexible real-time tasks may be obstructed by low-priority processes, if a shared actuator access cannot be preempted or reversed [55].

5.3. Video Camera and OMICs Motion Detection

In video surveillance, MD refers to the ability of the reconnaissance system to perceive motion and identify events. MD is usually done via software, which signals to the camera when it detects motions to start capturing the event (also known as activity detection), and to investigate the motion type to see if it deserves an alarm.
A prototype system can measure the 3-D relative coordinates of the objects of interest. The arrangement includes a video camera mounted in a known position and orientation in the working site, and a computer running image processing software. This easy to operate system can have a much lower cost, with less accuracy. Unlike laser tracking equipment, it does not pose a hazard of laser exposure.
Camera images are digitized and used to extract all usable objects in the field of view. Each object’s 3-D coordinates are the pixel coordinates of the targets in the images to ameliorate accuracy. The system has to have a unique design with corresponding filters for several different targets that is robust and tolerant of broadly varying illumination conditions, fields of view, and changing background imagery [47].
The outputs of several navigation sensors would be fed to a control unit (CU) (see Figure 11) that would combine OF data to find the motion relative to the environment using a hierarchical control architecture. This CU would communicate with a master CU that would associate facts from various sensing subsystems, define the priority to be given to each subsystem data, and relay control information to disturb motion.
The control functions to be implemented include terrain tracking, holding altitude, evading hazards, navigation by landmarks, stabilization of flight, as well as smooth landing. Insects lack stereoscopy but they can estimate distances to possible obstacles and other items from motion cues. Computationally, an OF-based strategy is simpler than stereoscopy to avoid hazards and to track terrain. Hence, OF can be used to design vision-based subsystems that are more compact, light, and low-power than other subsystems, with equivalent ability based on conventional stereoscopy.
These control loops for maintaining altitude and/or stabilizing attitude would contain optoelectronic hardware, including elements of the OF computation. The system control laws enable a smooth landing with insignificant computation. The forward speed and decent rate are reduced simultaneously, and are equally close to zero at landing. No understanding or measurement of instantaneous height or speed above the ground are required.
Figure 12 illustrates a flow chart for this process [56]. The need for accurate photos are common, and geographical information systems (GISs) are shown inside a dashed blue box, and will not be discussed in this manuscript.

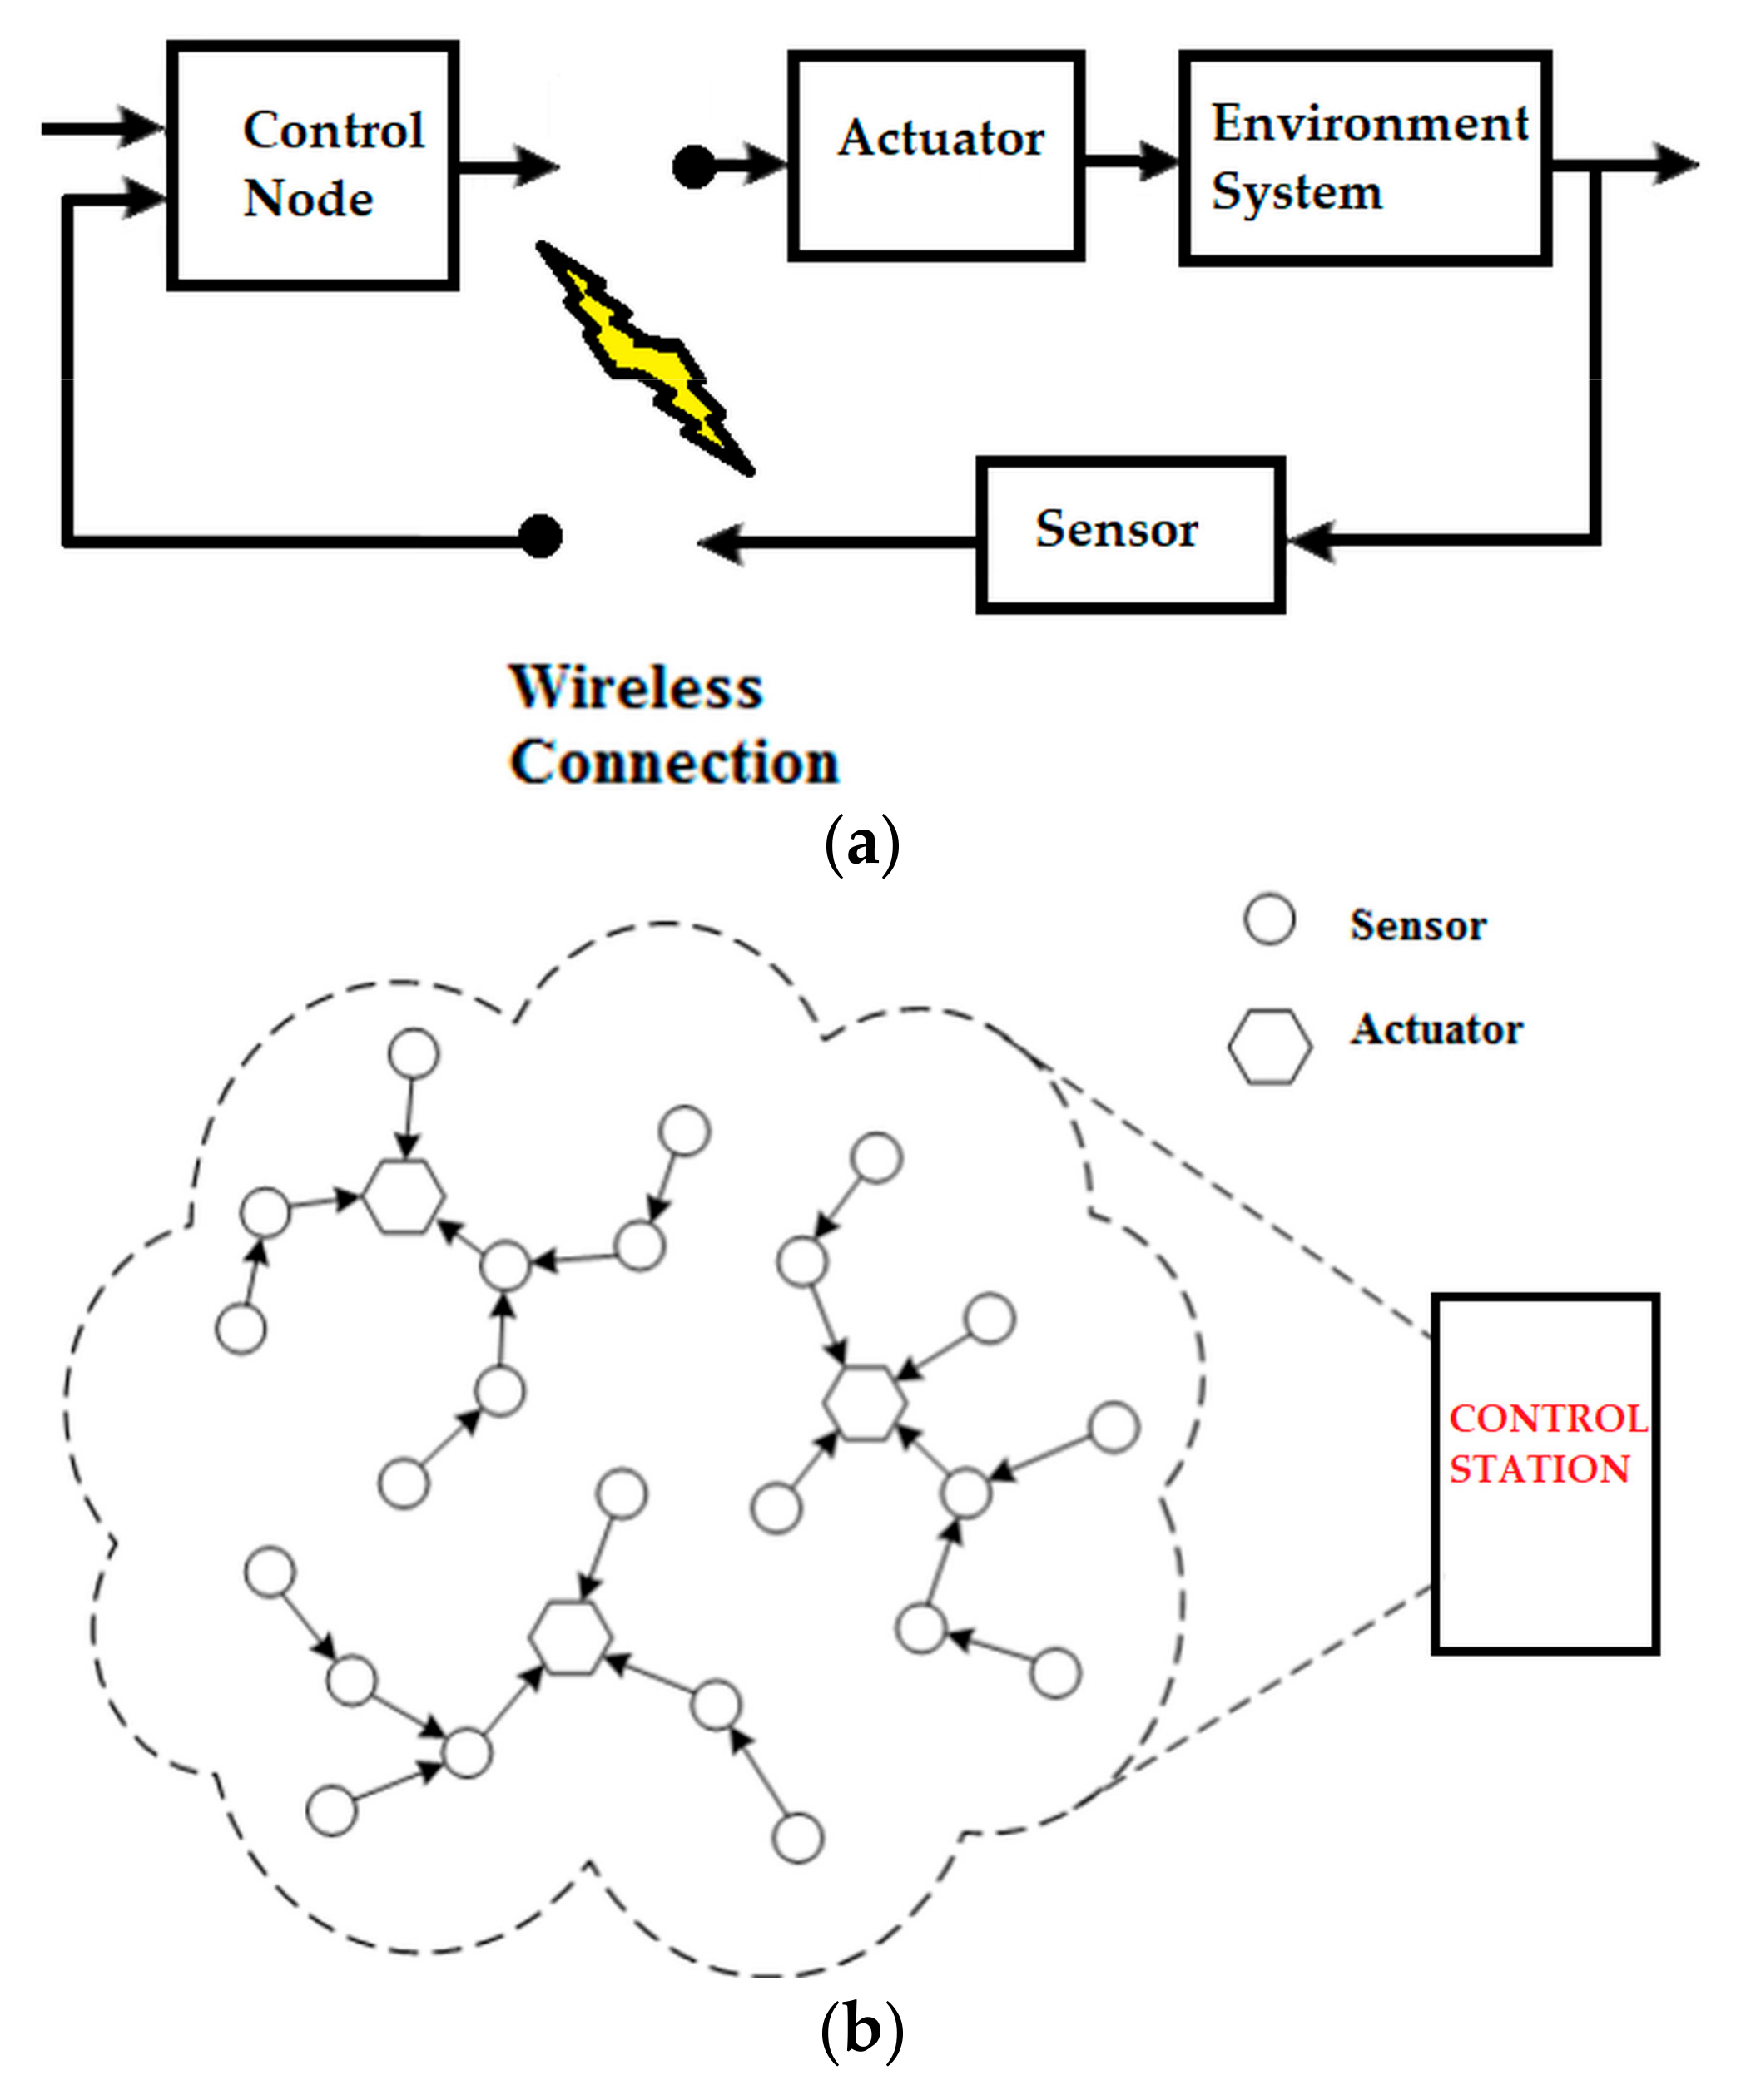
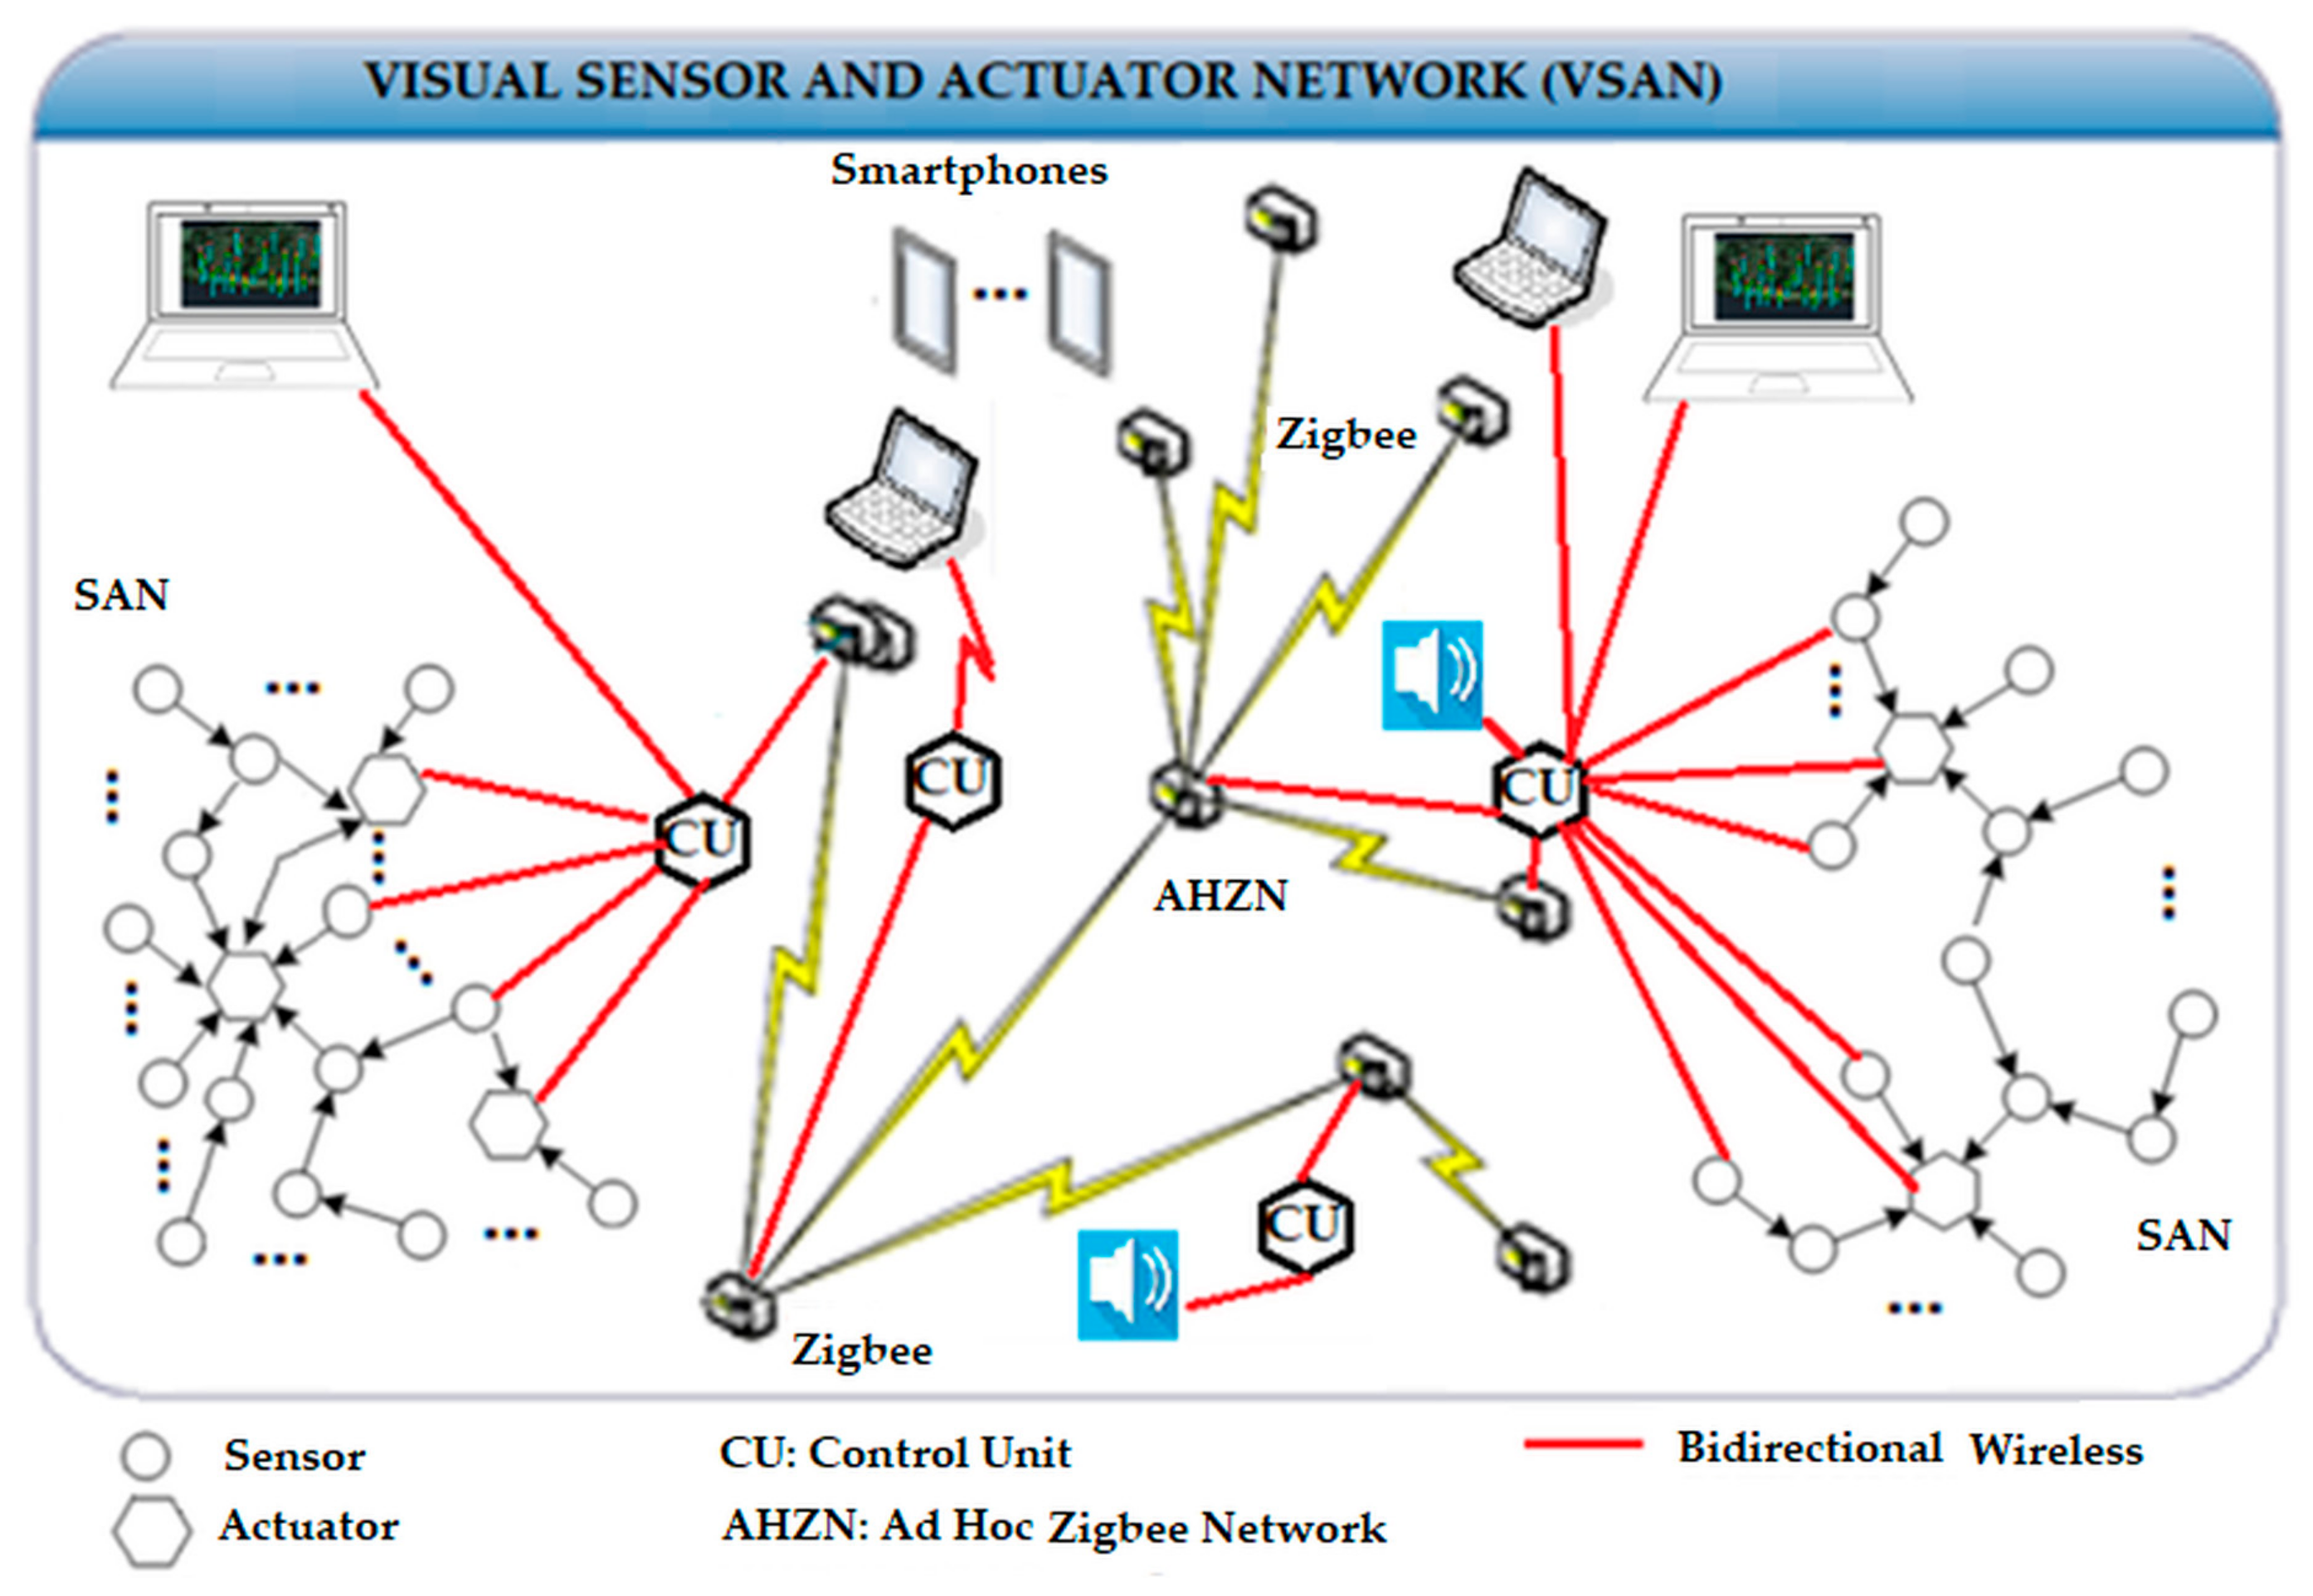
5.4. Visual Sensor Actuator Nodes (VSANs)

Resource scheduling in sensor and actuator networks (SANs) is a difficult task, and it plays an important part in CPS operation, since actuation coordination is crucial to choose which actuators must be selected for a particular action, or to control actions appropriately. Various parameters, like actuator abilities, task completion time, real-time warranty, actuator energy consumption, and the physical system necessities must be taken into consideration during control task allocation [20].
Salvaged components can be used to build VSANs, with each node comprising of several kinds of in situ sensors [21,28,57], such as circuitry from optical mice to identify motion via OF and landmarks. Some re-engineering to help design and to solve challenges could be done to handle communication interfaces like ZigBee and Bluetooth combined with green energy tools [58]. The resulting low-power low-cost nodes with sensing, data processing, and communication abilities acquire images, process them, and exchange the extracted information with other nodes and some control station for further analysis. Regrettably, the massive amount of data obtained from several VSANs and processed by the control units of other parts of the ER-CPS limits the decision-making strategies. The number of sensors installed to study different types of phenomena may be of the order of hundreds or thousands.
A typical VSAN controller (refer to Figure 11) has a microcontroller, some memory, while it processes and exchanges data during small active time intervals. A VSAN has long idle periods when it listens to the channel, and it tries to save its energy consumption, so that it can work for a sufficiently long time. It is convenient to design VSANs with low-power characteristics, even though tasks like information capture, processing, and communication will demand more energy.

6. Case Studies

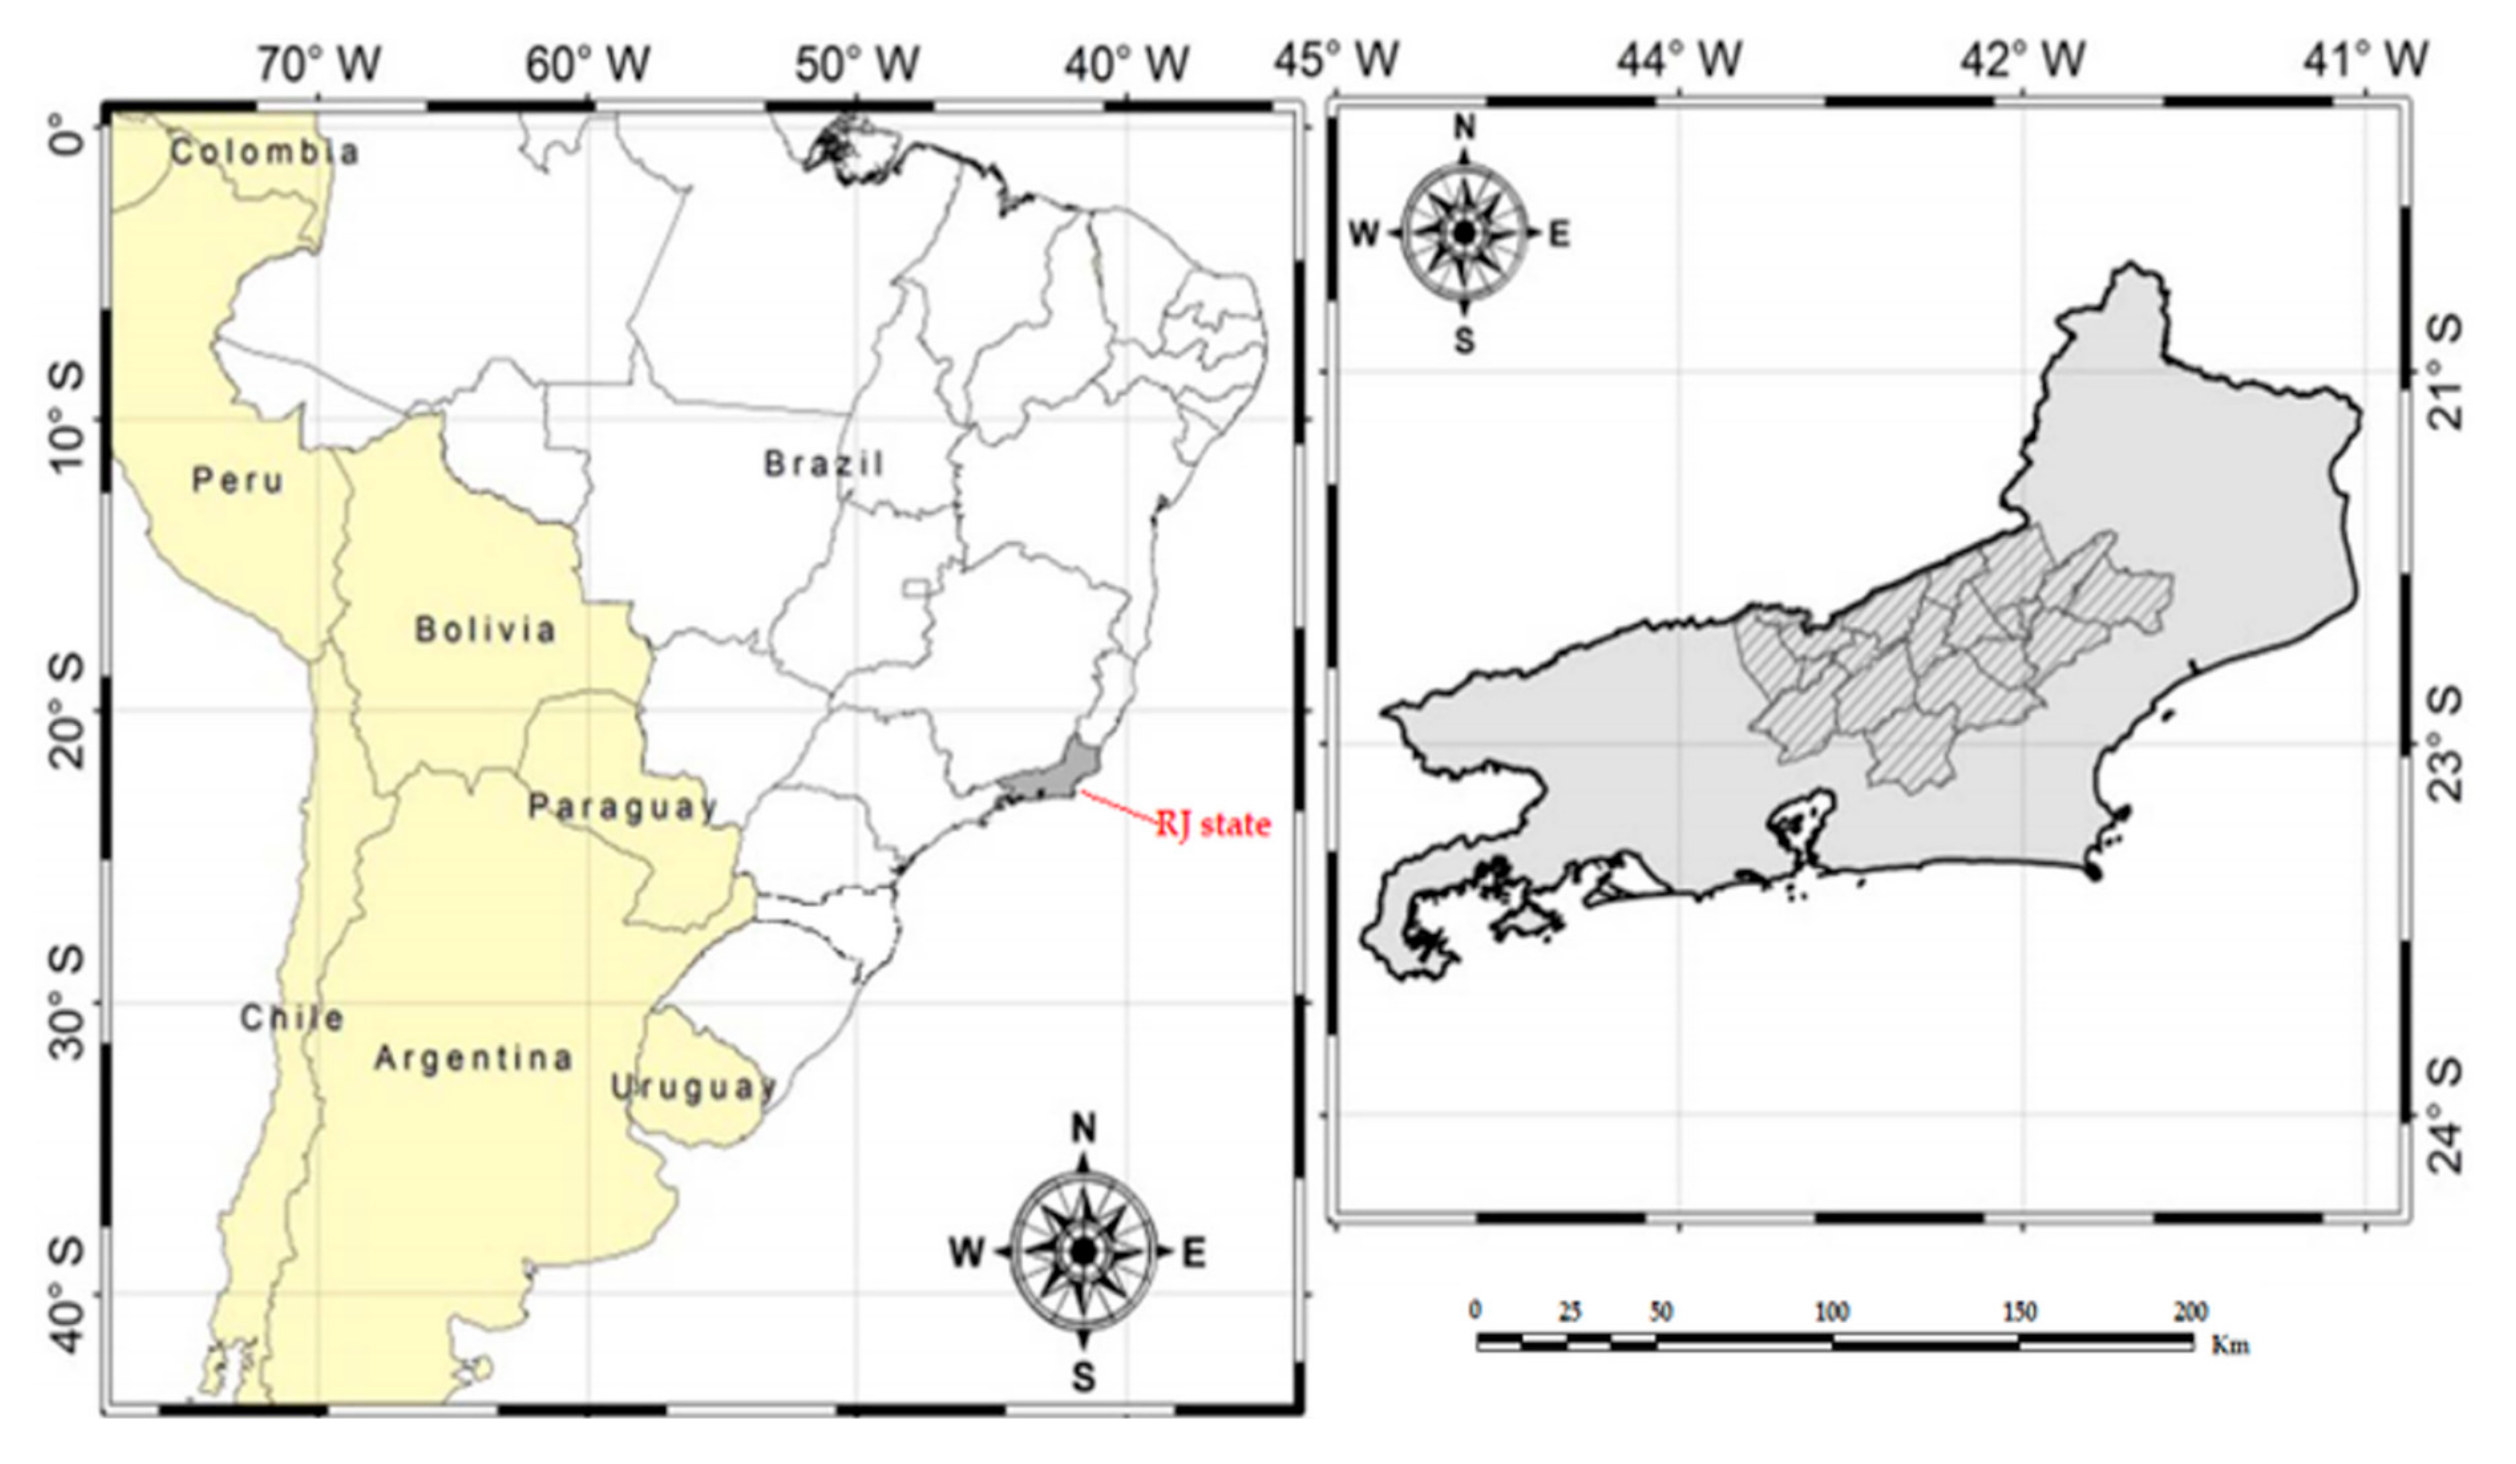
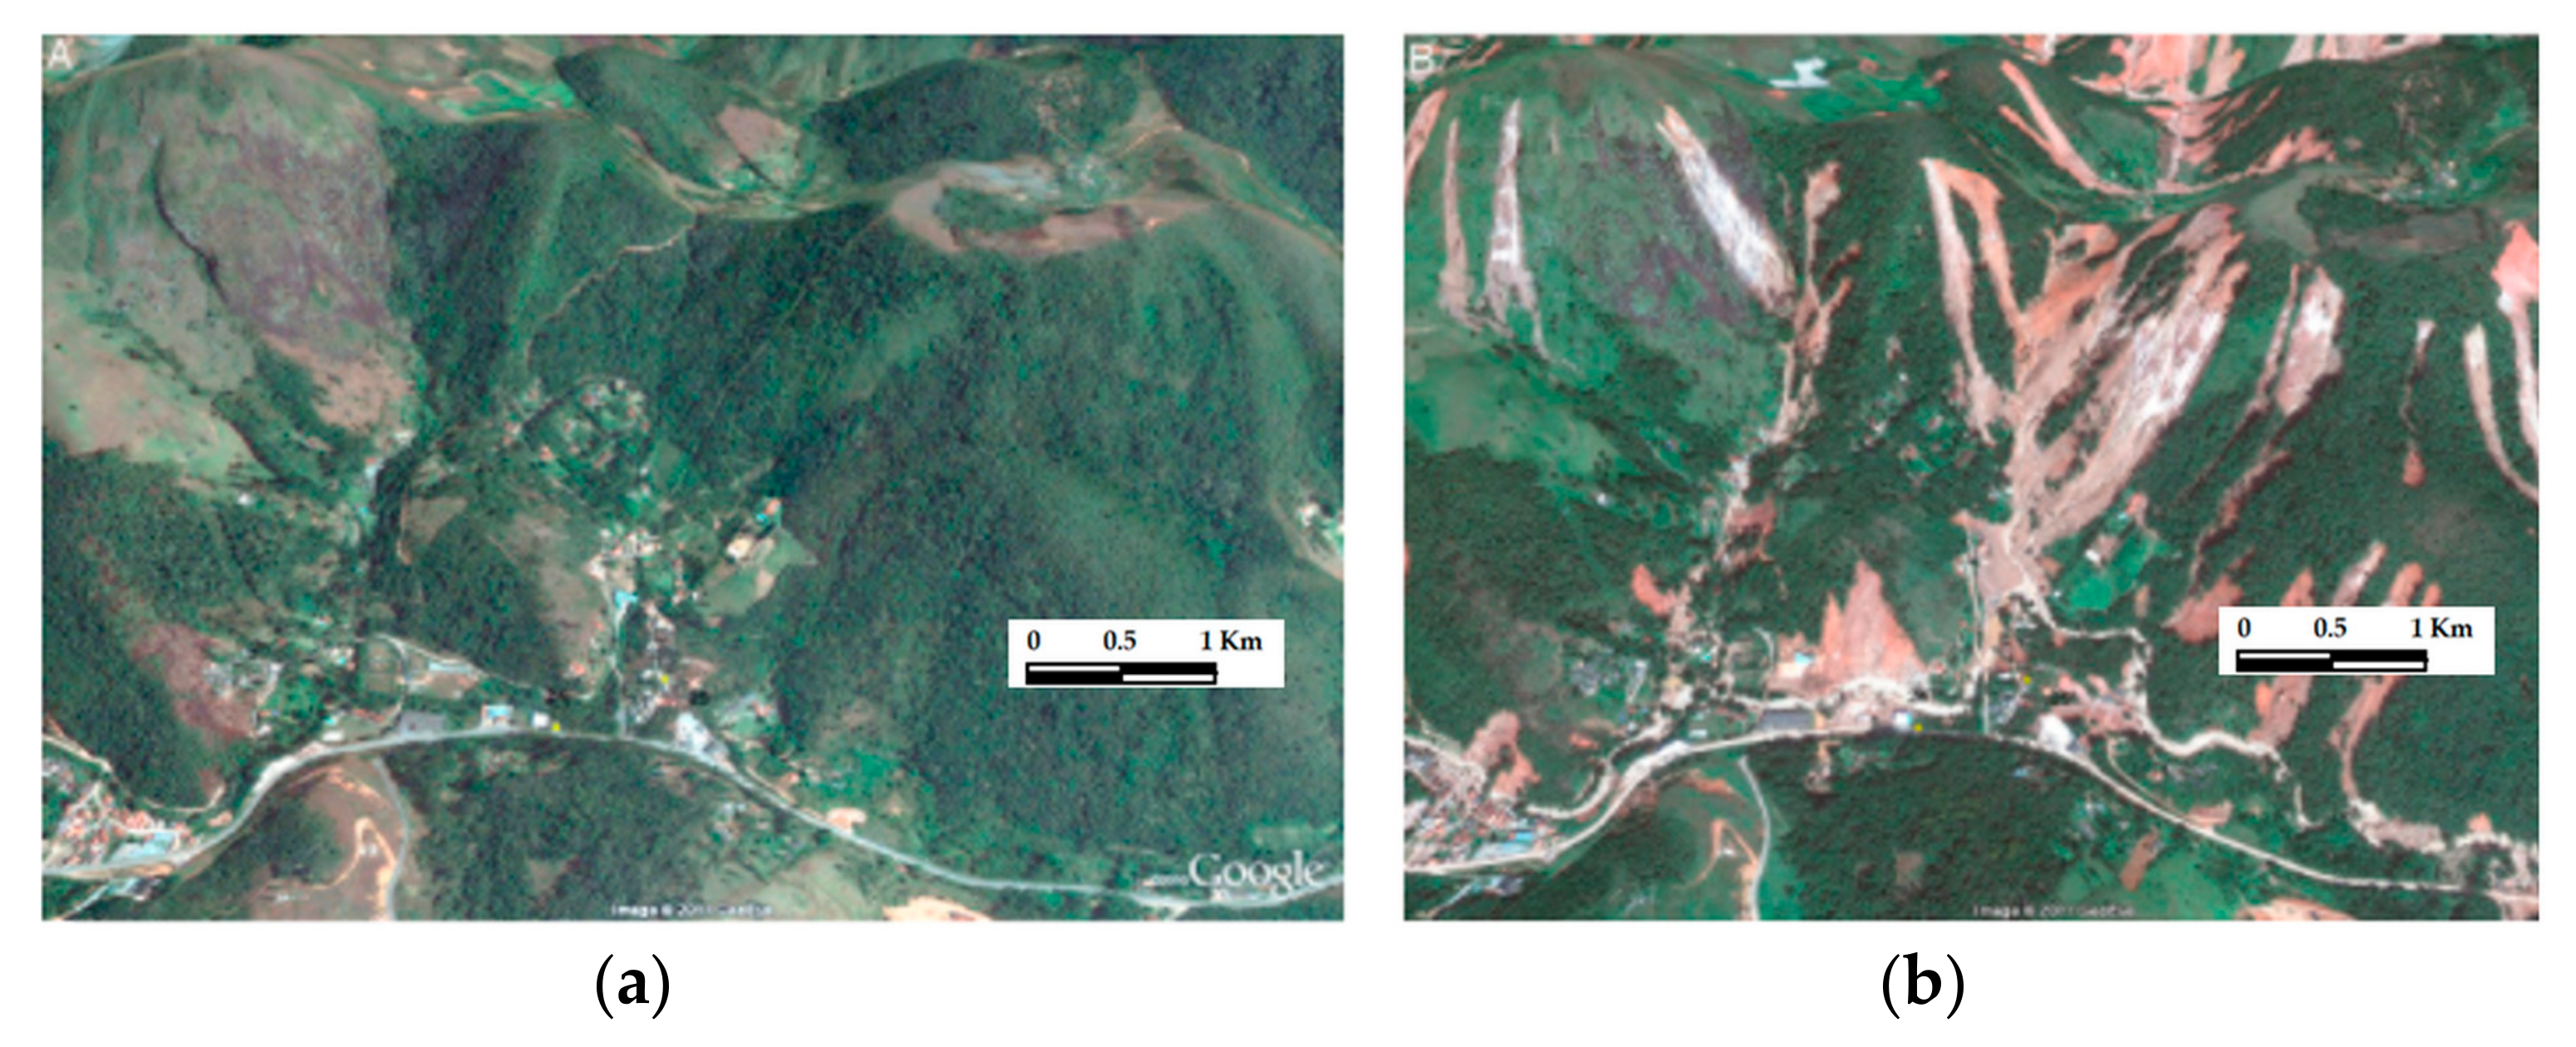
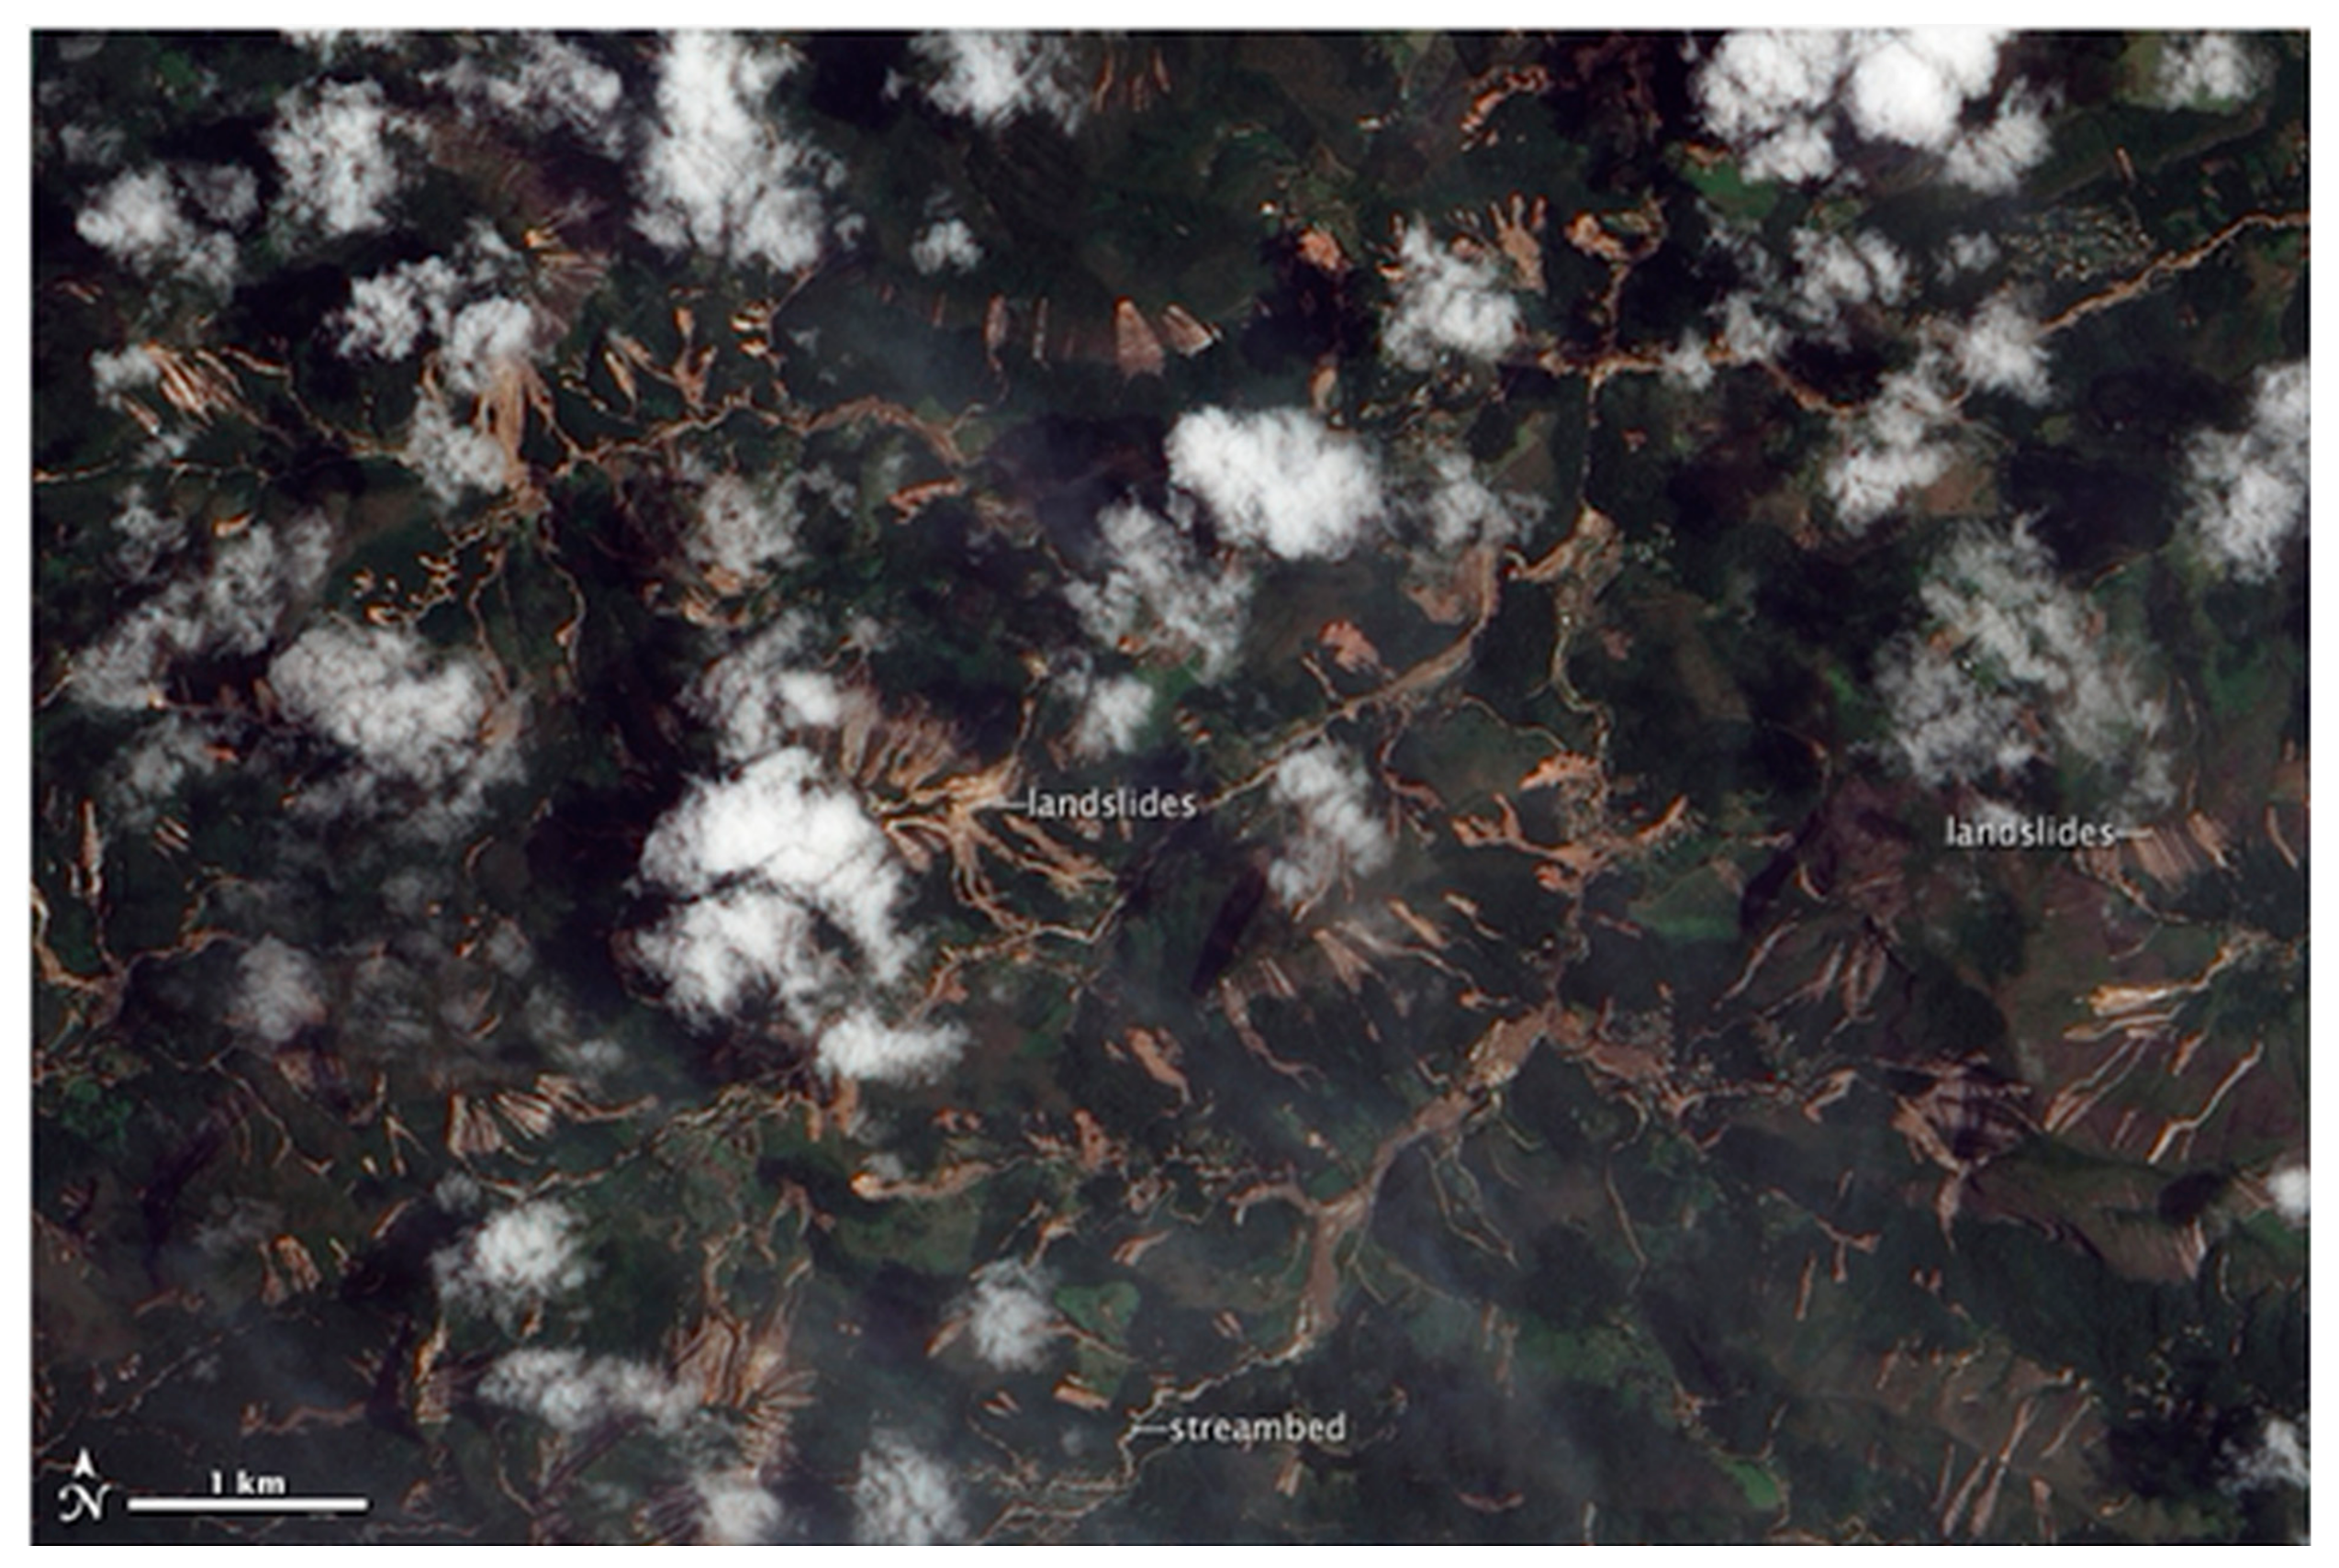
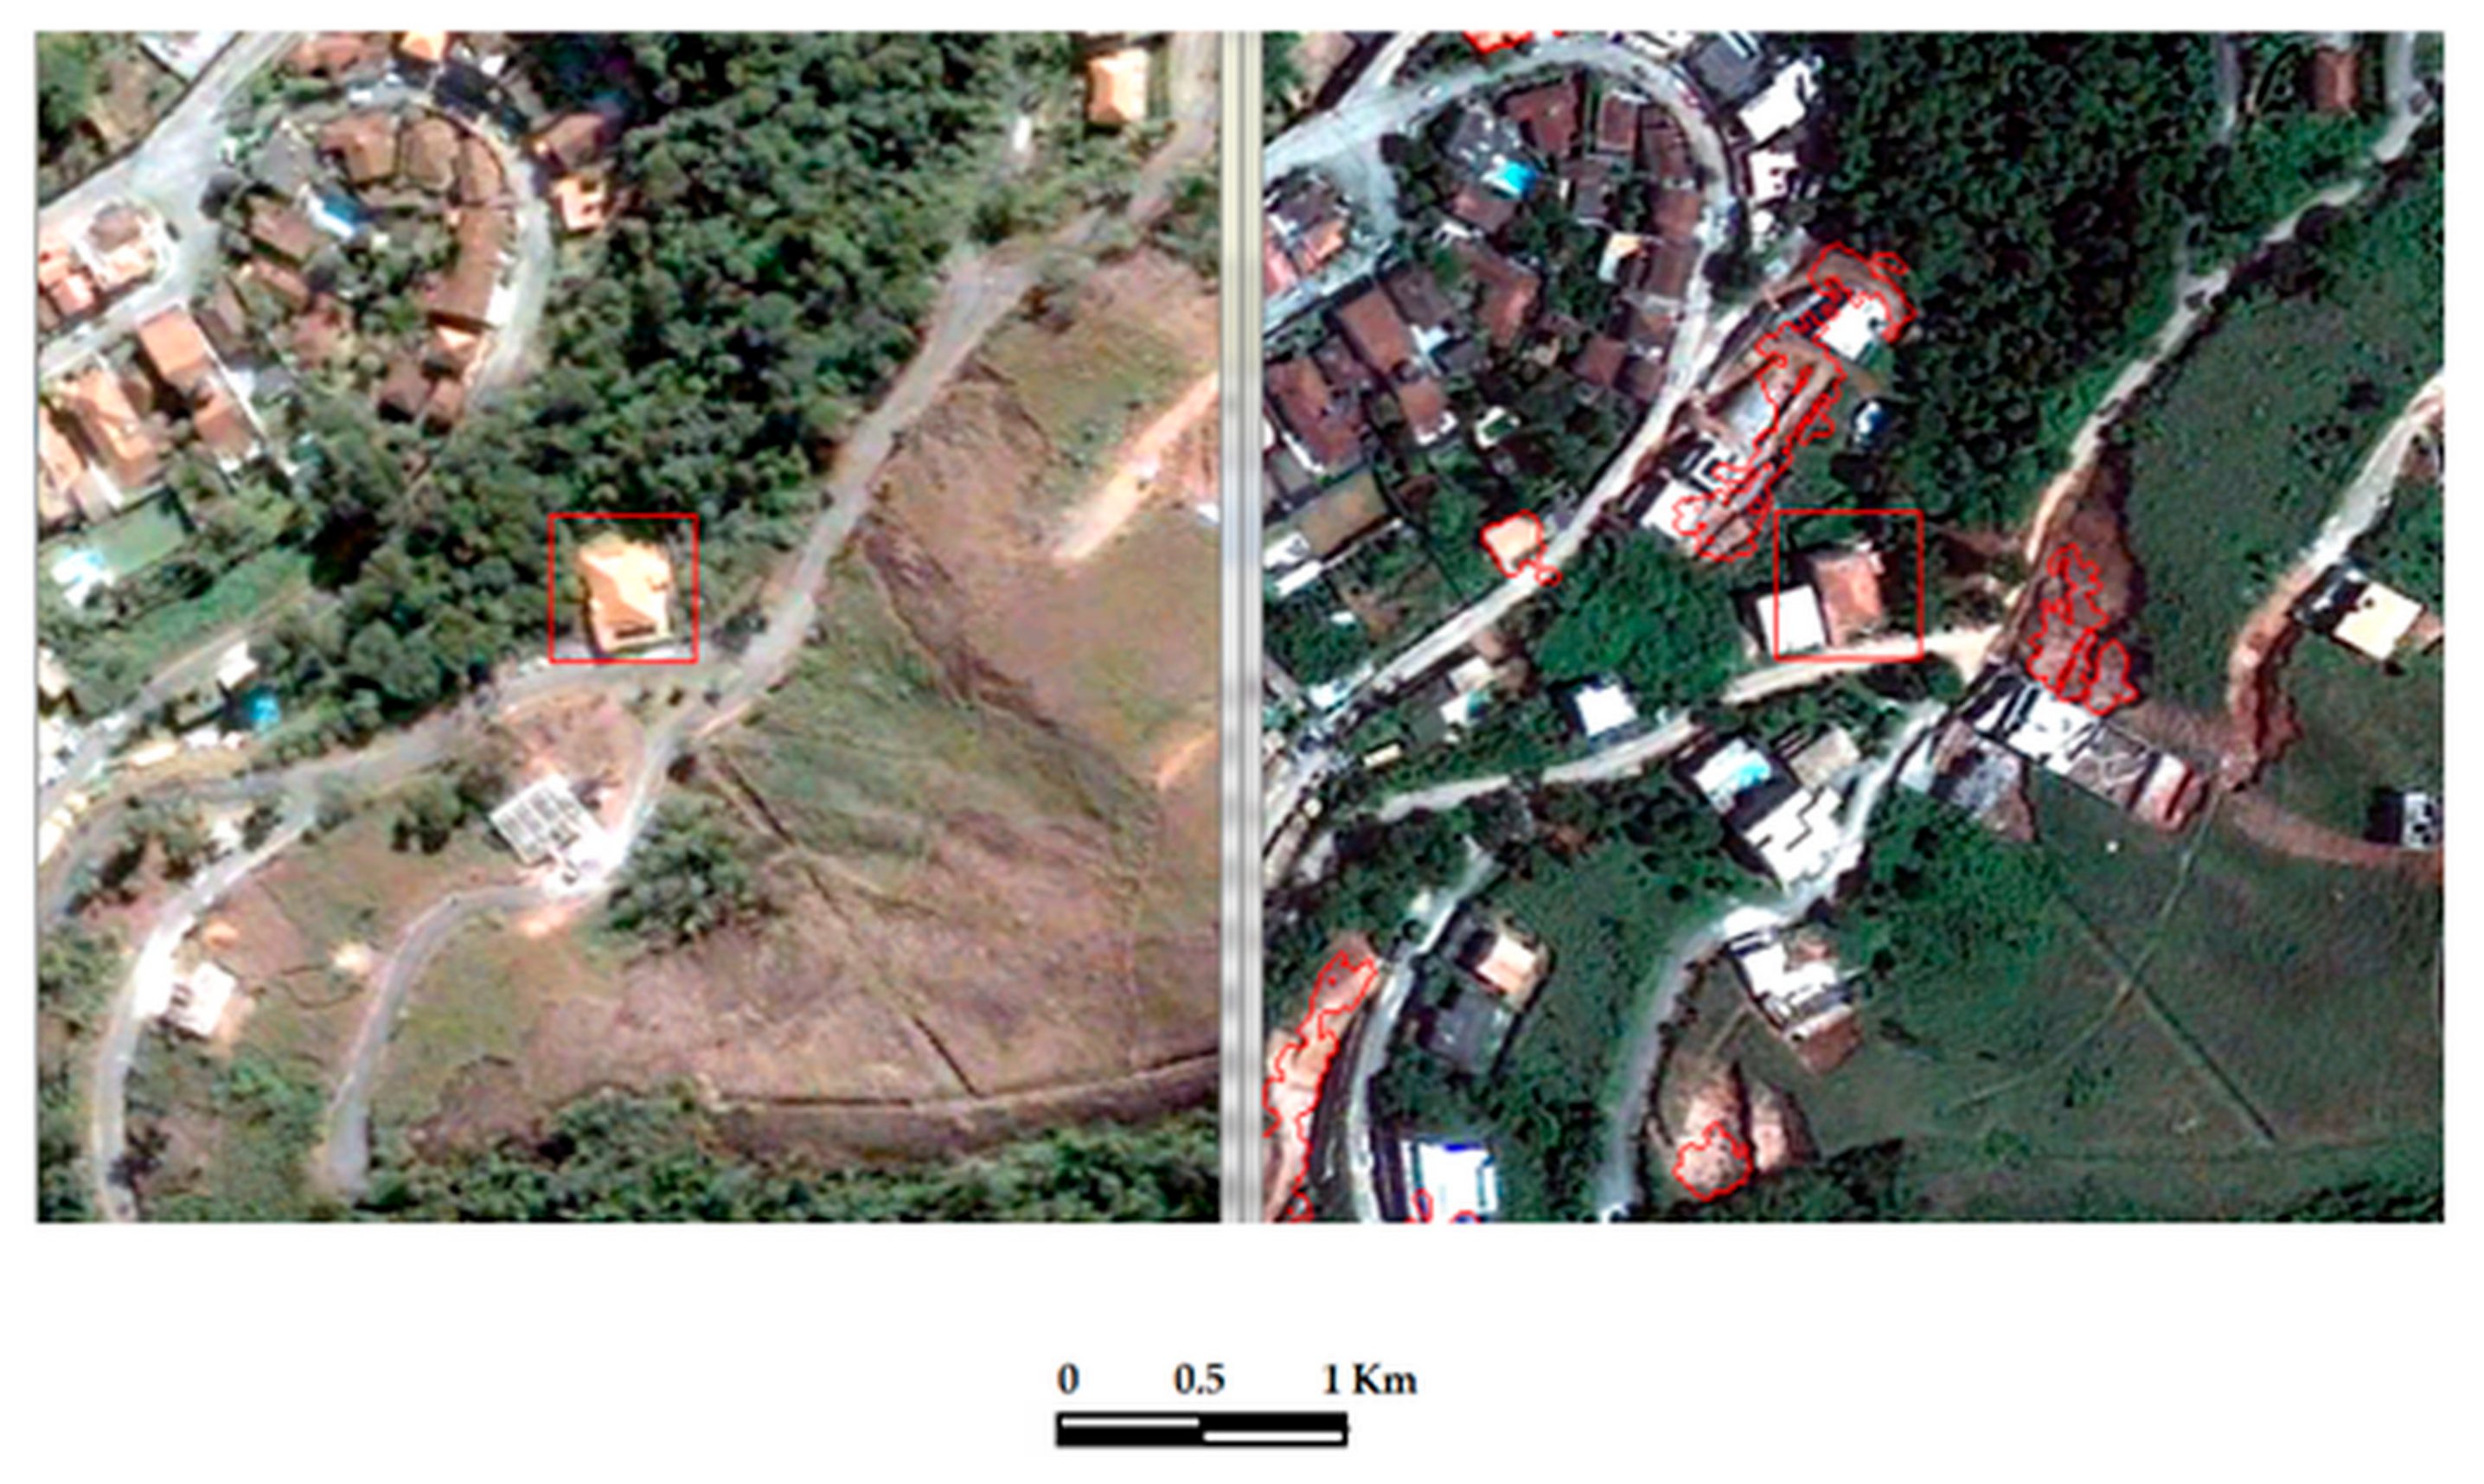
6.1. Case Study 1: Mudslides in Mountainous Region of Rio de Janeiro State

In January 2011, floods, mudslides, and landslides took place in several municipalities of the mountainous districts of the Rio de Janeiro (RJ) state (Figure 13), Brazil. Most human casualties happened in cities from the Serra dos Orgaos national park, which is a tourist attraction, due to its geographic topographies, historical landmarks, and pleasant temperatures. However, many buildings are subject to landslide hazards because of the steep territory and lack of sound engineering practices. The most critical watercourse, the Santo Antonio River, inundated the region. Nova Friburgo was the devastated city; Teresopolis and Petropolis also endured extensive damage and loss of lives. The cities of Sumidouro, Areal, and Sao Jose do Vale do Rio Preto also were hit, as the Preto and Piabanha rivers rose [2,3].
Figure 14 shows two views of the same slope before and after the 2011 heavy rainfall in the mountains of RJ state that killed hundreds of people and dislodged thousands, predominantly in hilltops, steep slopes, areas surrounding lakes and riverbanks. The image on the left displays a region before the landslide and on the right after the 2011 heavy rainfall [24,58,59,60].
Between the 24 h period from 11 to 12 January 2011, the rainfall exceeded what was projected for the entire month of January, so that flooding and landslides followed immediately. The disaster caused extensive property damage, and the supplies of public utilities (e.g., electricity, running water and telephony) were affected (Figure 15). The majority of deaths happened in poverty-stricken zones, and the impact could have been more bearable if not been for the poor conditions and lack of strategies for emergency mitigation/prevention in Brazil’s slums, which led some to describe the disaster as more human-made than natural (Figure 15).

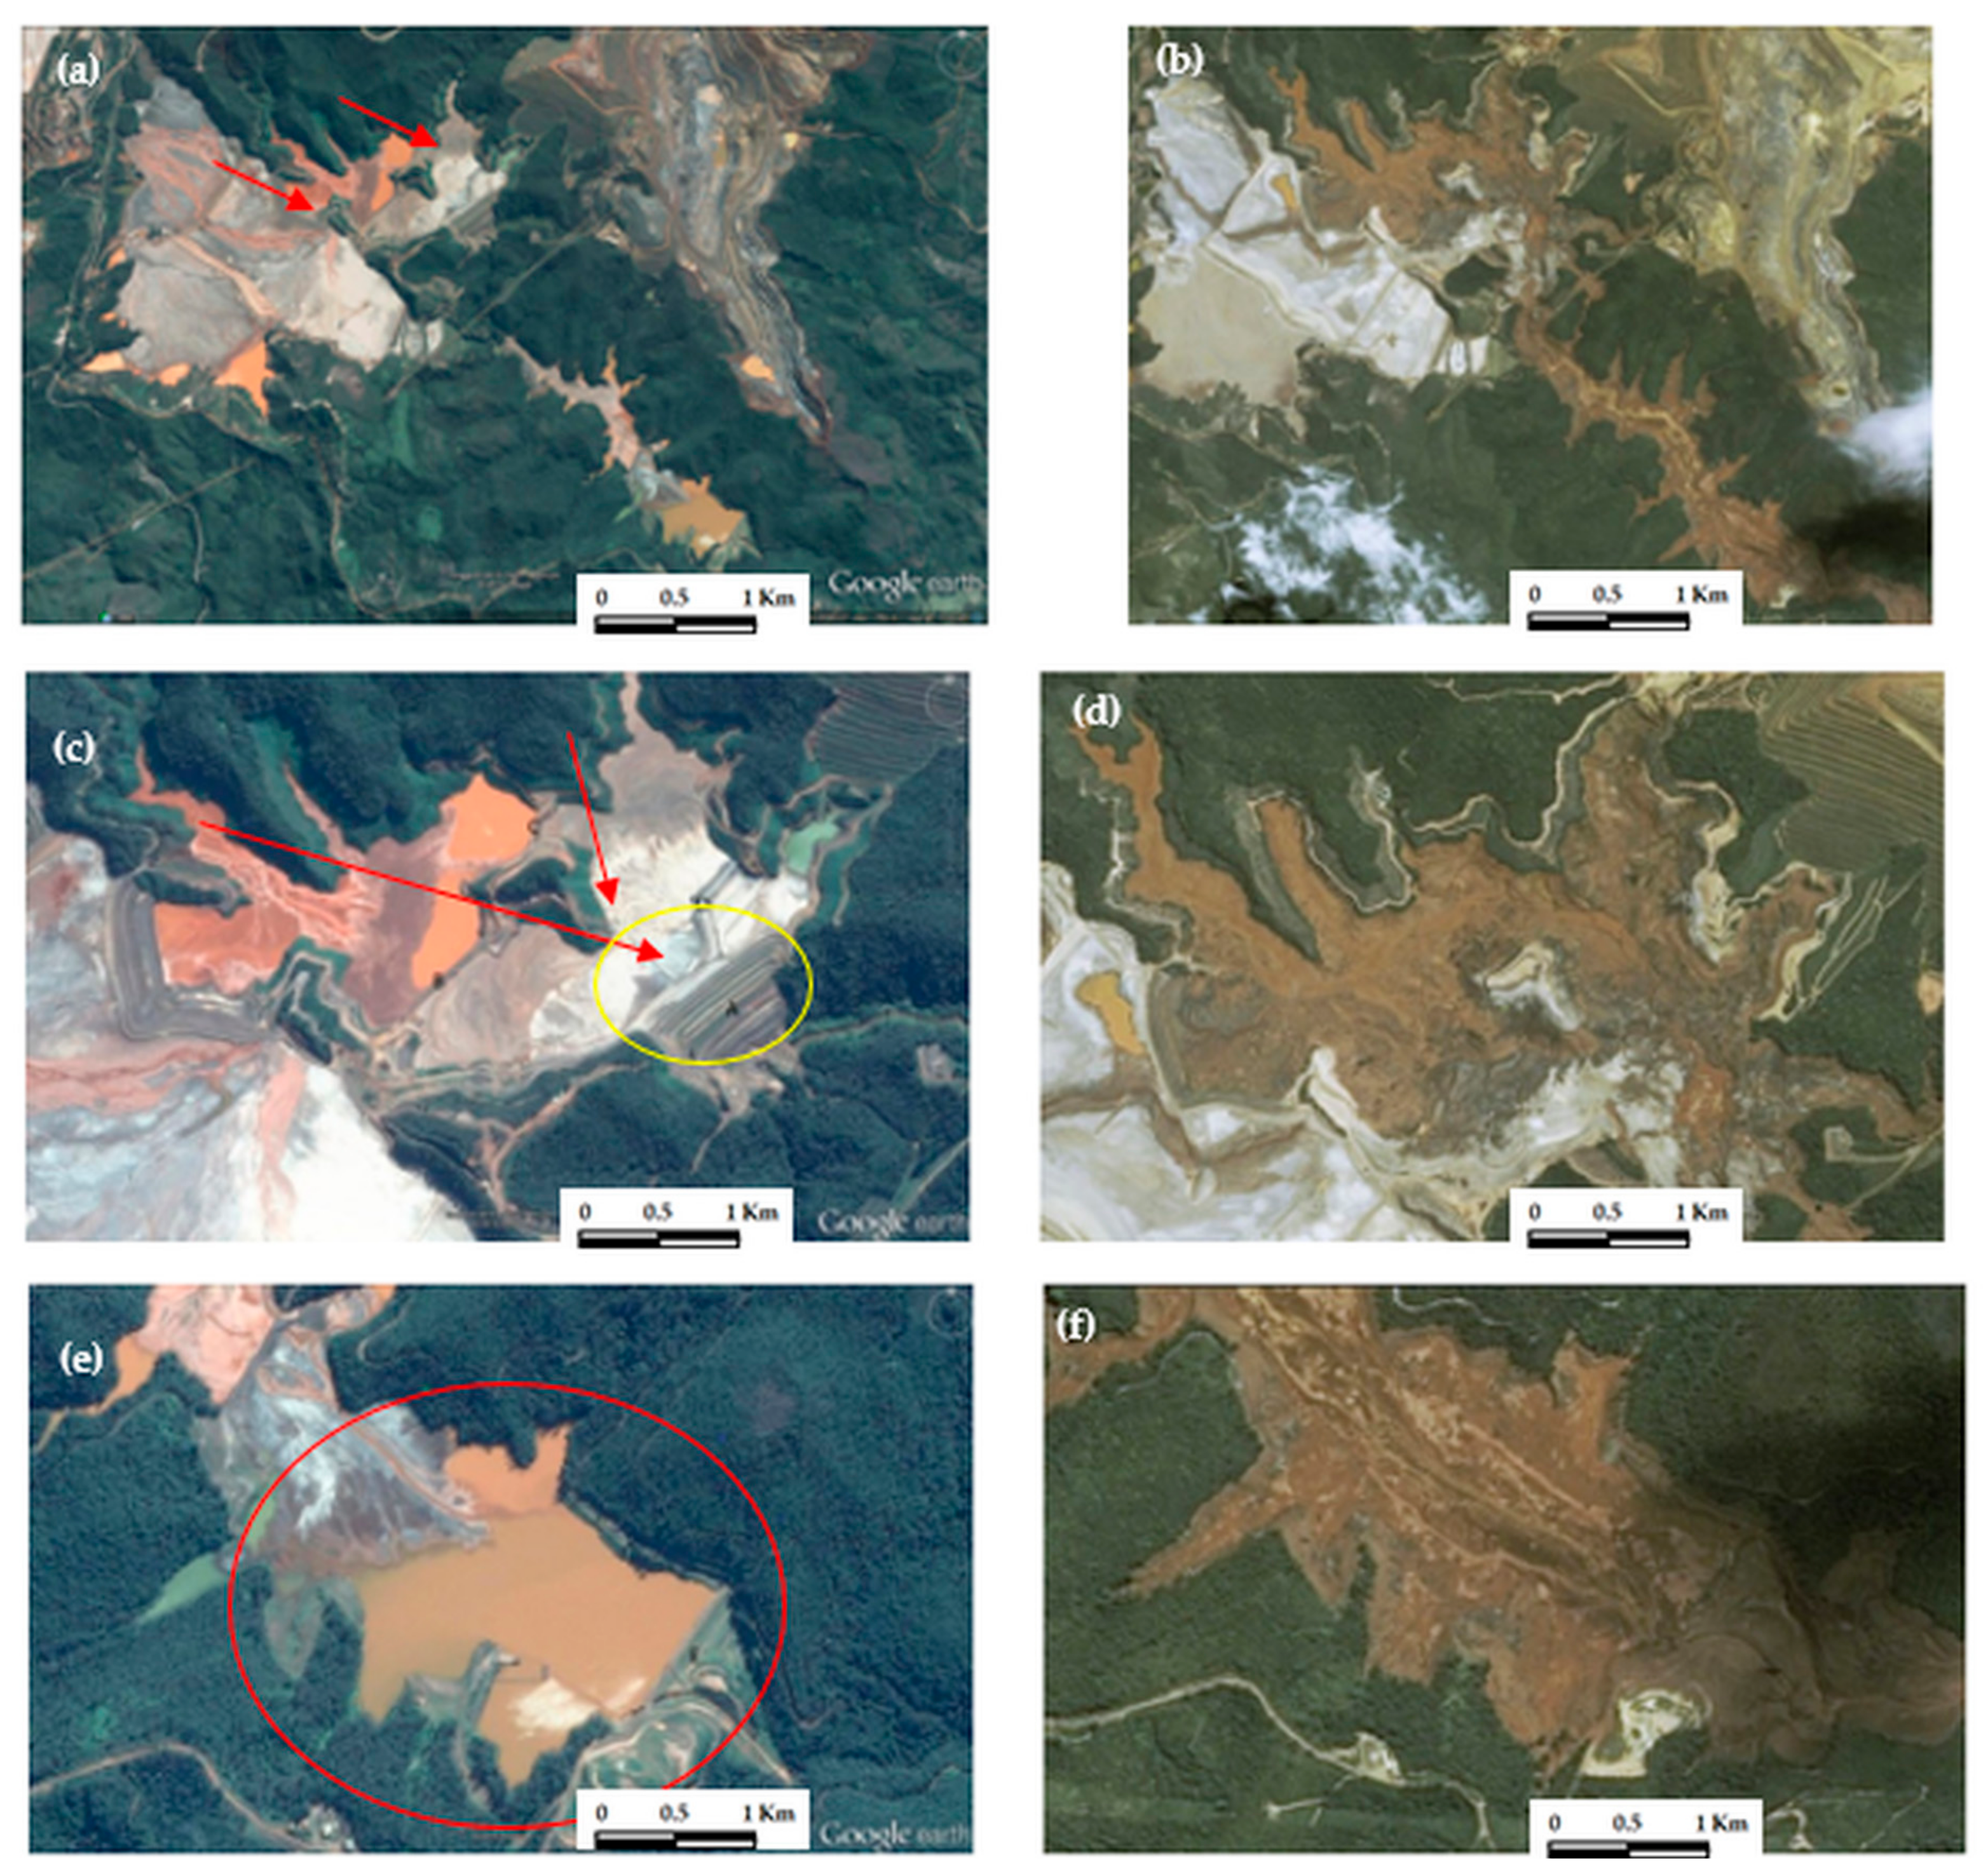
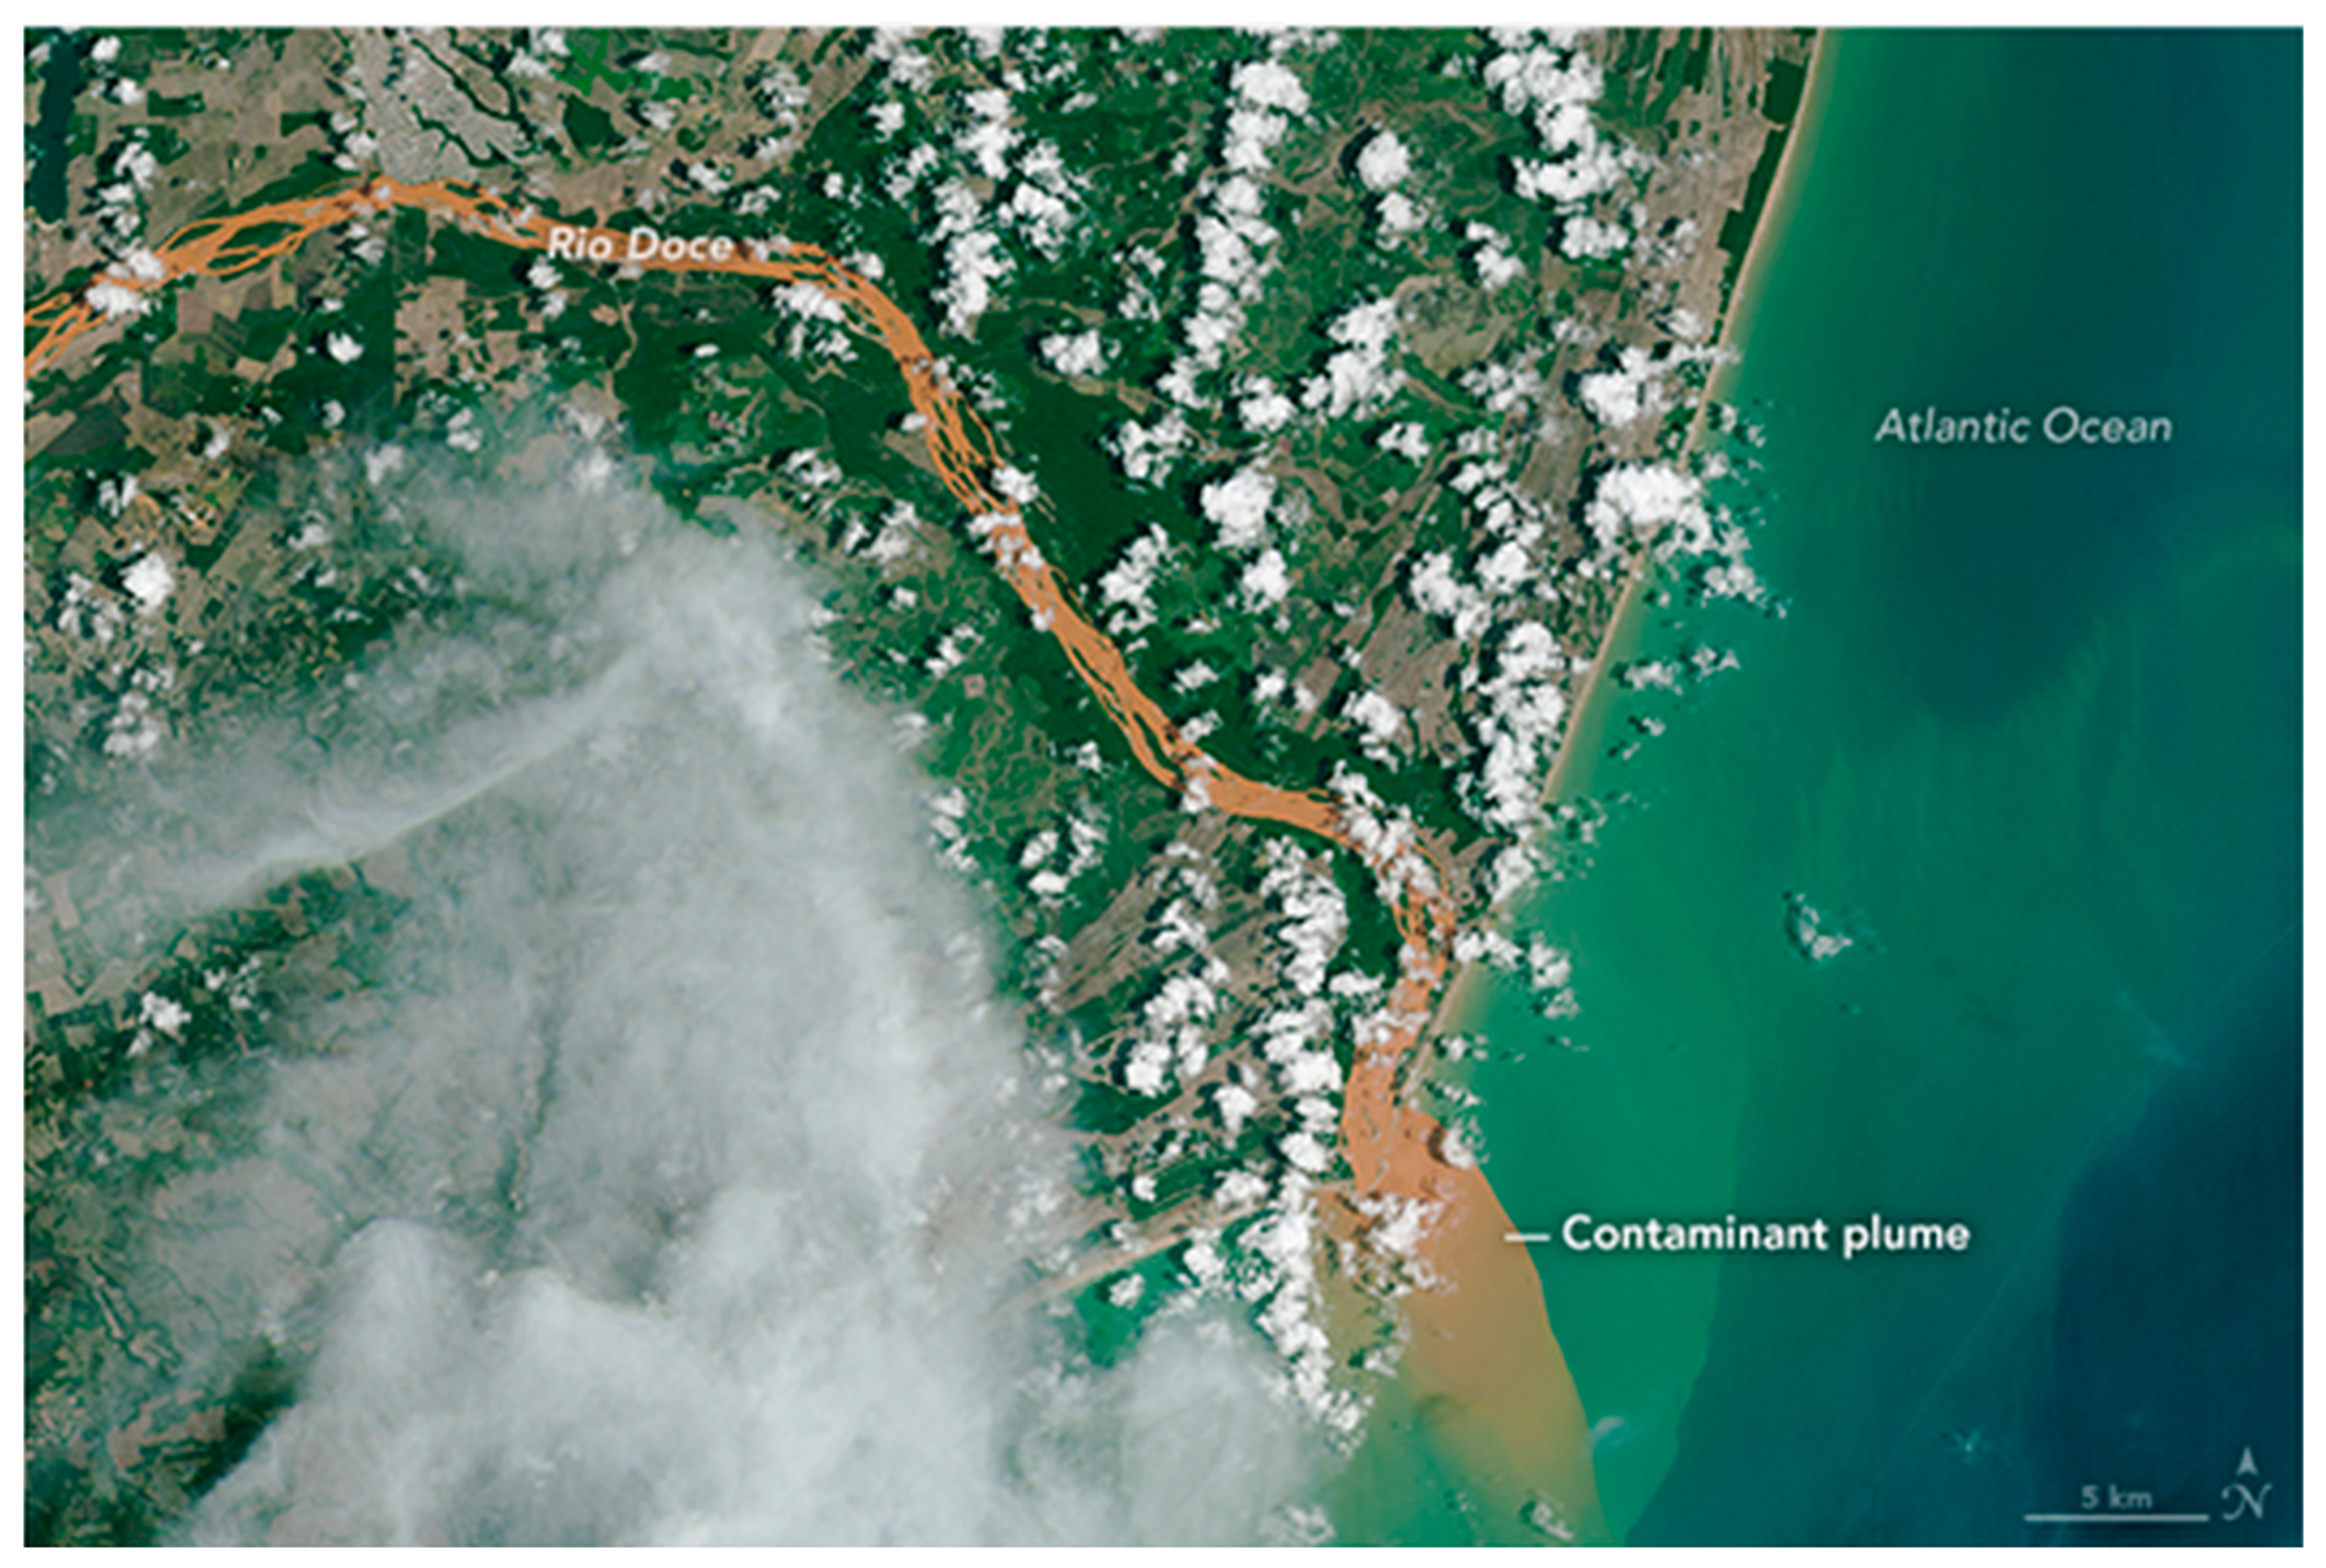
6.2. Case Study 2: The Mariana Disaster also Known as Samarco Tailings Dam Disaster in Bento Rodriguez

There were too many fatalities and ecological end results from the 2015 Samarco Co. cataclysm in the Bento Rodriguez municipality, also known as the Mariana Mining Disaster. News accounts and satellite images show 60 million m3 of sludge and debris at large, after the rupture of two tailings barriers. Tailings dams should be very robust, even though these problems happen quite alarmingly often. The images underneath show the set of dams involved in this tragedy. The two problematic upriver tailings dams started leaking debris to the downriver barrage (Figure 16a,b present the beginning of the failure). It seems one of the upper structures burst, initiating a breakdown that hit the downstream barrage as shown by the red arrows in Figure 16c,d). The left dam above is clearly unharmed, despite the fact that the barrage located to the west collapsed. The torrent that dismantled the valley was enormous, but it is related to the lower valley erosion. This erosion could have been better mapped with the help of in situ sensors. The second barrage illustrated in yellow in Figure 16c has a low-height wall in the nearby areas, and the vast volume of assorted debris flowing from the upper parts was not being held by any structure. Figure 16e,f display the final result from the collapse of the two upriver tailings dams [62,63].
Figure 16 illustrate the HR imagery of the Bento Rodrigues dam failures. This event resembles the tailings dam failure at Ajkai Timfoldgyar in Hungary in 2010 [63,64,65,66]. Academic studies [32,64,65,66,67] point towards that the occurrence of tailings dam failures worsen once commodities prices decrease. These failures peak about two years after the highest commodities prices occur. The relationship between the maxima in prices and the highest accident rates is attributed to [32]:
  • The urgency to mine rapidly implies low design and construction standards;
  • Fast staff turn-over as new and more lucrative opportunities appear;
  • The boom increases the resources in regions with difficult conditions;
  • After the boom, as commodity prices fall, expenses are reduced;
  • The boom stimulates the acquisition of inappropriate projects imported from other places;
  • Independent evaluations tend to go down, probably to evade the concomitant delays and costs.
It seems this event was caused by a calamitous near-complete failure of the Fundao Dam with disasters in the other levees in the tailings ponds. The Fundao Dam has filled completely without any remaining trace of the original structure, and probably failed first. The support loss from the other levees provoked the subsequent collapses. Figure 17 shows the contamination of the Atlantic Ocean.

6.3. Preliminary Experiments

6.3.1. Experiment 1: System with OMICs for Displacement Estimation

The ADNS-2610 ICs use OF to infer the horizontal displacement increments together with a CU (microcontroller), as depicted by Figure 11. They have an inbuilt camera to acquire images from the surface underneath the sensor. Each OMIC was placed at a different height, with a large carefully selected focal length lens and intense illumination to work stably at a given distance from its work surface [59].
An important concept related to optical mice is the surface quality (SQUAL), which measures the number of valid structures detectible by the OMIC or sensor unit (SU) in the current frame. This value is stored inside a register belonging to the OMIC. H and h are the lengths from the lens set to the paper surface under the OMIC, and from the OMIC to the lens set, respectively. Rd is the nominal optical sensor resolution, and R is the SUi resolution (i = 1, 2, 3). For a certain SU, calibration implies solving the expression R = hRd/H.
Each SU has a corresponding SQUALi. The OMICs can output trustworthy displacements over a surface with distances ranging from 26 to 43 mm and with a resolution of 400 counts per inch (CPI) [13,45,46,47,48]. Figure 18 shows the SQUAL × H curve for the ADNS-2610. The associated absolute relative error value for this SU appears in Figure 19. Each positioning structure can be located onto a movable device, which needs to be localized and associated to landmarks. The use of artificial landmarks with different colors can help to calibrate each OMIC system. Currently, there is not an optimization procedure to place and test OMICs.
The three sensors units (SU1, SU2, and SU3) have been positioned on a paper surface with enough landmarks under the SUs. The surface had obstructions (unevenness), and each one has a certain thickness. The system has moved 20 times along a 450 mm track. At each sampling time, the measurements from SU1, SU2, and SU3 were recorded.
Let Dt be the total displacement resulting from data fusion for the SUs, weighted by a row vector:
W = [SUsqual1, SUsqual2, SUsqual3]/S,
with S = Σ iSUsquali, i = 1, 2, 3, and measurements vector D = [D1, D2, D3]T such that
Dt = WD.
In practice, to monitor an area, the position of a three-SU set (sensor node) has to be known, and their information fused to estimate a displacement. Artificial landmarks would have to be scattered throughout the terrain.

6.3.2. Experiment 2: Two Views of the Same Site

Video cameras collect site evidence with low energy, inexpensively and with high spatiotemporal resolution. Consequently, OF has a high potential in displacement estimation over an extensive range of applications.
Although some information on terrain change can be obtained by frame difference, OF gets the complete movement data and identifies the changes in the background better. As an illustration, Figure 20 shows the detected changes between two frames. In Figure 20c, there is the ground truth, while Figure 20d presents the result of the OF estimation algorithm with [15].
However, the visible light information from should be fused with other types of radiation and sensors to corroborate the measurements, because real and apparent displacements may be considerably different. Even when legitimate terrain changes occur, they may be due other types of human intervention (e.g., as is the case of new construction sites shown in Figure 21).

7. Discussion

The proposed ER-CPS, although incomplete, could have lessened the losses of the Case Study 1 (Mudslides in Mountainous Region of Rio de Janeiro State). This is a typical scenario where community effort can help mitigate administrative shortcomings.
The Case Study 2 is more complex because the Mariana Disaster involved the interests of corporations, besides the lack of state intervention.
The comments below are some of the aspects that require further consideration and study.

7.1. Combination of Detectors

Merging passive and active sensor technologies into one VSAN can diminish false triggering (wrong detection), and vulnerability when both sensor types work together. This decreases the false alarm probability, for example, fluctuations of heat and light may trigger the passive IR (PIR) sensors without activating the microwave sensor (MS), or bouncing tree branches may activate the microwave device but not the PIR detector. If a movement is missed by either, then another sensing rationale can be added. Often, PDs are paired with another sensor to improve accuracy and decrease energy use. PIR involves less energy than an emissive MS, and when the PIR detects something, it also activates an MS. If the latter also detects a displacement, then the alarm sounds. Consequently, by comparing the total cost-performance benefits of using different types of sensors, the cost effectiveness and the adaptability for various applications can be examined.
SUs can be combined with images from IP cameras and crowdsourced images. Hence, a VSAN would consist of hundreds or thousands of SUs scattered across the area of interest and cameras (from crowdsource and IP).
This work has discussed the use of a grid of displacement sensors relying on SUs made out of OMICs to obtain more detailed punctual data on the soil conditions in landslide-prone spaces. In Figure 22, they are depicted by small circles that interact with several types of actuators, and can also communicate with CUs. Local stations, such as the laptops on the upper left and right corners, can display the sensor grids and their conditions.
Crowdsourced images acquired at near ground-level with smartphones, together with social media hints, provide information for real-time flooding detection. Images from the same drowned areas, obtained via crowdsourcing and others under dry conditions, can be combined to give analytical results for flooding comparison and detection. This strategy requires image normalization with and without inundation, followed by registration where the image without flooding is the ground truth. Algorithms can extract the target area in the crowdsourced images using context features and factors, such as geo-location, time, environmental/weather situations, and the image categories, which have an impact on photos and videos. The metadata obtained with crowdsourced images helps context identification, and social media cues are used for further evaluation. Algorithms can detect water reflections from nearby landmarks and the clouds/sky above. Figure 22 shows a VSAN for the proposed ER-CPS, where the smartphones gather knowledge, help to warn people, and interact with CUs, sensors, and actuators. A crowdsource environment entails constructing tagger and tagging communities, infrastructure and control taxonomies, and the visual data typification that arises from interactions among community members. Crowdsourced images can be further processed via OF algorithms based on the material presented in Section 3.
Real-time video monitoring can use as many cameras as necessary to observe a region. It is necessary to reposition the channels on the screen to allocate each channel to a window or use the automatic channel framing option on the website. To examine the landslide-prone area, IP cameras placed on poles or other elevated structures can be used. People usually monitor the video using local stations and recommend actions to the authorities, subject to internal procedures. Computer vision techniques like OF help to improve the operation of the security systems, because they reduce the operational cost and ease human errors. These techniques require treating large-scale images and more computational resources to lessen failures.

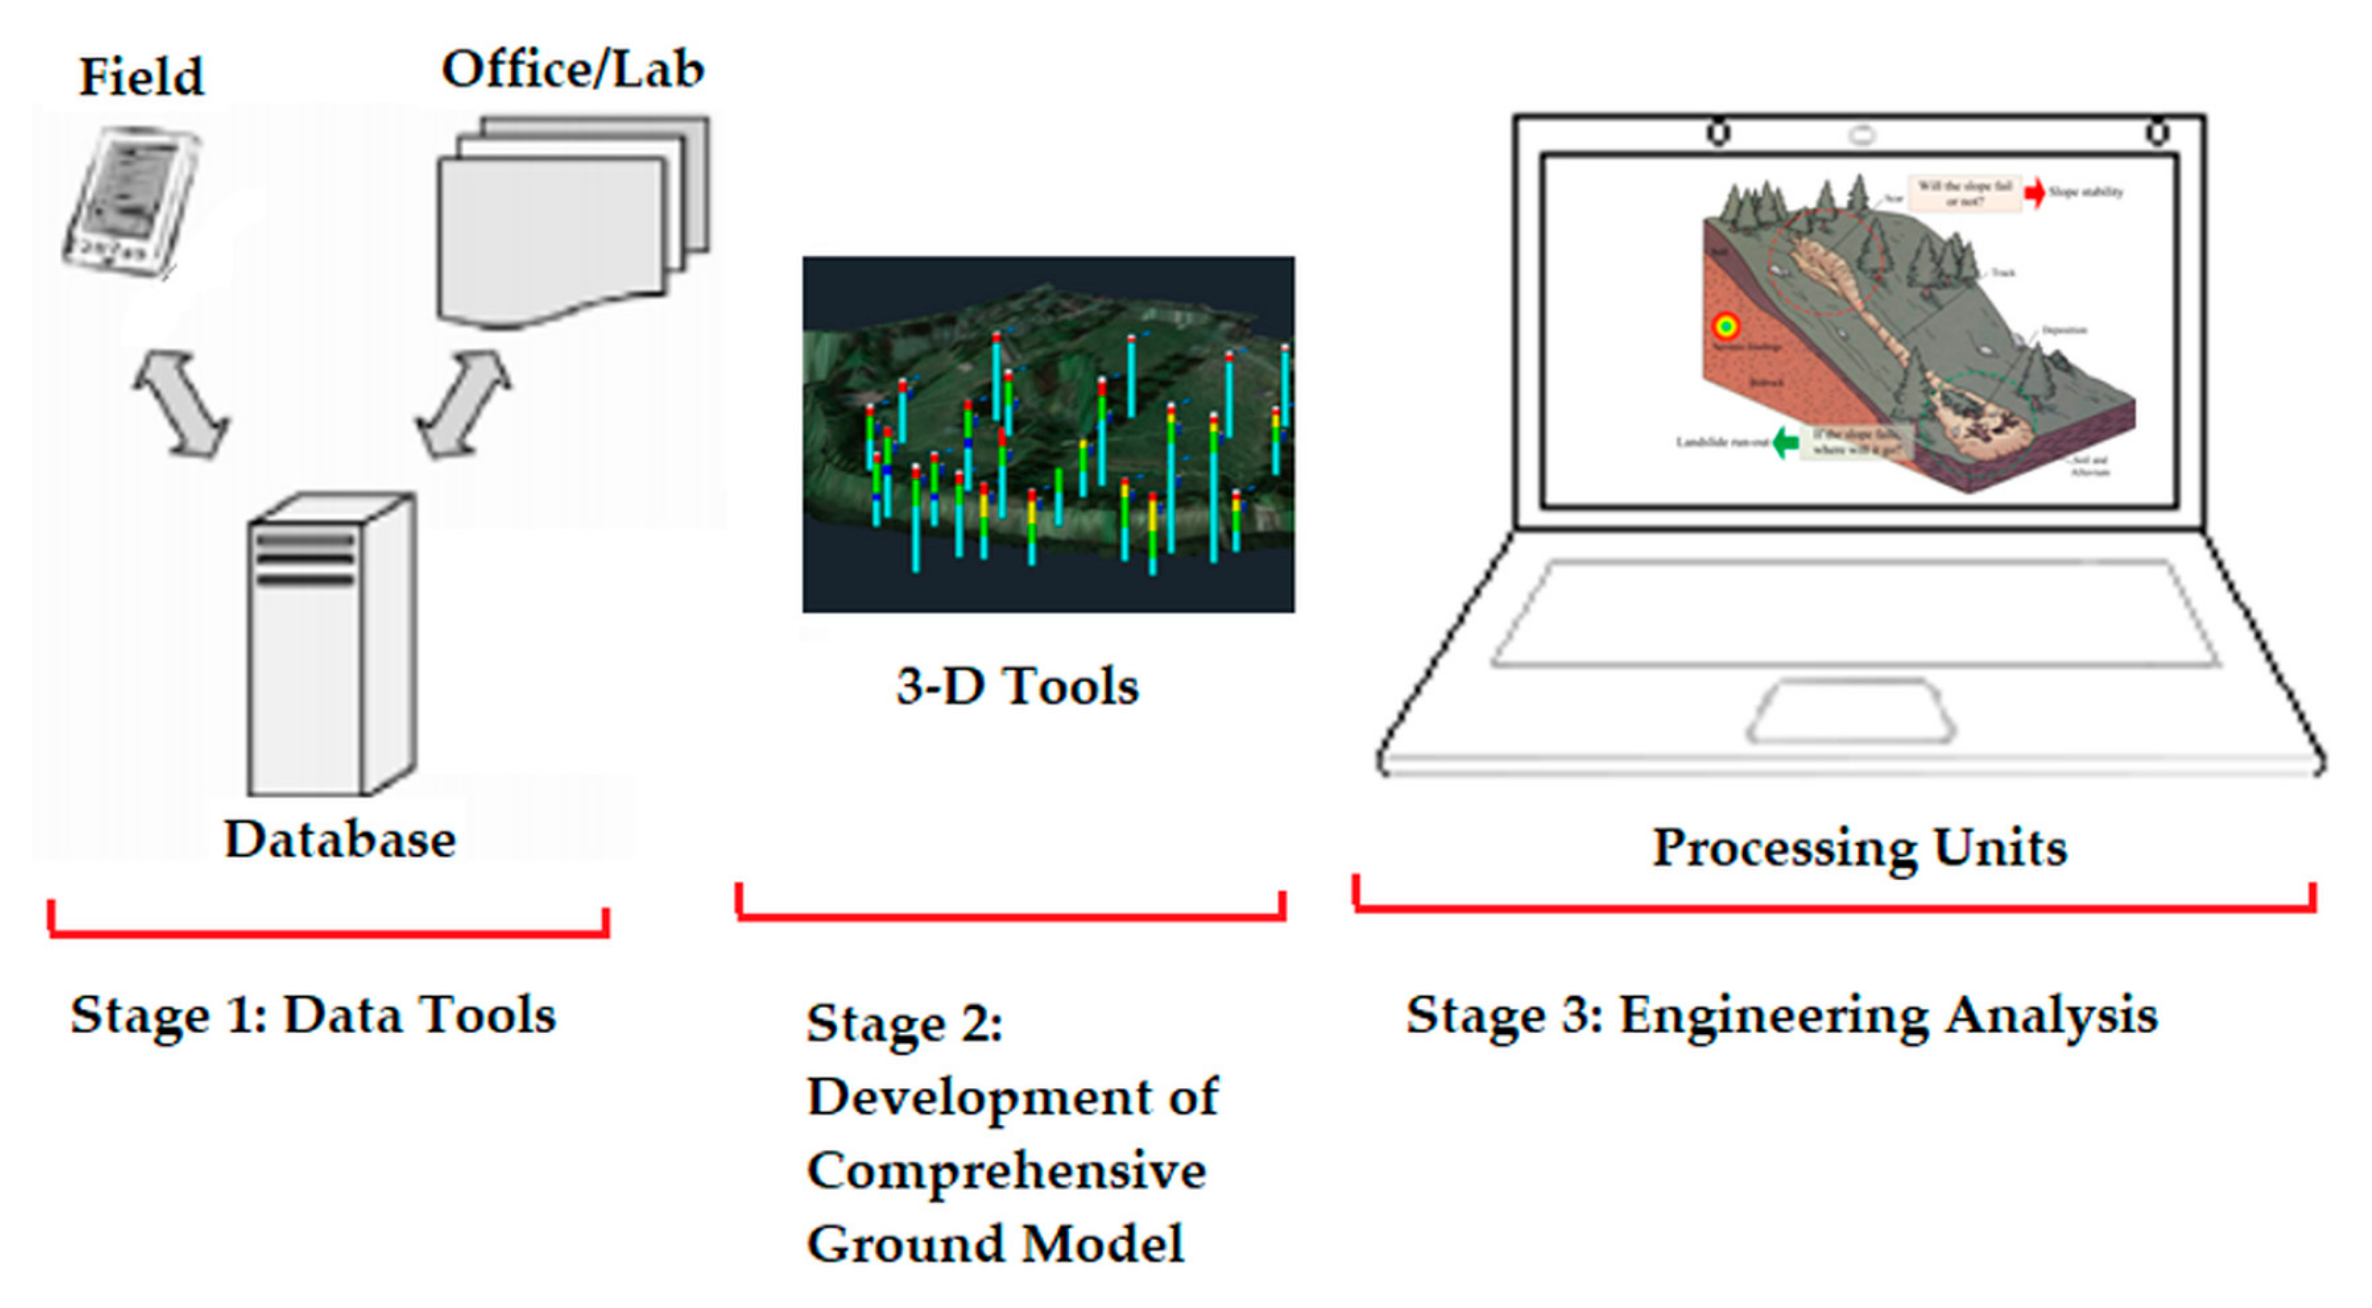
7.2. Fusion of In Situ and GIS Information

Geographical information systems (GISs) have unlimited potential for application in landslide engineering, remediation, and management. GIS helps to solve problems such as the creation of a database, site inventory, site surveillance, spatial analysis on databases, mathematical/computational modeling, and generate several types of outputs that would be strenuous or manually unviable.
The existing developments in 3-D GIS capability are still unsatisfactory for geotechnical engineering requirements. Mining software packages have tools for geological modeling that do not suit geotechnical modeling.
Remote sensing (RS) imagery allow creating landslide inventories and reports with medium resolution satellites (e.g., LANDSAT, ASTER, SPOT, and so forth) to routinely create land use maps and landslide inventories [70]. In situ information can be correlated with satellite-based evidence, such as precipitation, that leads to a global landslide predisposition map [71]. The limited resolution of a DEM and the lack of subsurface data limits the use of RS information by the landslide engineer.
Very high-resolution imagery is the best alternative for landslide mapping using satellites with stereo capabilities and increasingly better resolution.
Google Earth has high-resolution pictures, 3-D features, zoom, and allow drawing polygons on the area under study, which simplifies the analysis and mapping of slopes besides landslide studies [70,71,72]. These images can be stored, retrieved, measured, and further treated by a GIS package.
Landslide data analysis and management with GIS are essential for contending landslides, as 3-D visualization and modeling capabilities improve. Figure 12 exemplifies previsions for inserting GIS information in the existing ER-CPS in a dashed blue box.

7.3. Economic Indicators and Evaluation Tools for Sustainability

In general, when people assess “the cost” (definitions and interests abound when using this expression) of natural or human made disasters tend to look at things with insufficient indicators and shallow analysis [32,33,34].
Academics from engineering, economy, and social sciences still have many studies to conduct about the way powerful companies cope with changes involving social and environmental responsibility. Insights emerge from primary research with the people who analyze corporate sustainability initiatives that provide a foundation for additional theory development, inventory, hypotheses testing, and suggestions. The strategic findings comprise integration as a systems-based method to sustainability, change supervision, innovation, and corporate strategy. Integration calls for the alignment of performance metrics within and through business entities, and functions to integrate bottom line performance measurement through organizations, as well as value chains to notify management while guaranteeing decision-making, clarity, and external reporting. Integration and change administration are critical achievement factors for the progress of strategic sustainability initiatives [70,71,72]. A holistic methodology has to be thought that takes into consideration:
  • Economic advantages of preventing and remediating disasters.
  • Economic advantages of using salvaged components, carbon credits, etc.
  • Energy savings.
  • Other factors.

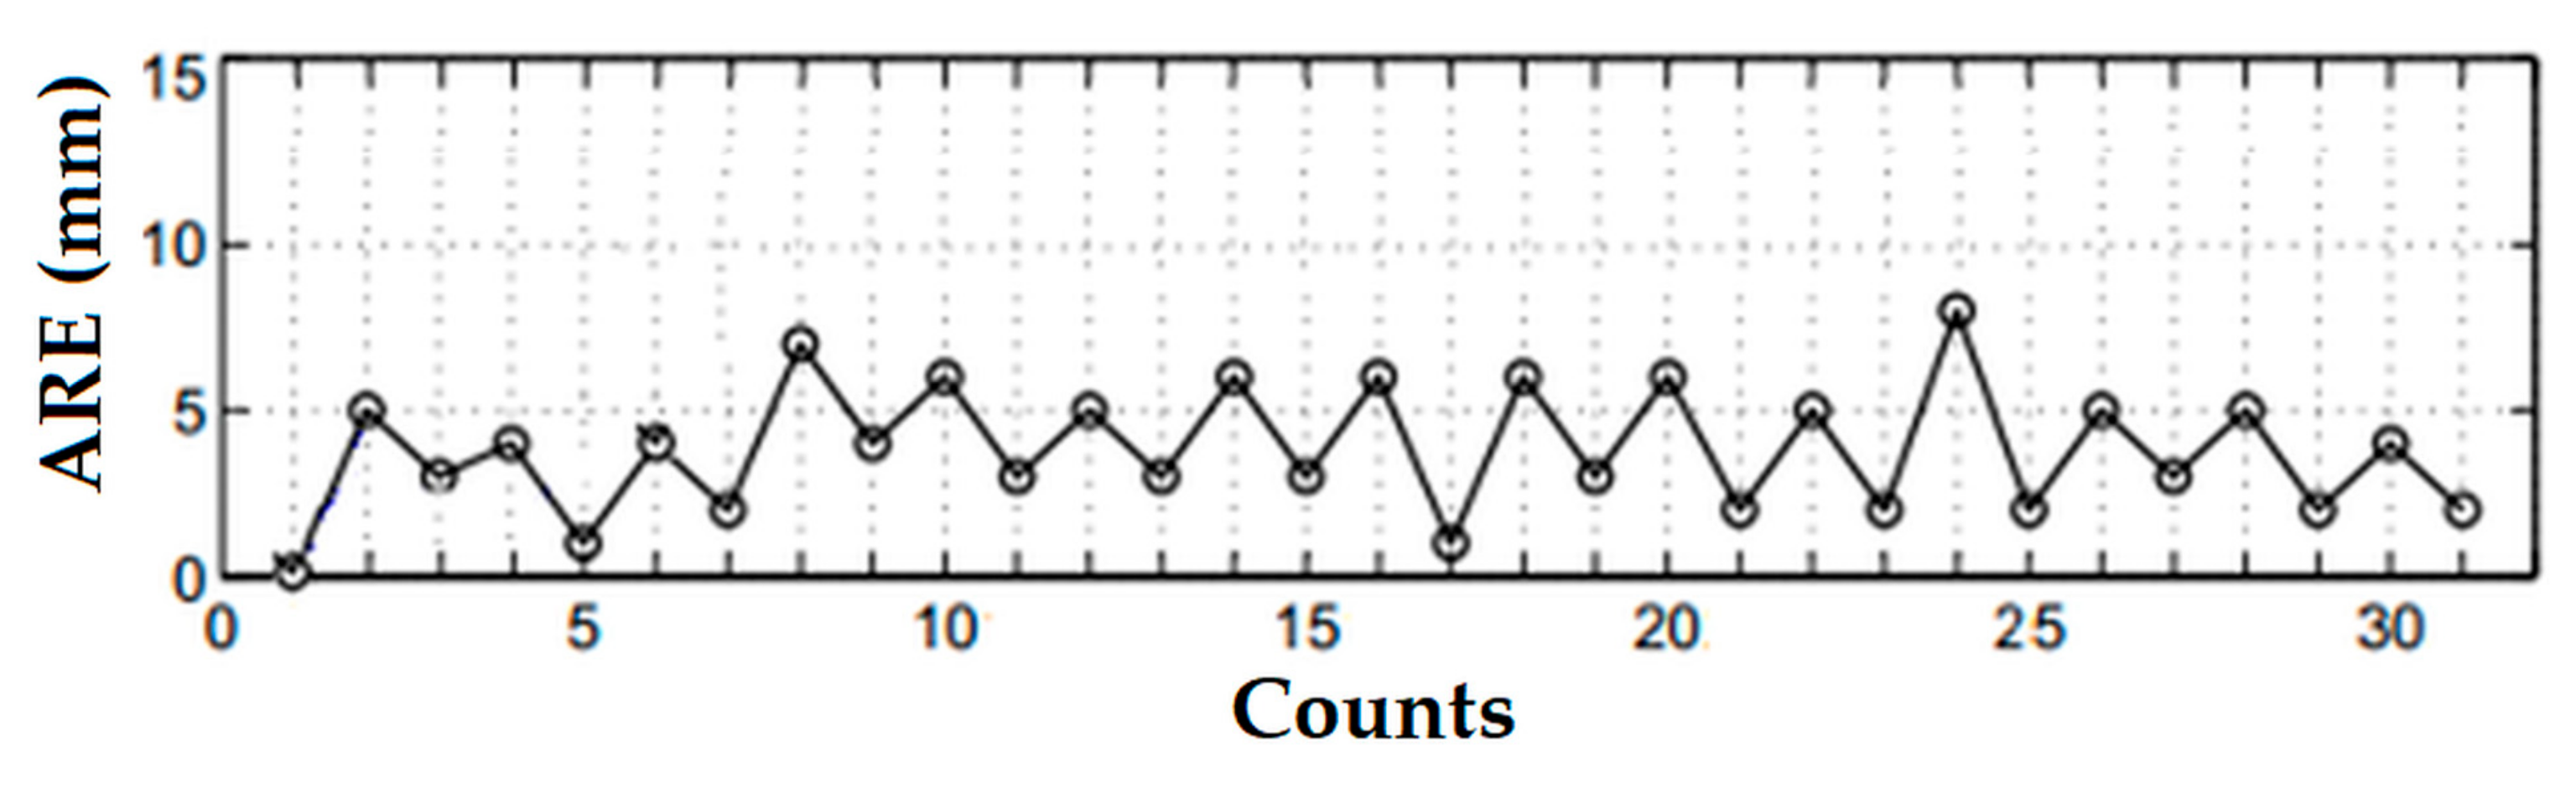
7.4. On Displacement Detection Robustness

Dense OF models should be used to cover all expected circumstances in a real-world scenario. Using visible and infrared radiation help to cope with illumination problems.
Displacement detection should be robust, which means the real-time estimation must endure adverse conditions with deviations in the adjusted or fixed variables and parameters, while being reliable.
If a displacement estimate happens, then the probability of incorrect triggers due to the rate of false alarms should be minimized.

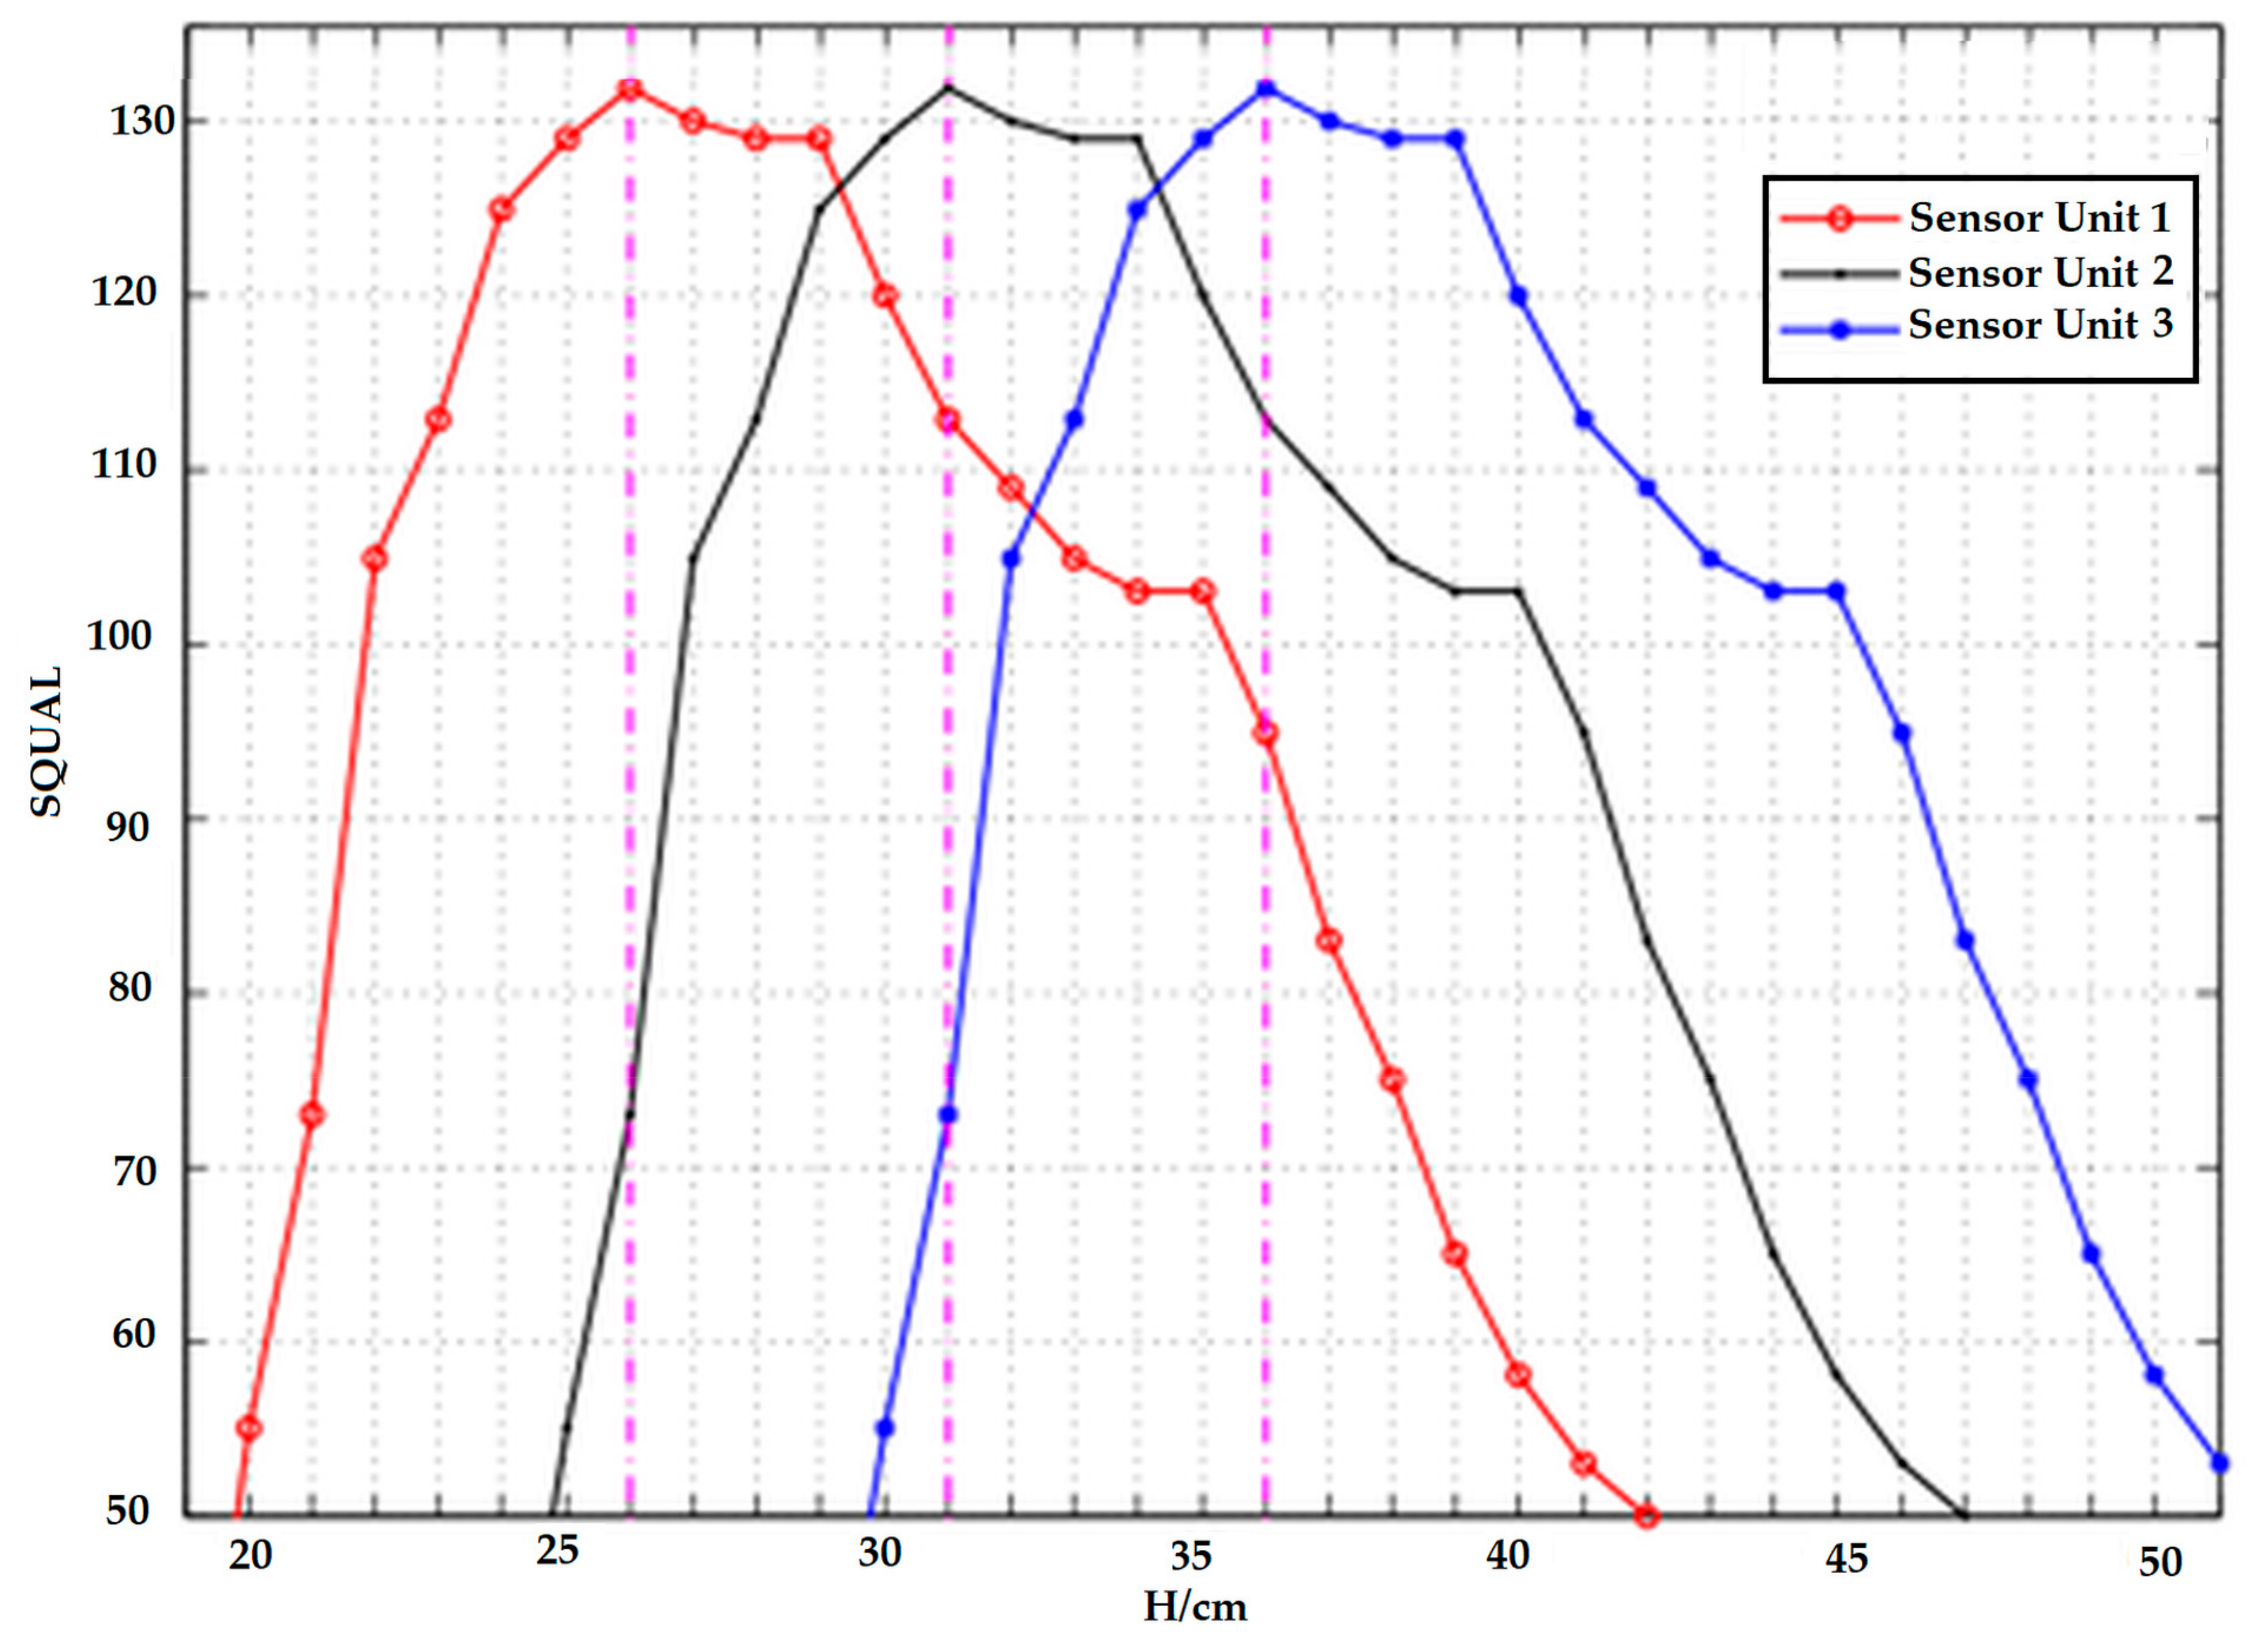
7.5. Sensor Placement

Area coverage is extensively used as performance criterion to distribute sensors and actuators. The current setting consists of sensors distributed empirically on small area. Future work involves the possibility of developing an optimization algorithm for sensor placement [73].
Firstly, the ratio between an extent covered by the sensors and the total area undergoing surveillance has to be maximized. Defining the VSAN coverage also depends on the sensor coverage model. The underlying conjecture is that each sensor monitors a round area, whose radius is the coverage range.
The second assumption refers to the sensor detection capability within its reconnaissance area with conventional or a probabilistic coverage of the environment.
The third supposition considers the target environment dimensionality, that is, the VSAN is actually a 3-D environment, and most projects assume it as a 2-D environment, which can compromise the VSAN performance. Realistically speaking, each sensor covered area should also reflects the environment topography with the corresponding obstacles obstructing each sensor.

8. Conclusions

This work highlights the influence and safety of landslide prevention and control on areas located around slopes. The success of such systems depends highly on the approaches used in the detection and monitoring stages. The trustworthiness of the detection techniques also relies upon factors and can be decreased under different states of affairs (like storm and ground vibration). An all-inclusive ER-CPS would involve more than the technologies mentioned in this work to strengthen security and reduce false alarms, such as fiber optics, manometers, and vibration sensors.
The ER-CPS investigates the electronic waste and environmental disaster problems, to create innovative solutions. Relatively simple circuits relying on salvaged components can identify flood in underprivileged regions. CPSs can enable event prediction and relief in disaster management. However, few green initiatives have been proposed in this area.
Recent technical advances bring about progress in landslides studies and improve risk metrics. This manuscript draws attention to some sensing strategies, such as surface in situ meters and cameras, to better track landslides with aerial imageries, and to monitor ground activities over large extents with increasing accuracy. The most significant advances result from improved visualization of landslides and related processes.
This paper describes an ER-CPS to identify and mitigate landslides using techniques based on motion detection that can productively predict and monitor the zone conditions to classify it as one of four types of messages: No Risk (NR), Slight Risk (SR), Moderate Risk (MR), in addition to High Risk (HR). Landslide data obtained by the ER-CPS can be transmitted to monitoring stations to lessen the erosion/sedimentation likelihood while increasing security.

Author Contributions

All authors contributed equally.

Conflicts of Interest

The authors declare no conflict of interest.

References

  1. Brancalion, P.H.S.; Garcia, L.C.; Loyola, R.; Rodrigues, R.R.; Pillar, V.D.; Lewinsohn, T.M. A critical analysis of the native vegetation protection law of Brazil (2012): Updates and ongoing initiatives. Nat. Conserv. 2016, 14, 1–15. [Google Scholar] [CrossRef]
  2. Braathen, E. Brazil: Successful Country, Failed Cities? Available online: https://blogg.hioa.no/nibrinternational/2011/01/24/brazil-successful-country-failed-cities/ (accessed on 5 March 2018).
  3. Avila, A.; Justino, F.; Wilson, A.; Bromwich, D.; Amorim, M. Recent precipitation trends, flash floods and landslides in southern Brazil. Environ. Res. Lett. 2016, 11. [Google Scholar] [CrossRef]
  4. Suthersan, S.; McDonough, J. Remediation Engineering: Design Concepts; CRC Press: Boca Raton, FL, USA, 1996. [Google Scholar]
  5. Delleur, J.W. The Handbook of Groundwater Engineering, 2nd ed.; CRC Press: Boca Raton, FL, USA, 2006. [Google Scholar]
  6. Bughi, S.; Aleotti, P.; Bruschi, R.; Andrei, G.; Milani, G.; Scarpelli, G.; Sakellariadi, E. Slow Movements of Slopes Interfering with Pipelines: Modeling and Monitoring. In Proceedings of the 15th International Conference on Offshore Mechanics and Arctic Engineers, Florence, Italy, 16–20 June 1996; pp. 363–372. [Google Scholar]
  7. Verde, C.; Torres, L. Modeling and Monitoring of Pipelines and Networks: Advanced Tools for Automatic Monitoring and Supervision of Pipelines; Springer: Berlin, Germany, 2017. [Google Scholar]
  8. Mosleh, A.; Pourali, M. A Functional Sensor Placement Optimization Method for Power Systems Health Monitoring. IEEE Ind. Appl. Soc. 2013, 49, 1711–1719. [Google Scholar]
  9. Teillet, P.M.; Gauthier, R.P.; Chichagov, A.; Fedosejevs, G. Towards integrated Earth sensing: Advanced technologies for in situ sensing in the context of Earth observation. Can. J. Rem. Sens. 2002, 26, 713–718. [Google Scholar] [CrossRef]
  10. Wong, K.P. Electrical Engineering, Encyclopedia of Life Support Systems; EOLSS Publishers Co. Ltd.: Abu Dhabi, UAE, 2009. [Google Scholar]
  11. Fraden, J. Handbook of Modern Sensors: Physics, Designs, and Applications, 5th ed.; Springer: Berlin, Germany, 2016. [Google Scholar]
  12. Platt, C. Encyclopedia of Electronic Components Volume 3: Sensors for Location, Presence, Proximity, Orientation, Oscillation, Force, Load, Human Input, Liquid and Gas Properties, Light, Heat, Sound, and Electricity; Maker Media, Inc.: Sebastopol, CA, USA, 2016. [Google Scholar]
  13. Dahmen, H.; Mallot, H.A. Odometry for ground moving agents by optic flow recorded with optical mouse chips. Sensors 2014, 14, 21045–21064. [Google Scholar] [CrossRef] [PubMed]
  14. De Jesus, M.A.; Estrela, V.V. Optical flow estimation using total least squares variants. Orient. J. Comput. Sci. Technol. 2017, 10, 563–579. [Google Scholar] [CrossRef]
  15. Coelho, A.M.; Estrela, V.V. A study on the effect of regularization matrices in motion estimation. Int. J. Comput. Appl. 2012, 51, 17–24. [Google Scholar] [PubMed]
  16. Horn, B.K.P.; Schunck, B.G. Determining optical flow. Artif. Intell. 1981, 17, 185–203. [Google Scholar] [CrossRef]
  17. Lucas, D.; Kanade, T. An Iterative Image Registration Technique with an Application to Stereo Vision. In Proceedings of the 7th International Joint Conference on Artificial Intelligence (IJCAI 1981), Vancouver, BC, Canada, 24–28 August 1981; Morgan Kaufmann Publishers: Burlington, MA, USA, 1981. [Google Scholar]
  18. Coelho, A.M.; Estrela, V.V. Data-driven motion estimation with spatial adaptation. Int. J. Image Proc. 2012, 6, 53–67. [Google Scholar]
  19. Hossain, K.M.; Sohel, A.A. Using optical mouse as a position feedback sensor for AGV navigation. Int. J. Mech. Mechatron. Eng. 2013, 13, 33–37. [Google Scholar]
  20. Mo, L.; Cao, X.; Chen, J.; Sun, Y. Collaborative Estimation and Actuation for Wireless Sensor and Actuator Networks. IFAC Proc. Vol. 2014, 47, 5544–5549. [Google Scholar] [CrossRef]
  21. Ko, B.; Kwak, S. Survey of computer vision-based natural disaster warning systems. Opt. Eng. 2012, 51. [Google Scholar] [CrossRef]
  22. Broxton, M.J.; Nefian, A.V.; Moratto, Z.; Kim, T.; Lundy, M.; Segal, A.V. 3D Lunar Terrain Reconstruction from Apollo Images. In International Symposium on Visual Computing (ISVC 2009); Bebis, G., Ed.; Springer: Berlin, Germany, 2009; pp. 710–719. [Google Scholar]
  23. Sabater, N.; Leprince, S.; Avouac, J.P. Contrast Invariant and Affine Sub-Pixel Optical Flow. In Proceedings of the 19th IEEE International Conference on Image Processing (ICIP 2012), Orlando, FL, USA, 30 September–3 October 2012; pp. 53–56. [Google Scholar]
  24. Marins, H.R.; Estrela, V.V. On the use of motion vectors for 2D and 3D error concealment in H.264 AVC video. In Handbook of Research on Applied Video Processing and Mining; Dey, N., Suvojit, A., Patra, P.K., Ashour, A., Eds.; IGI Global: Hershey, PA, USA, 2017. [Google Scholar]
  25. Coelho, A.M.; Estrela, V.V. EM-based mixture models applied to video event detection. arXiv, 2016; arXiv:1610.02923. [Google Scholar]
  26. Fernandes, S.R.; de Assis, J.T.; Pacheco, M.P.; Estrela, V.V.; Medina, I. Desenvolvimento de uma Ferramenta Computacional para o Processamento de Imagens Estereoscopicas. In Congresso Nacional De Matemática Aplicada E Computacional; SBMAC: Belem, Brazil, 2007. (In Portuguese) [Google Scholar]
  27. Van Westen, C.J.; Greiving, S. Multi-hazard risk assessment and decision making. In Environmental Hazards Methodologies for Risk Assessment and Management; Nicolas, R., Ed.; IWA Publishing Online: London, UK, 2017. [Google Scholar]
  28. Estrela, V.V.; Saotome, O.; Hemanth, J.; Cabral, R.J.R. Emergency Response Cyber-Physical System for Disaster Prevention with Sustainable Electronics. In Proceedings of the 10th International Conference on PErvasive Technologies Related to Assistive Environments (PETRA ’17), Rhodes, Greece, 21–23 June 2017; pp. 238–239. [Google Scholar]
  29. Morgenstern, N.R.; Martin, C.D. Landslides: Seeing the Ground, Landslides and Engineered Slopes; Taylor & Francis Group: London, UK, 2008. [Google Scholar]
  30. The Federal Emergency Management Agency (FEMA). Crisis Response and Disaster Resilience 2030: Forging Strategic Action in an Age of Uncertainty; Report Highlighting the 2010–2011 Insights of the Strategic Foresight Initiative; FEMA: Washington, DC, USA, 2012. [Google Scholar]
  31. Stankovic, J.A.; Lee, I.; Mok, A.; Rajkumar, R. Opportunities and obligations for physical computing systems. IEEE Comput. 2005, 38, 23–31. [Google Scholar] [CrossRef]
  32. Davies, M.; Martin, T. Mining Market Cycles and Tailings Dam Incidents, Tailings and Mine Waste. In Proceedings of the 13th International Conference on Tailings and Mine Waste, Edmonton, AB, Canada, 1–4 November 2009; pp. 3–14. [Google Scholar]
  33. Wang, H.; Zhang, Y.; Hu, H. A study on the relationship between the occurrence of landslides and rainfall. In Proceedings of the 2nd International Conference on Electric Technology and Civil Engineering (ICETCE ’12), Washington, DC, USA, 18–20 May 2012; pp. 200–203. [Google Scholar]
  34. Angeli, M.-G.; Pasuto, A.; Silvano, S. A critical review of landslide monitoring experiences. Eng. Geol. 2000, 55, 133–147. [Google Scholar] [CrossRef]
  35. Malet, J.-P.; van Asch, T.W.; van Beek, R.; Maquaire, O. Forecasting the behaviour of complex landslides with a spatially distributed hydrological model. Nat. Hazards Earth Syst. Sci. 2005, 5, 71–85. [Google Scholar] [CrossRef]
  36. Guzzetti, F.; Peruccacci, S.; Rossi, M.; Stark, C.P. Rainfall thresholds for the initiation of landslides in central and southern Europe. Meteorol. Atmos. Phys. 2007, 98, 239–267. [Google Scholar] [CrossRef]
  37. Wilson, R.C. The rise and fall of a debris-flow warning system for the San Francisco Bay region, California. In Landslide Hazard and Risk; John Wiley & Sons: Chichester, UK, 2012; pp. 493–516. [Google Scholar]
  38. White, I.D.; Mottershead, D.N.; Harrison, S.J. Environmental Systems: An Introductory Text; Psychology Press: Sussex, UK, 1992. [Google Scholar]
  39. Wieczorek, G.F.; Glade, T. Climatic factors influencing occurrence of debris flows. In Debris-Flow Hazards and Related Phenomena; Springer: Berlin, Germany, 2005; pp. 325–362. [Google Scholar]
  40. Aleotti, P. A warning system for rainfall-induced shallow failures. Eng. Geol. 2004, 73, 247–265. [Google Scholar] [CrossRef]
  41. Corominas, J. Landslides and Climate. In International Symposium on Landslides; IEEE: Cardiff, UK, 2000. [Google Scholar]
  42. Baum, R.L.; Godt, J.W. Early warning of rainfall-induced shallow landslides and debris flows in the USA. Landslides 2010, 7, 259–272. [Google Scholar] [CrossRef]
  43. Badoux, A.; Graf, C.; Rhyner, J.; Kuntner, R.; McArdell, B.W. A debris-flow alarm system for the Alpine Illgraben catchment: Design and performance. Nat. Hazards 2009, 49, 517–539. [Google Scholar] [CrossRef]
  44. Berti, M.; Martina, M.L.V.; Franceschini, S.; Pignone, S.; Simoni, A.; Pizziolo, M. Probabilistic rainfall thresholds for landslide occurrence using a Bayesian approach. J. Geophys. Res. Earth Surf. 2012, 117. [Google Scholar] [CrossRef]
  45. Sydenham, P.H.; Thorn, R. Handbook of Measuring System Design; John Wiley & Sons, Ltd.: Indianapolis, IN, USA, 2005. [Google Scholar]
  46. Linearize Optical Distance Sensors with a Voltage-to-Frequency Converter. Available online: https://www.edn.com/design/analog/4371308/Linearize-optical-distance-sensors-with-a-voltage-to-frequency-converter (accessed on 2 March 2018).
  47. Thakoor, S.; Chahl, J.; Bouffant, N.L.; Stange, G.; Srinivasan, M.V.; Hine, B.; Zornetzer, S. Bioinspired engineering of exploration systems: A horizon sensor/attitude reference system based on the dragonfly ocelli for Mars exploration applications. J. Robot. Syst. 2003, 20, 35–42. [Google Scholar]
  48. Bell, S. High-Precision Robot Odometry Using an Array of Optical Mice. In Proceedings of the 2011 IEEE Region 5 Student Paper Contest, Edmond, OK, USA, 14–17 April 2011. [Google Scholar]
  49. Walter, T.R. Low cost volcano deformation monitoring: Optical strain measurements and application to Mount St. Helens data. Geophys. J. Int. 2011, 186, 699–705. [Google Scholar] [CrossRef]
  50. Khaleghi, B.; Khamis, A.; Karray, F.O.; Razavi, S.N. Multisensor data fusion: A review of the state-of-the-art. Inf. Fusion 2013, 14, 28–44. [Google Scholar] [CrossRef]
  51. Song, B.; Choi, H.; Lee, H.S. Surveillance Tracking System Using Passive Infrared Motion Sensors in Wireless Sensor Network. In Proceedings of the International Conference on Information Networking (ICOIN 2008), Busan, South Korea, 23–25 January 2008; pp. 1–5. [Google Scholar]
  52. Kazuya, T.K.; Ueda, H.; Tamura, H.; Kawahara, K.; Oie, Y. Deployment design of wireless sensor network for simple multi-point surveillance of a moving target. Sensors 2009, 9, 3563–3585. [Google Scholar] [CrossRef]
  53. Buratti, C.; Conti, A.; Dardari, D.; Verdone, R. An overview on wireless sensor networks technology and evolution. Sensors 2009, 9, 6869–6896. [Google Scholar] [CrossRef] [PubMed]
  54. Yan, L.; Chakrabarty, K.; Ho, T.-Y. A Cyberphysical Synthesis Approach for Error Recovery in Digital Microfluidic Biochips. In Proceedings of the IEEE Design, Automation & Test in Europe Conference & Exhibition (DATE), Dresden, Germany, 12–16 March 2012. [Google Scholar]
  55. Springer, T.; Peter, S.; Givargis, T. Resource Synchronization in hierarchically Scheduled Real-Time Systems Using Preemptive Critical Sections. In Proceedings of the 2014 IEEE 17th International Symposium on Object/Component/Service-Oriented Real-Time Distributed Computing (ISORC), Reno, NV, USA, 10–12 June 2014. [Google Scholar]
  56. Walstra, J.; Dixon, N.; Chandler, J.H. Historical aerial photographs for landslide assessment: Two case histories. Quart. J. Eng. Geol. Hydrogeol. 2007, 40, 315–332. [Google Scholar] [CrossRef]
  57. Blaauw, F.J.; Schenk, H.M.; Jeronimus, B.F.; van der Krieke, L.; de Jonge, P.; Aiello, M.; Emerencia, A.C. Let’s get Physiqual—An intuitive and generic method to combine sensor technology with ecological momentary assessments. J. Biomed. Inform. 2016, 63, 141–149. [Google Scholar] [CrossRef] [PubMed]
  58. Al Najjar, M.; Ghantous, M.; Bayoumi, M. Video surveillance for sensor platforms. In Visual Sensor Nodes; LNEE Springer: New York, NY, USA, 2013; Volume 114, pp. 17–35. [Google Scholar]
  59. He, M.; Guo, X.; Wang, G. Enhanced Positioning Systems Using Optical Mouse Sensors. In International Conference on Intelligent Robotics and Applications (ICIRA 2014); Springer: Berlin, Germany, 2014; pp. 463–474. [Google Scholar]
  60. Source: Images Produced by Google Earth 2006/2010 and Reproduced in MMA. Available online: https://www.sciencedirect.com/science/article/pii/S1679007316300020#bib0115 (accessed on 5 March 2018).
  61. NASA Earth Observatory Image. Available online: https://earthobservatory.nasa.gov/NaturalHazards/view.php?id=49120 (accessed on 5 March 2018).
  62. Bento Rodrigues: A Disastrous Tailings Dam Failure in Brazil. Available online: https://blogs.agu.org/landslideblog/2015/11/06/bento-rodrigues-1/ (accessed on 5 March 2018).
  63. Sroufe, R. Integration and organizational change towards sustainability. J. Clean. Prod. 2017, 162, 315–329. [Google Scholar] [CrossRef]
  64. The Hungarian Tailings Dam Accident—Images of the Failure of the Impounding Embankment. Available online: https://blogs.agu.org/landslideblog/2010/10/05/the-hungarian-tailings-dam-accident-images-of-the-failure-of-the-impounding-embankment/ (accessed on 5 March 2018).
  65. Gura, D. Toxic Red Sludge Spill from Hungarian Aluminum Plant ‘An Ecological Disaster’. Available online: http://www.npr.org/blogs/thetwo-way/2010/10/05/130351938/red-sludge-from-hungarian-aluminum-plant-spillan-ecological-disaster (accessed on 12 April 2018).
  66. Enserink, M. After red mud flood, scientists try to halt wave of fear and rumors. Science 2010, 330, 432–433. [Google Scholar] [CrossRef] [PubMed]
  67. The Guardian. Outrage as Plant Bosses Acquitted over Fatal Toxic Spill in Hungary. Available online: https://www.theguardian.com/world/2016/jan/28/outrage-plant-bosses-acquitted-fatal-toxic-spill-hungary (accessed on 8 April 2018).
  68. Earth Observatory. Available online: https://earthobservatory.nasa.gov/IOTD/view.php?id=87083&eocn=image&eoci=related_image (accessed on 2 March 2018).
  69. Norsk Regnesentral. Available online: https://www.nr.no/nb/projects/some-results-3 (accessed on 31 March 2018).
  70. Krobl, B.; Boerboom, L.; Looijen, J.; van Westen, C.J. The Use of Geo-information in Eco-DRR: From Mapping to Decision Support. In Ecosystem-Based Disaster Risk Reduction and Adaptation in Practice; Springer: Berlin, Germany, 2016. [Google Scholar]
  71. Isermann, R. Process fault detection based on modeling and estimation methods—A survey. Automatica 1984, 20, 387–404. [Google Scholar] [CrossRef]
  72. Hong, Y.; Adler, R.F.; Huffman, G.J. Satellite remote sensing for global landslide monitoring. EDS Trans. Am. Geophys. Union 2007, 88, 357–358. [Google Scholar] [CrossRef]
  73. Akbarzadeh, V.; Lévesque, J.-C.; Gagné, C.; Parizeau, M. Efficient sensor placement optimization using gradient descent and probabilistic coverage. Sensors 2014, 14, 15525–15552. [Google Scholar] [CrossRef] [PubMed]
Figure 1. (a) A closed-loop control system for basic landslide detection; (b) Motion detection system (transmitter and receiver modules) using a passive infrared and light detector (phototransistor). The yellow light represents wireless communication.
Technologies 06 00042 g001
Figure 2. 2-D problem representation showing two frames at different time instants. The first frame contains a surface S1 at time t1. The solid green line from the first frame is projected in the second frame as a dotted green line to provide a reference. Without any deformation on the shape of the slope, one would have surface S2′ (dashed line). However, in real life, the slope will not only move but suffer deformation as shown by the solid green line (surface S2). Hence, the total change is a combination of a displacement (black arrow) with some erosion e (red vector).
Technologies 06 00042 g002
Figure 3. A simplified version of Figure 2, when there is no subsurface advection. The displacement vector d = (dx, dy, dz) is null. Hence, the curve at time t1 should have remained the same (dashed line) but because of erosion or advection becomes the solid line in the second frame.
Technologies 06 00042 g003
Figure 4. A simplified version of Figure 2, without erosion/sedimentation that is e = 0. The site’s surface is advected along with the disparity vector field (DVF) M1M2. The solid green line from the first frame is projected in the second frame as a dotted green line to provide a reference. Without any deformation on the shape of the slope, one would have surface S2′ (solid line). However, in real life, the slope will not only move but suffer deformation as shown by the solid green line (surface S2). The dashed line here is the original surface s1(x) after a horizontal displacement dx.
Technologies 06 00042 g004
Figure 5. Matching procedure to determine the offsets between two images or two sets of digital elevation models (DEMs) or point clouds.
Technologies 06 00042 g005
Figure 6. Emergency Response Cyber-Physical System (ER-CPS) proposed hardware framework. The lightning marks mean green for a WLAN, light pink for wireless long-distance communication, light blue for Bluetooth and yellow for a wireless personal area network (WPAN) such as Zigbee.
Technologies 06 00042 g006
Figure 7. Diagram showing the data processing stages of an ER-CPS.
Technologies 06 00042 g007
Figure 8. Landslide detection software framework using optical and infrared cameras.
Technologies 06 00042 g008
Figure 9. (a) The control perspective of a CPS; and (b) relationship between sensors and actuators. The yellow lightning stands for wireless communication.
Technologies 06 00042 g009
Figure 10. Simple motion detectors [10,11,12,49,50,51,52,53].
Technologies 06 00042 g010aTechnologies 06 00042 g010b
Figure 11. The outputs of optical mouse integrated circuits (OMICs) would be fed to an optical flow (OF) control unit. The number of necessary OMICs would grow according to the complexity of the CPS.
Technologies 06 00042 g011
Figure 12. A complete landslide assessment system using aerial photos or pictures from tall geographic or man-made structures [56].
Technologies 06 00042 g012
Figure 13. Mountainous region of Rio de Janeiro State struck by rainfall [3].
Technologies 06 00042 g013
Figure 14. Two views of a slope in Nova Friburgo: (a) before and (b) after the rainfall.
Technologies 06 00042 g014
Figure 15. Damage in Nova Friburgo [61].
Technologies 06 00042 g015
Figure 16. Two views of the Bento Rodrigues dam failures. The left images are from Google Earth, 2013. The right ones are from SPOT 6/7 via Airbus Defence and Space, 2016 [62,63]. The arrows show the flow of mud and debris that happened in 2015 projected onto a 2013 picture. The yellow ellipsis surrounds a dam and the red one shows two dams separated by some water (this proves there was an earlier sign that things could go wrong).
Technologies 06 00042 g016
Figure 17. Atlantic Ocean contamination [68].
Technologies 06 00042 g017
Figure 18. The relationship between the values of SQUAL and H. The pink vertical lines mark the maximum SQUAL value for each sensor unit.
Technologies 06 00042 g018
Figure 19. Absolute relative error (ARE) versus the counter value for a calibrated sensor unit (SU).
Technologies 06 00042 g019
Figure 20. Two views of a target site: (a,b). Optical flow between them: (c) Ground truth; (d) Changes with a regularized displacement detection algorithm from [15]. In (c,d), the darker the color, more profound is the corresponding pixel. The pictures have clouds, which amounts to some background changes.
Technologies 06 00042 g020
Figure 21. Changes due to urban interventions [69] are shown in red.
Technologies 06 00042 g021
Figure 22. Detailed architecture of a visual sensor actuator node (VSAN). The yellow paths represent a wireless personal area network (WPAN).
Technologies 06 00042 g022

