Article

The Effects of Oil Price Shocks on IIP and CPI in Emerging Countries

by
Yukino Sakashita
1 and
Yasunori Yoshizaki
2,*
1
International and Development Economics, Yale University, New Haven, CT 06511, USA
2
Graduate School of Economics, Kobe University, Rokkodai, Kobe 657-8501, Japan
*
Author to whom correspondence should be addressed.
Economies 2016, 4(4), 20; https://doi.org/10.3390/economies4040020
Submission received: 31 July 2016 / Revised: 14 September 2016 / Accepted: 22 September 2016 / Published: 29 September 2016
(This article belongs to the Special Issue Falling Oil Prices: Economic and Financial Implications)

Abstract

:
In this paper, we investigate the effects of oil price shocks on the production and price level in five emerging countries through comparison with the United States, using a two-block structural VAR model of the global crude oil market proposed by Kilian and Park (see International Economic, vol. 50, 2009, pp. 1267–1287). Our main finding is that the effect of oil price shocks on the index of the industrial production (IIP) and consumer price index (CPI) in emerging countries also depends on where the changes fundamentally come from (this is also the case for the United States). We also found that some emerging countries showed unique impulse response patterns, the shapes of which are different from those of the United States and there are differences in impulse response patterns among emerging countries.
JEL Classifications:
C32; E30

1. Introduction

There is a large body of literature that reports on the effects of oil price shocks on a developed economy like the United States. However, the effect of oil price changes on developing countries has often been ignored. In this study, we empirically analyze the impact of change in oil price on developing countries. Based on a two-block structural vector autoregressive (VAR) model proposed by Kilian and Park (2009) [1], we investigate the dynamic effects of oil price shocks on the index of the industrial production (IIP) and consumer price index (CPI) for the United States and five developing countries.
The price of oil is one of the most familiar economic indicators for many people as it is highly related to our daily economic activity. Therefore, changes in the oil price and their causes have been an interesting issue for economists. Early works generally employed production functions to investigate the effects of changes in oil prices on an aggregate economy (e.g., Hamilton (1983 [2], 1985 [3]) and Gisser and Goodwin (1986) [4]). Each study finds a negative association between energy prices and output. Hooker (1996) [5] found that, in the United States, the negative relationship between oil prices and GDP weakened after 1973 by examining the period 1948:1–1994:2. In addition, Hooker (1999) [6] pointed out that oil price changes would not appear to have a strong impact on the U.S. core inflation after 1980.
The main limitation of these previous works was that they assumed exogeneity of oil price changes: the possibility of reverse causality from the global economy through oil demand fluctuations has not been taken into consideration. To address the exogeneity problem, Kilian (2009) [7] established the structural VAR model of the global oil market in order to identify three underlying shocks in the global oil market: (1) oil supply shocks; shocks to the physical ability to produce oil; (2) aggregate demand shocks; shocks to the current demand for all industrial commodities which are determined by global macroeconomic conditions and (3) oil-specific demand shocks; shocks which cannot be explained based on oil supply shocks or aggregate demand shocks. Then he reached a conclusion that each oil price shock affects GDP growth and CPI in the United States differently. Following this contribution, the structural VAR model has been widely applied to the later studies investigating oil-related economic issues. For example, Kilian and Park (2009) [1] constructed a two-block structural VAR model that included the global oil market block and the U.S. stock market block in order to explore the differences in the responses of industry-level stock returns to changes in oil price. In addition, Fukunaga, Hirakata and Sudo (2010) [8] investigated the impacts of oil price shocks on industry-level production in the United States and Japan and found that each shock would differently affect each industry-level production depending on oil intensiveness, and the transmission mechanism would be different between both countries.
Looking at country coverage of the previous work, however, most empirical literatures have mainly focused on the effects of changes in oil price on the developed economy and the effects of changes in oil price on the developing countries are largely unknown. Therefore, in this study, we set our main objective to be examining the impact of change in oil price on developing countries in terms of their magnitudes, transmission mechanisms. More specifically, we investigate how the underlying causes of oil price changes respectively affect main short-term macroeconomic indicators, i.e., index of industrial production (IIP) and consumer price index (CPI), in five developing countries and the United States in order to make it possible to check whether there are any differences in response pattern to oil price change between developing countries and the United States, which we consider representative of developed countries. We apply a two-block structural VAR approach proposed by Kilian and Park (2009) [1] with the aim of controlling endogeneity of oil price. To the best of our knowledge, this study is the first attempt to investigate how oil price change affects developing countries, taking the endogeneity of oil price into consideration.
The main findings in this paper are as follows: First, as well as the United States, we showed that the effect of oil price shocks on IIP and CPI in emerging countries also depends on where the changes fundamentally come from. Second, we found that some emerging countries showed unique impulse response patterns, the shapes of which are different from those of the United States. Third, we revealed that the response patterns vary among emerging countries. The importance of oil production for each economy is one of the important factors that affect the response pattern.
The remainder of the paper is organized as follows. Section 2 contains data description and describes the empirical framework with brief discussions about the identified structural shocks to the global oil market. Section 3 provides the empirical results. Section 4 contains concluding remarks.

2. Experimental Section

2.1. Data Description

Table 1 shows the data set and its sources used in this study. This includes the monthly index of industrial production (IIP) and consumer price index (CPI) of six countries (Brazil, Chile, India, Mexico, Russia, and the United States). The sample period extends from April 1994 to February 2016: the start of the period depends on the data availability of IIP in India. For the oil market, we use world crude oil production, world trade volume1, and West Texas Intermediate spot crude oil prices2 to identify structural shocks. The main difference from Kilian’s (2009) [7] original work is in regard to the choice of a variable to represent global economic conditions. Kilian (2009) [7] constructs his original series based on dry cargo freight rates as the proxy of global economic conditions. However, it is possible that this index includes some irrelevant information on economic conditions that is specific to the ship-freight market, such as weather conditions and demurrage. Therefore, we use the index of world trade volume, instead, to appropriately measure the development of global economic conditions.

2.2. Methodology

Following Kilian and Park (2009) [1], we estimate a two-block structural VAR model for IIP and CPI in each country, to measure demand and supply shocks in the global oil market. The first block is “global oil market block”, and the second block is the “domestic aggregate economy block”. The description for each block will be discussed later.

2.2.1. Description of the Structural VAR Model

The restricted VAR model is represented as follows:
X t = A 0 + i = 1 12 A i X t i + e t  
where X t includes change in global oil production, a detrended series of world trade volume, WTI oil price in dollars, and the IIP or CPI for each country. e t represents the reduced-form VAR innovations.
Next, the structural VAR model is represented as follows:
B 0 X t = B 0 A 0 + i = 1 12 B i A i X t i + u t  
where u t is the vector of structural innovations. In order to capture the structural shocks u t , we assume that A 0 1   takes a specific form so that e t   in the reduced form and the structural errors u t have a specific relationship, as described below.
e t = ( e 1 t o i l   p r o d u c t i o n e 2 t r e a l   e c o n o m i c   a c t i v i t y e 3 t r e a l   p r i c e   o f   o i l e 4 t d o m e s t i c   C P I   o r   I I P ) = [ α 11 0 0 0 α 12 α 21 0 0 α 13 α 22 α 33 0 α 14 α 23 α 34 α 44 ] ( u 1 t o i l   s u p p l y   s h o c k u 2 t a g g r e g a t e   d e m a n d   s h o c k u 3 t o i l s p e c i f i c   d e m a n d   s h o c k u 4 t o t h e r   s h o c k s   t o   C P I   o r   I I P ) =   B 0 1 u t
The Equation (3) indicates that the model imposes the following excluding restrictions.

2.2.2. The Global Oil Market Block

This block includes three equations—global oil production, world trade volume, and oil price. The following are the assumptions related to the global oil market block: First, oil supply shocks are innovations to world oil supply that do not respond to innovations to the demand for oil within the same month: that is, the model assumes a vertical short-run supply curve for crude oil. Second, aggregate demand shocks are innovations to world trade volume, which is not explained by the crude oil supply shocks. This indicates that increases in the price of oil driven by shocks that are specific to the oil market would have a delayed effect of at least one month. Third, oil-specific demand shocks are the innovations to the price of oil that is explained neither by oil supply shocks nor by aggregate demand shocks. That is, oil-specific demand shocks are assumed to reflect changes caused by speculative demand for oil or some countries’ preferences for inventory holdings or changes in precautionary demand, which, for example, are caused by uncertainty regarding future oil supply shortage.

2.2.3. The Domestic Aggregate Economy Block

The domestic aggregate economy block comprises only one equation, IIP or CPI for each country. The restriction of the last column of B 0 1   implies that both IIP and CPI are assumed to respond to all three structural oil shocks, u 4 t   does not affect the global oil market with a delay of at least one month.

3. Empirical Results

Figure 1, Figure 2, Figure 3, Figure 4, Figure 5 and Figure 6 illustrate the estimated cumulative response of IIP and CPI in six countries to the three structural shocks identified in the global oil market block.

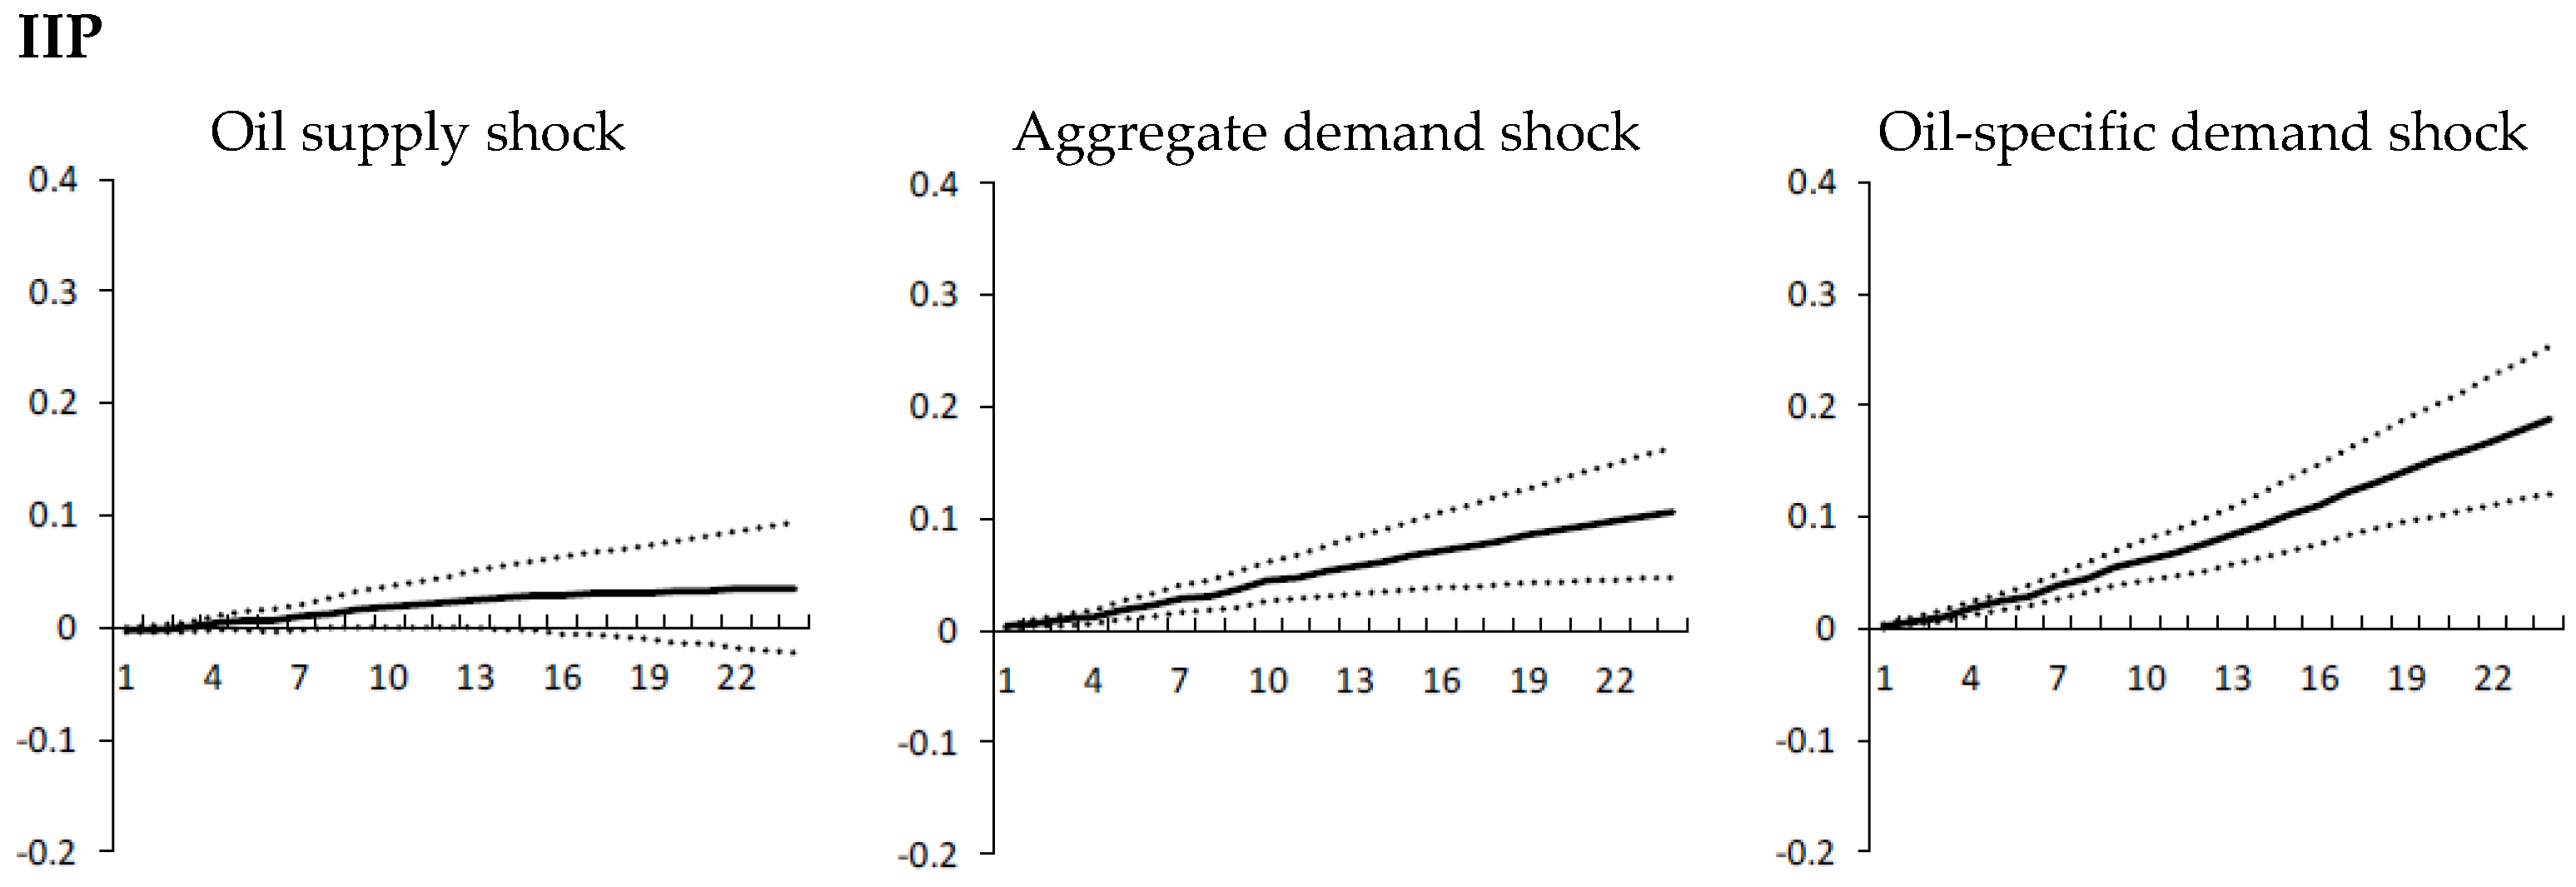
3.1. The United States

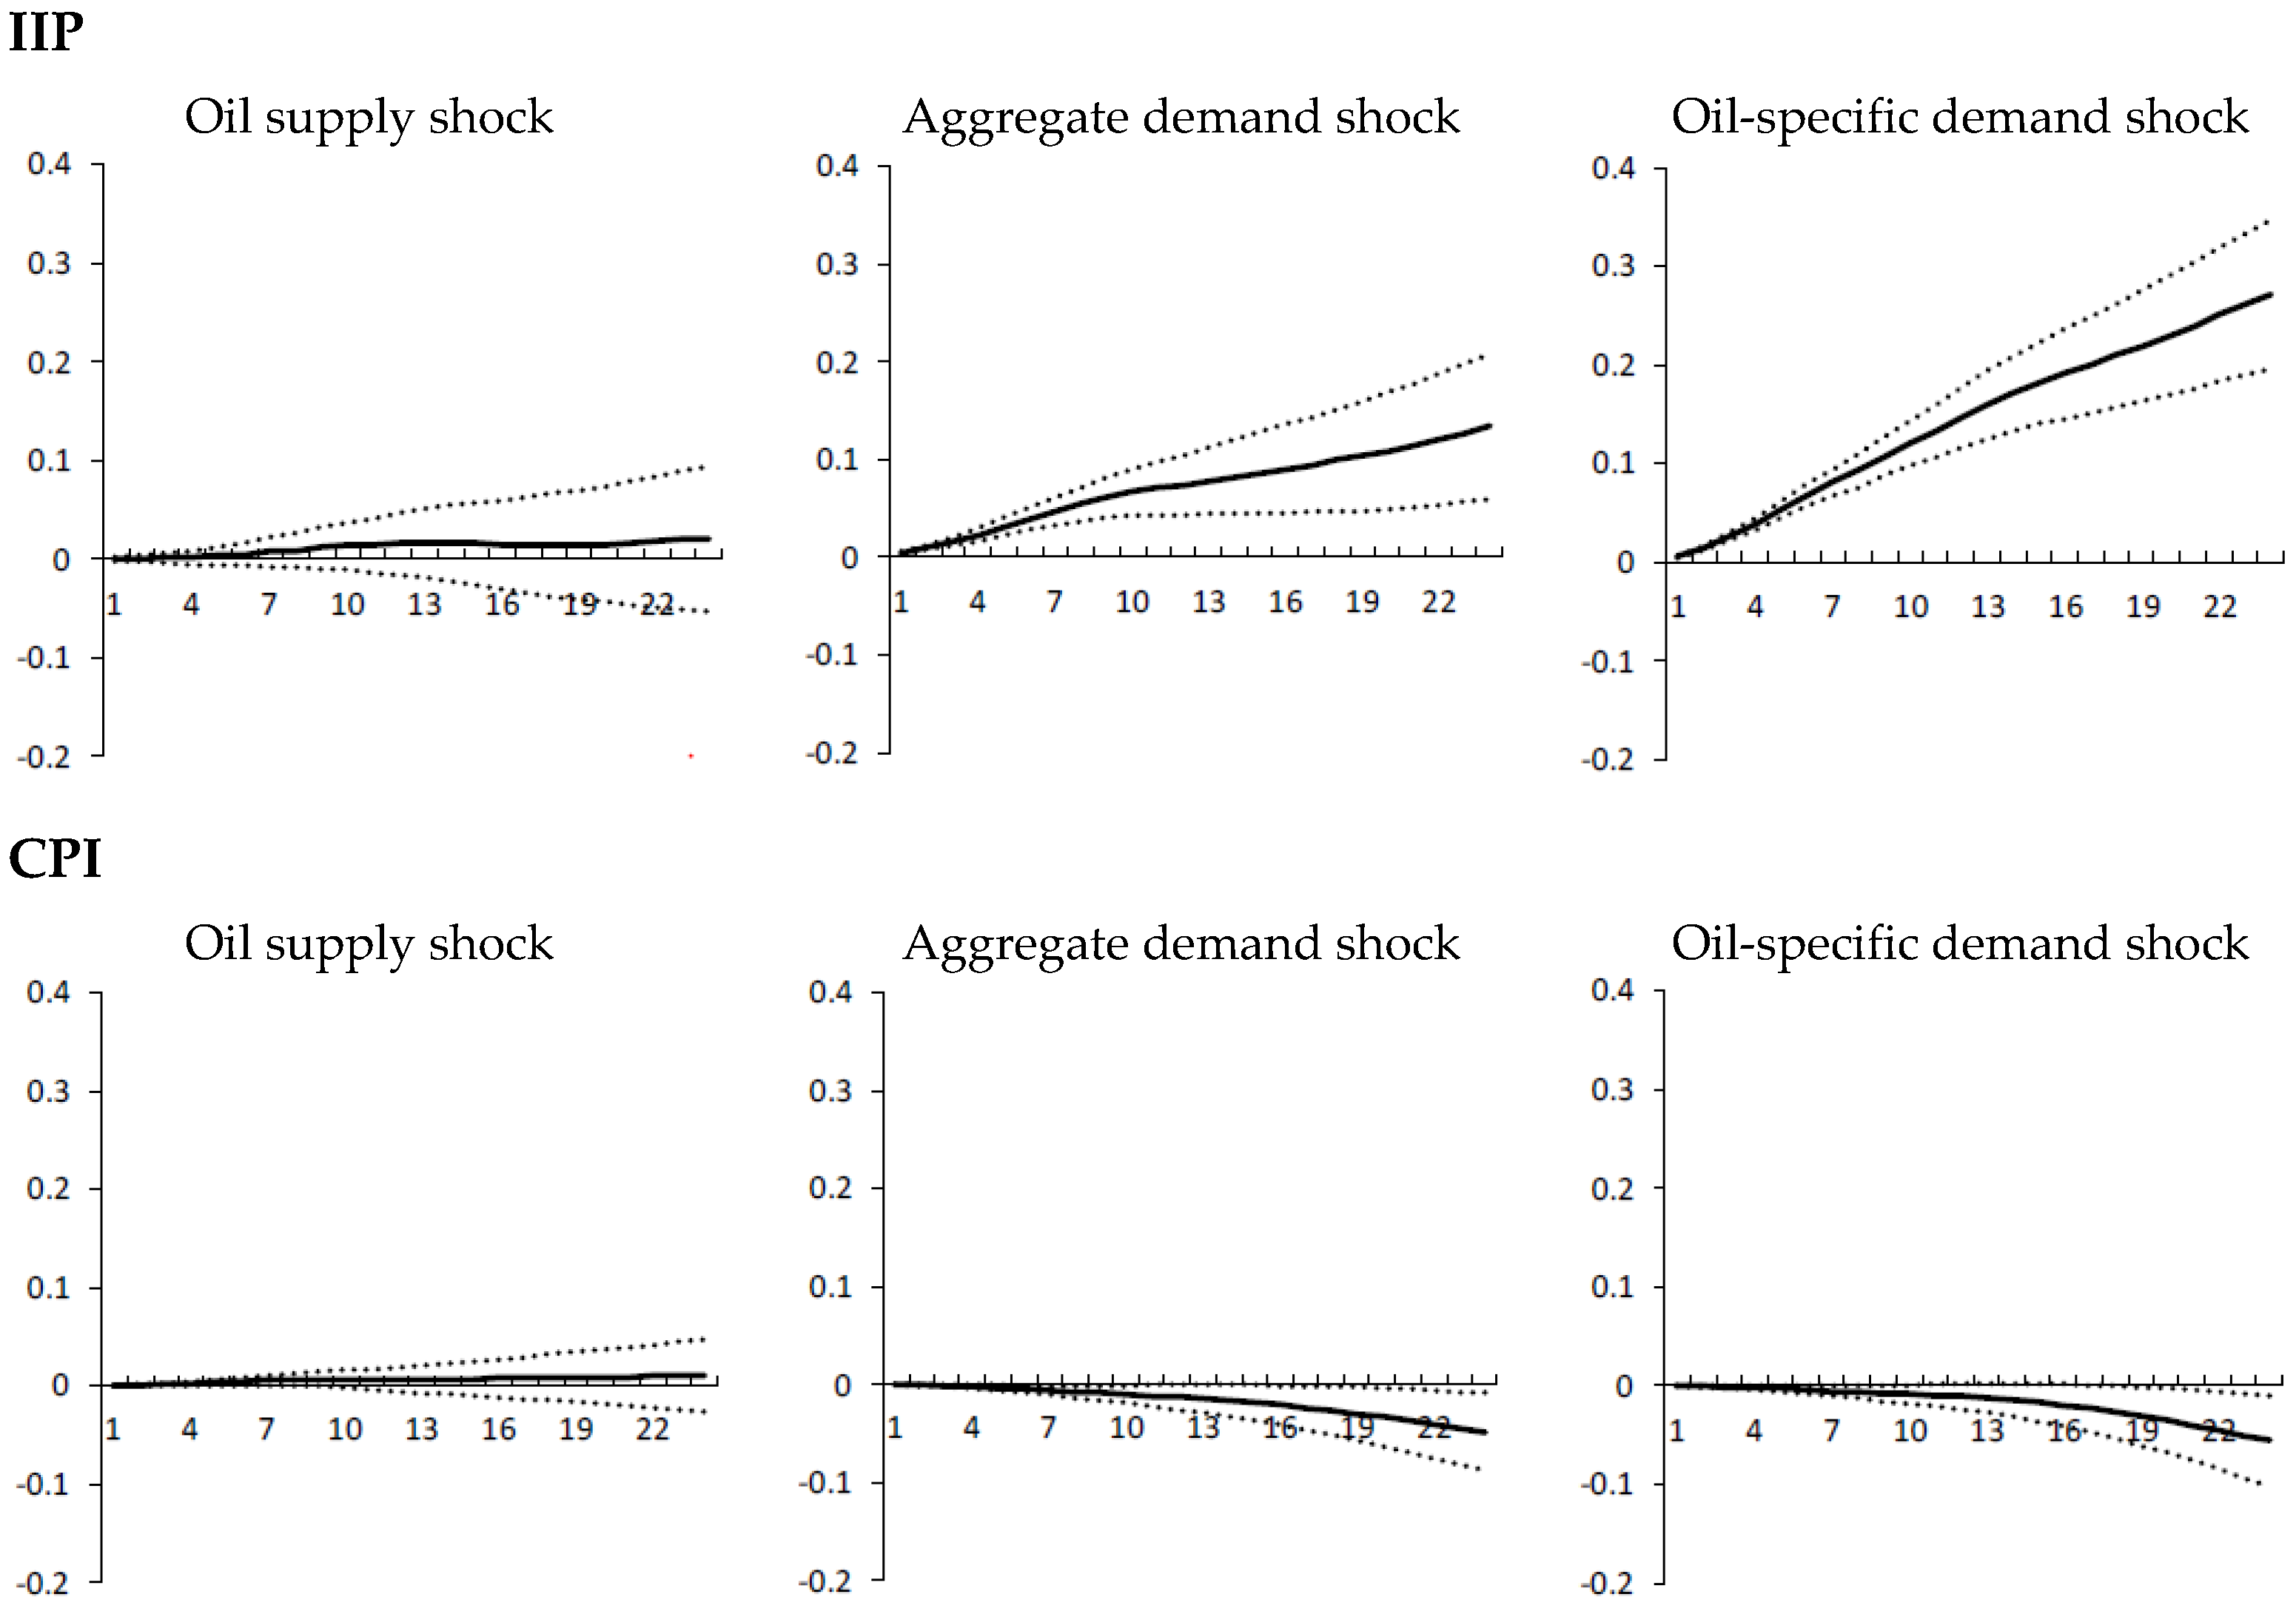
The effects of unanticipated oil supply shock on IIP and CPI are largely flat and statistically insignificant. These response patterns of both indexes are consistent with those of most other emerging countries. Aggregate demand increase provides a sustained level shift in IIP, from initial levels and the responses are statistically significant, while the corresponding response on CPI is in a persistent and statistically significant rise in level. The oil-specific demand expansion causes increases in both IIP and CPI although only the CPI shows statistical significance.
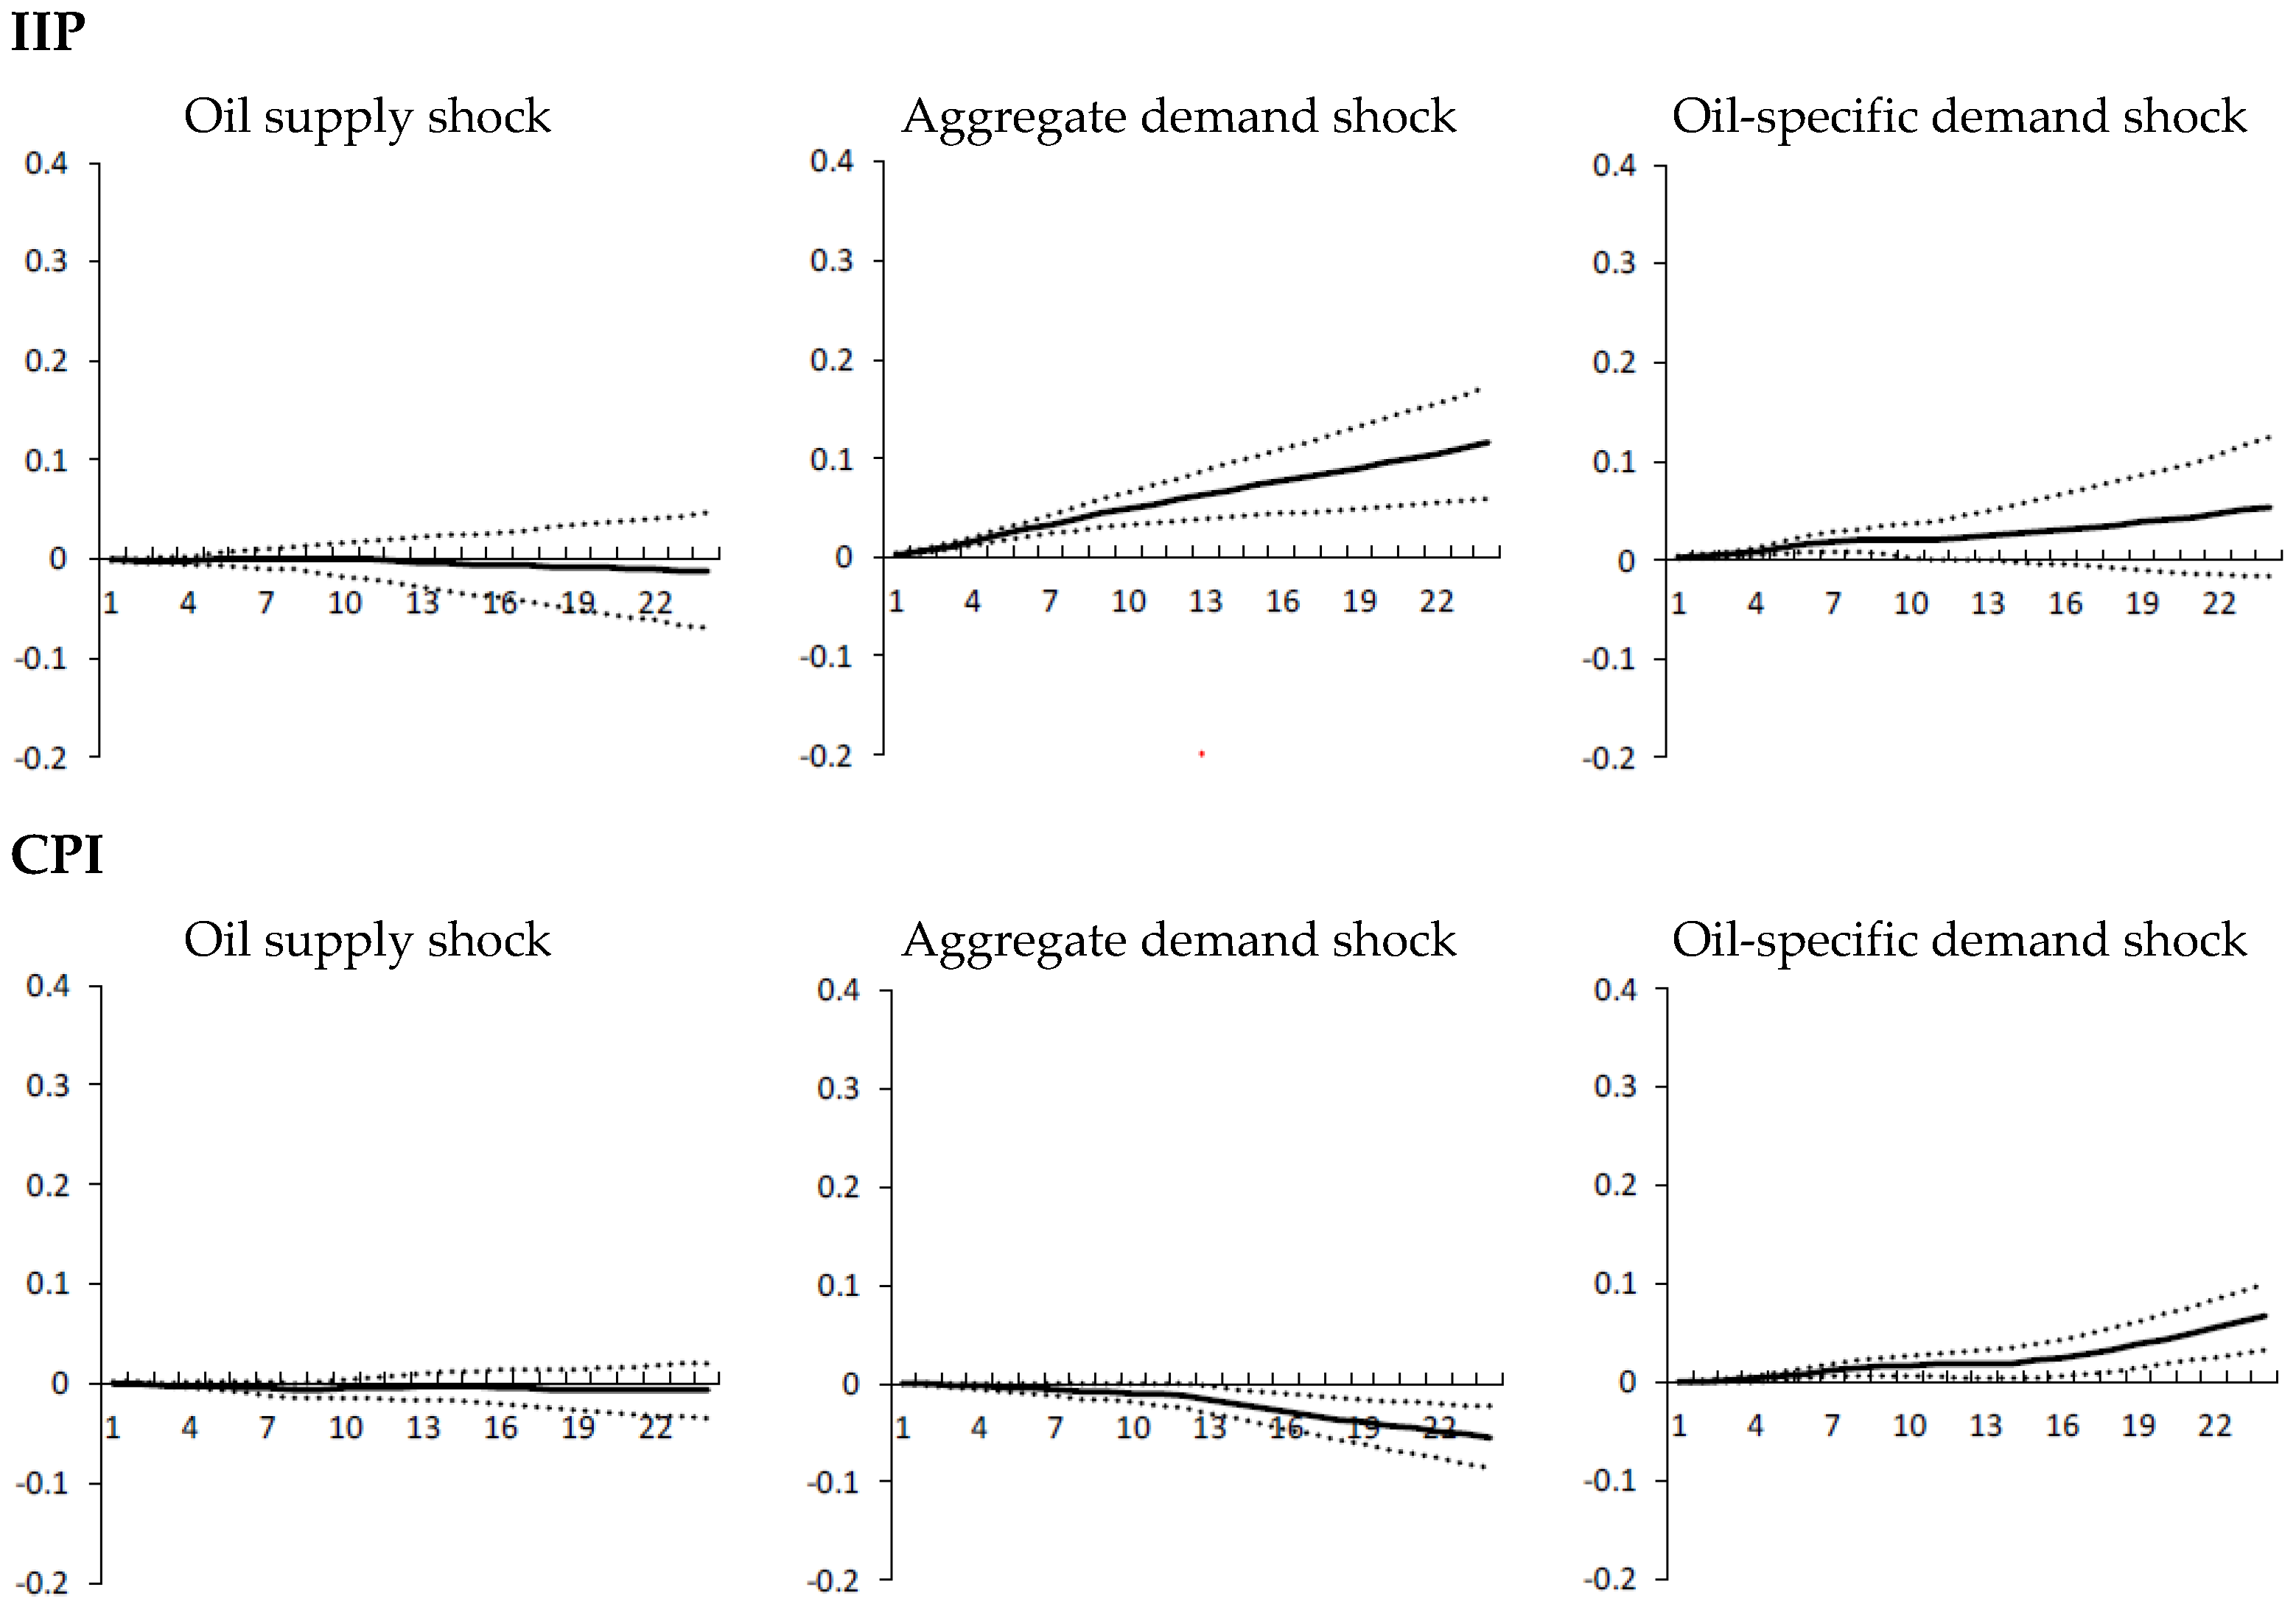
3.2. Brazil

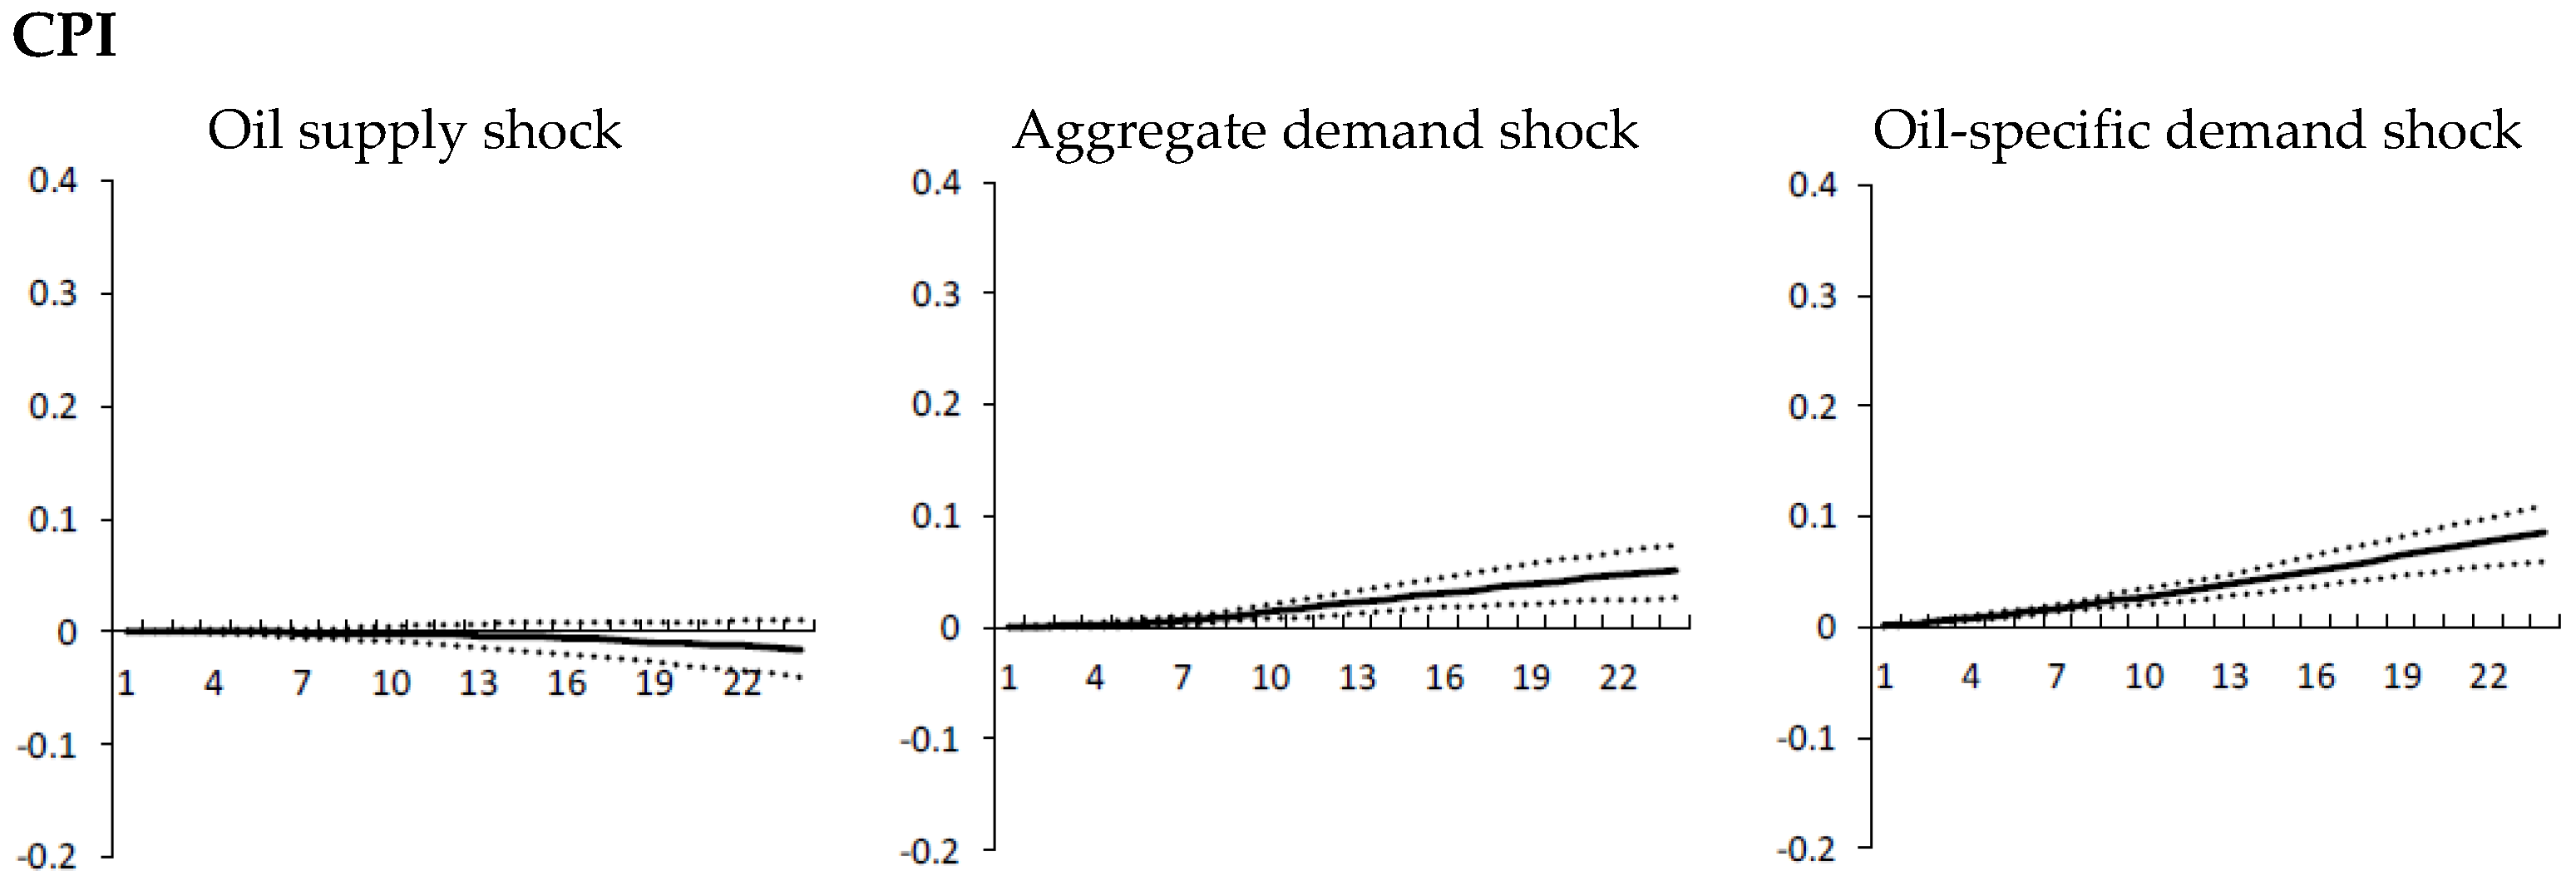
In Brazil, similar to the United States and most other emerging countries, oil supply shocks do not have statistically significant effects neither on IIP nor CPI. Both aggregate demand shocks and oil-specific demand shocks lead to a statistically significant increase above the initial level from the first month onward. The major difference from the United States is that, in Brazil, despite these stimuli in economic activity from aggregate demand shocks and oil-specific demand shocks, these two demand shocks shift the CPI downward. On the other hand, CPI does not go below the initial level in the United States.

3.3. Chile

The impulse response patterns look similar to those of the United States. The major difference is that unlike in the United States, the oil-specific shock leads to a persistent rise in IIP and the response is statistically significant.
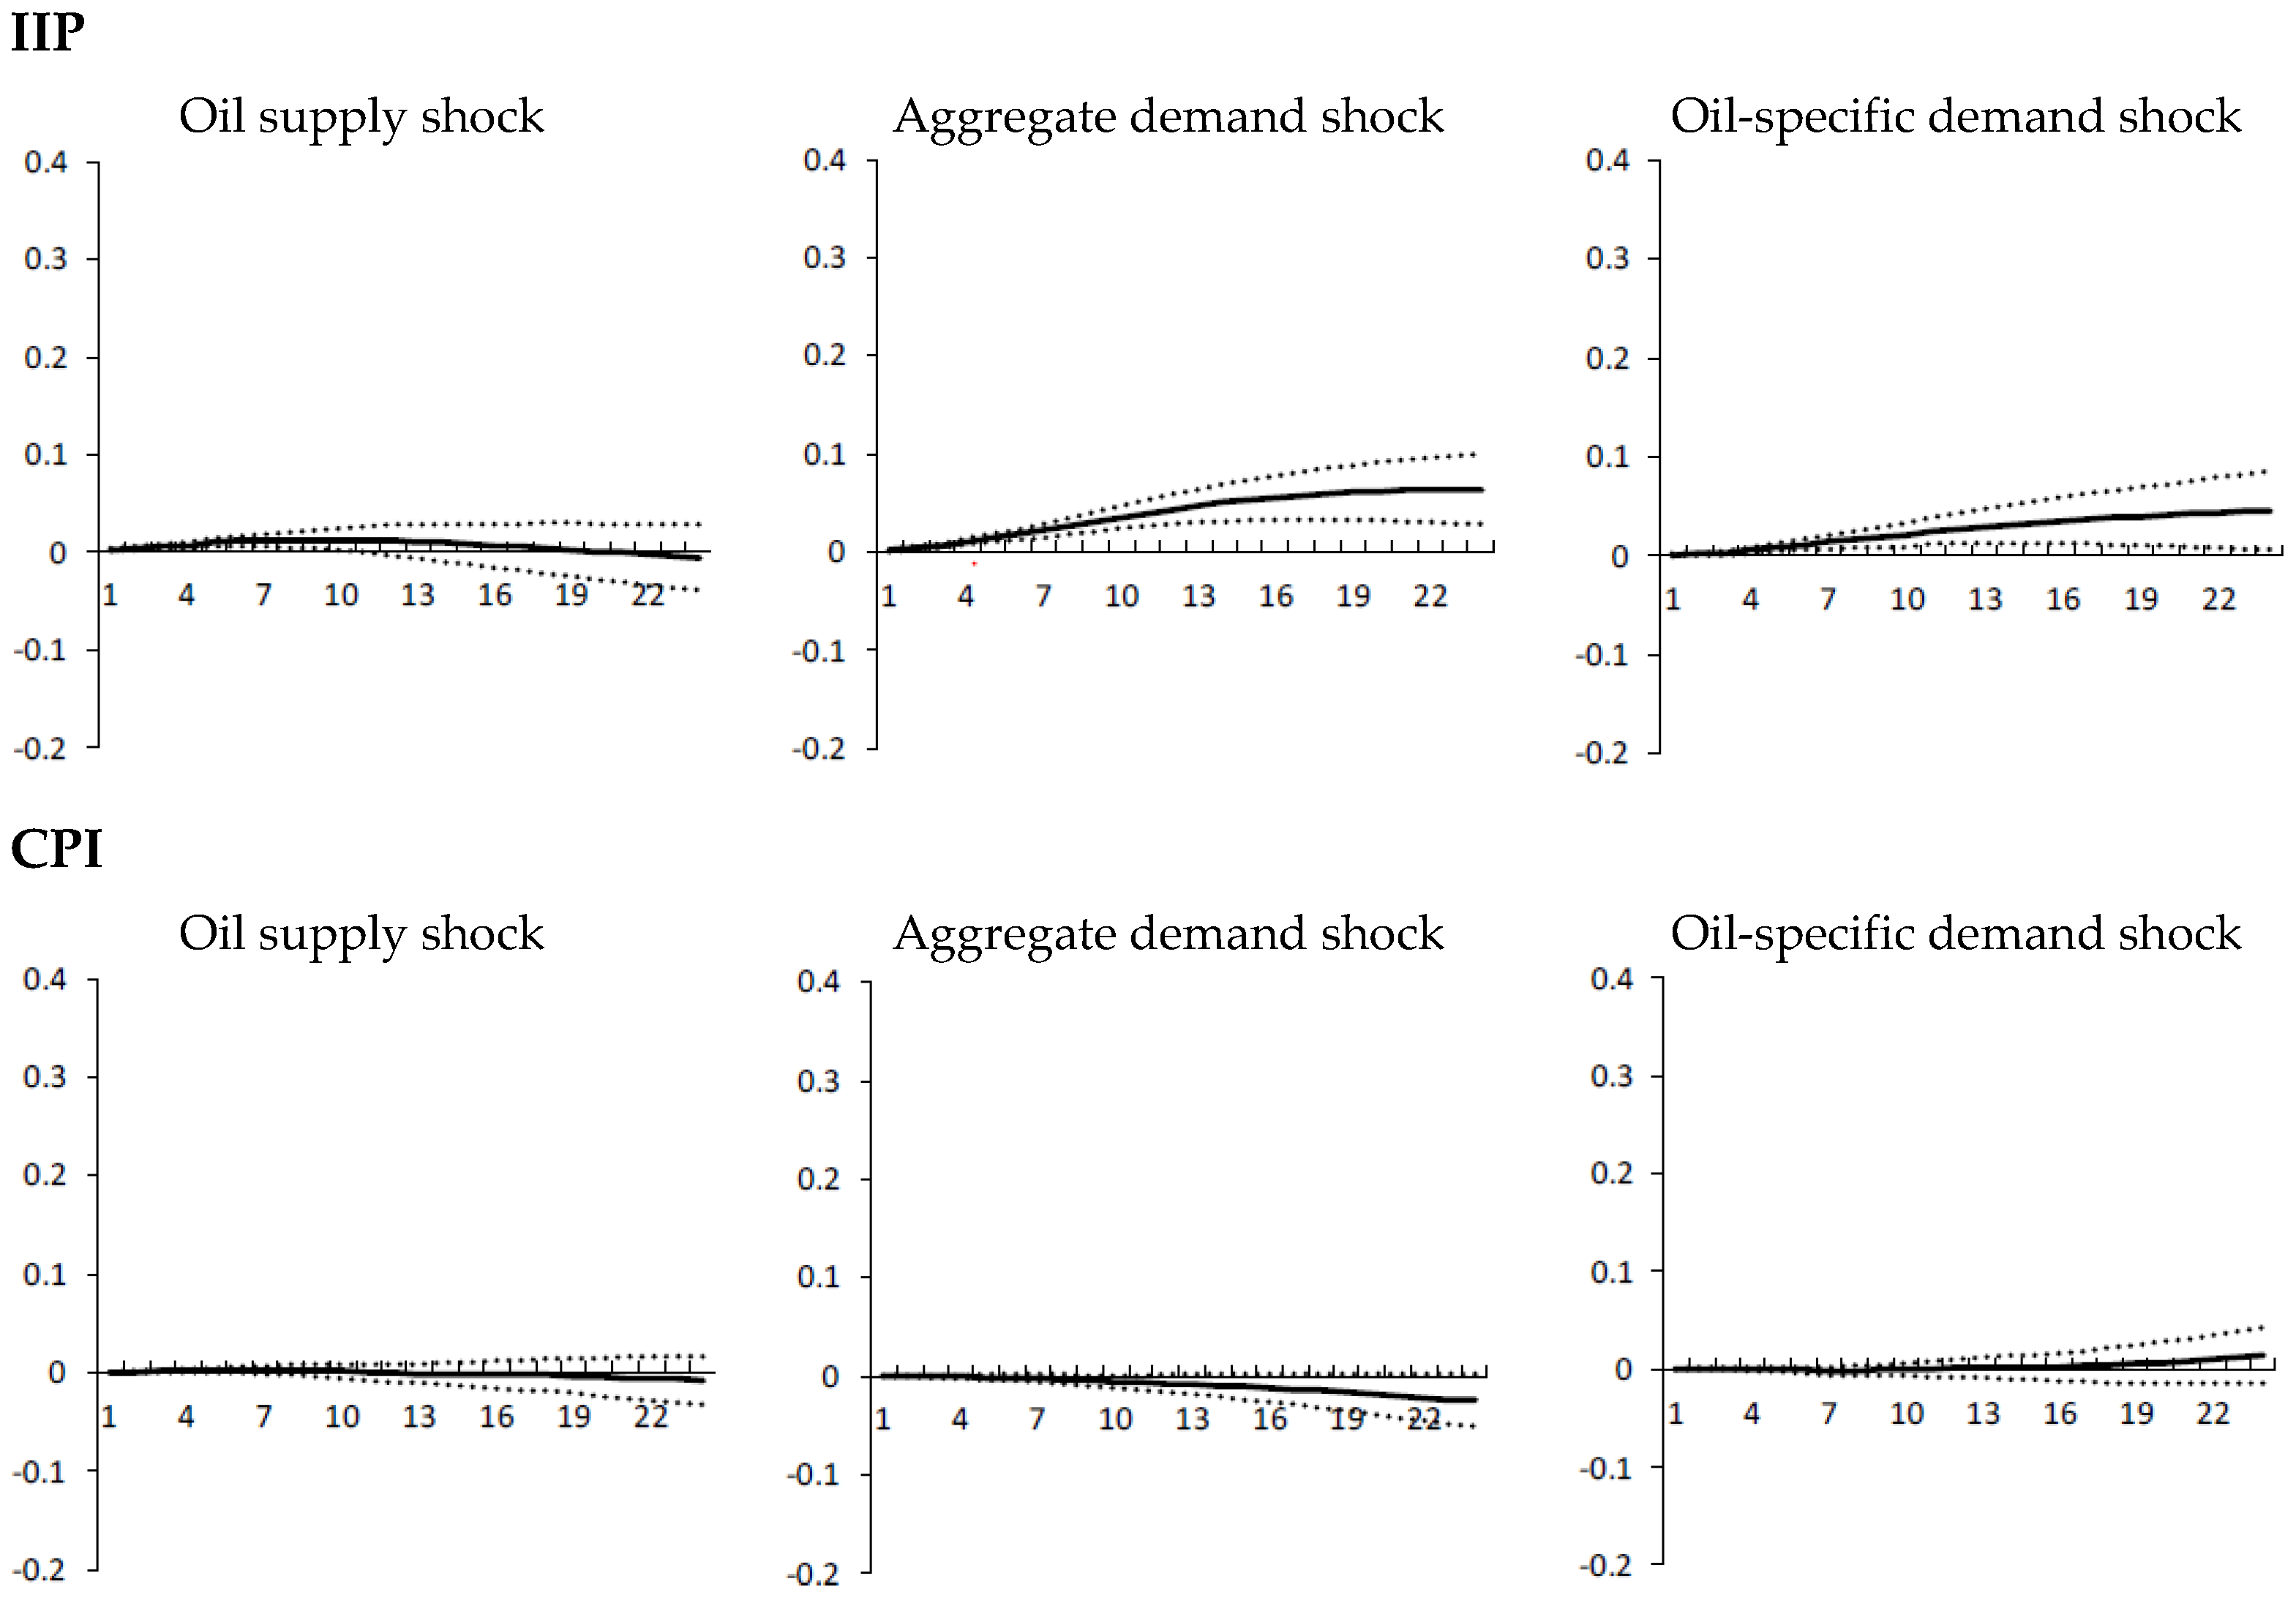
3.4. India

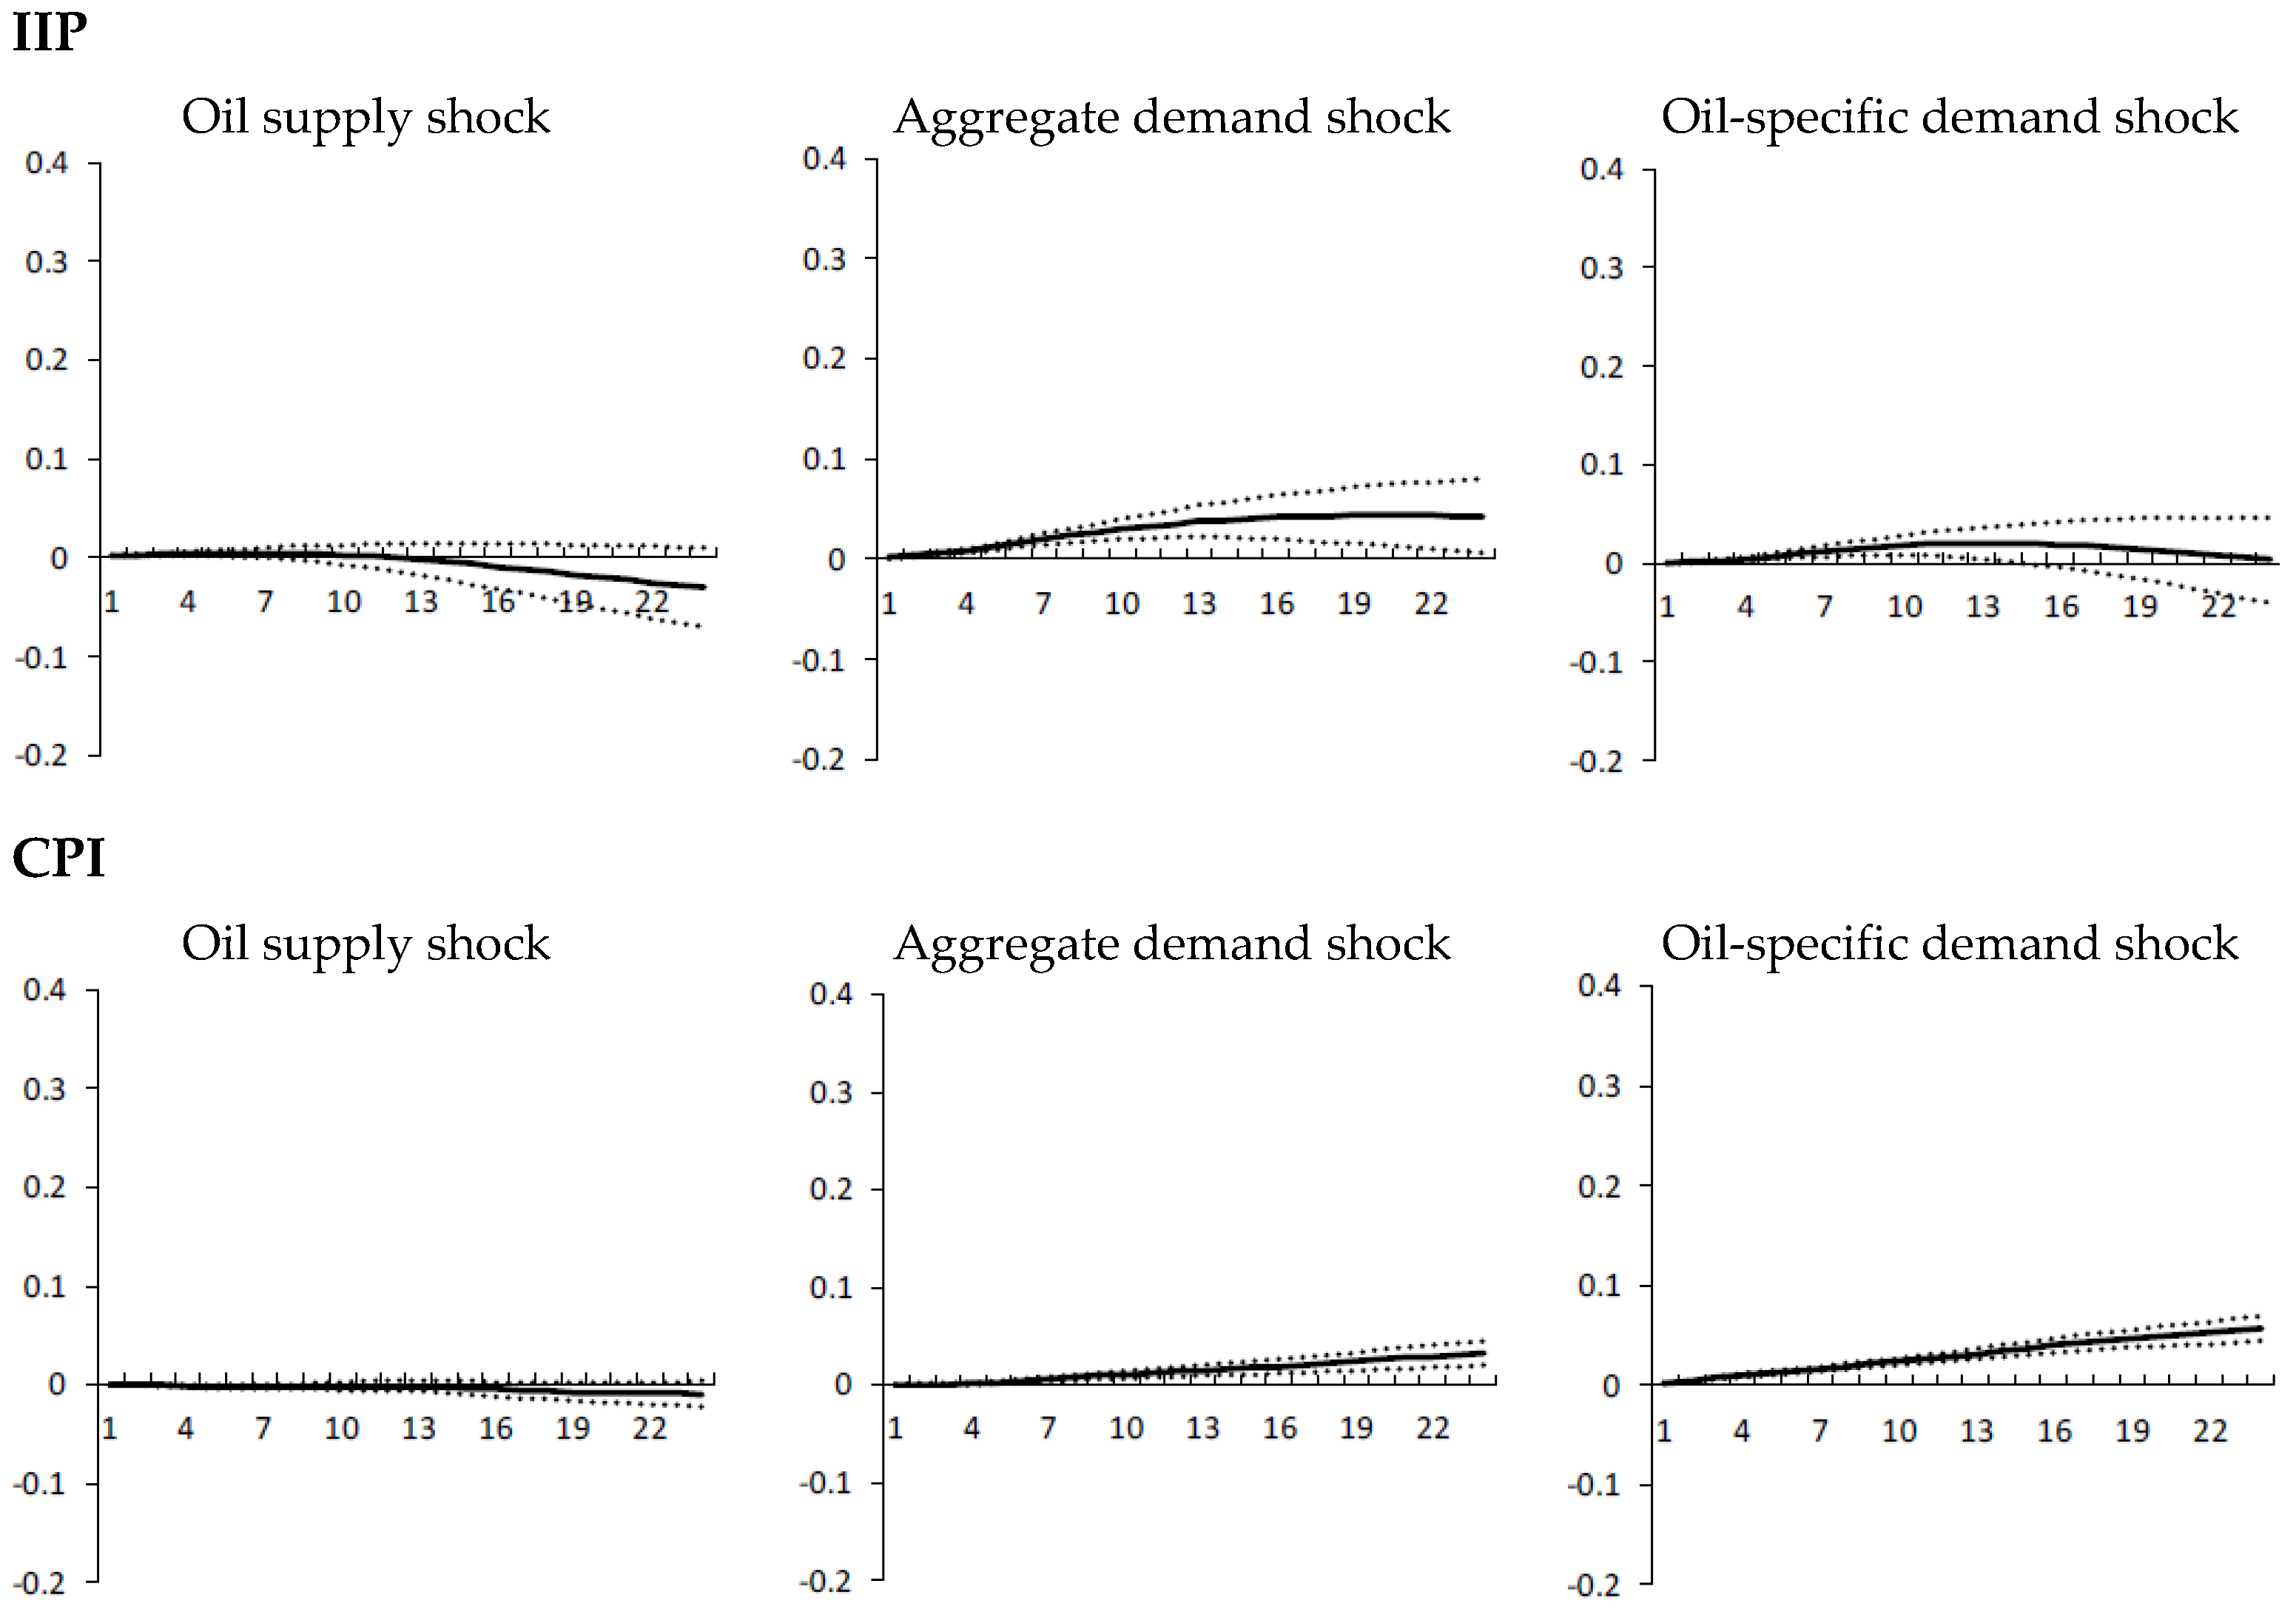
The inconsistent move between IIP and CPI that occurred because of the aggregate demand expansion can be seen in India as well as Brazil. Despite the economic performance being good under the aggregate demand expansion, the CPI goes under the initial level at all horizons. Oil-specific demand shock increases both production and price level in the long run.

3.5. Mexico

The response patterns are very close to those of India. The difference is that the oil-specific shock leads to a much smaller increase in CPI than that of India and the effect is statistically insignificant.
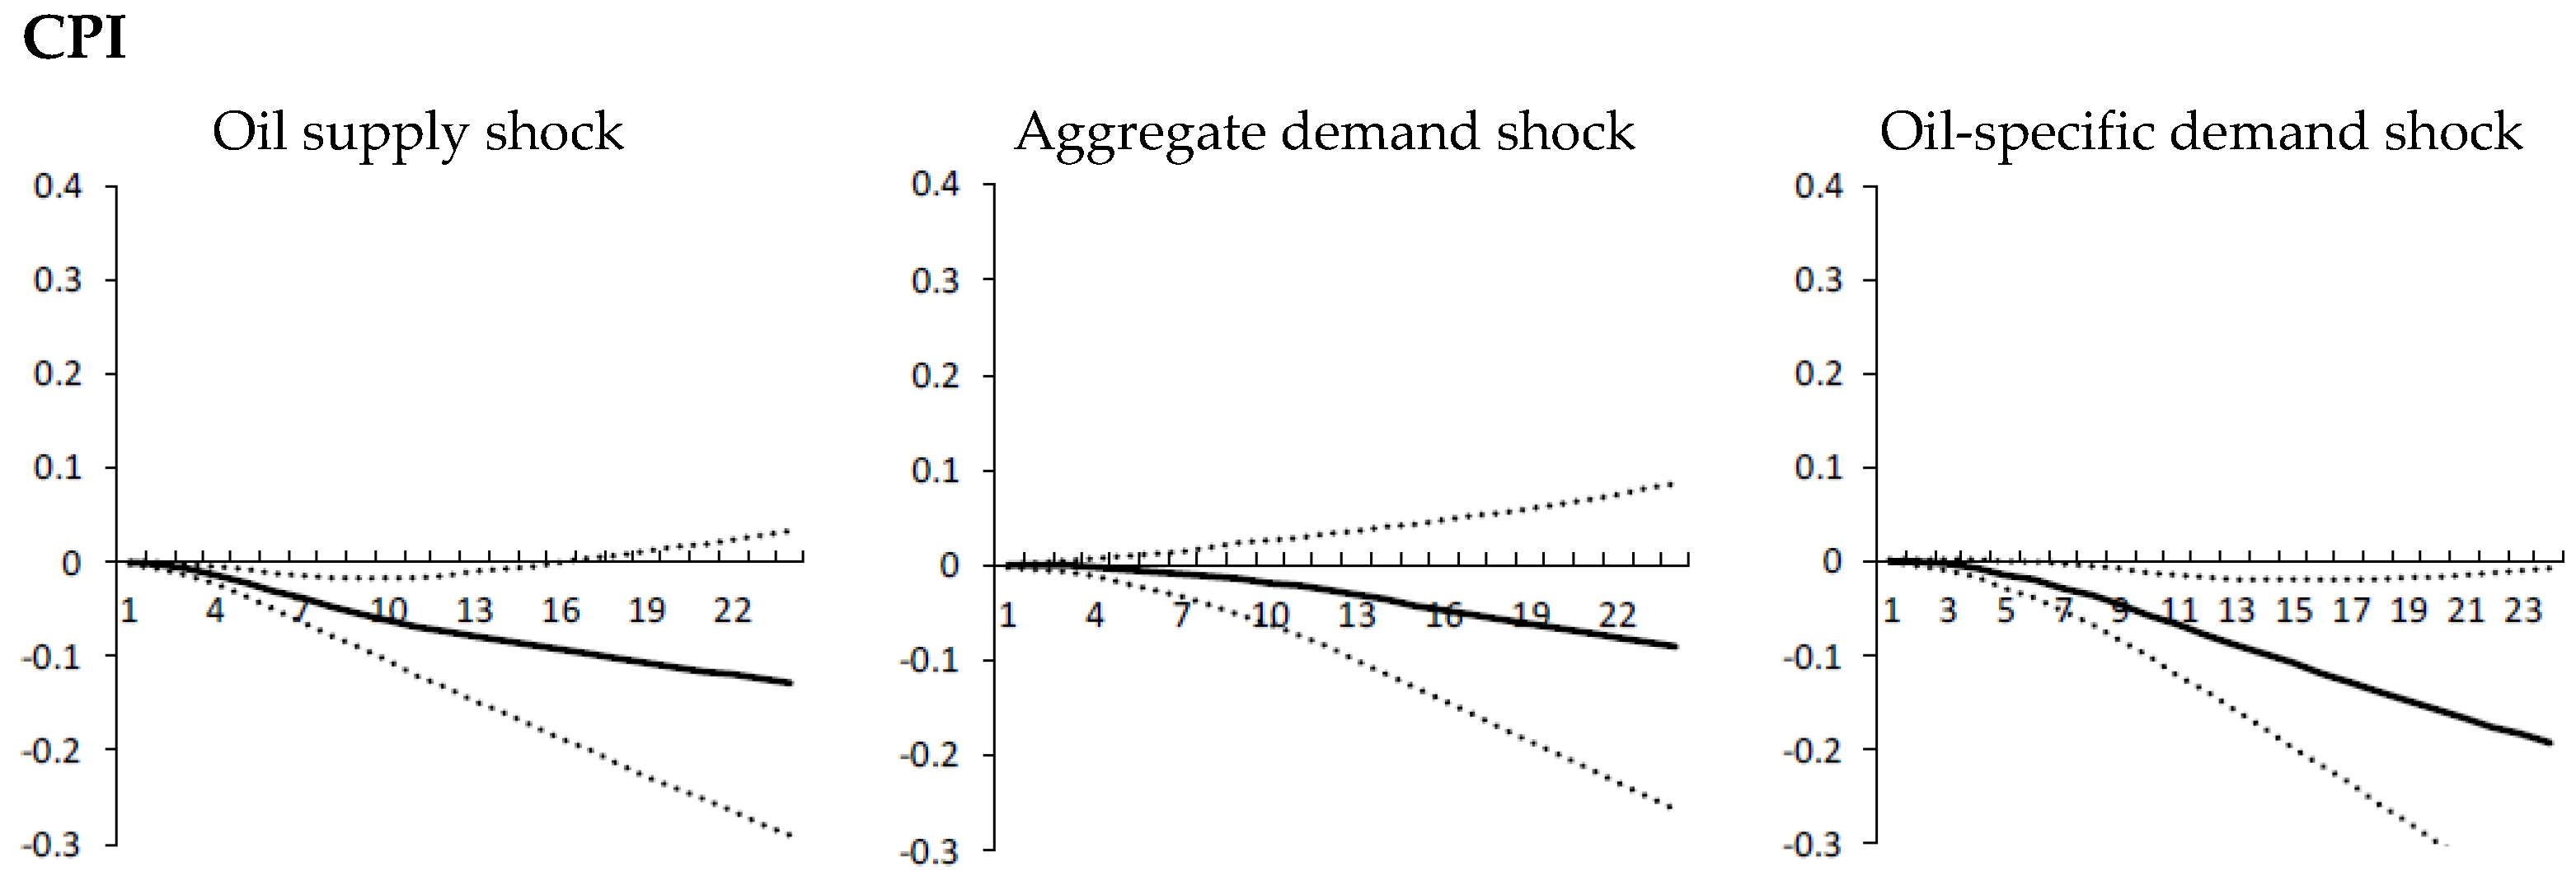
3.6. Russia

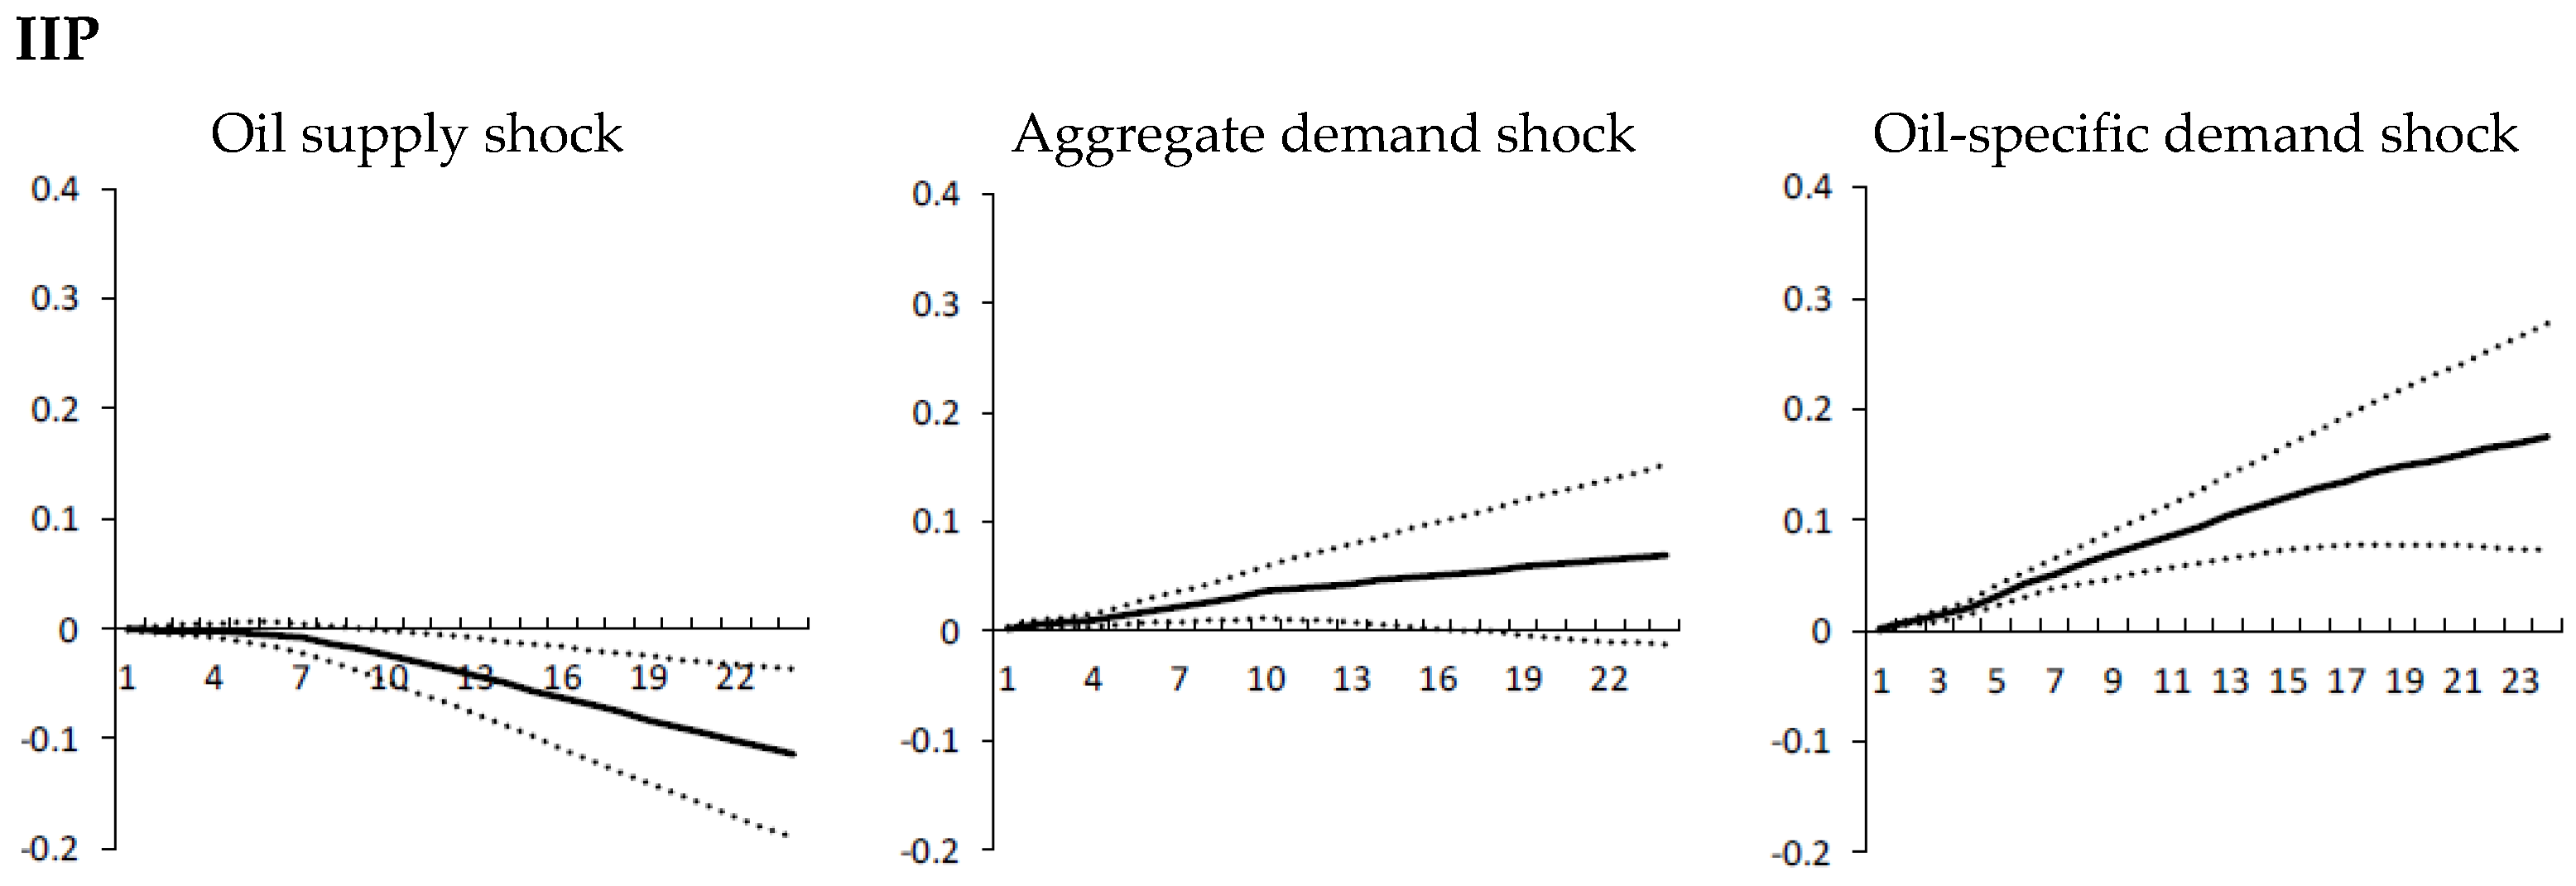
The impulse response patterns of Russia differ greatly from other emerging countries. Unanticipated oil supply expansion significantly lowers the level of production in Russia, which is unique among the six countries. The amount of decrease is the largest among sample countries. This may be explained by Russia being the one of the world’s largest oil producers3; when facing unanticipated oil supply innovation, Russia’s share of the world oil market tends to fall. Therefore, the production level in Russia would also decline. Both aggregate demand shocks and oil-specific demand shocks cause a significant level shift in IIP. At the same time, those two demand shocks push the CPI downward. The effect is significant only when unexpected oil specific-demand shock occurs.

4. Discussion

Based on a two-block structural VAR model established by Killian and Park (2009) [1], we investigate the effects of oil price shocks on the economic activity and price level of the emerging countries. To the best of our knowledge, this study is the first attempt to show, using the two block SVAR method, how the oil price shock affects the developing economies.
The main results can be summarized as follows: First, as well as the United States, we revealed that the effect of oil price shocks on IIP and CPI in emerging countries also depends on where the changes fundamentally come from. Second, we found that the transmission mechanisms of oil price change differs greatly between the United States and emerging countries. For instance, aggregate demand expansion leads to a significant rise in the U.S. IIP and CPI. Unlike the United States, for some emerging countries (Brazil, India, and Mexico), the shock lowers the level of price significantly. This difference may reflect the existence of a price regulation system in emerging countries on oil related goods and food, etc. Finally, we revealed that the response patterns vary among emerging countries. For example, we find no evidence that unexpected oil supply shocks cause no long-run effect on production in all countries, except Russia. This can be explained by the fact that the Russia’s share in the world oil market is far higher than that of other emerging countries.
Although our two-block structural VAR approach enabled us to reveal the response of CPI to higher oil price in emerging countries, the effects of change in oil price of detailed category of goods and services are still unknown. Considering the existence of price regulation system on some specific goods-categories, it is worth examining the impact of higher oil price on detailed category prices. Moreover, time-varying-VAR models that incorporate possible structural breaks in the global oil market are also promising methods to deepen our understanding of the transmission mechanisms of oil price shocks.

Author Contributions

Yukino Sakashita made the conception and design of this article, acquired data, conducted analysis and interpretation of data and draft manuscripts. Yasunori Yoshizaki made critical revision of the article.

Conflicts of Interest

The authors declare no conflict of interest.

References

  1. L. Kilian, and C. Park. “The impact of oil price shocks on the U.S. stock market.” Int. Econ. Rev. 50 (2009): 1267–1287. [Google Scholar] [CrossRef]
  2. J.D. Hamilton. “Historical causes of postwar oil shocks and recessions.” Energy J. 6 (1985): 97–116. [Google Scholar] [CrossRef]
  3. J.D. Hamilton. “Oil and the macroeconomy since World War II.” J. Political Econ. 91 (1983): 228–248. [Google Scholar] [CrossRef]
  4. M. Gisser, and T.H. Goodwin. “Crude Oil and the Macroeconomy: Tests of Some Popular Notions.” J. Money Credit Bank. 18 (1986): 95–103. [Google Scholar] [CrossRef]
  5. M.A. Hooker. “This is what happened to the oil price—Macroeconomy relationship: Reply.” J. Monet. Econ. 38 (1996): 221–222. [Google Scholar] [CrossRef]
  6. M.A. Hooker. “Are oil shocks inflationary? Asymmetric and nonlinear specifications versus changes in regime.” J. Money Credit Bank. 34 (1999): 540–561. [Google Scholar] [CrossRef]
  7. L. Kilian. “Not all oil price shocks are alike: Disentangling demand and supply shocks in the crude oil market.” Am. Econ. Rev. 99 (2009): 1053–1069. [Google Scholar] [CrossRef]
  8. I. Fukunaga, N. Hirakata, and N. Sudo. “The effects of oil price changes on the industry-level production and prices in the U.S. and Japan.” NBER Work. Pap., 2010. [Google Scholar] [CrossRef]
  • 1The index of world trade volume is the compilation of international trade flows among 96 individual countries plus the region Sub-Saharan Africa.
  • 2As for the oil price, the U.S. refiner acquisition cost of imported crude oil is used in Kilian (2009) [7]. Instead, we use the WTI, to investigate the effect of oil price change on economic activity in other countries rather than the U.S.
  • 3According to British petroleum statistics, Russia produced an average of 540.725 million barrels of oil per day in December 2015. This is 4.1 times larger than Brazil, 4.2 larger than Mexico and 13.1 times larger than India.
Figure 1. Cumulative responses of the index of the industrial production (IIP) and consumer price index (CPI) for the United States. Estimation is based on models (1)–(3). The dotted lines represent two-standard error bands.
Economies 04 00020 g001
Figure 2. Cumulative responses of IIP and CPI for Brazil. Estimation is based on models (1)–(3). The dotted lines represent two-standard error bands.
Economies 04 00020 g002
Figure 3. Cumulative responses of IIP and CPI for Chile. Estimation is based on models (1)–(3). The dotted lines represent two-standard error bands.
Economies 04 00020 g003aEconomies 04 00020 g003b
Figure 4. Cumulative responses of IIP and CPI for India. Estimation is based on models (1)–(3). The dotted lines represent two-standard error bands.
Economies 04 00020 g004
Figure 5. Cumulative responses of IIP and CPI for Mexico. Estimation is based on models (1)–(3). The dotted lines represent two-standard error bands.
Economies 04 00020 g005
Figure 6. Cumulative responses of IIP and CPI for Russia. Estimation is based on models (1)–(3). The dotted lines represent two-standard error bands.
Economies 04 00020 g006aEconomies 04 00020 g006b
Table 1. Data set and sources.
VariablesSources
World oil production (average per day in each month, thousands barrel)Energy Information Administration (EIA)
World trade volume (CPB World trade monitor, volumes, seasonally adjusted)CPB Netherlands Bureau for Economic Policy Analysis
WTI spot price (monthly average in dollar)Federal Reserve Bank of St. Louise
Domestic Index of Industrial Production (IIP)Organization for Economic Co-operation and Development (OECD)
Consumer Price Index (CPI)

