1. Introduction and Summary
Commissioned by the Institute and Faculty of Actuaries (IFoA), the purpose of this paper is to explore the impacts of changes in migration flows—in particular, those resulting from possible migration policy changes after a UK exit (‘Brexit’) from the European Union (EU)—on the finances of the UK state pension system.
Migration was one of the central issues in the EU referendum debate. At NIESR we have carried out extensive research and analysis on migration and the impact of migration on the economy, complimenting a well-established literature in this field.
1 Razin and Sadka (1999) [
1] is the first study to demonstrate that, in a dynamic context with a pay-as-you-go pensions system, immigrants can deliver a net fiscal benefit to the entire population present at the time of their arrival, even if they themselves are net beneficiaries of the pension system. In the theoretical framework of Razin and Sadka, this result is delivered by the reduction in the old-age dependency ratio that immigration is assumed to achieve. Key assumptions underlying the result are that the fertility of migrants and the educational distribution of migrant children are similar to the native population. These assumptions imply that immigration in the Razin and Sadka model is similar to a discrete increase in population size, and consequently relates closely to analyses of the fiscal implications of population growth explored elsewhere in the literature (e.g., Creedy and van de Ven, 2000 [
2]).
Since the analysis of Razin and Sadka (1999) [
1], the literature concerning the bearing of migration on fiscal aggregates has extended along a wide range of dimensions. Breyer and Kolmar (2002) [
3] explore the need for co-ordination between fiscally autonomous regions that permit free movement of labour. Intertemporal dynamics of welfare migration are studied using simulation methods by Geide-Stevenson and Ho (2004) [
4], and Fedotenkov (2014) [
5] explores associated implications of pension funding (pay-as-you-go or funded). Leers et al. (2003) [
6] consider interactions between fertility, wages and migration in a context where the value of pensions is determined by voter preferences. Their analysis reveals that the simple narrative—whereby a fall in fertility delivers higher wage growth, encouraging inward migration that off-sets upward pressure on the old-age-dependency ratio—can be overturned if the elderly successfully lobby for a rise in pensions paid for by taxes on labour.
In contrast to the theoretical literature that is cited above, empirical evidence concerning the fiscal impact of immigration has been relatively thin. Recent literature has, however, started to fill this gap. In 2014, for example, the
Economic Journal published a special issue focusing on evidence “that allows assessment of how much immigrants take out of and contribute to the public purse“, Dustmann and Frattini (2014 [
7], p. F565). Evidence from repeated cross-sectional survey data reported between 2001 and 2011 in that special issue suggests that, at least in Britain (the focus of the current paper), immigrants made a positive net fiscal contribution. This is especially true of immigrants from EEA countries, who Brexit is most likely to affect (Dustmann and Frattini, 2014 [
8]).
A number of studies have explored the likely fiscal implications for the UK of changes to migratory flows following Brexit. Wadsworth et al. (2016) [
9], for example, reports that EU immigrants to the UK “are more educated, younger, more likely to be in work and less likely to claim benefits than the UK-born. About 44% have some form of higher education compared with only 23% of the UK-born” (p. 1). Furthermore, the report concludes that “EU immigrants pay more in taxes than they take out in welfare and the use of public services” (p. 1). In a similar vein, Lisenkova and Sanchez-Martinez (2016) [
10] report results using an Overlapping Generations model, which indicate that the UK economy will be 9% smaller in aggregate, and 1% smaller per capita, by 2065 under Brexit. Lisenkova and Sanchez-Martinez also find that leaving the EU will have a negative impact on the UK’s public finances due to a rising dependency ratio.
One aspect of the Brexit debate that has not previously been considered, is the extent to which EEA migrants contribute to, and draw on, the state pension system in a dynamic context. To our knowledge, this is the first study to quantify the possible impact of alternative migration scenarios under Brexit on the UK pension system. To carry out this research we require some plausible alternative migration scenarios and a simulation model which differentiates the characteristics of EU and non-EU migrants and indigenous or native residents. Here we consider three possible migration scenarios based of the volume of migrant flows, and a further three scenarios where the earnings of new migrants are assumed to increase significantly following Brexit, designed to reflect an ‘Australian-style’ points system.
Our main conclusions are that reductions in immigration would have a negative impact on the public finances. To offset these impacts policy change in the form of increases in national insurance contributions, reductions in pensioner benefits, or increases in the state pension age could be used. More restrictive immigration policies would, not surprisingly, have more negative impacts. However, these impacts could be mitigated, and indeed reversed, were the government to introduce a skills or points based migration policy (perhaps similar to the policy in Australia) resulting in a very significant improvement in the incomes (and implicitly the skills or qualifications) of new immigrants. The reduction in EU migrants, an increase in total non EU migrants, and an up-scaling of skills are all policies that were aired in the UK referendum debate. However, an important policy question, which we do not address here, is whether these policies would and could actually be delivered in practice.
To carry out this analysis we use NIESR’s Lifetime Income Distributional Analysis model (LINDA), originally developed by NIESR for HM Treasury, Revenue and Customs, and the Department of Work and Pensions. A full description of the model can be found in van de Ven (2016) [
11], and a description of how the model’s parameters have been set is provided in van de Ven (2016) [
12]; a short non-technical summary is contained in
Appendix A [
13]. The model, which can be freely downloaded from the internet (
www.simdynamics.org), includes a detailed description of the UK tax and transfer system, as it stood at the time of the (April) 2016 Budget statement.
The simulated pensions system is comprised of three pillars. The first pillar is a means-tested welfare safety net (the Pension Credit) eligible to all resident adults over state pension age. Benefits payable under this pillar are withdrawn at a rate of 100% of other income up to a threshold, and 40% thereafter, until the benefit is exhausted. The second pillar is a contributory (basic) state pension, rights to which are accrued through the payment or accreditation of (national insurance) contributions during the working lifetime. The value of the full state pension payable under the second pillar is approximately equal to the threshold at which welfare benefits payable under the first pillar (discussed above) begin to be withdrawn at a rate of 40%. The third pillar is comprised of private (personal and occupational) pensions, which are simulated as (notional) defined contribution schemes, participation in which is voluntary. Benefits under the first two pillars are assumed to be paid from state pension age, which is defined by government, and is currently scheduled to increase from 65 in 2016 to 68 in 2034. In contrast, the timing of access to wealth held in private pensions is an endogenous decision in the model, and can be taken at any time between ages 55 and 74.
We use the LINDA micro-simulation model to show the impact of each of the six Brexit migration scenarios on key elements of government spending and tax revenue and the overall budgetary impact. This is done by taking differences between a simulation base scenario, and a counterfactual Brexit scenario, where the only differences between the two scenarios are the assumptions concerning migration.
We then consider the adjustments to each of three policy levers necessary to achieve budget neutrality under each Brexit migration scenario. The first lever considers rate adjustments to class 1 National Insurance Contributions, which is a proportional tax on labour income applied in the UK. The second lever considers the proportional adjustment required to the value of all state sponsored (first and second tier) pension benefits. The third lever considers adjustments to the state pension age. Importantly, labour and savings behavior are fully endogenous in LINDA, and consequently respond to changes in the incentives implied by transfer policy. This ensures that behavioural responses are fully taken into account in our projections. Note that much of the public debate thus far has only focused on one side—either the additional expenditure, due to claimed in-work benefits, or the additional income, due to higher taxes paid. In this study we bring them together to show the overall budgetary impact of the migration scenarios and assumptions about changes in future migrants’ income.
We add two caveats to these findings. First, while the impact of alternative migration scenarios on tax revenue and expenditure are large and statistically significant, the net effect on the government budget—although substantive—is not statistically significant. This underscores the importance of uncertainty associated with the projected effects. Second, the increase in total state retirement benefits over the time period considered, without any change in migration policy, of around £94 billion dwarfs the higher costs due to any changes in migration scenarios we consider. From this perspective, the substantive issues are about domestic policy.
2. Migration Scenarios
As the review by O’Donoghue et al. (2010) [
14] makes clear, there are a wide range of alternative approaches used to simulate the effects of migration in the microsimulation literature. Key modelling decisions include whether to model net migration or immigration and emigration flows separately, the variables that describe the likelihood of emigration, the approach taken to generate the characteristics of immigrants, and whether to accommodate re-entry of emigrants. These decisions depend upon the reasons for the respective model’s development, and the data that are available for parameterisation.
Migration has been accommodated in LINDA to meet two key objectives. First, the model should be capable of reflecting official projections for the age distribution of the population through time. Secondly, the model should reflect the bearing that contemporary trends concerning migration would have on the distribution of income if they were to continue into the projected future. Although the first of these two objectives could be achieved by modelling net migration only, allowing for both immigration and emigration helps to meet the second objective. LINDA is consequently designed to accommodate explicitly both immigration and emigration in each simulated year.
There are two key approaches to generating the characteristics of recent immigrants in a microsimulation context (see, e.g., Duleep and Dowhan, 2008 [
15]). The ‘regression’ based approach involves estimating a system of equations that describe all of the characteristics of interest, and to use these equations to generate the circumstances of new immigrants when they enter the model. Valid implementation of this approach is, however, exceptionally challenging in any context where more than a few characteristics need to be imputed. The alternative approach has been to initialise the circumstances of migrant entrants to the modelling frame by ‘cloning’ individuals selected from a ‘donor’ population pool. LINDA employs a cloning method for generating new migrants.
The model parameters include the total numbers of immigrants and emigrants, distinguished by age and government office region, to be assumed for each prospective year. Importantly, the age distribution is exhaustive, including both the very old and very young. The model parameters also describe the proportion of emigrants who were previously immigrants, and the division of immigrants into age specific (domestic) disposable income quintiles. This set of parameters permits a series of ‘target numbers’ to be calculated, separately for immigrants and emigrants.
The model uses a procedure based on random draws to reflect the target numbers for migrants that are described above. Starting with immigration, the model selects at random and without replacement a candidate donor from the simulated domestic population. The characteristics that are used as targets for the immigrant population—namely, the numbers and age of benefit unit members, region, and disposable income quintile—are then evaluated for the candidate. The influence of the candidate on the target numbers for immigrants is determined. If recognition of the candidate as a donor benefit unit for immigration does not result in any one of the targets numbers being exceeded, then the candidate is accepted; otherwise they are rejected. New random draws continue to be taken until all targets for the immigrant population are met. Simulation of emigration proceeds in the same manner, subject to a slightly different set of targets.
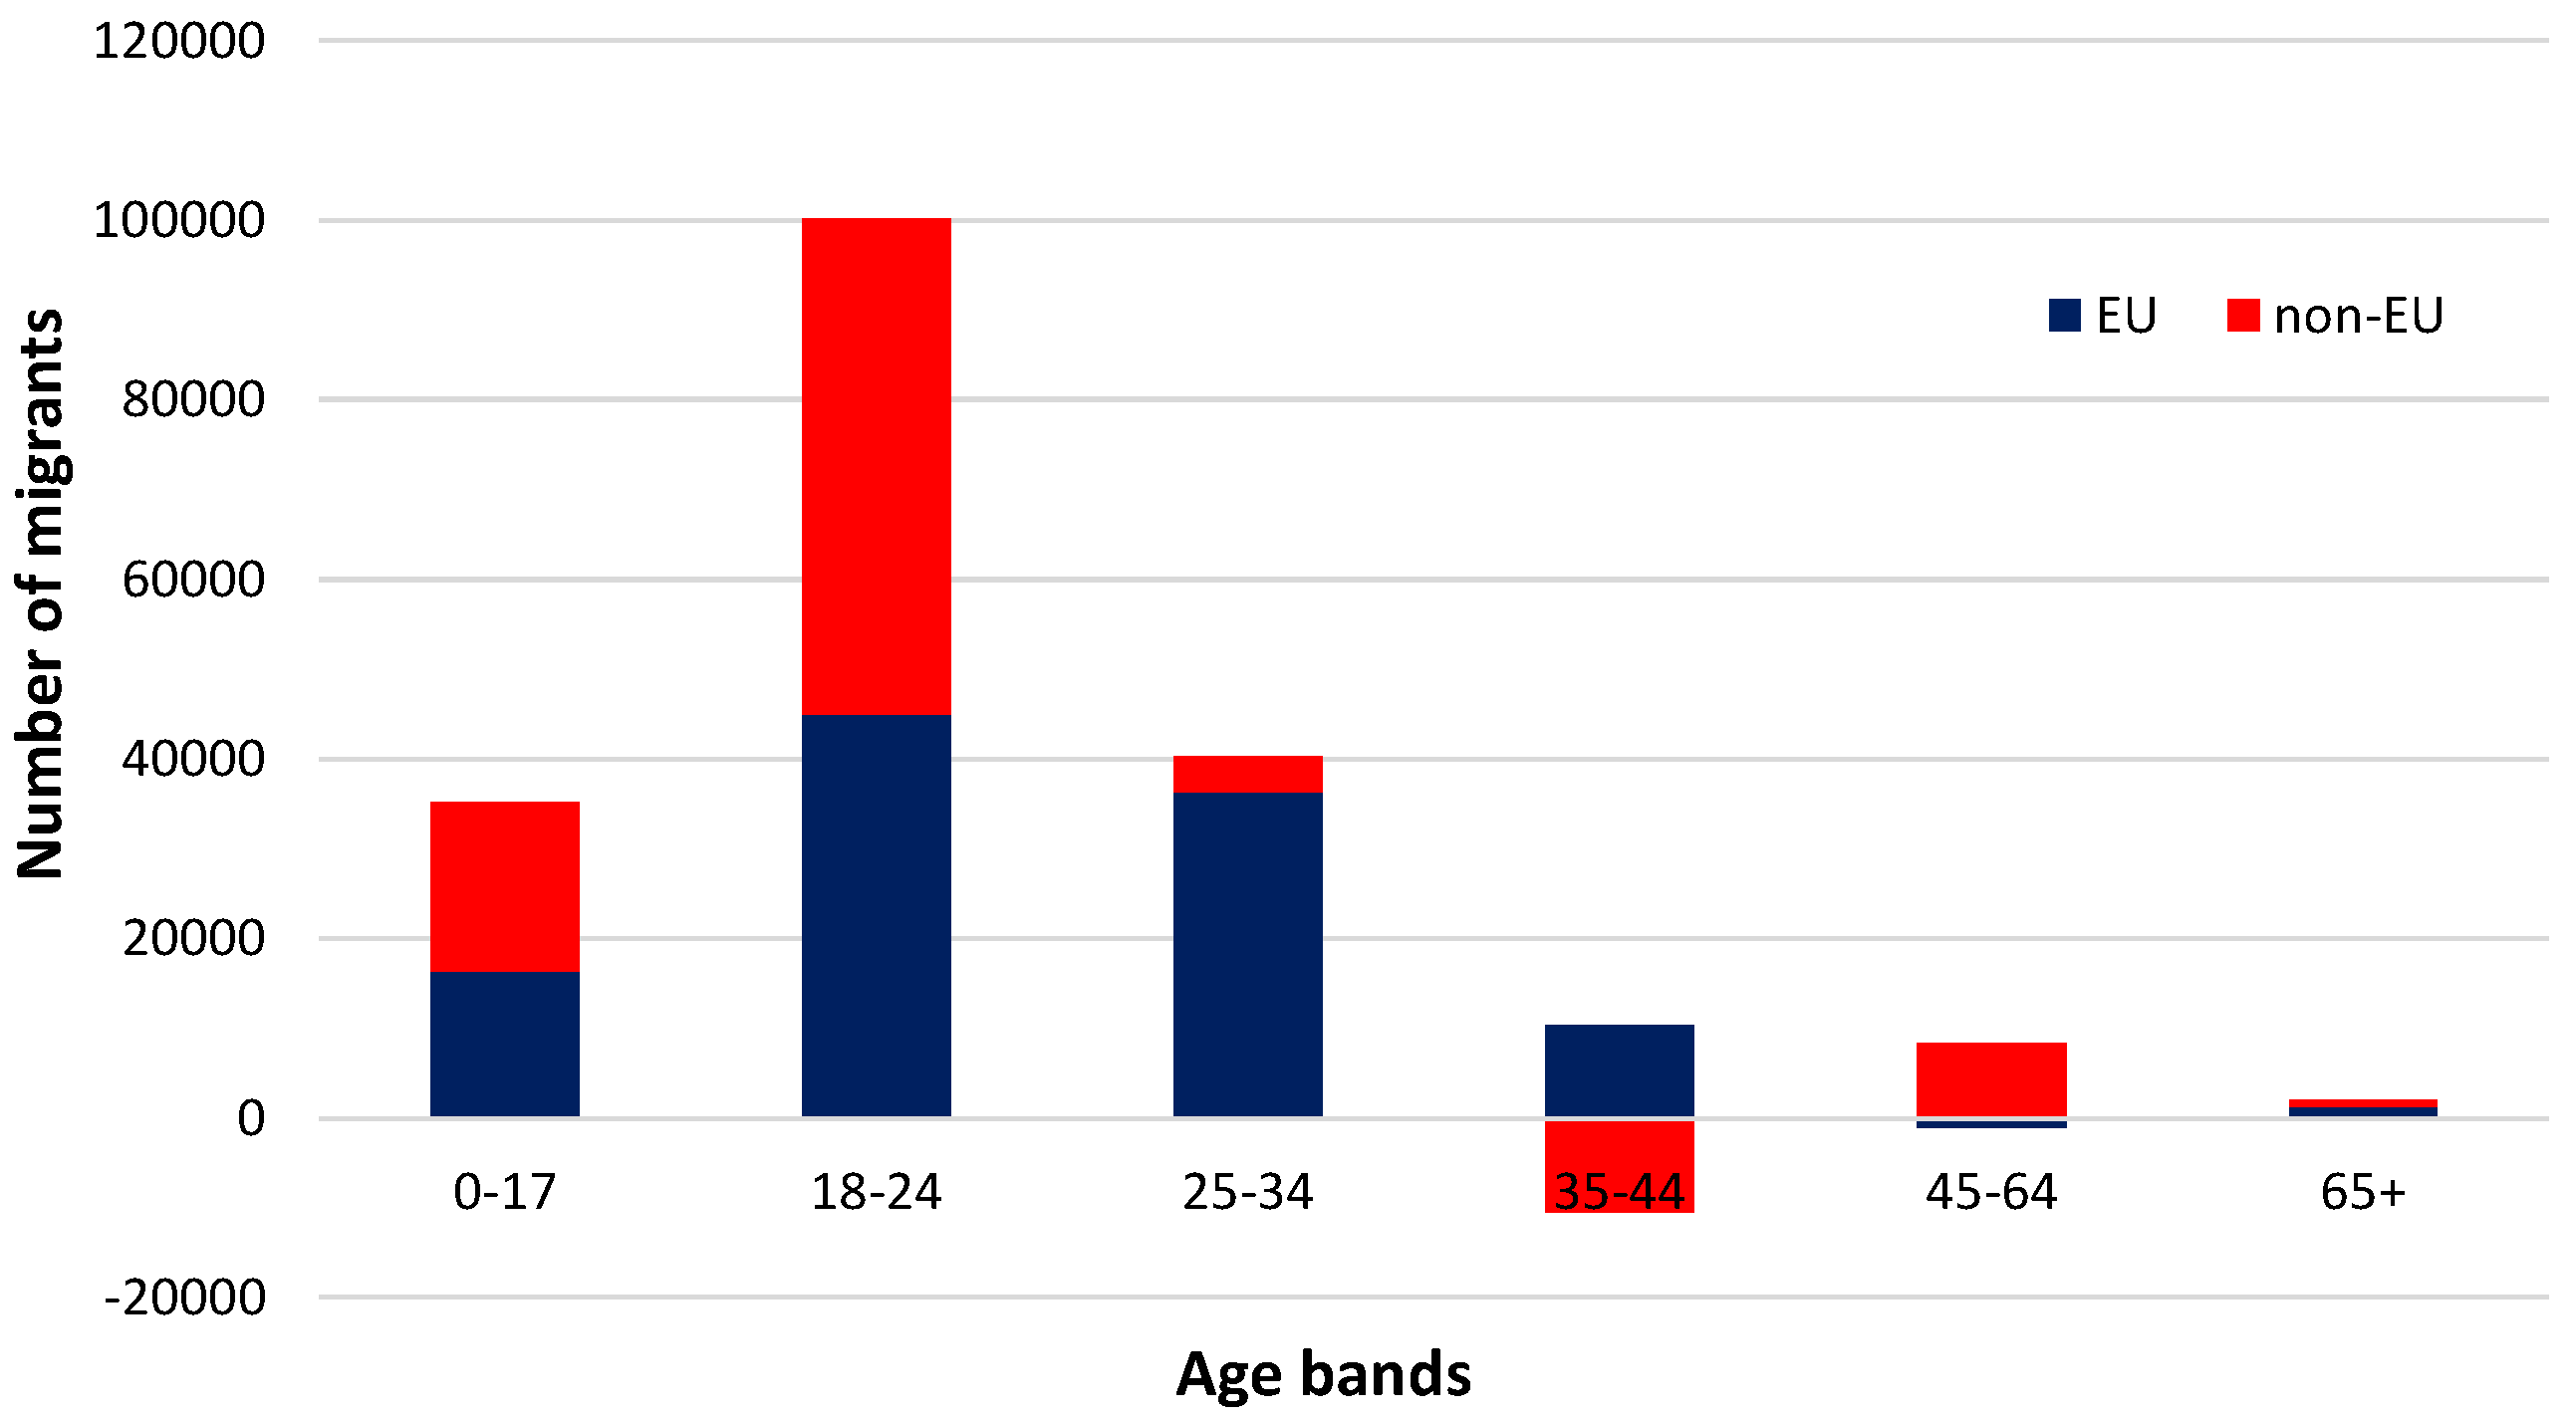
In order to model the impact of migration in LINDA, we consequently need to know the number and characteristics of immigrants and emigrants, differentiating between EU and non-EU migrants. As our base case, we take the 2014-based Principal Population Projections for the UK produced by the Office for National Statistics (ONS), and the migration assumptions contained therein. These are the official migration statistics and projections and we believe therefore they are an appropriate place to start. The official projections show net migration falling to 185,000 from 2020 to 2021, and remaining constant at that level in subsequent years. The ONS projects both immigration and emigration by age. We combine this with the ONS International Passenger Survey which shows the break-down between EU and non-EU migrants to project the base net migration scenario for 2020–2021 shown in
Figure 1 below.
However, the ONS Population Projections data does not provide any further details on the characteristics of the projected new migrants. We use data on recent UK immigration and emigration to disaggregate between EU and non-EU migrants; and we use data from the Family Resources Survey to estimate the income distribution of new migrants, and hence their labour market characteristics and outcomes. A summary of recent immigrants by age and income quintile distribution is presented in
Table 1 below. For example, of the 25 to 34 year old immigrants, 51.8% are in the lowest 40% of the overall UK gross income distribution.
2.1. Migration Flow Scenarios
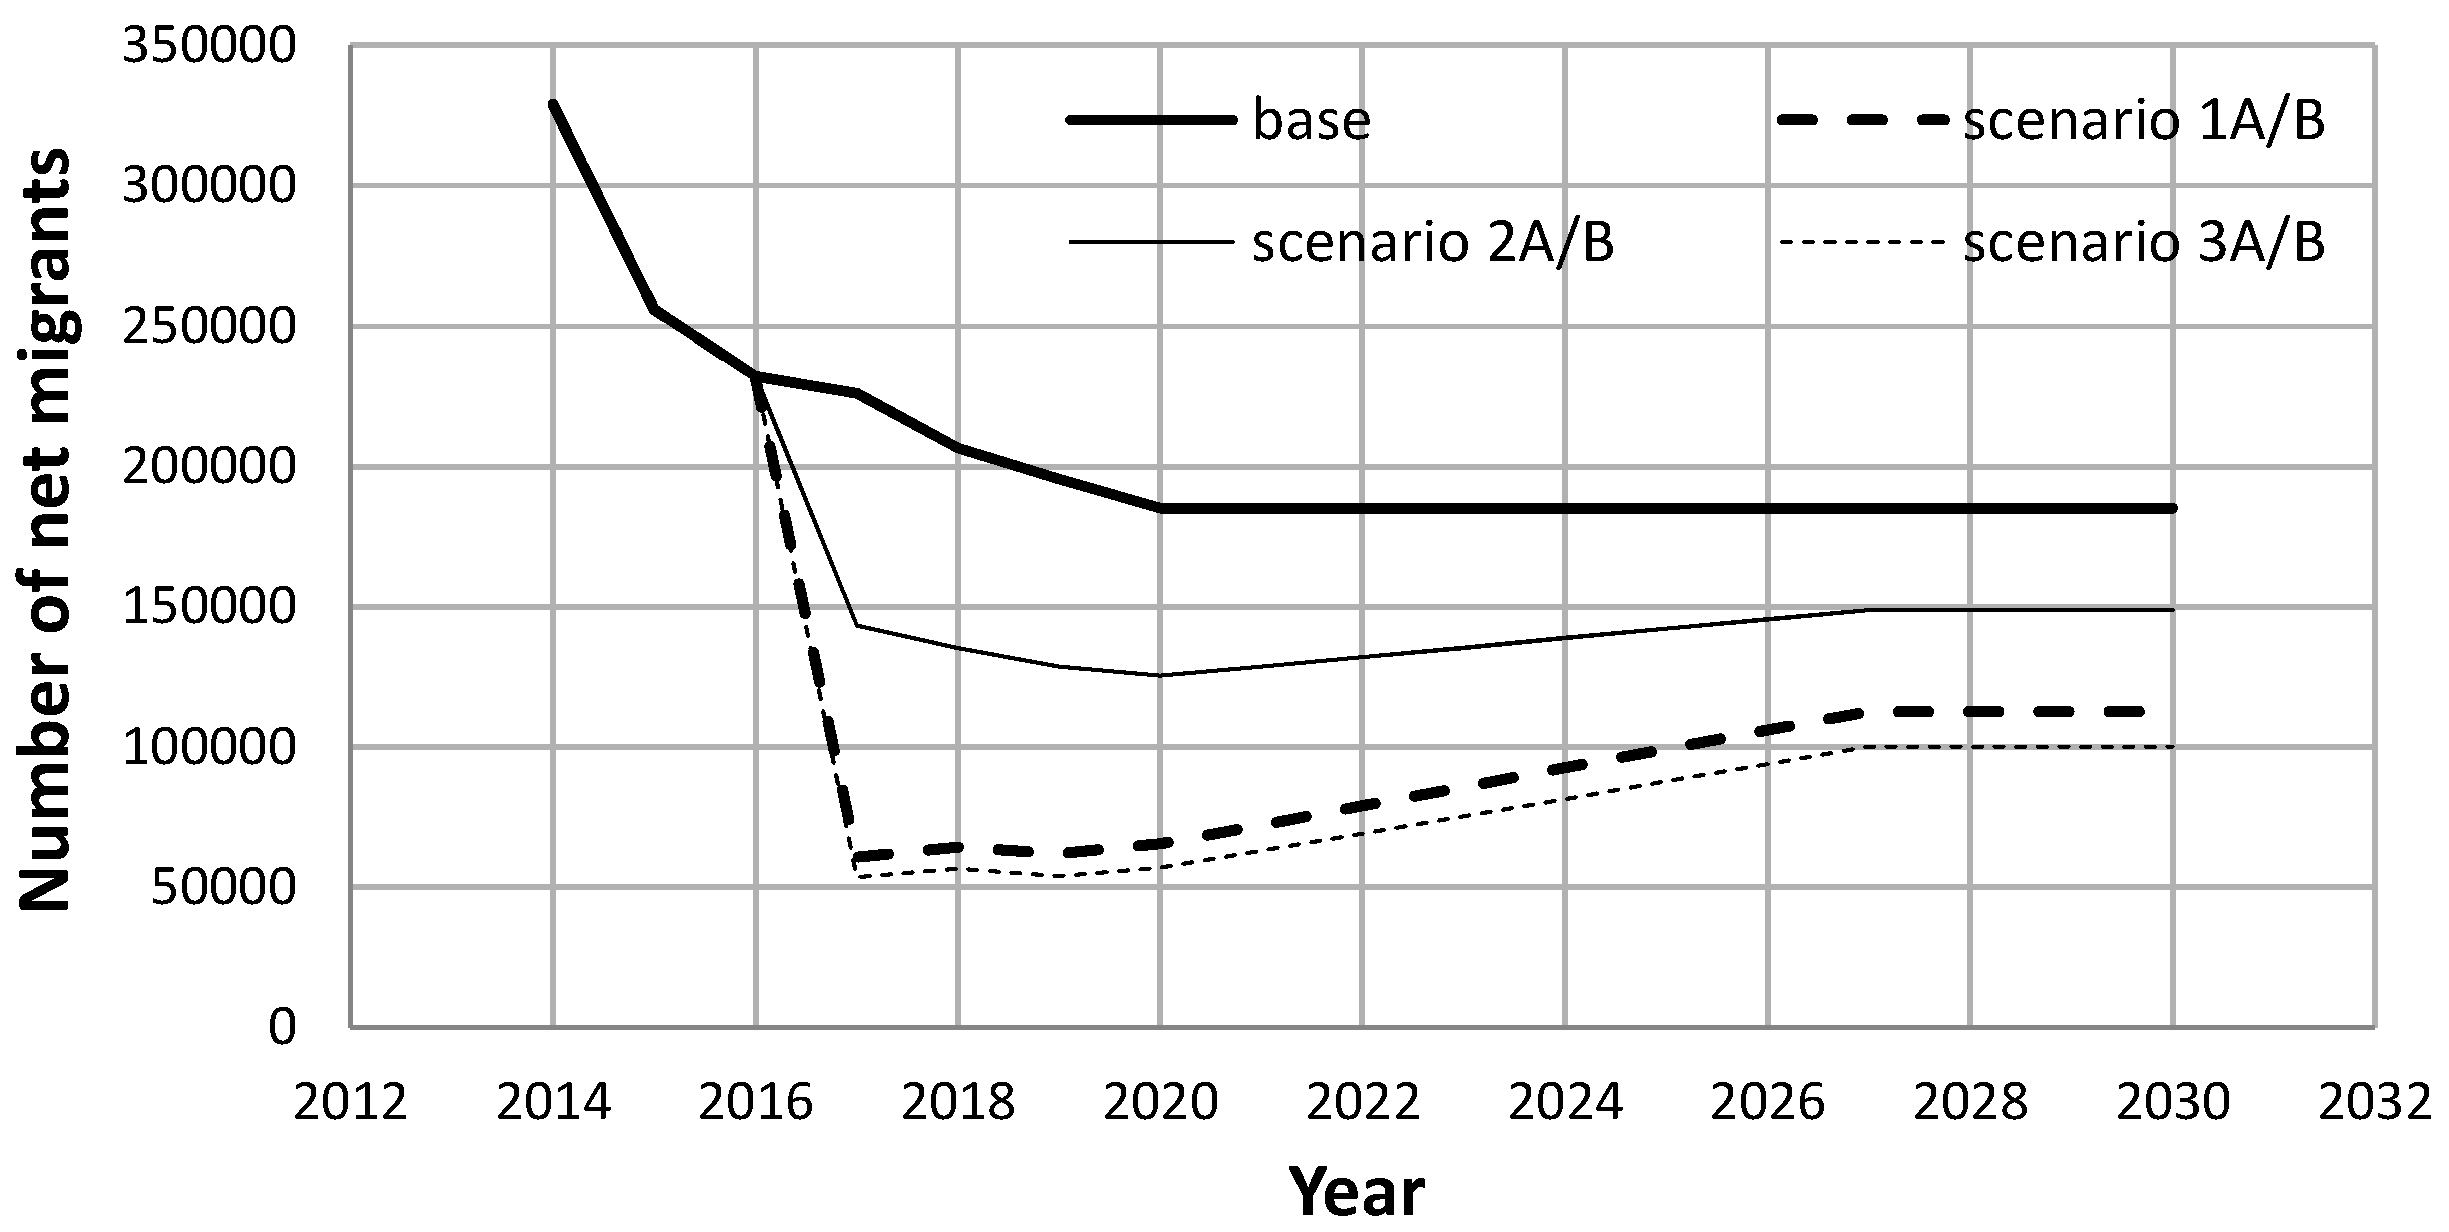
We construct six alternative scenarios to assess the impact of changes to migration policy after a possible Brexit outcome. These scenarios are implemented in our modelling from 2017 onwards. The first three scenarios listed below—1A, 2A and 3A—each differ by the number or flow of migrants, but we importantly assume that the incomes of new migrants remain unchanged from the base case based on the official projections. In each scenario we assume that emigration flows of UK natives out of the UK remains unchanged. The overall effect of these assumptions is shown in
Figure 2. The second set of scenarios, introduced in
Section 2.2 below, allows for assumed differences in earnings of migrants to reflect an illustrative points-based policy, also shown in
Figure 2.
2.1.1. Base
Population and migration projections contained in the ONS Populations Projections 2014.
2.1.2. Scenario 1A
Scenario 1A could be described as a “restrictive” policy. We assume a substantial reduction in EU migration, with no offsetting change in non-EU flows:
Immigration from the EU declines to 1/3 of base value in all years from 2017.
Immigration from outside the EU remains unchanged.
Emigration of immigrants who were originally from the EU declines linearly from 2018, stabilising at 1/3 of the original projection by 2027.
Emigration of UK natives and immigrants from outside the EU remain unchanged.
2.1.3. Scenario 2A
In Scenario 2A, we assume—as some proponents of Brexit have proposed—that a reduction in migration from the EU is offset, in part, by an increase in immigration from outside the EU:
Immigration from the EU declines to 1/3 of base value in all years from 2017.
Immigration from outside the EU increases to offset 50% of the reduction in immigrant numbers from the EU.
Emigration of immigrants who were originally from the EU declines linearly from 2018, stabilising at 1/3 of the original projection by 2027.
Emigration of immigrants who were originally from outside the EU increases linearly from 2018, stabilising in 2027 at a rate proportional to the rise in the number of non-EU immigrants arriving in the UK.
Emigration of UK natives remains unchanged.
2.1.4. Scenario 3A
In Scenario 3A, we assume that policy is adjusted to meet the government’s target that net migration should be reduced to 100,000 or below. This requires not just reductions in EU migration, but also some additional reductions in non-EU migration.
Immigration from the EU declines to 1/3 of base value in all years from 2017.
Immigration from outside the EU adjusts from 2017, so that total net migration stabilises from 2027 at 100,000 net new entrants per year.
This requires a reduction in non-EU net immigration from 77,000 to 64,000 per year or 17% fall in total over ten years.
Emigration of immigrants who were originally from the EU declines linearly from 2018, stabilising at 1/3 of the base projection by 2027.
Emigration of immigrants who were originally from outside the EU adjusts from 2018, to stabilise from 2027 at a rate proportional to the change in the number of non-EU (non-UK) immigrants.
2.2. Points-Based Migration Assumptions
As noted above, in Scenarios 1A, 2A, and 3A, we assume that that the incomes of new migrants remain unchanged from the base case; we simply vary the flow numbers. However, it is also possible that changes in policy will result in changes to the characteristics of new migrants. In particular, proponents of Brexit have argued that ending the free movement of labour would allow the UK to pursue a more targeted policy of economic migration, often described loosely as an “Australian-style points system”.
The model used to simulate the implications of alternative migration scenarios includes only a distinction between those holding graduate and non-graduate qualifications. In contrast, the Australian system of targeted skilled migration is designed to advantage the ‘skills’ in demand by the domestic labour market. This is in contrast with the model of skilled migration recently abandoned in Canada, which discriminated in favour of “higher” education in general. In context of the characteristics simulated by the model, the targeting of “skills” by the Australian-style points system is best proxied by income.
We consequently vary each of the scenarios discussed in
Section 2.1 by assuming that changes to migration policy mean that new immigrants have a different income distribution to past immigrants. In particular, we assume that policy changes mean that new immigrants to the UK have the same level of income relative to the resident population as currently observed for immigrants to Australia. This implies a considerable increase in the incomes earned by immigrants to the UK over that currently observed; the plausibility of this assumption is discussed below. Apart from immigrants under 25, all other immigrant age groups to Australia have a higher relative income than recent immigrants to the UK (comparing
Table 1 and
Table 2) although their incomes on average are still below the income of natives. The distribution of recent immigrants’ income to Australia is reported in
Table 2 below.
Combining the shift in immigrant incomes with the changes in migrant numbers produces three additional simulation Scenarios: 1B, 2B and 3B. The migration flows however remain the same quantum as shown in
Figure 2.
4. Discussion
The key conclusions from this analysis emerge immediately from the table above. Reductions in immigration would have a modestly negative impact on the public finances and the sustainability of the pension system, in both the medium (to 2032) and long term (to 2057). This is seen from Scenario 1A in 2032 and 2057 in the table. These impacts could be offset to make a budget neutral policy by an increase in national insurance contributions, reductions in pensioner benefits, or increases in the state pension age.
Table 4 shows that assuming that future immigrants have the same skills and earnings as those in the past, the effects on public finances are in the same direction for each of the three scenarios we have assumed. Scenario 2, which has a much smaller reduction in total migration, due to the assumption of an offsetting increase in non-EU migrants, has negligible effect on public finances. The takeaway message is that more restrictive immigration policies would, not surprisingly, have more negative effects on the net government budget.
These budgetary effects of limiting immigration to the UK could be mitigated, and indeed reversed, were the government able to successfully implement a radical change in the incomes (and implicitly the skills or qualifications) of new migrants. For example, if the distribution of migrant income relative to the income of UK natives resembled the distribution in Australia under the so-called ‘points system’. These findings are intuitively plausible—migrants, since they are mostly of working age, can be expected to have a positive impact on the public finances, although this impact may attenuate over time as they age. However, the skills mix, and hence incomes, of new migrants is a key driver of their fiscal impact, so a substantial improvement in the skills mix of new migrants can in principle offset the negative impacts of reducing migration.
Some important caveats are in order. First, the analysis here focuses on personal taxes and transfers: that is, we model the most important taxes on income and consumption, and spending on welfare benefits and pensions. Spending on other public services, such as health and education, and other tax revenues, such as taxes on companies and a number of other smaller revenue sources, are excluded from the analysis. However, our results are qualitatively similar to that of other analyses (OBR, 2015 [
16]; Lisenkova and Sanchez-Martinez, 2016 [
10]) which, while incorporating considerably less detail on the individual characteristics of the population, take account of a broader range of taxes and spending programmes.
Second, on the scenarios, these are inevitably stylised. In particular, the assumption in the “B” scenarios that the UK could immediately change the composition of new migrants to match that of Australian migrants is unrealistic. For example, Scenario 2B assumes a substantial increase in non-EU immigrants and a substantial increase in their qualifications (proxied by earnings) at the same time. The immigration systems, economies, labour markets, and sources of immigrant flows to Australia are entirely different from those to the UK; in addition, the UK has considerably less control over some migrants flows (for example, refugees) than over economic migrants. In practice, the B scenarios here should be regarded as an upper bound on the improvements to the fiscal position that could be achieved by changing the mix of new migrants.


