
Household’s Perception of Water Quality and Willingness to Pay for Clean Water in Mexico City

1
Departamento de Economía, Universidad Autónoma Metropolitana, Unidad Azcapotzalco. Av. San Pablo No. 180, Col. Reynosa Tamaulipas, Del. Azcapotzalco, Ciudad de México C.P. 02200, Mexico
2
CONACYT-UAM, Área de Crecimiento y Medio Ambiente, Departamento de Economía, Universidad Autónoma Metropolitana, Unidad Azcapotzalco. Av. San Pablo No. 180, Col. Reynosa Tamaulipas, Del. Azcapotzalco, Ciudad de México, C.P. 02200, Mexico
*
Author to whom correspondence should be addressed.
Economies 2017, 5(2), 12; https://doi.org/10.3390/economies5020012
Submission received: 20 February 2017
/
Revised: 27 March 2017
/
Accepted: 7 April 2017
/
Published: 11 April 2017
(This article belongs to the Special Issue The Role of Education and Health in Economic Development)
Abstract
:A 2011 survey of Mexico City’s households revealed that families prefer alternative sources of drinking water instead of relying in the city’s quality supply services. These include the purchase of bottled water, installation of filtration devices, and other means of water purification. The demand for better water quality was tested by estimating the household’s willingness to pay (WTP), using a contingency valuation (CV) experiment through an open-format questionnaire and by estimating a censored econometric (Tobit) model. The econometric study revealed that the WTP for better water quality is influenced by variables related with distrust of the water quality provided by the City and the organoleptic characteristics of the water supply, as well as spending on bottled water or water purification technologies. The average WTP surcharge for better potable water quality is US$3.1 or 4.7% of the bimonthly water bill, which is about 0.22% of the average family income in Mexico City. The percentage of WTP to income is bigger in poor families. This suggests that improving water quality is of greater importance for lower income families. Findings are consistent with previous studies that estimated the WTP for improvements in the services that supply water to households in the city. These include reduction of inefficiency and intermittency of the supply along with water quality, improve measuring water meters, reducing the obsolescence of the infrastructure and increasing adequate maintenance. Our research is the first to estimate the WTP for better water quality in Mexico City and constitutes a reference point for those that address the problem of water quality and its impact on the welfare and income of families.
Keywords:
perception of water quality; WTP for clean water; Mexico City’ water quality; contingent valuationJEL Classification:
D12; Q251. Introduction
Despite steadily increasing supply of drinking water throughout the world, water quality continues to be of concern in many developing countries and, to a lesser extent, in developed nations (UNDP 2006). In developing countries, many urban areas face the unevenness between supply and demand of reliable supply of good quality drinking water (Soto Montes de Oca and Bateman 2006). Moreover, the income and subsidies given to water facilities often are not sufficient to adequately maintain the necessary infrastructure and to ensure the quality of the water supply (Gadgil 1998).
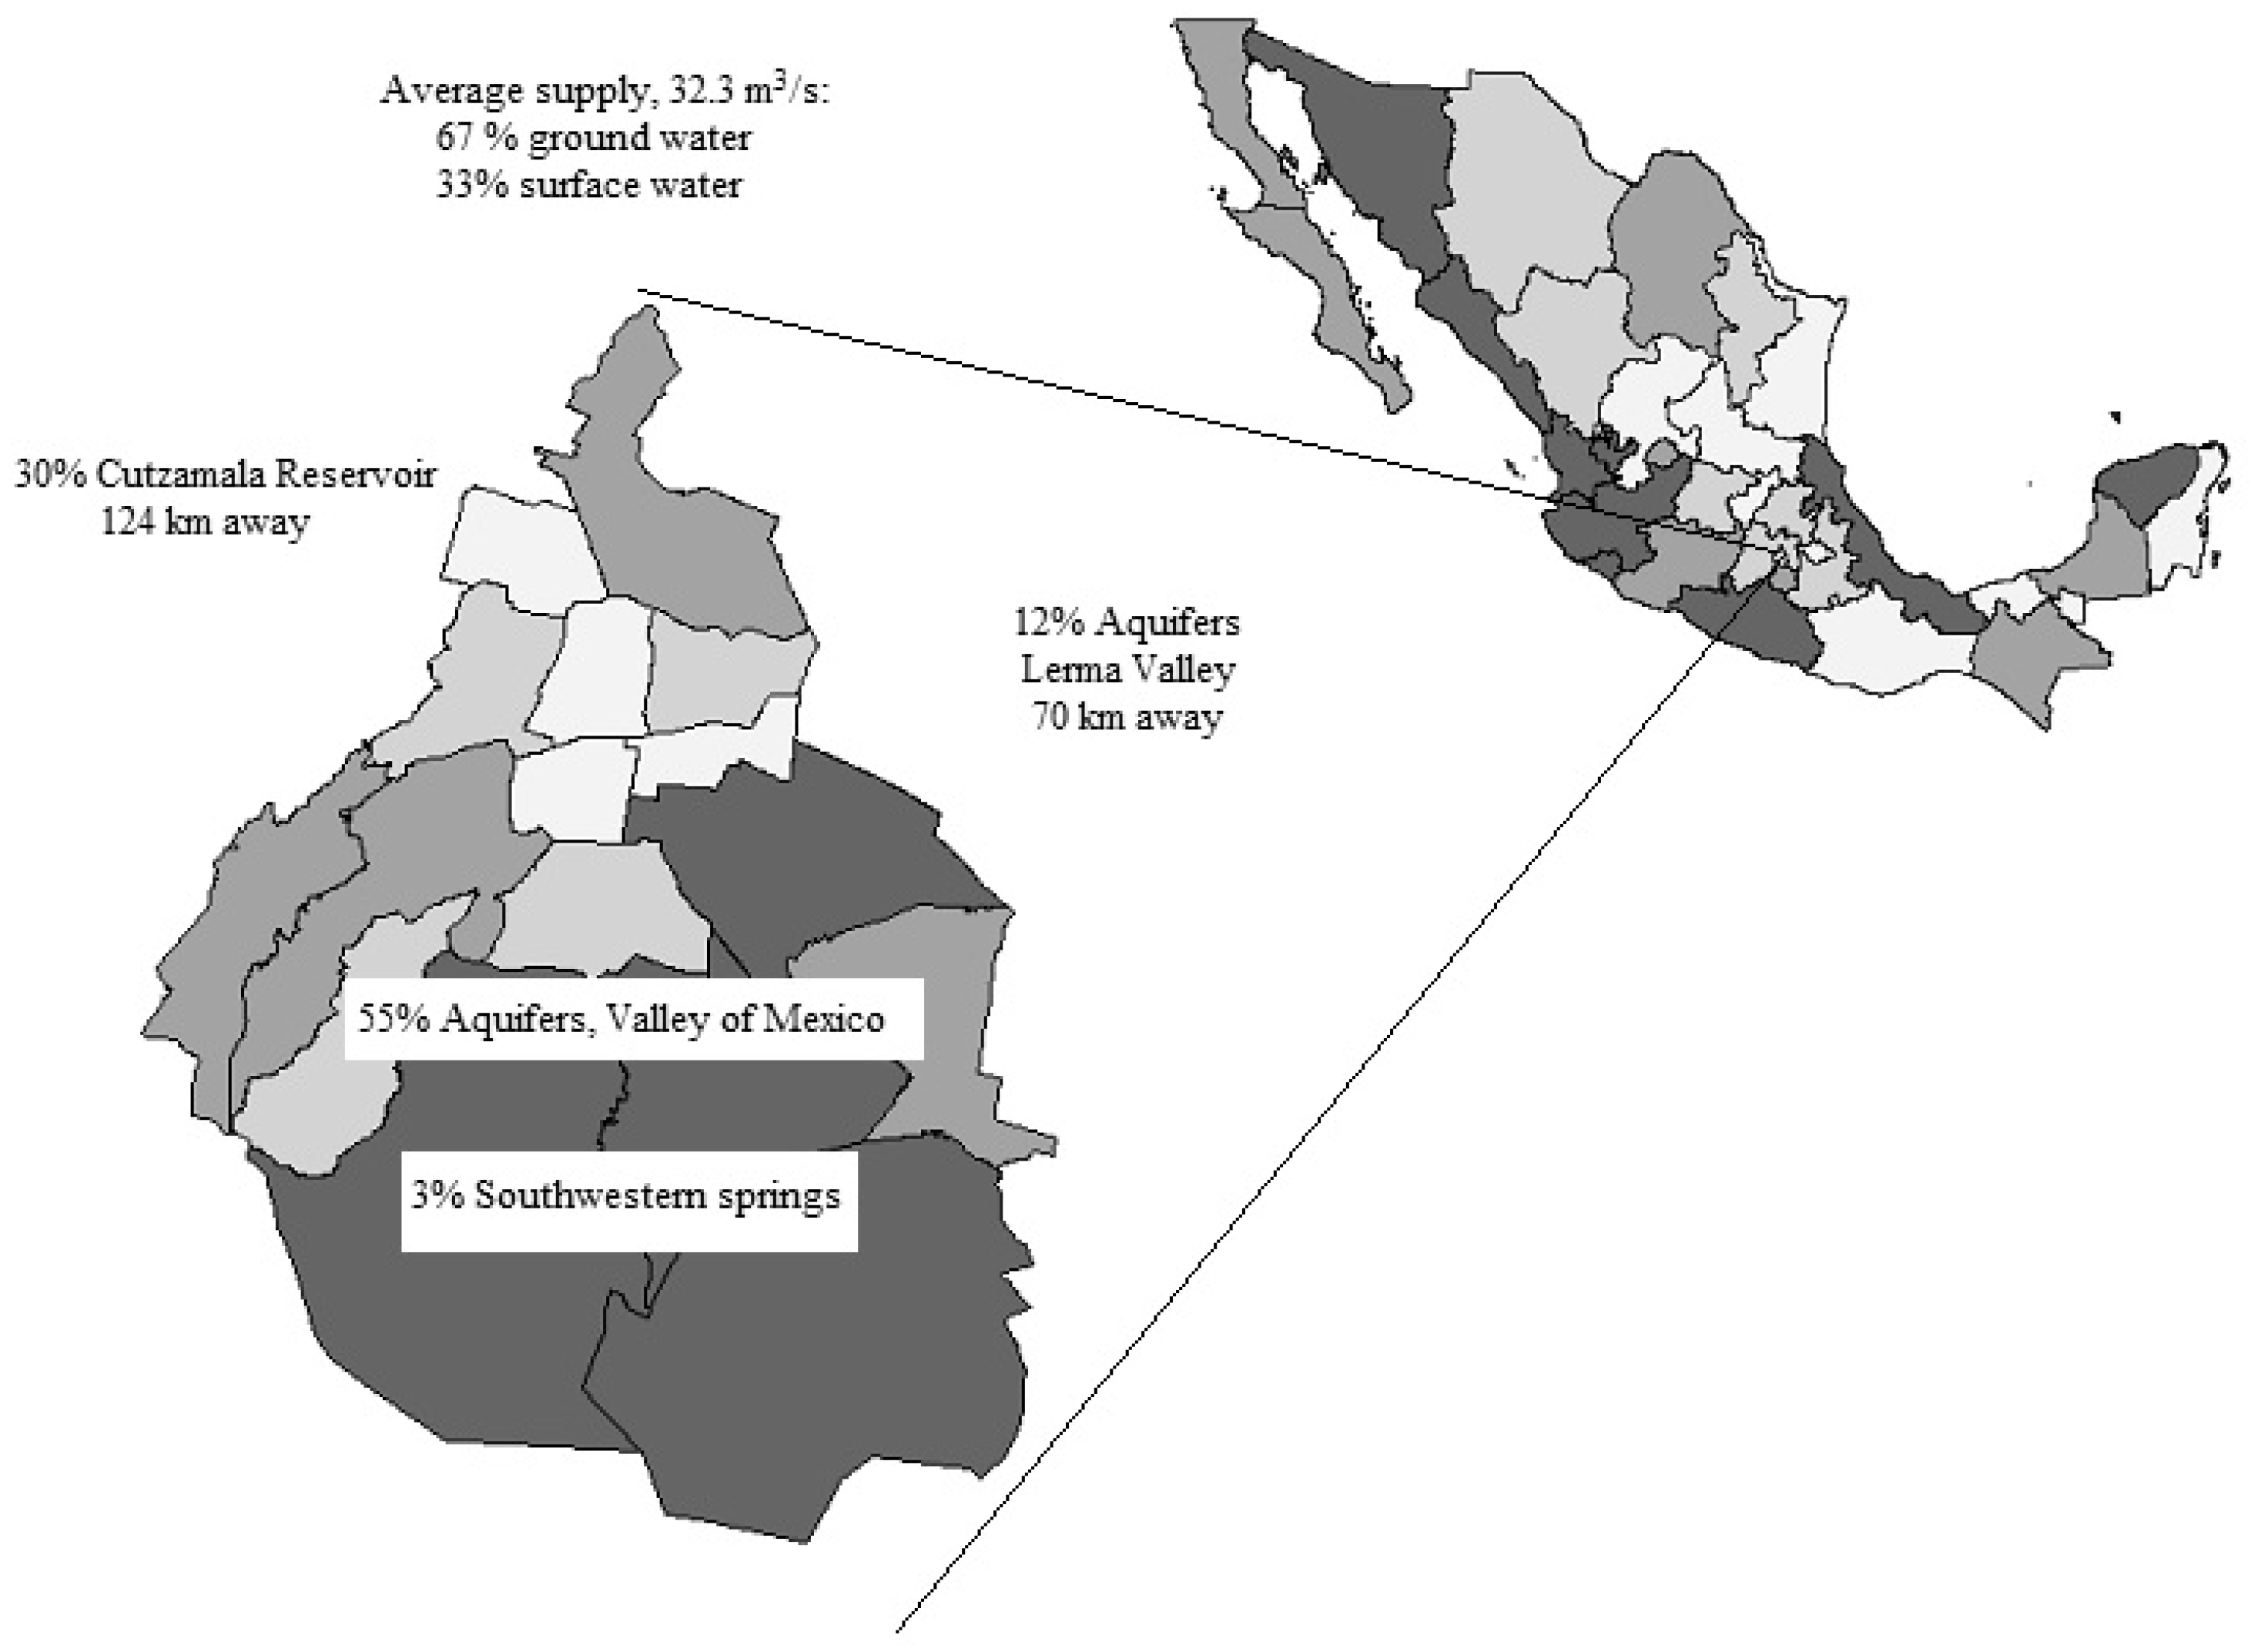
With a population of over 8.85 million living in an area of 1495 km2, Mexico City is the largest city in Mexico, accounting for 16.5% of the country’s economic activity. Furthermore, it is a core part of Mexico City’s Metropolitan Zone, which is considered the third largest urban area in the world. To satisfy the ever-increasing demand for drinking water, 32.3 m3 of water is supplied per second; 67% of this comes from underground sources. Of this total, over 55% comes from the Valley of Mexico aquifer and 12% from the Lerma Valley, 70 km away. The remaining 33% comes from surface water: 3% from the city’s southwestern springs and 30% from the Cutzamala reservoir, located 124 km away, in the states of Mexico and Michoacan (Figure 1).
Mexico City’s water supply is the sole responsibility of a single public organism known as Sistema de Aguas de la Ciudad de México (SACMEX in Spanish). It provides 98% of the required drinking water (INEGI 2010). This means that about 48,000 households are not yet connected to the water network and get their supply from mobile tanks or by carrying it by hand from stationary tanks. A study found that in the face of the State’s inability to ensure universal water supply, new forms of water supply emerge. Hence, people buy water or establish community arrangements for the construction, maintenance and operation of local systems (Torregrosa et al. 2015). To date, there is only a partial coverage of water meters (Torregrosa et al. 2015), with a significant number of homes that have no meter at all and pay a preset fixed rate.
In Mexico, the Metropolitan Zone of Mexico City is the region with the largest amount of concessions for urban public use. The State of Mexico is in first place, followed by Mexico City (Torregrosa et al. 2015). A recent study of 142 cities with over 50,000 inhabitants showed that cities with a high daily demand are over 575 L/inh. Examples of these cities are San José del Cabo, Guaymas and San Juan de los Lagos, Jalisco. Meanwhile, Mexico City gets 315 liters per inhabitant (Comisión Nacional del Agua 2012).
Mexico City is one of the only cities in the country with a supply coverage of almost 98 percent. Nevertheless, water quality continues to be a fundamental problem (Espinosa-García et al. 2015). According to the ‘Survey on Consumer Habits, Service and Water Quality of Mexico City’s Households’ (SHMC 2011), consumers report a critical inefficiency and intermittency of the supply, a lack of credibility of the accuracy of water meters and a very high distrust of the water quality. In addition, obsolescence of the infrastructure and lack of adequate maintenance are also mentioned as factors against the public water provider.
Furthermore, these are studies that support the public’s perception about the management and maintenance of the water distribution system, indicating that it is inadequate and insufficient, with 40% water loss due to leaks (Morales-Novelo and Rodríguez-Tapia 2007; Perló and González 2005) or significant fluctuations of the water quality (Mazari-Hiriart et al. 2005). It should be noted that the research does not focus on poor management of the provider and is mainly based on the public’s perception about water quality and supply, not taking into account the consumer’s failure to properly maintain in-home water deposits such as pipes, faucets, roof tanks and underground cisterns. This finding further complicates the situation of the water authorities, which need to attend the intermittency of the water supply so that people are in no need to domestic water storage.
SACMEX is responsible for performing chlorination and of ensuring the effectiveness of the procedures for disinfecting the water supplied to the population. Water quality is evaluated through the determination of residual free chlorine, a key indicator, whose presence in the domestic outlet indicates the efficiency of disinfection (Torregrosa et al. 2015). Nevertheless, this procedure is not sufficient for Mexico City’s population.
Drinking water supply problems in Mexico City are not different to those in other underdeveloped countries. Although there are worldwide advances to extend coverage through improving existing infrastructure (Tanellari et al. 2015). Also, there is growing interest of consumers to have access to uninterrupted, properly sanitized water (De Franca-Doria et al. 2009). Some international studies focus on improving water supply (Casey et al. 2006; So-Yoon et al. 2013; Onjala et al. 2014) but most are aimed to improve the quality of drinking water in underdeveloped countries (Orgill et al. 2013). In terms of continuous water supply, Mexico City is located within the eight top cities that provide the worst service in the country (Torregrosa et al. 2015).
There is a generalized perception that the quality of Mexico City’s water supply is poor. Tap water in 87% households is not used for drinking or preparing food (SHMC 2011). Instead, people choose alternative means to obtain water of the desired quality like boiling, chlorination or filtering tap water, purchasing bottled water or a combination of these methods. In developing countries, such alternative measures can be less accessible and more expensive (Whittington et al. 1991). For instance, Ferrier (2001) estimates that the average price of bottled water worldwide is 500 to 1000 times more expensive than tap water. In Mexico City, the cost of bottled water is 235 times more that of tap water (SHMC 2011), meaning that it is the low-income families who face the greatest difficulties in dealing with such expenses, either to improve their storage infrastructure or have access to better water quality (Whittington et al. 1991). A research report has shown that sale of bottled water is highest among African Americans, Asians, and Hispanic groups in North America, who often have lower incomes (Doria 2006).
In terms of bottled water consumption, on average, Mexicans consume between 180 and 250 L per month, making Mexico a top per capita consumer, while the average worldwide consumption is 80 to 100 L (Beverage Marketing Corporation 2016; Euromonitor International 2015). Mexico City families consume seven 20-L water bottles per month at a cost of US$16.6 (SHMC 2011), which represents a 350 L per-capita annual consumption, far higher than the national average.
The higher than average consumption of bottled water in Mexico City can be attributed to the poor quality of the water supplied by the city. Espinosa-García et al. (2015) considers that the distrust mibbght have originated with the high levels of water contamination after the big earthquake in 1985. This was followed by the cholera pandemic in the mid-90s, which could explain people’s present-day negative perception about the quality of tap water.
A search of the literature yields two approaches to analyze the economic value that households give about access to quality of goods and services. Firstly, the avoided cost (AC) or mitigation expense. It tries to estimate the entire cost of a house to have access to drinking water (Pattanayak et al. 2005). The second approach is contingent valuation (CV) where hypothetical scenarios are used to estimate the household’s willingness to pay (WTP) to improve its well-being through better quality of services (Casey et al. 2006; Genius and Tsagarakis 2006; Vásquez et al. 2009; Bilgic 2010; So-Yoon et al. 2013).
In addition, WTP measures the increase of a household well-being after it has access to tap water suitable for drinking, cooking and other activities without risking the health of all family members, for instance better understanding people’s preference. The WTP for better quality water will help identify and design appropriate policies for cost effectiveness and sustainability of public water supply entities (Gadgil 1998).
Using the AC method, Pattanayak et al. (2005) identified and estimated the costs involved in improving the quality of drinking water in Katmandu (Nepal) and found that they are lower than the WTP estimated by the CV method. Also using AC, Um et al. (2002) studied household profiles of tap water use in South Korea and found that domestic preventive measures are directly related to contamination of the water supply. Similarly, Othman et al. (2014) found that households in Kajang (Malaysia) spend an average US$82 per year to have access to water of better quality than water provided by the city.
Using the CV approach, Soto Montes de Oca (2007) estimates that WTP in Mexico City for water supply would be US$20 for reliable service and US$23.1 bimonthly to further improve their service, both twice the cost before 2010. Vásquez et al. (2009) estimates a WTP of US$12.2 in Parral, located in Chihuahua, northern Mexico, amounting to 3.3% of the family income. Also using CV, Genius et al. (2008) estimated the WTP at a monthly charge of US$13.8 per household for uninterrupted, good quality water in Rethymno (Crete, Greece). The WTP calculated by So-Yoon et al. (2013) was US$2.2 (36.6% of the monthly water bill) for homes in Busan (South Korea). Similarly, Del Saz-Salazar et al. (2015) estimated a US$1.47/month WTP for homes in Sucre, Bolivia, which amounts to 12% of the water bill. Throughout the literature, CV has been used to explore measures to improve access (Venkatachalam 2006; Wang et al. 2010; Lee et al. 2013), continuity of service (Hensher et al. 2006; Genius et al. 2008), residual water treatment (Kontogianni et al. 2003; Genius et al. 2005) and drinking water quality (Nallathiga 2009; Bilgic 2010; Polyzou et al. 2011).
In this paper, the WTP was estimated for people in Mexico City so that tap water is plentiful and safe to drink. The CV method was used in a survey that provided the necessary data. The socio-economic variables and factors that explain the willingness of families to pay a surcharge for better quality water were also explored and identified. This work directly estimates the value of WTP for an improvement in water quality, unlike the paper by Soto Montes de Oca (2007) that estimates the WTP for having an improvement in the water supply service (continuity, improvement in the quality of the resource, among others). This shows the originality of the work, since there are no similar studies in the literature to date.
The article is divided into four sections. The first one is the above introduction. Secondly, the methods and information about the areas and tools used in the study are explained. In the third section, the results are presented and discussed. Lastly, in section four the conclusions are summarized.
2. Methodology
The methodology used in this research is based on Hicks’ wellness theory; it allows for adaptive changes of wellbeing from a consumer or household economic agent. This is due to changes in the quality of goods and services, even in cases where there is no specific market for it. Service quality improvement benefits the economic agent, resulting in a higher indifference curve according to its income level. For example, in a real scenario where water quality is being offered as a take-it-or-leave-it proposition, it makes sense to think of this as a restricted demand problem. In this model, an improvement in quality water supply results in a shift of the initial indifference curve (U0) to a higher differential (U1) that gives the size of its wellness known as compensatory surplus (CS). In empirical terms, the CS results from the additional amount of money that a household would pay for better service.
2.1. A WTP Model for Household Water Quality Demand
Mexico City’s households are typical consumers that maximize their utility subject to constraints. The demand for water quality can be viewed as any other good or service and therefore modeled within the utility maximization framework or alternatively within the expenditure minimization model. In the last situation, the specification of the model is:
E (W, Y) Expenditure function
s.t. U = U (W, Y) Utility function
s.t. U = U (W, Y) Utility function
Faced with expenditures for both water quality services (W) and a composite good (Y) subject to the utility constraint, the consumer will attempt to minimize the following expenditure function (E):
where Pw represents quality water price; Py is the composite good price; and U is the utility function level.
E = E (Pw; Py; U)
However, since water quality is being offered as a take-it-or-leave-it proposition it makes sense to think of this as a restricted demand problem where the consumer does not observe Pw and choose W, but rather is offered W and can choose to pay for it or not (Casey et al. 2006). Therefore, Pw is replaced with W and the expenditure function takes the following form E*:
where W0 represents low quality water; and W1 is better quality water.
E* = E* (W, Py, U)
In this restricted case, the WTP for improved water quality is simply the difference between two expenditure functions with W1 ˃ W0 and the compensating surplus welfare estimate can be derived from this difference:
CS (W0, W1) = E* (Py, Wo, Uo) − E* (Py, W1, U0)
This estimate of compensating surplus is a measure for water quality in the home. It is the surcharge that each household is willing to pay and remain at the previous utility level before the change.
We can think of this WTP for increase water quality as a function of not only the cost of service, but also a host of water organoleptic characteristics, socioeconomic, demographic, and attitudinal characteristics of the household, which can be represented by Xi in the expenditure function. This consideration is relevant, since it is a reality that each household makes its decision on the WTP depending on the set of variables that define its environment.
CS (W0, W1) = E* (Py, W0, U0; Xi) − E* (Py, W1, U0; Xi)
2.2. Data
A Survey of Consumer Habits, Service and Water Quality (SHMC 2011) was carried out in Mexico City’s households to collect the necessary data for WTP estimation. The survey was carried from August to September 2011 and was restricted to people permanently living in the same home. A total of 689 families were selected randomly out of 1,903,983 homes (INEGI 2005). The sample had a 99% confidence level and a 5% margin of error.
The questionnaire was designed based on previous socio-economic study of the selected area and was divided into seven sections. The first was dedicated to briefly describing the current state of Mexico City’s water supply. The second part asked about the location of the house’s water main. The information about all members of the family and a general description of the house were collected in the third and fourth sections. The family’s water consumption habits were recorded in the fifth section. The last part was dedicated to find out their perception about the quality of the domestic water supply by openly asking how much they would be willing to pay for all necessary technical improvements needed to provide water that is clean and safe to drink out of the tap.
As the CV method uses a survey to simulate the existence of a market, it is essential that the format of the questionnaire is designed so that the only answers taken into account are those that can be measured without any bias. Table 1 presents the three formats (open question, referendum and double limit referendum) that are commonly used and their advantages/disadvantages.
The referendum and double limit referendum formats may result in deviations due to the amount of money registered at the start of the experiment. For example, a lower expense might generate high percentage of acceptance of scenarios or to face an inverse situation (Nunes and Nijkamp 2011; Shono et al. 2014). The open question format may generate higher percentages of rejections or to give no response at all because the interviewed party might not be used to this type of exercise.
The open question format was adopted for Mexico City´s survey and the possible limitations were avoided by placing the WTP question in the last module of the questionnaire. That is, when the answering person was already aware of the topic and the context of the question was sufficiently explained without significantly influencing the responses given. On the other hand, applying an open question format might have led us to under- or overestimation WTP because the answering person could be given strategic answers and offering a lower disposition to pay, obtaining something that others would be paying for (Del Saz-Salazar and García 2007; Nunes and Nijkamp 2011; Armbrecht 2014). The data obtained was then used for estimation WTP using a censored econometric model.
2.3. Censored Econometric Model
The WTP was estimated by applying a Tobit censored econometric model, which is appropriate in cases where the dependent variable (WTP) has continuous, positive, non-zero values. Negative values are censored (Wooldridge 2015). In the present study, WTP is based on an open question about the amount of money that the user is willing to pay for implementation of monitoring and cleaning processes that would result in tap water that is safe to drink.
The model specifies ten independent variables (Xi) that explain which households are willing to pay more or to pay less for clean water. These variables fulfill two criteria, as shown in Table 2. The first criterion is based on similar studies in which the social, economic and/or environmental factors involved in WTP. These were classified into five groups: (1) information about the organoleptic characteristics of water, (2) preventive measures taken, (3) trust of the utility provider, (4) economical and (5) social aspects of the household. This classification is that of De Franca-Doria (2010), with appropriate adjustments. The second criterion ensures that the variables have no multilinearity nor heterosedasticity problems for estimation of the econometric model.
The WTP Tobit model is described by Equations (6) and (7):
WTP* = β0 + Xi β + u, u|Xi ~ N(0, θ2)
WTP = max (0, WTP*)
The dependent variable WTP* satisfies the assumptions of a classical lineal model. In particular, it has a normal homocedastic distribution with a lineal conditional median. Equation (7) implies that the observed variable WTP equals WTP* when WTP ≥ 0, but WTP becomes zero when WTP* < 0. Tobit models seek to estimate the partial effects of Xi from dWTP/dXi so that WTP is given by the following variables, shown on Table 2:
where ‘u’ is the statistical error of the model.
WTP/DXi = β0 + β1 × residues + β2 × technology + β3 × bottled water + β4 × tap water + β5 × provider + β6 × income + β7 × payment + β8 × m3 + β9 × age + β10 × kitchen + u
3. Results
3.1. Survey Profile
According to a survey (SHMC 2011) Mexico City’s homes get their water as follows: 89.4 percent have a water main directly into the house, 6.4% have a water main within the land where the house is located. An important 4.2% are not connected to the water network, meaning that their water has to be carried by hand from communal taps, wells or water trucks.
In addition to the deficiencies in the manner by which water reaches some homes, the survey reveals important issues about the continuity of the service. In some cases, the city water supply is suspended once a day. As a result, 46% homes have cisterns, barrels or roof tanks for water storage. The methods that involve additional costs and efforts from all members of the family. It is fairly certain that this situation affects in inverse way the WTP of the households for improvements in the quality of water. In this sense, the WTP’s value could increase if SACMEX solve the service’s discontinuity. This discontinuity of the service could affect to some extent and in a negative way the response on the WTP of the households for improvements in the quality of the resource, possibly causing the value found in the WTP to be considered as a base value that could be increased if households do not have the problem of discontinuity.
The survey also reveals that 98.5% of the available water is used indoors and 1.5% for outside activities. Water usage breaks down as follows: personal hygiene (62.53%), laundry (22.76%), dishwashing (9.43%), food preparation (2.07%), general house cleaning (1.51%) and as drinking water (0.22%). Such water usage profile results from the city’s vertical growth and from homes that are being converted into business or commercial locations.
The survey also reveals that homes consumed 545.1 hm3 in 2011, with a monthly average of 25.8 m3 consumption per home. Based on these figures, the per capita use is 180 to 200 L/day, relatively similar to official data (28 to 35 m3) (Euromonitor International 2015).
The use of tap water for drinking or preparing food is less than 40% that of bottled water: 1.2 hm3 vs. 3.1 hm3, respectively. The survey’s finding that 87% homes declare not to consume tap water for drinking explains the 1.9 hm3 difference here reported. Bottled water is bought in 20-L carboys or 0.5 to 1.0 L bottles. The impact of such expenses can be considerable: for Mexico City´s families it is estimated to be around 380 million dollars, which is equivalent to 35% of the annual expense for water utility.
By just considering the need of water for drinking and food preparation and assuming that purchasing water bottled as a fashion statement is negligible, poor quality water has a considerable impact on the family’s income. Bottled water is 235 times more expensive than city tap water: US$120 vs. US$0.51 per cubic meter, respectively.
This negative perception of Mexico City’s public water supply emphasizes the importance of estimating the WTP of households for better quality water. The results of the survey also illustrate the need for the public water organism to recognize the need to improve the quality of the water and service they provide.
3.2. Model Estimation
The WTP/DXi model was based on data shown on Table 3 and is given by the following equation:
WTP/DXi = β0 + 0.341 × residues − 0.595 × technology + 1.155 × bottled water − 0.111 × tap water − 0.713 × provider + 0.162 × income – 0.014 × payment + 0.060 × volume + 0.097 × age + 0.075 × kitchen
It is estimated that the WTP is US$3.10 per home, bimonthly. The model is strong, as it uses average values of the Xi variables, equivalent to the median for homes in Mexico City.
3.3. Variables that Influence WTP
The ten independent variables significantly (p < 0.01) explain the dependent variable (WTP) (Table 3). Half of these independent variables are statistically significant per se. In the case of the remaining variables, although not statistically significant, they are important from the economic point of view and should be considered in the analysis (Novales 2009; Gujarati and Porter 2009).
The three variables labeled as preventive measures adopted by people to improve the quality of their water are the ones that have a greater influence on WTP, with purchase of bottled water and access to purification technologies as the most important. Purchase of bottled water increases WTP by US$1.2 (p < 0.05) while purification technologies give a –0.6 estimator, meaning that it diminishes WTP, as the home already has autonomous means to obtain drinking water. The third variable in this set is less significant and involves whether people drink or not tap water. Drinking tap water decreases WTP by US$0.1.
Another high-impact variable is the level of trust of tap water provider. Distrust of the organisation in charge of water supply decreases WTP by about −0.7 US dollars (p < 0.01). This is the variable with major influence after bottled water purchase and reflects the level of distrust of the population regarding the capability of the operating organism for providing water of good quality even after the extra cost involved is paid. The variable labeled ‘residues’ also refers to perception of the water quality. A reduction of residues present in tap water would increase WTP by US$0.34 (p < 0.1).
Among the variables measuring economic impact on WTP, the one labeled as ‘income’ has the greatest influence: higher family income increases WTP by US$0.162. The level of water consumption (m3 bimonthly) increases WTP by 0.06 dollars (p < 0.01). A one-dollar increase in the price of water (payment) decreases WTP by US$0.014 (p < 0.01), meaning that homes that have a lower water bill are willing to accept a cost increase while those that pay more are more reluctant to pay a surcharge, perhaps because they consider that they already pay a sufficient amount for the service.
Among social variables, it is seen that as the age of the person being interviewed, generally the head of the family, increases by one year WTP increases by about 0.1 dollars, indicating the concern of older people for improving the water quality. Finally, WTP increases by 0.08 dollars for each additional meal they prepare per week, showing their willingness to cook food for their families using good quality water.
3.4. WTP and Income
As shown in Table 4, WTP is directly proportional to the family income: it is US$2.7 for low-income homes and US$ 3.2 for higher income families. However, if WTP is compared as a percentage of the income, the trend is reversed and the WTP of lower income families are three times greater than that of higher income ones.
3.5. Consistency of Results
There are no previous reports that would prove the consistency of the estimated WTP value for good quality water in Mexico City. The closest found in literature are two studies that estimate WTP to improve the efficiency of the water supply, from coverage to operation of treatment plants. Soto Montes de Oca (2007) conducted the first study of this kind in 2007, estimating a WTP of US$20 per home every two months. The second study by Vásquez et al. (2009) in the northern city of Parral, Chihuahua where the corresponding WTP was US$24.4. Our estimation relates 15.5% and 12.7% compared to these two previous works and is a reasonable value because it includes only the water quality component, which was one among those included in Montes de Oca and Vásquez’ studies.
In other countries, So-Yoon et al. (2013) estimated that a WTP US$4.4 per home every two months for better quality water in Busan, South Korea, which is similar to the value we found for Mexico City. In Kajang, Malaysia (Othman et al. 2014) estimated a bimonthly WTP of US$13.3, which is 4.4 times higher than ours. The estimated value here presented is within the range of WTP for water quality improvements in developed countries, which is between 1.5 and 51.6 dollars for two months (De Frutos 2010).
4. Conclusions
The WTP per family for better quality of potable water is equivalent to 4.7% of the bimonthly water bill, and to 0.22% of the average family income in Mexico City (US$3.1). The factors that influence WTP level (statistically significant per se) are related to corrective and preventive measures to obtain better water quality. Firstly, we found that the high cost of bottled water strongly influences WTP. Bottled water is 235 times more expensive than city tap water (US$120 vs. US$0.51 per cubic meter respectively), meaning that low-income families face the greatest difficulties in dealing with such expenses. By just considering the need of water for drinking and food preparation and assuming that purchasing water bottled as a fashion statement is negligible, poor quality water has a considerable impact on the family’s income.
Secondly, these are followed by corrective measures such as installation of an in-home purification system and willingness to drink tap water. Furthermore, a third variable that needs to be considered is the lack of trust of the water provider, both in terms of its quality and in reliability of the water measuring method. Also, fourth in importance is the perception of water quality derived from the number of residues found in tap water. Improving the organoleptic characteristics of water would be an incentive for the water provider to increase their tariff because of a higher WTP of homes. In fifth place, we found that family income is directly related to WTP. Lastly, a set of variables that influence WTP to a lesser extent (although not statistically significant, they are important from the economic point of view) include age, number of times the family cooks their own meals, the volume of water consumed and payment to the water provider.
This negative perception of Mexico City’s public water supply emphasizes the importance of estimating the WTP of households for better quality water. The results of the survey also illustrate the need for the public water organization to recognize the need to improve the quality of the water and service they provide.
The lack of trust of the water supply agency affects adversely the willingness to pay of households and damages any policy that the government intends to apply. It reduces the possibilities for the agency to obtain resources from service users. Also, it induces households to seek solutions in the private sector, with serious negative implications on the poorest households. The WTP is directly proportional to income, but its percentage is inversely proportional, suggesting that improving water quality is of greater importance for lower income families.
Projecting the Tobit model results, the aggregate WTP for the City was around US$34.5 million US dollars in 2011, which represents nine percent of the annual cost homes pay for bottled water. Such a large amount of household expenditure on bottled water suggest that they can adopt alternative forms of water purification, such as filters and, domestic water treatment systems with new technologies, which entail lower costs, less time and greater comfort, as well as guarantee greater quality control of the water they consume. In this option, the government can implement subsidy policies for the poorest households to adopt such systems.
The results are impressive, while households’ willingness to pay for quality tap water is US$34.5 million a year, their expenditures on bottled water reach US$380 million annually. This suggests that in the solution of water quality, households have more trust in the private sector. Furthermore, this kind of solution is of concern because it impacts the well-being of low-income households, meaning that a significant percentage of their income would go to guarantee this basic need (such as drinking water), or face the risk of acquiring diseases.
Previous data suggest that SACMEX—as well as their credibility increase—could obtain revenues from households if it increases the quality of the water. To get that, it would be interesting that in addition to improving water quality, SACMEX could monitor the quality and organoleptic characteristics of water and inform users. In addition, it will be recommended that the water quality measure is carried out by independent laboratories and by specific areas. The above should be based on a continuous supply and transparency in the measurements made by household.
Finally, an estimation of the WTP provides information that supports the need for an in-depth cost-benefit analysis by the water authorities to make all necessary changes to provide potable water that complies with international standards. Moreover, the information would help identify and design appropriate policies for cost effectiveness and sustainability of better quality of the water supply entity. Such an accomplishment would result in a win-win situation by improving the quality of life for Mexico City’s population. At the same time, the operating entity obtains the necessary funds to ensure an economically and environmentally sustainable drinking water supply for the city.
Acknowledgments
This work was supported by Mexico’s National Council of Science and Technology (CONACYT in Spanish) under National Program Fund, project number 120-2015: ‘Towards an Integral Management of Water Sources: analysis of availability and uses’. CONACYT through the Young Researchers Support Program, project number 1812. Mexico City’s Institute for Science and Technology (CyTDF in Spanish), project number 13311378-2011: Water Quality and Conservation in Mexico City.
Author Contributions
All authors contributed equally to the paper.
Conflicts of Interest
The authors declare no conflict of interest.
References
- Armbrecht, John. 2014. Use value of cultural experience: A comparison of contingent valuation and travel cost. Tourism Management 42: 141–48. [Google Scholar] [CrossRef]
- Bateman, Ian J., Ian H. Langford, and Jon Rasbash. 1999. Willingness-to-pay question format in contingent valuation studies. In Valuing Environmental Preferences: Theory and Practice of the Contingent Valuation Method in the US, EU, and the Developing Countries. Edited by Ian J. Bateman and Kenneth G. Willis. New York: Oxford University Press. [Google Scholar]
- Beverage Marketing Corporation. 2016. The Global Bottled Water Market. New York: Beverage Marketing Corporation of New York. [Google Scholar]
- Bilgic, Abdulbaki. 2010. Measuring willingness to pay to improve municipal water in southeast Anatolia, Turkey. Water Resources Research 46: W12545. [Google Scholar] [CrossRef]
- Casey, James F., James R. Kahn, and Alexandre Rivas. 2006. Willingness to pay for improved water service in Manaus, Amazonas, Brazil. Ecological Economics 58: 365–72. [Google Scholar] [CrossRef]
- Comisión Nacional del Agua. 2012. Situación del Subsector Agua Potable, Alcantarillado y Saneamiento. Coyoacán: Comisión Nacional del Agua. [Google Scholar]
- De Franca-Doria, Miguel, Nick Pidgeon, and Paul R. Hunter. 2009. Perceptions of drinking water quality and risk and its effect on behaviour: A cross-national study. Science of the Total Environment 407: 5455–64. [Google Scholar] [CrossRef] [PubMed]
- De Franca-Doria, Miguel. 2010. Factors influencing public perception of drinking water quality. Water Policy 12: 1–19. [Google Scholar] [CrossRef]
- De Frutos, Pablo. 2010. Valoración de la calidad del agua de abastecimiento: medidas defensivas frente a disposición a pagar por su mejora. Urban Public Economics Review 13: 34–65. [Google Scholar]
- Del Saz-Salazar, Salvador, Francisco González-Gómez, and Jorge Guardiola. 2015. Willingness to pay to improve urban water supply: the case of Sucre, Bolivia. Water Policy 17: 112–25. [Google Scholar] [CrossRef]
- Del Saz-Salazar, Salvador, and Leandro García-Menéndez. 2007. Estimating the non-market benefits of an urban park: Does proximity matter? Land Use Policy 24: 296–305. [Google Scholar] [CrossRef]
- Doria, Miguel F. 2006. Bottled water versus tap water: Understanding consumers’ preferences. Journal of Water and Health 4: 271–276. [Google Scholar] [PubMed]
- Euromonitor International. 2015. Mexico. Available online: http://www.euromonitor.com/mexico (accessed on 12 August 2016).
- Espinosa-García, Ana C., Carlos Díaz-Ávalos, Fernando J. González-Villarreal, Rafael Val-Segura, Velvet Malvaez-Orozco, and Marisa Mazari-Hiriart. 2015. Drinking Water Quality in a Mexico City University Community: Perception and Preferences. EcoHealtg 12: 88–97. [Google Scholar] [CrossRef] [PubMed]
- Ferrier, Catherine. 2001. Bottled Water: Understanding a Social Phenomenon. Morges: World Wild Foundation, Available online: http://assets.panda.org/downloads/bottled_water.pdf (accessed on 15 August 2016).
- Freeman, A. Myrick, III. 2003. The Measurement of Environmental and Resource Values. Theory and Methods, 2nd ed. Washington: Resources for the Future. [Google Scholar]
- Gadgil, Ashok. 1998. Drinking Water in Developing Countries. Annual Review of Energy and the Environment 23: 253–86. [Google Scholar] [CrossRef]
- Genius, Margarita, and Konstantinos P. Tsagarakis. 2006. Water shortages and implied water quality: A contingent valuation study. Water Resources Research 42: W12407. [Google Scholar] [CrossRef]
- Genius, Margarita, E. Hatzaki, E.M. Kouromichelaki, G. Kouvakis, S. Nikiforaki, and Konstantinos P. Tsagarakis. 2008. Evaluating consumer’s willingness to pay for improved potable water quality and quantity. Water Resources Management 22: 1825–34. [Google Scholar] [CrossRef]
- Genius, Margarita, M. Manioudaki, E. Mokas, E. Pantagakis, D. Tampakakis, and Konstantinos P. Tsagarakis. 2005. Estimation of willingness to pay for wastewater. Water Science Technology: Water Supply 5: 105–13. [Google Scholar]
- Gujarati, Damodar N., and Dawn C. Porter. 2009. Basic Econometrics, 5th ed. New York: Mc Graw Hill. [Google Scholar]
- Hensher, David, Nina Shore, and Kenneth Train. 2006. Water supply security and willingness to pay to avoid drought restrictions. Economic Record 82: 56–66. [Google Scholar] [CrossRef]
- INEGI. 2005. Conteo de Población y Vivienda. Aguascalientes: INEGI. [Google Scholar]
- INEGI. 2010. Censo de Población y Vivienda 2010. Aguascalientes: INEGI. [Google Scholar]
- Kontogianni, Areti, Ian H. Langford, Andreas Papandreou, and Mihalis S. Skourtos. 2003. Social preferences for improvising water quality: An economic analysis of benefits from wastewater treatment. Water Resources Management 17: 317–36. [Google Scholar] [CrossRef]
- Lee, Won-Seok, Seung-Hoon Yoo, and Jeehyeong Kim. 2013. Measuring the economic benefits of the tap water supply service in urban areas: the case of Korea. Water Resources Management 27: 619–27. [Google Scholar] [CrossRef]
- Mazari-Hiriart, Marisa, Yolanda López-Vidal, Sergio Ponce-de-León, Juan José Calva, Francisco Rojo-Callejas, and Gonzalo Castillo-Rojas. 2005. Longitudinal Study of Microbial Diversity and Seasonality in the Mexico City Metropolitan Area Water Supply System. Applied and Environmental Microbiology 71: 5129–37. [Google Scholar] [CrossRef] [PubMed]
- Morales-Novelo, Jorge A., and Lilia Rodriguez-Tapia. 2007. Economía del Agua. Escasez del Agua y su Demanda Doméstica e Industrial en Áreas Urbanas. Ciudad de México: Universidad Autónoma Metropolitana. [Google Scholar]
- Nallathiga, Ramakrishna. 2009. An assessment of the willingness to pay for reliable water supply in NCT-Delhi. Water Policy 11: 320–29. [Google Scholar] [CrossRef]
- Novales, Alfonso. 2009. Las interrelaciones entre investigación y docencia en economía aplicada. Revista Electrónica Sobre la Enseñanza de la Economía Pública 6: 20–37. [Google Scholar]
- Nunes, Paulo, and Peter Nijkamp. 2011. Economic valuation, values and contingent method: An overview. Regional Science Inquiry Journal 3: 95–116. [Google Scholar]
- Onjala, Joseph, Simon Wagura Ndiritu, and Jesper Stage. 2014. Risk Perception, Choice of Drinking Water, and Water Treatment: Evidence from Kenyan Towns. Journal of Water Sanitation and Hygiene for Development 4: 268–80. [Google Scholar] [CrossRef]
- Orgill, Jennifer, Ameer Shaheed, Joe Brown, and Marc Jeuland. 2013. Water quality perceptions and willingness to pay for clean water in peri-urban Cambodian communities. Journal of Water and Health 11: 489–506. [Google Scholar] [CrossRef] [PubMed]
- Othman, Jamal, Goh Hong Lip, and Yaghoob Jafari. 2014. Benefits valuation of potable water quality improvement in Malaysia: The case of Kajang Municipality. International Journal of Water Resources Development 30: 621–34. [Google Scholar] [CrossRef]
- Pattanayak, Subhrendu K., Jui-Chen Yang, Dale Whittington, and K. C. Bal Kumar. 2005. Coping with unreliable public water supplies: Averting expenditures by households in Kathmandu, Nepal. Water Resources Research 41: W02012. [Google Scholar] [CrossRef]
- Perló, Manuel, and Arsenio Ernesto González. 2005. ¿Guerra por el Agua en el Valle de México? Ciudad de México: Universidad Nacional Autónoma de México, Fundación Friedrich Ebert. [Google Scholar]
- Polyzou, Eugenia, Nikoleta Jones, Konstantinos Evangelinos, and Constantinos Prokopiou Halvadakis. 2011. Willingness to pay for drinking water quality improvement and the influence of social capital. Journal of Socio-Economics 40: 74–80. [Google Scholar] [CrossRef]
- SHMC. 2011. Encuesta Sobre Consumo de Agua en los Hogares del Distrito Federal (SHMC). Ciudad de México: Universidad Autónoma Metropolitana. [Google Scholar]
- Shono, Aiko, Masahide Kondo, Hiroshi Ohmae, and Ichiro Okubo. 2014. Willingness to pay for public health services in rural Central Java, Indonesia: Methodological considerations when using the contingent valuation method. Social Science & Medicine 110: 31–40. [Google Scholar]
- Soto Montes de Oca, Gloria. 2007. Agua: Tarifas, Escasez y Sustentabilidad en las Megaciudades. ¿Cuánto están Dispuestos a Pagar los Habitantes de la Ciudad de México? Ciudad de México: Universidad Iberoamericana. [Google Scholar]
- Soto Montes de Oca, Gloria, and Ian J. Bateman. 2006. Scope sensitivity in households’ willingness to pay for maintained and improved water supplies in a developing world urban area: Investigating the influence of baseline supply quality and income distribution upon stated preferences in Mexico City. Water Resources Research 42: W07421. [Google Scholar] [CrossRef]
- So-Yoon, Kwak, Seung-Hoon Yoo, and Chang-Seob Kim. 2013. Measuring the Willingness to Pay for Tap Water Quality Improvements: Results of a Contingent Valuation Survey in Pusan. Water 5: 1638–52. [Google Scholar]
- Tanellari, Eftila, Darrell J. Bosch, and Elton Mykerezi. 2015. On consumers’ attitudes and willingness to pay for improved drinking water quality and infrastructure. Water Resources Research 51: 47–57. [Google Scholar] [CrossRef]
- Torregrosa, Maria Luis, Ismael Aguilar Barajas, Blanca Jiménez Cisneros, Karina Kloster, Polioptro Martínez, Jacinta Palerm, Ricardo Sandoval, and Jordi Vera. 2015. Urban Water in Mexico. In Urban Water Challenges in the Americas: A Perspective from the Academies of Sciences. Tlalpan: The Inter-American Network of Academies of Sciences (IANAS). [Google Scholar]
- Um, Mi-Jung, Seung-Jun Kwak, and Tai-Yoo Kim. 2002. Estimating willingness to pay for improved drinking water quality using averting behavior method with perception measure. Environmental and Resource Economics 21: 287–302. [Google Scholar]
- UNDP (United Nations Development Programme). 2006. Human Development Report. New York: UNDP. [Google Scholar]
- Vásquez, William F., Pallab Mozumder, Jesus Hernandez-Arce, and Robert P. Berrens. 2009. Willingness to pay for safe drinking water: Evidence from Parral, Mexico. Journal of Environmental Management 90: 3391–400. [Google Scholar] [CrossRef] [PubMed]
- Venkatachalam, L. 2006. Factors influencing household willingness to pay (WTP) for drinking water in peri-urban areas: a case study in the Indian context. Water Policy 8: 461–73. [Google Scholar] [CrossRef]
- Wang, Hua, Jian Xie, and Honglin Li. 2010. Water pricing with household surveys: a study of acceptability and willingness to pay in Chongqing, China. China Economic Review 21: 136–49. [Google Scholar] [CrossRef]
- Whittington, Dale, Donald T. Lauria, and Xinming Mu. 1991. A study of water vending and willingness to pay for water in Onitsha, Nigeria. World Development Review 19: 179–98. [Google Scholar] [CrossRef]
- Wooldridge, Jeffrey M. 2015. Introductory Econometrics: A modern Approach. Edited by Cengage Learning. Florence: South-Western College Publishing. [Google Scholar]
Figure 1.
Sources of drinking water in Mexico City. Source: Authors, based on Comisión Nacional del Agua (2012).
Figure 1.
Sources of drinking water in Mexico City. Source: Authors, based on Comisión Nacional del Agua (2012).


Table 1.
Questionnaires used in contingent valuation studies.
| Open | Referendum | Double Limit Referendum | |
|---|---|---|---|
| What is it? | The interviewed party is asked for their maximum willingness to pay (WTP) for a given good or service | The interviewed party is asked whether he/she is willing to pay a randomly pre-established amount | The interviewed party is given a second question whether to pay a higher or lower amount |
| Number of questions | Single | Single | Iterative series of questions |
| Obtained WTP | Actual value | Yes or No | Yes or no, iterative series of questions |
| Major advantage | Gives a simple direct valuation of the good or service | Friendlier to the interviewed party | Greater statistical value |
| Major disadvantage | The interviewed party may not have a frame of reference to give an answer | ‘Anchoring effect’ as the interviewed party may accept the chosen WTP because he/she ignores the true value for the good or service | Its validity depends on the initial question, which might influence the final result |
| Consequence | Under- or overestimation of WTP. Negative answers to the valuation question or too many high values that do not accord to the reality | Under- or overestimation of WTP, depending on the initial proposal | Under- or overestimation of WTP, depending on the initial question |
Source: Authors, adapted from Bateman et al. (1999); Freeman (2003).
Table 2.
Variables of the WTP model for improving water quality in Mexico City.
| Model | Questions and Answers from Households | Predicted Parameter |
|---|---|---|
| Dependent variable (WTP) | ||
| WTP | What is the maximum amount that you would be willing to pay for a series of improvements to ensure a steady supply of good quality, drinkable tap water? | |
| Independent Variables (Xi) | ||
| Group 1: Information about Sensorial Elements of Water Quality | ||
| Residues Ø | What is your perception about residues in your tap water? | + |
| 1 = Very bad, 2 = Bad, 3 = Regular, 4 = Good, 5 = Very good | ||
| Group 2: Preventive Measures | ||
| Technology † | Do you know any technology for home water purification? | − |
| Yes = 1/No = 0 | ||
| Bottled water † | Do you purchase bottled drinking water? | + |
| Yes = 1/No = 0 | ||
| Tap water † | Do you drink tap water? | − |
| yes = 1/No = 0 | ||
| Group 3: Trust of the City’s Water Provider Entity | ||
| Provider † | Do you think that the city’s water provider does not fulfill the quality requirements for drinking water? | − |
| Yes = 1/No = 0 | ||
| Group 4: Economical Characteristics | ||
| Income Ø | Monthly family income | + |
| Payment ¥ | Water bill | − |
| Volume ¥ | Bimonthly amount of water consumed (m3) | + |
| Group 5: Social Characteristics | ||
| Age of the interviewed person Ø | 1 = 15−24; 2 = 25−44; 3 = 45−59; 4 = 60 or more | + |
| Kitchen ¥ | Number of in-home prepared meals | + |
Ω Continuous censored variable, zero value at lower limit; † Dichotomy variable (using this type of variables can cause a loss in the explanation of the independent variables. Nevertheless, everything depends on the clarity on how it is constructed from the question in the survey); ¥ Continuous variable, Ø Categorical variable. Source: Authors, based on SHMC (2011).
Table 3.
Results from WTP for quality drinking water in Mexico City—Marginal effects of each dependent variable with respect to the WTP.
Table 3.
Results from WTP for quality drinking water in Mexico City—Marginal effects of each dependent variable with respect to the WTP.
| Variable | dWTP/dXi | [95% C.I.] | |
|---|---|---|---|
| Group 1: Information about Sensorial Elements of Water Quality | |||
| Residues Ø | 0.341 * (0.201) | −0.054 | 0.736 |
| Group 2: Preventive Measures | |||
| Technology † | −0.595 (0.799) | −2.16 | 0.971 |
| Bottled water † | 1.155 ** (0.58) | 0.018 | 2.293 |
| Tap water † | −0.111 (0.737) | −1.556 | 1.334 |
| Group 3: Trust of the City’s Water Provider Entity | |||
| Provider† | −0.713 * (0.478) | −1.649 | 0.224 |
| Group 4: Economical Characteristics | |||
| Income Ø | 0.162 (0.187) | −0.204 | 0.528 |
| Volume ¥ | 0.06 *** (0.014) | 0.034 | 0.087 |
| Payment ¥ | −0.014 *** (0.004) | −0.022 | −0.006 |
| Group 5: Social Characteristics | |||
| Age of the interviewed person Ø | 0.097 (0.22) | −0.333 | 0.528 |
| Kitchen ¥ | 0.075 (0.054) | −0.03 | 0.18 |
| Sigma | 9.061 *** (0.874) | 7.344 | 10.778 |
| Number of strata | 1 | Number of Observations | 431 |
| Number of PSUs | 431 | Population size | 1,393,810 |
| WTP Ω | Design df | 430 | |
| Probability > F | 0.0016 | ||
WTP, Willingness to Pay; Ω Continuous censored variable, zero value at lower limit; † Dichotomy variable; ¥ Continuous variable; Ø Categorical variable; () Standard deviation; Statistical significance at: * = 10%; ** = 5%; *** = 1%. Source: Authors, based on SHMC (2011).
Table 4.
WTP and family income for better drinking water in Mexico City.
| Income US$/Bimonthly (Confidence Intervals) | Bimonthly WTP US$ | WTP/Income | |
|---|---|---|---|
| 0–488 | (Lower/Media/Upper) | 2.4/2.7/3.0 | 0.42%/0.47%/0.52% |
| 490–1056 | (Lower/Media/Upper) | 2.7/3.0/3.3 | 0.21%/0.23%/0.25% |
| 1058 or more | (Lower/Media/Upper) | 2.9/3.2/3.5 | 0.14%/0.15%/0.17% |
| Average | (Lower/Media/Upper) | 2.7/3.1/3.3 | 0.19%/0.22%/0.24% |
Source: Authors, based on SHMC (2011).
© 2017 by the authors. Licensee MDPI, Basel, Switzerland. This article is an open access article distributed under the terms and conditions of the Creative Commons Attribution (CC BY) license (http://creativecommons.org/licenses/by/4.0/).
Share and Cite
MDPI and ACS Style
Rodríguez-Tapia, L.; Revollo-Fernández, D.A.; Morales-Novelo, J.A. Household’s Perception of Water Quality and Willingness to Pay for Clean Water in Mexico City. Economies 2017, 5, 12. https://doi.org/10.3390/economies5020012
AMA Style
Rodríguez-Tapia L, Revollo-Fernández DA, Morales-Novelo JA. Household’s Perception of Water Quality and Willingness to Pay for Clean Water in Mexico City. Economies. 2017; 5(2):12. https://doi.org/10.3390/economies5020012
Chicago/Turabian StyleRodríguez-Tapia, Lilia, Daniel A. Revollo-Fernández, and Jorge A. Morales-Novelo. 2017. "Household’s Perception of Water Quality and Willingness to Pay for Clean Water in Mexico City" Economies 5, no. 2: 12. https://doi.org/10.3390/economies5020012
Note that from the first issue of 2016, this journal uses article numbers instead of page numbers. See further details here.