Determinants of Related and Unrelated Export Diversification


Global Water Practice, The World Bank, G5/1, Islamabad 44050, Pakistan
Economies 2017, 5(4), 50; https://doi.org/10.3390/economies5040050
Submission received: 14 July 2017
/
Revised: 1 December 2017
/
Accepted: 8 December 2017
/
Published: 13 December 2017
Abstract
:This paper contributes to the literature on determinants of the export diversification by introducing related variety (RV) and unrelated variety (UV) in the analysis in addition to the traditional entropy based measure at three-digit Standard International Trade Classification (SITC) level, overall variety (OV). RV measures variety in cognitively related industries, while UV measures variety in industries that are unrelated to each other. Studies on RV and UV have shown that the dynamics of their relationship with economic growth and innovation may differ and one would expect that the determinants of RV and UV may also be different. Therefore, using data on manufacturing sector exports for 130 countries from 1996 to 2011, this paper identifies the determinants of export diversification with primary focus on foreign direct investment as an external source of knowledge and a stimulus to entrepreneurship and human capital as a measure of productive capabilities. Considering the concern of endogeneity bias, estimations of the econometric models were performed using generalized method of moments. Findings show that some of the determinants of diversification affect RV, UV and OV differently. For instance, foreign direct investment (FDI) negatively affects RV while it has no significant relationship with OV and UV. Moreover, interaction of human capital with FDI appears to be positive and significant for UV and RV while interaction of human capital with trade openness is significant and positive for RV only, showing the importance of knowledge through external sources in the process of related diversification.
Keywords:
export diversification; related variety; unrelated variety; human capital; foreign direct investment; Generalized Method of MomentsJEL Classification:
F14; F21; O331. Introduction
Recent fluctuations in oil prices have slowed down the economic performance of oil exporting countries, such as Saudi Arabia, Iraq, Syria, Venezuela etc. Since share of oil exports is very high in most of these countries, the fall in oil prices significantly reduced their earnings from exports. In the wake of oil price fluctuations, countries like Saudi Arabia have started formulating export product diversification policies to reduce the reliance on a single commodity. Theory-based arguments in favour of economic diversification are based on dynamics of preference structure (both within and across borders), risk-spreading strategy, knowledge spillovers, and innovation. Moreover, preferences of economic agents change with changes in income. Demand for variety, for instance, increases with increase in affordability (Krugman 1981). From firms’ point of view, diversified economic structure facilitates innovation through knowledge spillovers (Saviotti and Frenken 2008) and increases the resistance against shocks by spreading risk across portfolio of products (Acemoglu and Zilibotti 1997). The literature on product diversification within regions has identified diversification as a source of generation, diffusion, and recombination of knowledge. Differentiating between related and unrelated variety, the evidence suggests that if a region is diversified across unrelated sectors, the knowledge flows are likely to be relatively less frequent however recombination of knowledge across unrelated sectors is likely to result in radical innovations (Castaldi et al. 2015); in contrast, if diversification occurs across related sectors, the knowledge flows are likely to be frequent however the resulting innovations are likely to be incremental in nature. Concentration in a few sectors, especially in primary goods, increases vulnerability to shocks, such as fluctuations in export prices, abrupt changes in demand, and internal supply shocks (Agosin et al. 2012; Cadot et al. 2013). The consequences of shocks can be severe if the area of core competence is directly affected (Ferdous 2011).
Despite the known benefits of diversification, the process by which diversification could be achieved is complex as introduction of new products in the export portfolio may not only require new productive capabilities but also will require the new products to be of internationally competitive quality. While existing literature does point towards the possible determinants of overall diversification, not much is known about the determinants of related and unrelated dimensions of diversification. Since diversification in related sectors can take place naturally through the evolutionary process, facilitated by knowledge spillovers, the determinants of related variety are expected to be different from unrelated variety, as the latter is more difficult to achieve and may require locally unavailable knowledge and capabilities. The present study therefore contributes to the literature by distinguishing between the determinants of overall, related and unrelated diversification. Primary focus of this study is on foreign direct investment (FDI) and human capital as the core determinants of diversification process. Using disaggregated export data at the 3-digit level from 1996 to 2011, results show that human capital weakly but positively affects OV and RV, however, it doesn’t have significant relationship with UV. Foreign direct investment seems to have a negative and significant relationship with diversification especially in the case of RV. The interaction between human capital and foreign direct investment shows positive and significant relationship with UV and RV showing that both variables positively moderate each other’s relationship with diversification.
The structure of the rest of the paper is as follows. Section 2 briefly discusses the existing studies on determinants of export diversification, Section 3 discusses types of diversification, Section 4 describes data, Section 5 outlines the econometric models, Section 6 explains the methodology, Section 7 provides and discusses estimation results while Section 8 concludes the paper.
2. Determinants of Export Diversification
The existing studies on the determinants of diversification are relatively small in number and the results of these studies are generally incomparable due to differences in data, econometric models and estimations methodologies. This section aims to bring together some of the key results in the literature in order to motivate the choice of determinants used in this study.
2.1. Economic Development and Size of the Economy
Most frequently discussed determinant of diversification among the previous studies is economic development where demand for variety increases with the economic expansion (Krugman 1981). Economic development also promotes entrepreneurship and innovation through forces of competition that results in increase in diversification (Acemoglu and Zilibotti 1997). Empirical findings on the relationship between development and diversification have shown both monotonic (De Benedictis et al. 2009; Parteka and Tamberi 2013) as well as non-monotonic relationships (Cadot et al. 2011a; Imbs and Wacziarg 2003; Koren and Tenreyro 2007). An example of a non-monotonic relationship between development and specialization is the U-shaped relationship which was first observed by Imbs and Wacziarg (2003). Their finding suggests that countries at low levels of development tend to diversify as they grow, however, after reaching a certain level of development, countries tend to re-specialize. Low-income countries generally have low levels of diversification due to insufficient capital. As their economies grow, they experience structural changes that shape the overall structure of the economy leading to a wider set of economic opportunities and higher productive efficiency (Acemoglu and Zilibotti 1997; Parteka and Tamberi 2013). However, after reaching a certain threshold, they tend to re-specialize by getting rid of inefficient sectors and allocating more resources into the productive ones. As shown by the empirical studies mentioned above, the results are far from conclusive. Moreover, in addition to positive affect of development on diversification, the direction of causality may also run from diversification to development (Frenken et al. 2007; Saviotti and Frenken 2008). In presence of bi-directional causality, empirical setup for estimation has to be carefully designed in order to account for the endogeneity bias, however, only handful of studies aim to rectify this potential bias (Agosin et al. 2012; Goya 2014). Similar to economic development, empirical studies also show that size of the economy also matters for the diversification of product portfolio. Larger economies are more likely to demand and produce wider variety of products which may result in increase in diversification. Larger market size is also one of the determinants of foreign direct investment which shapes the nature of competition in the region. On the contrary, scale effect would also imply that larger economies will demand larger quantity of conventional products due to cultural and traditional values that would result in concentration of resources into fewer set of industries; resulting in specialization. Therefore it is difficult to set a-priori expectation for the relationship of development and size of the economy with export diversification.
2.2. Role of Knowledge in Diversification Strategies
Neoclassical growth model defines growth as a function of physical capital, labor inputs and exogenously given technological progress (Solow 1956). In other words, it assumes that technological advancement comes from outside of the economic system. However, inability of the neoclassical growth models to explain the differences in growth trajectories across countries casted doubts on its assumptions. Endogenous growth theory on the contrary argues that technological progress is determined within the economic system and that the role of human capital and knowledge accumulation is the most important ingredient of the technological progress which eventually determines the growth trajectory of the country (Romer 1990). It also emphasizes the role of human capital and technological capabilities in the process of product diversification (Aghion et al. 1998; Lucas 1988). The concept of human capital may not be limited to attainment of education, instead it also includes accessibility, managerial practices and economic freedom in general (Sen 1983; Yunus 2007). Extensions of the endogenous growth theory also highlight the importance of diffusion of knowledge across borders showing that development and innovation are not only functions of education related efforts at home but also depend on knowledge that is created elsewhere (Penrose 1959). In this context, knowledge spillovers through international trade, patent collaborations, skilled migration and foreign direct investment work as the channel of knowledge spillovers across borders. However, absorption and use of knowledge through external sources also depends on the stock of knowledge in the host country. The necessary condition to absorb and use external knowledge is termed as “absorptive capacity” in the literature of knowledge diffusion (Cantner and Pyka 1998; Cohen and Levinthal 1990). Knowledge under the endogenous growth framework, therefore, carries multiple dimensions where all dimensions are interrelated to each other. Human capital and productive capabilities allow economies to grow by creating economic opportunities through entrepreneurship and facilitate innovation by absorption of external knowledge and recombination of existing ideas within and between sectors.
Product diversification is a subset of growth policy which also requires knowledge and capabilities. The concept of “social capabilities” proposed by (Abramovitz 1986) includes general education and technical competence among other factors that allows economies to develop. From purely technological point of view, the capability to access, absorb and use of knowledge can be termed as “technological capability” (Kim 1997 as cited by Fagerberg and Srholec (2015)). According to Kim, technological capability can be divided into three types; productive capabilities, which are necessary to efficiently utilize productive facilities; investment capabilities, that are concerned with abilities to engage in new ventures and innovative capabilities, that are necessary to develop goods and services. The ability to diversify, therefore, strongly depends on the capabilities present in the country and diffusion of knowledge from external sources could become crucial in the diversification process of the technologically lagging countries.
2.3. Foreign Direct Investment and Trade Openness
Numerous studies have shown that FDI not only creates employment opportunities but also transfers knowledge, both voluntary and involuntary, from home to host countries through formal and informal channels (Ali et al. 2016; Branstetter 2006; Hejazi and Safarian 1999; Saggi 2002). If lack of diversification in a country is due to the lack of productive capabilities then FDI is expected to fill the competence gap by transferring capital and productive and managerial know-how to the host country provided that local firms have the absorptive capacity to capitalize on the knowledge flows through FDI. Multinational firms usually invest in the human capital of their employs by providing trainings. Doing so, they voluntarily transfer core managerial and productive skills to their employees. In an event of labor mobility from multinational firms to the local firms, the knowledge embodied in the employees of the multinational firm is then transferred to the local firms not only making them more productive and efficient than before but also increasing their absorptive capacity and innovativeness. Foreign direct investment can be one of the main determinants of unrelated variety, especially in countries that lag behind in technology, as it brings capabilities that are not available locally. Literature also shows that high-tech FDI and hi-tech imports as well as FDI-related and import-related spillovers complement each other (Ali et al. 2016; Brainard 1997). In the long run, these capabilities promote entrepreneurship through entrepreneurial spin-offs and knowledge spillovers.
The impact of trade liberalization on export diversification in the previous studies have not been conclusive (Cadot et al. 2013). Some studies have found that trade openness leads to specialization instead of diversification as countries trade in the products in which they have comparative advantage (Ferdous 2011) while other studies have shown that trade liberalization increases export opportunities by increasing the number of trade partners, therefore increasing volume and diversity of demand for its products, resulting in increased export diversification (Agosin et al. 2012). Moreover, some studies have also shown that trade liberalization facilitates economic expansion (Krugman and Venables 1990), which results in product diversification. We also know from the literature that trade can facilitate knowledge spillovers through knowledge embodied in the imported goods (Ali et al. 2016; Coe and Helpman 1995; Saggi 2002). Therefore, one would expect countries to expand their product portfolio by learning from the knowledge embodied in imported products, provided they have sufficient absorptive capacity. Since increase in trade openness implies a greater exposure to international markets, and since demand for diverse products can incentivize local producers to invest in new products, one would expect that trade openness may have a positive relationship with export diversification. Since related diversification may be achieved using capabilities available in the related sectors, one would expect that increase in openness would have a stronger effect on related variety as compared to unrelated variety which is relatively more difficult to achieve.
2.4. Remoteness
The geographical position of a country also plays an important role in the diversification process (Cadot et al. 2011b; Parteka and Tamberi 2013). Venables and Limao (2002) for instance, suggest that being closer to one’s trade partners or major markets reduces the cost of trade, opening up opportunities for a country to trade. Similarly, Dutt et al. (2009) show that the diversification process is negatively affected by the distance to major markets. Although geographical distance is exogenous to the economy, policy recommendation based on this indicator is related to the reduction of the costs associated with remoteness (Agosin et al. 2012). Being far away from major markets can limit the exposure of a country to the global demand for heterogeneous products, giving them less opportunity to diversify. The major three capital-good producing regions are the U.S., Japan and Western Europe (Gallup et al. 1998). Therefore, the present study defines Rotterdam, New York and Tokyo as the three major markets. These three cities are the major capitals in the above mentioned regions. The variable measures the Great-Circle air distance in kilometers of the nearest of these three capitals from the capital cities of the countries studied in this paper.
3. Types of Diversification
With respect to relatedness among sectors, diversification can be distinguished between related (i.e., within-sector) variety and unrelated (i.e., between-sector) variety. Related variety (RV) concerns with variety of country’s exports in cognitively related sectors while unrelated variety measures variety in unrelated sectors. If a country wishes to increase export diversification it must have the necessary capabilities to successfully pursue diversification strategies (Cadot et al. 2013). Due to the relatedness among sectors, production in related sectors may require a similar set of capabilities as compared to unrelated variety (UV) which encompasses products that may require different sets of capabilities (Frenken et al. 2007; Saviotti and Frenken 2008). The distinction between the determinants of related and unrelated diversification is important because not only that they may require different set of capabilities, but also because they have different implications for growth and innovations. Investment in unrelated new ventures is relatively more difficult, risky, and costly than investing in related sectors, and RV and UV affect economic output with different time lags (Saviotti and Frenken 2008). On one hand, since RV includes products that embody similar characteristics (or that fall under similar industry classifications), the relatedness of these products facilitates the knowledge spillovers. On the other hand, unrelated diversification guards against real economic shocks as unrelated sectors are, by definition, not strongly correlated with each other.
Technically, entropy version of diversification measures the equality of export distribution across sectors. The export structure is considered highly diversified if each sector shares approximately the same proportion in total exports. On the contrary if total exports are concentrated in few sectors, the export composition is said to be specialized. Depending on the context, diversification can be measured at any level of industrial classification. Standardized industrial classifications assign industries to different classes based on their relatedness to each other, where more digits in the classification number indicate closer relatedness. Industries within the same three-digit level, for example, are considered more related to each other as compared to industries within the same two-digit level. Since level of relatedness differs at different levels of industrial classifications, diversification at different levels can have different implications for the economy. Related variety measures the distribution of exports at three-digit level within each two-digit level; i.e., it measures the distribution of exports in related sectors within each two-digit sector. Whereas, unrelated variety measures the distribution of exports at two-digit level i.e., it measures the distribution of total exports across two-digit sectors. Since industries with different two-digit codes are unrelated to each other, variety at this level can be classified as unrelated variety.
To delve more deeply into the concepts of RV and UV, consider an example of two sectors—42 and 78—from the Standard International Trade Classification (SITC) Rev. 3 (See Table 1). Here, the types of products covered under two-digit sectors 41 and 78 are quite different. However, within these two-digit sectors, three-digit sectors are closely related to each other (compare for example, 421 with 422 or 781 with 782/783). Since variety at the two-digit level measures how total exports are distributed between two-digit sectors, variety takes the highest value if both sectors have equal shares, and takes the lowest value (i.e., zero) if one of these sectors has a 100% share. Since sectors 41 and 78 are unrelated to each other, variety at this level is considered UV. On the other hand, if variety is measured at the three-digit level falling under two-digit sectors (e.g., 421 and 422 within 42, or 781, 782, and 783 under 78), the index then measures the distribution of export shares within two-digit sectors. Since three-digit sectors are related to each other, variety calculated at this level is considered RV.
Relatedness of industries at lower levels of industrial classification (for example at the three-digit level) increases productivity across countries through knowledge spillovers. When the share of exports in one sector starts to grow, this fuels demand for intermediate inputs. As a result, shares of other related sectors also start to increase. The increase in RV in such a case is a result of the processes that normally accompany increased economic activities within a broad (i.e., two-digit) sector. An increase in UV, on the contrary, measures how evenly total exports are distributed across unrelated sectors (for example, at the two-digit level). To begin production in unrelated sectors, new capabilities are required, which might not be available locally. Therefore one would expect the determinants of RV and UV to be different and this is the main contribution of this paper.
4. Data
The data used in this study cover the time period from 1996 to 2011. The descriptive statistics and correlation matrix are presented in Table A1 and Table A2, respectively. A full list of variables, their description, and their sources are given in the Table A3 in the Appendix. Data for commodity exports for the creation of diversification indices are taken from the United Nations Conference on Trade and Development (UNCTAD) database, which provides exports data at the three-digit level for most countries in the world, starting from 1995. Three measures of diversification are used in the empirical analysis: the Theil overall variety index (OV), which measures overall export diversification at the three-digit level; related variety (RV), which measures diversification at three-digit within each two-digit industrial classification; and unrelated variety (UV), which measures diversification across industries at two-digit industrial classification. Since the focus of the study is on the role of capabilities in producing sophisticated products, these diversification indices are restricted to the manufacturing sector only. The manufacturing sector includes Industries 5 to 8, excluding 68, as per Standard International Trade Classification (SITC), Revision 3. Countries were chosen for this study purely on the basis of data availability. The list of countries can be found in Table A4 in the Appendix. The computation of the diversification indices is explained in the following section.
4.1. Calculation of Variety Indices
4.1.1. Overall Variety (OV)
The overall variety index is calculated at three-digit SITC classification level using the entropy measure proposed by Theil (1972). The index takes the value of 0 when all exports are concentrated in one three-digit industry and a maximum value of log2(n) when all active three-digit industries have equal shares in total exports (where n is the number of sectors at three-digit level). Since we have data for 255 three-digit industries, the range of the OV index can therefore be defined as from 0 to log2(255) = 8.
In order to formally explain the steps for the calculation for indices, let three-digit sectors i fall under a two-digit sector Sg, where g = 1, G. The formula for OV index can then be written as entropy at three-digit level1.
4.1.2. Related Variety (RV)
The decomposable nature of the Theil entropy index allows it to calculate variety at different levels of industrial classification. RV (i.e., within industries that share the same two-digit code) and UV (i.e., across industries that differ at the two-digit level) are calculated based on the methodology used by Frenken et al. (2007). Using the notation in section (i) above, the two-digit shares Pg can be derived by summing up the three-digit shares pi:
Related variety is then calculated as the weighted sum of entropy within two-digit sector.
where,
The entropy based measure Hg represents sum of distribution of three-digit sectoral shares under each representative two-digit sector. The formula for RV then adjusts this measure to the overall share of the two-digit sector Pg in total exports.
4.1.3. Unrelated Variety (UV)
Finally, unrelated variety is calculated as variety at the two-digit level by exploiting the relative unrelatedness at two-digit classification. Formally the formula for calculating UV can be presented as:
4.2. Time Trends of Variety Indices
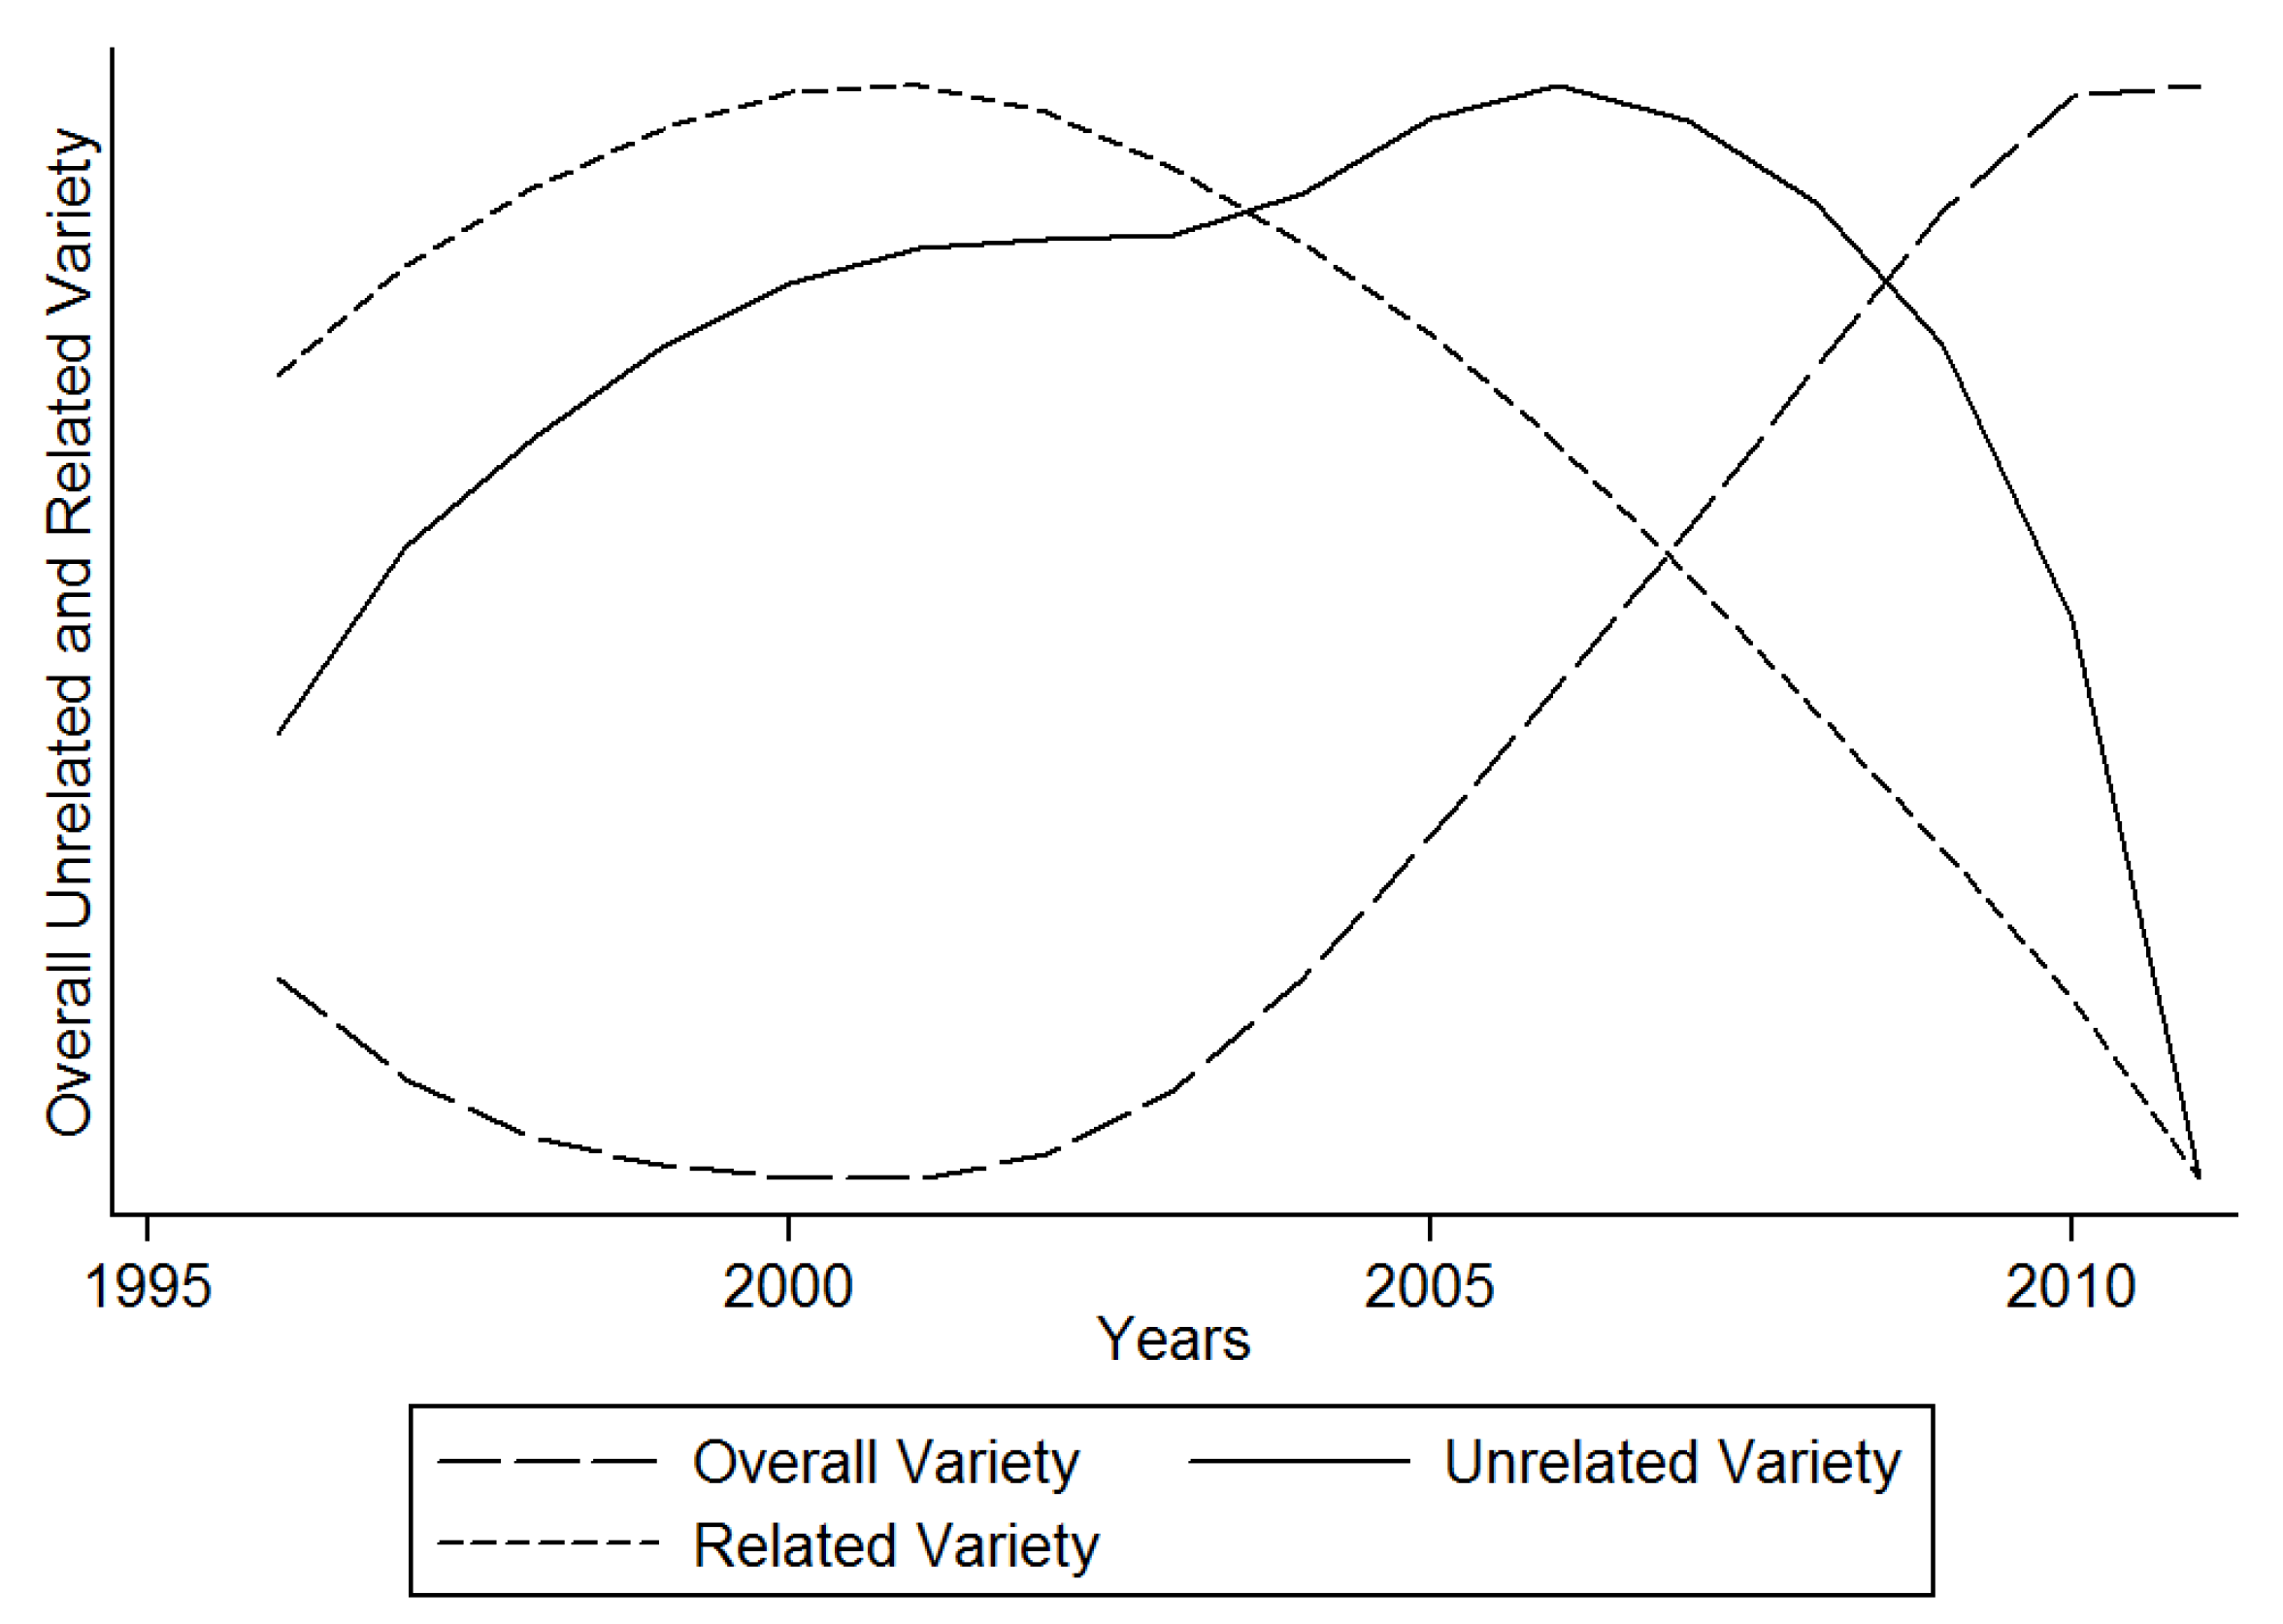
An important feature of panel data is that it allows not only for cross country comparison but also allows for analysis of trend over time. Subsequent set of figures aim to visualize the data in order to have a general understanding of the trends across the different groups of countries. Figure 1 shows the evolution of OV, RV and UV over time collectively for all countries. Observations for all variables at each time step are taken as averages across countries. Figure shows that OV and RV trends are mirror images of each other where OV shows a U-shaped curve and RV shows an inverted U-shaped curve. It appears as if, on average, when one type of variety increases, the other one decreases which is surprising as decomposition property of the Theil index implies that the resulting indices at different levels of industrial classification may not be necessarily correlated with each other. The turning points for both RV and OV occurred around 2001 before which RV showed an increasing trend while OV showed a decreasing trend over time. In terms of UV, diversification shows positive trend on average until 2006 after which it showed sharp decline till the end of the sample period showing that diversification on average has been decreasing rapidly in the last decade. In sum, Figure 1 shows that while overall variety in the world has been on the rise since 2001, the related and unrelated variety are showing decreasing trend in recent years showing the trend towards related and unrelated specialization even though diversification as a whole at three-digit level has been increasing.
Previous empirical studies have shown that diversification patterns differ for developed and developing countries. In order to visualize the differences among trends of OV, RV and UV, Figure 2 presents three sub-graphs for OV (Figure 2a), RV (Figure 2b) and UV (Figure 2c). Figure 2a shows that OV for developing countries have been persistently increasing over the years while for developed countries it shows a U-shaped trend with the turning point occurring around 2003. OV trend for all countries combined also shows a U-shaped trend with a turning point occurring earlier than 2003. In general, Figure 2a shows that trends in variety clearly differ for developed and developing countries showing some level of path dependency and difference in diversification patterns across different growth trajectories. As compared to Figure 1, Figure 2a shows that overall variety has been increasing for both developed and developing countries over the recent years however the trends for developing and developed countries differ before 2004.
Figure 2b,c compare trends of RV and UV across developing and developed countries, respectively. For developed countries, both RV and UV show persistent decreasing trend over time indicating a movement towards related and unrelated specialization. For developing countries RV shows an inverted U-shaped curve with an increasing trend upto 2001 and then decreasing trend afterwards. On the contrary, UV shows an overall increasing trend with a decreasing trend in the last two years which could be the result of measurement error in the latest available data. The set of figures in Figure 2 clearly indicate that diversification patterns differ across countries at different stages of development. The difference in trends is most prominent for UV where for developed countries it seems to decrease over time and for developing countries it has been increasing except for the last two years. The differences highlighted in Figure 1 and Figure 2, motivate the need to differentiate between the types of diversification in the empirical analysis.
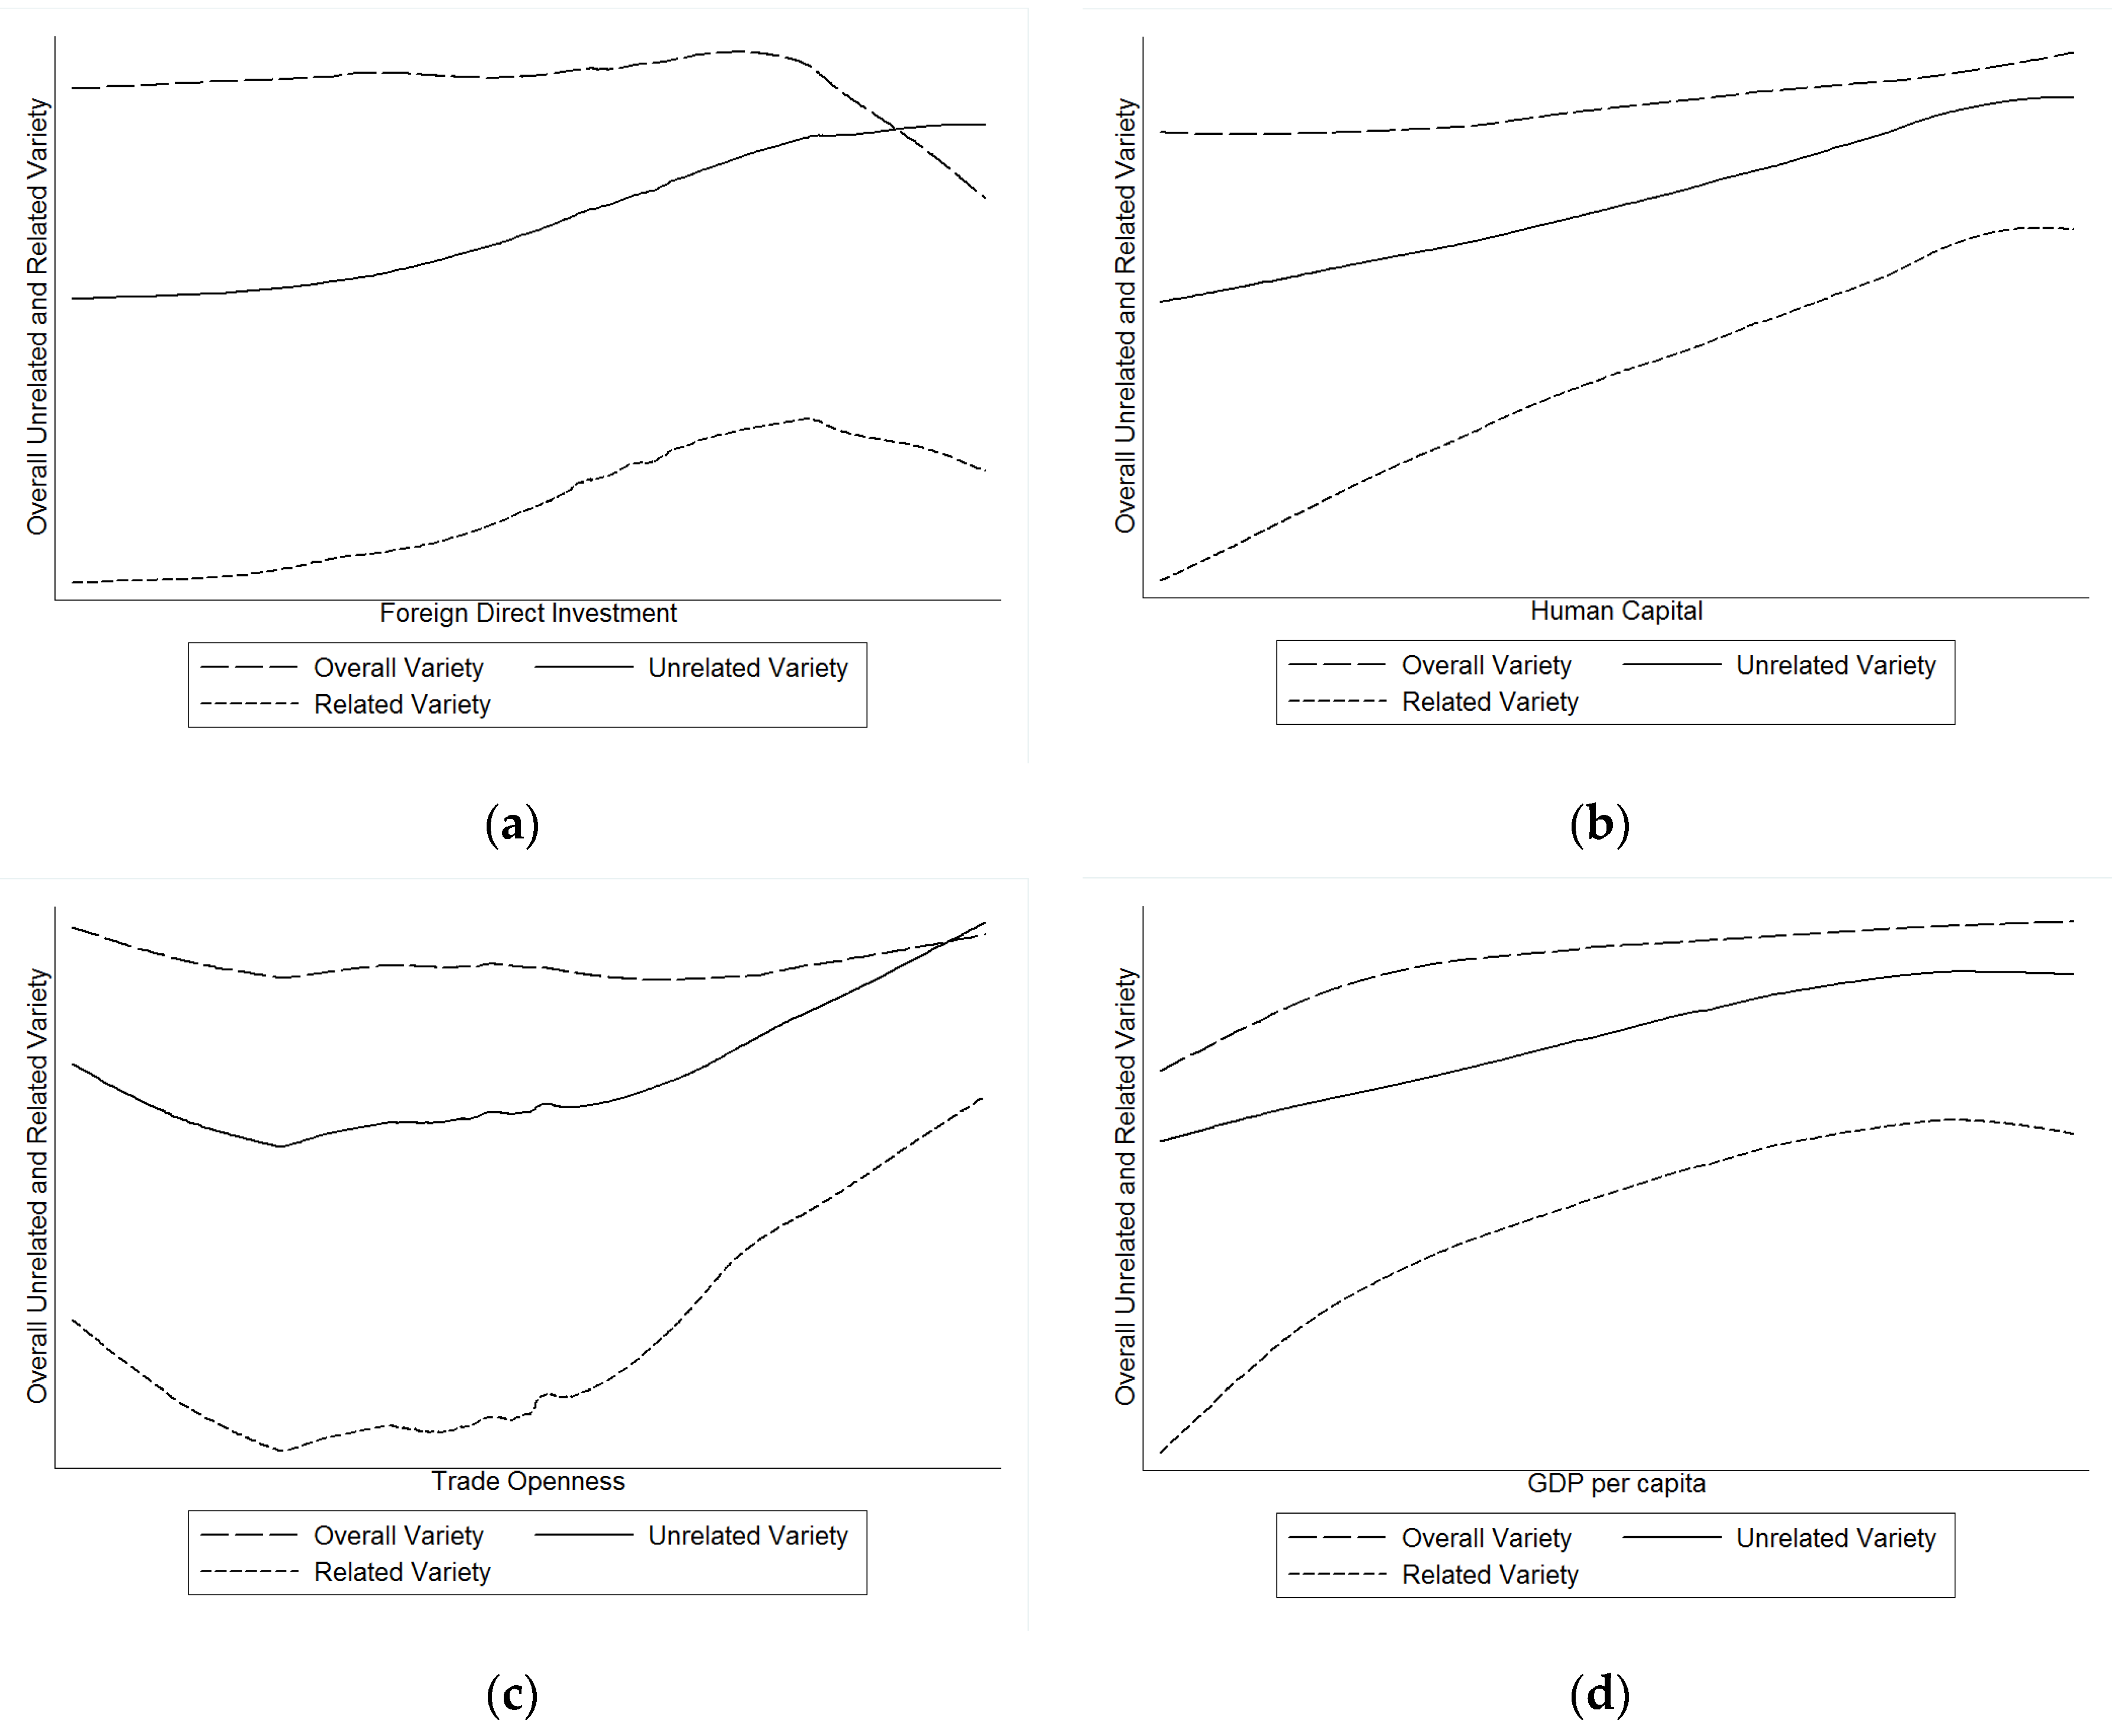
Empirical analysis in this study mainly focused on the role of FDI, human capital and openness in the diversification process. Therefore, before proceeding to the econometric models and estimations, Figure 3 compares the correlations between variety indices and foreign direct investment (Figure 3a), human capital (Figure 3b), trade openness (Figure 3c) and GDP per capita (Figure 3d). Figure 3a shows that FDI has slightly hump-shaped relationship with OV and RV, showing that FDI stock may have positive correlation with diversification up-to certain extent after further increase in FDI stock would lead to specialization instead of diversification in case of OV and RV. In contrast, the humped-shaped relationship between FDI stock and UV appears to be relatively less prominent and the overall correlation between FDI and UV appears to be linear and positive.
Figure 3b shows that all three types of diversification have positive correlation with human capital showing that the countries with higher stock of human capital tend to have higher variety in all three variants. The curve for RV appears to be relatively steeper as compared to the other two indices showing that correlation of human capital with RV is higher in magnitude as compared to UV and OV. Figure 3c shows U-shaped relationship of trade openness with all three types of diversification. It appears as if diversification decreases with increase in trade openness at first, however, after reaching a certain threshold, diversification starts to increase again. The humped-shape is more pronounced for the related variety and least prominent for overall variety showing that trade openness may not have noticeable correlation with OV however; it does appear to have some relationship with UV and OV.
Finally, Figure 3d compares the relationship between GDP per capita and diversification. The graph shows overall positive relationship of GDP per capita with all three types of diversification but with a slight hint of a hump-shaped relationship. The apparent non-linear relationship between GDP per capita and diversification shows support for the findings of Imbs and Wacziarg (2003) who showed that diversification increases with increase in income per-capita up-to certain level of income after which it declines. Our empirical findings, however, did not show support for the non-linear causal relationships shown by sub-figures under Figure 3.
5. Econometric Model
Previous empirical studies on determinants of (economic) diversification have used various different model specifications and estimation methodologies leading to incomparable results. Differences in econometric models used in the previous studies are most probably due to the lack of theoretical models on the subject. Consequently the variables used in this study are inspired from Agosin et al. (2012), Cadot et al. (2013) and Parteka and Tamberi (2013) resulting in the following econometric base model:
where takes either OV, RV or UV; represents population of a country as a proxy for size of an economy; represents real GDP per capita, represents trade as a percentage of GDP which is used as a proxy for trade openness, represents the stock of human capital, represents exchange rate of a local currency with Unites States dollars, represent year dummies, represent country dummies and is an idiosyncratic error term. All variables are used in 3-year averages of their natural logarithmic forms. Model 1 serves as a base model for the empirical analysis in this study which is then subsequently extended to include which represents remoteness as a geographical distance from the main international markets and which represents stock of inward foreign direct investment (model 2).
Subsequent extensions of Model 2 introduce interactions of FDI variable with human capital and trade openness with human capital as represented by Models 3 and 4 respectively.
Our main hypotheses state that human capital has positive causal relationship with diversification and interaction between human capital and FDI should be positive implying that human capital serves as absorptive capacity to convert knowledge through external sources to competitive uses. Positive interaction may also imply that the combination of FDI and human capital has stronger positive effect on diversification compared to their main effects. Similarly, trade openness would facilitate the knowledge spillovers through trade and its interaction with human capital is likely to be positive and significant.
6. Methodology
Dynamic nature of econometric models presented in Section 5, combined with panel data structure, requires specific considerations for the choice of empirical methodology. Fixed or random effects models are generally used for panel data analysis however fixed effects models produce so-called Nickell-bias in dynamic models (Nickell 1981). Moreover, empirical literature on the relationship between diversification and growth has shown that there might be a bi-directional causality between diversification and growth which is likely to result in endogeniety bias under fixed and random effects models (Parteka and Tamberi 2013). Therefore, this study uses system Generalized Method of Moments (GMM), proposed by Arellano and Bond (1991), to estimate parameters of the proposed equations. System GMM offers many advantages over other estimation methods including correction for persistence in the dependent variable, correction for endogeneity, accounting for unobserved country specific effects, correcting for autocorrelation in panel data models and allows for the inclusion of time invariant variables as explanatory variables that would be wiped-out in fixed effects or difference GMM estimations. System GMM makes use of available information within the data to account for potential biases created by endogeneity. In particular it uses lagged values of endogenous variables in difference equation and first difference of endogenous variables in level equation. An important condition for any estimation method involving instruments is the validity (exogeneity) of instruments which is tested in the GMM framework by Hansen test proposed by Hansen (1982). However, Hansen test weakens with the increase in number of instruments (Bowsher 2002) therefore, in addition to Hansen test, Arellano-Bond test for second order autocorrelation is also used to confirm the validity of instruments. Robust standard errors and small sample correction are applied for correction of standard errors. Moreover, one step GMM is used due to relatively small sample size which may lead to incorrect calculation of weight matrix. GDP per capita is assumed to be endogenous and second and third lags of income are used as GMM-type instruments. Remoteness, exchange rate and population are treated as strictly exogenous variables, where first lags and onwards are used as IV-type instruments. All the other variables are treated as pre-determined variables where GMM-type instruments are used with first lags and onwards. In order to avoid too many instruments in the models, instrument matrix was collapsed (Roodman 2009).
7. Estimation Results
Estimation results for the econometric models with the dependent variables OV, RV and UV are presented in Table 2, Table 3 and Table 4, respectively. The first model in each table is the base model with time-specific and country-specific effects. Model 2 and 3 subsequently introduce Rem and FDI into the main model to ensure the robustness of the results for the base model. Interactions between FDI and HC and between Opn and HC are included in Model 4 and Model 5, respectively in order to test whether the impact of HC on diversification differs across different levels of FDI and trade openness.
The results show that population and trade openness have positive and significant relationship with all three types of diversification implying that, as economies expand in size they tend to diversify their product portfolio. Similarly, as countries increase overall size of their international trade as a percentage of their GDP, they tend to diversify their export portfolio. The results support the argument that as economies grow, demand for variety increases (Krugman 1981). Similarly, in international context, when countries increase the size of their international trade, they face additional demand for variety from their trade partners. Comparing the results for three types of variety i.e., OV, RV and UV, the results show that the impact of size of an economy and openness to international trade on diversification does not differ in terms of sign and significance for the three types of diversification indices used in this study. The magnitude of coefficients is similar for OV and RV while for UV it is noticeably smaller in size as compared to OV and RV. An interpretation of this result could be that since increase in UV is expected to be relatively difficult to achieve due to unrelatedness of the required capabilities with the existing ones, mere increase in size of the economy and trade openness may not have the same strength of the effect as for RV and OV.
With respect to the relationship between level of development and export diversification, contrary to the findings in previous studies, per capita income does not appear to have a significant relationship with OV. However, it does have negative and significant relationship with UV and RV showing that, with increase in development, countries tend to specialize in both related and unrelated sectors similar to the findings of Parteka and Tamberi (2013) for overall variety. The difference in results for different types of variety once more shows the need to differentiate among variety at different levels of industrial classifications. From methodological perspective, when quadratic functional form of per capita income is included in a simple OLS based framework with control variables proposed in previous studies, one can find evidence for quadratic relationship. The result shows not only that causal interpretation of the result requires careful consideration of endogeneity bias but also that econometric models used by previous research might have omitted some important control variables in their models. This study therefore improves the findings of previous studies by using a relatively more complete model specification and by using an appropriate methodology to account for the potential endogeniety bias.
Turning to the variables of interest, FDI and human capital, results show that FDI is negatively and significantly related to RV while it doesn’t seem to have an effect on UV and OV. Negative relationship between FDI and RV implies that FDI exploits the resources available in economy to produce goods in sector related to but different from the sector(s) of core competence of the host countries. With respect to human capital, result shows only weak positive effect of human capital on RV and UV which is not robust across specifications. This result might be due to the fact that human capital index is based on average years of schooling and in order to diversify the export portfolio, higher average years of schooling may not be sufficient. In order to test this argument, interactions between human capital and FDI and an interaction between human capital and trade openness are included in Models 4 and 5, respectively. The aim of the interactions is to capture the relationship of human capital at different levels of FDI stock and trade openness as both trade and FDI have been identified as the channels of international knowledge spillovers in previous studies. Results for OV show that human capital remains insignificant for different levels of FDI and trade openness as both interactions appear with insignificant coefficients. The interaction for FDI and human capital shows positive and highly significant relationship with both RV and UV showing that FDI significantly and positively moderates the relationship between human capital and diversification. This result shows support for the hypothesis that FDI is a source of knowledge and human capital serves as absorptive capacity to transform encoded knowledge to productive output (Ali et al. 2016). In case of trade openness, the positive and significant interaction was only found for RV showing that knowledge spillovers through trade may only moderate the relationship between human capital and diversification for variety in related sectors showing further support for the argument that determinants of UV might differ from the determinants of RV.
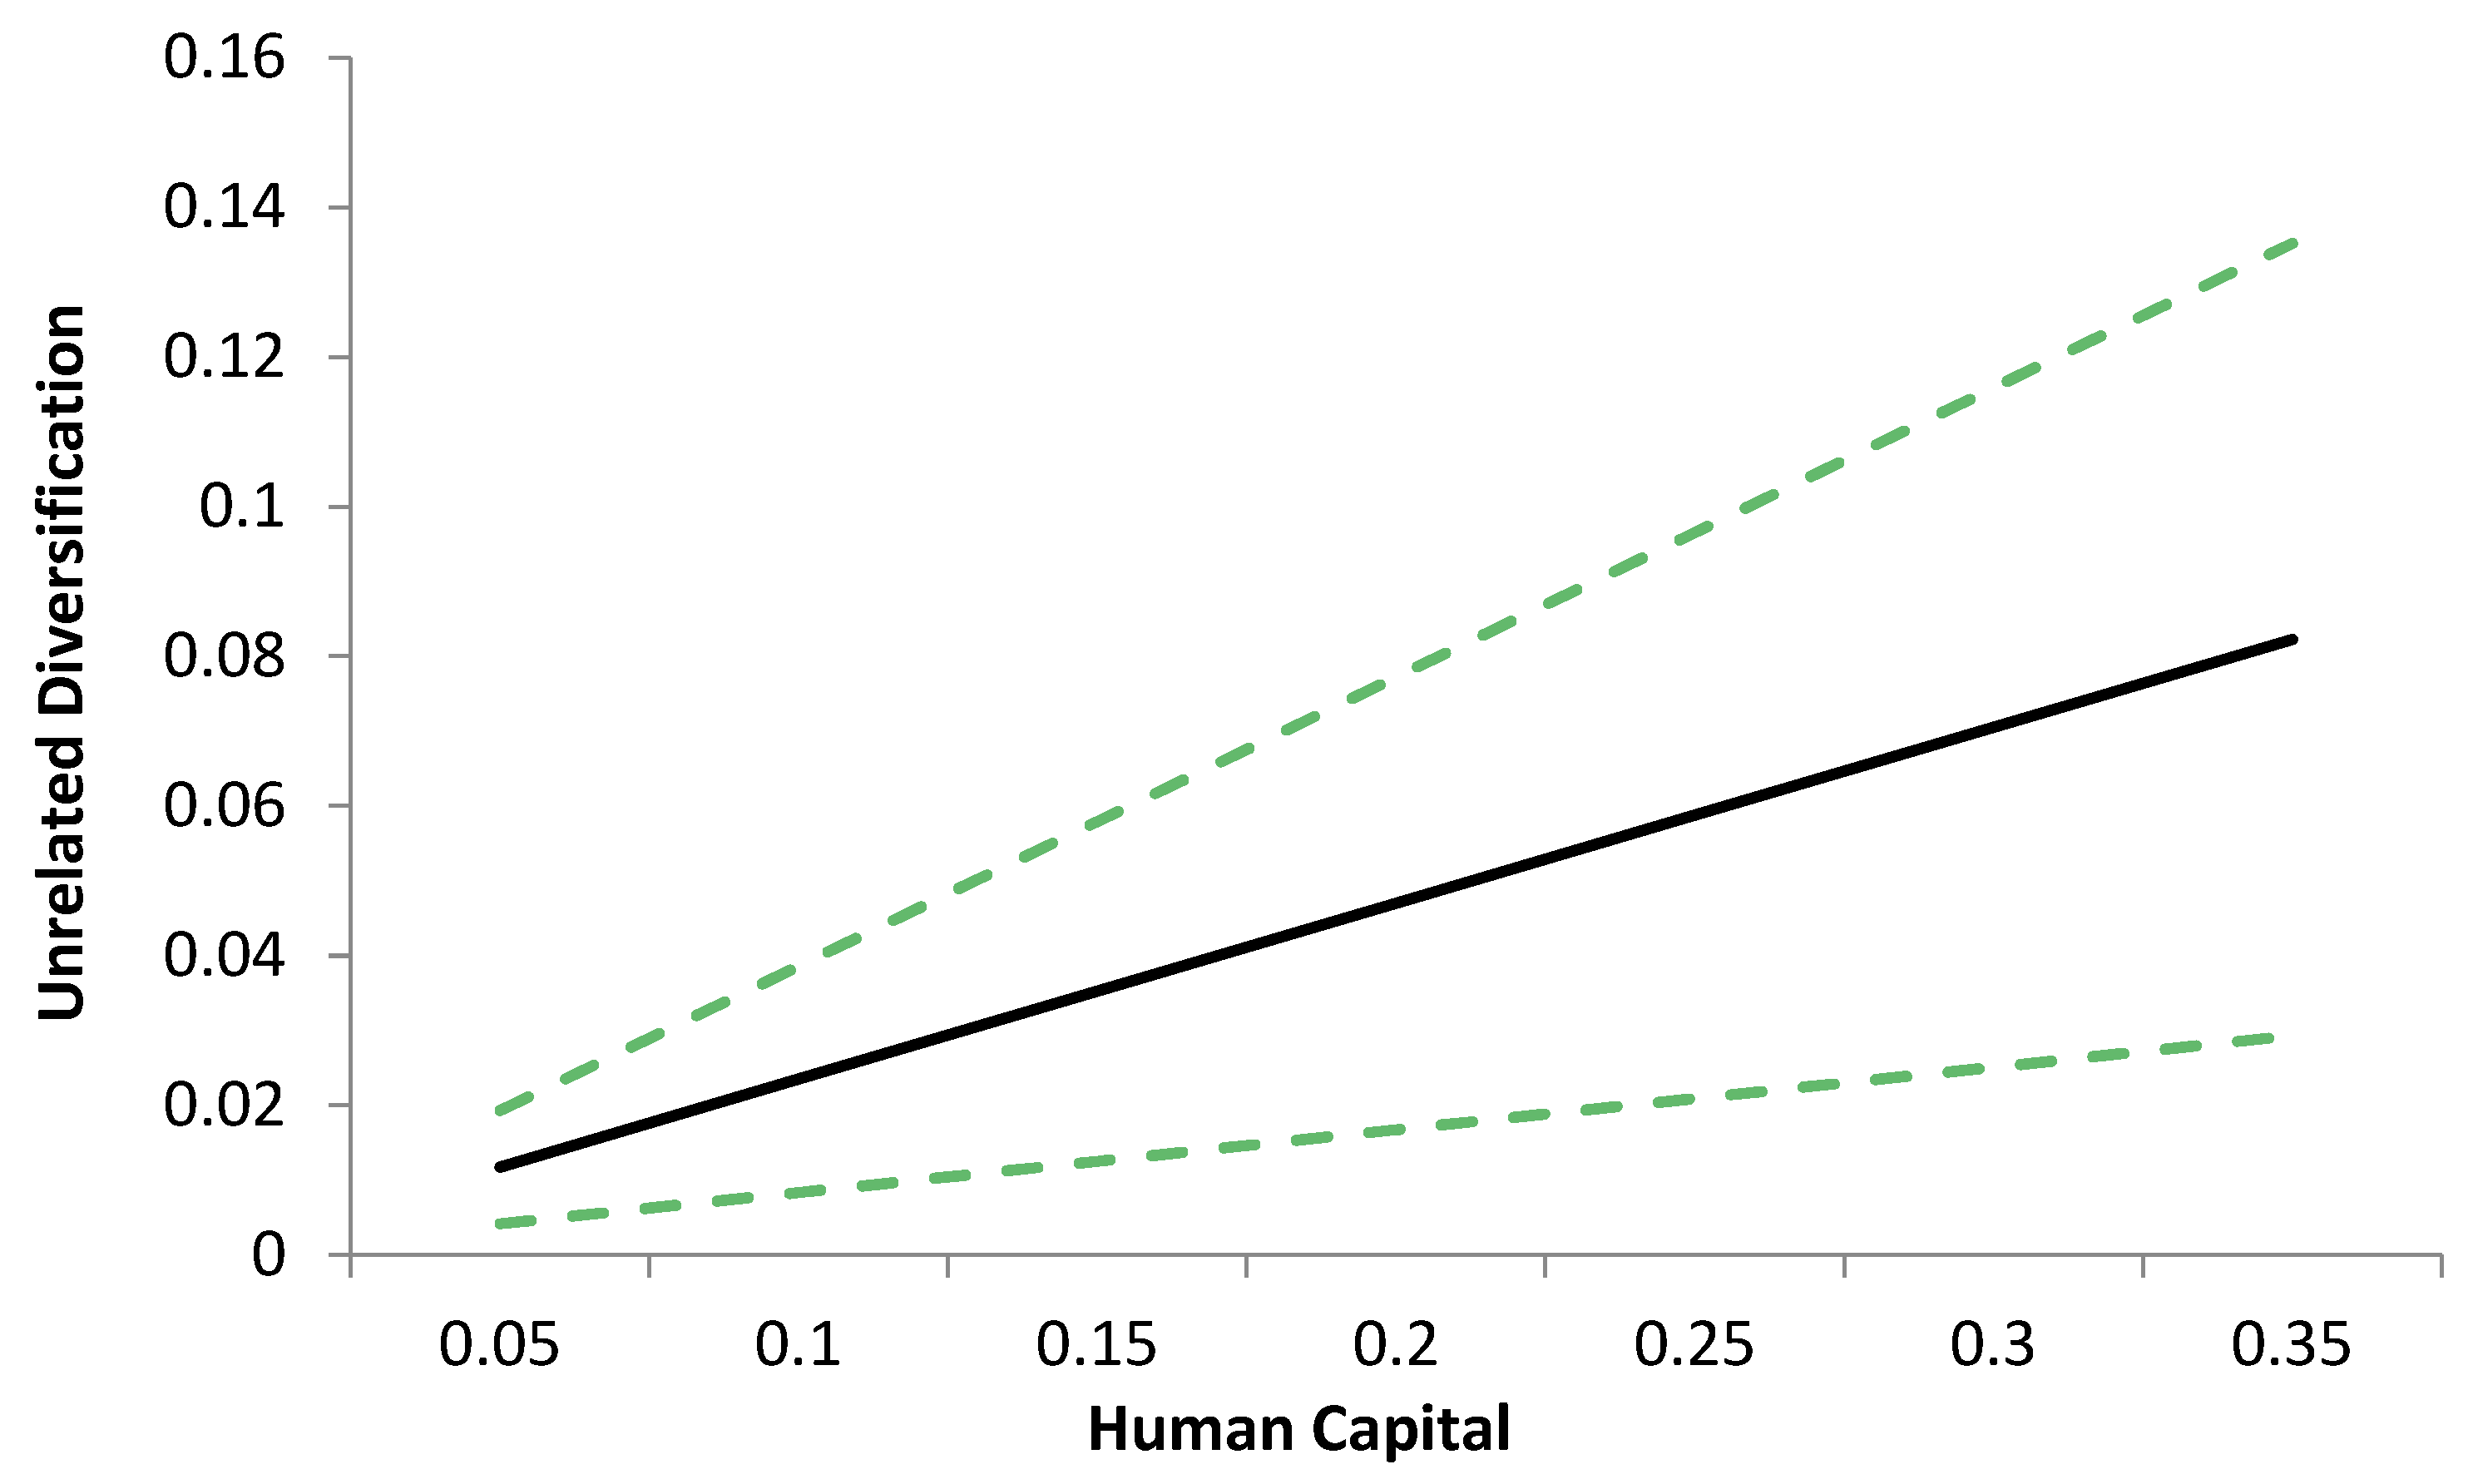
Figure 4 and Figure 5 show the interaction effects of human capital with FDI and trade openness. Figure 4 shows that the effect of FDI on unrelated variety increases with increase in human capital. Similarly, Figure 5 shows that the positive effect of trade openness increases with increase in human capital. Both figures show support for the absorptive capacity hypothesis.
Real exchange rate depreciation is generally shown to have positive relationship with diversification in previous empirical studies implying that depreciation of currency makes exports of a country cheaper which increases the international demand for country’s exports. however, results in this study show negative relationship between exchange rate depreciation and diversification both for RV and UV.
A possible explanation for this result could be that when exchange rate depreciates, it increases the global demand for the country’s exports in the market however a country is likely to attract customers in the sectors where it has comparative advantage in quality. It is likely that when decrease in prices push the demand for exports in only few sectors, the resources and investment trends may shift towards these sectors resulting in increase in production and exports in few sectors that will lead to increase in specialization in general. The result points towards a possibility that depreciation of exchange rate may increase demand for country’s products but it may not necessarily increase demand for variety at the same time.
Finally, in order to capture the importance of geographical positioning of a country for its export performance, geographical remoteness from major markets was included in the regressions. The coefficient for remoteness shows weak negative relationship with RV and UV. Negative relationship shows that distance from major markets negatively affects the diversification process as the demand for products might be affected by the distance to the trade-hubs. Contrary to the findings in previous empirical studies, remoteness does not appear to have a significant relationship with OV. The result should however be interpreted with care as it is not robust across specifications. Nevertheless, geographical distance with major market is indeed an important variable in context of trade and it should be included in the models that aim to explain demand for exports of a given country.
8. Conclusions
This study aims to contribute to the literature on determinants of export diversification by differentiating between related and unrelated export diversification in addition to the traditionally used overall Theil diversification index. The diversification indices were calculated using export data at the three-digit level of industrial classification for 130 countries from 1996 to 2011. Using system GMM methodology to account for the potential endogeneity bias, results of the study show that foreign direct investment leads to related specialization. With respect to the interaction between FDI and human capital, the results show that FDI significantly and positively moderates the relationship between human capital and diversification for UV and RV where coefficient of the interaction for RV appears to be atleast twice as large as the one for UV. Similarly, the interaction between human capital and trade openness appears significant only for RV showing that the role of trade openness, whether be in the form of knowledge or employment effects, is more pronounced for RV. The results show that there is a need to distinguish between OV, RV and UV in any analysis of export diversification. It also shows the importance of human capital in the diversification process and shows that even though FDI may have significant and negative relationship with diversification, it can still increase diversification in combination with human capital stock. From policy perspective, this study shows that local absorptive capacity should be increased if a country wishes to diversify its product portfolio. It also shows that FDI should be attracted if a country wants to increase unrelated variety and trade openness should be increased if a country wants to increase related variety. In both cases, human capital appears to facilitate the positive effect of FDI and openness on unrelated and related variety, respectively.
Despite providing some interesting insights, the study does have potential limitations. First, regarding the measurement of diversification, most (if not all) indices of diversification rely on industrial classifications. These classifications are revised infrequently, which makes it difficult if not impossible to distinguish between real innovations and simple additions of already existing products in the portfolio. Moreover, relatedness in industrial classifications is sometimes arbitrary, and lacking a proper scientific relatedness framework. As a result, some industries that should be related to each other are assigned to different groups resulting in difficulties to distinguish between related and unrelated variety effects. Second, human capital index is based on average years of schooling, which does not account for the quality of human capital. A better human capital variable that can account for the quality and technological content in the human capital stock would significantly improve the results. Third, use of better measures of foreign direct investment that explicitly differentiate between sectors and product types would also improve the results and will allow for more comprehensive analysis. Finally, longer time series could also help in identifying long-term trends and relationships using cointegration techniques.
Appendix A

Table A1.
Descriptive Statistics.
| Variable | Obs | Mean | Std. Dev. | Min | Max |
|---|---|---|---|---|---|
| OV | 1716 | 1.119 | 0.414 | −2.036 | 1.514 |
| UV | 1716 | 0.452 | 0.816 | −2.988 | 1.451 |
| RV | 1716 | −0.909 | 1.355 | −6.328 | 0.689 |
| Pop | 1716 | 2.281 | 1.666 | −1.447 | 7.181 |
| GDPpc | 1689 | 8.187 | 1.690 | 4.585 | 11.329 |
| Opn | 1562 | 4.338 | 0.522 | 2.809 | 6.046 |
| Rem | 2112 | 0.036 | 0.027 | 0.000 | 0.096 |
| FDI | 1698 | −2.031 | 1.260 | −7.573 | 1.619 |
| HC | 1716 | 0.871 | 0.252 | 0.132 | 1.284 |
| XR | 1690 | 2.883 | 2.774 | −4.005 | 10.127 |
Table A2.
Correlation matrix.
| OV | UV | RV | Pop | GDPpc | Opn | Rem | FDI | HC | XR | |
|---|---|---|---|---|---|---|---|---|---|---|
| OV | 1.00 | |||||||||
| UV | 0.44 | 1.00 | ||||||||
| RV | 0.48 | 0.90 | 1.00 | |||||||
| Pop | 0.25 | 0.19 | 0.23 | 1.00 | ||||||
| GDPpc | 0.42 | 0.51 | 0.42 | −0.18 | 1.00 | |||||
| Opn | −0.03 | 0.15 | 0.16 | −0.56 | 0.26 | 1.00 | ||||
| Rem | −0.19 | −0.42 | −0.34 | 0.18 | −0.53 | −0.26 | 1.00 | |||
| FDI | 0.04 | 0.26 | 0.16 | −0.30 | 0.52 | 0.48 | −0.25 | 1.00 | ||
| HC | 0.39 | 0.56 | 0.49 | −0.11 | 0.75 | 0.32 | −0.41 | 0.41 | 1.00 | |
| XR | −0.24 | −0.38 | −0.32 | 0.15 | −0.57 | −0.21 | 0.32 | −0.38 | −0.46 | 1.00 |
Table A3.
Variable Description and Sources.
| Variable | Description/Unit | Source |
|---|---|---|
| Overall Variety (OV) | All three indices were calculated using UNCTAD detailed statistics at three-digit level for exports. | UNCTAD secretariat calculations, based on UN DESA Statistics Division, UN COMTRADE; IMF, Direction of Trade Statistics; UNCTAD. |
| Related Variety (RV) | ||
| Unrelated Variety (UV) | Merchandise trade matrix–detailed products, exports in thousands of dollars, annual, 1995–2013 | |
| Pop | Population in thousands | Penn World Table 8.0 |
| GDPpc | GDP per capita constant 2005 US Dollars | Penn World Table 8.0 |
| HC | Index of human capital per person, based on years of schooling | Penn World Table 8.0 |
| Opn | Trade openness = (Exports + Imports)/GDP | World Development Indicators (WDI) |
| FDI | Stock of inward FDI in US Dollars at current prices and current exchange rates in millions | UNCTAD |
| XR | Real exchange rate adjusted for cross prices. Variables used: Nominal Exchange Rate (Local Currency Unit per US$) and Inflation (Deflator) | World Development Indicators (WDI) |
| Rem | Kilometers to nearest major port (New York, Rotterdam or Tokyo). | CEPII (Centre d’Etudes Prospectives et d’Informations Internationales, bilateral distance |
| data: dist_cepii). |
Table A4.
List of Countries.
| Developing | Macao | Australia |
| Argentina | Malawi | Austria |
| Bahrain | Malaysia | Belgium |
| Bangladesh | Maldives | Bulgaria |
| Barbados | Mali | Canada |
| Belize | Mauritania | Croatia |
| Benin | Mauritius | Cyprus |
| Bolivia | Mexico | Czech Republic |
| Botswana | Mongolia | Denmark |
| Brazil | Morocco | Estonia |
| Brunei | Mozambique | Finland |
| Burundi | Namibia | France |
| Cambodia | Nepal | Germany |
| Cameroon | Niger | Greece |
| Central African Republic | Pakistan | Hungary |
| Chile | Panama | Iceland |
| China | Paraguay | Ireland |
| Colombia | Peru | Italy |
| Congo, Dem. Rep. | Philippines | Japan |
| Congo, Republic of | Qatar | Kazakhstan |
| Costa Rica | Rwanda | Kyrgyzstan |
| Cote dIvoire | Saudi Arabia | Latvia |
| Dominican Republic | Senegal | Lithuania |
| Ecuador | Sierra Leone | Luxembourg |
| Egypt | Singapore | Malta |
| El Salvador | South Africa | Moldova |
| Fiji | Sri Lanka | Netherlands |
| Gabon | Sudan | New Zealand |
| Gambia, The | Swaziland | Norway |
| Ghana | Syria | Poland |
| Guatemala | Tanzania | Portugal |
| Honduras | Thailand | Romania |
| Hong Kong | Togo | Russia |
| India | Trinidad and Tobago | Slovak Republic |
| Indonesia | Tunisia | Slovenia |
| Iran | Turkey | Spain |
| Iraq | Uganda | Sweden |
| Israel | Uruguay | Switzerland |
| Jamaica | Venezuela | Taiwan |
| Jordan | Vietnam | Tajikistan |
| Kenya | Yemen | Ukraine |
| Korea, Republic of | Zambia | United Kingdom |
| Kuwait | Zimbabwe | United States |
| Laos | Developed and Transition | |
| Lesotho | Albania | |
| Liberia | Armenia |
References
- Abramovitz, Moses. 1986. Catching Up, Forging Ahead, and Falling Behind. The Journal of Economic History 46: 385–406. [Google Scholar] [CrossRef]
- Acemoglu, Daron, and Fabrizio Zilibotti. 1997. Was Prometheus Unbound by Chance? Risk, Diversification, and Growth. Journal of Political Economy 105: 709–51. [Google Scholar] [CrossRef]
- Aghion, Philippe, Peter W. Howitt, and C. García-Peñalosa. 1998. Endogenous Growth Theory. Cambridge: MIT Press. [Google Scholar]
- Agosin, Manuel R., Roberto Alvarez, and Claudio Bravo-Ortega. 2012. Determinants of Export Diversification around the World: 1962–2000. The World Economy 35: 295–315. [Google Scholar] [CrossRef]
- Ali, Muhammad, Uwe Cantner, and Ipsita Roy. 2016. Knowledge spillovers through FDI and trade: The moderating role of quality-adjusted human capital. Journal of Evolutionary Economics 26: 1–32. [Google Scholar] [CrossRef]
- Arellano, Manuel, and Stephen Bond. 1991. Some Tests of Specification for Panel Data: Monte Carlo Evidence and an Application to Employment Equations. The Review of Economic Studies 58: 277–97. [Google Scholar] [CrossRef]
- De Benedictis, Luca, Marco Gallegati, and Massimo Tamberi. 2009. Overall trade specialization and economic development: Countries diversify. Review of World Economics 145: 37–55. [Google Scholar] [CrossRef] [Green Version]
- Bowsher, Clive G. 2002. On Testing Overidentifying Restrictions in Dynamic Panel Data Models. Economics Letters 77: 211–20. [Google Scholar] [CrossRef]
- Brainard, S. Lael. 1997. An Empirical Assessment of the Proximity-Concentration Trade-off between Multinational Sales and Trade. The American Economic Review 87: 520–44. [Google Scholar]
- Branstetter, Lee. 2006. Is foreign direct investment a channel of knowledge spillovers? Evidence from Japan’s FDI in the United States. Journal of International Economics 68: 325–44. [Google Scholar] [CrossRef]
- Cadot, Olivier, Céline Carrère, and Vanessa Strauss-Kahn. 2011a. Export Diversification: What’s behind the Hump? Review of Economics and Statistics 93: 590–605. [Google Scholar] [CrossRef]
- Cadot, Olivier, Céline Carrère, and Vanessa Strauss-Kahn. 2011b. Trade Diversification: Drivers and Impacts. Selected Works. Available online: http://works.bepress.com/ocadot/23 (accessed on 6 June 2014).
- Cadot, Olivier, Céline Carrere, and Vanessa Strauss-Kahn. 2013. Trade Diversification, Income, and Growth: What Do We Know? Journal of Economic Surveys 27: 790–812. [Google Scholar] [CrossRef]
- Cantner, Uwe, and Andreas Pyka. 1998. Absorbing Technological Spillovers: Simulations in an Evolutionary Framework. Industrial and Corporate Change 7: 369–97. [Google Scholar] [CrossRef]
- Castaldi, Carolina, Koen Frenken, and Bart Los. 2015. Related Variety, Unrelated Variety and Technological Breakthroughs: An analysis of US State-Level Patenting. Regional Studies 49: 767–81. [Google Scholar] [CrossRef]
- Coe, David T., and Elhanan Helpman. 1995. International RandD spillovers. European Economic Review 39: 859–87. [Google Scholar] [CrossRef]
- Cohen, Wesley M., and Daniel A. Levinthal. 1990. Absorptive Capacity: A New Perspective on Learning and Innovation. Administrative Science Quarterly 35: 128. [Google Scholar] [CrossRef]
- Dutt, Pushan, Ilian Mihov, and Timothy Van Zandt. 2009. Trade diversification and Economic Development. mimeo (INSEAD). Available online: http://scholar.google.de/scholar?oi=bibsandcluster=15641237450692600313andbtnI=1andhl=en (accessed on 21 May 2014).
- Fagerberg, Jan, and Martin Srholec. 2015. Capabilities, Competitiveness, Nations. CIRCLE, Papers in Innovation Studies. Lund University. Available online: http://swopec.hhs.se/lucirc/abs/lucirc2015_002.htm (accessed on 25 October 2015).
- Ferdous, Farazi Binti. 2011. Pattern and Determinants of Export Diversification in East Asian Economies. In IPEDR. Singapore: IACSIT Press, Volume 5. [Google Scholar]
- Frenken, Koen, Frank Van Oort, and Thijs Verburg. 2007. Related Variety, Unrelated Variety and Regional Economic Growth. Regional Studies 41: 685–97. [Google Scholar] [CrossRef]
- Gallup, John Luke, Jeffrey D. Sachs, and Andrew D. Mellinger. 1998. Geography and Economic Development (Working Paper No. 6849). National Bureau of Economic Research. [Google Scholar] [CrossRef]
- Goya, Daniel. 2014. The Multiple Impacts of the Exchange Rate on Export Diversification (Cambridge Working Papers in Economics No. 1436). Faculty of Economics, University of Cambridge. Available online: https://ideas.repec.org/p/cam/camdae/1436.html (accessed on 12 March 2015).
- Hansen, Lars Peter. 1982. Large Sample Properties of Generalized Method of Moments Estimators. Econometrica 50: 1029–54. [Google Scholar] [CrossRef]
- Hejazi, Walid, and A. Edward Safarian. 1999. Trade, Foreign Direct Investment, and RandD Spillovers. Journal of International Business Studies 30: 491–511. [Google Scholar] [CrossRef]
- Imbs, Jean, and Romain Wacziarg. 2003. Stages of Diversification. The American Economic Review 93: 63–86. [Google Scholar] [CrossRef]
- Kim, Linsu. 1997. Imitation to Innovation: The Dynamics of Korea’s Technological Learning. Boston: Harvard Business Press. [Google Scholar]
- Koren, Miklós, and Silvana Tenreyro. 2007. Volatility and Development. The Quarterly Journal of Economics 122: 243–87. [Google Scholar] [CrossRef]
- Krugman, Paul R. 1981. Intraindustry Specialization and the Gains from Trade. Journal of Political Economy 89: 959–73. [Google Scholar] [CrossRef]
- Krugman, Paul, and Anthony J. Venables. 1990. Integration and the Competitiveness of Peripheral Industry (CEPR Discussion Paper No. 363). C.E.P.R. Discussion Papers. Available online: https://ideas.repec.org/p/cpr/ceprdp/363.html (accessed on 6 June 2014).
- Lucas, Robert E. 1988. On the mechanics of economic development. Journal of Monetary Economics 22: 3–42. [Google Scholar] [CrossRef]
- Nickell, Stephen. 1981. Biases in Dynamic Models with Fixed Effects. Econometrica 49: 1417–26. [Google Scholar] [CrossRef]
- Parteka, Aleksandra, and Massimo Tamberi. 2013. What Determines Export Diversification in the Development Process? Empirical Assessment. The World Economy 36: 807–26. [Google Scholar] [CrossRef]
- Penrose, Edith Tilton. 1959. The Theory of the Growth of the Firm. Oxford: Oxford University Press. [Google Scholar]
- Romer, Paul M. 1990. Endogenous Technological Change. Journal of Political Economy 98: S71–S102. [Google Scholar] [CrossRef]
- Roodman, David. 2009. How to do xtabond2: An introduction to difference and system GMM in Stata. The Stata Journal 9: 83–136. [Google Scholar] [CrossRef]
- Saggi, Kamal. 2002. Trade, Foreign Direct Investment, and International Technology Transfer: A Survey. The World Bank Research Observer 17: 191–235. [Google Scholar] [CrossRef]
- Saviotti, Pier Paolo, and Koen Frenken. 2008. Export variety and the economic performance of countries. Journal of Evolutionary Economics 18: 201–18. [Google Scholar] [CrossRef]
- Sen, Amartya. 1983. Development: Which Way Now? The Economic Journal 93: 745–62. [Google Scholar] [CrossRef]
- Solow, Robert M. 1956. A Contribution to the Theory of Economic Growth. The Quarterly Journal of Economics 70: 65–94. [Google Scholar] [CrossRef]
- Theil, Henry. 1972. Statistical Decomposition Analysis: With Applications in the Social and Administrative Sciences. Amsterdam: North-Holland Publication Co. [Google Scholar]
- Venables, Anthony J., and Nuno Limao. 2002. Geographical disadvantage: A Heckscher–Ohlin–von Thünen model of international specialisation. Journal of International Economics 58: 239–63. [Google Scholar] [CrossRef]
- Yunus, Muhammad. 2007. Creating a World without Poverty: Social Business and the Future of Capitalism. New York: Public Affairs. [Google Scholar]
| 1 | For details of the construction of indices see Frenken, Oort, and Verburg, (2007). |
Figure 1.
Trends of overall variety (OV), UV and related variety (RV) over the years. Source: Author’s elaboration. Lowess smoothing has been applied to the data series for better visualization.
Figure 1.
Trends of overall variety (OV), UV and related variety (RV) over the years. Source: Author’s elaboration. Lowess smoothing has been applied to the data series for better visualization.

Figure 2.
Comparison of trends between developed and developing countries. (a) Overall variety; (b) Related variety; (c) Unrelated variety. Source: Author’s elaboration. Lowess smoothing has been applied to the data series for better visualization.
Figure 2.
Comparison of trends between developed and developing countries. (a) Overall variety; (b) Related variety; (c) Unrelated variety. Source: Author’s elaboration. Lowess smoothing has been applied to the data series for better visualization.
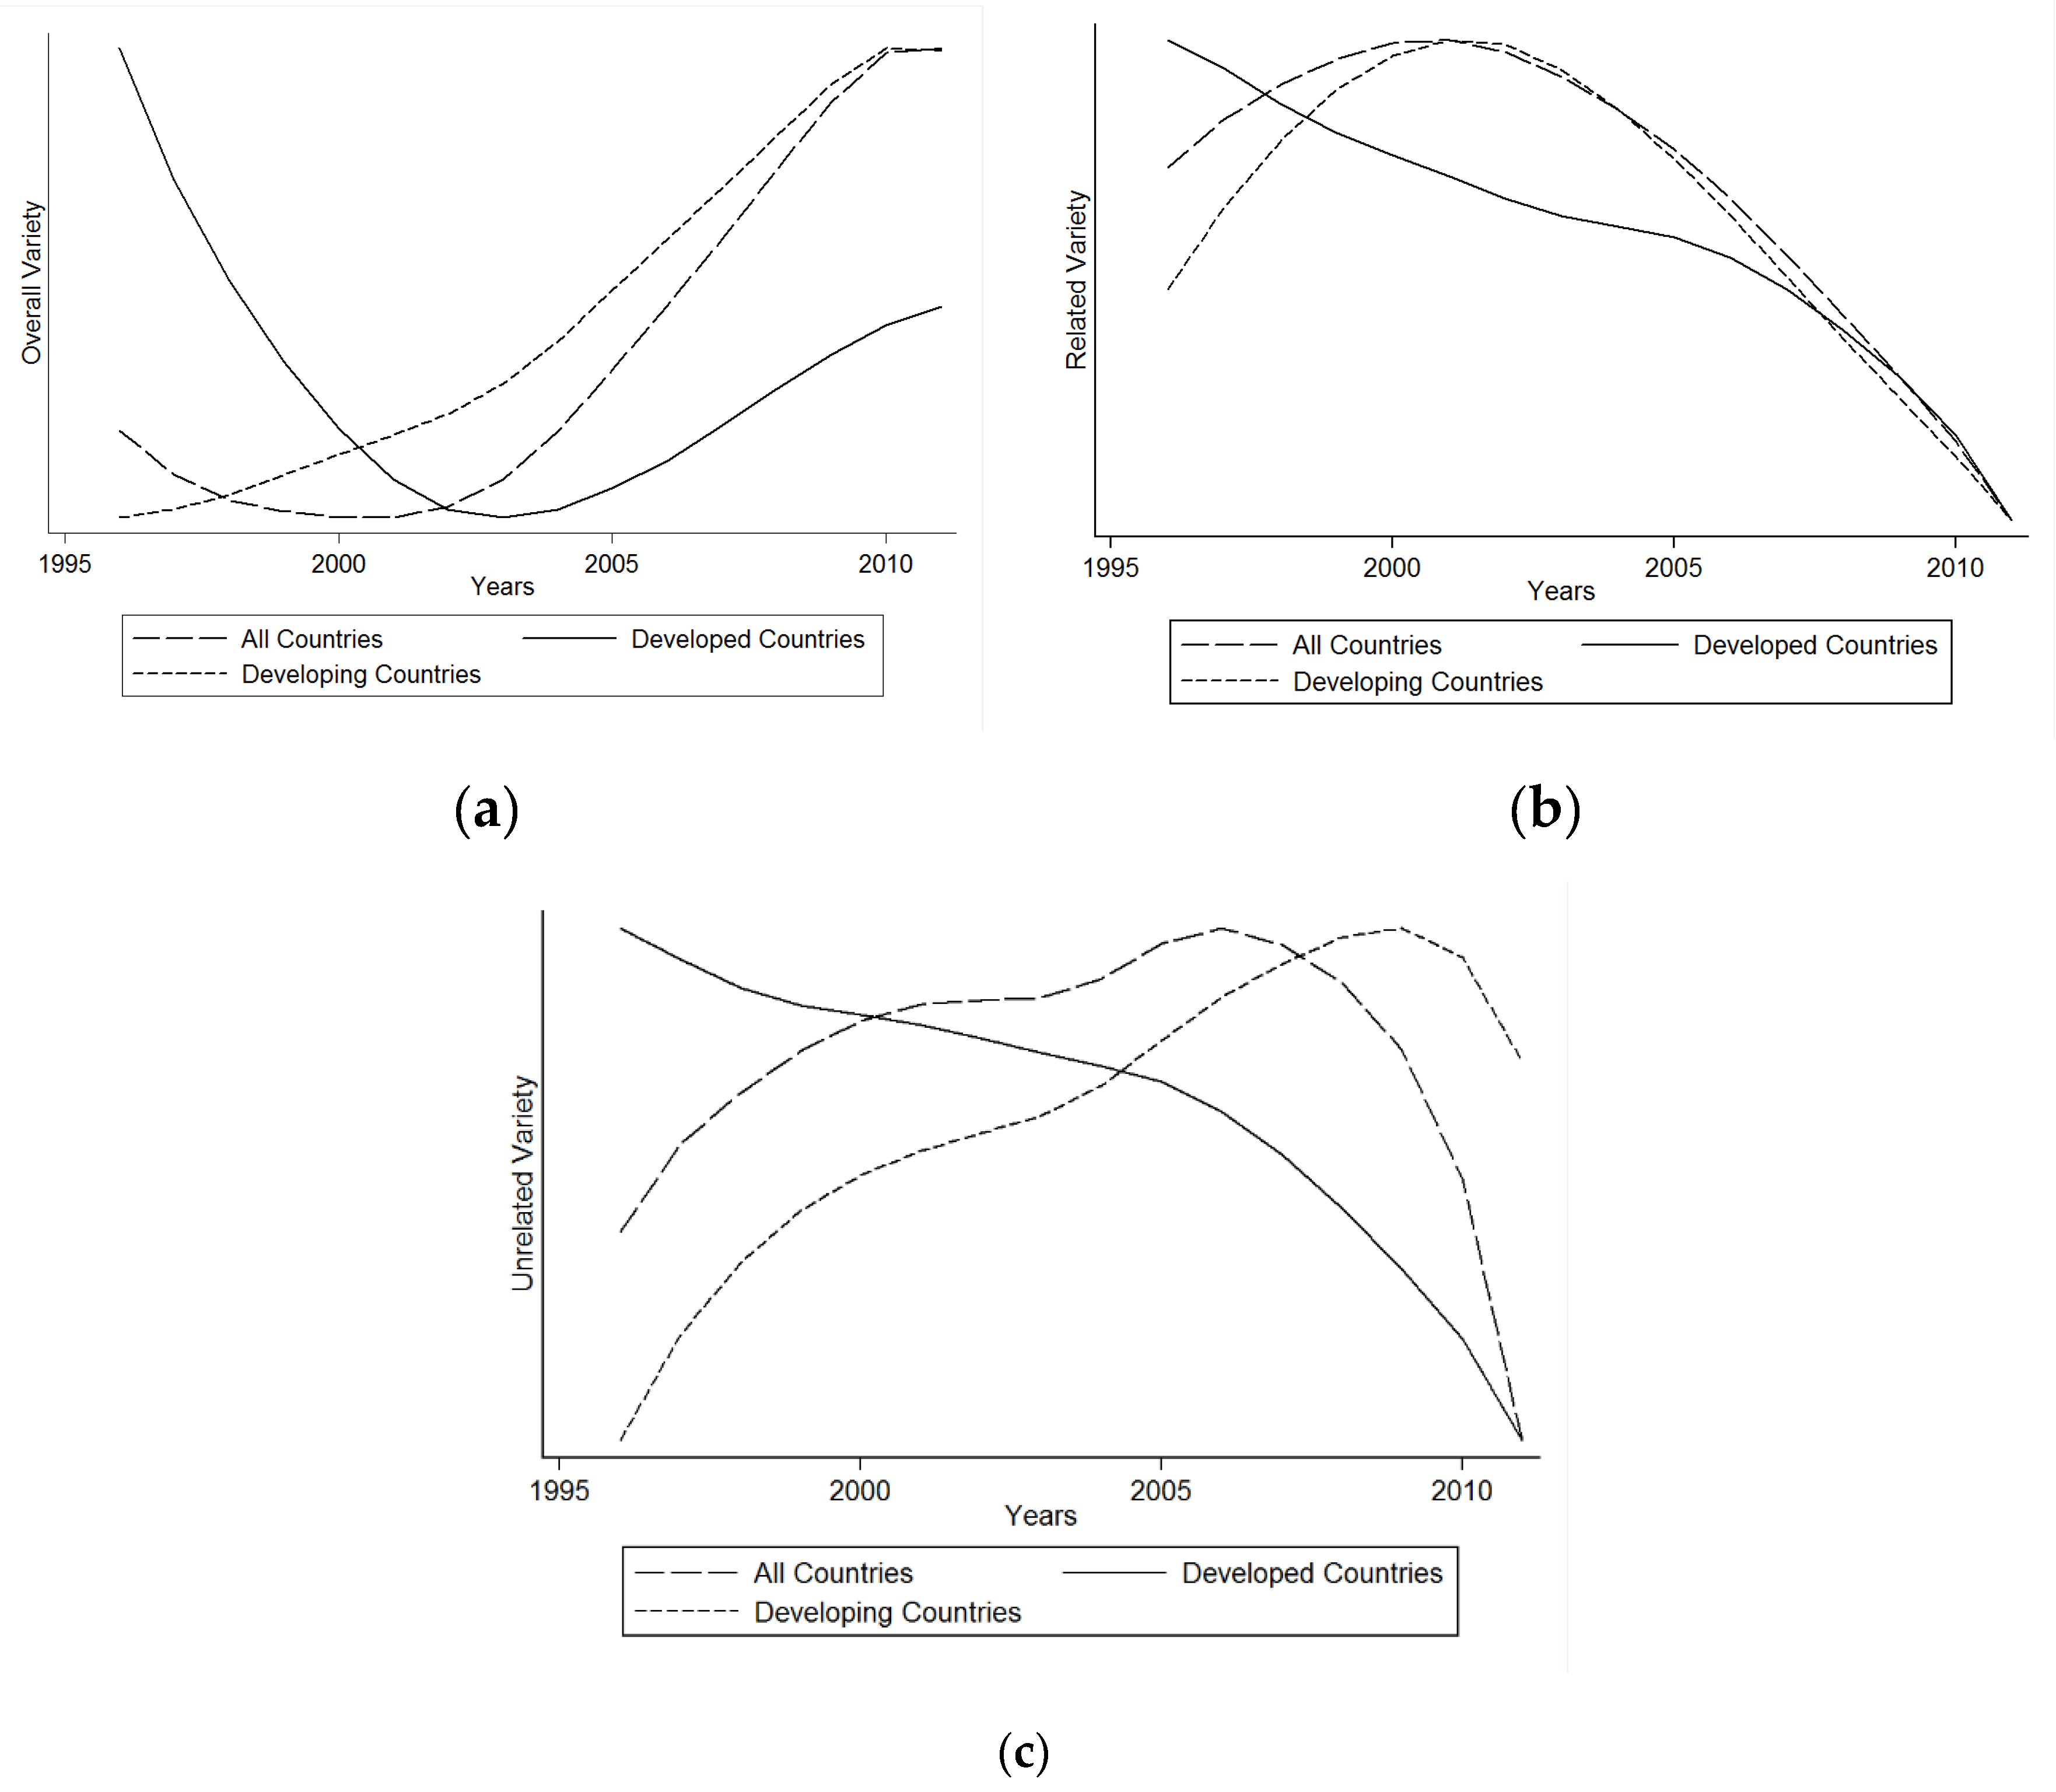
Figure 3.
Correlation of diversification indices with key determinants. (a) Foreign direct investment; (b) Human capital; (c) Trade openness; (d) GDP per capita. Source: Author’s elaboration. Lowess smoothing has been applied to the data series for better visualization.
Figure 3.
Correlation of diversification indices with key determinants. (a) Foreign direct investment; (b) Human capital; (c) Trade openness; (d) GDP per capita. Source: Author’s elaboration. Lowess smoothing has been applied to the data series for better visualization.

Figure 4.
Foreign direct investment (FDI) and unrelated variety (UV): Interaction with Human Capital.
Figure 4.
Foreign direct investment (FDI) and unrelated variety (UV): Interaction with Human Capital.

Figure 5.
Trade Openness and RV: Interaction with Human Capital.
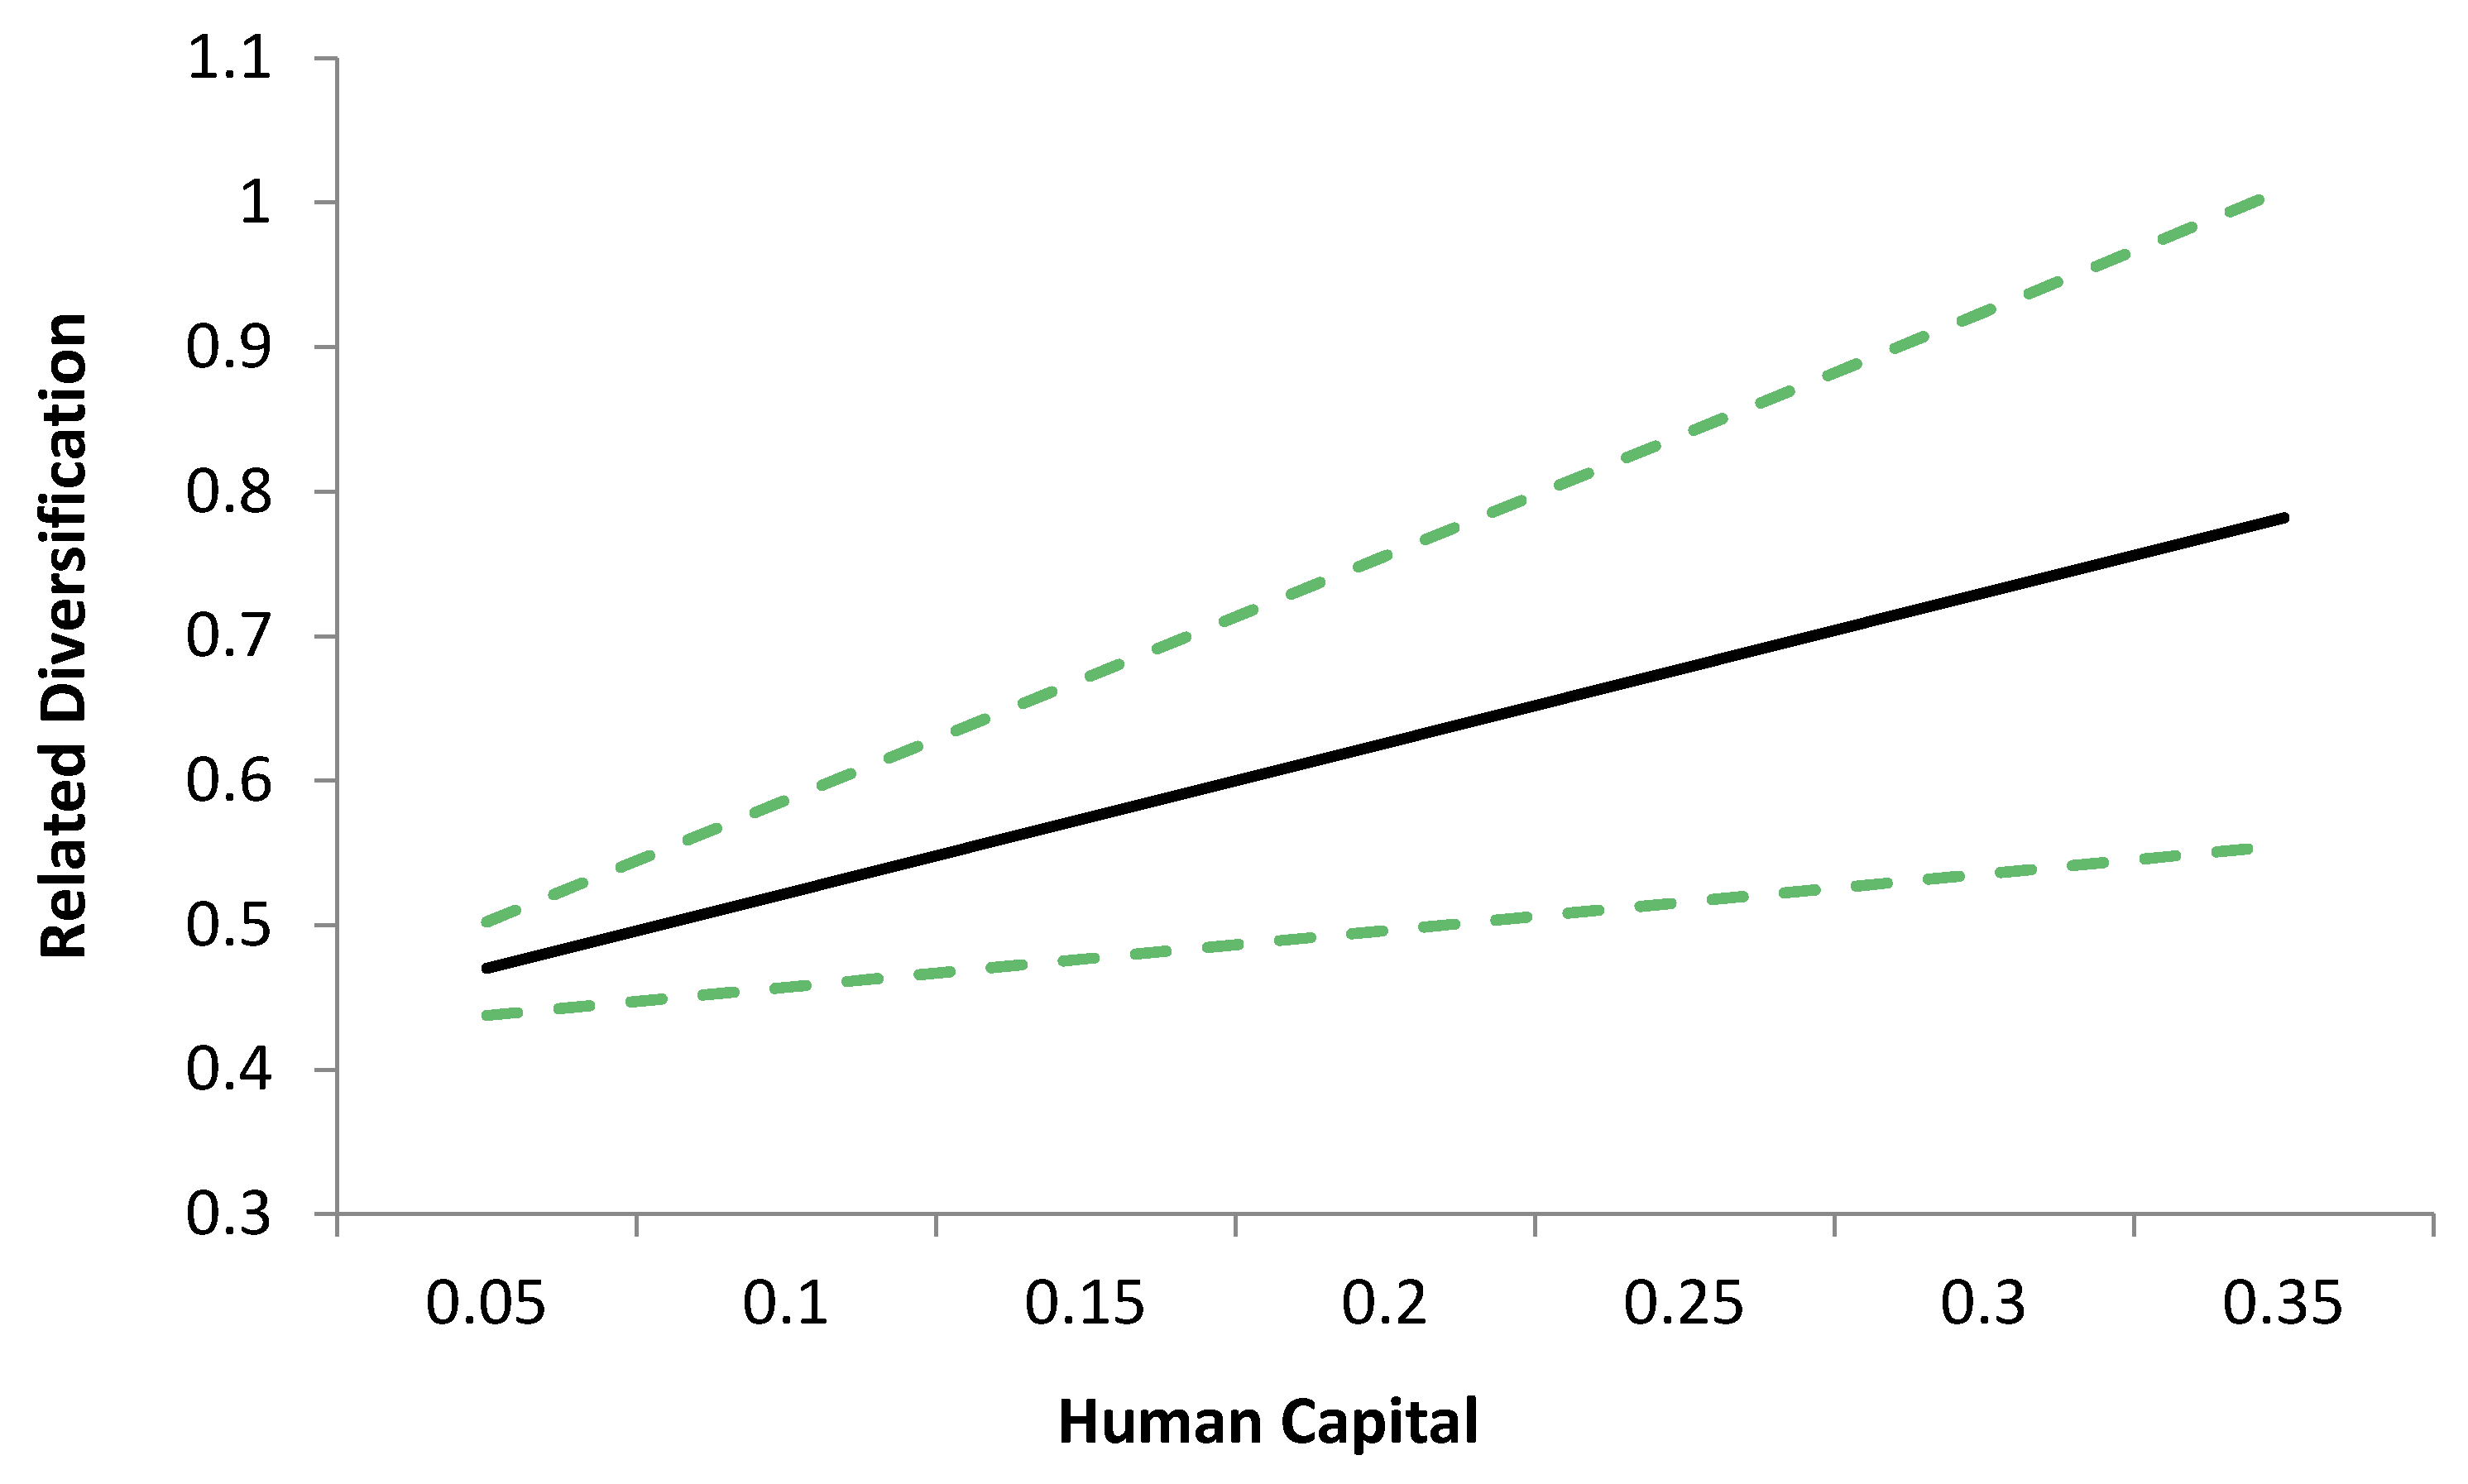
Table 1.
Examples of Two-digit and Three-digit sectors (SITC Rev.3).
| Trade Classification Code | Classification Description |
|---|---|
| 42 | Fixed vegetable fats and oils, crude, refined or fractionated |
| 421 | Fixed vegetable fats and oils, “soft” |
| 422 | Fixed vegetable fats and oils, other than “soft” |
| 78 | Road vehicles (including air-cushion vehicles) |
| 781 | Motor cars and other motor vehicles for transport of persons |
| 782 | Motor vehicles for the transport of goods |
| 783 | Road motor vehicles |
Table 2.
Estimation Results. Dependent variable: OV.
| (1) | (2) | (3) | (4) | (5) | |
|---|---|---|---|---|---|
| 0.611 *** | 0.364 *** | 0.364 *** | 0.371 *** | 0.370 *** | |
| (0.080) | (0.115) | (0.116) | (0.130) | (0.112) | |
| 0.034 ** | 0.076 *** | 0.076 *** | 0.075 *** | 0.074 *** | |
| (0.013) | (0.024) | (0.022) | (0.025) | (0.021) | |
| −0.001 | −0.014 | −0.014 | −0.012 | −0.014 | |
| (0.030) | (068) | (0.068) | (0.083) | (0.074) | |
| 0.042 | 0.204 ** | 0.214 ** | 0.206* | 0.208 * | |
| (0.094) | (0.100) | (0.103) | (0.113) | (0.125) | |
| 0.174 | 0.255 | 0.173 | 0.181 | 0.191 | |
| (0.201) | (0.324) | (0.371) | (0.287) | (0.415) | |
| −0.007 | −0.015 | −0.018 | −0.016 | −0.020 | |
| (0.007) | (0.019) | (0.018) | (0.020) | (0.020) | |
| 0.012 | 0.010 | 0.015 | −0.001 | ||
| (0.058) | (0.045) | (0.045) | (0.058) | ||
| −0.143 | −0.078 | −0.112 | |||
| .265) | (1.815) | (1.499) | |||
| −0.004 | |||||
| (0.071) | |||||
| 0.141 | |||||
| (0.449) | |||||
| Year Dummies | Yes | Yes | Yes | Yes | Yes |
| Country Dummies | Yes | Yes | Yes | Yes | Yes |
| Constant | 0.382 | 0.723 | 0.745 | 0.710 | 0.733 |
| (0.331) | (0.573) | (0.562) | (0.715) | (0.612) | |
| AR(1): p-value | 0.0171 | 0.0366 | 0.0370 | 0.0429 | 0.0336 |
| AR(2): p-value | 0.131 | 0.180 | 0.181 | 0.193 | 0.177 |
| Hansen Stat: p-value | 0.287 | 0.170 | 0.135 | 0.281 | 0.308 |
| No. of instruments | 75 | 57 | 58 | 73 | 64 |
| No. of countries | 130 | 130 | 130 | 130 | 130 |
| No. of observations | 1526 | 1335 | 1335 | 1335 | 1335 |
| VIF | 1.90 | 1.97 | 1.97 | - | - |
Standard errors in parentheses * p < 0.10, ** p < 0.05, *** p < 0.01.
Table 3.
Estimation Results. Dependent variable: RV.
| (1) | (2) | (3) | (4) | (5) | |
|---|---|---|---|---|---|
| 0.865 *** | 0.826 *** | 0.803 *** | 0.791 *** | 0.819 *** | |
| (0.060) | (0.075) | (0.081) | (0.085) | (0.080) | |
| 0.051 * | 0.0586 * | 0.059 * | 0.068 * | 0.086 ** | |
| (0.027) | (0.032) | (0.035) | (0.036) | (0.037) | |
| −0.255 ** | −0.241 * | −0.283 ** | −0.357 ** | −0.238 * | |
| (0.102) | (0.131) | (0.138) | (0.162) | (0.133) | |
| 0.190 | 0.344 ** | 0.308 * | 0.324 * | 0.418 ** | |
| (0.154) | (0.166) | (0.183) | (0.187) | (0.167) | |
| 1.045 * | 1.188 | 1.230 | 1.569 ** | 1.190 | |
| (0.569) | (0.739) | (0.750) | (0.743) | (0.731) | |
| −0.066 *** | −0.089 *** | −0.093 *** | −0.097 ** | −0.082 ** | |
| (0.025) | (0.032) | (0.032) | (0.040) | (0.031) | |
| −0.172 ** | −0.189 ** | −0.133 * | −0.161 ** | ||
| (0.074) | (0.080) | (0.068) | (0.062) | ||
| −4.717 * | −5.172 * | −3.051 | |||
| (2.416) | (3.076) | (2.210) | |||
| 0.426 *** | |||||
| (0.141) | |||||
| 1.040 *** | |||||
| (0.328) | |||||
| Year Dummies | Yes | Yes | Yes | Yes | Yes |
| Country Dummies | Yes | Yes | Yes | Yes | Yes |
| Constant | 2.127 ** | 1.999 * | 2.491 * | 3.063 ** | 1.938 |
| (0.888) | (1.143) | (1.260) | (1.503) | (1.198) | |
| AR(1): p-value | 0.0000745 | 0.0000740 | 0.0000643 | 0.0000882 | 0.0000880 |
| AR(2): p-value | 0.294 | 0.344 | 0.354 | 0.438 | 0.289 |
| Hansen Stat: p-value | 0.175 | 0.182 | 0.231 | 0.254 | 0.210 |
| No. of instruments | 64 | 79 | 80 | 95 | 83 |
| No. of countries | 130 | 130 | 130 | 130 | 130 |
| No. of observations | 1526 | 1521 | 1521 | 1521 | 1521 |
| VIF | 1.93 | 1.97 | 1.97 | - | - |
Standard errors in parentheses * p < 0.10, ** p < 0.05, *** p < 0.01.
Table 4.
Estimation Results. Dependent variable: UV.
| (1) | (2) | (3) | (4) | (5) | |
|---|---|---|---|---|---|
| 0.823 *** | 0.902 *** | 0.889 *** | 0.850 *** | 0.885 *** | |
| (0.065) | (0.066) | (0.068) | (0.089) | (0.070) | |
| 0.045 ** | 0.034 * | 0.033 * | 0.044 * | 0.039 * | |
| (0.019) | (0.018) | (0.019) | (0.024) | (0.020) | |
| −0.153 *** | −0.107 * | −0.126 ** | −0.189 ** | −0.125 * | |
| (0.058) | (0.054) | (0.057) | (0.092) | (0.065) | |
| 0.214 ** | 0.204 ** | 0.185 ** | 0.249 ** | 0.208 ** | |
| (0.096) | (0.080) | (0.083) | (0.113) | (0.094) | |
| 0.587 | 0.382 | 0.410 | 0.719 * | 0.434 | |
| (0.367) | (0.320) | (0.326) | (0.412) | (0.348) | |
| −0.046 *** | −0.032 ** | −0.034 ** | −0.046 ** | −0.035 ** | |
| (0.016) | (0.014) | (0.014) | (0.021) | (0.015) | |
| −0.016 | −0.024 | −0.029 | −0.021 | ||
| (0.030) | (0.031) | (0.040) | (0.033) | ||
| −2.016 * | −2.679 | −1.839 | |||
| (1.214) | (1.902) | (1.259) | |||
| 0.235 *** | |||||
| (0.076) | |||||
| 0.245 | |||||
| (0.188) | |||||
| Year Dummies | Yes | Yes | Yes | Yes | Yes |
| Country Dummies | Yes | Yes | Yes | Yes | Yes |
| Constant | 1.428 ** | 0.970 * | 1.213 ** | 1.763 * | 1.176 * |
| (0.548) | (0.516) | (0.572) | (0.920) | (0.645) | |
| AR(1): p-value | 0.000144 | 0.0000942 | 0.0000917 | 0.0000694 | 0.0000953 |
| AR(2): p-value | 0.245 | 0.280 | 0.285 | 0.345 | 0.277 |
| Hansen Stat: p-value | 0.220 | 0.126 | 0.127 | 0.164 | 0.176 |
| No. of instruments | 75 | 57 | 58 | 62 | 73 |
| No. of countries | 130 | 130 | 130 | 130 | 130 |
| No. of observations | 1526 | 1521 | 1521 | 1521 | 1521 |
| VIF | 1.93 | 2.00 | 2.00 | - | - |
Standard errors in parentheses * p < 0.10, ** p < 0.05, *** p < 0.01.
© 2017 by the author. Licensee MDPI, Basel, Switzerland. This article is an open access article distributed under the terms and conditions of the Creative Commons Attribution (CC BY) license (http://creativecommons.org/licenses/by/4.0/).
Share and Cite
MDPI and ACS Style
Ali, M. Determinants of Related and Unrelated Export Diversification. Economies 2017, 5, 50. https://doi.org/10.3390/economies5040050
AMA Style
Ali M. Determinants of Related and Unrelated Export Diversification. Economies. 2017; 5(4):50. https://doi.org/10.3390/economies5040050
Chicago/Turabian StyleAli, Muhammad. 2017. "Determinants of Related and Unrelated Export Diversification" Economies 5, no. 4: 50. https://doi.org/10.3390/economies5040050
Note that from the first issue of 2016, this journal uses article numbers instead of page numbers. See further details here.