Human Capital, Social Capabilities and Economic Growth †


1
The World Bank, Islamabad, Pakistan
2
Science Policy and Innovation Studies, National Centre for Technology Management, Ile-Ife 220005, Nigeria
3
Applied Economics Research Center, University of Karachi, Karachi 75270, Pakistan
*
Author to whom correspondence should be addressed.
†
This paper is an extended version of our paper published in 30th Annual General Meeting, Pakistan Institute of Development Economics, Islamabad, Pakistan and Working paper no. 2016-013 in Jena Economic Research Papers, University of Jena, Jena, Germany.
Economies 2018, 6(1), 2; https://doi.org/10.3390/economies6010002
Submission received: 29 September 2017
/
Revised: 21 December 2017
/
Accepted: 25 December 2017
/
Published: 2 January 2018
(This article belongs to the Special Issue The Role of Education and Health in Economic Development)
Abstract
:Theoretically, human capital is conclusively believed to be positively related with economic growth. While empirically, the said relationship does not always hold for several reasons. Thus, the current paper presents new results on a set of conditions under which human capital is robustly and positively associated with economic growth. Using data for 132 countries over 15 years, the empirical results reveal that human capital plays a positive role in per capita GDP growth only in the presence of better economic opportunities and high-quality legal institutions. In fact, economic opportunities reinforce the effect of human capital on growth: the easier it is to do business and trade domestically or internationally, the stronger the effect of human capital on growth. In conclusion, the findings suggest that inconclusive results in previous empirical studies on human capital and growth might be due to omitted variable bias as these studies do not include variables related to social capabilities.
JEL Classification:
O15; O41. Introduction
This paper contributes to the literature on the role of human capital in economic growth by highlighting the importance of variables related to social capabilities in the growth equations. The relationship between human capital and growth has been repeatedly studied both theoretically and empirically since endogenous growth theory became popular (Aghion and Howitt 1992; Arrow 1962; Benhabib and Spiegel 1994; Romer 1986). Theoretical formulations of the relationship between human capital and growth consistently predict that knowledge embodied in humans is important for innovation, productivity and growth. However, this relationship does not always hold when assessed empirically. Thus, the empirical studies on the subject do not provide conclusive evidence. For instance, Benhabib and Spiegel (1994) show that the current level of human capital in an economy has a positive relationship with per capita income, but growth in the level of human capital does not have a significant impact on growth in per capita income. It is, in fact, the level of human capital that has been shown to have a significant positive relationship with economic growth (Cohen and Soto 2007). Apparently, specification of the human capital variable matters.
Several possible reasons have been adduced for the inconclusiveness of empirical results on the link between human capital and economic growth. Sunde and Vischer (2015) argue that inconsistencies in specification of empirical models could be the cause of empirical irregularity. They show that traditional econometric models provide better results when the initial level of human capital is included in the regressions. This implies that empirical specifications need to include other channels through which human capital can affect economic growth. The most prominent suspects are socio-economic and institutional indicators—particularly the factors that affect human capital accumulation and quality—which could strengthen or weaken the relationship between human capital and growth. Hanushek and Kimko (2000) suggest that it is important to consider the quality of education. Further along this line, Becker (1994) highlights the importance of factors such as inflation, health and opportunity costs of investments as modifiers of the contribution of human capital to the economy.
Becker’s idea corresponds to the “social capability” concept of Abramovitz (1986). Abramovitz emphasized the importance of social capabilities in the adoption and diffusion of technologies. He further argued that the extent to which human capital contributes to economic growth will be at least partly dependent on a country’s social capabilities. Social capabilities include factors that allow economic agents to utilize their potential such as the quality of institutions, as reflected in the quality of governance, for instance. In other words, for technologically lagging countries to catch up with leaders, they need not only human capital, but also well-functioning institutions (Olofsdotter 1998). A related concept to social capabilities is the concept of human capabilities. In his seminal contribution, Sen (1983) argued that improvement in the quality of life of citizens should be the objective of economic policy, instead of focusing narrowly on increasing overall output. This approach suggests that human and productive capabilities should be improved to facilitate human capital, and that a higher level of human capital can only affect productivity if it is efficiently utilized by the economic system.
In light of the foregoing, this paper re-examines the relationship between human capital and growth with the aim to shed some light on the reasons behind inconclusive findings in the literature. The study uses data on 132 countries for the period 1996 to 2011 to achieve three objectives. First, we replicate the established results in the literature by applying cross-sectional methodology on the selected dataset. Then, we test whether these results hold when panel data methods are applied to the same econometric models. Third, we test the role of two variables related to social capabilities—“economic opportunities” and “legal systems and property rights”—to assess their role in the relationship between human capital and growth. Zhu and Li (2017) have earlier performed an analysis similar to ours, by looking at the interaction effect of economic complexity and human capital on economic growth. The contributions of our paper differ from, and at the same time build upon, this earlier work. First, we find that significance of human capital disappears when panel data methods are applied to the econometric models of human capital and growth. However, when variables related to social capabilities are included in the growth models, the level of human capital becomes highly significant. This further extends the endogenous growth literature by highlighting the importance of incorporating different channels, particularly social capabilities, through which human capital can affect economic growth. In addition, the results of the current study also illustrate that economic opportunities significantly moderate the relationship between human capital and growth. To the best of our knowledge, no previous study has considered the interaction effect of social capabilities and human capital on economic growth.
The next section presents a short background on the relationship between human capital and growth. Following this, Section 3 discusses conditionalities associated with the relationship between human capital and growth. Data is described in Section 4, the empirical models and estimation method are specified in Section 5 and the results are discussed in Section 6. The paper concludes in Section 7.
2. Human Capital and Economic Growth
Human capital was originally defined as ‘[…] knowledge, skills, attitudes, aptitudes, and other acquired traits contributing to production’ (Goode 1959). This definition is broader than just educational attainment, as it includes any productive skills or capabilities of individuals, not just those that are formally taught. In other words, human capital encompasses all forms of investments made to improve human skills, including schooling, informal education, on-the-job training, and learning by doing. It also includes other factors that facilitate the productive use of human skills, such as health. Other than formal education, nearly all of the components of human capital discussed above are very difficult to measure. Therefore, most studies linking human capital to economic growth have been restricted to studying the impact of formal education. This methodological choice is bolstered by the common understanding that education is an important ingredient in sustainable economic growth, and that better education ensures smooth economic growth over time (Barro 1991; Lucas 1988). For simplicity, in the present paper, we use the very generic conceptualization of human capital offered by Becker (1994), who referred to it as the ‘resources found in people’. These resources would typically include knowledge, skills, competences, and other attributes embodied in humans that are relevant to economic activity.
In the field of economics, knowledge is considered as a set of skills and abilities that can be used to produce new goods. In the literature on endogenous growth, knowledge embodied in humans is termed as human capital. This literature highlights the importance of knowledge for economic growth at the country level, postulating that human capital explains most of the variation in growth across countries. As a result, knowledge, in the form of education and productive capabilities, is brought to the centre of discussions on drivers of growth. The general conclusion is that human capital is a very important, if not the most important, potential source of growth (Aghion and Howitt 1992; Arrow 1962; Mankiw et al. 1992; Romer 1986, 1990). It is believed that the abilities of people shape the structure and evolution of the economy. Knowledge accumulation and recombination bring new ideas and improve both productivity and the quality of products. In a broader macroeconomic sense, higher human capital also encourages entrepreneurship and innovation, which lead to higher growth rates (Dakhli and Clercq 2004).
However, this literature assumes homogeneity of institutional and socio-economic settings across national boundaries. In reality, countries are heterogeneous in many ways, with different laws, institutes, types of government, and policies that could affect the relationship between human capital and growth (Robeyns 2006). Therefore, the strength of the relationship between human capital and growth will differ across countries, creating a need to identify the institutional and socio-economic factors that weaken or strengthen the relationship between human capital and growth. For instance, strong regulatory institutions are expected to lead to the enforcement of labor laws related to fair wages and transparent hiring and firing procedures, creating a suitable working environment for the qualified labor force. Moreover, countries with high levels of corruption are generally characterized as lacking equitable rights, and this leads to sub-optimal utilization of human capital. This in turn weakens the relationship between human capital and growth. Finally, a country with favorable entrepreneurial policies is more likely to attract and retain qualified individuals who seek to start their own businesses. A lack of opportunities in this sense makes it difficult for entrepreneurs to form start-ups, thereby under-utilizing the potential of the qualified labor force. In the next section, we elaborate on some institutional and socio-economic factors that condition the effect of human capital on economic growth at the national level.
3. Conditionalities Associated with the Human Capital and Growth Nexus
Several previous studies have examined the question of how the human capital-growth relationship fares in the presence or absence of some other macro economic variables. Sunde and Vischer (2015), for example, explored the reasons behind the weak empirical effect of human capital on growth in existing cross-country studies. They elaborated on the standard neoclassical growth model, which does not account for the important variables through which human capital affects growth. Using three different datasets for average years of schooling of more than 80 countries, their study identified two distinct channels through which human capital affects growth: changes in human capital and initial levels of human capital. Their results suggested that the effect of human capital is likely to be underestimated and biased in empirical specifications that do not account for both channels. On the basis of these findings, they argued that the weak growth effects found in previous studies were due to heterogeneity in the cross-country data, as well as due to measurement issues.
Elias and Fernandez (2000) emphasized the role of human capital and income levels in sustained growth in Latin American countries. Education indicators—school enrollment ratios—were used as a proxy for human capital. Their results revealed that the countries that invested more in primary education in 1965 had a tendency to grow more; however, neither secondary nor high school spending had a significant relationship with growth until a variable representing life expectancy is included in the model. Thus, accumulating higher levels of human capital improves growth only when a country has high life expectancy, which ensures that highly qualified individuals contribute to the economy long enough to make a measurable impact.
The quality of the educational system has also been shown to be a facilitating characteristic for the effect of human capital on growth. For instance, Dessus (1999) used panel data of 83 countries to demonstrate that differences in the quality composition of human capital across nations must be taken into account when analyzing the effect of human capital on growth. Ignoring such differences creates a significant estimation bias. The result of such bias is that human capital is presented as a negative contributor to growth models (as reported by Islam (1995) for example). After correcting for such bias, Dessus found a positive effect of human capital on growth. Additionally, using a varying parameter method, Dessus traced the heterogeneity among countries to the differences in the quality of their human capital—in particular, to the difference of the education infrastructure and the initial endowment in human capital. He found that such differences affect the quality of human capital, as well as the capacity of the education system to equitably distribute educational services. Similarly, Banerjee (2012) used data of 55 countries for the period from 1980 to 2007 to show that the quality of human capital is important for growth. He argues that the stock of human capital affects economic growth through its effect on capital productivity, as well as through technological diffusion. He makes this assertion based on his finding that while the stock of persons with tertiary education is not a significant determinant of growth, the stock of persons with secondary and primary education is important. Consequently, although basic education may not be sufficient to ensure a high degree of research and development (R&D), it is necessary to allow the population to absorb existing technologies, and its quality therefore plays a key role in conditioning the effect of human capital on growth. Moreover, Gemmell (1996), showed that a country’s level of development significantly determines its human capital needs: primary education is most important in least-developed countries (LDCs), secondary education in intermediate countries, and tertiary education in OECD countries.
Most cross-country analyses have assumed that countries follow a common, balanced growth path, but this assumption has been met with widespread criticism. The findings of a series of multi-country analyses by Sunde and Vischer (2015) offered strong evidence contradicting the assumption of a balanced growth path. Once the balanced growth path assumption is removed, human capital as a production factor or an innovation input no longer directly influences growth. The effect of human capital on growth is conditioned by living conditions: when living conditions are favorable, the contribution of human capital to growth is amplified. In Owen et al. (2009) analyses of a sample of developed and developing countries, it was shown that countries do not necessarily follow similar growth paths; rather, countries can be sorted into categories, each with its own unique growth processes. Two of the largest sources of heterogeneity in this respect are economic complexity and the quality of institutions. The moderating effect of economic complexity on the contribution of human to economic growth was recently examined by Zhu and Li (2017). They find a positive interaction effect, suggesting that economic complexity reinforces the effect of human capital on growth.
The quality of institutions within a country influences the growth environment and affects the growth process by determining the effects of the usual factors of production, including human capital accumulation. For instance, Farida and Ahmadi-Esfahani (2008) provided empirical evidence regarding the impact of corruption on human capital productivity and growth in Lebanon. Their analysis extends the Solow growth model by including corruption as an additional determinant. Not only did the corruption variable have a significant coefficient in the extended model, the other growth determinants had smaller coefficients than in the absence of the corruption variable. This result indicates that corruption leads to inefficiency in the economy by lowering investment, reducing the effectiveness of government expenditure and undermining the productivity of human capital. In the absence of adequate demand for a qualified labor force, skilled individuals either settle for a much less productive job or they emigrate. This is consistent with the findings of Fan and Stark (2007) that international migration from developing countries is largely due to the lack of adequate demand for qualified individuals, which creates unemployment among educated persons.
In addition to the role of quality of institutions, the literature also highlights the importance of economic opportunities in the relationship between human capital and growth. The main argument here is that increasing human capital is not enough if productive capabilities are not also increased (Ranis et al. 2000). Particularly, facilitating new business formation is of prime importance as new businesses create demand for both skilled and unskilled labor. Abramovitz’s (1986) concept of social capabilities highlights the importance of ability to absorb new technology, attract capital and participate in global markets in the catching-up process. The concept of social capabilities goes beyond human capital and includes dimensions related to economic opportunities among the determinants of catching up. On similar grounds, Sen (1983) introduced the concept of human capabilities in welfare economics. The concept accentuates the relevance of human freedom to choose, of factors that affect the happiness of individuals, and of the distribution of economic opportunities in the society.
In light of this, it becomes clear that analyses of growth goes beyond simple inputs into production function, but also involves the aspect of economic opportunities, which define the freedom that people have to deploy their skills and capabilities in an economy. In particular, the efficient utilization of resources requires sound institutional policies that protect the basic rights of individuals and provide fair and equal opportunities to all economic agents. In the presence of corruption and low regulatory quality, the legitimacy of such institutions becomes questionable as they fail to perform their functions efficiently (IMF 2002). Under these conditions, the educated labor force will contribute less than its potential to economic growth; some individuals will emigrate, while those who stay will not be able to perform as efficiently as they would have under a system with high-quality institutions. For this reason, human capital tends to contribute more strongly to economic growth in countries with high levels of economic opportunities.
Inspired by the discussion above, in this study, we re-examine the relationship between human capital and growth. First, we replicate the traditional models of Benhabib and Spiegel (1994) (henceforth, BS) and Cohen and Soto (2007) (henceforth, CS) in the cross-sectional settings. Second, we extend these models using panel data approach in order to test for the robustness of these results to change in methodology. Third, we include factors related to economic opportunities and quality of legal institutions in the framework of human capital and growth. Finally, we test for the moderating role of economic opportunities and quality of legal institutions in the relationship between human capital and growth. Although it is well known that human capital, institutions and economic opportunities directly affect economic growth independently, no empirical study has ever examined their interaction effects on growth.
4. Data and Variables
Our sample comprises 132 countries from 1996 to 2011. We use data from Penn World Tables v8.0, World Development Indicators (WDI) of the World Bank, and Economic Freedom Dataset of the Fraser Institute (Gwartney et al. 2014). A description of the variables drawn from each data source is provided in the following paragraphs. Descriptive statistics and correlation matrices are provided in Appendix A Table A1, Table A2, Table A3, Table A4 and Table A5.
The dependent variable in this study is growth of GDP per capita. Data for GDP per capita is taken at current purchasing power parity (PPP) from World Development Indicators. Data on physical capital (K) is also taken at current PPP, while L is the share of employed population in a country in a given year. Both K and L are taken from Penn World Tables v8.0. The human capital index is also taken from Penn World Tables v8.0. This index is based on average years of schooling (according to (Barro and Lee 2013)) and the rate of return (according to (Psacharopoulos 1994)). Recent literature argues that human capital indicators based on average years of schooling do not provide an accurate estimate of the quality of a country’s education system (Ali et al. 2016; Hanushek and Kimko 2000). However, indicators proposed for quality adjustment of human capital are not available for long-term periods. Moreover, using a human capital variable based on average years of schooling allows for the comparison of results with previous established studies. Therefore, we use human capital index based on average years of schooling for our analysis.
In order to add a component of social capabilities to our growth regressions, we use two proxies: economic opportunities and legal system and property rights. Both of these indices are components of the Economic Freedom Index (EFI). The EFI has been developed by The Economic Freedom of the World project of The Fraser Institute (Gwartney et al. 2014). The score on this index ranges from 0 to 10, where 0 represents the least amount of freedom and 10 represents the highest level of freedom. This index has been used in previous studies for similar types of economic analysis, in which the authors aimed to test for the moderating role of economic freedom on the main variables of interest (see, for example, (Alguacil et al. 2011)). Legal system and property rights is component number 2 in the EFI. It comprises factors related to quality of legal institutions. Our measure of economic opportunities is the average of the fourth and fifth components of the Economic Freedom Index, namely “Freedom to trade internationally” and “Regulation”. Both of these indices cover the factors that affect the abilities, apart from human capital, to engage effectively in economic activities. The list of subcomponents of these indices is presented in Appendix A Table A6.
5. Empirical Specification and Estimation Approach
5.1. Econometric Model
Similar to the framework of Benhabib and Spiegel (1994), our econometric specification is based on a Cobb–Douglas-type production function that takes the following form:
where y is per capita GDP at current purchasing power parity (PPP), K is the stock of physical capital at current purchasing power parity (PPP), L is the employed labor force, A is the technological progress, H is the human capital and is the residual. Taking log differences on both sides of Equation (1) gives us our main econometric model shown in Equation (2):
Lagged endogenous independent variables are frequently used in the literature to account for potential simultaneity bias. Moreover, since qualifications and experience are only reflected in the output after a time lag, we use one period lag of the human capital variable as well as other covariates. Notice that here we arrive at the econometric model with human capital in changes, which is also the first base model in BS. However, we know from later studies that the effect of change in human capital on economic growth is generally found to be insignificant and that the current level (or both difference and level) of human capital better explains the relationship between human capital and economic growth. Following this tradition, we include the human capital variable in level form, lagged over period. The resulting specification is shown in Equation (3):
where represents time dummies and represents country dummies.
In the first extension of the model, we introduce the variables on social capabilities, namely Economic Opportunities (EO) and quality of Legal Institutions and Property Rights (LP). This gives us the model specified in Equation (4):
As a second extension, we test for the moderating role of EO and LP in the relationship between human capital and growth (Equation (5)):
In all the specifications presented above, the EO and LP variables are in absolute form. In a cross-country analysis, relative standing of a country might be more important than the absolute one especially when the variables are not changing rapidly over time. Keeping this in view, we performed an additional set of estimations replacing absolute EO and LP variables with their relative versions. In particular, the relative versions of the variables capture the distance of a country from the frontier in a given year, taking the value of 0 for the frontier itself. Formally:
where X represents either of and . Subscript i represents the value of variable X for country i at a given time t and represents the country with the maximum value of the variable X at time t. The resulting variables, and , also serve to illustrate how a country’s relative level of social capabilities could affect the role of human capital in its economic development.
5.2. Estimation Technique
A noticeable difference between our model and the previous ones in the literature is that it exploits the time dimension available in the dataset. Surprisingly, most studies in the literature suppress the time dimension and simply use cross-sectional datasets. However, this strategy can have serious demerits especially in the context of growth regressions. First, growth models such as the one used here have a strong component of convergence that is less likely to be captured in a cross-sectional setting (Islam 1995). Second, use of panel data allows for the control of country-specific effects that are crucial in a setting with a large number of heterogeneous countries. Notably, countries differ not only in terms of their stock of human capital or their level of income, they also differ with respect to their cultural settings, institutions and other socio-economic traits. Most of these are unobservable and are likely to bias the results if countries are assumed to be homogeneous.
Although some studies include country group dummies, either based on levels of per capita income or geographical locations, they still do not capture the country level heterogeneity present in cross country analysis. We, therefore, rely on panel data for our analyses. Doing so not only allows us to test for the robustness of the previous findings in the literature when the time dimension is introduced in the analysis, but also enables us to use a significantly larger number of observations. The most common estimation methods for panel data are Fixed Effects (FE) models, Random Effects (RE) models and Generalized Method of Moments (GMM). Compared to FE and RE models, GMM offers various attractive features such as unbiased dynamic panel data modelling and correction for endogeneity. However, GMM is most efficient when there is high persistence in the data (Soto 2009). Our preliminary analysis finds no evidence of persistence over time. This compels us to use the fixed effects model. Robust standard errors are reported to account for the heteroskedascity while Variance Inflation Factors (VIF) are reported under the tables to show that there is no problem of multicollinearity with the models.
6. Results and Discussion
Since we employ a different estimation methodology from a traditional model, we begin with a comparison of our results with traditional results in the literature. Our basic specification is similar to the one used by Benhabib and Spiegel (1994). We suppressed the time dimension and used one observation per country to estimate a simple cross-sectional OLS regression. The results are reported in models 1, 2 and 3 of Table 1. An alternative model provided by Cohen and Soto (2007) is also estimated to test for robustness (models 4, 5 and 6 in Table 1). It involves excluding the labor variable from the original estimations.
The first noticeable result in Table 1 is the negative and significant sign of the labor variable—which is insignificant in the BS study—in model 1. The significance disappears when the human capital variable enters the specification in level form in both models 2 and 3. This result corresponds to the findings of Sunde and Vischer (2015) (henceforth, SV) where they argue for the inclusion of both channels of human capital in human capital-growth regressions. The negative effect of labor could be the result of structural change in some economies moving from labor-intensive technologies to capital-intensive ones during the period of analysis. In this case, the sheer size of the labor force does not favor—and may be detrimental to—economic growth. Rather, it is the quality of the labor force (reflected in educational attainment) that matters. It should be noted, however, that misspecification of the model by omitting time- and country-specific effects could also cause labor to have a negative co-efficient.
The change in level of human capital is insignificant and even has a negative effect in model 1, corresponding to the results of BS. A similar result is found in model 4, which excludes the labor variable as in CS. On the contrary, the initial level of human capital shows a positive and significant effect whether in the presence or absence of the labor variable (models 2 and 5, respectively). It is also positive and significant when included together with change in human capital, which remains insignificant (models 3 and 6). Here, the insignificance of the change variable contradicts the findings of SV who showed that when both formulations of human capital are included in the regression, they have positive and significant effects. The important take-away from the results in Table 1 is that initial levels of human capital should always be considered in the analysis of the link between human capital and economic growth.
After the cross-sectional estimations compared above with previous studies, we now turn to the panel data estimation of the same models (Table 2). The variables appearing in change form are annual first differences and the lags represent one year lags. Consistent with BS, change in human capital is insignificant in model 7. Both labor and physical capital are significant and positive while lagged income is negative and significant, lending some support to the convergence argument. The labor variable has a positive sign in model 7 in contrast to a negative sign in model 1. This indicates that when individual differences across countries and time periods are accounted for, the labor variable has the expected sign and is consistently significant (compare models 2 and 3 in Table 1 with models 7 to 11 in Table 2). In general, the results in model 7 suggest that, despite the significant differences in econometric settings, the results of BS are verified by our exercise.
Following SV, we estimated two more variations of the base model: in model 8, we include only the level of human capital and, in model 9, we include both the level and change of human capital. In both models, human capital, however measured, has insignificant coefficients. These results, especially the insignificance of the human capital variables in model 9, contradict the findings of SV who show that human capital has a significant and positive relationship with economic growth when both its level and change are concurrently taken into account. Thus, we find only partial support for the results of SV in our cross-sectional analysis and no support at all in our panel data analysis.
In an attempt to find explanations for these findings, one could take the exercise of SV a little further. Their exercise is grounded in the argument that traditional human capital models do not account for all the major channels through which human capital could influence economic growth. This is precisely how they interpret the significant coefficient of human capital when both its level and change are included in the model. Following the same line of argument, one could also think of channels, other than the current level of human capital, that could affect the relationship between human capital and growth. In this paper, we highlight institutional characteristics and economic opportunities. Our rationale is straightforward: the stock of knowledge in a given country has to be utilized efficiently for it to be able to contribute to economic growth. This is hard to achieve where institutions are weak and economic opportunities are rare. Human capital is expected to improve productivity, increase innovation and increase entrepreneurial activities. However, in the absence of sound economic, social and institutional environments, the human capital stock of a country will be underutilized. Quality of legal system and property rights, for example, are likely to facilitate hiring of labor on merit, and will also facilitate the entrepreneurial process by providing sound business environment to the economic agents.
Keeping this in view, we include “Economic opportunities” (EO) and “Legal system and property rights” (LP) in our specifications (model 10 in Table 2). Interestingly, initial level of human capital becomes significant after the inclusion of these variables while growth of human capital is still found to be insignificant. This result holds when both variants of human capital enter our specification together or separately. The change in significance of the level of human capital shows that econometric specifications that aim to model the relationship between human capital and economic growth should account for country-specific characteristics related to economic and business environment, in addition to previous levels of human capital as proposed by SV.
As far as the significance of the additional variable(s) is concerned, both EO and LP had positive and significant coefficients, at least at the 5% significance level. Inclusion of these variables also improves the model fit considerably, increasing adjusted- from 0.192 in model 9 to 0.307 in model 10 (Table 2). The results of model 11 in Table 2 show that the findings in model 10 related to human capital are robust to the changes in formulation of EO and LP variables. More importantly, it is noteworthy that and both have negative coefficients. For formula and explanation, see Equation (6) in Section 5. This suggests that the further away a country is from the frontiers of EO and LP, the worse it performs in economic growth.
Following the arguments for EO and LP as facilitators of the human capital–growth relationship, we extend our analysis by including interactions between human capital and EO as well as LP. The results, as reported in Table 3, show that interaction between human capital and EO is significant (model 13). This suggests that higher economic opportunities significantly increase the effect of human capital on growth. Since EO index includes two broader components of economic freedom i.e., freedom to trade internationally and regulation that capture the ease of doing business, significance of the interaction between EO and human capital can be interpreted in both contexts.
From the perspective of freedom to trade internationally, this result hints at the importance of domestic stock of knowledge to absorb knowledge spillovers from, for example, imports (Ali et al. 2016). It also shows that increase in freedom to trade internationally increases the opportunities for the individuals in the home country to exploit the needs of foreign markets. If the stock of human capital at home is sufficiently high, individuals are more likely to innovate in response to foreign competition, thereby improving growth.
From the perspective of ease of doing business at home, significant interaction between human capital and EO implies that, in a sound economic environment, human capital tends to have a stronger effect on economic growth. Another important result here is the significant coefficient of the change in human capital, further highlighting the importance of including factors relating to social capabilities in the growth regression. Figure 1 shows the graphical representation of interaction between human capital and economic opportunities. One can see from the figure that the effect of each additional unit of human capital is stronger when economic opportunities are higher.
The results in models 14 and 15 of Table 3 are consistent with the foregoing. The larger the gap from the frontiers of EO and LP, the weaker the effects of human capital on economic growth. In fact, both formulations of the human capital variable are significant in model 15, suggesting that beyond a country’s absolute social capabilities, its relative capabilities may be more relevant in reinforcing the role of human capital in economic growth. Surprisingly, the interaction between human capital and LP does not have significant coefficients. This result is surprising because one would expect the quality of legal system and property rights to strengthen the relationship between human capital and growth through provision of protection for innovators and investors.
7. Conclusions
The empirical relationship between human capital and economic growth has been analyzed extensively since the emergence of the literature on endogenous growth theory. However, results from these analyses are far from being conclusive. Moreover, most studies in this regard employ cross-sectional data and methods. Recent studies (e.g., Sunde and Vischer 2015) show that results on the human capital–growth relationship depend on empirical specification, and that additional channels through which the effects of human capital is transmitted should be included in the empirical analysis.
The present study enters the discussion by arguing that convergence is better captured by panel data. Using data of 132 countries, the results revealed that previous studies on human capital and growth partially hold when the time dimension is included in the empirical model and control for country-specific effects. We also identify a specific set of conditions under which human capital has a consistently positive effect on economic growth. On their own, economic opportunities and quality of legal institution have a significant and positive relationship with growth. More importantly, inclusion of these variables changes the significance of the human capital variable, highlighting their importance as channels through which human capital can indirectly affect growth. These results suggest that, when a country possesses strong institutions and its citizens have ample economic opportunities, it tends to derive better utility from its stock of human capital. Analysis of interaction effects reveals that economic opportunities but not quality of legal institutions significantly moderate the relationship between human capital and growth. This result holds even when we measure economic opportunities and quality of institutions relative to a frontier.
This study contributes to the growth literature by identifying the factors that strengthen the link between human capital and economic growth. Building upon the work of Zhu and Li (2017) that identified economic complexity as a significant moderator of the link between human capital and economic growth, we highlight a significant interaction effect of some aspects of social capabilities and human capital on economic growth. This study also offers a methodological insight: results shown in some traditional growth models only hold in cross-sectional data and are therefore not realistic. Future research will benefit from the use of panel data that allow explicit modeling of growth dynamics over time. It is also highly desirable to have more studies on the channels through which the effects of human capital are transmitted to economic growth. It is in identifying these specific channels that the policy relevance of growth regression lies. In this regard, our study offers two key policy insights. First, it is highly desirable to create strong and high-quality institutions. From a policy point of view, quality of institutions can be viewed as market enhancing or growth enhancing. Market-enhancing growth is a narrow concept, which only deals with the efficiency of markets. The primary argument is that efficient markets attract technology and capital, and eventually improve the economic development of the country. In contrast, growth-enhancing governance suggests that markets are inherently inefficient. Specific governance capacities are required for the efficient allocation of resources and to accelerate growth using both market and non-market mechanisms, allowing both productivity and absorptive capacity to be increased (Khan 2007). In short, growth-enhancing and market-enhancing governance capacities are substantially different from each other, but are not necessarily mutually exclusive. Countries should, therefore, strive to cultivate both. Legal institutions are particularly important as they inspire confidence in a country’s business environment. Second, irrespective of level of investments in human capital accumulation, the educated labour force will always under-perform if economic opportunities do not exist.
A remark on opportunities for future research is in order. It might be argued that single-country time-series data, wherein cross-country differences are absent and only inter-temporal within-country differences are present, could lead to different results from our own. Indeed, a number of previous studies have shown a positive and significant correlation between human capital and growth, based on single-country time-series datasets (e.g., Lau et al. 1993; Liu and Armer 1993; McMahon 1998). However, these studies simply consider the direct effects of human capital. It remains to be seen whether the kind of conditionalities found by us and Zhu and Li (2017) will be supported in single-country analyses. In this regard, we hope that our work will stimulate further rigorous empirical debate.
Acknowledgments
Authors gratefully acknowledge the comments and suggestions from Uwe Cantner, Silke Ubelmesser, participants of the Jena Summer Academy 2012 and 30th Annual General Meeting 2014 of Pakistan Institute of Development Economics, Islamabad, Pakistan. Authors also gratefully acknowledge the funding of Deutsche Forschungsgemeinschaft Research Training Group 1411.
Author Contributions
Empirical analysis was carried out by Muhammad Ali while Abiodun Egbetogun and Manzoor Hussain Memon reviewed the literature. All three authors contributed in developing conceptual and methodological framework and finally the write-up of the paper.
Conflicts of Interest
The authors declare no conflict of interest.
Appendix A

Table A1.
List of countries.
| Developing Countries | Jordan | Thailand | Greece |
| Argentina | Kenya | Togo | Hungary |
| Bahrain | Korea, Republic of | Trinidad and Tobago | Ireland |
| Bangladesh | Kuwait | Tunisia | Iceland |
| Barbados | Laos | Turkey | Italy |
| Belize | Lesotho | Uganda | Japan |
| Benin | Liberia | Uruguay | Lithuania |
| Bolivia | Macao | Venezuela | Luxembourg |
| Botswana | Malawi | Vietnam | Latvia |
| Brazil | Malaysia | Yemen | Malta |
| Brunei | Maldives | Zambia | Netherlands |
| Burundi | Mali | Zimbabwe | Norway |
| Cambodia | Mauritania | Transition Economies | New Zealand |
| Cameroon | Mauritius | Albania | Poland |
| Central African Republic | Mexico | Armenia | Portugal |
| Chile | Mongolia | Croatia | Romania |
| China | Morocco | Kazakhstan | Slovak Republic |
| Colombia | Mozambique | Kyrgyzstan | Slovenia |
| Congo, Dem. Rep. | Namibia | Moldova | Sweden |
| Congo, Republic of | Nepal | Russia | United States |
| Costa Rica | Niger | Serbia | |
| Cote d‘Ivoire | Pakistan | Tajikistan | |
| Dominican Republic | Panama | Ukraine | |
| Ecuador | Paraguay | Developed Countries | |
| Egypt | Peru | Australia | |
| El Salvador | Philippines | Austria | |
| Fiji | Qatar | Belgium | |
| Gabon | Rwanda | Bulgaria | |
| Gambia, The | Saudi Arabia | Canada | |
| Ghana | Senegal | Switzerland | |
| Guatemala | Sierra Leone | Cyprus | |
| Honduras | Singapore | Czech Republic | |
| Hong Kong | South Africa | Germany | |
| India | Sri Lanka | Denmark | |
| Indonesia | Sudan | Spain | |
| Iran | Swaziland | Estonia | |
| Iraq | Syria | Finland | |
| Israel | Taiwan | France | |
| Jamaica | Tanzania | United Kingdom |
Table A2.
Correlation table: Panel data.
| logy | logK | logL | logH | |||||
|---|---|---|---|---|---|---|---|---|
| logy | 1 | |||||||
| logK | 0.1527 | 1 | ||||||
| logL | 0.0955 | 0.1955 | 1 | |||||
| −0.0815 | −0.0217 | −0.103 | 1 | |||||
| logH | 0.022 | 0.1235 | 0.1039 | −0.275 | 1 | |||
| 0.0313 | −0.1379 | −0.2568 | 0.7474 | −0.4032 | 1 | |||
| 0.1063 | 0.0811 | −0.0796 | 0.6963 | −0.243 | 0.6412 | 1 | ||
| 0.086 | −0.0158 | −0.1521 | 0.7343 | −0.2441 | 0.6098 | 0.6138 | 1 |
Table A3.
Descriptive statistics: Panel data.
| Variable | Obs | Mean | Std. Dev. | Min | Max |
|---|---|---|---|---|---|
| logy | 1951 | 0.0249289 | 0.0467287 | −0.4301615 | 0.6506202 |
| logK | 1980 | 0.0530881 | 0.0679552 | −0.4876966 | 0.9718685 |
| logL | 1980 | 0.0199598 | 0.0298383 | −0.1491693 | 0.291219 |
| 1954 | 8.173697 | 1.688926 | 3.97215 | 11.36358 | |
| logH | 1980 | 0.0068272 | 0.0055718 | −0.012367 | 0.0273357 |
| 1980 | −0.0032263 | 0.2535024 | −0.7432166 | 0.4157762 | |
| 1695 | 1.910732 | 0.1685139 | 1.088507 | 2.231478 | |
| 1712 | 1.712567 | 0.3467041 | 0.1492792 | 2.264325 |
Table A4.
Correlation table: Cross-sectional data.
| logy | logK | logL | logH | |||
|---|---|---|---|---|---|---|
| logy | 1 | |||||
| logK | 0.1854 | 1 | ||||
| logL | −0.1782 | 0.3992 | 1 | |||
| logH | 0.0146 | 0.2814 | 0.3614 | 1 | ||
| 0.0745 | −0.2551 | −0.4831 | −0.6324 | 1 | ||
| −0.2502 | −0.0634 | −0.1707 | −0.3849 | 0.7298 | 1 |
Table A5.
Descriptive statistics: Cross-sectional data.
| Variable | Obs | Mean | Std. Dev. | Min | Max |
|---|---|---|---|---|---|
| logy | 128 | 0.373616 | 0.2877525 | −0.4768372 | 1.576412 |
| logK | 132 | 0.7963213 | 0.6311445 | −1.656434 | 3.745654 |
| logL | 132 | 0.2993976 | 0.2464028 | −0.3392376 | 1.592419 |
| logH | 132 | 0.1024086 | 0.0579185 | −0.0160332 | 0.264487 |
| 132 | 0.8163371 | 0.2658609 | 0.1271352 | 1.256124 | |
| 130 | 7.99791 | 1.700084 | 3.97215 | 10.96582 |
Table A6.
Components of the EO and LP indices.
| Legal System and Property Rights | Economic Opportunity | |
|---|---|---|
| Legal System and Property Rights | Freedom to trade internationally | Regulation |
| A Judicial independence | A Tariffs | A Credit market regulations |
| B Impartial courts | Ai Revenue from trade taxes (% of trade sector) | Ai Ownership of banks |
| C Protection of property rights | Aii Mean tariff rate | Aii Private sector credit |
| D Military interference in rule of law and politics | Aiii Standard deviation of tariff rates | Aiii Interest rate controls/negative real interest rates) |
| E Integrity of the legal system | B Regulatory trade barriers | B Labor market regulations |
| F Legal enforcement of contracts | Bi Non-tariff trade barriers | Bi Hiring regulations and minimum wage |
| G the sale of real property the sale of real property | Bii Compliance costs of importing and exporting | Bii Hiring and firing regulations |
| H Reliability of police | C Black market exchange rates | Biii Centralized collective bargaining |
| I Business costs of crime | D Controls of the movement of capital and people | Biv Hours Regulations |
| Di Foreign ownership/investment restrictions | Bv Mandated cost of worker dismissal | |
| Dii Capital controls | Bvi Conscription | |
| Diii Freedom of foreigners to visit | C Business regulations | |
| Ci Administrative requirements | ||
| Cii Bureaucracy costs | ||
| Ciii Starting a business | ||
| Civ Extra payments/bribes/favoritism | ||
| Cv Licensing restrictions | ||
| Cvi Tax compliance | ||
References
- Abramovitz, Moses. 1986. Catching up, Forging ahead, and Falling behind. The Journal of Economic History 46: 385–406. [Google Scholar] [CrossRef]
- Aghion, Philippe, and Peter Howitt. 1992. A Model of Growth through Creative Destruction. Econometrica 60: 323–51. [Google Scholar] [CrossRef]
- Alguacil, Maite, Ana Cuadros, and Vicente Orts. 2011. Inward FDI and growth: The role of macroeconomic and institutional environment. Journal of Policy Modeling 33: 481–96. [Google Scholar] [CrossRef]
- Ali, Muhammad, Uwe Cantner, and Ipsita Roy. 2016. Knowledge Spillovers through FDI and Trade: Moderating Role of Quality-Adjusted Human Capital. Journal of Evolutionary Economics 26: 837–68. [Google Scholar] [CrossRef]
- Arrow, Kenneth J. 1962. The Economic Implications of Learning by Doing. The Review of Economic Studies 29: 155–73. [Google Scholar] [CrossRef]
- Banerjee, Sudatta. 2012. Economic Growth and the Quality Composition of Human Capital. SSRN Scholarly Paper ID 2021735. Rochester: Social Science Research Network. [Google Scholar]
- Barro, Robert. 1991. Economic Growth in a cross Section of Countries. The Quarterly Journal of Economics 106: 407–43. [Google Scholar] [CrossRef]
- Barro, Robert J., and Jong Wha Lee. 2013. A new data set of educational at- tainment in the world, 1950–2010. Journal of Development Economics 104: 184–98. [Google Scholar] [CrossRef]
- Becker, Gary S. 1994. Human Capital: A Theoretical and Empirical Analysis with Special Reference to Education, 3rd ed. Cambridge: NBER Books—National Bureau of Economic Research, Inc., vol. 1, pp. 132–33. [Google Scholar]
- Benhabib, Jess, and Mark M. Spiegel. 1994. The role of human capital in eco- nomic development evidence from aggregate crosscountry data. Journal of Monetary Economics 34: 143–73. [Google Scholar] [CrossRef]
- Cohen, Daniel, and Marcelo Soto. 2007. Growth and human capital: Good data, good results. Journal of Economic Growth 12: 51–76. [Google Scholar] [CrossRef]
- Dakhli, Mourad, and Dirk De Clercq. 2004. Human capital, social capital, and innovation: A multi country study. Entrepreneurship & Regional Development 16: 107–28. [Google Scholar]
- Dessus, Sebastien. 1999. Human Capital and Growth: The Recovered Role of Education Systems. SSRN Scholarly Paper ID 632700. Rochester: Social Science Research Network. [Google Scholar]
- Elias, Silvina, and M. Del R. Fernandez. 2000. Human Capital Investment, Income Levels and Economic Growth In Latin American Countries. Paper presented at 40th Congress of the European Regional Science Associatio, Barcelona, Spain, August 29–September 1. [Google Scholar]
- Fan, C. Simon, and Oded Stark. 2007. The brain drain, educated unemployment, human capital formation, and economic betterment. Economics of Transition 15: 629–60. [Google Scholar] [CrossRef]
- Farida, Moe, and Fredoun Z. Ahmadi-Esfahani. 2008. Corruption and economic growth in Lebanon. Paper presented at 52nd Annual Australian Agricultural and Resource Economics Society Conference, Canberra, Australia, February 5–8; Canberra: Australian Agricultural and Resource Economics Society. [Google Scholar]
- Gemmell, Norman. 1996. Evaluating the Impacts of Human Capital Stocks and Accumulation on Economic Growth: Some New Evidence. Oxford Bulletin of Economics and Statistics 58: 9–28. [Google Scholar] [CrossRef] [PubMed]
- Goode, Richard B. 1959. Adding to the Stock of Physical and Human Capital. The American Economic Review 49: 147–55. [Google Scholar]
- Gwartney, James, Robert Lawson, and Joshua Hall. 2014. Economic Freedom Dataset. Vancouver: Fraser Institute. [Google Scholar]
- Hanushek, Eric A., and Dennis D. Kimko. 2000. Schooling, Labor-Force Quality, and the Growth of Nations. American Economic Review 90: 1184–208. [Google Scholar] [CrossRef]
- IMF. 2002. Governance, Corruption, and Economic Performance. Washington: International Monetary Fund. [Google Scholar]
- Islam, Nazrul. 1995. Growth Empirics: A Panel Data Approach. The Quarterly Journal of Economics 110: 1127–70. [Google Scholar] [CrossRef]
- Khan, Mushtaq. 2007. Governance, Economic Growth and Development Since the 1960s. Monographs. August. Available online: http://eprints.soas.ac.uk/9921/1/DESA_Governance_Economic_Growth_and_Development_since_1960s.pdf (accessed on 20 April 2015).
- Lau, Lawrence J., Dean T. Jamison, Shu-Cheng Liu, and Steven Rivkin. 1993. Education and economic growth Some cross sectional evidence from Brazil. Journal of Development Economics 41: 45–70. [Google Scholar] [CrossRef]
- Liu, Chien, and J. Michael Armer. 1993. Educations Effect on Economic Growth in Taiwan. Comparative Education Review 37: 304–21. [Google Scholar] [CrossRef]
- Lucas, Robert. 1988. On the mechanics of economic development. Journal of Monetary Economics 22: 3–42. [Google Scholar] [CrossRef]
- Mankiw, N. Gregory, David Romer, and David N. Weil. 1992. A Contribution to the Empirics of Economic Growth. The Quarterly Journal of Economics 107: 407–37. [Google Scholar] [CrossRef]
- McMahon, Walter W. 1998. Education and growth in East Asia. Economics of Education Review 17: 159–72. [Google Scholar] [CrossRef]
- Olofsdotter, Karin. 1998. Foreign direct investment, country capabilities and eco- nomic growth. Weltwirtschaftliches Archiv 134: 534–47. [Google Scholar] [CrossRef]
- Owen, Ann L., Julio Videras, and Lewis Davis. 2009. Do all countries follow the same growth process? Journal of Economic Growth 14: 265–86. [Google Scholar] [CrossRef] [Green Version]
- Psacharopoulos, George. 1994. Returns to investment in education: A global update. World Development 22: 1325–43. [Google Scholar] [CrossRef]
- Ranis, Gustav, Frances Stewart, and Alejandro Ramirez. 2000. Economic Growth and Human Development. World Development 28: 197–219. [Google Scholar] [CrossRef]
- Robeyns, Ingrid. 2006. Three models of education Rights, capabilities and human capital. Theory and Research in Education 4: 69–84. [Google Scholar]
- Romer, Paul M. 1986. Increasing Returns and Long Run Growth. Journal of Political Economy 94: 1002–37. [Google Scholar] [CrossRef]
- Romer, Paul M. 1990. Endogenous Technological Change. Journal of Political Economy 98: S71–102. [Google Scholar] [CrossRef]
- Sen, Amartya. 1983. Development: Which Way Now? The Economic Journal 93: 745–62. [Google Scholar] [CrossRef]
- Soto, Marcelo. 2009. System GMM Estimation with a Small Sample. Barcelona Economics Working Paper Series, 395th Ser, 780.09; Barcelona: Universitat Autònoma de Barcelona. Institut d’Anàlisi Econòmica. [Google Scholar]
- Sunde, Uwe, and Thomas Vischer. 2015. Human Capital and Growth: Speci-cation Matters. Economica 82: 368–90. [Google Scholar] [CrossRef]
- Zhu, Shujin, and Renyu Li. 2017. Economic complexity, human capital and economic growth: Empirical research based on cross-country panel data. Applied Economics 49: 3815–28. [Google Scholar] [CrossRef]
Figure 1.
Interaction between human capital and economic opportunities.
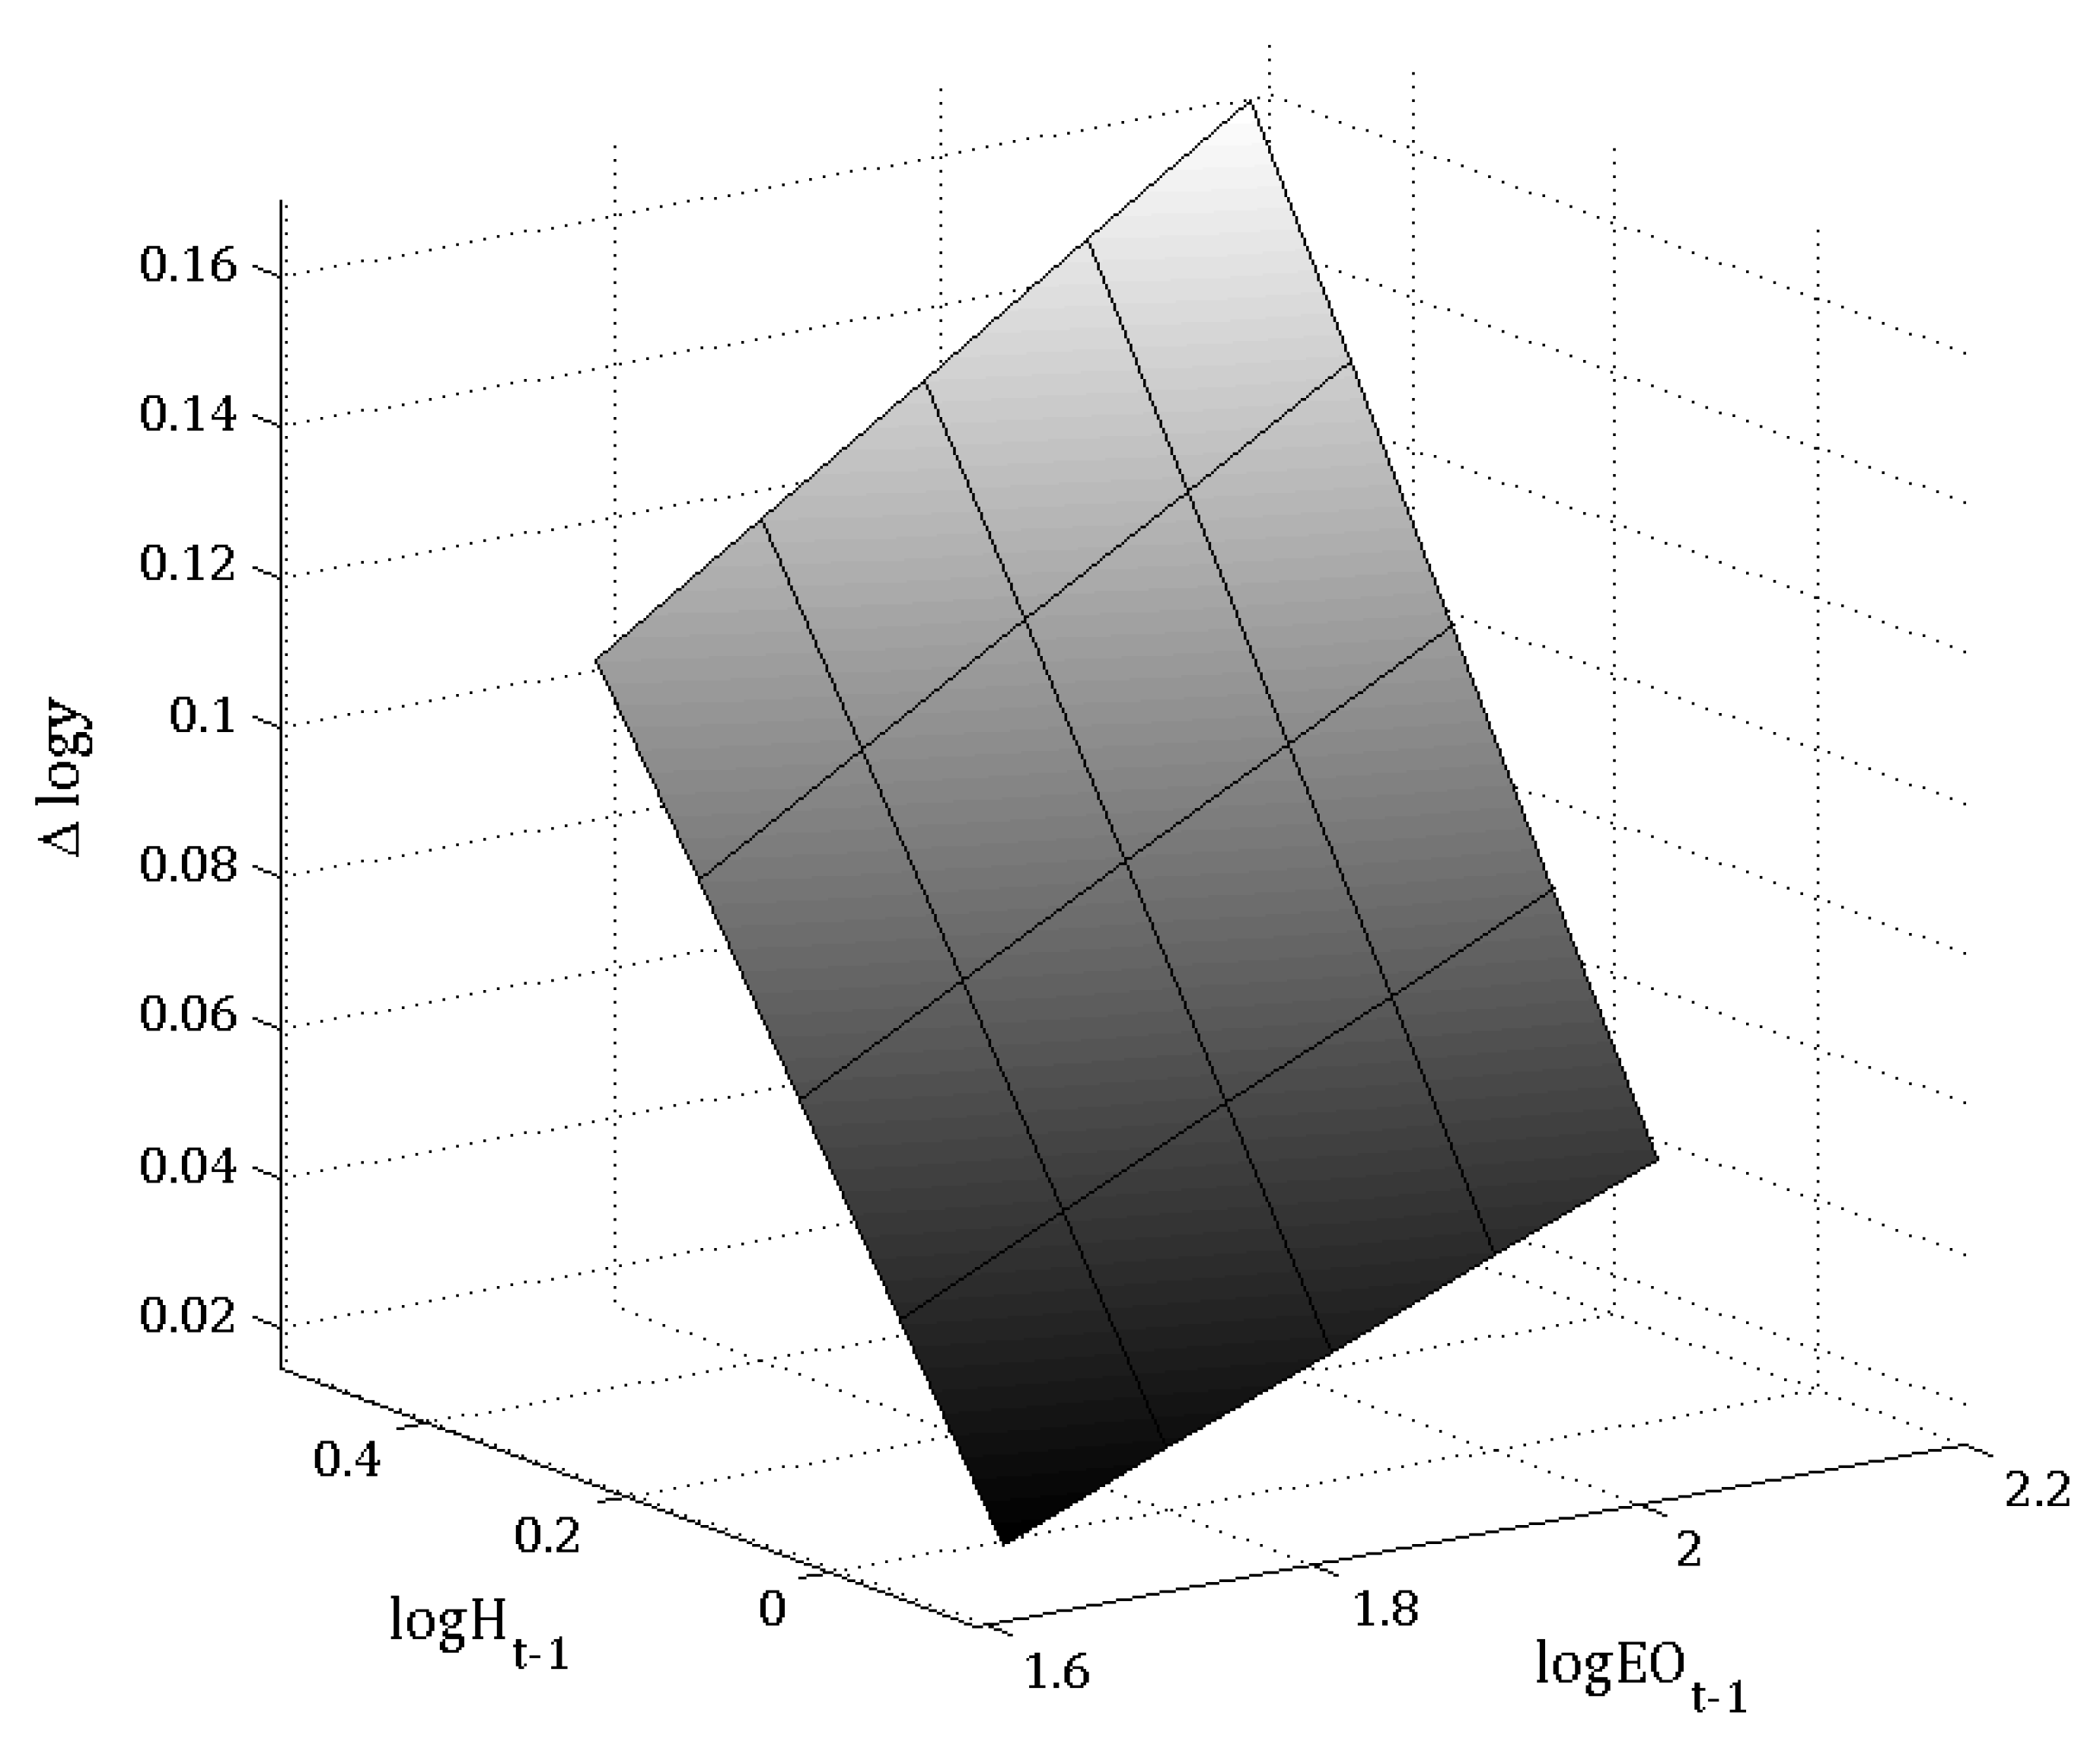
Table 1.
Cross-sectional OLS estimation. Dependent variable: per capita GDP growth.
| (1) | (2) | (3) | (4) | (5) | (6) | |
|---|---|---|---|---|---|---|
| logK | 0.164 ** | 0.169 ** | 0.160 ** | 0.105 | 0.145 ** | 0.136 ** |
| (0.077) | (0.070) | (0.074) | (0.067) | (0.061) | (0.064) | |
| logL | −0.40 *** | −0.197 | −0.193 | |||
| (0.141) | (0.156) | (0.159) | ||||
| logH | −0.453 | 0.590 | −0.845 | 0.618 | ||
| (0.561) | (0.661) | (0.585) | (0.637) | |||
| −0.055 *** | −0.113 *** | −0.116 *** | −0.051 *** | −0.122 *** | −0.125 *** | |
| (0.017) | (0.024) | (0.025) | (0.017) | (0.021) | (0.022) | |
| 0.606 *** | 0.697 *** | 0.725 *** | 0.818 *** | |||
| (0.145) | (0.198) | (0.124) | (0.157) | |||
| Constant | 0.853 *** | 0.710 *** | 0.602 *** | 0.788 *** | 0.644 *** | 0.533 *** |
| (0.171) | (0.154) | (0.164) | (0.179) | (0.163) | (0.160) | |
| Observations | 128 | 128 | 128 | 128 | 128 | 128 |
| 0.206 | 0.306 | 0.314 | 0.115 | 0.288 | 0.297 | |
| Adjusted | 0.181 | 0.284 | 0.286 | 0.093 | 0.271 | 0.274 |
| VIF | 1.29 | 2.06 | 2.20 | 1.20 | 1.87 | 2.08 |
Robust standard errors in parentheses. * p < 0.10, ** p < 0.05, *** p < 0.01.
Table 2.
Fixed effects estimation. Dependent variable: per capita GDP growth.
| (7) | (8) | (9) | (10) | (11) | |
|---|---|---|---|---|---|
| logK | 0.041 * | 0.044 * | 0.045 ** | 0.057 ** | 0.057 ** |
| (0.023) | (0.023) | (0.023) | (0.025) | (0.024) | |
| logL | 0.193 ** | 0.188 ** | 0.192 ** | 0.285 *** | 0.284 *** |
| (0.087) | (0.087) | (0.087) | (0.095) | (0.095) | |
| –0.064 *** | −0.064 *** | –0.063 *** | −0.089 *** | −0.088 *** | |
| (0.017) | (0.017) | (0.017) | (0.016) | (0.016) | |
| logH | 0.325 | 0.443 | 0.412 | 0.419 | |
| (0.259) | (0.257) | (0.250) | (0.253) | ||
| 0.072 | 0.091 | 0.149 ** | 0.156 ** | ||
| (0.071) | (0.073) | (0.060) | (0.060) | ||
| 0.069 ** | |||||
| (0.032) | |||||
| 0.045 *** | |||||
| (0.011) | |||||
| −0.135 ** | |||||
| (0.063) | |||||
| −0.078 *** | |||||
| (0.017) | |||||
| Constant | 0.536 *** | 0.481 *** | 0.452 *** | 0.538 *** | 0.754 *** |
| (0.136) | (0.161) | (0.166) | (0.123) | (0.129) | |
| Observations | 1948 | 1948 | 1948 | 1659 | 1659 |
| 0.198 | 0.199 | 0.200 | 0.315 | 0.317 | |
| Adjusted | 0.191 | 0.191 | 0.192 | 0.307 | 0.308 |
| VIF | 1.75 | 1.89 | 2.01 | 2.13 | 2.11 |
Robust standard errors in parentheses. * p < 0.10, ** p < 0.05, *** p < 0.01.
Table 3.
Fixed effects estimation. Dependent variable: per capita GDP growth.
| (12) | (13) | (14) | (15) | |
|---|---|---|---|---|
| logK | 0.057 ** | 0.059 ** | 0.057 ** | 0.059 ** |
| (0.025) | (0.025) | (0.024) | (0.024) | |
| logL | 0.285 *** | 0.277 *** | 0.284 *** | 0.274 *** |
| (0.095) | (0.096) | (0.095) | (0.095) | |
| −0.089 *** | −0.098 *** | −0.088 *** | −0.100 *** | |
| (0.016) | (0.018) | (0.016) | (0.017) | |
| logH | 0.412 | 0.487 * | 0.419 | 0.513 ** |
| (0.250) | (0.255) | (0.253) | (0.258) | |
| 0.149 ** | −0.068 | 0.156 ** | 0.240 *** | |
| (0.060) | (0.131) | (0.060) | (0.059) | |
| 0.069 ** | 0.089 ** | |||
| (0.032) | (0.035) | |||
| 0.045 *** | 0.047 *** | |||
| (0.011) | (0.013) | |||
| × | 0.143 ** | |||
| (0.063) | ||||
| × | 0.006 | |||
| (0.031) | ||||
| −0.078 *** | −0.089 *** | |||
| (0.017) | (0.022) | |||
| −0.135 ** | −0.185 *** | |||
| (0.063) | (0.069) | |||
| × | −0.362 *** | |||
| (0.119) | ||||
| × | −0.044 | |||
| (0.050) | ||||
| Constant | 0.538 *** | 0.572 *** | 0.754 *** | 0.857 *** |
| (0.123) | (0.131) | (0.129) | (0.144) | |
| Observations | 1659 | 1659 | 1659 | 1659 |
| 0.315 | 0.322 | 0.317 | 0.328 | |
| Adjusted | 0.307 | 0.312 | 0.308 | 0.318 |
| VIF | 2.10 | - | 1.97 | - |
Robust standard errors in parentheses. * p < 0.10, ** p < 0.05, *** p < 0.01.
© 2018 by the authors. Licensee MDPI, Basel, Switzerland. This article is an open access article distributed under the terms and conditions of the Creative Commons Attribution (CC BY) license (http://creativecommons.org/licenses/by/4.0/).
Share and Cite
MDPI and ACS Style
Ali, M.; Egbetokun, A.; Memon, M.H. Human Capital, Social Capabilities and Economic Growth. Economies 2018, 6, 2. https://doi.org/10.3390/economies6010002
AMA Style
Ali M, Egbetokun A, Memon MH. Human Capital, Social Capabilities and Economic Growth. Economies. 2018; 6(1):2. https://doi.org/10.3390/economies6010002
Chicago/Turabian StyleAli, Muhammad, Abiodun Egbetokun, and Manzoor Hussain Memon. 2018. "Human Capital, Social Capabilities and Economic Growth" Economies 6, no. 1: 2. https://doi.org/10.3390/economies6010002
Note that from the first issue of 2016, this journal uses article numbers instead of page numbers. See further details here.