1. Introduction
Due to the technology advancement in 21st century, many companies faced myriad of risks, such as internet, complex financial instruments, global competition, deregulations, downsizing, and the consumer demands are some of the major risk factors in an organizational environment (
Shenkir and Walker 2006). Malaysia remains one of South East Asia’s most dynamic producer of oil and gas, and it is considered as the keystone in the Malaysian economy. The exploration of Petroleum products started in Sarawak with the start of 20th century, in Sarawak, in 1909, Oil was for the first time was discovered and later in 1910 the production of oil was carried out Sarawak. In the whole world, Malaysia is among the countries that 25th biggest reserved of Oil and 14th biggest reserves of Gas. Based on
Jin et al. (
2013), the Oil & Gas (O&G) sector contributes about 40% of the nation’s total revenue. The government of Malaysia collected direct and indirect taxes from O&G, amounting to RM 34.4 billion in 2012. In 2015, the company registered RM329 billion in revenues, and therefore, O&G is considered as one of the main pillars of the Malaysia’s economy due to the contribution of O&G industry to Malaysian economy.
Many forms of risks are involved in the field of O&G and most of them are exposed to risks, such as government policies, environmental incidents, operational, survival circumstances, and market threats. These risks should be managed in an effective manner or else it will lead to a huge effect on firm’s value (
Nguyen et al. 2007). Risks that occur frequently in O&G industries are political risk, environmental risk, operational risk, market risk; climate change risk, financial risk; regulatory risk; and, strategic risk, and these risks are increasingly evident, particularly during and after financial crises (
Jalal-Karim 2013;
Othman and Ameer 2008). Financial rises 1997–1998 have badly affected Malaysian companies and it is mainly due to the poor risk management (
Yazid and Muda 2006). As the crisis resulted in currency devaluation throughout the region (
Yazid 2001), many companies suffered loss due to these crises, for instance, Tenaga Nasional Bhd (TNB), the main energy provider in Malaysia, suffered a loss of RM 2.47 billion, Telekom Malaysia™, a telecommunications provider, suffered a loss of RM 158 billion (
Yazid 2001).
Malaysia Airline System (MAS) suffered a loss of RM 300 to 400 million (
Financial Express 1998). There have been impressive changes in the role of risk management as most corporations responded by shifting towards strategic risk management in their operations (
Nocco and Stulz 2006). Most of the organizations responded by implementing enterprise risk management (ERM) to manage the risk in accordance with the directions of well-known corporations of United States (US), such as General Electric (GE), Wal-Mart, Bank of America, and IBM, whereby they have implemented ERM effectively in managing their risks (
Drew et al. 2005). ERM evaluates and improves the effectiveness of risk management, in which it provides assurance to stakeholders the capabilities of management in governing the risks (
Beasley et al. 2006). ERM has been recognized as one of the most significant tools in managing risks in businesses and to ensure that mishaps are prevented to the best possibility, which is in accordance to organizations objectives. Researchers have recommended various frameworks like COSO’s Enterprise Risk Management-Integrated Framework, Traditional risk management framework, Arthur Anderson Business risk management process etc., but though they are difference in names, industries, areas, and regions, but they all share a common theme that is identification, prioritization, measurement, and treatment of risk. However, the ERM framework provides companies with key principles and concepts and clear direction, as well as guidance to solve specific risk (
Jalal-Karim 2013).
2. Literature Review
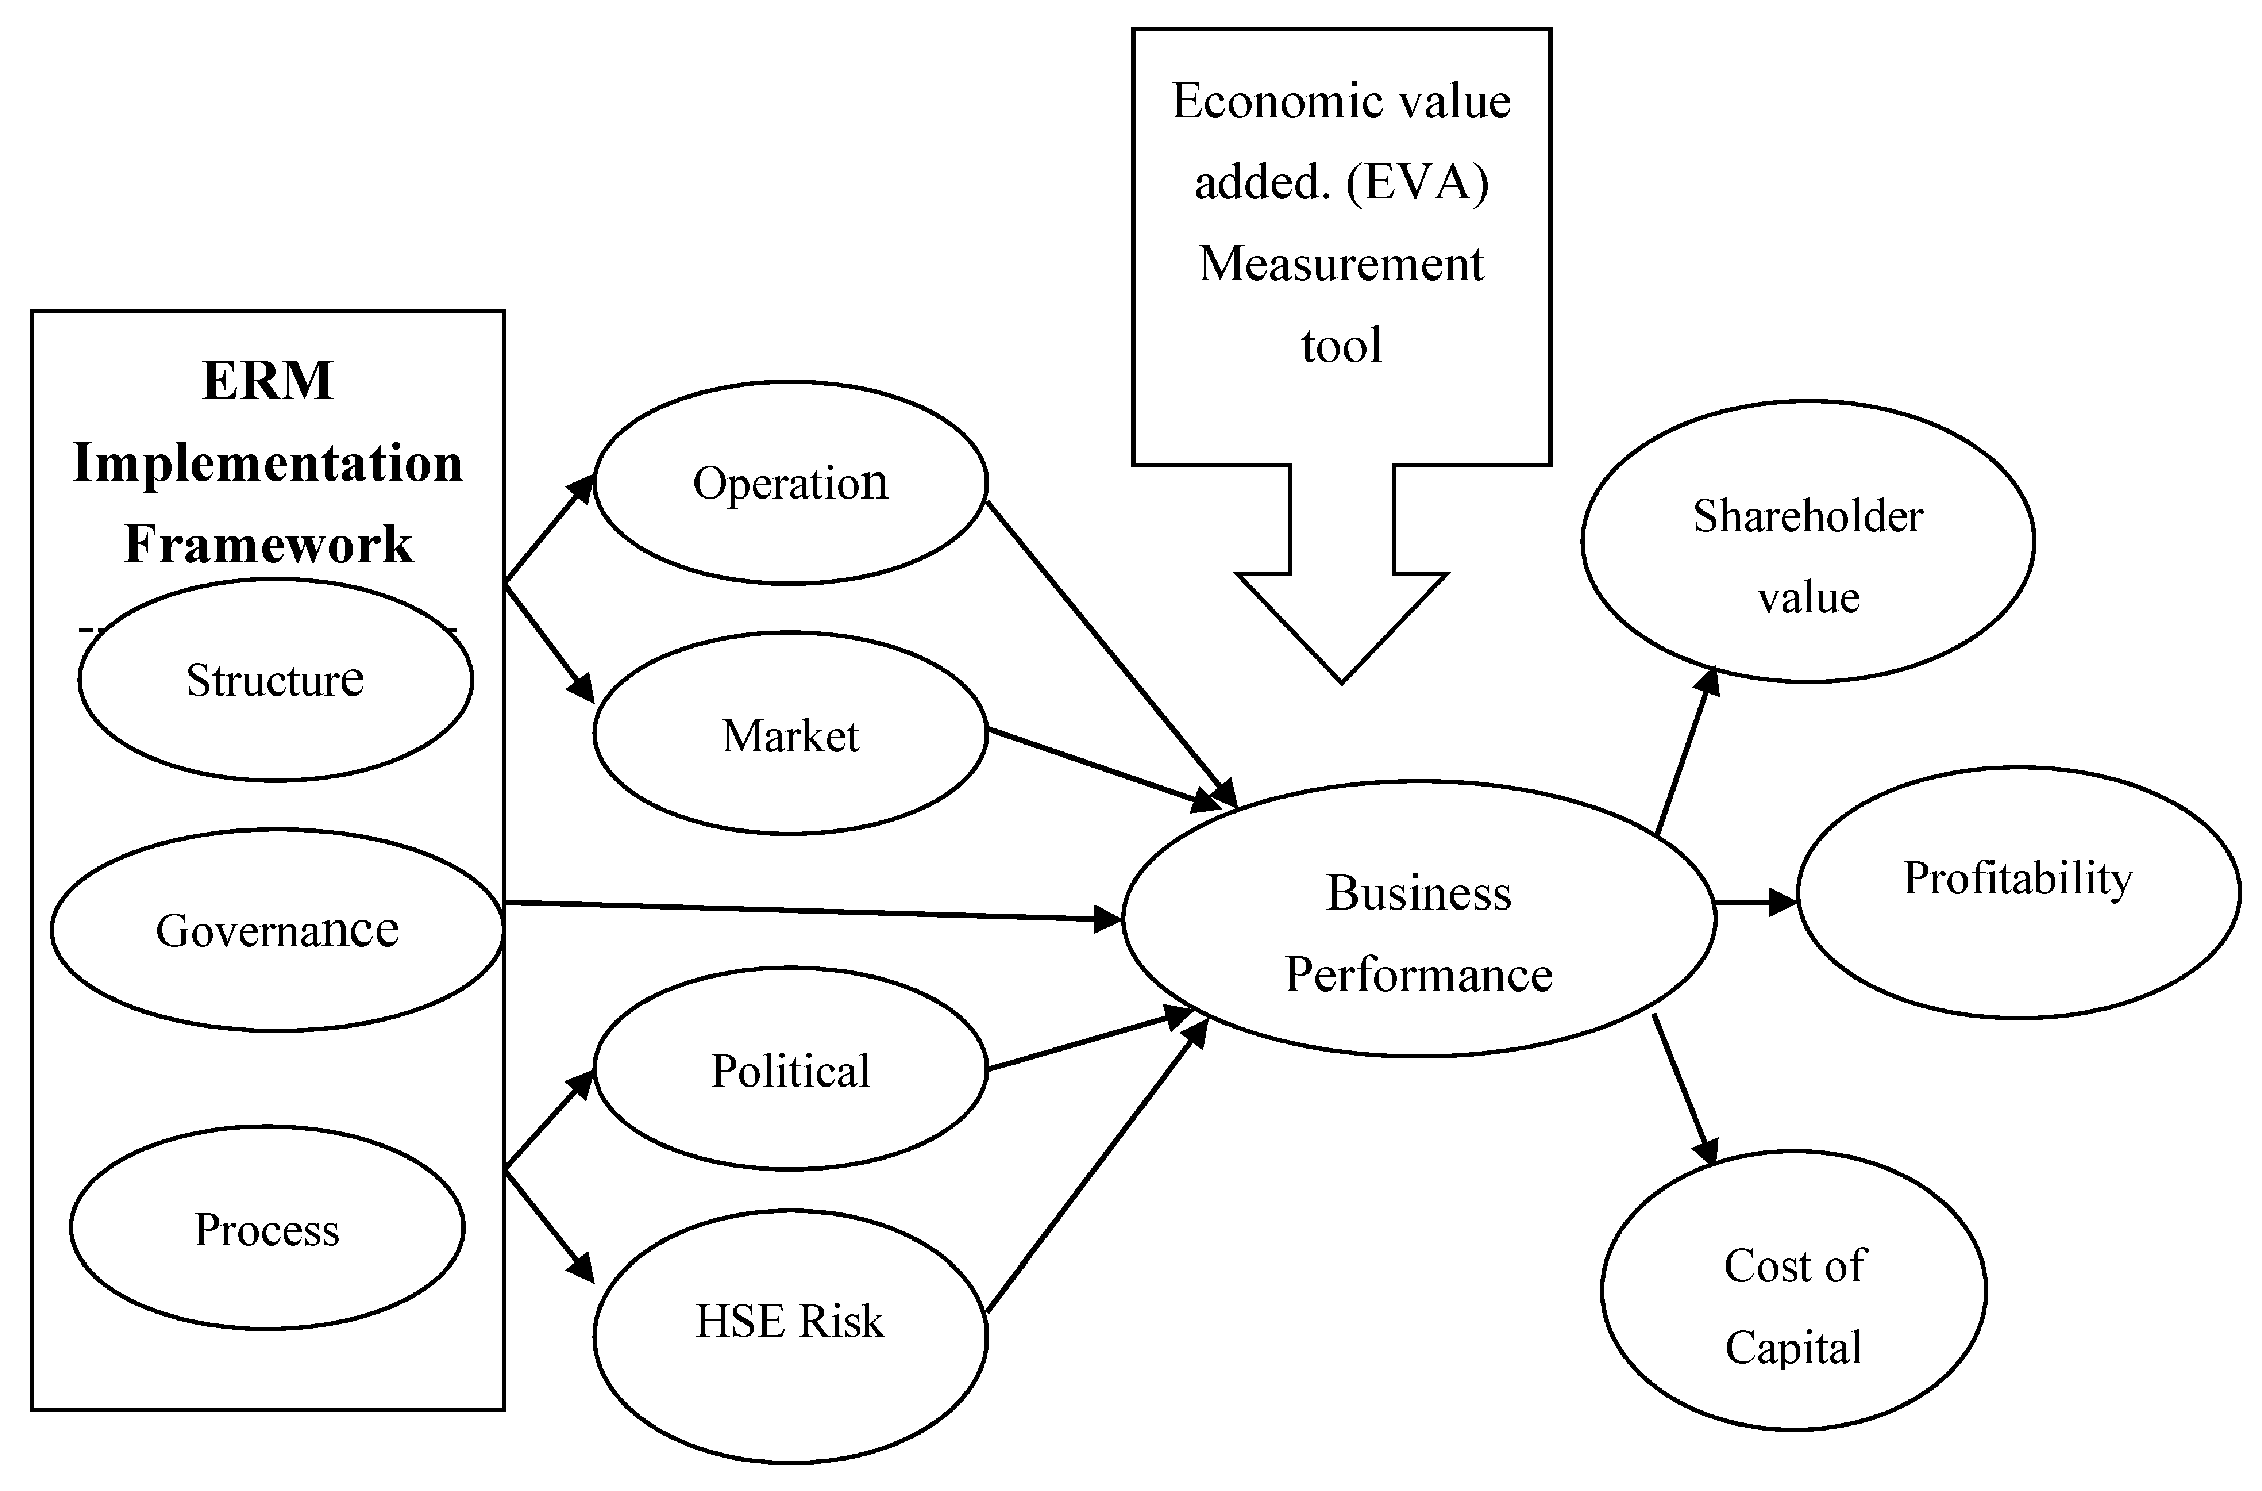
ERM implementation framework that has been adopted encompasses three dimensions (i.e., structure, governance, and process), extended to seven areas (
Lai 2012). These fourteen areas are operationalized with implementation of 14 elements. The focus of the research involves two areas, i.e., ERM definition, and performance measurement, and these two areas are operationalized by four implementation elements. The governance dimension covers two areas (i.e., information and roles, and compliance), with four implementation elements. The process dimension includes three areas (i.e., integration of business strategy and objectives, risk identification and response, and risk quantification), with six implementation elements. According to
Lai (
2012), the ERM framework consists fourteen elements, which are considered as significant for an effective and efficient management of risks faced by firms.
The proposed model is strategic as it covers all idiosyncratic risk. Hence, the use of ERM Implementation Framework is to identify the various types of risk that are involved in the Oil and Gas Sector, and to examine the effects of implementing the framework to manage the identified risks. In addition, it investigates the impact of the framework on business performances (
Richard et al. 2009).
Hybrid measuring techniques is undertaken to overcome the accounting and market weaknesses (
Richard et al. 2009). Three hybrid measures that exist are the Tobin’s q, the Altman’s Z score, and Economic Value Added (EVA). This model that was proposed in this study was economic value added (EVA). EVA is referred to as economic profit as it attempts to capture the true economic profit of a company in short and long term performances. EVA is developed and trademarked by Stern Stewart & Co., as a measurement tool in 1989. EVA shows overall operating profit inclusive of taxes (NOPAT), minus weighted average cost of capital multiply by total capital
Stewart (
1990). Mathematically, it can be given as study utilized model:
where NOPAT—operating profit inclusive of taxes, TC—Total capital.
According to EVA a company is “create value”:
If EVA > 0, then organization utilizes their own capital in an efficient, this helps to increase the company’s value.
If EVA = 0, then the organization gains and capital cost are same as the time of initial investment.
If EVA < 0, then the organization and decrease in company’s value.
EVA is a useful to measure performances, because it helps to find out the net profit adjustment by cost of capital (
Black 1998). On the other hand, ERM is useful because it aims to minimize the cost of capital in order to enhance performances. ERM program implemented to reduce the cost of capital and to improve the business performance (
Lai and Samad 2010). EVA measures the performance of financial status of a company and highlights the precise profit of that organization (
Stewart 1990).
For the success of almost every organization, proper risk management in all perspectives is essential, especially in the global business era. ERM is a comparatively new model and yet to be fully implemented in most of organizations. Despite of recognizing its importance, many industries are still proceeding to implement inaccurate risk management practices. Establishing a proper plan that deals with risk to meet the needs of modern management practices is crucial, especially in the O&G sector. Numerous studies have been undertaken to highlight the importance of ERM in the field of gas and oil sector. However, based on extensive literature review, it is observed that there is limited research available about the impact of ERM in enhancing business performances in the Oil & Gas industry in Malaysia, utilizing Economic Value Added as a measuring tool.
Many organizations, like Coca Cola, DuPont, Eli Lilly, Polaroid, Pharmacia (former Monsanto), and Whirlpool adopted EVA as a measurement technique to measure performances. Most of the studies used Tobin’s Q as a tool to measure firm’s value (
Hoyt and Liebenberg 2008;
Abdelgalil 2004); and traditional measures like ROC, ROI, ROA, return on net assets RONA. EVA can eliminate the confusion and conflicts that arise when a firm uses multiple measures, such as EPS, ROI, Return on Equity (ROE), and Net Operating Profit after Tax (NOPAT) (
Kudla and Arendt 2000). All of these measurements focuses are based on historical background from the past experience and overlooked any efforts to anticipate in the future. These measures do not provide any assistance for the company for their long term planning in order to secure the company’s future risks. These measurements only predict the short term outcomes.
However, studies on EVA as a measurement tool for business performance is still limited. Therefore, this study intends to fill the research gap by investigating the model of Enterprise risk management to examine its effect on business performances, using EVA as a measurement tool to analyze the performances of Oil & Gas industry of Malaysia.
Oil and gas companies face many types of risks in their operations, and therefore, identification and management of risk is very important for these companies. In order to identify and manage many types of risks, these companies use different ERM frameworks, for instance, Traditional Risk Management Framework, Committee of Sponsoring Organizations of the Treadway Commission’s (COSO), ERM’s model, and Arthur Andersen Business Risk Management Process (BRMP). Traditional risk management framework comprises of five components, such as identifying, analyzing, evaluating, treating, and monitoring. Committee of Sponsoring Organizations of the Treadway Commission’s (COSO) ERM’s model comprises of eight components, such as internal environment, objective setting, event identification, risk assessment, risk response, control activities, information and communication, and finally, monitoring. Arthur Andersen Business Risk Management Process (BRMP) comprises of seven elements, which are establish the business risk management process, assess business risks, develop business risk management strategies, design/implement risk management capabilities, monitor risk management performance, continuously improve risk management capabilities, and information for decision making. More recently,
Lai (
2012) has proposed an ERM Implementation framework that is more comprehensive in nature in defining intensity, maturity, and penetration level of ERM practices, as compared to other ERM frameworks because it covers almost all idiosyncratic risks. This newly proposed framework comprises of fourteen elements and seven areas that are ERM definition, effective communication of risk and responsibilities, philosophy of ERM, risk identification and response, compliance, risk quantification, and performance measurement. Based on its strategic nature, the proposed framework will play more significant role in identifying and managing risks, and will significantly improve business performances in terms of profitability, cost of capital, and shareholder value, which will be measured using economic value added (EVA) approach. This model is being tested for the first time in Malaysian Oil and Gas Sector to identify its applicability in identifying risks and enhancing business performances.
The benefit of Eva when compared to other tools is that EVA can be used to hold management accountable for all economic outlays, whether they appear in the income statement, balance sheet, or in the financial statements. This is possible because EVA creates one financial statement that includes all of the costs of being in business, while making the organization aware of the funds spent.
Oil and Gas production is the foundation of Malaysian economy. PETRONAS is the major Oil Company that plays a very important role for the development of oil and gas resources in Malaysia. Malaysia has the 25th largest oil reserves and the 14th largest gas reserves in the world. The O&G sector contributes approximately 40% of the nation’s total revenue (
Jin et al. 2013). The Malaysian government collected direct and indirect taxes approximately RM 34.4 billion in the year 2012 (
Jin et al. 2013). Most of the companies that operated in O&G industries in Malaysia were badly affected during the 1997–1998 financial crises (
Yazid and Muda 2006). This reveals that companies that operates in O&G industries in Malaysia face various forms of risks internally or externally, political, economic, cultural, technological, operational, environmental, natural disaster, etc. The corporate scandals, frauds, and company failures are also caused due to poor risk management programs in the organization. Therefore, the stability and improvement in company performances highly depends on enterprise risk management (
Sobel and Reding 2004). According to
D’Arcy (
2001), there are various risk management approaches, like corporate risk management, business risk management, traditional risk management, holistic risk management, strategic risk management, and integrated risk management. All of these approaches fall under the standard of Enterprise Risk Management (ERM).
Risks are not only considered as threats, but they can also be an opportunity for growth and the maximization of firm’s value (
Gupta 2011).
Meagher and O’Neil (
2000) specified that the current risk management processes are divided into parts and treat risks as disparate and individually. Nevertheless, the leading managers in most of the organizations recognized that to deal with risk by using “silo” approach is not an effective way to manage the myriad types of risks in the organization face (
Walker and Shenkir 2008). Enterprise risk management implementation provides many advantages to the enterprise, like reducing risk/return profile of the company, reducing earning volatility (
Lam 2003), improving management’s assurance in business operations and risk monitoring, enhancing business reputation, improving enterprise-wide decision making process, boosting enterprise profitability, improving competitive advantage, and enhancing corporate performances. According to COSO, the ERM framework needs executive management commitment for its effectiveness and efficiencies of the implementation. The executives and BODs should be committed to ERM, as they are responsible to protect, improve and maximize shareholders value (
Shenkir and Walker 2006).
According to
Lai et al. (
2011) there is a fundamental connection between ERM and improvement of shareholders’ value. Based on the developed model, the implementation of Enterprise risk management framework is beneficial for the firm and the main benefits that are gained through ERM program are as follows: Decreasing risk profile, reducing earning volatility, strengthening confidence of the management in operational and monitoring business operations, generating plane governance actions, ornamental business status, refining clearness of organization wide resolution creation and chain of knowledge, inspiring business entrepreneurship, and exploiting firm’s effectiveness. It also will help to cut down the capital cost and enhance business performances.
There are numerous factors that need to be considered when designing and planning ERM initiatives. Details of the risks, strategies and protocols should be recorded in a risk management policy for the organization. EVA emerges as the better measure of financial performance. EVA measures the impact of firm’s operations on the wealth of shareholders. According to the EVA theory, earning a return greater than the cost of capital increases firms’ value.
Figure 1 provides information on the contents of a typical ERM & EVA framework.
Gap in the Literature
The oil and gas companies of Malaysia can be affected by various risks, for example, health safety and environmental risk, political risk, climate risk, operational risk financial risk, etc. The main risks that appear in oil and gas companies of Malaysia are political risk, natural environmental risk, operational risk, management risk, economic risk, and regulatory risks (
Zhang and Xing 2011). In order to identify the major risks in the Malaysian oil and gas industry, a checklist of risk prepared from the literature will be undertaken in this study.
5. Presentation of Findings
The outcomes of reliability test reveals the value of the Cronbach’s alpha scores for the each constructs composite scale, respectively, shown in
Table 1. All the coefficient of Cronbach’s alpha is above 0.70, which represents a satisfactory internal instrument’s consistency (
Malhotra et al. 2004). On the basis of these results, the other tests can be confidently executed in terms of the formulated hypotheses.
Five hypotheses were established in order to analyze the impact of Enterprise Risk Management implementation on the operational risk; market risk; political risk; health, safety and environmental risk; as well as business performance. All of the five hypotheses H1, H2, H3, H4, and H5 are accepted because the generated results are proven to be positive.
Table 2 summarizes the results of regression analysis for the above hypotheses.
Hypothesis H1 portray that the implementation of Enterprise Risk Management model significantly reduces the operational risk of the organization. H2 regression testing reveals that the implementation of Enterprise Risk Management will reduce market risk of the organizations. H3 regression results present that the implementation of Enterprise Risk Management has a significant positive effect in reducing the political risk of the organization. H4 demonstrated that the implementation of Enterprise Risk Management has a significant effect in terms of reducing the health, safety, and environmental risk in an organization. H5 portray that the implementation of Enterprise Risk Management significantly improve the organization’s business performance.
Hypothesis H6 demonstrated that the business performance of an organization would be high if the operational risk is low. H7 regression result presents the effect of lower market risk in increasing the business performance of the organization. H8 portray that the impact of political risk on high organization’s business performance when it is low. H9 portray that the lower health, safety and environmental is, the higher the organization’s business performances.
Table 3 below summarizes the results of the regression analysis for the hypotheses.
Four hypotheses were established with the purpose of analyzing the impact on high business performance in the organization based on the lower operational risk; lower market risk; lower political risk; as well as lower health, safety, and environmental risk. These hypotheses range from H6, H7, H8, and H9. However, only H6, H7, and H9 are accepted because the generated results are proved to be having an inverse relationship while H8 is being rejected due to having a positive result rather than the expected result of being inversely related.
Discussion of Findings
The outcomes of the regression analysis for H1 indicates that the p-value is 0.000 (p < 0.05), in which refers to the existence of a significant relationship between the implementation or Enterprise Risk Management model and the operational risk of the organization. The result for R-value of Pearson coefficient is 0.596 for H1. The positive R-value of H1 portray that there is a positive relationship between the implementation of Enterprise Risk Management and operational risk of the organization that demonstrates that an increase in the practices of Enterprise Risk management will increase the business performance of the organization in terms of profitability, shareholder value as well as cost of capital. The value of R2 is 0.356, indicating that 35.6% of variance of dependent variable is explained by the independent variable. Thus, hypothesis H1 is accepted, stating that implementation of Enterprise Risk Management gives a significant impact on the operational risk of the organization.
The outcome of the analysis on H2 indicates that the implementation of Enterprise Risk Management has a positive and significant relationship with its effect on the market risk of the organization. The value of the correlation coefficient specified by R, as displayed in
Table 2, is 0.538. This value specifies that implementation of Enterprise Risk Management provide a significant impact on the market risk of an organization. The value of
R2 obtained from the analysis performed on H2 is 0.290, in which states that 29% variance in terms of market risk can be predicted through the usage of Enterprise Risk Management. The
p-value, on the other hand, shows the significance of the connection between the two variables as having the value of 0.000, in which aligned with
p < 0.05 that indicates a significant linear association between the implementation or Enterprise Risk Management and its impact on the organization’s market risk. Hence forward, hypothesis H2 is accepted that attesting implementation of Enterprise Risk Management have a significant effect on the market risk of an organization.
The result of the regression test on hypothesis H3 indicates that the implementation of Enterprise Risk Management has a significantly positive relationship to the political risk of the organization. The value of the correlation coefficient for H3 portrayed by R is 0.640, while the value of R2 is 0.410. The results indicate that 41% variance in market risk can actually be indicated through the implementation of Enterprise Risk Management, while ascertaining that the implementation of Enterprise Risk Management do give a significant impact on the political risk of an organization. The p-value obtained from the analysis is 0.000 (p < 0.05). This value indicates the presence of a significant linear association between the implementation of Enterprise Risk Management and its impact on the political risk of the organization. Hence, hypothesis H3 is accepted with the results demonstrating that the implementation of Enterprise Risk Management minimizes the political risk in the organization.
Hypothesis H4 stated that the implementation of Enterprise Risk Management has a significant impact on the health, safety, and environmental risk of the organization. The result displays that there is a significant relationship between the implementation of Enterprise Risk Management and health, safety, and environmental risk to be positive and significant. This is proven by the value of the correlation coefficient, R (0.397), which is obtained from the regression analysis performed. The value of R2 on the other hand is 0.158, in which refers to the fact that 15.8% variance in health, safety, and environmental risk can be predicted through the implementation of Enterprise Risk Management. The p-value of the regression analysis for H4 is 0.000 (p < 0.05). The value indicates that a significant linear association between the implementation of Enterprise Risk Management and its impact on health, safety, and environmental risk of the organization do exist. Hence, hypothesis H4 is accepted and states that ERM implementation gives a significant impact on the organization’s health, safety, and environmental risk. However, the value of Pearson coefficient, which is 0.397, is quite low. However, R-value is 0.397, with a positive sign in which it indicates that the existence of a positive relationship between both independent and dependent variables.
Hypothesis H5, on the other hand, stated that the implementation of Enterprise Risk Management has a significant impact on the business performance of the organization. H5 also display the results that indicate that there is a positive and significant relationship between the implementation of Enterprise Risk Management and business performance. The evidence is revealed by the value of the correlation coefficient, R (0.383) obtained from the result of regression analysis. The value of R2 for H5 is 0.137, in which refers to the fact that 13.7% of business performance’s variance can be indicated with the use of the implementation of Enterprise Risk Management. The p-value of the regression analysis for H5 is 0.000 (p < 0.05). This value states the existence of a significant linear association between the implementation of Enterprise Risk Management and its impact on business performance of the organization. Hence, hypothesis H5 is accepted and at the same time proving that ERM implementation gives a significant impact on the organization’s business performance. However, the value of Pearson coefficient, which is 0.383, is very low. This refers to the fact that the effect achieved through the implementation of Enterprise Risk Management on the business performance of the organization is quite weak, although the R-value is 0.383 with positive sign, in which indicates the existence of a positive relationship between both independent and dependent variables.
As shown in
Table 4, the results for five of the hypotheses in terms of the linear regression analysis showed that the Pearson correlation and regression co-efficient of ERM implementation are significant at
p < 0.05, in which indicates that the implementation of Enterprise Risk Management have a significant positive linear association with operational risk, market risk, political risk, business performance, as well as health, safety, and environmental risk. Thus, all five hypotheses testing the impact of the implementation of Enterprise Risk Management are accepted.
As shown in
Table 5, results for four of the hypotheses in terms of the linear regression analysis showed that the Pearson correlation and regression co-efficient of higher business performance are all in the positive range, in which a significant positive linear association with operational risk, market risk, political risk, as well as health, safety, and environmental risk. Thus, all four hypotheses testing the impact of all the variables on the business performance are rejected since the expected result are supposed to be inverse relationship.
Hypothesis H6, on the other hand, stated that the higher business performance in the organization can be achieved if the operational risk is lower. This hypothesis will definitely refer to an inverse relationship between the two variables. From the result of the regression analysis, the value of the correlation coefficient for H6 portrayed by R is 0.862, while the value of R2 is 0.743. The reason behind these results is that 74.3% variance in business performance can be indicated through the operational risk, while proving that the operational risk do give a significant impact on the business performance of an organization. The p-value obtained from the analysis is 3.001 (p > 0.05). This value indicates a very weak evidence of a significant linear association between the business performance and operational risk of the organization. Apart from that, the p-value obtained from the result is a positive value, whereas it is expected to be a negative value. Thus, hypothesis H6 is rejected with the results proving that the higher business performance will only be achieved with higher operational risk in the organization.
Hypothesis H7 stated that low market risk has a significant impact on higher business performance of the organization. The results indicate the connection between the implementation of Enterprise Risk Management and health, safety, and environmental risk to be inversely proportional and significant. The result had proven otherwise, whereby the p-value of the regression analysis for H7 is 0.6 (p > 0.05), in which indicates that a weak evidence of significant positive linear association between the market risk and its impact on the business performance. The value of the correlation coefficient, R is obtained from the regression analysis performed is 0.789. The value of R2 on the other hand is 0.622, in which refers to the fact that 66.2% variance in business performance of the organization can be predicted through market risk. Hence, hypothesis H7 is also rejected and proving that higher business performance in the organization can be achieved if the market risk is high.
Hypothesis H8 indicates that the political risk has an inverse relationship with its effect on the business performance of the organization. The value of the correlation coefficient specified by R, as displayed is 0.645. This value specifies that political risk do give a significant impact on the business performance of an organization. The value of R2 obtained from the analysis performed on H8 is 0.417 in which it states that 41.7% variance in terms of business performance can be predicted through the level of political risk. The p-value, on the other hand, shows the significance of the relationship between the two variables with the value of 0.004, in which aligned with p < 0.05 that indicates a significant linear association between political risk and its impact on the organization’s business performance. However, hypothesis H2 is rejected since the result is expected to be achieved from the analysis does not refer to the fact that higher business performance can be achieved with low political risk—an inverse relationship rather than positive.
H9 indicates that the health, safety, and environmental risk needed to increase the business performance of the organization. The value of the correlation coefficient specified is 0.763. This value specifies that health, safety, and environmental risk do give a significant impact on the business performance of an organization. The value of R2 that is obtained from the analysis performed on H9 is 0.582, in which states that 58.2% of business performance’s variance can be indicated by the level of health, safety, and environmental risk. The p-value of H9 analysis on the other hand, shows the significance of the relationship between the two variables of possessing the value of 0.204, in which aligned with p > 0.05, which indicates a weak evidence of a significant linear association between health, safety, and environmental risk, as well as its impact on the organization’s business performance. Therefore, hypothesis H9 will not only be rejected due to this, but also because of the fact that the result from the analysis was expected to be referring to the fact that higher business performance is achievable when the level of health, safety, and environmental risk is low, thus indicating an inverse relationship rather than positive.


