Crime Statistics: Modeling Theft in Favour of Victims’ Choices


Western Norway University of Applied Sciences, Department of Business Administration and Social Sciences, 5063 Bergen, Norway
*
Author to whom correspondence should be addressed.
Economies 2018, 6(2), 25; https://doi.org/10.3390/economies6020025
Submission received: 11 December 2017
/
Revised: 10 February 2018
/
Accepted: 27 March 2018
/
Published: 4 April 2018
Abstract
:The number of reported property thefts has dropped steeply in many European countries over the last 15 years. One reason for this could be that people have become more honest, which would imply that fewer resources should be allocated to the police and to crime prevention measures. In this paper, we have elaborated upon some alternative explanatory factors behind the decrease in the number of reported crimes within a utility-maximizing model where both thefts and victims are behaving rationally. Increased time and travelling costs for reporting, economic growth and a lower rate of solving crime could all explain the development in the reported crime rate. Within this theoretical approach, the nominal crime rate could decrease, while the real crime rate either remains constant or even increases. Applying the number of reported thefts as the sole or main parameter for allocating resources for crime prevention measures may result in a sub-optimal resource allocation. Developments in the number of reported thefts must therefore be supplemented by other indicators to provide a better basis to ensure an optimal allocation of police resources to combat theft. Estimates of unreported crimes must also be included as part of the basis of these allocation decisions.
1. Introduction
The current year, 2018, marks 50 years since the economist Gary Becker wrote his groundbreaking article Crime and Punishment: An Economic Approach in the Journal of Political Economy Becker (1968). Until Becker published his article, the study of crime had been an area that was to a large extent reserved for psychologists and sociologists and there existed many different theories that tried to explain the level of criminal activity. There was a wide span of explanatory variables provided by these theories, ranging from the shape of people’s skull and their biological inheritance to upbringing and social exclusion Becker (1974). In 1992, Gary Becker was awarded the Sveriges Riksbanks (The Central Bank of Sweden) Prize in Economic Sciences in Memory of Alfred Nobel “for having extended the domain of microeconomic analysis to a wide range of human behaviour and interaction, including nonmarket behaviour” Nobelprize.org (2017).
The novelty of Becker was that he did not regard criminals as people with mental or social problems. Instead, he regarded them as rational utility-maximizing individuals who make a compromise between possible losses and possible gains and on this basis decide whether to engage in criminal activities or not. The starting point for Becker is the expected benefit () of committing a crime (j). Becker defined the expected benefit as follows:
where is the probability that one is punished for the crime, is the physical plus the mental yield measured in money while is the penalty measured in money. In the wake of Beckers theory, a large field of international research on crime has emerged. Economists have contributed to a greater understanding of the field. There has been a development of: normative models for the assessment of criminal laws and crime prevention, quantitative methods to analyze the causes of criminal activity and the impact of crime prevention measures, models to explain criminal behavior and methods for aggregating criminal activity to macro level in order to analyze crime patterns and their consequences for society Marie (2014).
There is an extensive literature on crime and crime prevention. However, only a small part of this literature has focused on the victims of the criminal activity. K. K. Sieberg says:
Victims are treated simply as witnesses. They are compelled to appear in court and testify, often at great risk of physical danger, embarrassment, and emotional trauma. They are paid a witness fee…and then forgotten.
In Sieberg’s book Criminal Dilemmas we find one of the relatively few articles that deal with problems concerning the victims of a crime. The problem he deals with is this: Assume that the victim receives compensation, either from the insurance company or from local authoritities and, in addition, he gets back the value of what he lost in the robbery. How much compensation should be made to the victim leaving him/her indifferent to being a victim of the crime and not? The answer is obtained by using the following equation:
The left side of Equation (2) represents the situation where the victim is not subject to any criminal act and is still in possession of the goods of value X with 100 percent certainty. The right side of Equation (2) is the expected outcome of a lottery where the victim with probability p will get the value of the goods X along with an additional compensation. The key point of the model is to show that, if the victim receives an overcompensation E, he might lie about the size of the loss—that is, the victim himself becomes a criminal—or he might use fewer of his own resources to look after his belongings. The latter problem is well known by insurance companies Gaute (1998).
Like Sieberg, we will focus on the victim, but we will have a different approach and try to explain why so many crimes are not reported, and discuss the possible consequences for the society’s use of resources when crimes are not reported.
The rest of this paper is structured as follows: First we will explain the existing research in this field. Then we will present the analytic model and discuss its limitations and extensions. Thereafter, we will present the results that can be deducted from the model and, finally, the results will be discussed.
2. Thefts and Reported Thefts
Table 1 shows the change in reported crimes in 34 European countries from 2008 to 2015. In 26 countries, the number of reported crimes per hundred thousand inhabitants decreased while in eight of the countries it increased Eurostat (2017). Norway is not on this list, but during the period 2003–2016, reported property thefts in Norway declined by 45 percent Anmeldte Lovbrudd (2017). This is a remarkable result because there was both a population growth and a per capita GDP growth in the same period, of respectively 15 and 68 percent Årlig Nasjonalregnskap (2017).
Empirical research indicates that a significant share of the property thefts are not reported. In a survey among Norwegian companies conducted by The Norwegian Business and Industry Security Council (NSR) in 2017, 10 percent of the businesses answered that, in the past year, their company has been subjected to crimes that they did not report Næringslivets Sikkerhetsråd (2017) and, in a survey in 2012, almost half of the members of the NLF (the Norwegian Truck Owners Federation) said that they did not find it appropriate to report theft of diesel Dokumentar (2016). As the two studies above indicate, there may be a big difference between the number of crimes committed and the number of reported crimes.
In the following we will—on the basis of basic microeconomic theory—develop a simple model that can give an explanation of why so many people choose not to report thefts.
2.1. The Variables and Assumptions of the Model
In the following we will use these symbols:
We assume that the victim has complete information about the following matters:
- The value (V) that the victim will get back if the thief is caught by the police. In many cases, the object will be damaged and the object may be completely worthless. Anyway, we assume that the victim can estimate the extent of the damage measured in money.
- The time spent on reporting the crime (t).
- The cost per hour the victim must use to report the theft (a). These costs will probably depend on the victim’s income and wealth, but in this paper, these costs are assumed to be constant and therefore independent of income and wealth.
- All other time-independent costs were incurred if the victim reports the theft (b). Non-material losses in the form of reduced welfare due to fear of retaliation from the criminals are included. In some other countries, but not in Norway, a fee payment to the police station is required for being allowed to report a crime.
- The subjective probability that the police will solve the case (p). When we use the term ”subjective probability”, we mean the probability that the victim believes is the correct one. This may be identical to the empirical clarification percentage, but it does not have to be.
The entire population of potential victims are all private individuals plus all businesses. This population can be divided into two groups: Those who have insured their assets against theft and those who have not done so. We start with the group that has insurance.
We also assume the following timeline: At time , the crime happens. At a later date (), the victim receives information about the value of the stolen object if the police solve the case and he is handed back the object. The victim is also able to get information about the time needed for reporting the theft, cost per hours of reporting, and all other time-independent costs, and finally he estimates the likelihood that the theft will be solved. Based on this information, he decides whether he should report the theft or not.
2.2. Model for Reporting Thefts
Becker’s starting point was that the criminals are rational utility-maximizing individuals Becker (1968). We assume that the same applies to the victims. The theft will only be reported if that is expected to increase the utility of the victim.
It is said that any decision problem has a moral dimension Ekeland (2003), but we disregard this and make no attempt to enter any moral scruples into the model. To report a theft is not without any costs. The victim must in many cases travel to the police station, maybe he needs to wait at the counter and it takes time to make a statement. The time he spends on these activities represents an alternative cost that could be substantial if he has to take time off from work. Many people also put a high price on leisure. We assume that the time cost per hour is constant and equal to a and that the victim uses t hours to report the theft. The total time cost is thus .
In addition to the time costs, other direct costs may occur if the victim reports a crime. Perhaps the victim must travel a long way to the police station; this may be quite time-consuming. The victim may also feel discomfort if he reports a crime. For example, the victim may be afraid of retaliation if the crime is reported. For this reason, the victim feels unsafe if he a reports the theft. The feeling of insecurity creates a loss of welfare and this loss measured in terms of money plus other direct costs related to the reporting are supposed to equal b. Thus, the cost of reporting a theft is:
The victim has a subjective estimate of the probability that the police will solve the case. We call this subjective probability p. The empirical counterpart of p is the detection rate as one may find in public records.
When the probability of detection is p, the probability of non-detection equals . The expected value of reporting a crime then becomes:
The utility of reporting a crime U is the expected value of reporting minus all costs. By Equations (3) and (4), we get:
By putting in Equation (5), we find the victim’s status quo indifference curve. Below we call combinations of the value the victim gets back if the theft is solved by the police, i.e., the value of the stolen item, and the probability of that happening for and respectively. We get:
To concretize we will assume that the victim sets a price on time to 200. Furthermore, we assume that the victim spends 2 h on reporting a crime and that other costs are 100. We then get this status quo utility line:
Figure 1 the status quo indifference curve in the plane.
According to our definition, is the smallest value the victim must get in order for him to report the theft when the subjective clarification probability is . Thus, we have:
The minimum return value is a function of the time cost , other costs and the detection probability such that when the time cost or other costs increase, will increase. The subjective clarification probability has the opposite effect. When increases, the smallest required return value goes down. Based on the discussion above, we can say that the number of reported crimes (the nominal crime rate ) is a function of the minimum return value . Thus, we have the following relationship:
The nominal crime—number of crimes that appear in the records—goes down when the price of time, time spent on reporting, or when other costs related to reporting the crime increases. Conversely, it goes up if the subjective clarification probability increases.
Example: Changes in Reporting Costs
Costs related to the reporting of crime increase with increased time the victim has to spend on reporting the crime because of increased cost of time or due to other reasons such as reduced welfare because of fear of retaliation. If we assume that the time spent on reporting a crime goes up, the indifference curve shown in Figure 1 will move outwards in the plane. This means that the amount of combinations of p and V which do not result in a report will increase. This means that the nominal crime rate will go down. This is shown in Figure 2.
If that occurs, one possible scenario could be a centralization of the police administration leading to the closure of local police stations. Then victims have to travel further and thus take more time to report a crime. On the other hand, the police might become more effective which, after a while, will affect the subjective clarification probability. If we have multiple simultaneous changes, we will only observe the effect of the sum of the changes. Based on the model, it is not difficult to imagine that we could have a simultaneous decline in the nominal crime and an increase in the real crime rate.
The main point of the model is to show that there could be several possible causes of a decline in the nominal crime rate. Several factors often work at the same time and we only observe the sum of the effects.
2.3. The Impact of Insurance
Above we looked at a group that had not been insured against theft. Now we look at the group that is covered by an insurance against theft. Insurance companies often require that the crime is reported if a customer is to be compensated for a theft. The question then is: Will all those who have insured themselves against theft report the theft?
We have examined the conditions of insurance against theft in three Nordic insurance companies If, Frende and Trygg. It is tempting to believe that this companies have harmonized their insurance compensation rules because the structure of the terms are identical for both insurances directed at the corporate market and for insurances for households: All companies cover customer’s losses beyond a certain deductible part. In Equation (9) below, we state a relationship that must apply when we assume that the items have an expected return value of zero. A positive expected return value will only make the terms more comprehensive and not change the conclusion. In the same context as above, we can now formulate the following relationship between the minimum value , the deductible part E and reporting costs to the police () and the cost of reporting to the insurance company ():
where is the time it takes to report the theft while is the time it takes to report the theft to your insurance company while and are other costs related to reporting to the police and to the insurance company. The total reporting costs can be considerable and these costs do depend on the item. It could also be difficult for the victim to estimate the value of the stolen item. This is quite easy when it comes to standardized and frequently sold items, such as bicycles, where the victim has got a receipt which when he/she bought the item. Far worse is if the stolen item is a valuable painting that the victim has inherited. Here, one may obtain a certificate from a certified art dealer to document the value of the painting, but this could be time-consuming and is not costless.
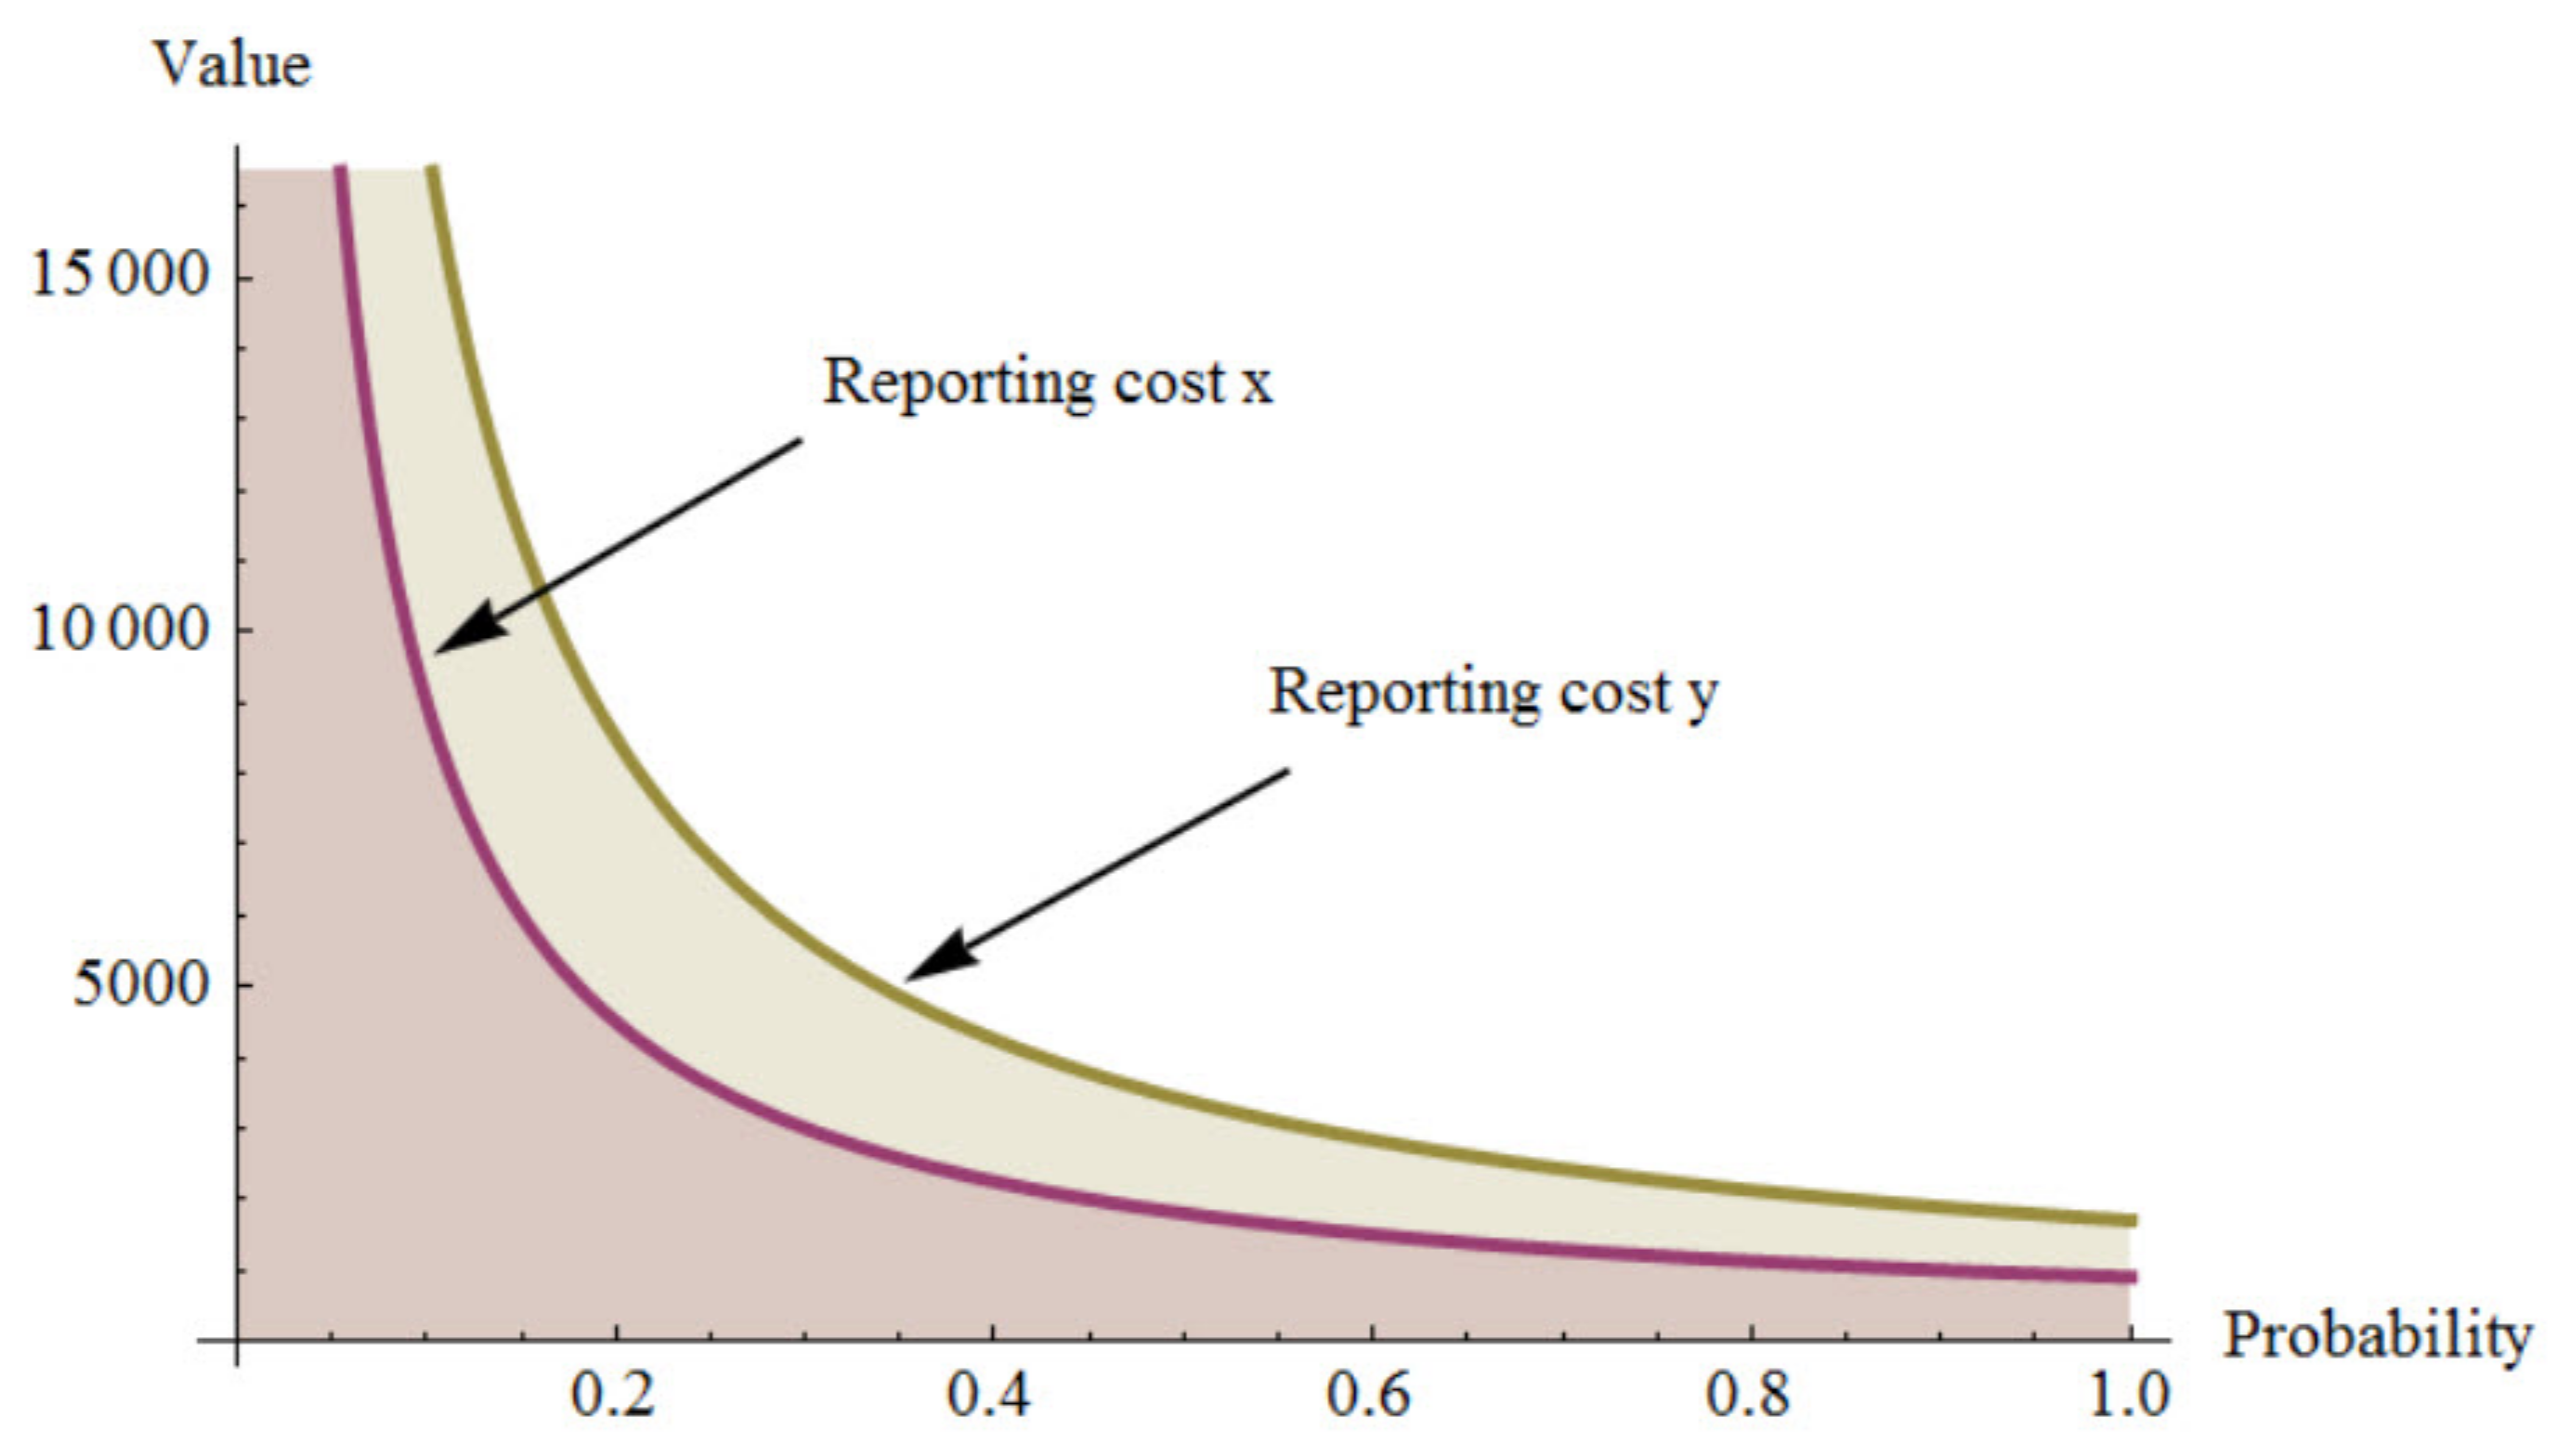
If the victim has insurance against theft, the indifference curve—with the assumptions that we have made—will be independent of the subjective clarification probability. Figure 3 shows the indifference curve in the -plane. Only combinations of V (value) and t (time) which are above this line will be reported.
Insurance premiums can vary significantly between insurance companies, but all the companies distinguish between the corporate market and the market for private households. When it comes to households, the standard deductible on their insurance police is NOK 4000 in Norway (about 400 Euros) for bicycle theft and theft of items with a similar value. A standard deductible of 4000 NOK is also the smallest deductible amount that insurance companies allow. A deductible of zero is therefore not possible. The theoretical rationale is explained in the literature Gaute (1998). Customers may request a higher deductible and get a reduction in insurance premiums. One of the companies stated that they had private clients who had deductible of 50,000 NOK, but most people choose the standard rate of 4000 NOK.
The standard deductible in the corporate market was 10,000 NOK for polices in all three insurance companies. Some customers—for a higher insurance premium—request a lower deductible (minimum 4000 NOK), but 80–90 percent of customers choose the standard rate of 10,000 NOK. As illustrated in Figure 3, the size of the excess is of great importance for the number of thefts that is not reported. If the deductible increases, the indifference curve is shifted upwards and fewer thefts will be reported.
Whether the victim has insurance or not, we arrive at the same conclusion: When the victim has utility maximization as the goal, a large number of crimes are not reported. Below, we will discuss the impact this may have on resource allocation in society.
3. Crime, Resources and Information
In theory, a competitive market maximizes the social value. In markets where one or more of the prerequisites for the competitive market is not met, this could lead to market failures and misallocation of resources if the authorities are unable to make corrections in the market solution.
One of the central prerequisites for the competitive market is that all market agents have full information on all relevant market characteristics, such as prices and other market conditions. If the public sector wants to produce a good, the problem is often lack of correct information about the demand for goods.
Many public goods are not sold on the market and the marginal willingness to pay for the good is difficult to determine. When the provider of a good does not have accurate information about the demand, there is a significant possibility that the amount of resources used in the production of that good is not optimal. The consequence of incomplete information is discussed by Just et al. (2004), while the problems facing the public sector when trying to determine the optimal use of resources in producing public goods are treated by Atkinson and Stiglitz (1987). In the analyses below, we will see how inadequate information about crime in society can lead to suboptimal use of resources.
3.1. The Optimum Amount of Crime Prevention
There are many types of offences, but we focus on only one: Property thefts. Thefts are the most common crime and thieves are the largest group of offenders Green (2012). When we apply the term crime prevention in this paper, we mean all measures taken by the government to counteract and prevent property theft.
We have previously defined the real crime rate () and the nominal crime rate (). We assume that the marginal willingness to pay for crime prevention () depends on the real crime rate in society () and the amount of crime prevention (x) that the government provides:
For a given amount of crime, there is a relationship between the marginal willingness to pay and the amount of crime prevention. We assume a decreasing demand function. When crime increases, we get a positive shift in the marginal willingness to pay for crime prevention. This is illustrated in Figure 4 below.
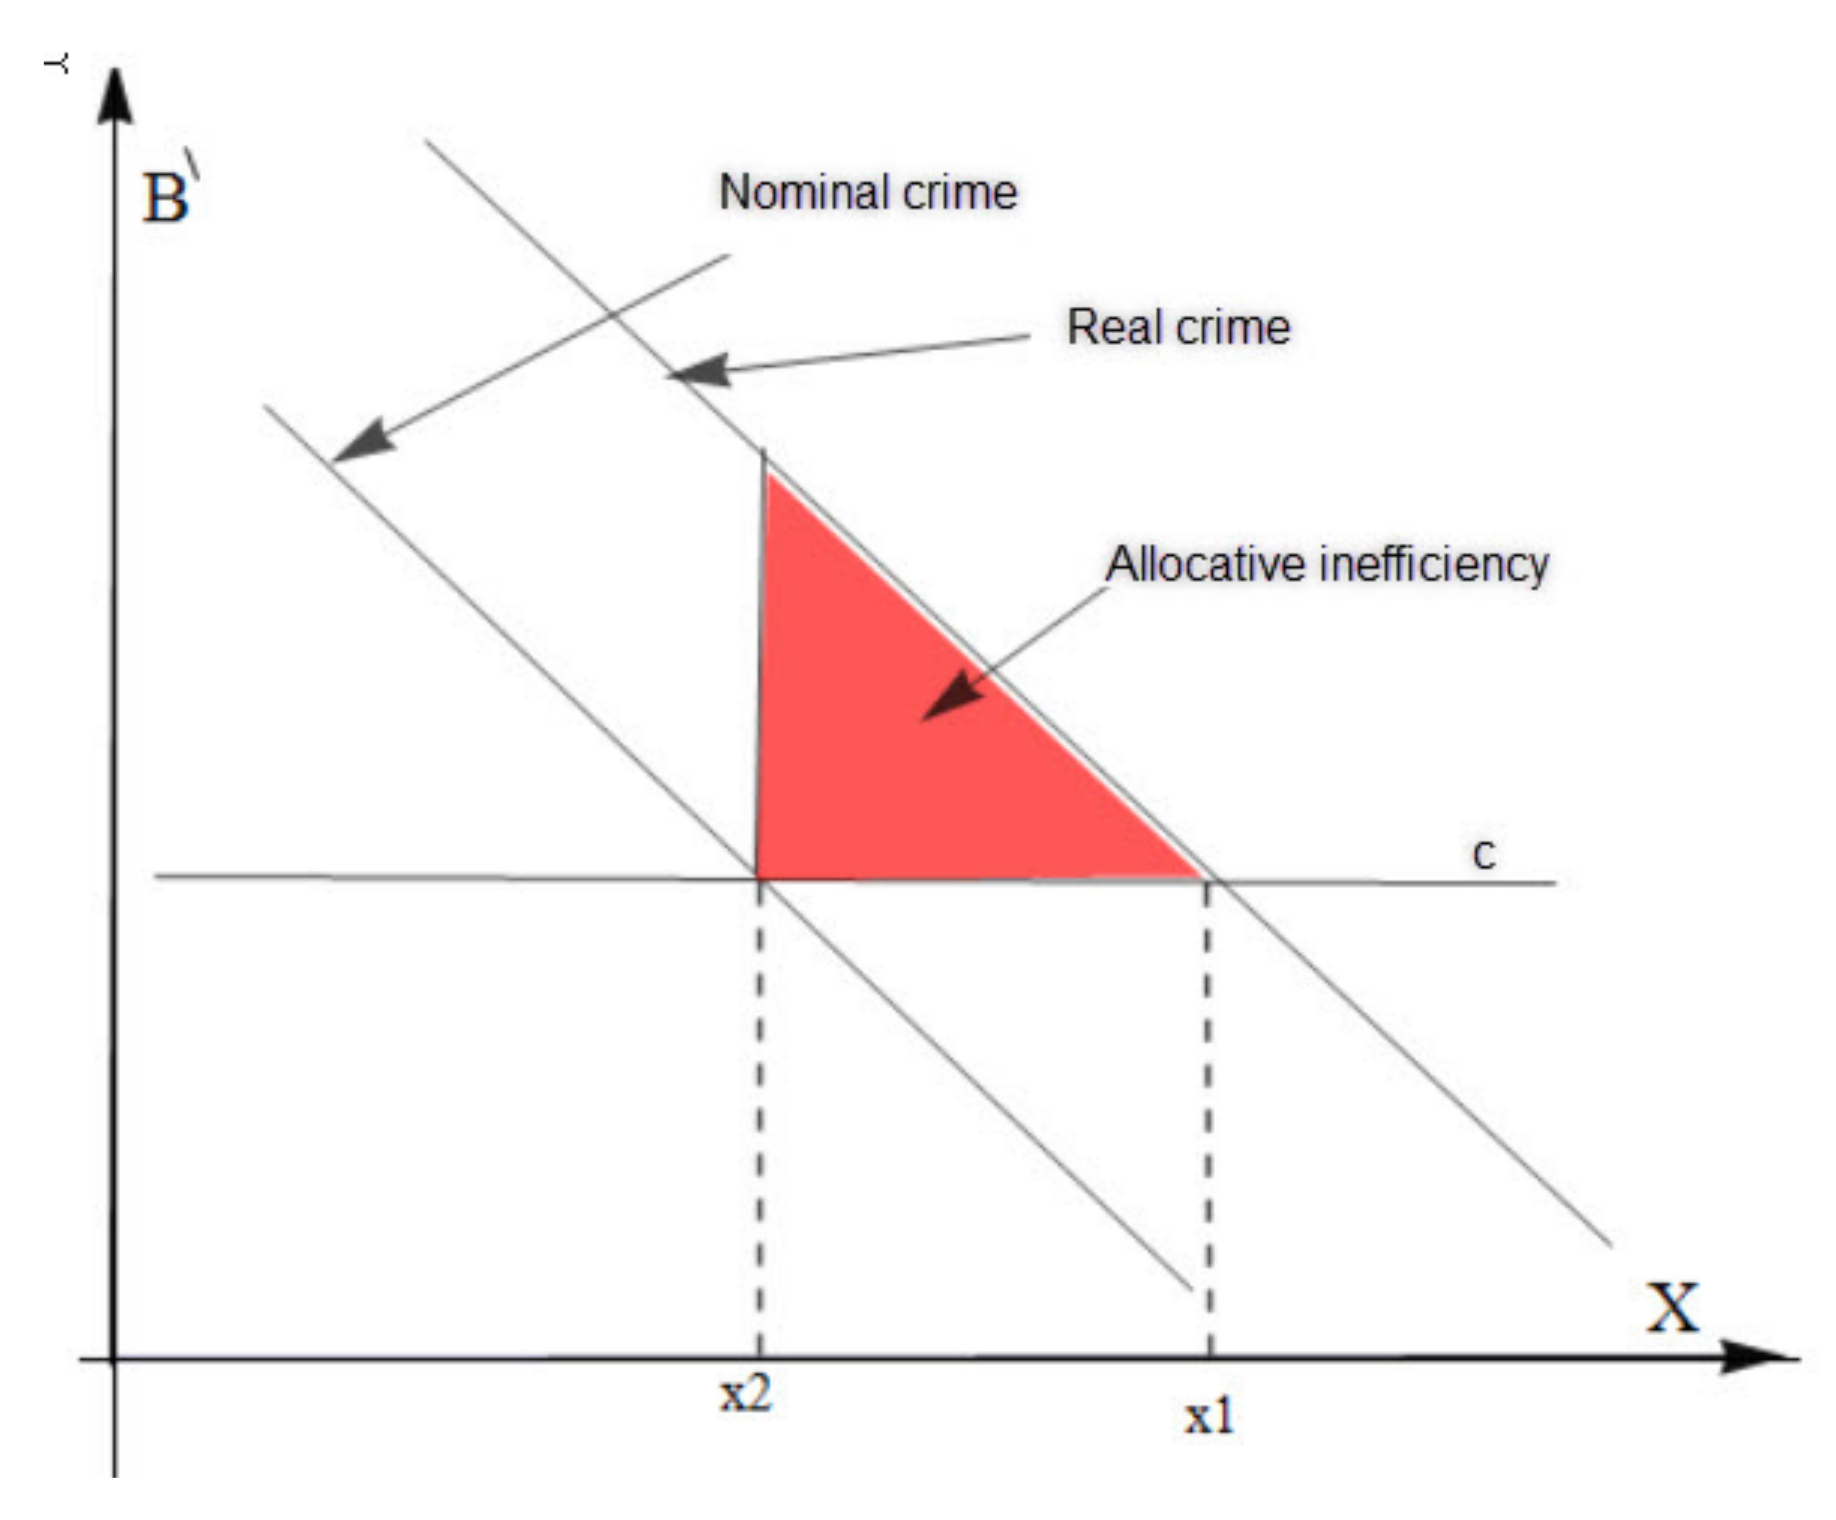
Let us now assume that the public sector, i.e., the authorities, has complete information about the amount of real crime. With correct information, we assume that public sector can also find the correct marginal willingness to pay for crime prevention. According to basic economic theory Gravelle and Rees (2004) we find the optimum level of production where the marginal willingness to pay for the good in question equals the social marginal costs. If the social marginal costs are constant and equal to c, we get optimal production when . The optimum output is set to x1 in Figure 5.
The real crime rate is not possible to observe. The authorities can only observe the nominal crime rate. Let us now assume that the nominal crime rate is less than the real crime rate for all crime levels. If the authorities—in the absence of accurate information—assume that the nominal and the real crime rates are equal and determine the marginal willingness to pay for crime prevention based on the nominal crime rate, the provision of crime prevention may be too low. The society will then suffer a loss, due to a suboptimal production of crime prevention activities. Production in this case (x2) and the economic loss is shown in Figure 5.
Example: Assume that the actual marginal willingness for crime prevention is where a and b are constants so that and and x is the provision of crime prevention activities. Let us further assume that marginal costs are constant and equal to c. This provides an optimum production .
Let us now assume that the government does not have accurate information about crime in society but they wrongly assume that the real crime rate equals the nominal crime rate. The authorities then assume that the marginal willingness to pay is . Where . This will give a provision of crime prevention activities equal to because , then . The provision of crime prevention activities will be less than the optimum provision , implying that the market solution is suboptimal. The situation is illustrated in Figure 5.
3.2. The Impact on Resource Usage
If the government determines the use of resources and thus the provision crime prevention activities (x) based on the nominal crime rate, we get:
Here, b is the sum of other costs related to reporting the crime to the police and to the insurance company. t is the victim’s time spent on reporting the crime. Equation (11) applies whether the victim has insured his/her assets or not.
Suppose that the real crime rate is unchanged but there is economic growth. In this case, the opportunity cost of time increases. This will lead to fewer reported crimes and a lower nominal crime rate. If allocation of resources to prevent criminal activities are positively correlated to the nominal crime rate, than fewer resources are allocated to crime prevention and a larger loss in social benefit will occur.
We can also imagine more bizarre results: Suppose politicians centralize the police force in rural areas. This means that it will be more awkward for victims to report crimes because the costs of reporting go up. Thus, the nominal crime rate goes down. The centralization of the police force could then seem to be successful because of the decreased nominal crime rate. Thus, there will also be a reduction in the resources allocated to the police and consequently a loss in social benefit.
However, the police force is probably aware of the risk of using the nominal crime rate as an indicator for allocation of resources to their activities. In a report from the Oslo Police District in 2017, it is stated that: “The decline in the recorded criminal activities may be due to a declining proportion reported to the police”. Criminal records are in this case a bad source of knowledge Sætre et al. (2017). Another report, also from the Oslo Police District, from 2014 states:
In addition, one must assume a significant amount of unrecorded crimes. Recorded criminal activities do not show the real crime rate since this type of criminal activity (pickpocketing) does not imply big losses for the victims. The data are therefore not applicable for generalizations about pickpocketing as a social problem.
In the decades following Becker’s famous article, rational choice theory has become a dominant theory for analyzing factors influencing crime rates and the individual decisions as to whether it will be beneficial to commit a crime or not. At the core of this theory, which mirrors the classical economic theory concerning consumers utility-maximizing behavior and firm’s profit-maximizing attitude, is the assumption that an individual is weighing his/her personal present and future gains against all of the present and future costs before committing a crime. The potential gains could be financial, e.g., increased wealth from possessing or selling stolen items, or social, such as higher marital and social class. The potential costs could be financial, such as repayment to victims and fees to the police, lost present and future income from work, lost future job opportunities and business associate and the costs could be social, for example, loss of freedom and family/friends while in prison and loss of social reputation and trust.
An extensive paneldata-study conducted on US-adolescence, found that offenders’ behaviour responded to changes in perceived benefits and costs of committing a crime that was in full compliance with the rational choice theory Loughran et al. (2016). Severity of sanctions, and personal and social rewards positively affected an individual’s propensity to commit a theft or a robbery, while the degree of certainty regarding apprehension had a negative effect. Pezzin found that higher earnings from criminal activities was positively correlated to future duration of such activities Pezzin (1995) while Piliavin et al. found that for different groups of offenders, their criminal activity was positively affected by anticipated rewards and negatively affected by anticipated costs and punishment Piliavin et al. (1986). Many aspects of punishment such as the probability of being arrested, probability of conviction, and probability of imprisonment have a negative impact on crime rate, while the number of police officers and wages in legal activities had a positive, significant effect on a person’s criminal activity. This was shown by Cornwell and Trumbull (1994) and Baltagi (2006). Individuals with a low level of human capital (i.e., small potential for learning) and with high discount rates, (i.e., low assessment of future costs) have significantly higher incentives for committing a theft while low opportunity costs at the time when the act of crime is committed has no significant effect Williams (2017).
The theory of rational choice applied in crime economics has been elaborated and modified by Cornish and Clarke (1986). During the last 30 years, the theory has been contested for its presumption of an offender’s rationality. The critics argue that some criminal activities, in particular sexual crimes and acts of violence, are rooted in basic biological instincts De Haan and Vos (2003) and many criminal activities are conducted in affection without rational calculations of pros and cons, like effectual manslaughter Matsueda (2013). Some results from psychological studies Akerlof and Dickens (1982), Dickens (1986), are contradictory to the theory of rational choice. In crime-economic models which incorporate cognitive dissonance, increased punishment could decrease law-compliance because severe punishment will reduce criminals uncertainty about type and magnitude of the law enforcement and thereby reduce their internal justification for being law-obedient. However, some of the extreme interpretations have been modified in new models of criminal behavior based on the theory of rational choice by restricting the time span when decisions about whether to conduct a criminal act or not are taken or to restrict the costs and benefits under consideration Simon (1978), LeClerc and Wortley (2013).
The theory of rational choice has also been applied to analyze the victim’s propensity to report the crime Skogan (1984), Gottfredson and Gottfredson (1987). Based on panel data from Crime Victims Surveys, Garoupta and Bowles et al. found that the propensity of reporting a crime is positively correlated with the loss entailed by the crime and the costs related to reporting the crime and to the intimidation of the victim is of particular importance for the reporting rate Bowles et al. (2009). The propensity to report will also depend on reporting mode, and the possibility of applying the web instead of the telephone in reporting a crime could increase the reporting rate Lasley and Palombo (1995). On the other hand, a study conducted by Alarid and Novak suggests that citizens prefer the phone over the Internet while reporting a crime Alarid and Novak (2008). Reporting a crime will increase the risks of retaliation and to be intimidated by the offender and a variety of witness protection programmes indicates the positive relationship between the victim’s feeling of being taken care of and protected and his/her propensity to report a crime Avail Consulting (2004), Singer (1988). The costs of reporting will be compared to the benefits for each individual in their assessments on whether to report a crime or not. The indirect benefit from reporting could result from the fact that reporting a crime could alert the police about the ”high” criminal rate in the area and thereby increase their use of resources to protect citizens in this neighborhood Goudriaan et al. (2006), Starrett et al. (1988). The indirect effect could be caused by a rejection effect as well. When victims report a crime, potential offenders will be aware of the fact that crimes in that neighborhood are, to a large extent, reported, which will increase the probability of being caught.
The direct benefit of reporting is partly due to the fact that it is mandatory for a victim to report a theft in order to claim for compensation from the insurance company. In addition, the probability of getting the stolen items back will increase when reporting if the police are willing to investigate the crime.
The willingness to report is highest when all modes of reporting are available, less time is needed or fewer resources are used for reporting and when police officers encourage victims to report Tolsma et al. (2012).
4. Conclusions
Sometimes, in order to assess a situation, economists are given the task to answer two questions: A positive question; How is it? and a normative question; How should it be? For example, mapping of how politicians and the head of police allocate resources to crime prevention is a comprehensive task. We are not able to find an exhaustive amount of economic research in this area. That does not mean that this field is unimportant. This article is intended to contribute to the debate about how it should be, while showing that criminal records will always underestimate the real crime rate as long as the victim’s pursue a utility-maximizing behaviour.
In order to determine the optimal use of resources allocated to crime prevention measures, the authorities are dependent on accurate information about the crime rate. If the authorities—in the absence of accurate information—use the number of reported crimes to decide the resource allocation to crime prevention measures, there may be a loss in social welfare because some fraction of the criminal activity is not reported and the nominal crime rate may vary for several reasons.
If the victim is utility-maximizing, the criminal act will only be reported if the victim’s expected benefit of reporting exceeds the costs. Even when the real crime rate does not change, we may observe a decrease in the number of reported crimes when the time it takes to report the crime increases. The same will happen if the price of time increases and if other costs related to reporting a crime increase. The fraction of crimes which are reported will also decrease if people feel less confident that the police will be able to solve the case. If the victim is insured, the rate of reporting will go down if the deductible or the reporting costs increase.
Without exact information about the real crime rate, applying the nominal crime rate for the purpose of allocating resources to combat criminal activities will probably result in a suboptimal allocation with a loss of social benefit. Criminal records should be supplemented by other social science research in order to achieve a more solid basis for making a better allocation of resources to the police.
Acknowledgments
To our wives who stole our hearts.
Author Contributions
Both authors contributed equally to this work
Conflicts of Interest
The authors declare no conflicts of interest.
References
- Akerlof, George A., and William T. Dickens. 1982. The Economic Consequencies of Cognitive Dissonance. American Economic Review 72: 307–19. [Google Scholar]
- Alarid, Leanne F., and Kenneth J. Novak. 2008. Citizen’s views on using alternate reporting methods in policing. Criminal Justice Policy Review 19: 25–39. [Google Scholar] [CrossRef]
- Atkinson, Antony B., and Joseph E. Stiglitz. 1987. Lectures on Public Economics. Singapore: McGrow-Hill Book Co. [Google Scholar]
- Avail Consulting. 2004. No Witness, No Justice (NWNJ). Pilot Evaluation: Final Report. October 29. Available online: http://www.cps.gov.uk/publications/docs/NWNJ_pilot_evaluation_report_291004.pdf (accessed on 10 October 2017).
- Baltagi, Badi H. 2006. Estimating an economic model of crime using panel data from North Carolina. Journal of Applied Econometrics 21: 543–47. [Google Scholar] [CrossRef]
- Becker, Gary S. 1968. Crime and Punishment: An Economic Approach. Journal of Political Economy 76: 169–217. [Google Scholar] [CrossRef]
- Becker, Gary S. 1974. Essays in the Economics of Crime and Punishment. Cambridge: National Bureau of Economic Research. [Google Scholar]
- Bowles, Roger, Maria Garcia Reyes, and Nuno Garoupa. 2009. Crime Reporting Decisions and the Costs of Crime. European Journal of Criminal Policy Research 15: 365–77. [Google Scholar] [CrossRef]
- Cornish, Derek B., and Ronald V. Clarke, eds. 1986. The Reasoning Criminal. Rational Choice Perspectives on Offending. New York: Springer Verlag. [Google Scholar]
- Cornwell, Christopher, and William N. Trumbull. 1994. Estimating the economic model of crime with panel data. Review of Economics and Statistics 76: 360–66. [Google Scholar] [CrossRef]
- De Haan, Willem, and Jaco Vos. 2003. A crying shame: The over-rationalized conception of man in the rational choice perspective. Theoretical Criminology 7: 29–54. [Google Scholar] [CrossRef]
- Dickens, William T. 1986. Crime and Punishment Again: The Economic Approach with a Psychological Twist. Journal of Public Economics 30: 97–107. [Google Scholar] [CrossRef]
- NRK Dokumentar. 2016. Raser over Henlagte Dieseltyverier—Dokumentar—NRK. Available online: https://www.nrk.no/dokumentar/xl/raser-over-henlagte-dieseltyverier-1.12866040 (accessed on 7 December 2017).
- Ekeland, Ivar. 2003. Tilfeldighetenes Spill. Oslo: Pax Forlag. [Google Scholar]
- Eurostat. 2017. Crime and Criminal Justice Statistics. Available online: http://ec.europa.eu/eurostat/statistics-explained/index.php/Crime_and_criminal_justice_statistics (accessed on 8 December 2017).
- Gaute Torsvik. 1998. Informasjonsproblem og Økonomisk Organisering. Bergen: Fagbokforlaget. [Google Scholar]
- Gottfredson, Michael R., and Don M. Gottfredson. 1987. Decision Making in Criminal Justice: Toward the Rational Exercise of Discretion, 2nd ed. Springer: Berlin. [Google Scholar]
- Goudriaan, Heike, Karin Wittebrood, and Paul Nieuwbeerta. 2006. Neighbourhood characteristics and reporting crime: Effects of social cohesion, confidence in police effectiveness and socio-economic disadvantage. British Journal of Criminology 46: 719–42. [Google Scholar] [CrossRef]
- Gravelle, Hugh, and Ray Rees. 2004. Microeconomics, 3rd ed. Toronto: Pearson Education Canada. [Google Scholar]
- Green, Stuart P. 2012. Thirteen Ways to Steal a Bicycle: Theft Law in the Information Age. Cambridge: The President and Fellows of Harvard College. [Google Scholar]
- Hofseth, Christina, Marianne Sætre, and Veslemøy Grytdal. 2014. Vinningslovbrudd i Oslo 2012/2013. Omfang og Gjerningspersoner—Med Vurdering av Kunnskapen. Oslo: Oslo Politidistrikt. [Google Scholar]
- Just, Richard E., Darrell L. Hueth, and Andrew Schmitz. 2004. The Welfare Economics of Public Policy. Cheltenham: Edward Elgar Publishing. [Google Scholar]
- Lasley, James R., and Bernadette Jones Palombo. 1995. When crime reporting goes high-tech: An experimental test of computerized citizen response to crime. Journal of Criminal Justice 23: 519–29. [Google Scholar] [CrossRef]
- LeClerc, Benoit, and Richard Wortley, eds. 2013. Cognition and Crime: Offender Decision-Making and Script Analyses. London: Routledge. [Google Scholar]
- Loughran, Thomas A., Ray Paternoster, Aaron Chalfin, and Theodore Wilson. 2016. Can Rational Choice Considered a General Theory of Crime? Evidence From Individual-Level Panel Data. Criminology 54: 86–112. [Google Scholar] [CrossRef]
- Marie, Olivier. 2014. Lessons from the Economics of Crime. CentrePiece Winter 2013/14. London: The London School of Economics and Political Science. [Google Scholar]
- Matsueda, Ross L. 2013. Rational choice research in criminology: A multi-level framework. In Handbook of Rational Choice Social Research. Edited by R. Wittek, T. Snijders and V. Nee. Palo Alto: Stanford University Press. [Google Scholar]
- Næringslivets Sikkerhetsråd. 2017. Kriminalitets- og Sikkerhetsundersøkelsen i Norge 2017 (Krisino). Available online: https://www.nsr-org.no/publikasjoner/ (accessed on 5 December 2017).
- Nobelprize.org. 2017. Available online: http://www.nobelprize.org/ (accessed on 29 September 2017).
- Pezzin, Liliana E. 1995. Earnings prospects, matching effects, and the decision to terminate a criminal career. Journal of Quantitative Criminology 11: 29–50. [Google Scholar] [CrossRef]
- Piliavin, Irving, Rosemary Gartner, Craig Thornton, and Ross L. Matsueda. 1986. Crime, deterrence, and rational choice. American Sociological Review 51: 101–19. [Google Scholar] [CrossRef]
- Sætre, Marianne, Christina Hofseth, Ingjerd Hansen, and Anne Bakosgjelten. 2017. Trender i Kriminalitet 2016–2017. Utfordringer i den Globale Byen. Oslo: Oslo Politidistrikt. [Google Scholar]
- Sieberg, Katri K. 2005. Criminal Dilemmas. Understanding and Preventing Crime. Berlin/Heidelberg: Springer-Verlag. [Google Scholar]
- Simon, Herbert A. 1978. Rationality as Process and Product of Thought. American Economic Review 8: 1–11. [Google Scholar]
- Singer, Simon I. 1988. The fear of reprisal and the failure of victims to report a personal crime. Journal of Quantitative Criminology 4: 289–302. [Google Scholar] [CrossRef]
- Skogan, Wesley G. 1984. Reporting crimes to the police: the status of world research. Journal of Research in Crime and Delinquency 21: 113–37. [Google Scholar] [CrossRef]
- Starrett, Richard A., Michael P. Connolly, James T. Decker, and Adelina Araujo. 1988. The crime reporting behavior of Hispanic older persons: A causal model. Journal of Criminal Justice 16: 413–23. [Google Scholar] [CrossRef]
- Statistics Norway. 2017. Annual National Accounts: 1970- (CSV files). Available online: https://www.ssb.no/nasjonalregnskap-og-konjunkturer/tabeller/nr-tabeller (accessed on 10 September 2017).
- Statistics Norway. 2017. Offences reported to the police. Available online: https://www.ssb.no/sosiale-forhold-og-kriminalitet/statistikker/lovbrudda (accessed on 10 September 2017).
- Tolsma, Jochem, Joris Blaauw, and Manfred Te Grotenhuis. 2012. When do people report crime to the police? Results from a factorial survey design in The Netherlands, 2010. Journal of Experimental Criminology 3: 117–34. [Google Scholar] [CrossRef]
- Williams, Geoffrey. 2017. The Thief’s Wages: Theft and Human Capital Development. Oxford Economic Papers. Oxford: Oxford University Press. [Google Scholar]
Figure 1.
The status quo indifference curve that makes the victim indifferent to reporting and not reporting a crime. In the example, the price on time is 200. The time to report the crime is 2 h and other costs are 100. The shaded area represents combinations of expected return values V and subjective clarification probabilities p that leaves the theft unreported.
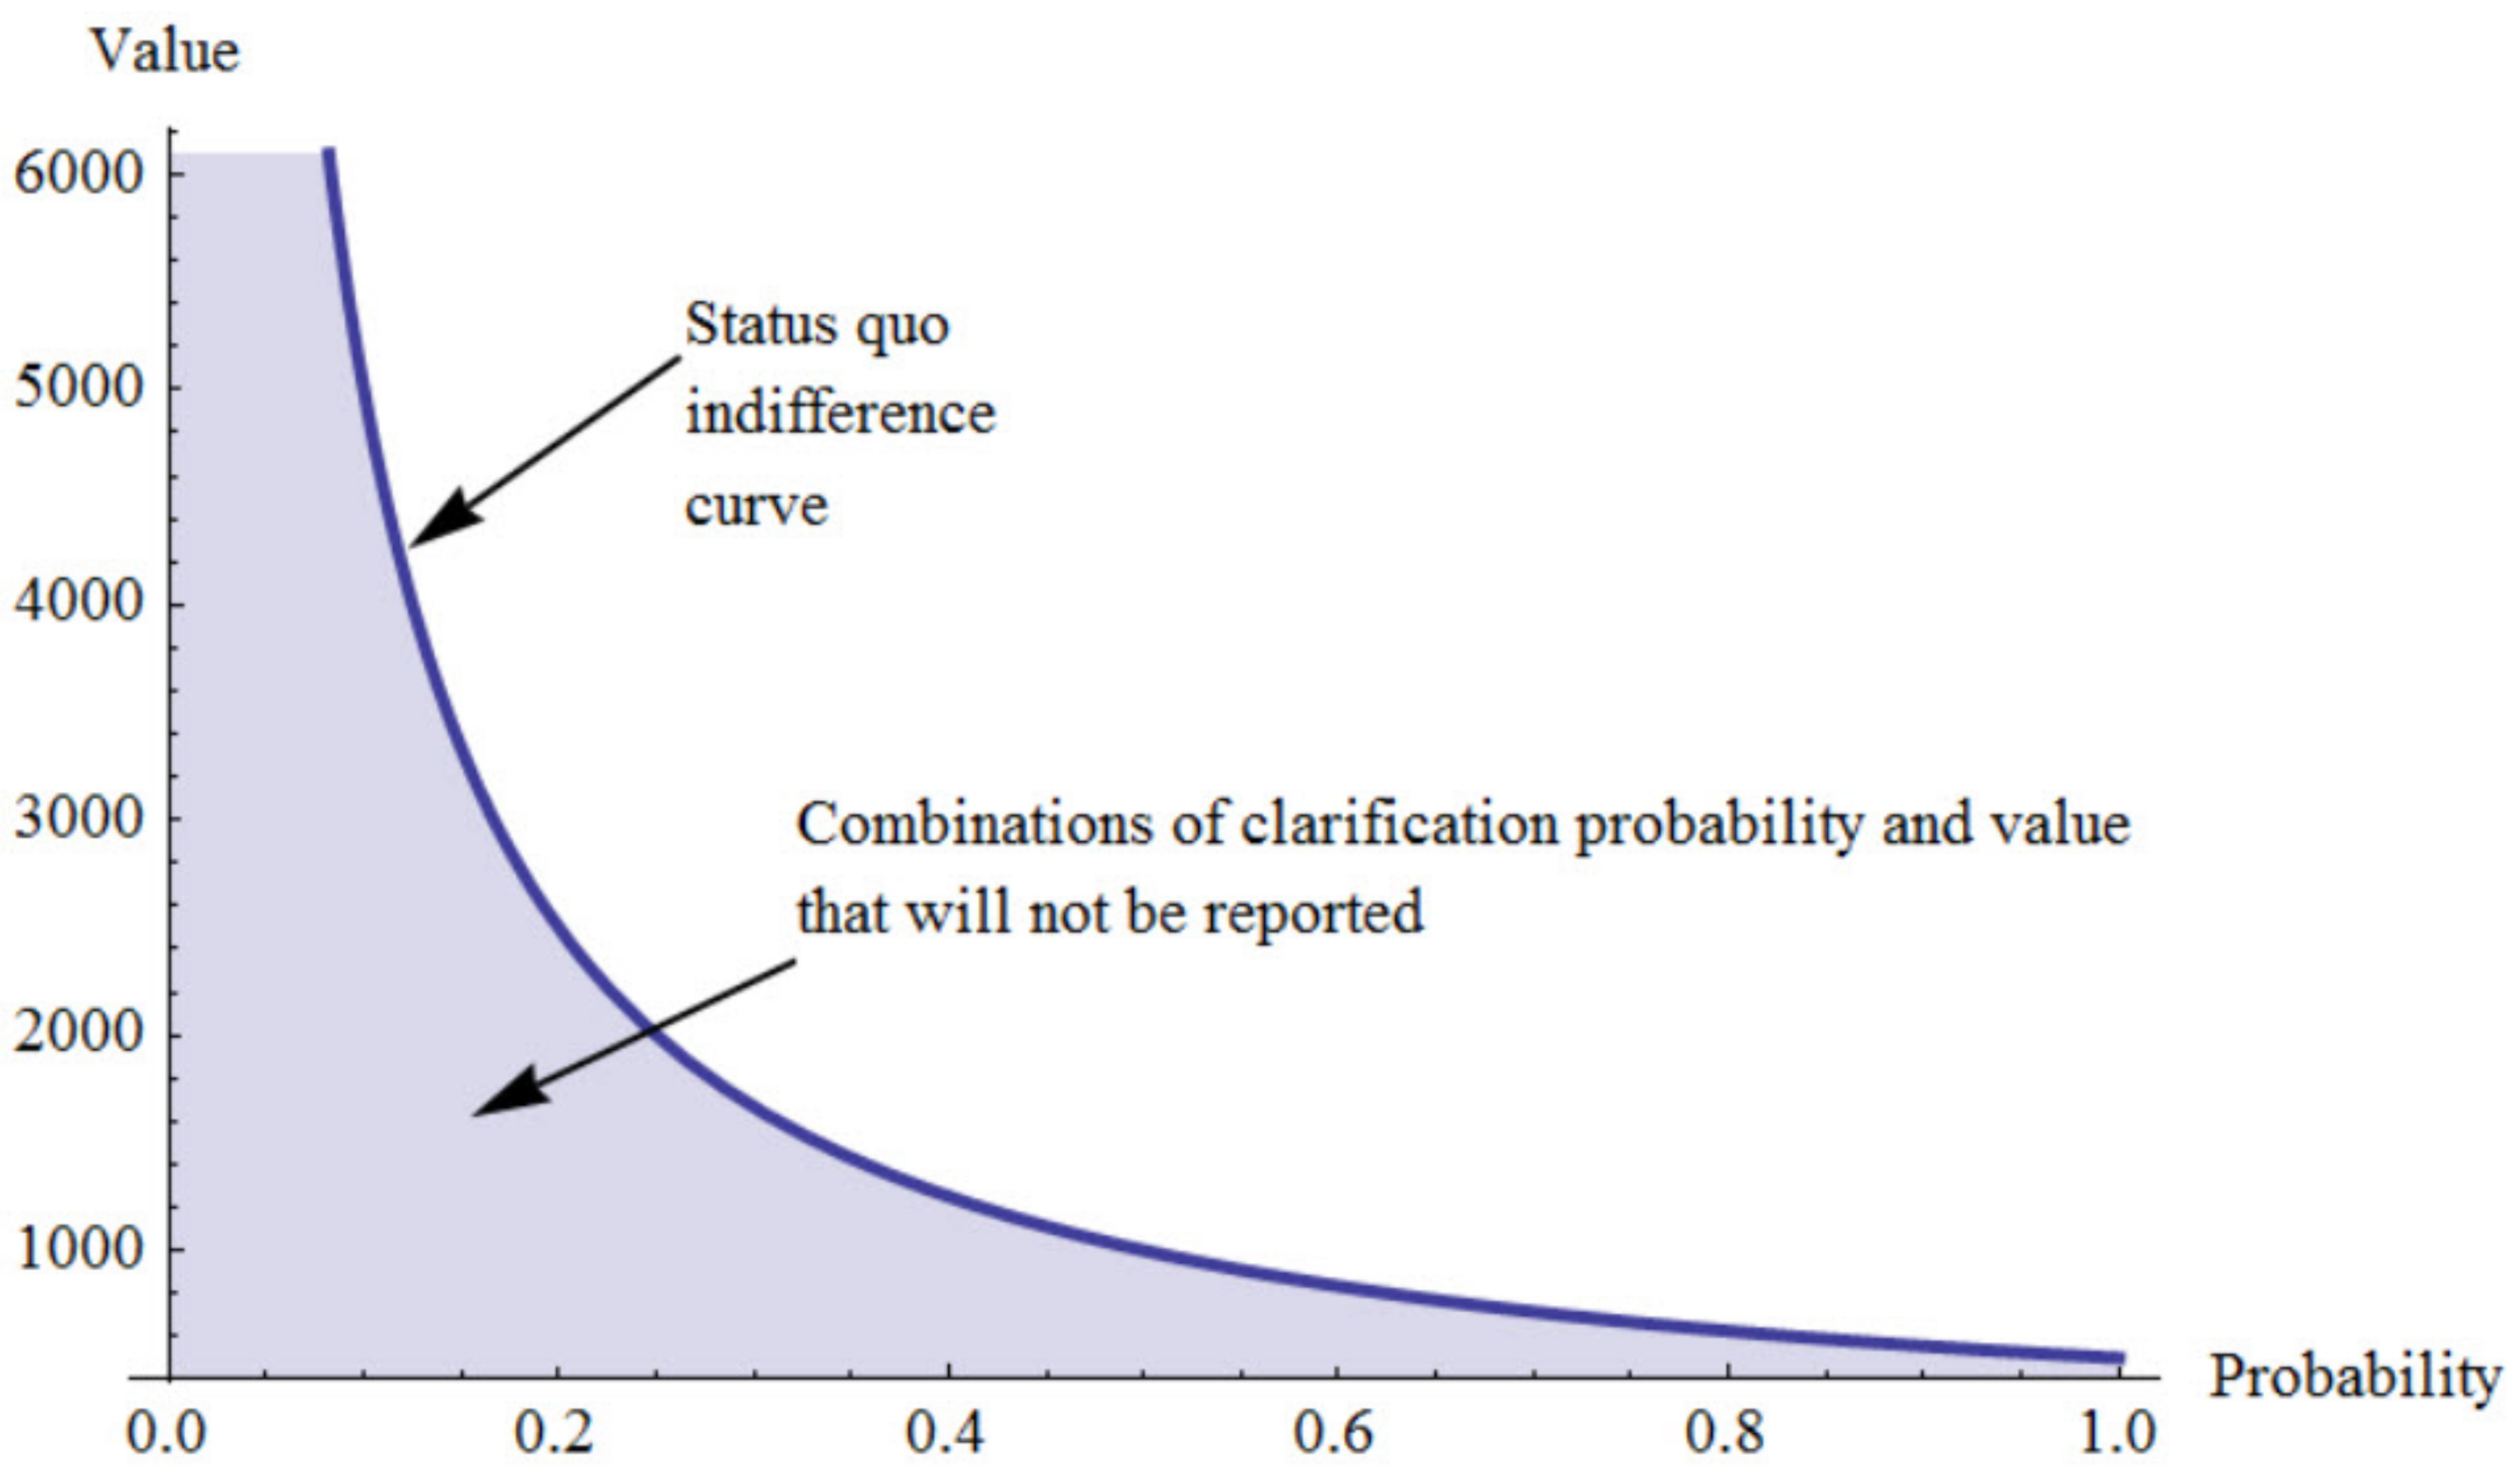
Figure 2.
Indifference curves illustrating the effect of increasing reporting costs. Here, x is less than y.
Figure 2.
Indifference curves illustrating the effect of increasing reporting costs. Here, x is less than y.

Figure 3.
The indifference curve in the case where the victim holds an insurance and the return value in case of clarification equals zero. Only the combination of V and t which is located above the line will be reported. The shaded area represents the combinations that will not be reported.
Figure 3.
The indifference curve in the case where the victim holds an insurance and the return value in case of clarification equals zero. Only the combination of V and t which is located above the line will be reported. The shaded area represents the combinations that will not be reported.

Figure 4.
The marginal willingness to pay for crime prevention for two different levels of crime. When the crime increases, the marginal willingness to pay shifts to the right.
Figure 4.
The marginal willingness to pay for crime prevention for two different levels of crime. When the crime increases, the marginal willingness to pay shifts to the right.
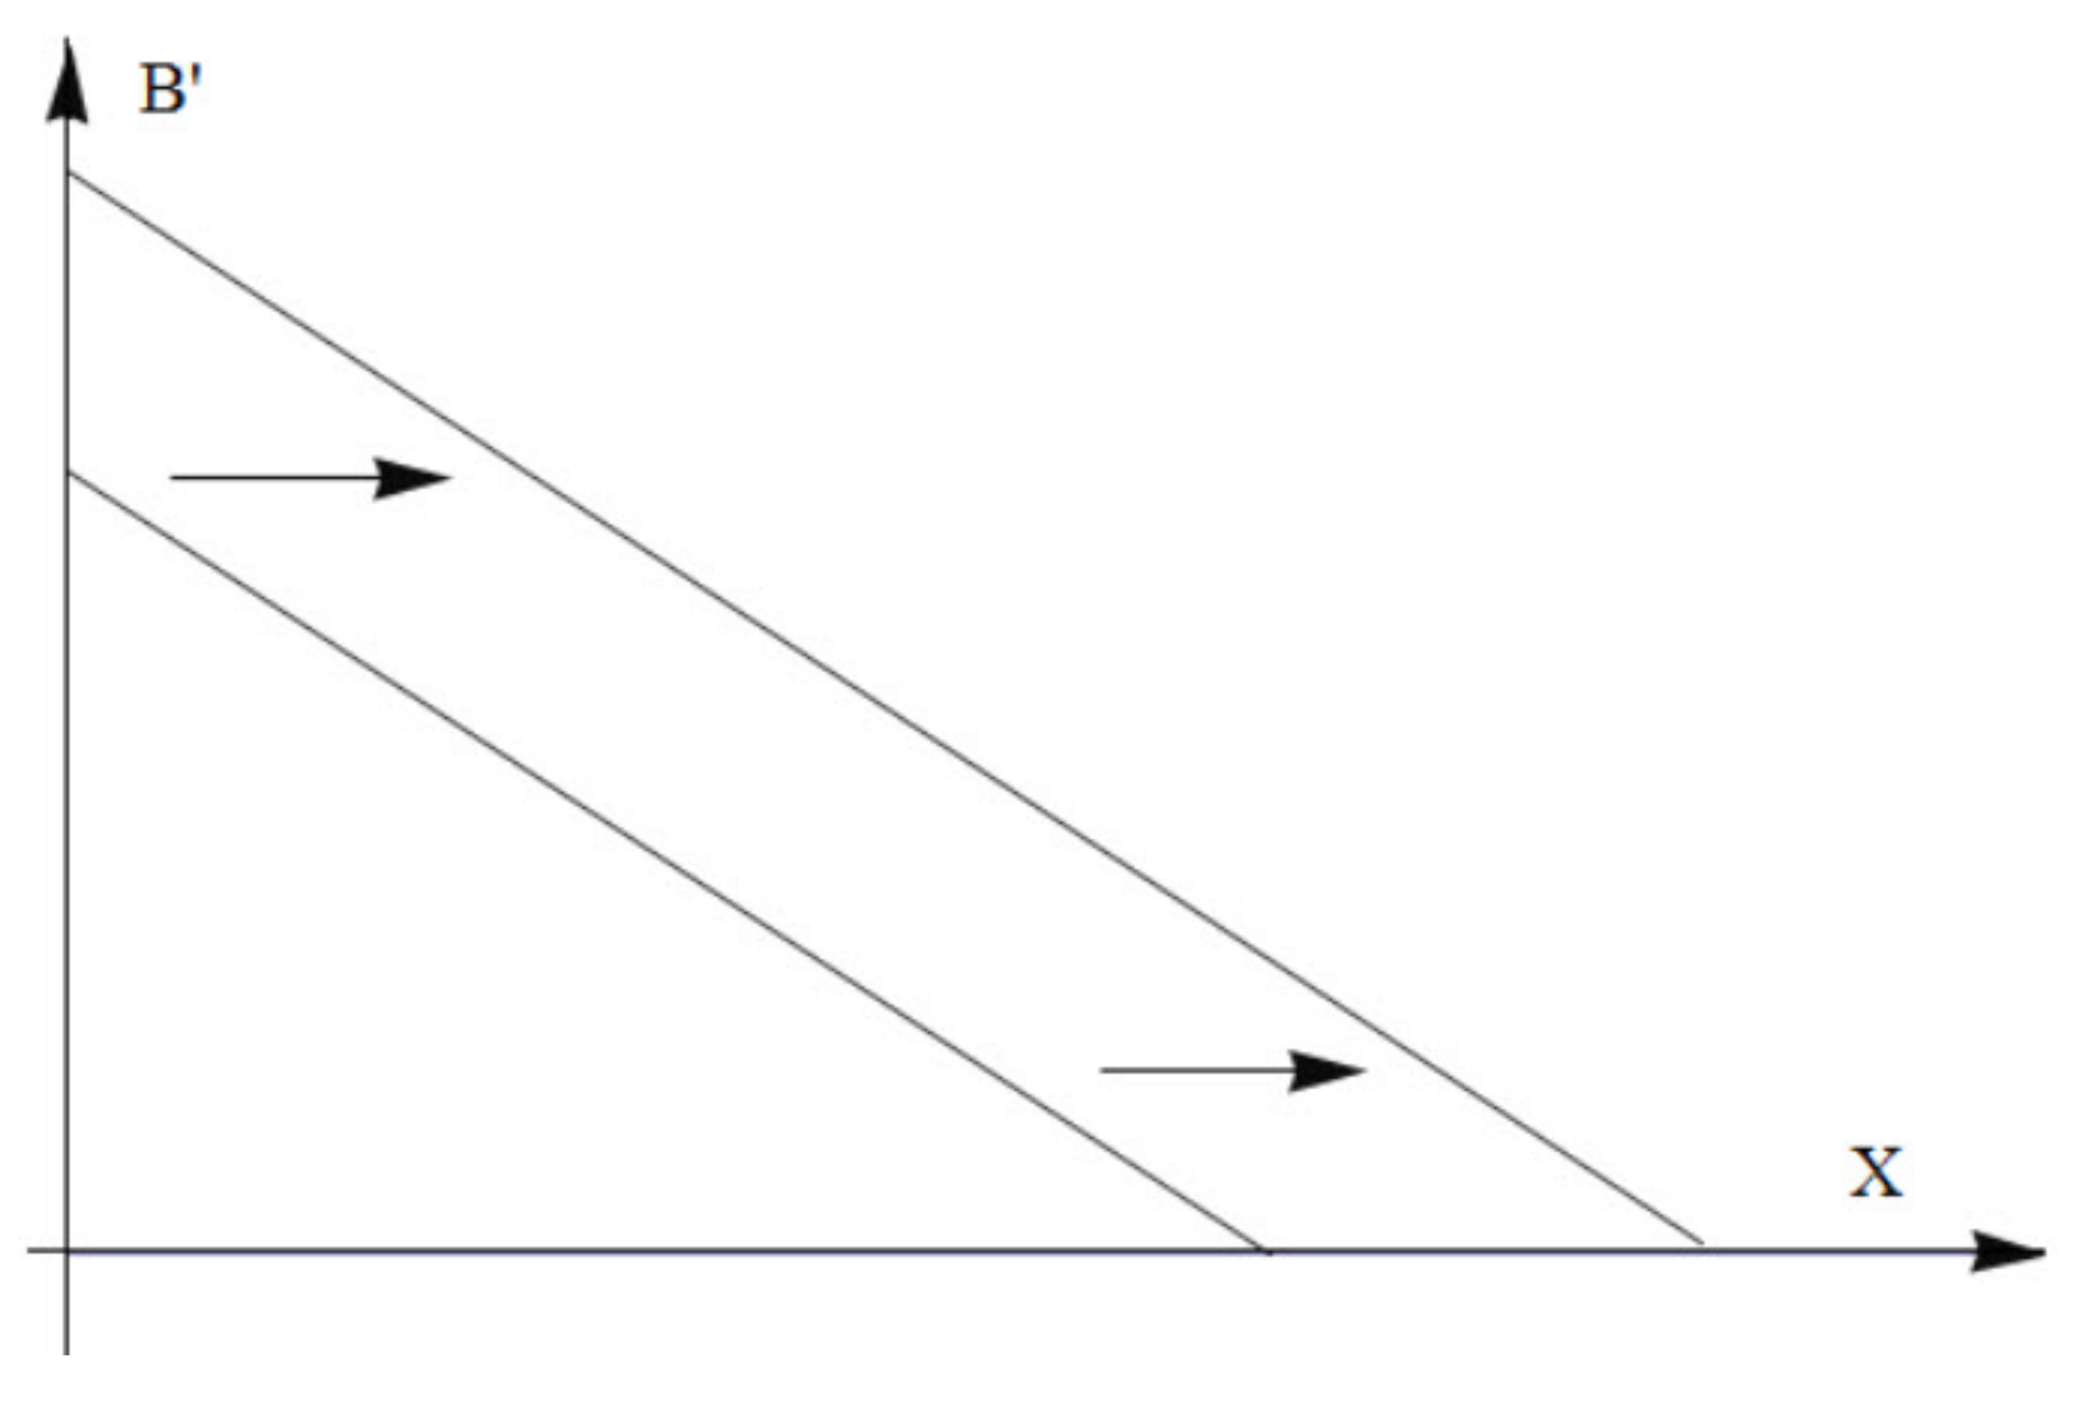
Figure 5.
The figure shows the efficiency loss due to suboptimal resource allocation when the authorities determine the amount of crime prevention activities on the basis of the nominal crime rate and not on the real crime rate. We have assumed that constant marginal costs equal c. In the figure, X is the amount of crime prevention activities. The optimal amount of crime prevention is labeled x1 while the non-optimal amount is labeled x2. B is the marginal willingness to pay for crime prevention.


Table 1.
The number of reported crimes per hundred thousand inhabitants in 34 European countries in 2008 and in 2015.
Table 1.
The number of reported crimes per hundred thousand inhabitants in 34 European countries in 2008 and in 2015.
| Country | 2008 | 2015 | Change in Percent |
|---|---|---|---|
| Cyprus | 411.03 | 108.38 | –73.6 |
| Estonia | 1756.22 | 863.51 | –50.8 |
| Poland | 562.54 | 363.54 | –35.4 |
| Germany | 2496.92 | 1646.84 | –34.0 |
| Portugal | 1202.99 | 832.95 | –30.8 |
| Slovakia | 627.65 | 444.37 | –29.2 |
| Belgium | 2303.23 | 1660.42 | –27.9 |
| Lithuania | 921.68 | 688.78 | –25.3 |
| Netherlands | 4292.25 | 3219.39 | –25.0 |
| Austria | 2094.47 | 1586.92 | –24.2 |
| England and Wales | 2916.32 | 2215.82 | –24.0 |
| Denmark | 4504.61 | 3436.13 | –23.7 |
| Slovenia | 1430.9 | 1105.16 | –22.8 |
| Sweden | 4752.8 | 3828.01 | –19.5 |
| Hungary | 1265.5 | 1031.67 | –18.5 |
| Iceland | 1495.6 | 1225.16 | –18.1 |
| Czech Republic | 1605.71 | 1319.87 | –17.8 |
| Italy | 2085.33 | 1719.49 | –17.5 |
| Latvia | 1179.12 | 976.14 | –17.2 |
| Spain | 520.1 | 442.96 | –14.8 |
| Ireland | 1724.2 | 1500.6 | –13.0 |
| Greece | 1038.79 | 923.72 | –11.1 |
| Croatia | 354.83 | 320.62 | –9.6 |
| Bulgaria | 566.01 | 531.99 | –6.0 |
| Northern Ireland (UK) | 1377.12 | 1300.2 | –5.6 |
| Malta | 2090.32 | 2015.4 | –3.6 |
| Finland | 1754.54 | 1781.22 | 1.5 |
| Liechtenstein | 503.45 | 516.51 | 2.6 |
| Montenegro | 128.99 | 132.94 | 3.1 |
| Switzerland | 1591.06 | 1772.66 | 11.4 |
| Luxembourg | 1451.22 | 1650.74 | 13.7 |
| Serbia | 269.68 | 317.71 | 17.8 |
| France | 1503.87 | 1846.91 | 22.8 |
| Romania | 202.92 | 545.72 | 168.9 |
© 2018 by the authors. Licensee MDPI, Basel, Switzerland. This article is an open access article distributed under the terms and conditions of the Creative Commons Attribution (CC BY) license (http://creativecommons.org/licenses/by/4.0/).
Share and Cite
MDPI and ACS Style
Idsø, J.; Årethun, T. Crime Statistics: Modeling Theft in Favour of Victims’ Choices. Economies 2018, 6, 25. https://doi.org/10.3390/economies6020025
AMA Style
Idsø J, Årethun T. Crime Statistics: Modeling Theft in Favour of Victims’ Choices. Economies. 2018; 6(2):25. https://doi.org/10.3390/economies6020025
Chicago/Turabian StyleIdsø, Johannes, and Torbjørn Årethun. 2018. "Crime Statistics: Modeling Theft in Favour of Victims’ Choices" Economies 6, no. 2: 25. https://doi.org/10.3390/economies6020025
Note that from the first issue of 2016, this journal uses article numbers instead of page numbers. See further details here.