Did the Plan Sénégal Emergent Affect Cropping Decisions in the Senegal River Basin?


1
Food and Resource Economics Department, University of Florida, Gainesville, FL 32611-0240, USA
2
Department of Economics and Management, Universitie Gaston-Berger de Saint Louis, Saint Louis 3200, Senegal
3
Department of Agricultural, Food, and Resource Economics, Rutgers University, New Brunswick, NJ 08902, USA
4
Bureau for Food Security, US Agency for International Development, Washington, DC 20523, USA
*
Author to whom correspondence should be addressed.
Economies 2018, 6(3), 42; https://doi.org/10.3390/economies6030042
Submission received: 30 March 2018
/
Revised: 2 June 2018
/
Accepted: 11 July 2018
/
Published: 23 July 2018
(This article belongs to the Special Issue Economic Development in Africa)
Abstract
:One of the basic debates in African development is whether agriculture can be the instrument for the transformation of a rural economy. A common question is whether agricultural policies can provide the impetus to move agriculture in developing economies from subsistence to commercial agriculture. Senegal’s Plan Sénégal Emergent (PSE) provides a data point in this discussion. Senegal and international donors invested in agricultural supply chains starting in 2012 to facilitate the emergence of commercial agriculture for peanuts, rice, and vegetables. This study focuses on these investments in the Senegal River Valley of northern Senegal. The empirical results presented in this study provide evidence that farms in the Senegal River Valley impacted by PSE have moved away from subsistence agriculture by planting more hectares in commercial crops.
JEL Classification:
O12; 013; Q12; Q181. Introduction
A basic tenet of development is structural transformation: the transition of labor from subsistence farming to non-farm employment simultaneously with the emergence of commercial agriculture to feed the growing labor force (Lewis 1954; Timmer 1988; Timmer and Akkus 2008; Sheahan and Barrett 2017). Commercial agriculture is often associated with farm specialization, even in developing economies, because of the classical gains from specialization noted by Adam Smith, other economies of scale in agricultural production, and comparative advantage (Carter and Lohmar 2002; Emran and Shilpi 2012; Yang and Liu 2012; Klasen et al. 2016). However, African small farmers often practice diversified livelihoods to reduce risk from both food production shocks and market failure leading to an inability to purchase sufficient foods (Barrett et al. 2001, 2017). The Plan Sénégal Emergent (PSE) is the country’s plan using agriculture as an engine of growth that spurs balanced economic and social development across multiple sectors. The PSE has mobilized significant public resources in agriculture with an initial financing of West African Franc (CFA) 7.3 trillion (about $14 billion in 2014 exchange rates) and aspirational funding of CFA 10.3 trillion (Republique du Senegal 2014). Additionally, it has reoriented agricultural priorities to place development of the rice value chain as the first priority rather than the historical emphasis on the peanut value chain, with notional funding for rice of more than 4 times that of peanuts (Republique du Senegal 2014).
While structural transformation remains a decades-long process, it is nonetheless important to track the near-term impacts of this level of structural adjustment policy for several reasons (see Van den Broeck and Maertens (2017) and Moss et al. (2016) for further discussion of these issues). First, growth-enhancing structural adjustment has been hard to achieve in Africa, so a policy approach that could stimulate this adjustment could literally be a continent-changing insight. Second, the PSE approach prioritizes agriculturally led growth. Despite the close connection between agricultural transformation and structural transformation and agricultural growth’s positive contributions to poverty reduction (Johnston and Mellor 1961; Timmer 1988; Fulginiti and Perrin 1998; Irz et al. 2002; Byerlee et al. 2009; Diao et al. 2010; Haggblade et al. 2010; Christiaensen et al. 2011; Naseem et al. 2016), arguments against continued investment in agriculture in general and smallholder agriculture in particular continue to be made (Hasan and Quibria 2004; Collier and Dercon 2014). Thus, the emergence of agriculturally led growth would provide significant evidence on this debate. Third, the reprioritization of a staple crop (rice) over traditionally exported peanuts provides information on the debate as to whether agricultural development for staple food generates as much growth or poverty reduction as development of a high-value agricultural export sector (Diao and Dorosh 2007). For example, Moss et al. (2017) find that investment in the (exported) Rwanda coffee value chain had significant poverty-reducing impacts, albeit likely in part because Rwandan coffee is grown by smallholders. In a segment of the Senegal River Delta different from our sample area, with greater proximity to the port of St. Louis and large-scale horticultural export companies, Van den Broeck and Maertens (2017) find evidence of agricultural export-led structural transformation that generates pro-poor growth through employment effects and investment and consumption linkages. Evidence of an association between rice production and poverty-reducing growth elsewhere in the Senegal River Valley would give further credence to the conclusion that in different contexts, either staple crop or export crop development could make significant contributions to a broader strategy of poverty reduction through agriculturally led growth.
In this paper, we examine evidence to determine whether an agriculturally led structural transformation is emerging in the irrigated rice-producing areas of the Senegal River Valley. In particular, we examine the allocation of smallholder agricultural resources including agricultural land within the Senegal River Valley. Evidence of reallocation of land away from subsistence crops such as millet and sorghum and towards rice and to a lesser extent onions is taken as evidence of policy impacts, and in particular of the beginnings of an agriculturally led transformation. Evidence that the shares of land allocated to subsistence crops are stable or increasing is taken as evidence of the lack of agricultural leadership in structural transformation, raising the question of whether a structural transformation is emerging.
2. Background: Structural Transformation in the Senegal River Valley
Senegal, one of the most stable but also poorest countries in Africa, has since 2012 re-prioritized its investment to catalyze an agriculturally-led structural transformation. Since it gained independence from France in 1960, all three Senegalese presidential transitions have been peaceful, including most recently the 2012 election in which the challenger (President Macky Sall) defeated the incumbent; this stability potentially opens up non-agricultural growth opportunities (Mansoor et al. 2017). Yet, since 1960, structural transformation had at least until recently remained elusive (Eicher 1987; Mansoor et al. 2017). The share of agriculture in employment remains high, with 52% of the population employed in agriculture producing only 17.5% of GDP (World Bank 2016). Poverty declined from 68% in 1991 to 38% in 2005, but remained at 38% in 2011 (World Bank 2016). Real agricultural value added increased at a 1.9% rate from 1968 to 2016, almost a full percentage point below the rate of population increase (author’s calculations from World Bank (2016)). In 2015 Senegal ranked 162 out of 188 on the human development index. To address these and other issues, the government of Senegal has prioritized structural transformation, led by development of the agricultural sector but in conjunction with enabling non-agricultural development, as set forth in the PSE.
The PSE is a broad plan to achieve by 2035 a vision of Senegal as a “socially responsible society under the rule of law”, with an economic emphasis on structural transformation of the economy from one based primarily on subsistence agriculture to an integrated economy with a commercial agricultural sector that provides significant and inclusive contributions to overall economic growth. Over the sample period, the National Agricultural Investment Plans covering 2011–2015 (PNIA 1) and 2016–2020 (PNIA 2) and the Program for Accelerating the Tempo of Senegalese Agriculture (PRACAS) have guided the implementation of the agricultural portion of the PSE.
The PNIA focuses on longer-term goals for agriculture, including accelerating agricultural growth to cut poverty in half. Based on modeling of different investment options, the plan targeted an agricultural growth rate of 6.7%. In some cases there were specific sub-targets, such as increasing rice yields from the 2005/6 average of 2.9 tonnes (mt)/ha to 6.7 mt/ha by 2020.
The PRACAS was a short-term (2014–2017) effort to focus attention and resources on four value chains: rice, onions, vegetables and peanuts, with the first three relevant for the study area in the Senegal River Valley. Rice is the staple grain for most of the country and onions are widely consumed in Senegalese cuisine. Senegal currently is a net importer of rice and onions because of both production and processing constraints including quality issues for rice. The PRACAS targets include self-sufficiency in rice and onions, but with emphasis on rice, and development of an export industry mainly to Europe for off-season vegetable production. Notable in the PRACAS is that notional funding to support the rice value chain is about four times the funding for the peanut value chain, in contrast to historical priority being given to the peanut value chain.
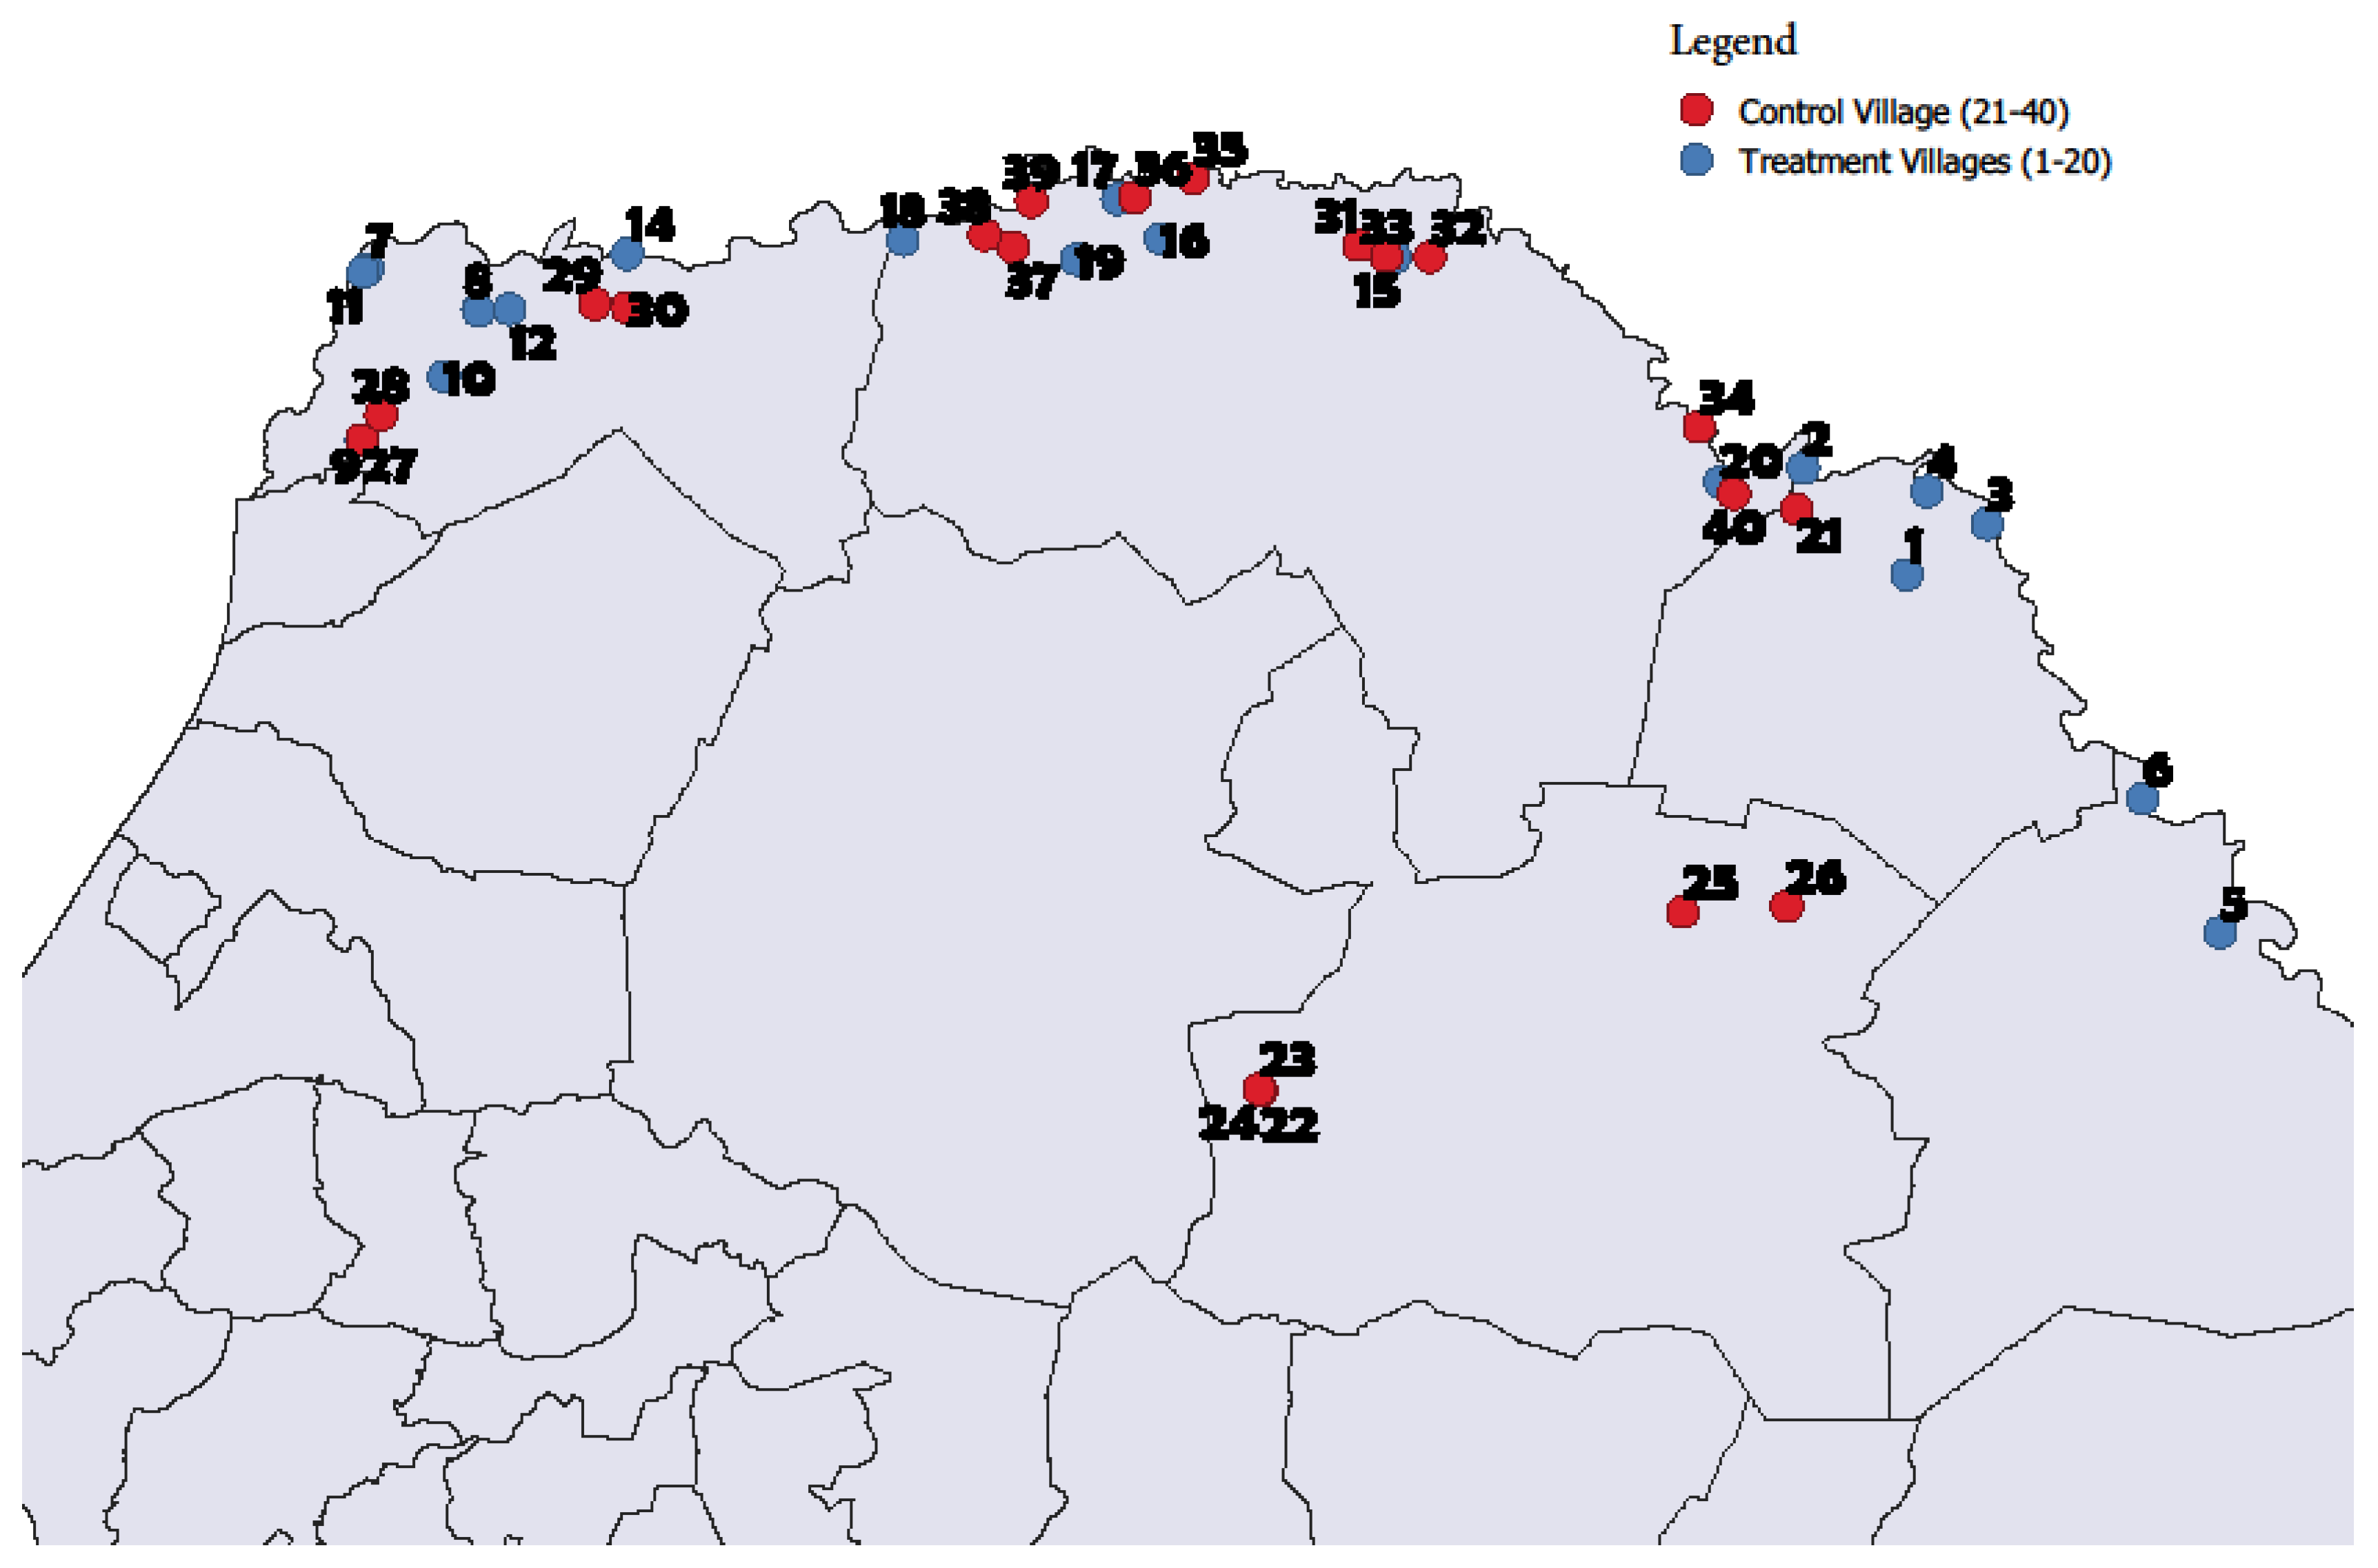
In this paper we are particularly concerned with the effects of the PSE, PRACAS and PNIAs on the emergence of structural transformation in the Senegal River Valley. The Senegal River has headwaters in Guinea and flows through Mali before becoming part of the Senegal–Mauritania border, eventually emptying into the Atlantic Ocean at the city of St. Louis, Senegal. The study area is on the Senegal side of the river and extends from the Matam district on the upstream end to the Diama dam on the downstream end (Figure 1).
The Diama dam is located 27 km inland from the river mouth and prevents salt water from pushing upstream. Rainfed agriculture is limited: there is a small amount of upland rice but the rainfed agriculture focuses on subsistence farming of drought-tolerant grains such as millet and sorghum, with a small amount of livestock production. Rice has been the major crop in the irrigated Delta. Since the 1970s, the Government of Senegal and donors have invested in irrigation schemes to increase rice production. As a result of these investments, yields improved such that by the early 2000s, irrigated fields, average yields were over 5 mt/ha with peak yields reaching 9.5 mt/ha. Despite these successes in yields, irrigation schemes remained underdeveloped, rice quality was poor and people preferred imported rice to local. Hence development of a commercial rice sector was stunted despite significant yield increases. The limited effectiveness of these irrigation schemes was due in part to a limited ability to control river flow. The Manatali Dam, located 1200 km upstream in Mali and completed in 1988, now provides flood control and water retention for release during the irrigation period. The hydrological potential for irrigation is 375,000 ha (World Bank 2016). This could provide more than 1.6 million mt of rice based on a single-cropping basis at global average rice yields on 4.3 mt/ha, more than the 1.5 mt consumed in 2014/2015 (USDA, 2016). However, Senegal became increasingly dependent on rice imports for 20 years after the Mantali Dam was completed and a recent analysis showed a negative net present value (Manikowski and Strapasson 2016).
Key interventions in agricultural production in the sample area include the successful development of irrigated perimeters in the Senegal River Delta, facilitated by recent investments from the World Bank, the Millennium Challenge Corporation, and the Senegalese private sector; development of power and transport infrastructure particularly in the Senegal River Delta; and development of a seed industry for improved rice varieties, facilitated by Feed the Future’s Project for Economic Improvement (PCE). Value chain development actions included strengthening of financing and credit access; strengthening of a local rice processing sector to help make domestic rice competitive in price and quality against imports; and strengthened marketing of domestic rice in the capital city of Dakar and other urban demand centers. In all of these actions leadership and support from the government of Senegal played a critical role.
The critical policy question here is how smallholders are responding to the PCE and PSE more broadly in terms of their allocation of resources within agriculture. That is, are smallholders making the necessary reallocations of agricultural inputs including land so that the sector as a whole can switch from subsistence to commercial agriculture?
3. Methodology
3.1. Theory
To examine the question of whether smallholder agricultural resource allocation is changing in response to policy shifts and in ways that are consistent with agriculturally led structural adjustment, we posit a theory of agricultural resource allocation. We start from the household production model (HPM):
where is the utility generated by the consumption of a vector of consumption goods; is the amount of good produced (e.g., if denotes rice production is the pounds of rice produced); is the quantity of production sold; is the production function for rice (based on a common input that effects both rice and onion production—, is a specialized input that only effect rice production; is the hectares of farmland dedicated to the production of rice; is the household labor dedicated to the production of rice); is the production function for the second crop (e.g., onions); is the price of output ; is the input price for input ; is outside income (possibly from remittances); is the wage rate for off farm employment; is the total amount of labor available to the household; and is the total amount of quasi-fixed asset (e.g., farmland) available to the household. The Lagrange formulation for the utility problem can then be specified as:
where , , , and are Lagrange multipliers. For our purposes of this study, the most important conditions involve the allocation of the quasi-fixed input between production alternatives. Applying the Kuhn–Tucker approach (i.e., assuming that the amount of quasi-fixed input allocated to each production process has to be greater than or equal to zero) yields the first-order conditions:
Here, the marginal value of farmland allocated to crop 1 or 2 is determined by the value of each respective crop to the household (i.e., for output 1 and for output 2) when that crop is produced at a non-zero level. Specifically, the Kuhn–Tucker first-order condition for is:
If the good is produced ():
where the marginal value of is determined by the derivative of the utility function with respect to . To bring this value into context, we take the first-order condition of utility with respect to :
A couple of things about this result. First, we do not impose the restriction that since the household could buy or sell rice. If the household sells rice. However, if the household buys rice. Second, we assume that so that the household consumes some rice.
Returning to the allocation of land between crops, if both crops are planted:
To develop the implications of this conditions, is the yield of crop 1 per hectare and is the yield of crop 2 per hectare (i.e., is the rice yield per hectare, and is the yield of onions per hectare). Implicitly, the relationship in Equation (7) allows for complexity not possible in simple profit maximization given exogenously determined output prices. To develop this point, consider the marginal utility relationship implied by merging Equations (5) and (6):
which yields the traditional marginal condition from profit and utility maximization under market conditions. The marginal utility equals as in the standard demand model and the marginal product of each input equals the ratio of input price to output price:
The difference between the market solution and a subsistence solution results from a failure of Equation (8). Specifically, given that the household cannot access the market for a particular good due to low income:
Under this scenario, the household will allocate more farmland to the subsistent good than suggested by market prices. In Equation (7), since increases above the market price, has to increase (assuming that the marginal product of farmland is downward sloping) to meet the equilibrium condition.
To draw this discussion out in order to highlight the role of subsistence crops, let us assume that is the commercial crop (e.g., rice) as above, but now let us assume that is an output that tends to be a subsistence crop (e.g., cassava which is largely consumed by the household in autarky). Under this scenario the relationship in Equation (8) remains unchanged (the marginal utility of rice is equal to the marginal utility of income times the price of rice). However, the marginal utility of cassava is greater than the marginal utility of income times the price of cassava, so that:
assuming . Substituting the implication of Equations (8) and (11) into Equation (7) yields:
Intuitively, the market value of rice does not change—it is still determined by the marginal utility of income times the market price of the output. However, the value of the subsistence crop (cassava) is higher than the value determined in the market. If we assume that the marginal product of land used to plant cassava is downward sloping, more land will be dedicated to the planting of cassava than “justified” by its market price.
Equation (12) explains why more land is planted to the subsistence crop than implied by market prices; however, the question then shifts to why is . This divergence is implicit in the subsistence counterpart to Equation (6):
One simple way to yield the result of Equation (13) is to hypothesize a transaction cost on the subsistence crop sufficient to yield the equality:
where is a transaction cost that may be incurred to purchase the subsistence good. Hence, we have two market conditions:
A second possibility involves the implicit condition determining the marginal utility of income. Specifically, given that the utility function is concave in the level of goods consumed, is a decreasing function of income—relatively poorer households have a higher marginal utility of income ( where is the marginal utility of a relatively poorer household). Mathematically, poorer households put a higher value on subsistence crops because their marginal utility of income is relatively high.
3.2. Data
This paper relies on collection and analysis of primary household data collected in the study area in 2014 and 2017, supplemented in some instances by secondary data. A household survey instrument was developed for the express purpose of measuring rural transformation as described in the previous section, and was pre-tested at the University of Gaston-Berger in St. Louis, Senegal. To provide additional information on job creation, the interviewers used an additional survey instrument to solicit information on employment from local enterprises. Both the household and enterprise survey instruments had been previously developed and validated for use in south-east Senegal.
Based on sample size calculations, a sample of 200 target households and 200 control households was desired for the household data collection exercise. To determine the sampling frame it was necessary to define a geographic area with significant development activities and a potentially emergent transformation. The United States Agency for International Development (USAID)-funded Project Croissance Economique (PCE) provided such an opportunity. PCE is involved in strengthening the rice value chain from farm credit and input supply to processing and finally marketing of rice in Dakar. Additionally, multiple other donors including the World Bank, the Millennium Challenge Corporation and others as well as the government of Senegal are active in the area. Within the Senegal River Valley PCE operates in the departments of Podor, Matam, Kanel and Dagana, and there are 51 villages within these departments (Figure 1). PCE is an individualized progam that targets beneficiaries in the 51 villages, by providing farmers with various types of support such as helping identify market opportunities, obtain credit, and training. From these 51 villages, 20 villages were randomly selected as being the target group. Ten households from the target villages were then randomly selected for a total of 200 households. The control group was selected from the villages along the Senegal River that were not the 51 villages forming the target group sample frame, and hence not in the PCE. From the set of possible control group villages, 20 were selected on the basis of matching different characteristics of the target group. Village-level characteristics that were used to find the control villages included whether the control was similar to the target in terms of access to water, distance to paved road, access to markets, and agricultural production. It should be pointed out that while some control villages are further from the Senegal River—specifically Touba Velingara, Velingara Wolof 1, Velingara Maure 2, Mody Kelo and Loumbol Samba Abdoul in Matam—these villageshave access to irrigation so the distance from the river is not a differentiating characteristic and these villages make reasonable control villages. Within the 20 control villages, 10 farming households per village were randomly selected from the rolls of the village producer organizations.
3.3. Empirical Methods and Results
Table 1 presents the share of crops planted in the control and treated areas in 2014 and 2017. In general, the amount of land devoted to the production of rice increased across the board, rising from 46.7 percent for the whole sample in 2014 to 60.4 in 2017. Rice and onions (cash crops in the irrigated areas) dominated the treatment area in 2014 with 81.4%, and this domination increased to 91.9% in 2017. This is interpreted to mean that in the treatment areas, smallholder agriculture is over 90% commercialized. In contrast, in the control areas, the proportion of area planted to rice and onions in 2014 was 31.1% and 49.0% in 2017. That is, in the control areas slightly more than half the area is planted to subsistence crops. This is interpreted to mean that subsistence farming still plays a significant role in the control area, but that commercialization is occurring.2
At this point, it is tempting to analyze the statistical significance of these changes using rudimentary statistics. However, these formulations ignore the “adding-up” constraint in the data—the shares of farmland planted to each crop add up to 100.0 percent by definition. As in the estimation of systems of demand equations, the variance matrix for crop shares is singular. Given the summing up restriction and the fact that shares are bounded between zero and one, we estimate the covariance matrix for each group using Wild-Bootstrapping (Wu 1986) using the Rademacher distribution as described in the appendix. The variance/correlation matrix along with the standard deviation for each sample is presented in Table 2.
The correlation coefficients between different crop shares presented in Table 2 indicate that correlation coefficients are smaller and more stable in the treatment group than in the control group. Several changes in correlation in the control group are large, but the most significant for our current analysis is the change in correlation between rice and onions across time periods. In 2014, the correlation coefficient between rice and onions was 0.1676; however, the correlation coefficient declined to −0.8282 in the 2017 sample. Hence, onion plantings in 2014 were largely uncorrelated with the planting of rice. However, in the 2017 sample these plantings are negatively correlated—farmers appear to be trading between rice and onion production in the control group. One possible interpretation is that programmatic support for increased rice production within the treatment group enabled those producers to focus on rice production, increasing the land share in rice by 12.5 ppt. and decreasing the share in onions by 2 ppt. In contrast, commercial farmers in the control areas without programmatic support for rice production increased their share of land in rice production by 6.2 ppt. and their share of land in onions by 11.7 ppt. While not conclusive, this is nonetheless important corroborative evidence of the positive impact of treatment-area programs and projects on commercial rice production. The correlations in the treatment group appear to be smaller overall. For example, the correlation in the 2014 sample between rice and onions was −0.1658. While this would appear to provide some evidence that higher rice plantings were associated with lower onion plantings, this effect would be small. In the 2017 sample, this value declines to −0.2671 which strengthens the conjecture that rice and onion plantings substitute for each other, but the figure is still relatively small.
Following the general approach used in systems of equations, the test for the control shares in 2017 being the same as the control shares in 2014 becomes:
where is the variance matrix for the control sample in 2014 with the last row and column (the values for other crops) dropped. This test statistic can be rejected at any conventional confidence level. The likelihood ratio for the treatment shares in 2014 equal to the control shares in 2014 is 441.88 which again is rejected at any level of confidence. The test statistic for the change in the shares for the treated group is 43.73 which is still statistically insignificant at any conventional confidence level. Finally, the test for the control shares in 2017 equal to the treatment group is 5256.13.
The magnitudes of the test statistics suggest that the test statistics may over-reject the null hypothesis (i.e., following Moss and Theil (2003) the variance matrix may be too small). To examine this hypothesis, we extend the informational approach for testing the change in shares developed in the Appendix B. Specifically, we examine information across crop shares defined as:
where is the share of crop in the control group and is the share of crop in the treatment group. As a first step, we generate the information measure for the treatment group equal to the control group in 2014—. Like the likelihood ratio test above, this value is statistically significant at any conventional confidence level. Next, we generate the same measure for 2017 yielding which again is statistically significant at any conventional confidence level. Hence, like the likelihood ratio results, the allocation for the treatment group is different to the allocation in the control group at any conventional level of significance.
To examine the dynamics in a slightly different light we develop a difference-in-difference formulation. Specifically, we turn to a different informational measure based on changes in the shares between 2014 and 2017 for the treatment group compared to the control group. The interpretation of this test statistic is somewhat complex. First, it is important to recognize that the treatment and control groups have different land allocations in 2014, which is interpreted as meaning that the treatment group has started an agricultural transformation. If the control group is indeed to participate in this transformation alongside the treatment group, i.e., the two groups are to converge, then the control group must ‘catch up’ to the treatment group. That is, the shares in the control group would have to change more rapidly than the shares in the treatment group. A more rapid change in the control group would be consistent with a statistically significant test statistic. In contrast, if there is no difference-in-difference effect, then the result is interpreted to mean that the control group continues to lag the treatment group. This would be interpreted as evidence that the policy actions taken by the government of Senegal along with donor support are having a continuing effect on agricultural transformation in the treatment group.
Focusing on the treatment group we compute:
where measures the change in information for the treatment group between 2014 and 2017. Numerically, . Based on sampling the change in the control shares over that same period, we determine that . Hence, we conclude that the change in the shares for the treatment group are not statistically different to the change in the control group. We interpret this as support for the hypothesis that the policy effect has continued through 2017.
4. Discussion and Conclusions
The Senegal River Valley is potentially the ‘rice basket’ of Senegal, with agronomic potential to supply enough rice to meet all domestic demand with significant export possibility. Achieving this potential requires transformation in the area from subsistence farming to commercial agriculture. While the first step in achieving this transformation may be increased yields as in the Green Revolution, irrigated rice yields in the area have been high at least since the 1990s. Instead, the constraints appear to be poorly managed irrigation schemes, low-quality rice that does not meet consumer quality requirements, and an inefficient supply chain. Recent emphasis by the government of Senegal with multi-donor support have addressed these irrigation, quality, and value-chain constraints. The hypothesis is thus that a transformation from subsistence farming to rice-based commercial agriculture will ensue.
This paper provides direct empirical evidence of the hypothesis. In particular, we provide evidence on smallholder reallocation of land away from subsistence crops such as millet and sorghum and towards rice production, using a unique panel data set including treatment and control groups. The evidence is consistent with a significant reallocation of land away from subsistence crops. It is consistent with a significant reallocation towards rice, and to a much smaller extent towards onions, a secondary commercial crop. In 2017, the treatment group planted over 90% of its land with rice and onions, compared to less than 50% for the control group. An information-based, difference-in-difference inference measure demonstrates statistical significance of the switch. That is, while both treatment and control groups are commercializing, the treatment group is much farther along the commercialization path than is the control group. In fact, at 90% commercialization, the transition from subsistence to commercial orientation is almost complete in the treatment group.
Methodologically, this paper has refined the information-based metric of Moss, Mbaye and Oehmke, in particular applying it to a difference-in-difference approach. This information metric is an extremely useful tool for comparing distributional changes (as compared to say mean yield changes). The difference in difference approach is the best approach for examining the effect of policy or programmatic development interventions. The application of the information metric to the difference-in-difference approach is thus the best approach to quantification and inference about distributional changes attributable to development interventions. In this case the application was to the distribution of farm land to commercial versus subsistence crops. However, a wide variety of development outcomes are distributional in nature, from income distributions to labor allocations. Further research is appropriate to apply the information-based difference-in-difference approach to quantify important distributional changes.
These findings shed light on several conclusions that may hold more broadly throughout African agriculture. First, yield increases are not always sufficient to catalyze agricultural transformation. Additional infrastructure investments and policy changes as well as value chain development may be necessary. Second, there is a debate as to whether smallholder agriculture is amenable to commercialization, especially in staple crops, or whether farm consolidation to achieve economies of scale is a prerequisite. This paper shows that in the Senegal River Valley farm consolidation is not a prerequisite. This potentially has implications for land policy throughout many staple crop-producing regions in Africa, although further work is required for specific contexts. The current data are not sufficient to shed light on the question of whether consolidation would have accelerated commercialization within the treatment group, nor of whether consolidation going forward will generate further productivity increases within commercial agriculture, but the latter question is likely to be researchable with the next round of data collection and analysis. Finally, the emergence of a transformation to commercial agriculture raises a number of interesting questions for further research: are farm and non-farm labor markets providing local employment and entrepreneurial opportunities as the rice value chain grows? Are local food markets growing as smallholders turn from subsistence production to commercial markets to feed their households? Are there income and consumption linkages that are strengthening local economies?
Author Contributions
In this research C.B.M. primarily contributed in the development and implementation of the economics and econometrics. S.M. conducted the surveys and provided local knowledge about the implementation of the programs in Senegal. A.N. provided the linkages to development literature in the area of agricultural transformations. J.F.O. with support from all coauthors developed the initial research questions and general approach. All authors contributed to the preparation of the document.
Funding
The authors acknowledge the generous support of USDA and USAID via the cooperative agreement grant TA-CA-15-008-01. The views expressed in this paper are those of the authors and do not necessarily reflect the views of the U.S. Agency for International Development.
Acknowledgments
The authors would like to acknowledge the inputs of the anonymous reviewers and the technical editors of Economies.
Conflicts of Interest
The authors declare no conflict of interest.
Appendix A

Table A1.
List of control and target villages (numbers refer to those on the map).
| Control Villages | Target Villages | ||
|---|---|---|---|
| Number | Name | Number | Name |
| 1 | KOBILO DIADIABE | 21 | DABIA OREFONDE |
| 2 | DIORBIVOL STATION | 22 | TOUBA VELINGARA |
| 3 | DONDOU | 23 | VELINGARA WOLOF 1 |
| 4 | GAOL | 24 | VELINGARA MAURE 2 |
| 5 | ORKADIERE | 25 | MODY KELO |
| 6 | THIALY SOUBALO | 26 | LOUMBOL SAMBA ABDOUL |
| 7 | DEBY | 27 | GAMOU THILLE |
| 8 | MBOUNDOUM BARRAGE | 28 | NDIOUGUE MBERESSE |
| 9 | NDELLE | 29 | LOUGUE DEUMISSE |
| 10 | ROSS-BETHIO | 30 | PAKH |
| 11 | TIGUET | 31 | NIANGA EDY |
| 12 | KASSACK NORD | 32 | KOGGA |
| 13 | RONKH | 33 | THIALAGA |
| 14 | ROSSO-SENEGAL | 34 | WASSETAKE |
| 15 | DIOMANDOU | 35 | MBOYE |
| 16 | DONAYE | 36 | WOURO MADIHOU |
| 17 | GUIA | 37 | DIMATH DIERY |
| 18 | NDIEURBA | 38 | THIANGAYE |
| 19 | THIEWLE | 39 | BAKAO |
| 20 | TOUFNDE GANDE | 40 | THILOMBOL |
Appendix B. Distribution of Information Measures
Since the changes in other crops are relatively small, most of this gain comes from the reduction in other crops which fell from 24.5 percent in 2014 to 7.4 percent in 2017. Examining each group (control versus treatment) the increase in control group appears to be slightly larger (22.8 percent) in the control group than the treatment group (16.7 percent). To examine whether this shift in relative shares is statistically significant, we use an information approach proposed by Moss et al. (2016). Specifically, we let the be the share of farmland in the control group planted to crop and be the share of farmland in the treatment group planted to crop . The information between the two distributions () is then defined as:
where is the number of crops (in this case 7). Theoretically, the with only when the two sets of crop shares are identical. Numerically, and ; however, these numbers by themselves are difficult to interpret. Specifically, we can say that the difference between the treatment group and control group becomes larger, but it is difficult to determine whether this difference is statistically significant. To develop whether these statistics are significant, Moss et al. (2016) use a jack-knifing procedure to generate —the draw defined as:
where is the draw for the share of crop generated by dropping 1/3 of the control sample. Moss et al. (2016) draw 15,000 samples to generate the distribution of the information statistic under the null. Given this information, they construct a non-parametric test for whether is statistically significant.
This study departs from the approach of Moss et al. (2016) by modifying the jack-knife procedure along the lines of a Wild-Bootstrap (Wu 1986). Specifically, Moss et al. (2016) generate the informational sample by the sequence of 0/1 weights following the jack-knife approach. Intuitively, 2/3 of the sample receive a weight of 1 and 1/3 of the sample receive a weight of 0. One difficulty with this approach is that some low-frequency events may generate . Assume that some planting event only occurs one time in the sample—say only one farm plants sweet potatoes. Hence, it is possible that one of the jack-knife draws will not include that sample. Hence, which yields an undefined value in Equation (A2). To overcome this possibility, consider the areas of each crop planted by farmer () which are used to generate the overall crop shares
The total area farmed by each farmer in the control group can then be defined as:
Implicitly the jack-knifing procedure involves generating a set of totals:
where with probability . In this study, we replace the with where is the standard deviation of the logarithm of for the sample and . Given a draw the level of crop for farmer then becomes:
The shares for the draw are then computed by applying Equation (A3) to the results for Equation (A6).
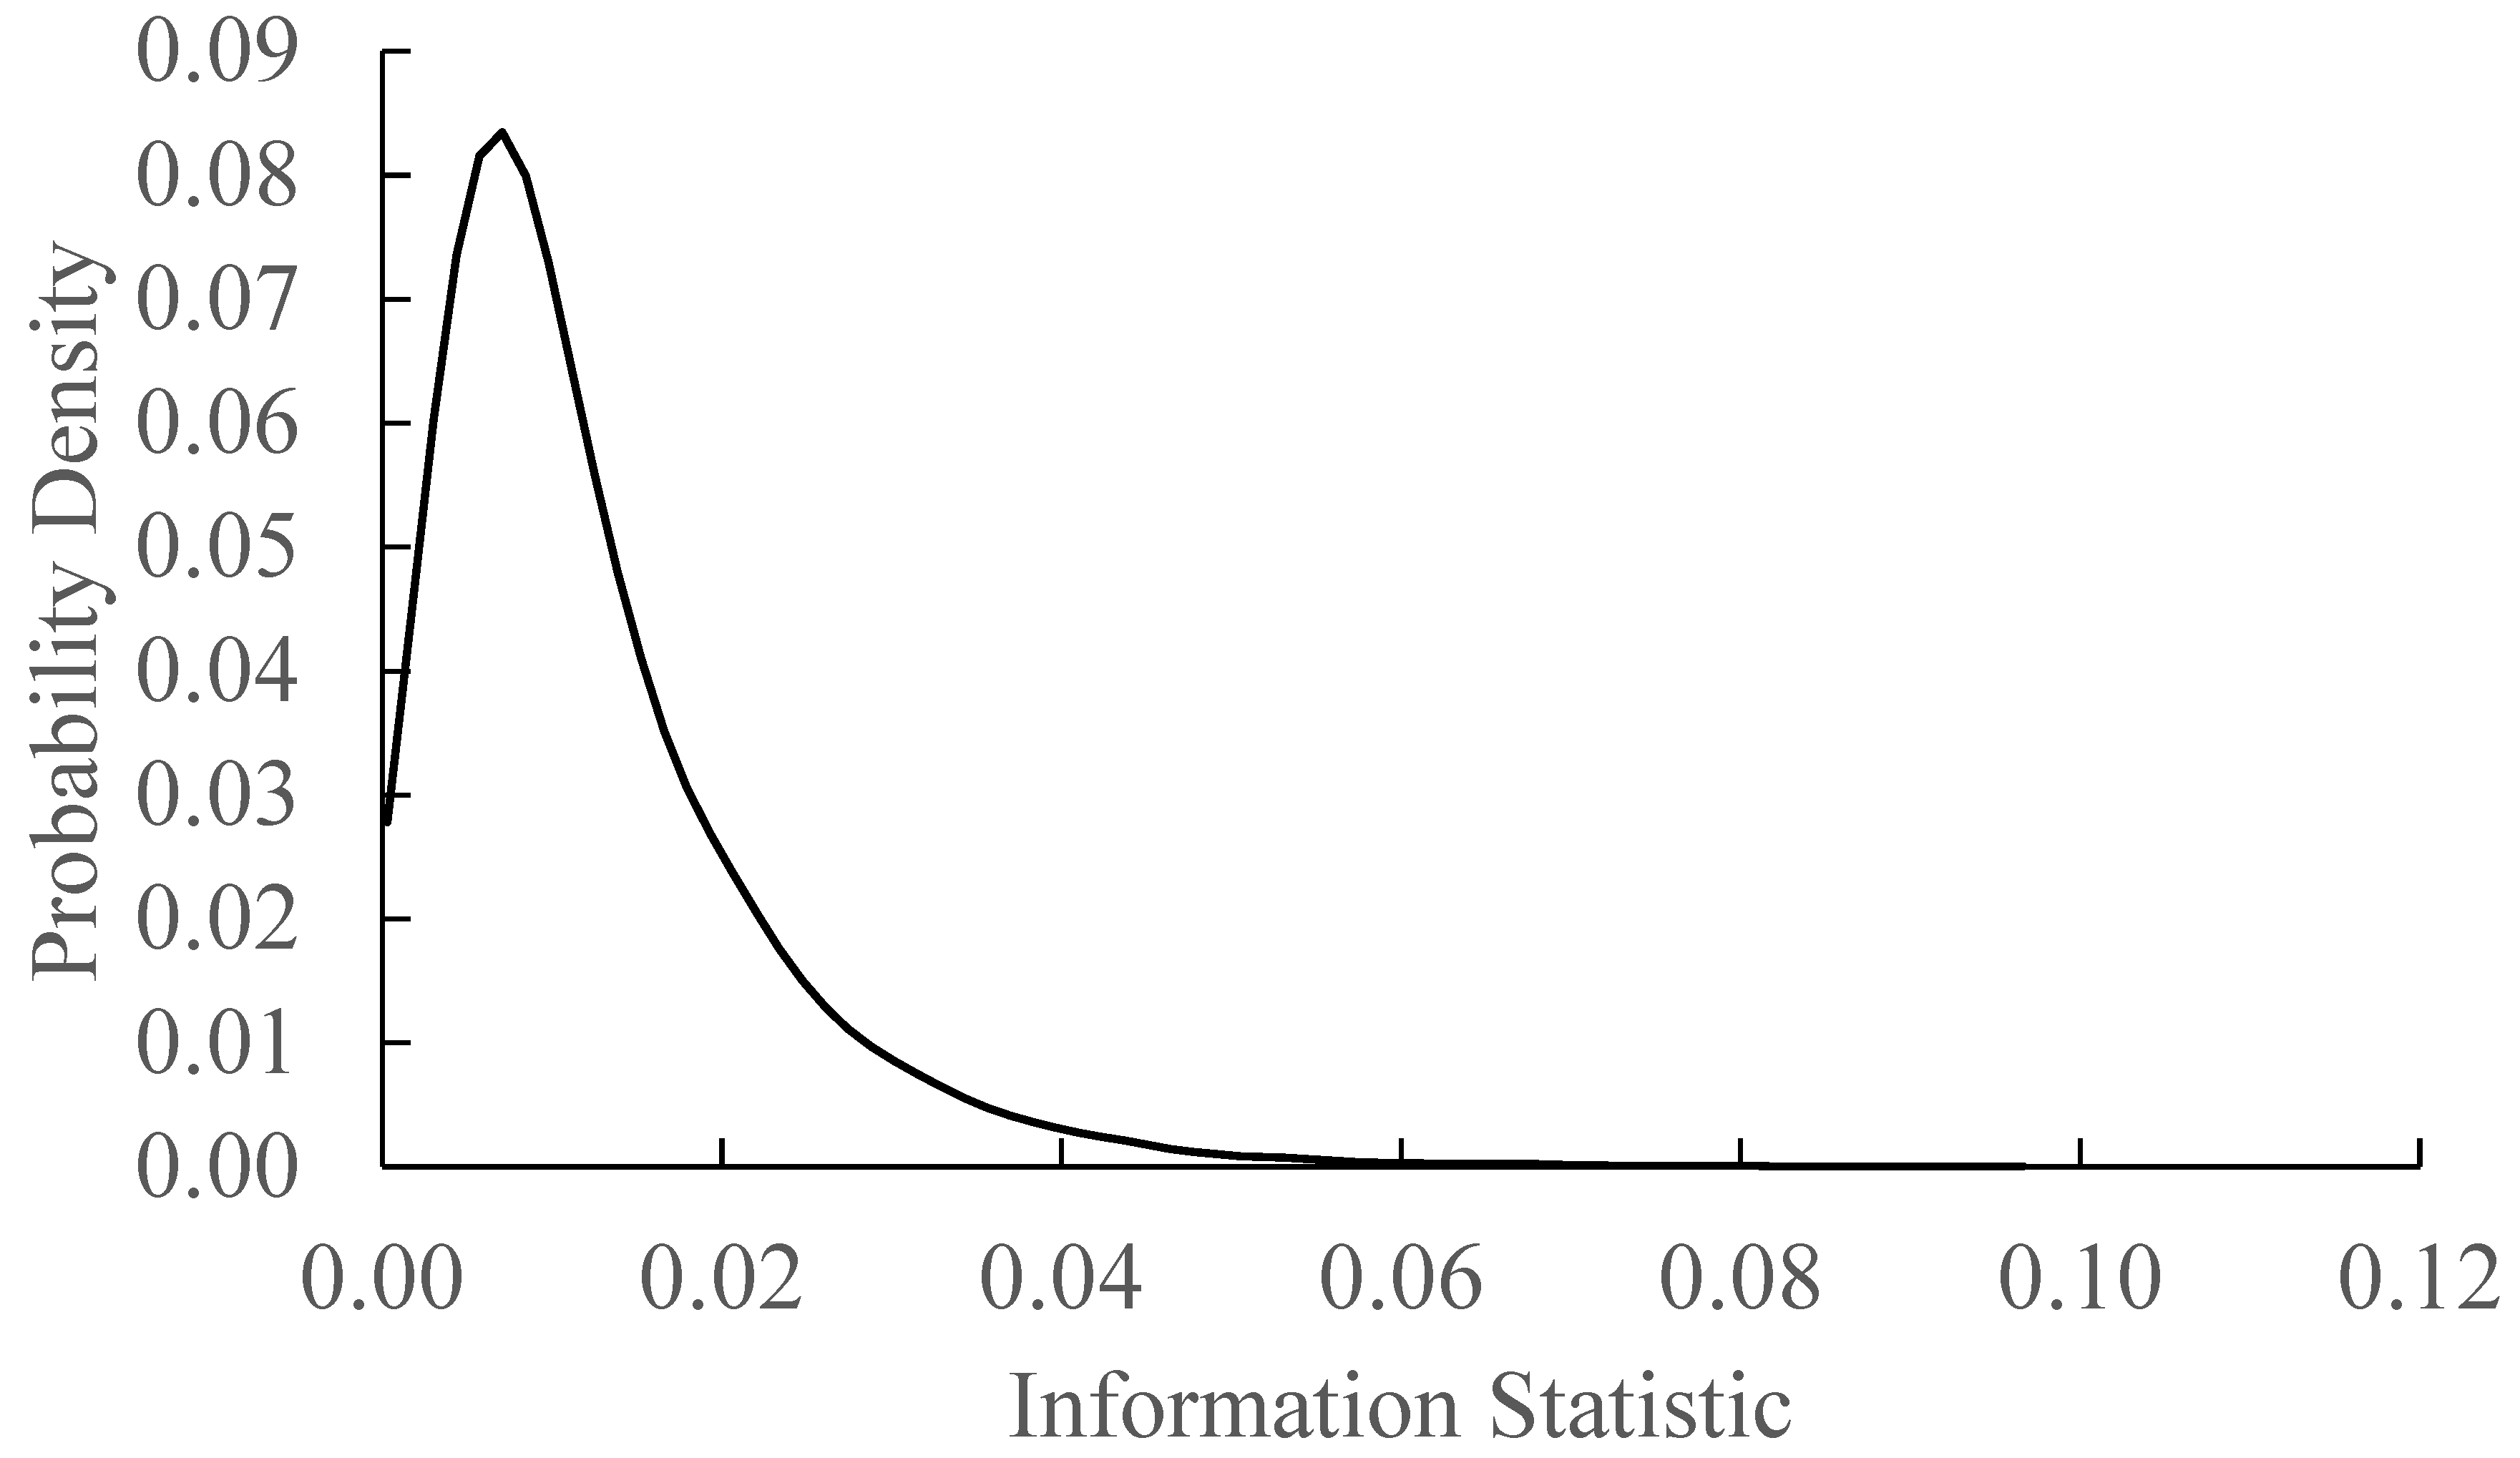
The averaged shifted histogram (ASH) probability density function (Scott 1992, pp. 113–24) for the control group in 2014 is presented in Figure A1. Following Kullback and Leibler (1951), the probability density function is similar to a distribution. Figure A2 presents the numeric cumulative density function () defined as:
where is the number of the draws less than less than some value and is the total number of draws. Hence, the numeric value implies a probability (all of the simulated values of the information statistic are less than 0.5625) so we reject the hypothesis that our value of is drawn from the control sample. Applying this procedure to the values for the 2017 dataset, so the treatment information statistic is statistically different from that of the control group.
Figure A1.
Probability density function for information statistic for 2014 control group.

Figure A2.
Cumulative density function for information statistic for 2014 control group.

Given these differences, we derive an informational version of the difference in difference model to examine the impact of PSE on agriculture in the Senegal River Basin. Here our approach is similar to the information in the change in farmland values from Moss et al. (2007). Moss et al. (2007) observe the shares of farmland values for each state in year ( where is the total farmland value for state at time ). Using these definitions, they then define the information in the changes in farmland values as:
Using this formulation, we define the information statistic for the difference in the land allocation between crops for the control group as:
where is the share of farmland planted by the control group to crop in year (). Using the values in Table 1— and (the difference value for the treatment group); hence, the informational difference in the treatment group is less than the difference for the control group. The question is then whether this difference is statistically different. Again, we turn to bootstrapping by resampling to form an empirical distribution for . Applying the empirical cumulative density function approach from Equation (11) we find that so we fail to reject that the is different from .
References
- Barrett, Christopher B., Luc Christiaensen, Megan Sheahan, and Abebe Shimeles. 2017. On the Structural Transformation of Rural Africa. Journal of African Economies 26: i11–i35. [Google Scholar] [CrossRef]
- Barrett, Christopher B., Thomas Reardon, and Patrick Webb. 2001. Nonfarm Income Diversification and Household Livelihood Strategies in Rural Africa: Concepts, Dynamics, and Policy Implications. Food Policy 26: 315–31. [Google Scholar] [CrossRef]
- Byerlee, Derek, Alain de Janvry, and Elisabeth Sadoulet. 2009. Agriculture for Development: Toward a New Paradigm. Annual Review of Resource Economics 1: 15–31. [Google Scholar] [CrossRef]
- Carter, Colin A., and Bryan Lohmar. 2002. Regional Specialization of China’s Agricultural Production. American Journal of Agricultural Economics 84: 749–53. [Google Scholar] [CrossRef]
- Christiaensen, Luc, Lionel Demery, and Jesper Kuhl. 2011. The (Evolving) Role of Agriculture in Poverty Reduction—An Empirical Perspective. Journal of Development Economics 96: 239–54. [Google Scholar] [CrossRef]
- Collier, Paul, and Stefan Dercon. 2014. African Agriculture in 50 Years: Smallholders in a Rapidly Changing World? World Development 63: 92–101. [Google Scholar] [CrossRef]
- Diao, Xinshen, and Paul Dorosh. 2007. Demand Constraints on Agricultural Growth in East and Southern Africa: A General Equilibrium Analysis. Development Policy Review 25: 275–92. [Google Scholar] [CrossRef]
- Diao, Xinshen, Peter Hazell, and James Thurlow. 2010. The Role of Agriculture in African Development. World Development 38: 1375–83. [Google Scholar] [CrossRef]
- Eicher, Carl K. 1987. Famine Prevention in Africa: The Long View. East Lansing: Department of Agricultural Economics, Michigan State University, Reprint No. 3. [Google Scholar]
- Emran, M. Shahe, and Forhad Shilpi. 2012. The Extent of the Market and Stages of Agricultural Specialization. Canadian Journal of Economics/Revue Canadienne D’économique 45: 1125–53. [Google Scholar] [CrossRef]
- Fulginiti, Lilyan E., and Richard K. Perrin. 1998. Agricultural Productivity in Developing Countries. Agricultural Economics 19: 45–51. [Google Scholar] [CrossRef]
- Haggblade, Steven, Peter Hazell, and Thomas Reardon. 2010. The Rural Non-Farm Economy: Prospects for Growth and Poverty Reduction. World Development 38: 1429–41. [Google Scholar] [CrossRef]
- Hasan, Rana, and M. G. Quibria. 2004. Industry Matters for Poverty: A Critique of Agricultural Fundamentalism. Kyklos 57: 253–64. [Google Scholar] [CrossRef]
- Irz, Xavier, Lin Lin, Colin Thirtle, and Steve Wiggins. 2002. Agricultural Productivity Growth and Poverty Alleviation. Development Policy Review 19: 449–66. [Google Scholar] [CrossRef]
- Johnston, Bruce F., and John W. Mellor. 1961. The Role of Agriculture in Economic Development. The American Economic Review 51: 566–93. [Google Scholar]
- Klasen, Stephan, Katrin M. Meyer, Claudia Dislich, Michael Euler, Heiko Faust, Marcel Gatto, Elisabeth Hettig, Dian N. Melati, I. Nengah Surati Jaya, Fenna Otten, and et al. 2016. Economic and Ecological Trade-Offs of Agricultural Specialization at Different Spatial Scales. Ecological Economics 122: 111–20. [Google Scholar] [CrossRef]
- Kullback, S., and R. A. Leibler. 1951. On Information and Sufficiency. The Annals of Mathematical Statistics 22: 79–86. [Google Scholar] [CrossRef]
- Lewis, W. Arthur. 1954. Economic Development with Unlimited Supplies of Labour. Manchester School 22: 139–91. [Google Scholar] [CrossRef]
- Manikowski, Stanislaw, and Alexandre Strapasson. 2016. Sustainability Assessment of Large Irrigation Dams in Senegal: A Cost-Benefit Analysis for the Senegal River Valley. Frontiers in Environmental Science 4: 18. [Google Scholar] [CrossRef]
- Mansoor, Ali, Jules Leichter, Salifou Issoufou, Andrea Presbitero, and Joao Jalles. 2017. Senegal: Selected Issues. Washington, DC: International Monetary Fund. [Google Scholar]
- Moss, Charles B., and Henri Theil. 2003. Homogeneity Testing Revisited. Journal of Agricultural and Applied Economics 35 S: 3–4. [Google Scholar]
- Moss, Charles B., Ashok K. Mishra, and Kenneth W. Erickson. 2007. Next Year on the Us Farmland Market: An Informational Approach. Applied Economics 39: 581–85. [Google Scholar] [CrossRef]
- Moss, Charles B., Samba Mbaye, and James F. Oehmke. 2016. Information Measures of Wages and Employment: Application to Senegal. Applied Mathematics 7: 177. [Google Scholar] [CrossRef]
- Moss, Charles B., Alexandre Lyambabaje, and James F. Oehmke. 2017. An Economic Evaluation of Spread on Rwanda’s Rural Population. Applied Economics 49: 3634–44. [Google Scholar] [CrossRef]
- Naseem, Anwar, James F. Oehmke, and Jock R. Anderson. 2016. Measuring Agricultural and Structural Transformation. Paper presented at the Conference on Rural Transformation, Agricultural and Food System Transition: Building the Evidence Base for Policies that promote Sustainable Development, Food and Nutrition Security and Poverty Reduction, FAO, Rome, Italy, September 19–20. [Google Scholar]
- Republique du Senegal. 2014. Plan Senegal Emergent; Dakar: Gouvernement de la République du Sénégal.
- Scott, David W. 1992. Multivariate Density Estimation: Theory, Practice, and Visualization. Hoboken: John Wiley & Sons Inc. [Google Scholar]
- Sheahan, Megan, and Christopher B. Barrett. 2017. Ten Striking Facts About Agricultural Input Use in Sub-Saharan Africa. Food Policy 67: 12–25. [Google Scholar] [CrossRef] [PubMed]
- Timmer, C. Peter. 1988. The agricultural transformation. In Handbook of Development Economics. Edited by Hollis Chenery and T. N. Srinivasan. Amsterdam: Elsevier Publishing, vol. 1, pp. 276–331. [Google Scholar]
- Timmer, C. Peter, and Selvin Akkus. 2008. The Structural Transformation as a Pathway out of Poverty: Analytics, Empirics and Politics. Washington, DC: Center for Global Development. [Google Scholar]
- Van den Broeck, Goedele, and Miet Maertens. 2017. Moving up or Moving out? Insights into Rural Development and Poverty Reduction in Senegal. World Development 99: 95–109. [Google Scholar] [CrossRef]
- World Bank. 2016. World Development Indicators. Washington, DC: World Bank. [Google Scholar]
- Wu, C. F. J. 1986. Jackknife, Bootstrap and Other Resampling Methods in Regression Analysis. The Annals of Statistics 14: 1261–95. [Google Scholar] [CrossRef]
- Yang, Dan, and Zimin Liu. 2012. Does Farmer Economic Organization and Agricultural Specialization Improve Rural Income? Evidence from China. Economic Modelling 29: 990–93. [Google Scholar] [CrossRef]
| 1 | Table A1 in the Appendix A presents the list of control and target villages corresponding to the indicated numbers. |
| 2 | It is tempting to compare the magnitude of change in area share between the treatment and control groups and say that the commercialization of agriculture is now proceeding more rapidly in control areas than in treatment areas, but this would be inaccurate in the context of transformation. The reason for the inaccuracy is that it is comparing across different stages of transformation—it could be that the movement in the treatment group went from 31% to 50% commercialization more quickly, or more slowly, than the control group. Unfortunately, we do not have historical data to resolve that question. Additionally, the movement from 31% to 49% commercialization may be easier than moving from 81% to 91%. |
Figure 1.
Map of Senegal indicating location of study.1
Figure 1.
Map of Senegal indicating location of study.1

Table 1.
Shares of area planted to major crops in 2014 and 2017.
| Grouping | Rice | Millet | Sorghum | Cowpea | Sweet Potato | Onions | Other |
|---|---|---|---|---|---|---|---|
| 2014 | |||||||
| Sample | 46.7% | 17.0% | 2.2% | 4.1% | 0.5% | 5.0% | 24.5% |
| Control | 27.2% | 24.5% | 2.2% | 6.0% | 0.6% | 3.9% | 35.6% |
| Treatment | 74.9% | 6.1% | 2.2% | 1.5% | 0.4% | 6.5% | 8.5% |
| 2017 | |||||||
| Sample | 60.4% | 16.2% | 2.2% | 2.1% | 1.7% | 10.1% | 7.4% |
| Control | 33.4% | 31.3% | 2.1% | 3.7% | 0.4% | 15.6% | 13.4% |
| Treatment | 87.4% | 1.0% | 2.3% | 0.6% | 2.9% | 4.5% | 1.3% |
Table 2.
Variance/covariance matrices for major crop shares.
| Crop | Rice | Millet | Sorghum | Cowpea | Sweet Potato | Onions | Other |
|---|---|---|---|---|---|---|---|
| Complete Sample, 2014 () | |||||||
| Rice | 0.001487 | −0.000510 | −0.000081 | −0.000057 | 0.000007 | 0.000059 | −0.000905 |
| Millet | −0.600165 | 0.000248 | 0.000035 | 0.000018 | −0.000004 | −0.000038 | 0.000251 |
| Sorghum | −0.299393 | 0.303088 | 0.000025 | 0.000005 | −0.000001 | −0.000006 | 0.000023 |
| Cowpea | −0.206916 | 0.153144 | 0.123828 | 0.000026 | 0.000000 | 0.000001 | 0.000007 |
| Sweet Potato | 0.073285 | −0.107219 | −0.055858 | 0.012669 | 0.000003 | 0.000001 | −0.000006 |
| Onions | 0.167522 | −0.251300 | −0.130606 | 0.009197 | 0.069262 | 0.000043 | −0.000060 |
| Other | −0.638783 | 0.417861 | 0.119369 | 0.029736 | −0.081294 | −0.235448 | 0.000690 |
| Std. Dev | 0.038562 | 0.015748 | 0.005000 | 0.005099 | 0.001732 | 0.006557 | 0.026268 |
| Complete Sample, 2017 () | |||||||
| Rice | 0.002758 | −0.001387 | 0.000034 | −0.000016 | 0.000013 | −0.001155 | −0.000248 |
| Millet | −0.919599 | 0.000781 | −0.000037 | −0.000001 | −0.000026 | 0.000581 | 0.000088 |
| Sorghum | 0.111942 | −0.287347 | 0.000031 | 0.000003 | 0.000002 | −0.000037 | 0.000004 |
| Cowpea | −0.065085 | −0.008759 | 0.089300 | 0.000020 | 0.000001 | −0.000027 | 0.000020 |
| Sweet Potato | 0.037088 | −0.176015 | 0.033946 | 0.013757 | 0.000043 | −0.000029 | −0.000003 |
| Onions | −0.806232 | 0.957325 | −0.184549 | −0.106363 | −0.369956 | 0.000705 | −0.000038 |
| Other | −0.344857 | 0.290254 | 0.035569 | 0.154450 | −0.074332 | −0.296891 | 0.000178 |
| Std. Dev | 0.052517 | 0.027946 | 0.005568 | 0.004472 | 0.006557 | 0.026552 | 0.013342 |
| Control Group, 2014 () | |||||||
| Rice | 0.002911 | −0.000928 | −0.000175 | −0.000116 | 0.000017 | 0.000088 | −0.001796 |
| Millet | −0.752295 | 0.000523 | 0.000092 | 0.000029 | −0.000012 | −0.000065 | 0.000361 |
| Sorghum | −0.434531 | 0.535144 | 0.000056 | 0.000010 | −0.000004 | −0.000019 | 0.000041 |
| Cowpea | −0.225652 | 0.134581 | 0.137157 | 0.000090 | 0.000001 | 0.000013 | −0.000028 |
| Sweet Potato | 0.106590 | −0.172849 | −0.189954 | 0.034219 | 0.000009 | 0.000004 | −0.000015 |
| Onions | 0.167599 | −0.292523 | −0.256301 | 0.140215 | 0.135095 | 0.000094 | −0.000115 |
| Other | −0.845240 | 0.400887 | 0.139015 | −0.073576 | −0.126724 | −0.301302 | 0.001552 |
| Std. Dev | 0.053954 | 0.022869 | 0.007483 | 0.009487 | 0.003000 | 0.009695 | 0.039395 |
| Control Group, 2017 () | |||||||
| Rice | 0.003405 | −0.001750 | 0.000143 | 0.000142 | 0.000032 | −0.002083 | 0.000113 |
| Millet | −0.952937 | 0.001159 | −0.000098 | −0.000091 | −0.000020 | 0.000981 | −0.000180 |
| Sorghum | 0.376010 | −0.612062 | 0.000049 | 0.000009 | 0.000003 | −0.000130 | 0.000025 |
| Cowpea | 0.312510 | −0.476152 | 0.143205 | 0.000070 | 0.000002 | −0.000204 | 0.000073 |
| Sweet Potato | 0.232998 | −0.341022 | 0.157397 | 0.080425 | 0.000006 | −0.000027 | 0.000003 |
| Onions | −0.828231 | 0.920258 | −0.374056 | −0.461060 | −0.193894 | 0.002173 | −0.000709 |
| Other | 0.080307 | −0.302806 | 0.127362 | 0.294706 | 0.043024 | −0.585344 | 0.000676 |
| Std. Dev | 0.058352 | 0.034044 | 0.007000 | 0.008367 | 0.002449 | 0.046615 | 0.026000 |
| Treatment Group, 2014 () | |||||||
| Rice | 0.000417 | −0.000147 | −0.000060 | −0.000034 | −0.000003 | −0.000062 | −0.000111 |
| Millet | −0.285072 | 0.000091 | 0.000009 | 0.000016 | 0.000000 | 0.000001 | 0.000029 |
| Sorghum | −0.162717 | 0.058567 | 0.000047 | 0.000001 | 0.000000 | −0.000002 | 0.000005 |
| Cowpea | −0.153567 | 0.171997 | 0.023697 | 0.000017 | 0.000000 | −0.000001 | 0.000001 |
| Sweet Potato | −0.038936 | 0.004278 | 0.012827 | 0.006044 | 0.000002 | 0.000000 | 0.000000 |
| Onions | −0.165844 | 0.006372 | −0.040205 | −0.013655 | 0.010074 | 0.000049 | 0.000016 |
| Other | −0.267058 | 0.166741 | 0.092352 | 0.016365 | 0.014427 | 0.208597 | 0.000059 |
| Std. Dev | 0.020421 | 0.009539 | 0.006856 | 0.004123 | 0.001414 | 0.007000 | 0.007681 |
| Treatment Group, 2017 () | |||||||
| Rice | 0.000509 | −0.000033 | −0.000097 | −0.000021 | −0.000195 | −0.000120 | −0.000043 |
| Millet | −0.135389 | 0.000021 | 0.000003 | 0.000000 | 0.000004 | 0.000004 | 0.000002 |
| Sorghum | −0.210220 | 0.015566 | 0.000073 | 0.000002 | 0.000009 | 0.000005 | 0.000005 |
| Cowpea | −0.108821 | 0.005299 | 0.075327 | 0.000013 | 0.000002 | 0.000002 | 0.000002 |
| Sweet Potato | −0.278554 | 0.012038 | 0.091472 | 0.014768 | 0.000169 | 0.000007 | 0.000005 |
| Onions | −0.236543 | 0.017345 | 0.071212 | 0.024436 | 0.245450 | 0.000088 | 0.000014 |
| Other | −0.203583 | 0.019616 | 0.169539 | 0.048754 | 0.448679 | 0.368350 | 0.000015 |
| Std. Dev | 0.022561 | 0.004583 | 0.008544 | 0.003606 | 0.013000 | 0.009381 | 0.003873 |
© 2018 by the authors. Licensee MDPI, Basel, Switzerland. This article is an open access article distributed under the terms and conditions of the Creative Commons Attribution (CC BY) license (http://creativecommons.org/licenses/by/4.0/).
Share and Cite
MDPI and ACS Style
Moss, C.B.; Mbaye, S.; Naseem, A.; Oehmke, J.F. Did the Plan Sénégal Emergent Affect Cropping Decisions in the Senegal River Basin? Economies 2018, 6, 42. https://doi.org/10.3390/economies6030042
AMA Style
Moss CB, Mbaye S, Naseem A, Oehmke JF. Did the Plan Sénégal Emergent Affect Cropping Decisions in the Senegal River Basin? Economies. 2018; 6(3):42. https://doi.org/10.3390/economies6030042
Chicago/Turabian StyleMoss, Charles B., Samba Mbaye, Anwar Naseem, and James F. Oehmke. 2018. "Did the Plan Sénégal Emergent Affect Cropping Decisions in the Senegal River Basin?" Economies 6, no. 3: 42. https://doi.org/10.3390/economies6030042
Note that from the first issue of 2016, this journal uses article numbers instead of page numbers. See further details here.