Democracy and Inter-Regional Trade Enhancement in Sub-Saharan Africa: Gravity Model


1
Department of Accounting, Economics and Finance, University of Houston-Victoria, Katy, TX 77449, USA
2
Department of Accounting, Economics and Finance, University of Houston-Victoria, Victoria, TX 77901, USA
*
Author to whom correspondence should be addressed.
Economies 2018, 6(3), 45; https://doi.org/10.3390/economies6030045
Submission received: 10 February 2018
/
Revised: 25 July 2018
/
Accepted: 25 July 2018
/
Published: 6 August 2018
(This article belongs to the Special Issue Economic Development in Africa)
Abstract
:There has been considerable research on the effect of democracy on trade openness since the 1980s when development strategies toward free trade and democracy were rapidly adopted in developing countries. Most studies have focused on Asian, Latin American, and former soviet bloc countries and few studies have focused on Sub-Saharan Africa (SSA). This study is an attempt to fill that gap and uses a gravity model approach to test the effects of democracy in SSA on trade. Our results show that democracy has substantial impact on openness to trade and SSA democratic countries will trade more with other countries irrespective of their level of democracy, when compared to non-democratic countries. The results do not vary much even when we use different sources of democracy variable. Also, democratic countries trade more among each other perhaps due to having a shared business environment.
JEL Classification:
F15; C55; O501. Introduction
Previous studies have argued that democratic economies have better functioning institutions and respect for the rule of law (property rights, respect of contracts) as political freedom drives the framework for effective institutions. They also note that since democratic countries have a better institutional framework, they trade much more compared to countries with high tariffs. Transaction costs should be lower in democratic countries as it is expected that things like corruption are less prevalent. It will, therefore, be expected that democratic countries trade more intensively with each other because being democratic induces pro-trade institutions and lowers transaction costs even when we take into account other “natural” transaction costs such as transport, common culture, and language (Siroen et al. 2004; Anderson and Wincoop 2003).
As noted by Acemoglu and Robinson (2001), globalization improves income distribution, thereby reducing political conflict and favoring democratization when trade policies result in a better distribution of assets, such as improved access to education by the poor. The authors, however, note that where gains from trade accrue to the elite especially in commodity exporting countries or where land is the abundant factor, increased trade could impede the emergence of democracy.
Due to the aforementioned factors, many policymakers in developing countries have a positive perception of the causal link between trade openness and democratic governance, which can lead to the deepening of trade liberalization at global and regional levels. Most scholars agree that most of the economically advanced democracies today achieved their status partially because of their openness to international trade (López-Córdova and Meissner 2008).
There has been increased research on the consequences of democracy on trade openness since the 1980s when the general development strategy towards free trade and democracy gained momentum, notably in developing countries. Most studies have, however, focused more on Asian, Latin American and former eastern European Soviet countries. Very few studies, if any, have focused on the impact of the democratization process on trade in Sub-Saharan Africa (SSA) and the present study is an attempt to fill that gap. The study wishes to answer the following questions: whether the transition towards democracy in SSA has led to more trade, whether the democratic SSA countries trade more with other countries irrespective of their region or level of democracy, and finally whether SSA countries that have moved towards democracy trade more with other regional democracies.
According to the International Monetary Fund (IMF) (2015), by 2060 the population of SSA could be as large as 2.7 billion people while Europe’s declining population is projected to drop from 738 million people in 2010 to 702 million in 2060. Integrating SSA’s labor force into global supply chains would, therefore, be beneficial for the global economy. The SSA region’s macroeconomic stability, trade openness, and strong institutions will be critical in harnessing this demographic dividend.
The remainder of the paper is organized as follows. Section 2 provides an overview of the recent economic, political, and trade development trends in SSA. Section 3 provides an overview of trade liberalization and democracy in SSA. The model specification and data issues are presented in Section 3, while the econometric methodology and findings are presented in Section 4. Concluding remarks are presented in the last section.
2. Recent Economic, Political, and Trade Development in Sub-Saharan Africa (SSA)
2.1. Recent Economic Development in SSA
African countries have experienced strong economic growth in the last decade. Some analysts from the region have argued that, perhaps, the continent has reached a turning point in its development and is poised to play a greater role in the global economy of the twenty-first century. The Africa region’s average annual growth rate of real output increased from 1.8% in the period 1980–1989 to 2.6% in 1990–2000 and 5.3% in the period 2000–2010. Also, during the 2000–2010 period, 12 African countries had an average growth rate above the developing-country average of 6.1% and two countries (Angola and Equatorial Guinea) sustained double-digit growth rates. Compared to the 1980s and 1990s, Africa’s average growth rate since the turn of the millennium has also been higher than the average growth rate of the world economy (UNCTAD 2014).
The continent was not immune to the global financial and economic crisis of 2008/2009 which resulted in a significant slowdown in growth, although its average growth rate in the post-crisis period (2008–2012) was about 2 percentage points higher than that of the world economy. Several internal factors have contributed to Africa’s relatively impressive growth performance during the past decade and include, among others, better macroeconomic management, high domestic demand, and a relatively more stable political environment. Some external factors that have contributed to sustained growth include favorable commodity prices, stronger economic cooperation with emerging economies, higher official development assistance since 2000, and an increase in foreign direct investment (FDI) flows (UNCTAD 2014; Osakwe 2010).
However, African countries’ economic growth has yet to translate into benefits in the areas of economic diversification, high-income jobs, and social development. Many countries in the African continent continue to grapple with development challenges that include food insecurity, high unemployment, poverty and inequality, commodity dependence, lack of economic transformation, environmental degradation, and low integration of the continent into the global economy (ECA 2016).
2.2. Democracy in SSA
According to Aideyana et al. (2015), there has not been a common standard for categorizing democracy in SSA and experts have tried to classify political regimes in Africa into five categories: liberal democracies, electoral democracies, ambiguous, liberalized autocracy, and unreformed autocracy. Using these classifications, only the five SSA states of Cape Verde, Mauritius, South Africa, São Tomé and Príncipe, and Botswana could be categorized as “liberal” democracies in 2015 because, in addition to multiparty elections, they “embody respect for civil and political liberties, the existence of relatively effective legislature and judicial institutions, and tolerance for press criticism and dissenting opinions.”
In contrast, other analysts have divided SSA governments into only three groups: modern monarchies such as Swaziland; “full democracies”; and “pretend democracies”. The aforementioned five “liberal” democracies using Aideyana’s classification system are classified as “full” democracies, while all other non-monarchic states are labeled “pretend” democracies (Uwizeyimana 2012).
The SSA democratization process started in the early 1990s as multiparty democracy was sweeping across the region. During this period, single-party states and authoritarian leaders were forced to bow to pressure from within their countries or from the outside. With these changes there was hope that greater political freedoms and stronger institutions, as enabled by democracy, would bring in more government accountability and, therefore, economic development. However, two decades later, there is a huge debate on whether democracy is delivering on these goals in SSA although the majority believes it is still the most viable form of government for the region (Morgan 2013).
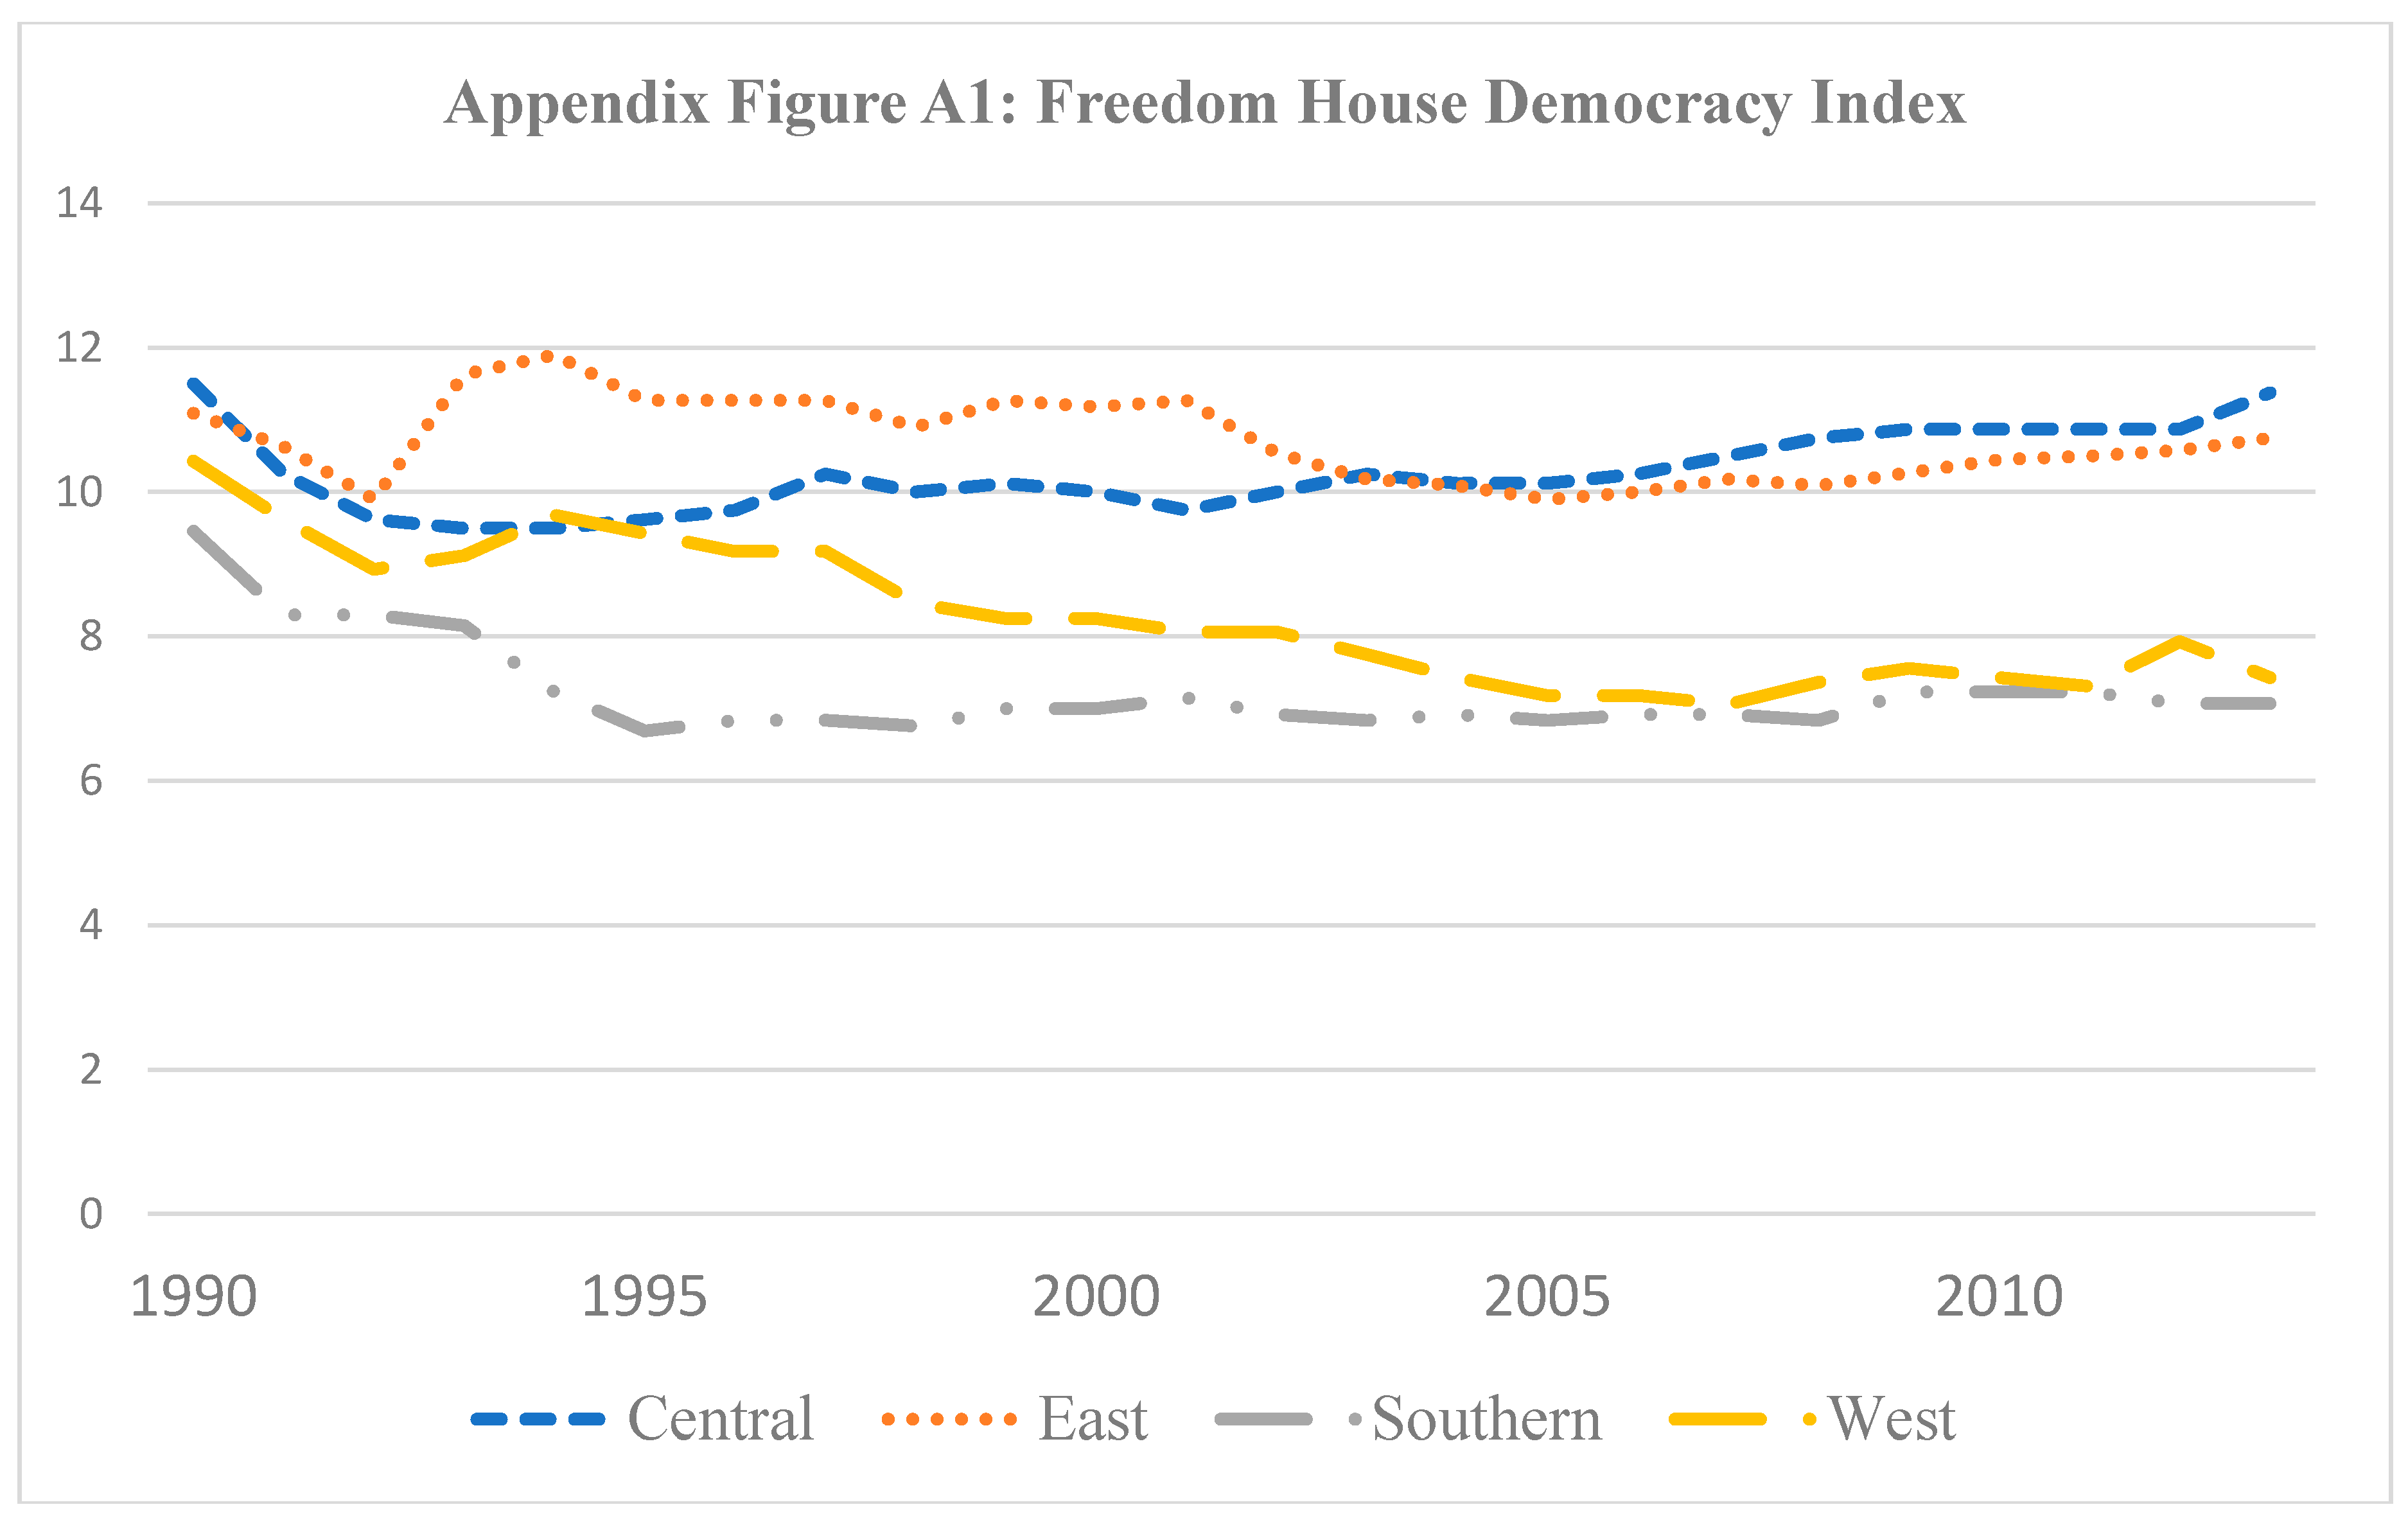
According to Freedom House (2014), SSA experienced a decade and a half of growing democracy through 2005. Since then, the region has experienced 8 years of democratic backsliding, leaving SSA with the same levels of freedom as in 2001. As Appendix Figure A1 shows, over the past 20 years, the growth of democracy has taken two separate paths in SSA, with democracy having dramatically grown in the Southern and West African regions while the East and Central African regions have experienced declines. Although the causes for SSA’s setbacks in the period varied from country to country, the deterioration in the rule of law; restrictions on political pluralism; and curbs on freedom of expression were most common. SSA countries have also suffered declines across all categories of political rights and civil liberties.
Studies have shown that improving the civil rights and liberties in a country influences its involvement in international trade. According to Aidt and Gassebner (2010), democracies trade more than autocracies as democratic political institutions are associated with liberal trade policy. Other studies have argued that international trade encourages democratization (López-Córdova and Meissner 2008).
The movement towards democracy in developing countries such as those in SSA has allowed these countries to reduce their trade barriers dramatically. The democratization process has opened up new avenues of support for freer trade as groups in those countries that had been previously disenfranchised became part of the voting public. According to this argument, the new voting groups in a democracy benefit more from trade liberalization than they do under continued high protectionism. Because of this, democratic political competition has meant that leaders in these countries were likely to choose trade liberalization as a means of gaining broader political support from these new groups and to ensure their political survival (Milner and Kubota 2005; Jenkins 1999).
As noted by an African Development Bank (2003) report, the series of reforms and liberalization efforts that were undertaken by developing countries in the 1980s represented a shift in development strategy from an inward-oriented, import-substituting framework to an outward-oriented, export-promoting framework. This is reaffirmed by Milner and Kubota (2005) who state that the process of democratization among the least developed countries (LDCs) began in the late 1970s, almost a decade before widespread trade liberalization got underway.
SSA was not left behind during this reform and, as noted by Subramanian (2000), the democratization in the African region lent an impetus to trade liberalization. To provide an example of Zambia, which held a successful democratic transition in 1991, the author notes that the new Zambian government launched a massive economic reform program which featured trade liberalization including lowering tariffs from 30% in the late 1980s to 13% by 1996.This is a testament to the idea that advancement in political activities and civil liberties have an influence on changes in trade policy. This holds true when trade liberalization followed an improvement of civil rights and liberties, especially through democratization.
2.3. Trade Liberalization in SSA
The entrance of African countries into the free trade arena has led to the concern, 30 years later, that the free trade model has left many SSA economies overly dependent on raw commodity exports. SSA exports have high levels of concentration with exports of mining and related activities representing over 80% of the total for Mozambique, Zambia, and Botswana, while exports of oil represent over 90% of the total for Angola and Chad. With 60% of SSA exports going to the United States and the European Union, the SSA economies are especially vulnerable to potential financial crises or trade policy changes in these major markets. (Rodriguez and Rodrik 2000). This vulnerability is compounded further by the low price and income elasticities of primary commodities. Thus, a decrease in the global demand for African exports due to the recessions in western countries not only decreases commodity prices and government revenue thereby weakening their fiscal positions, but also has negative impact on real GDP growth rates which worsens their current account balances. Also, many African countries have suffered from increased exchange-rate volatility, which has induced high uncertainty and high costs for international trade (Allen and Giovannetti 2011). Thus, the gains from trade have produced few high paying manufacturing jobs and has been accompanied by rising inequality in SSA.
Those who see the gains from international trade tilted against African countries argue that after lower formal tariffs and quotas at the border are negotiated between developed and African countries, developed countries continue to use non-tariff barriers including product quality controls, sanitary and phytosanitary requirements, rules of origin, etc. which hinders trade from SSA countries (Bowen 2014).
Several policy makers have, therefore, argued that African countries should prioritize on regional commerce over traditional African–European trade flows. Karingi (2013) notes that it might be helpful for African countries to identify trading partners that can support increased manufactured exports by changing the direction of trade and integration priorities.
In the recent past, the African continent has created its own share of regional trade agreements (RTAs) and the continent now has 30 RTAs or trade blocs, many of which are part of deeper regional integration schemes. In Sub-Saharan Africa, some RTAs have contributed significantly to structural reform by creating incentives for removing restrictive trade practices and licensing procedures, streamlining customs procedures and regulations, integrating financial markets, simplifying transfers and payments procedures, and harmonizing tax treatment (Chiumya 2009).
In a few instances, African countries have gone even further, seeking to harmonize investment incentives, standards, and technical regulations, as well as policies relating to transportation, infrastructure, labor, and immigration. The benefits such reforms provide to regional partners spill over into more efficient and equitable treatment of all trading partners and, thus, contribute to a more favorable economic environment, including investment.
3. Model and Data Specification
Like other gravity models that are present in the domain of social sciences, the gravity model for trade is synonymous with Newton’s gravity law in mechanics, which states that the gravitational pull between two physical bodies is proportional to the product of each body’s mass divided by the square of the distance between their respective centers of gravity. The model makes predictions on the bilateral trade flows and assumes that trade between two countries is proportional to their economic “mass” as measured by a product of their national incomes and inversely proportional to the distance between the countries’ respective ‘economic centers of gravity’, generally considered as their capitals. Thus, the present paper adopts a gravity model to estimate patterns of international trade flows. Early proponents of the gravity model specified the representation of the gravity model of trade equation as follows:
In Equation (1), Tij is specified as the value of trade between country i from country j and Yi and Yj are country i and j’s respective national incomes. Dij is specified as a measure of distance between the two countries’ economic centers or capitals and k is a constant of proportionality. β and γ parameters’ signs are hypothesized to be positive while the sign of δ is hypothesized to be positive.
Taking into consideration the multiplicative nature of the gravity equation, Equation (1) is estimated by taking the natural logarithms of all variables and obtaining a log-linear equation that can be estimated by ordinary least squares. This yields a linear form of the gravity model equation which can be represented as follows:
where α, β, γ, and δ are the coefficients to be estimated. The error term (uij) captures any other random events that may affect trade between the two countries and is predicted to have a mean of zero and constant variance.
Thus, in addition to the basic model (2), an augmented gravity model equation is estimated which includes several conditioning variables that account for bilateral trade over and above the natural logarithms of income and distance. To capture the impact of economic differences between countries that influence bilateral trade in our study, we add to (2) GDP per capita . In addition, we add democracy to capture the advancement in political activities and civil liberties in a given economy. We then add other dummy variables by assuming for k distinct effects. The augmented model is summarized as:
Which is equivalent to:
where Zkij represents a vector of dummy variables including shared border, shared language, shared colonizer, shared regional trade agreement, being landlocked, etc. The dummy variables are binary with Zk = 1 for a criterion and zero otherwise.
There are several variables to capture trade costs in a gravity model. In empirical studies, the most common proxy variable for trade costs is bilateral distance. Also, other variables customarily used include dummies for island nations, landlocked countries, and shared borders. The present study uses these different dummy variables to hypothesize that transport costs will increase with distance and are expected to be higher for landlocked countries and islands but lower for countries that share a common border. In addition, dummies for common language and related cultural features such as shared colonial history are included to capture information costs. It is also hypothesized that search costs are lower for trade between countries where business practices, competitiveness, and delivery reliability are well known to one another. It is also expected that firms in adjacent countries that share a common language or other related cultural features are likely to relate better to each other and to understand more of each other’s business practices when compared to firms operating in non-familiar environments. Thus, firms are more likely to look for business in countries where they are more familiar with the business environment. The gravity model also includes tariff barriers, in the form of dummies, for belonging to a regional trade agreement among trading partners (World Trade Organization 2012).
Studies conducted using the gravity models of international trade have yielded consistent high and statistically significant results that carry the expected signs for both income and distance variables. Results from previous studies have shown high R2, thereby explaining a considerable proportion of bilateral trade among countries and fronting it as a successful empirical tool for evaluating bilateral trade among countries. In addition, studies have used the gravity model to evaluate trade policy issues including the impact of protectionism and trade openness (Wall 1999; Harrigan 2003).
Gross Domestic Product (GDP) is taken as a separate independent variable in the study as it has been considered a good indicator of a country’s level of development. As in previous studies, the study assumes that as a country becomes more developed, its citizens have higher purchasing power and will demand more foreign goods that can be considered to be superior to those produced domestically, which will lead to an increase in imports. Also, it is expected that as the country becomes more developed there will be an increase in domestic innovation or the invention of new products which will act as exports to other countries, thereby enhancing regional trade. Previous studies have noted that as countries develop they gain the ability to create efficient transportation infrastructure which is known to facilitate trade.
Another variable considered in the study is transportation cost. The presence of transport costs ensure that factor price equalization theory does not hold in the production of the same good in two or more countries. Studies have shown that trade models behave differently when transport cost and differences in demand across countries are taken into account (Paas 2000). As in previous studies, distance (D) is used as a proxy for transport costs since the distance between two countries is expected to determine the volume of trade between them. Costs associated with doing business at a distance include physical shipping costs, time-related costs, and costs of (cultural) unfamiliarity. Among these costs, physical shipping costs are considered to be the most important (Frankel et al. 1995).
Another transport related variable used in the study is shared border (Bordij). The study assumes that, as in D, countries that share common boundaries engage in more trade due to shorter distance, shared culture, and common language among other factors. A dummy variable is used to identify if a pair of countries share a border with one (1) indicating that countries i and j share a common border and zero (0) when they do not.
Landlocked (LLij) countries in SSA face a lot of challenges including lack of infrastructure development and poor integration of their economies, which makes trade volumes between these countries to be 20% less than countries that are not landlocked. The study uses LLij to capture transport costs and assumes that there is more trade between landlocked and non-landlocked countries than among landlocked countries. The dummy variable is used to denote one (1) where either country i and j is not landlocked and zero (0) if both countries are landlocked.
To capture information costs, common language (Langij) is used. Langij between two trading partners is expected to reduce transaction costs as speaking the same language helps to facilitate trade negotiations. As most SSA countries inherited the languages of their colonizers, common language can also lead to common values and tastes that can foster trade between countries. In the study, a dummy variable is used to denote one (1) when countries share a common language (official or commercial) and zero if otherwise.
Another measure used to capture information costs is shared colonial links (Colij). It is expected that Colij will reduce transaction costs that arise due to cultural differences and also lead to common values. In the study, a dummy variable is used to denote a common colonizer between two trading partners with one (1) indicating country i and j were colonized by the same country and zero (0) if otherwise.
The reason why a country enters into a regional trade agreements is to foster bilateral trade with other members of the region. To capture tariff barriers, the present paper uses three major trade agreements: the Common Market for Eastern and Southern Africa (COMESA), the Southern African Development Community (SADC), and the Economic Community of West African States (ECOWAS).Moreover, the expectation is that countries that belong to one of these agreements will have more trade among themselves than with other countries who are not members of one (Frankel et al. 1995). The dummy variables for COMESA, SADC, and ECOWAS are equal to one (1) where either country i and j belong to the same regional trade agreement and zero (0) if otherwise. Uij is a log-normally distributed error term and represents other variables that effect bilateral trade between African countries. It is expected that E (lnUij) = 0.
The study assumes that good governance in a country as reflected by the adoption of democracy allows two trading partners to relate better to each other. It also allows countries to understand more of each other’s business practices and expected outcome as compared to trading with countries with an unpredictable operating environment or business outcomes. To capture if democracies trade more with each other than with non-democracies, the study uses the log of democracy (lnDemocracyij) variable. Democracy information used in the study comes from two different sources. The first source of democracy is the Freedom House (2014) series of freedom in the world annual survey. Freedom house’s first annual survey was introduced in 1973 to construct an index to measure democracy. Political rights and civil rights are the two indicators that define democracy. While assessing the ratings of freedom, Freedom House’s measure of democracy applies the scale from 1 to 7. Higher freedom performance in a given country is signified as these numbers get smaller. Following Helliwell (1994), we utilize these two indicators in the following manner:
Thus, the range of the transformed index is denoted as zero (0) to signify no political or civil liberties while one (1) denotes fully functioning political rights and civil liberties.
The second source of democracy is obtained from the Polity IV project data set of The Center for Systemic Peace (Marshall 2014).1 The indicators of this index are subjectively similar to the Freedom House data as attributed to each country by the authors (Jaggers and Gurr 1995) on the following basis; “the competitiveness of political participation, the openness and competitiveness of executive recruitment, and the level of constraints on the chief executive”. Although Polity IV uses an 11-point measure (0 to 10, where higher values signify greater democracy), the study follows Rodrik (1999) and converts the ratings to make the Polity IV ratings scale similar to the Freedom House index in which they vary from 0 to 1. The correlation coefficient index for the derived democracy measures between the Freedom House and Polity IV studies is 0.75, which is an indication that the two freedom indexes are highly correlated. The two variables were, therefore, expected to behave relatively similarly in the dataset although as expected this varies depending on the time period. To relax simultaneity, the study used lagged values of the democracy variables.
Finally, DemocDummyij, a dummy reflecting weighted democracy score for country i and j in year t where democracy scale is a number from −10 to +10 was used. Two countries were considered to be both democratic if their weighted score was greater than 6.0.In the study, a dummy variable DemocDummyij is used to denote the two trading partners as democratic in year t with one (1) indicating country i and j were both democratic and zero (0) if otherwise.
Data Specification
The study covers 46 African countries from Sub-Saharan Africa for the period 1995 to 2011 (17 years).The time frame was selected based on the availability of data. Data on GDP, GDP per capita, and population was obtained from the World Development Indicators (WDI) database of the World Bank (The World Bank 2015). Data on exports of goods and services for African countries (country i’s exports) to all other countries (country j) was obtained from the United Nations Conference on Trade and Development (UNCTAD). Data on distance (in kilometers) between the capital cities or commercial centers for the different SSA countries were obtained from the Mapcrow distance calculator website. Data on common language was obtained from the Nationsonline website, while data on former African countries’ colonizers was obtained from the www.worldstatesmen.org website. Also, data on shared border, landlocked countries, and being a member of a particular RTA was compiled by the authors. GDP per capita was calculated in current US dollars as were total exports and total imports, while population was considered in millions.
4. Empirical Results
Table 1 presents definitions and descriptive statistics of variables that were included in the study. As the results show, SSA is a land of contrasts with some countries having GDP 300 times bigger than others and GDP per capita that are over 100 times more than others. The area is also geographically dispersed with average distance between business capitals of almost 1000 km. This might explain some of the low interregional trade when we incorporate the low regional infrastructure development. The table also shows that some countries in the region do not engage in any trade.
Table 2 shows the results of correlation coefficients for the variables. The results confirm that bilateral trade between SSA countries is positively correlated with GDP, level of democracy, shared language, shared common border, belonging to the same regional trade agreements (COMESA, ECOWAS, and SADC), and having had the same colonizer. The results also show negative correlation between bilateral trade among SSA countries and GDP per capita, distance between the two trading partners, and being landlocked. Another important finding from Table 2 is the significant positive correlation between democracy and GDP per capita. There is also a very high correlation between shared colonizer and shared language. As expected, most regional trade agreement memberships are geographical and the results show a high positive correlation between regional trade agreement membership and shared border, and a negative relationship between shared border and regional trade agreement membership. Also, the results show a positive correlation between shared language and being a member of the same regional trade agreement.
5. Empirical Analysis and Discussion
The empirical analysis of the paper involves a set of random-effect panel data regressions where bilateral trade between countries I and j is regressed against GDP, GDP per capita, democracy, and other determinants of trade. The study does not adopt fixed-effect panel since the gravity model includes particular variables that do not vary over time.2 The present study adopts the general least squares (GLS) model for panel data analysis. In the GLS model, all cross-sectional units are observed during the whole time, which is also known as longitudinal data.
The study also applies another estimation technique: a system generalized method of moments (GMM). The GMM estimators offer consistent and unbiased estimates by employing a particular set of instruments. A system GMM is needed in a study with very persistent dependent variables (Blundell and Bond 1998; Bond 2002). Thus, the GMM framework allows us to (i) relax omitted variables problems, (ii) include time-invariant explanatory variables (as the model requires), and (iii) to relax endogeneity concerns using internally generated instruments. Next, we move to a dynamic version of our system GMM.
(a) Costs and Tariff Barriers
Table 3 shows the random effects of GLS regression results. The dependent variable was the overall trade between two SSA countries. Table 3 displays results for the five GLS model regressions and all the estimated five models include time dummies. Model 1 in the first column (Simple Gravity) covers income and distance variables. Models 2 and 3 incorporate the democracy variable with the Freedom House (FH) index. Model 3 (Full with FH index) adds information costs, transportation costs, and tariff barriers to model 2. Lastly, models 4 and 5 which are listed in columns 4 and 5 add the Polity IV index as a democracy variable while other tested variables are the same as in models 2 and 3. Overall, all five GLS regressions models succeeded in explaining the dependent variable as reflected by the significant results and signs of all variables. According to the study, the 12 independent variables are good predictors of trade for the SSA countries except for being land-locked based on the results of the two full models. All models also passed the F-test for overall significance.
As in previous studies, GDP had a positive impact on trade between SSA countries in all of the five GLS regressions and was statistically significant at the 1% level. Also, GDP per capita had a negative sign and was significant at the 1% level in all of the four GLS models. The other important variable in the gravity model is distance, which had the expected negative sign and was significant at the 1% level in all five tested GLS models. For example, the results reveal that a 1% increase in distance reduces trade level among SSA countries by between 1.06 and 2.17% when all five GLS models are considered.
The dummy variables that were used to capture trade determinants among SSA countries were found to be statistically significant at the 1% level, except for being landlocked. To better explain our findings, the study separated the models into four different sub components (large rows) of Governance, Information costs, Transport Costs, and Tariff barriers (RTAs). The results of the study suggest that, with an average coefficient of 0.9 for information cost indicators of language and colonial dummies in the two full models, if SSA countries share the same language, the trade level among them will be higher than their trade with countries with whom they do not share a common language.
Also, the colonial links dummy variable was positive and significant at the 1% level. Based on our results, SSA countries that share similar colonial links will tend to trade more among themselves than with those with whom they do not share similar links. Having a similar background, the same colonial past, and sharing the same language would otherwise decrease the information cost while doing trade in the SSA region. The results on the dummy variable for a border had a positive sign and was statistically significant. The results confirm that SSA countries that are neighbors will, on average, trade 2.5% more among themselves when compared to their trade to those countries with whom they do not share a border. The only dummy variable that is not statistically significant in the two full models was being landlocked. This indicates that being landlocked does affect trade among the SSA countries.
The study considered tariff barriers from three different RTAs: COMESA, ECOWAS, and SADC. Our findings suggest that regional agreements do have a positive and significant impact on trade in the SSA region. Both full models reveal that countries that are in one of these major RTAs will experience more trade among themselves than with others in the SSA region. The average percentage increases for the volumes of trade among the RTAs considered in both models were 1.2% for COMESA, 1.9% for ECOWAS, and 1.7% for SADC.
(b) Democracy and Trade in SSA
One of the important findings from the study was the positive role that democracy plays on trade among SSA countries. To avoid causality issues in the empirical results, the study included lagged values of democracy variables. The results of the study show that democracy variables are positive and significant at the 1% level of significance for both models. Based on the results, a 1% increase in the Freedom House democracy index would increase trade among SSA countries by 0.3% when all other variables are held constant. The results are true when the Polity IV index is used to measure democracy. Our results show that an improvement in the components of democracy will increase trade between the SSA countries by 0.1%, ceteris paribus. Thus, regardless of how democracy is defined, the study reveals that a simple progress in its conditions will translate into a positive economic outcome for the SSA region.
To test if SSA countries that have moved towards democracy trade more with other regional democracies, the study created a dummy democracy variable, DemocDummy. Two countries were considered to be both democratic if their combined average democratic scale was more than 1 based on the scale of 0 to 2. The results of the GLS model, which includes the democracy dummy, are shown in Table 3. As the results show, the democracy dummy was positive and significant at the 5% level in the Freedom House model. This result affirms that SSA countries that are more democratic trade more with other like countries than they do with those that are less democratic. Table 3 results indicate that SSA countries that are democratic have a 12% higher probability of trading more with other democratic countries in the region than they would with non-democratic countries. Contrary to our expectation, the same dummy does not have any effect on trade in the Polity IV model although it has the correct sign with a low magnitude that is not statistically significant. All reported tests indicate a good fit for all five models.
Trade and growth theories suggest that GDP and democracy are expected to be endogenous variables. If this holds, the estimated coefficients of Equation (3) may be biased. Consequently, endogeneity test will be necessary. The next step is to see if we move to the GMM proposed by Arellano and Bond (1991).The null hypothesis is exogeneity. If we reject it, then we use the lnGDP, lnGDPpercap, and lnDemocracy variables as endogenous and apply GMM as an instrumental method.One of the most discussed advantages of the GMM method is that if heteroskedasticity is existing, the GMM estimator is more proficient than the IV estimator. Finally, Sargan–Hansen’s J test is resourceful to check the overall validity of the instruments used in the study.
First, we employ the system GMM technique in Table 4 and then the dynamic GMM. Table 5 displays the results for a dynamic version of the system GMM. In dynamic GMM, we simply add an additional explanatory variable, the time-lagged dependent variable, which allows us to control for time persistence in bilateral trade patterns. This will cause a decrease in the number of observations in the models. Our findings are similar to the previously obtained results.
Sargan–Hansen’s J tests for over-identifying restrictions point out problems with the validity of the instrumental variables. However, when Table 4 and Table 5 GMM estimates are compared with the estimates from Table 3, the differences are negligible. Using explanatory variables lagged for one period and dummies as the instrumental variables do not make much of a difference in the estimates. One reason for this result is our instruments are probably not particularly good because there may be an endogeneity problem and the attempts to address it fail. We may conclude that our estimates are robust to the attempts to address the endogeneity.
6. Concluding Remarks
It is widely expected that countries that adopt democracy will engage in more trade when compared to countries that adopt other kinds of governance. The results of the present paper strongly suggest that SSA countries that have embraced democratic governance enjoy more trade than other SSA countries that are less democratic. The results also indicate that SSA countries that embrace democracy trade more among themselves than they do with other countries from the region. The results of the study are consistent with other studies from the region that have found that regional characteristics such as distance, language, GDP, shared colonial heritage, and shared border play an important role when countries select their trading partners in SSA.
The important policy implication for the SSA regions is that the path towards democracy, as defined by free and fair elections, respect for civil and political liberties, effective legislative and judicial institutions, and tolerance for press criticism and dissenting opinions should never be abandoned as its gains transcend into trade openness and, therefore, economic development.
The results of the study avail of some possible future research queries. The first query is whether it is possible to test for causality between trade and democracy. In other words, which comes first in SSA: democracy or trade openness? In addition, a future study could look at how resource endowment or lack thereof plays a role on trade within SSA and how it affects democratization or the existence of democracy.
Author Contributions
All authors contributed equally to all aspects of the research reported in this paper.
Funding
This research received no external funding.
Conflicts of Interest
The authors declare no conflicts of interest.
Appendix A
Figure A1.
Freedom House Democracy Index.


Table A1.
Panel gravity model estimates fixed-effects.
| Dependent Variable: lnT | Full Model Democracy Variable: Freedom House | Full Model Democracy Variable: Polity IV | |
|---|---|---|---|
| constant | 3.622 (0.881) *** | 2.630 (0.867) *** | |
| Gravity Model | lnGDP | 1.348 (0.095) *** | 1.310 (0.095) *** |
| lnGDPpercap | −0.276 (0.085) *** | −0.187 (0.084) ** | |
| lnDistance | omitted | omitted | |
| Governance | lnDemocracyt-1 | 0.291 (0.054) *** | 0.088 (0.029) *** |
| DemDummyt-1 | 0.116 (0.055) ** | −0.056 (0.058) | |
| Information costs | Language | omitted | omitted |
| Colonial | omitted | omitted | |
| Transport Costs | Border | omitted | omitted |
| LandL | omitted | omitted | |
| Tariff BarriersRTAs | COMESA | omitted | omitted |
| ECOWAS | omitted | omitted | |
| SADC | omitted | omitted | |
| Tests, and others | R-sq (between) | 0.246 | 0.232 |
| F/Wald χ2 | 81.98 *** | 81.98 *** | |
| Rho (fraction variance u) | 0.786 | 0.788 | |
| No. of observations | 16,082 | 16,082 | |
| Time length | 17 | 17 | |
Notes: Standard Errors in parentheses. ***, **, and * Statistical significance at 1, 5, and 10% levels, respectively.
References
- Acemoglu, Daron, and James A. Robinson. 2001. A Theory of Political Transitions. American Economic Review 91: 938–63. [Google Scholar] [CrossRef]
- African Development Bank. 2003. African Development Report 2003. Oxford: Oxford University Press. [Google Scholar]
- Aideyana, Osaore, Osunde Omoruyi, and Benedicta A. Ideho. 2015. Political Openness in Post Authoritarian Sub-Saharan Africa: Domestic and External Pressure to Conformity. Journal of Third World Studies 32: 191–217. [Google Scholar]
- Aidt, Toke S., and Martin Gassebner. 2010. Do Autocratic States Trade Less? The World Bank Economic Review 24: 38–76. [Google Scholar] [CrossRef] [Green Version]
- Allen, Franklin, and Giorgia Giovannetti. 2011. The effects of the financial crisis on Sub-Saharan Africa. Review of Development Finance 1: 1–27. [Google Scholar] [CrossRef]
- Anderson, James E., and Eric Van Wincoop. 2003. Gravity with Gravitas: A Solution to the Border Puzzle. The American Economic Review 93: 170–92. [Google Scholar] [CrossRef]
- Arellano, Manuel, and Stephen Bond. 1991. Some tests of specification for panel data: Monte Carlo evidence and an application to employment equations. The Review of Economic Studies 58: 277–97. [Google Scholar] [CrossRef]
- Blundell, Richard, and Stephen R. Bond. 1998. Initial Conditions and Moment Restrictions in Dynamic Panel Data Models. Journal of Econometrics 87: 115–43. [Google Scholar] [CrossRef]
- Bond, Stephen R. 2002. Dynamic Panel Data Models: A Guide to Microdata Methods and Practice. Portuguese Economic Journal 1: 141–62. [Google Scholar] [CrossRef]
- Bowen, Rike. 2014. Africa’s Free Trade Hangover: Why African Leaders Have Growing Doubts about the Virtues of Free Trade. Available online: Foreignpolicy.com (accessed on 18 May 2016).
- Chiumya, Chiza. 2009. Regional Trade Agreements: An African perspective of challenges for customs policies and future strategies. World Customs Journal 3: 85–92. [Google Scholar]
- ECA (Economic Commission for Africa). 2016. Greening Africa’s Industrialization. Economic Report on Africa. Addis Ababa: ECA (Economic Commission for Africa). [Google Scholar]
- Frankel, Jeffrey, Ernesto Stein, and Shang-Jin Wei. 1995. Trading blocs and the Americas: The natural, the unnatural, and the super-natural. Journal of Development Economics 47: 61–95. [Google Scholar] [CrossRef]
- FreedomHouse (Freedomhouse.org). 2014. Democratic Trends in Sub-Saharan Africa. Washington, DC: Freedom House, Available online: https://freedomhouse.org/node/45793#.U8gBavldWE4 (accessed on 2 April 2018).
- Harrigan, James. 2003. Specialization and the Volume of Trade. In Handbook of International Trade. Edited by E. Kwan Choi and James Harrigan. Oxford: Blackwell Publishers. [Google Scholar]
- Helliwell, John F. 1994. Empirical linkages between democracy and economic growth. BritishJournal of Political Science 24: 225–48. [Google Scholar] [CrossRef]
- International Monetary Fund (IMF). 2015. Regional Economic Outlook, Sub-Saharan Africa Navigating Headwinds. In How Can Sub-Saharan Africa Harness the Demographic Dividend? Washington: International Monetary Fund (IMF), chp. 2. [Google Scholar]
- Jaggers, Keith, and Ted Robert Gurr. 1995. Tracking democracy’s third wave with Polity III data. Journal of Peace Research 32: 469–82. [Google Scholar] [CrossRef]
- Jenkins, Rob. 1999. Democratic Politics and Economic Reform in India. Cambridge: Cambridge University Press. [Google Scholar]
- Karingi, Stephen. 2013. Evidence-based research should inform Africa’s position on regional integration. Paper presented at Economic Commission for Africa (ECA), Addis Ababa, Ethiopia, February 20–21; Available online: www.uneca.org (accessed on 19 May 2015).
- López-Córdova, J. Ernesto, and Christopher M. Meissner. 2008. The Impact of International Trade on Democracy: A Long-Run Perspective. World Politics 60: 539–75. [Google Scholar] [CrossRef]
- Marshall, Monty G. 2014. Polity IV Project: Political Regime Characteristics and Transitions, 1800–2013. Available online: http://www.systemicpeace.org/polityproject.html (accessed on 21 May 2015).
- Milner, Helen, and Keiko Kubota. 2005. Why the Move to Free Trade? Democracy and Trade Policy in the Developing Countries. International Organization 59: 107–44. [Google Scholar] [CrossRef]
- Morgan, Mary. 2013. Can democracy deliver for Africa? BBC Africa. Available online: https://www.bbc.com/news/world-africa-24228425 (accessed on 20 May 2015).
- Osakwe, Patrick N. 2010. Africa and the Global Financial and Economic Crisis: Impacts, Responses and Opportunities. In The Financial and Economic Crisis of 2008–2009 and Developing Countries. New York and Geneva: UN, pp. 203–21. [Google Scholar]
- Paas, Tiiu. 2000. The gravity approach for modeling international trade patterns for economies in transition. International Advances in Economic Research 6: 633–48. [Google Scholar] [CrossRef]
- Rodriguez, Francisco, and Dani Rodrik. 2000. Trade policy and economic growth: A skeptic’s guide to the cross-national evidence. NBER Macroeconomics Annual 15: 261–325. [Google Scholar] [CrossRef]
- Rodrik, Dani. 1999. Democracies pay higher wages. The Quarterly Journal of Economics 114: 707–38. [Google Scholar] [CrossRef]
- Siroen, Jean, Clotilde Granger, and Cindy Duc. 2004. Trade and democracy: An Empirical Investigation. Unpublished paper. Available online: http://www.dauphine.fr/siroen/tradedemo.pdf (accessed on 21 May 2015).
- Subramanian, Arvind. 2000. Trade and Trade Policies in Eastern and Southern Africa. Washington: IMF. [Google Scholar]
- The World Bank. 2015. World Development Indicators. Washington: The World Bank, Available online: http://data.worldbank.org/data-catalog/world-development-indicators (accessed on 22 May 2015).
- UNCTAD. 2014. Economic Development in Africa Report 2014: Meeting Africa’s New Development Challenges in the 21st Century. Sales No. E.14.II.D.2. New York and Geneva: United Nations Publication. [Google Scholar]
- Uwizeyimana, Dominique E. 2012. Democracy and Pretend Democracies in Africa: Myths of African Democracies. Law, Democracy & Development 16: 144. [Google Scholar]
- Wall, Howard J. 1999. Using the Gravity Model to Estimate the Costs of Protection. Review of Federal Bank of Saint Louis 81: 33–40. [Google Scholar] [CrossRef]
- World Trade Organization. 2012. A Practical Guide to Trade Policy Analysis. Geneva: WTO Publications, ISBN 978-92-870-3812-8. Available online: http://vi.unctad.org/tpa/ (accessed on 23 May 2015).
| 1 | The data were downloaded from The Center for Systemic Peace (CSP), Web site: http://www.systemicpeace.org/inscrdata.html (accessed on 10 April 2015). |
| 2 |
Table 1.
Descriptive statistics.
| Variable | Definition | Mean | Median | Minimum | Maximum |
|---|---|---|---|---|---|
| lnT | Log of Trade | 4.594 | 4.431 | 0.000 | 15.771 |
| lnGDP | Log of GDP | 3.460 | 3.118 | 2.307 | 9.162 |
| lnGDPpercap | Log of GDP per capita | 12.660 | 12.452 | 7.947 | 18.641 |
| lnDistance | Log of Distance from one capital to another | 7.762 | 7.890 | 2.824 | 8.940 |
| lnDemt−1FH | Log of Democracy in lag Freedom House source | −0.264 | −0.182 | −2.485 | 0.693 |
| lnDemt−1PIV | Log of Democracy in lag Polity IV source | 0.571 | 0.569 | 0.000 | 1.444 |
| DemDumFH | Democracy dummy (Freedom House)1 if both countries are democratic | 0.302 | 0.000 | 0.000 | 1.000 |
| DemDumPIV | Democracy dummy (Polity IV)1 if both countries are democratic | 0.190 | 0.000 | 0.000 | 1.000 |
| Language | 1 if trading countries share a common language | 0.399 | 0.000 | 0.000 | 1.000 |
| Border | 1 if trading countries colonized by the same country | 0.079 | 0.000 | 0.000 | 1.000 |
| Colonial | 1 if trading countries share a border | 0.264 | 0.000 | 0.000 | 1.000 |
| LandL | 1 if either trading country is not landlocked | 0.889 | 1.000 | 0.000 | 1.000 |
| Comesa | 1 if either trading country belongs to Comesa | 0.111 | 0.000 | 0.000 | 1.000 |
| Ecowas | 1 if either trading country belongs to Ecowas | 0.127 | 0.000 | 0.000 | 1.000 |
| SADC | 1 if either trading country belongs to SADC | 0.082 | 0.000 | 0.000 | 1.000 |
Notes: Missing values were skipped.
Table 2.
Correlation coefficients.
| lnT | lnGDP | lnGDPpercap | lnDist | lnDemFH | lnDemPIV | DemDumFH | DemDumPIV | Lang | Border | Colonial | LandL | Comesa | Ecowas | SADC | Variables |
|---|---|---|---|---|---|---|---|---|---|---|---|---|---|---|---|
| 1 | 0.44 | 0.02 | −0.42 | 0.08 | 0.02 | 0.07 | 0.02 | 0.18 | 0.36 | 0.24 | 0.01 | 0.11 | 0.22 | 0.17 | lnT |
| 1 | 0.33 | −0.07 | −0.01 | 0.03 | 0.02 | −0.01 | −0.03 | 0.08 | 0.04 | 0.14 | −0.10 | −0.05 | 0.03 | lnGDP | |
| 1 | −0.02 | 0.13 | 0.17 | 0.21 | 0.15 | 0.05 | −0.07 | 0.02 | 0.19 | −0.12 | −0.09 | −0.02 | lnGDPpercap | ||
| 1 | 0.05 | 0.04 | 0.02 | 0.03 | −0.13 | −0.50 | −0.10 | 0.07 | −0.16 | −0.36 | −0.13 | lnDistance | |||
| 1 | 0.75 | 0.65 | 0.49 | 0.00 | −0.07 | 0.05 | −0.02 | −0.09 | 0.15 | 0.13 | lnDemFH | ||||
| 1 | 0.65 | 0.69 | 0.01 | −0.06 | 0.02 | 0.01 | 0.01 | 0.07 | 0.16 | lnDemPIV | |||||
| 1 | 0.59 | 0.01 | −0.03 | 0.02 | 0.02 | −0.07 | 0.13 | 0.11 | DemDumFH | ||||||
| 1 | 0.02 | −0.05 | 0.00 | 0.03 | 0.01 | 0.06 | 0.13 | DemDumPIV | |||||||
| 1 | 0.09 | 0.60 | 0.00 | 0.08 | −0.07 | 0.01 | Language | ||||||||
| 1 | 0.11 | −0.05 | 0.01 | 0.17 | 0.05 | Border | |||||||||
| 1 | −0.03 | 0.06 | 0.05 | 0.04 | Colonial | ||||||||||
| 1 | −0.10 | 0.07 | −0.15 | LandL | |||||||||||
| 1 | −0.13 | 0.15 | COMESA | ||||||||||||
| 1 | −0.11 | ECOWAS | |||||||||||||
| 1 | SADC |
Notes: n = 16,082.
Table 3.
Panel gravity model estimates random-effects (general least squares (GLS)).
| Democracy Variable: | Democracy Variable: | |||||
|---|---|---|---|---|---|---|
| FREEDOM HOUSE | POLITY IV | |||||
| Dependent Variable: lnT | Simple Gravity | Gravity only with Governance | Full Model Freedom House | Gravity only with Governance | Full Model Polity IV | |
| constant | 20.235 | 21.031 | 10.863 | 20.343 | 10.023 | |
| (1.108) *** | (1.098) *** | (1.315) *** | (1.106) *** | (1.316) *** | ||
| Gravity Model | lnGDP | 1.510 | 1.528 | 1.520 | 1.516 | 1.510 |
| (0.063) *** | (0.062) *** | (0.060) *** | (0.063) *** | (0.060) *** | ||
| lnGDPpercap | −0.317 | −0.372 | −0.317 | −0.322 | −0.271 | |
| (0.049) *** | (0.049) *** | (0.047) *** | (0.049) *** | (0.046) *** | ||
| lnDistance | −2.157 | −2.172 | −1.140 | −2.161 | −1.101 | |
| (0.123) *** | (0.121) *** | (0.142) *** | (0.123) *** | (0.143) *** | ||
| Governance | lnDemocracyt−1 | --- | 0.333 | 0.312 | 0.083 | 0.075 |
| (0.053) *** | (0.053) *** | (0.028) *** | (0.028) *** | |||
| DemDummyt−1 | --- | 0.144 | 0.131 | −0.025 | −0.033 | |
| (0.054) *** | (0.054) ** | (0.058) | (0.057) | |||
| Information Costs | Language | --- | --- | 0.744 | --- | 0.747 |
| (0.214) *** | (0.215) *** | |||||
| Colonial | --- | --- | 1.100 | --- | 1.120 | |
| (0.235) *** | (0.236) *** | |||||
| Transport Costs | Border | --- | --- | 2.565 | --- | 2.560 |
| (0.352) *** | (0.354) *** | |||||
| LandL | --- | --- | 0.227 | --- | 0.170 | |
| (0.235) | (0.269) | |||||
| Tariff Barriers (Regional Trade Agreements) RTAs | COMESA | --- | --- | 1.147 | --- | 1.116 |
| (0.273) *** | (0.275) *** | |||||
| ECOWAS | --- | --- | 1.728 | --- | 1.868 | |
| (0.279) *** | (0.280) *** | |||||
| SADC | --- | --- | 1.687 | --- | 1.806 | |
| (0.308) *** | (0.310) *** | |||||
| Tests, and others | R-sq (between) | 0.419 | 0.432 | 0.536 | 0.419 | 0.530 |
| F/Wald χ2 | 2302.62 *** | 2388.08 *** | 2755.28 *** | 2315.87 *** | 2694.32 *** | |
| No. of observations | 16,082 | 16,082 | 16,082 | 16,082 | 16,082 | |
| Time length | 17 | 17 | 17 | 17 | 17 | |
Notes: Standard Errors in parentheses. ***, **, and * Statistical significance at 1, 5, and 10% levels, respectively.
Table 4.
System generalized method of moments (GMM)—gravity model estimates.
| Democracy Variable: | Democracy Variable: | |||||
|---|---|---|---|---|---|---|
| FREEDOM HOUSE | POLITY IV | |||||
| Dependent Variable: lnT | Simple Gravity | Gravity only with Governance | Full Model Freedom House | Gravity only with Governance | Full Model Polity IV | |
| constant | 29.850 | 17.756 | 8.803 | 14.364 | −1.039 | |
| (2.014) *** | (1.527) *** | (2.055) *** | (1.628) *** | (0.440) *** | ||
| Gravity Model | lnGDP | 2.043 | 2.049 | 1.856 | 2.123 | 2.077 |
| (0.022) *** | (0.019) *** | (0.034) *** | (0.020) *** | (0.036) *** | ||
| lnGDPpercap | −1.101 | −0.885 | −0.651 | −0.912 | −0.664 | |
| (0.027) *** | (0.022) *** | (0.034) *** | (0.024) *** | (0.031) *** | ||
| lnDistance | −2.355 | −1.153 | −0.873 | −0.715 | 0.383 | |
| (0.231) *** | (0.177) *** | (0.230) *** | (0.189) *** | (0.235) | ||
| Governance | Democracyt−1 | --- | 0.364 | 0.155 | 0.113 | 0.032 |
| (0.063) *** | (0.065) ** | (0.046) ** | (0.046) | |||
| DemDummyt−1 | --- | 0.089 | 0.114 | 0.105 | −0.037 | |
| (0.079) | (0.082) | (0.074) | (0.079) | |||
| Information costs | Language | --- | --- | 0.786 | --- | 2.592 |
| (0.264) *** | (0.245) *** | |||||
| Colonial | --- | --- | 4.496 | --- | 4.009 | |
| (0.266) *** | (0.251) *** | |||||
| Transport Costs | Border | --- | --- | 3.931 | --- | 1.969 |
| (0.672) *** | (0.668) *** | |||||
| LandL | --- | --- | 2.202 | --- | 0.930 | |
| (0.328) *** | (0.361) *** | |||||
| Tariff BarriersRTAs | COMESA | --- | --- | 1.110 | --- | −0.186 |
| (0.287) *** | (0.261) | |||||
| ECOWAS | --- | --- | 2.369 | --- | 2.728 | |
| (0.280) *** | (0.239) *** | |||||
| SADC | --- | --- | 3.122 | --- | 2.410 | |
| (0.337) *** | (0.342) *** | |||||
| Tests, and others | Wald χ2 | 20,604.8 *** | 20,887.67 *** | 22,396.83 *** | 20,936.51 *** | 22,590.51 *** |
| Sargan–Hansen’s J | 0.000 | 0.000 | 0.000 | 0.000 | 0.000 | |
| AR(1) | 0.000 | 0.000 | 0.000 | 0.000 | 0.000 | |
| AR(2) | 0.004 | 0.004 | 0.004 | 0.004 | 0.004 | |
| No. of observations | 16,082 | 16,082 | 16,082 | 16,082 | 16,082 | |
| Instruments | 81 | 145 | 257 | 145 | 257 | |
Notes: Standard Errors in parentheses. ***, **, and * Statistical significance at 1, 5, and 10% levels, respectively. The row for the Sargan-Hansen J-test reports the p-values for the null hypothesis of instrument validity. The values reported for AR(1) and AR(2) are the p-values for first and second order autocorrelated disturbances.
Table 5.
Dynamic GMM—gravity model estimates.
| Democracy Variable: | Democracy Variable: | |||||
|---|---|---|---|---|---|---|
| FREEDOM HOUSE | POLITY IV | |||||
| Dependent Variable: lnT | Simple Gravity | Gravity only with Governance | Full Model Freedom House | Gravity only with Governance | Full Model Polity IV | |
| constant | 26.932 | 17.658 | 13.893 | 17.709 | 12.236 | |
| (1.817) *** | (1.558) *** | (1.887) *** | (1.623) *** | (1.910) *** | ||
| lnTt−1 | 0.362 | 0.426 | 0.355 | 0.422 | 0.341 | |
| (0.012) *** | (0.012) *** | (0.012) *** | (0.012) *** | (0.012) *** | ||
| Gravity Model | lnGDP | 1.258 | 1.141 | 1.195 | 1.182 | 1.366 |
| (0.033) *** | (0.032) *** | (0.042) *** | (0.034) *** | (0.046) *** | ||
| lnGDPpercap | −0.743 | −0.560 | −0.449 | −0.589 | −0.467 | |
| (0.033) *** | (0.029) *** | (0.037) *** | (0.031) *** | (0.036) *** | ||
| lnDistance | −2.428 | −1.521 | −1.507 | −1.495 | −1.205 | |
| (0.205) *** | (0.178) *** | (0.207) *** | (0.186) *** | (0.205) *** | ||
| Governance | Democracyt−1 | --- | 0.246 | 0.132 | 0.115 | 0.061 |
| (0.084) *** | (0.083) | (0.056) ** | (0.053) | |||
| DemDummyt−1 | --- | 0.107 | 0.085 | 0.027 | −0.015 | |
| (0.099) | (0.099) | (0.091) | (0.093) | |||
| Information costs | Language | --- | --- | 0.112 | --- | 1.218 |
| (0.289) | (0.266) *** | |||||
| Colonial | --- | --- | 2.819 | --- | 2.537 | |
| (0.291) *** | (0.276) *** | |||||
| Transport Costs | Border | --- | --- | 1.597 | --- | 0.323 |
| (0.718) ** | (0.711) | |||||
| LandL | --- | --- | 1.034 | --- | −0.288 | |
| (0.370) *** | (0.400) | |||||
| Tariff BarriersRTAs | COMESA | --- | --- | 1.087 | --- | 0.483 |
| (0.324) *** | (0.294) | |||||
| ECOWAS | --- | --- | 1.907 | --- | 2.210 | |
| (0.314) *** | (0.273) *** | |||||
| SADC | --- | --- | 1.942 | --- | 1.057 | |
| (0.387) *** | (0.405) *** | |||||
| Tests, and others | Wald χ2 | 15,433.3 *** | 14,930.56 *** | 16,673.59 *** | 15,034.74 *** | 16,978.17 *** |
| Sargan–Hansen’s J | 0.000 | 0.000 | 0.000 | 0.000 | 0.000 | |
| AR(1) | 0.000 | 0.000 | 0.000 | 0.000 | 0.000 | |
| AR(2) | 0.000 | 0.000 | 0.000 | 0.003 | 0.000 | |
| No. of observations | 15,136 | 15,136 | 15,136 | 15,136 | 15,136 | |
| Instruments | 108 | 170 | 275 | 170 | 275 | |
Notes: Standard Errors in parentheses. ***, **, and * Statistical significance at 1, 5, and 10% levels, respectively. The row for the Sargan–Hansen J-test reports the p-values for the null hypothesis of instrument validity. The values reported for AR(1) and AR(2) are the p-values for first and second order autocorrelated disturbances.
© 2018 by the authors. Licensee MDPI, Basel, Switzerland. This article is an open access article distributed under the terms and conditions of the Creative Commons Attribution (CC BY) license (http://creativecommons.org/licenses/by/4.0/).
Share and Cite
MDPI and ACS Style
Durmaz, N.; Kagochi, J. Democracy and Inter-Regional Trade Enhancement in Sub-Saharan Africa: Gravity Model. Economies 2018, 6, 45. https://doi.org/10.3390/economies6030045
AMA Style
Durmaz N, Kagochi J. Democracy and Inter-Regional Trade Enhancement in Sub-Saharan Africa: Gravity Model. Economies. 2018; 6(3):45. https://doi.org/10.3390/economies6030045
Chicago/Turabian StyleDurmaz, Nazif, and John Kagochi. 2018. "Democracy and Inter-Regional Trade Enhancement in Sub-Saharan Africa: Gravity Model" Economies 6, no. 3: 45. https://doi.org/10.3390/economies6030045
Note that from the first issue of 2016, this journal uses article numbers instead of page numbers. See further details here.