From Linear Industrial Structures to Living Systems: A Design Shift in Education for Sustainability


Walton Sustainability Solutions Initiatives, Arizona State University, P.O. Box 878009, Tempe, AZ, 85287-8009, USA
Educ. Sci. 2017, 7(2), 43; https://doi.org/10.3390/educsci7020043
Submission received: 2 October 2016
/
Revised: 16 March 2017
/
Accepted: 21 March 2017
/
Published: 26 March 2017
(This article belongs to the Special Issue Sustainability, Environment and Education)
Abstract
:If sustainability is to be an integral part of rethinking education organization, it is necessary to redesign mental models that shape present curricular structures. Assumptions underlying the design of most schools and curricula are based on linear industrial models, which raises an essential question: How can we use opposite concepts of systems dynamics and living structures to create a shift in our present thinking about curriculum and learning for sustainability? From this, we can begin a dramatic design shift toward innovative curriculum to prepare future students and teachers. This article begins with a critique of modern industrial education, then moves into an overview of sustainability concepts and structure through systems thinking. The article then presents the research of an original sustainability curriculum that structures assessment to measure systems thinking. From the results, the article then explores a conceptual design framework for a 21st century curriculum that bio-mimics living systems and organic molecular structure, based on systems thinking and mechanistic principles. By placing assessment on competency relationships and not solely assignment completion, this new framework encourages students and educators to develop emerging 21st century skills in the age of digital technology and communication. This essay and framework, which emerged from the author’s dissertation research and findings, offers a new conceptual tool to the field of sustainability education while challenging educators to adopt living systems into their own instructional designs.
1. Introduction
1.1. The Industrialization and Reductionism of Education
At the beginning of the 20th century, the Progressive Era embraced the ideas of scientific management to bring about reform in all sectors of society, one of which was the design and direction of compulsory education. In the email-exchange-turned-book Turning Learning Right Side Up, education experts Russell Ackoff and Daniel Greenberg wrote with the emergence of the Industrial Revolution, it was seen as an imperative to prepare citizens in an education system meant to create workers for a time of booming industrialism: workers who could read (instructions), write (reports), and do math (simple calculations). If the student could take orders and complete a task from a teacher, the student should be able to do the same thing in response to a boss [1].
This idea was based on the “Four Scientific Principles” that engineer Frederick Taylor devised in The Principles of Scientific Management [2] to maximize efficiency of managers and workers of the industrial era. Those four principles include:
- Replace rule-of-thumb work with methods based on the scientific study of the task;
- Scientifically train and develop each worker and not allow them to train themselves;
- Cooperate with workers to ensure that the scientific methods are being followed;
- Split workloads between the managers and the workers, so that the managers can apply scientific methods in planning the work and the workers can perform the task.
To produce the workforce needed for the emerging industrial economy at that time, states adopted these principles into curriculum and instruction so when students left schools and entered factories, they were well groomed to take orders from their managers [1].
This reductionism in education is and has been well researched and critiqued, starting with John Dewey’s Democracy in Education. He wrote that education is meant to be a “fostering, nurturing and cultivating process” [3] (p. 10), but when we confine the education of those who work with their hands to a few years of schooling devoted (for the most part) to acquiring the use of rudimentary symbols at the expense of training in science, literature, and history, we fail to prepare the minds of workers to take advantage of “freeing the mind for a higher order of thinking” [3] (p. 259).
Further works, such as Paulo Freire’s “banking model” in Pedagogy of the Oppressed [4], Bowles and Gintis’ Schooling in Capitalist America [5], and the emergence of Critical Pedagogy often point to how the rigidity and non-adaptive nature of an industrialized education system not only suppresses, but oppresses, many in the education system.
Much like the straight lines of factory conveyor belts, the design of linear systems ruled efficiency for the industrial era. If all products came off the same line, the level of expectation and quality could be expected to be the same. When applied to direct instruction, such as in Figure 1, the model was ideal to supply the country with the workforce needed through a high rate of output of ready workers for industry. By allowing little flexibility in curriculum for efficiency’s sake, the expectation was all students accomplish the same task to the same level of quality at the same time.
The linear model manifests itself in common instruction and assessment items, such as worksheets, end of unit tests, reports and assignments that focus learning objectives on one or a few specific concepts. Many of these instruments follow the concept of the correspondence principle, where work in the classroom is made to mimic tasks in the workplace [6]. When grades are assigned, the value is placed on the assignment, rather than the concept or competency it is aiming to assess, therefore rewarding the completed task. These typical instruction methods are even prevalent in popular sustainability curriculums, such as Facing the Future [7], Science and Sustainability [8], Project WET [9], Going to Green [10] and Teaching Green: The High School Years [11]. While these particular curriculums do a great job introducing and reinforcing sustainability concepts and offer some experiential assignments, much of their content still follows the linear model practiced in other disciplines, perpetuating inherent issues from linear constructs detrimental to learning.
To start, since there are no alternative paths of learning, it creates limited options and a rigid “make-or-break” environment. If a student struggles with the path put before them, it requires more energy and resources on behalf of the student, teacher, and school to ensure that student’s success. This model also requires a high level of top-down control from the teacher, limiting the student’s own input into their educational journey to what the curriculum prescribes. And by being singular and non-adaptive, if an outside disturbance were to affect the student, such as at home issues or lack of resources in the classroom, the resiliency for the curriculum to help students and teachers is greatly limited. By having to teach with these inherent issues of linear curriculum, educational “waste” is created in the forms of wasted time, talent, effort and resources [12] (p. 12).
While these concerns are presented in the scope of societal and educational concerns, they also apply to many mechanistic systems, for instance energy and material being strong enough to overcome resistance and naturally following the path of least resistance, such as giving students options for what concept or assignment they hope to initially learn. The same can be said for encouraging or avoiding feedback loops, such as frequent absenteeism or defiant behavior.
Though there will be substantial variance of student performance, the system inherently creates a ‘monocrop’ of students through a lack of instructional diversity among diversifying student populations. Without diversity and depth of instruction, students are unable to think and act critically to a rapidly changing world, but rather are equipped with as much basic information as they are able to learn and retain.
There have been educational innovations and advances that run counter to this industrialization, such as humanistic education (e.g., Montessori), place-based learning, distance and service learning. Yet, assessment of student learning, even within these models, can still follow industrial education tendencies. And, these alternatives often reach too few students in compulsory education, particularly in public education which serves almost 50 million students, the overwhelming majority of students in the United States alone [13] (p. 20).
Learning is a natural, human process. However, when we look at nature, we find very few linear systems, but rather evolved ecosystems of complex and interconnected relationships. If we shift curriculum away from industrial, linear curriculum design, would a systems model a viable option to teach emerging and interdisciplinary fields in education, such as sustainability? Will it be too complex for students and decrease not only literacy and competence, but motivation as well? Or will the focus on systems thinking not only establish, for the sake of this paper, sustainability competency, but motivate students to explore and create meaningful work and solutions to share with their communities and beyond?
These guiding questions informed the research discussed in this paper about the emerging role of systems thinking in the design of curriculum for sustainability. It provides a brief literature rational for approaching a living systems inspired design for curricula. It then introduces a triangulated approach to a concurrent mixed methods research process measuring the impact of a new curricular structure. The results are then discussed extensively which leads to a conceptual design model of a network map that grows by mimicking concepts of natural systems dynamics. This work emerged from the dissertation research of a public school teacher of a Science, Technology, Engineering, and Math (STEM) magnet program for secondary students [14].
1.2. The Essential Shift to a Natural Systems Model of Education
As sustainability focuses not only on how individual components of a system work independently, special attention is placed on the interconnected relationships that bind them together, making the system work collectively [15]. Examining ecosystems, economic systems, and social constructs to then understand how systems function allows for effective problem solving and development toward resilient systems, be it human made or natural. A system itself is an interconnected web of diverse parts, working together to achieve a common goal. When an outside disturbance affects the system, a more resilient system will be better apt to resist that disturbance or recover from it [16,17]. Maintaining biodiversity, diversifying economies or consuming highly nutritious foods are examples of fostering resiliency.
When assessing society and constructs within it, such as education, we should maintain the approach of systems thinking, especially a living systems approach. Systems theorist Fritjof Capra in The Hidden Connections wrote that “understanding human organizations in terms of living systems, i.e., in terms of complex non-linear networks, is likely to lead to new insights into the nature of complexity, and thus help with the complexities of today’s business environment” [16] (p. 100). When designing for business, education or any human construct, moving away from traditional linear education can allow for innovation and mindsets that are not allowed by linear structures.
When using systems concepts and applying them to curriculum development, the system should be designed to both support and challenge students as they explore, practice, and demonstrate their learning of the curriculum. Students and teachers should know how the system works and how it can be modified and adapted for different learning styles to allow multiple paths of learning. Donella Meadows stated that systems, simple or complex, do have a certain predictability about how they will act [15]. Therefore, understanding systems as networks of relationships is the beginning for one to “see” how systems thinking is a critical tool to enhance learning for all.
In Thinking in Systems: A Primer, Meadows introduces three structural basics of systems:
- elements, or individual parts of a system (such as specific knowledge and skills learned);
- interconnections, or the relationships that hold elements together (the understanding of how two or more elements affect one another);
- function or purpose, which is the emergent behavior of a human and/or nonhuman system through repeated actions [15]. More on this in the discussion section.
Meadows notes that systems have leverage points of intervention ranging from easiest to do with least impact on the system to most challenging to implement with greatest effect [15] (p. 145). So not only should those in education know how to see systems, but know how to best intervene in a system’s structure to make the behavioral changes they seek with the time and resources they have.
Another renowned systems theorist, Jay W. Forrester noted that we need to take systems thinking another step further to system dynamics, which he argued serves as the “foundation under systems thinking” [18]. Forrester argued the very popular process of systems thinking can be “superficial, ineffective and prone to arriving at counterproductive conclusions” [18] if it does not have a means of measuring effectiveness. He says system dynamics include using models to interpret real-life systems, measuring “how things change through time, which covers what most people find important” [18]. While some may say systems thinking inherently includes system dynamics, Forrester made clear we are mostly concerned with how the system will operate and change over time in regard to its overall goal, and not necessarily with the system structure itself. We tend not to think of systems until something has gone wrong. So as Meadows illustrated with her leverage points of intervention and Forrester did with his notion of dynamics, systems are meant to be adjustable and measurable to produce a desired outcome.
Systems theorist Niklas Luhmann argued that all social systems, the largest being society as a whole, rely on communication to function effectively. He wrote that “social systems are self-referential systems based on meaningful communication. They use communication to constitute and interconnect the events (actions) which build up the systems” [19] (p. 131). As systems grow, the communications between system components are what essentially separate the systems from the environment. Just so, “a social system creates the difference between system and environment through the occurrence of communication—that is, by establishing relations between independent living beings” [20] (p. 64). This ability not only distinguishes one’s self from others, such as one student to another, but then helps share learning effectively, critical to an effective systems design of curriculum. W. Edward Deming, a renowned statistician and management consultant, stressed that most problems, from 94% to 97% of any given situation, stem from flaws and inefficiencies in the system’s design and operation [21].
Intention is the first step of design. When looking at issues and possible solutions, we often find a large network of interacting parts, or a series of actions and consequences that affect a greater whole. However, industrialized education has had major implications on an absolutely critical component of teaching and learning sustainability effectively, which is being able to think in systems. This must change as Capra clearly states “we need to fundamentally redesign our technologies and social institutions to bridge the wide gap between human design and the ecologically sustainable systems of nature” [16] (pp. 119–121).
If something was not created by natural systems, then it had to be engineered, which means it had to be designed. David Orr [22,23] wrote at length on design, particularly where nature and design meet. In The Nature of Design, he wrote that “designing with nature … disciplines human intentions with the growing knowledge of how the world works as a physical system … and it is not just about making things, but rather remaking the human presence in the world in a way that honors life and protects human dignity” [22] (p. 4). Further, Orr wrote that poor design results from “poorly equipped minds,” and “good design can only be done by people who understand harmony, patterns and systems. Good design requires a breadth of view … moreover, good design uses nature as a standard and so requires ecological intelligence” [22] (p. 167).
The natural world has been experimenting with and modifying systems performance for nearly 3.8 billion years. Ecosystems continuously adjust and grow from human and natural disturbances, serving as a fantastic model to learn from. Yet much of sustainability curriculum and instruction, which include solutions to address these divides, still use constructs of industrialized education, such as worksheets, teacher-driven instruction and end of unit assessments. Even as some of these curriculums introduce the idea of systems thinking, they do so through linear constructs. It is one thing to be taught about systems thinking, but it is another to be taught through systems thinking. Let us start teaching and learning through systems and not just about them as if they are merely another topic to learn. When we celebrate and design learning to mimic natural systems, especially the diverse and abundant connections that both our modern society and natural world reflects, we will develop the systems, creative and critical thinkers needed for a sustainable future.
Janine Benyus began her book, Biomimicry, with three simple concepts of using biomimicry, or mimicking naturally occurring structures and behaviors, as a design concept:
- Nature as model. Biomimicry is a science that studies nature’s models and then imitates them or takes inspiration from these designs and processes to solve human problems.
- Nature as measure. Biomimicry as an ecological standard to judge innovation “rightness”.
- Nature as mentor. Biomimicry is a way of seeing and valuing nature, based not on what we can extract from the nature, but on what we can learn from it [24] (p. i).
Besides ideas and products that have biomimicry in mind, Benyus also described the structure and function of the brain in comparison to a typical computer. She made several key points regarding the brain, including that it: (a) has multiple sensory inputs; (b) uses parallel (systems) processing as opposed to a computer’s linear processing, which often leads to a bottleneck of inefficiency [24] (p. 196); and (c) is made of carbon, not silicon [24] (p. 195).
This last point is critical. If we look at the core design of living systems, we are brought to a chemical level. Capra consistently stressed that even at the level of chemical and cellular bonds, the rules of systems behavior still apply [16] (pp. 18–32). Benyus quoted evolutionary computational theorist Michael Conrad, in that “the seat of intelligence is proteins and sugars and fats and nucleic acids—all carbon-based molecules” [24] (p. 195). It is the dynamic behavior and strength of carbon bonds that allows the various molecules to take shape, since the purpose of a molecule is determined by its shape. Benyus wrote that “life uses shape of chemicals to identify, to categorize, to deduce and to decide what to do” [24] (p. 194). So then, if molecules can automatically form to do the function that they need to do, then why not use that as a design for allowing learners to form their own learning?
Two other life systems theorists, Humberto Maturana and Francisco Valera, developed the concept of “autopoiesis” or the ability for self-assembly and self-replication. In Autopoiesis and Cognition: The Realization of the Living, Maturana and Valera wrote that all living systems are capable of self-organization and self-replication, which is critical to all living things (cells and organisms) and systems (bodies and ecosystems). The authors argued that there is a level of cognition that comes with living as a process [25]. This idea underlies the notion of creating “lifelong learners”: that students must be instructed to allow for their own learning. So, if autopoiesis is inherent in living systems, then it should manifest in a mimicked design of curriculum for students to self-assemble, self-organize, and self-replicate their own learning.
When cells conduct mitosis, or self-replicate, they start to form a specific tissue. Combined with other tissues, they together eventually grow into an organism. Just as Forrester insisted the need for measurement in systems, growth can be measured. Jackson argued that we should use “nature as measure” [26]. He states by using nature as measure and paying attention to the responses of ecosystems when practicing agriculture, we better our ability to work with the land and not in opposition to it. He wrote, “ecology is our primary field of interest because nature is our standard, the model we use as we design our experiments” [26].
When thinking of a student’s or topic’s “body of knowledge”, we think of their collective and cumulative knowledge. However, when we apply biomimicry to the development of that body of knowledge, we must draw inspiration from where real bodies, or life, begin. The essential shift to a natural systems model of education, particularly for sustainability education, comes from viewing and teaching students as the growing and living collection of molecules, cells, tissues, and bodies they are. Instead of linear conveyor belts for design inspiration, let us design a systems curriculum that biomimics organic molecules and cellular structure and behavior.
Above all other considerations, in order for a systems curriculum to be a viable option for educators, it must functionally work and it must be enjoyable for students and educators. The following section describes the research process measuring the effectiveness of a systems oriented curriculum to help students make interconnections of sustainability knowledge and skills, referred to as competencies. I hypothesize that if students are taught through a curriculum structure that mimics systems dynamics, specifically natural systems (akin to biomimicry), students will focus their learning on the relationships between competencies. When assessment structures shift focus to relationships and give students greater voice to articulate understanding, then assessment scores will rise in comparison to traditional assignment grades. When systems dynamics are applied to how students learn, students will inherently learn interconnectivity of sustainability, providing data which can then be mapped to visually model how somebody system thinks.
2. Research Methodology
The focus of the research was measuring public high school student’s comprehension and articulation of sustainability competencies through a curricular structure designed to mimic systems. The students were enrolled in The Center for Research, Engineering, Science and Technology (CREST) in Phoenix, Arizona, United States. CREST serves as a public Career and Technical Education magnet program focused on the teaching of technical skills for industry application. Housed on a public high school campus, CREST offered a sustainability specific program with a comprehensive course load for enrolled students (the program has since been discontinued). The research was conducted in a single semester (Spring 2014) in two sustainability content courses; Sustainable Energy and Sustainable Materials and Technology.
Though the curriculum followed a traditional linear timeline, it’s structure was fundamentally different. Through instruction and assessment mimicking concepts of dynamical systems, particularly structure (e.g., elements and interconnections) and behavior (e.g., adaptation and self-organization), there is an intentional departure from typical linear instruction (instruct then assess). The curriculum of the two courses focused on content and requisite skills while systems thinking was not explicitly taught. Rather, the aim was students demonstrating relationship based understanding of sustainability competencies by participating in a systems inspired curricular design. While aligned to U.S. Common Core standards, U.S. Next Generation Science Standards and Arizona state standards, the systems curriculum also followed identified principles and competencies of sustainability, such as “Education for Sustainability” standards from The Cloud Institute and Arizona State University’s School of Sustainability.
2.1. Participants
The primary foci for the study were thirteen secondary students at the junior level (ages 16 and 17) who took the two content classes simultaneously. CREST is a competitive elective program accepting students of honors and Advanced Placement levels, this study did not include students of regular or special education level courses. As an elective program, students applied to be admitted to this program. Fourteen students were enrolled in the CREST Sustainability program, with one student’s parents declining their child’s participation in the study.
2.2. Methods
The research was conducted through a concurrent mixed methods approach. The research consisted of three distinct forms of data collection, which required a triangulation of data and methodology. Because of the thirteen students available to participate in the research made a small sample size, a triangulation of methods was chosen to increase the quality of validity of the intended research. The three forms of data collected are entirely student generated:
- Student Rubric Grading: Mixed Media and Dichotomous Rubric Scoring;
- Student Competency Meetings: Interview and Transcription Coding;
- and Student Blogs: Phenomenological and Narrative Inquiry through Graphing.
The hope early in the proposed research methodology was to conduct a formal experimental design for comparative analysis. This would have been a control group of students going through the courses in the typical linear fashion measured against similar students in an experimental group going through methods one and two listed above. As the program experienced some student attrition, the researcher saw dividing the students into two groups would make too small sample sizes, so all students were subject to the same methods. More on this in the conclusion. Below is the nature of each methodological approach, explaining qualitative or quantitative properties, the apparatuses created and the procedures used to collect the data from each method.
2.3. Method One: Student Rubric Grading: Mixed Media and Dichotomous Rubric Scoring
A dichotomous rubric (Figure 2) was the primary means of assigning grades, allowing for tiered assessment based on prioritization of student work and understanding. The rubric followed a mixed-scale model, measuring student outcomes through qualitative determinants and assigning them a quantitative value. This was done to have scores fall into a traditional A to F format to follow the school’s grading scale. The grades were not on assignments, as is typically the case with linear methods, but rather the competencies themselves. The competency a student chose was evaluated on the range and completeness of assignments, articulation of concept and then specific qualities depending on the nature of the competency, mostly focusing on how well students describe interconnections of a given competency to others.
The concept of mixed media comes from the students’ work. With student portfolios as the main means of work submission, a rich database of digital pieces emerged as evidence demonstrating the student’s ability to articulate sustainability comprehension. Assignments were varied and diverse in medium, including written, audio and visual. The students’ work was then subjected to the second and third tiers of the rubric to determine the score.
Student portfolios: With every student at CREST having a Google account, Google sites were used as the primary instrument where students posted and kept their work. It included documents and digital media produced to demonstrate their learning of sustainability concepts along with resumes, bios and blogs.
Dichotomous rubric scoring: As students discussed their understanding of a given competency, they used their portfolios (on their laptop with them at the meeting) to access their mixed media work. The process for evaluating student sustainability competency comprehension followed a structured dichotomous rubric. This rubric asked three major questions that were simply answered with a “yes”, “somewhat”, or “no”. Criteria (listed below) determined what made an answer to then proceed on the rubric. This rubric was developed as a visual aid to help students and teachers in the grading process so expectations were clear, and what was needed to demonstrate sustainability comprehension was easily identified. The evaluative steps and complete rubric are as follows:
- Step 1:
- Are the assignments showcasing this competency complete?5–4 = Yes 3–2 = Somewhat 1–0 = No
- The work contains diversity through variety and creativity;
- Demonstrates a depth of research; existing and experimentation;
- The appropriate terminology was included;
- Tangible examples referenced with “real world” relevancy;
- Principles of sustainability addressed and apparent.
- Step 2:
- Does the student accurately and clearly explain the concept?5–3 = Yes 2–0 = No
- Correct terminology is used fluidly;
- Are articulate with speech and concept;
- Clear and conscious responses to questions;
- Tangible examples referenced with “real world” relevancy;
- Principles of sustainability addressed and apparent.
- Step 3:
- Competency Category Specific Determinate(Simple yes or no for instructor and student judgement)
- Content: Provides relationship to other competencies;
- Theoretical: Provides relationship to other competencies;
- Research: Demonstrates impact on the inquiry process;
- Application: Impact on sustainable practice.
Satisfying a descriptor was left to the judgement of the teacher and student through evidence presented in both work submitted and articulation of the competency. Note that in the third column, the rubric measures how well a student intentionally connected other competencies to the competency being assessed, giving weight to relationship based understanding. Once the score was determined, it was placed on the Sustainability Competencies Scorecard (Figure 3).
Student sustainability competency scorecard: This document tracked the growth and progress of individual student competency scores. Students were expected to maintain this scorecard, serving as a “checklist” to see what competencies had been attempted. The first column are the competencies themselves. The second column is the first score. This is where students placed the score of their first attempt at a competency. At the top of the column within each competency group students were to average scores together. The third column is the second score which allowed students to try the competency again if they were not satisfied with their first score. The fourth and final column has space to link work used to argue and defend their grade. Since assignments were multimedia, students were able place a digital link straight to the assignment(s) used for that competency.
2.4. Method Two: Student Competency Meetings: Interviews and Coding
To justify the second part of the rubric, students needed an opportunity to discuss and articulate their understanding of the competencies while using their work as evidence. I used semi-structured interviews to do this. Interviews were conducted in a responsive style which allowed for flexible questioning during the interview and support give-and-take conversation as opposed to relying on pre-determined questions (Figure 4 serves as an example). For grading purposes during the scoring stage, I discussed with students aspects of a competency missed or omitted that was discussed in class or readings. A qualitative coding sheet for each student was developed (Figure 5), which contained all of the predetermined codes for competencies mentioned in each transcript.
Student interview transcription format: The interviews were recorded with QuickTime audio on my laptop. The student was next to me with their own computer to show their work and spoke aloud to be recorded. Audio files were transcribed into word documents.
The length of an interview depended on how many competencies a students aimed to attempt in a single meeting. I allocated four minutes per competency defense (discussion and showing of work) and then one minute for grade negotiation using the rubric. The discussions were student directed though I posed probing and clarifying questions based on what they had and had not presented. Students were expected to meet for four meetings per semester per course, covering roughly three to four competencies per meeting. If a student failed to negotiate competencies via a meeting, I evaluated student work on their portfolios by myself following the dichotomous rubric.
On the transcription heading, three colored labels make up the coding key. Green is “Assignments Referenced”, blue is “Connected Competency”, and yellow is “Vocabulary Used”. When these items occur in the transcription, the text was highlighted the appropriate color.
Student interview transcription coding sheet: Using a Google Spreadsheet, a coding sheet was created for the transcriptions and highlighted text. Each student had one transcription coding sheet to account for all of their transcriptions.
The coding sheet was designed as a “cross-reference”, allowing for a space to mark when any given competency was mentioned in the context of another competency. The sheet starts with a row labeling the columns and then includes the codes for all of the competencies. In the first column is all of the competency codes, with the actual competency written out in the second column. Bolded lines separate the competency sections into their respective categories, such as the specific content courses, research, theoretical and so on. The abbreviation codes stand for a competency group or cluster:
Content Competencies (Separated by their respective courses):
- POS: Principles of Sustainability
- SEC: Sustainable Ecosystems
- SWF: Sustainable Water and Food
- SEN: Sustainable Energy
- SMT: Sustainable Materials and Technology
The rest of the competencies were then grouped together as whole categories:
- THO: Theoretical
- RES: Research
- APP: Application
(*Note: For the sake of space, the complete list of competencies has been omitted from this article as their presence in entirety is not critical for the purpose of the piece. The competencies and accompanying curriculum can be made available upon request to the author.)
Following each category abbreviation was a number that provided the specific label to a given competency. So, an abbreviation and number made up a competency code, for example the eleventh theoretical competency, Environmental Justice, was coded as THO 11. The numbers were assigned from alphabetical order of the competencies, except for the first five in theoreticals, which were the “Principles of Sustainability” (Anticipating Consequences, Evaluating Trade-Offs, Identifying Stakeholders, Macro/Micro Visioning, Systems Thinking) and led the curriculum use, so they were placed first. In the body of the transcription coding sheet was a steady downward diagonal stream of X’s, which cancelled out the spaces where the same two competencies intersect.
The part of the transcription coded on the spreadsheet was when another competency was mentioned during a competency meeting and highlighted in blue (assignments coded in green and vocabulary coded in yellow were for reference only, not part of statistical measurement). Each time a student mentioned a competency (ROW 2) while discussing another competency for a grade (COLUMN A), a slash marked the intersecting box (Figure 6).
For example, if a student attempted a grade at “Non-Renewable Energy” (SEN2) and was referencing concepts of “Raw Material Extraction” (SMT 2), a slash would be placed in Box AE29. Boxes were only allowed to have one slash. Even if a competency was mentioned multiple times, it was only seen if the connection was made at all. The spreadsheet was used for all of a student’s transcriptions to showcase all of their competency cross-references.
2.5. Method Three: Student Blogs: Phenomenological and Narrative Inquiry
The student blog was one of the most critical pieces of qualitative data for the research. Each student maintained a blog and were required to add at least one entry a week, but given freedom to write about anything in relation to their experience and learning in the CREST program. The content ranged from personal events within the program, things they heard or read outside of the classroom that got them thinking about what happened in the classroom (or vice versa), or how they thought the curriculum was lacking or missing something they thought was important. Completely open to emotion and content, students were encouraged to have no barriers or hesitation to express independent thoughts as this was their opportunity to have voice in the program and study. This was an assignment that came before the research was proposed and provided phenomenological research through narrative inquiry, combining two qualitative methods into a single approach.
For the blogs, a phenomenological approach through narrative form was taken. As Clark Moustakas describes in Phenomenological Research Methods, phenomenological research is “studying a small number of individuals through a prolonged engagement to develop, identify and analyze potential patterns and relationships of meaning” [27] (p. 59). The thirteen blogs documented the students’ insights to the phenomenon of participating in this unique curriculum, allowing students to discuss thoughts and reflections as a part of, and during, the study. The experiences were measured in three contexts; internal/external perspective, negative/positive tone and academic integration. While Moustakas notes phenomenological research uses an analysis of significant statements, the generation of meaning units and the development of the essence of description, the blog analysis focused on individual words and tone [27]. These were targeted to help assess the three contexts to measure and find the essence of the students’ experience.
The inherent nature of blogs maintains student storytelling, which is the root of narrative research. This form complements phenomenological study as Connelly and Clandinin write that “narrative inquiry, the study of experience as story, then is first and foremost a way of thinking about experience. Narrative inquiry as a methodology entails a view of the phenomenon...to adopt a particular view of experience” [28] (p. 375). While narrative devices such as plot, setting, etc. [29] (p. 184) were not used, narrative chronology [29] (p. 13) of the blog posts was used to determine the overall phenomenological transformation of the student from where they started in the semester to where they ended.
Student blogs: With semesters at school 16 weeks long, there should have been 16 posts entries per student. I achieved about 70% success with students maintaining and keeping meaningful blogs. The other 30% have shown either to not maintain consistent blog posts or not blog anything substantive.
Graphing analysis letter: Well after the semester was concluded (~6 months), students were emailed a letter asking them to revisit their blogs to conduct the graphical analysis. The delay in time was intentionally taken to allow mental separation from the experience. This was done to have students read and assess their posts with as much of a neutral and unbiased mind toward the emotional and perspective based axis. The letter explained the process of how to assess the blogs.
Graphing model to copy: In the graphing analysis letter, students were requested to make a copy of a blank graph template (Figure 7). The graph showed two axes, the X axis for Internal/External and the Y axis for Positive/Negative. Along each axis were marks that started at zero and ended at five. There were four quadrants with point total spaces for each quadrant in their respective outside corners.
Example of complete graphing model: In the letter, students were provided a complete example (Figure 8) to serve as a model. The model shows the six considerations asked for in the analysis:
- (1)
- Each blog post made signified by an encircled number, or “dot”;
- (2)
- X-axis consideration (internal/external perspective);
- (3)
- Y-axis consideration (positive/negative tone);
- (4)
- Academic coloring of each post;
- (5)
- An arrowed line connecting the sequence of the blog posts dots;
- (6)
- The numerical value of all the dots in a quadrant, totaled in each quadrant corner.
Student blogs and graphing plane procedure: This section details how students were to score their posts on the blog graphing analysis. Instructions in the letter informed students on how to graph their blogs on metrics based on their own subjective reasoning, which focused on three different dimensions, or “axis” for graphing purposes. The first was the perspective of their blogs which followed the X axis, then the “tone” or emotional context was placed on the Y axis. A third axis is included, called a Z axis. This often leads to a three dimensional graphical plane, but for the sake of not developing cubic graphs, the way this was presented was modified. The Z axis measured the academic content of the blogs, and was depicted by the color of the dots placed on the graph. Unlike the X and Y axis, the Z axis was not subjective and had clear metrics written below.
X Axis: Viewpoint: For the X axis, students were to measure the perspective of the post. “Internal” meant how much they wrote about themselves and their personal reflection in a post. The more personal the post, the more the dot would be on the left. The “external” side of the axis was for how much students focused on an issue or event in the post, so if the post was relatively free of pronouns and emotions and sounded like a current event, they would have placed the dot on the right side of the axis. The measurement was solely based on their subjective judgement. Below is the Likert scale measure included in the directions using increments of five to match the number of increments on the graph.
| X AXIS: INTERNAL TO EXTERNAL |
| LEFT −5 −4 −3 −2 −1 0 1 2 3 4 5 RIGHT |
| personal/emotional balanced/neutral community/world/issues |
Y Axis: Tone: For the Y axis, students were to measure the tone of their post. If students had more positive and optimistic language in the post, dots would be toward the top of the axis. If students read more negative or pessimistic language in their posts, the dots would then have gone toward the bottom. This too was solely based on student’s subjective judgement and followed the Likert scale given below.
| Y AXIS: NEGATIVE TO POSITIVE |
| DOWN −5 −4 −3 −2 −1 0 1 2 3 4 5 UP |
| negative/pessimistic balanced/neutral positive/optimistic |
To give context on the relationship of the X and Y axis, if a student wrote about how good they felt about something they learned or did, the dot would most likely be in quadrant II. If they were writing negatively about some news event or ongoing issue, the dot would be in quadrant IV.
Z Axis: Academic: The third measurement, representing a Z axis, was academic inclusion into the blog posts. Students were to assign the dots different colors based on how many academic mentions their posts had. An academic mention could come from one of three categories:
- Assignments: References to work done in/out of class;
- Competencies: Any of the competencies mentioned;
- Vocabulary: Any time course vocabulary was used.
The color scheme used followed the spectrum of light, or ROY-G-BIV:
- Red: 0–1 Total Mentions
- Orange: 2–3 Total Mentions
- Yellow: 4–5 Total Mentions
- Green: 6–7 Total Mentions
- Blue: 8–9 Total Mentions
- Indigo: 10–11 Total Mentions
- Violet: 12+ Total Mentions
While the hope was the dots would turn from red to eventually violet from post to post, this measurement was meant to see if academic content inclusion has any binding on the other two perspectives.
Quadrants and line meaning: On a standard graphical plane with two axes, there are four quadrants. In this case, the quadrants are labeled I, II, III and IV, starting in the upper right and moving counter-clockwise. I used this part of the graphing process to determine the overall personal experience of the student based off the blog descriptions. Below are the meanings of each quadrant with X axis then Y axis descriptions:
- Quadrant I (+, +) (External, Positive): This quadrant demonstrated a positive or benevolent emotion and perspective on the outside world. When discussing external events or local/global issues, the student tended to have an optimistic view.
- Quadrant II (−, +) (Internal, Positive): This quadrant demonstrated a positive or benevolent emotion with an introspective perspective, focused on personal experiences, reflections and/or insights. Writing was focused on the student and not on local or worldly events.
- Quadrant III (−, −) (Internal, Negative): This quadrant demonstrated a negative view of student’s feelings or emotions. Associated with being upset or expressing displeasure with an experience with or an element of the curriculum.
- Quadrant IV (+, −) (External, Negative): This quadrant demonstrated a negative view on an external perspective. These posts were often pessimistic on local or global issues and may have included elements of despair or frustration in or outside the student’s control.
Since each dot had the sequence number inside of if, not only did that provide the sequential order of the post, but it also gave it weight. Students added up the numbers of all the dots in the respective quadrants. If a dot fell on an axis they were to divide the number in half and add each half to the respective quadrants the dot shared. Once the total of each quadrant was added up, the total was labeled in the outer corner of each quadrant (e.g., Q3 = 16). The quadrant with the greatest number indicated the most probable description of where the student’s perspective finalized and the student’s overall qualitative experience. The weighted analysis describes where the students ended the semester as opposed to where they began. It is more valuable to see what the student was thinking and feeling in week sixteen as opposed to week one since they had more time to work with and experience the curriculum.
Figure 8, the graphing plane example, shows an arrow pointing from the first blog dot to the next. This line connecting the dots demonstrated the student’s narrative in chronological order as the semester moved week by week. By following these arrows, it helped to see the progression of perspective, tone and academic content inclusion and from what quadrants they moved to.
2.6. Ethical Considerations
There was no physical or emotional testing that put the students in danger beyond what is taught at a traditional career and technical education program. As described in the Institutional Review Board (IRB) document approved by Prescott College, anonymity of the students was required since they were minors. Names and gender identifiers were not needed for the purposes of the study. There was no “experimental group” or alteration of instruction or assessment for any individual or group of students. The Paradise Valley Unified School District granted permission to the outlined methodologies.
3. Findings and Analysis
While the data from thirteen participating students made for a small population, the three methods increased the diversity and volume of data from each student, creating a more complete picture of each student’s performance and experience in the systems curriculum. Triangulation was applied to look for ways data converged in the small student population. This increased the validity of the data and allowed more exploration about possible correlations in student work as opposed to looking at data sets in isolation. The findings are explored using graphical and imaged analysis of the data, along with discussion of what the data may be suggesting. Possible errors that may have influenced the data will also be briefly discussed.
Overall, the data suggests that the systems curriculum is a viable method to teach, though it is evident students being accustomed to linear education impacted final outcomes. This was seen in student scores where students who typically perform well in linear curriculums performed just as well in the systems designed course. However, students who had often performed not as well in linear courses saw a slight increase in grades when they used the rubric method and was allowed to voice their learning. Still, those students struggled to complete some non-rubric scored assignments.
No noticeable correlation between students’ grades compared to how many times they mentioned a competency in a meeting was found. However, it should be noted that on the dichotomous rubric, other competency mentions were a lesser priority on grade calculation compared to assignment completion. When students did discuss competencies in relation to one another, they tended to connect competencies from the same category. Interestingly, they frequently discussed competencies in relation to content taught in prior years, not just the content of the then current courses.
While I would argue the academic achievement within the curriculum should be further tested and measured in different educational levels, settings, and scales, the phenomenological blog posts indicated an overwhelming majority of students having a positive experience in the curriculum. Twelve of the thirteen students wrote with an overall positive tone with a near balance of internal and external perspective, indicating students were able to have a positive personal learning experience while viewing the world with optimism. As in molecular structure, when a cell is able to achieve a near balance of internal and external environments, the status is known as “homeostasis”, which living systems aim to achieve. More on this point later in the discussion.
3.1. Data Set One: Student Grades of Mixed Media from Dichotomous Rubric Scoring
The first set of data consisted of the competency grades determined by the dichotomous rubric. Not all assignments in the course were scored using the rubric, creating a slight difference in overall rubric grades and final course grades (Figure 9). The scores determined by the rubric were comparable to the students’ overall grades and followed similar trends of their scores from linear structured courses they had prior. However, for the five students that scored at or below 80% for their overall course grade, four of them scored over 80%, with gains between 2% to 5%. The lower scores can be directly attributed to students not having completed assignments, lowering both the rubric score and the overall score, but having a greater impact on assignments not assessed using the rubric. When students were able to discuss their understanding of a competency along with presenting completed assignments, they were better able to justify and negotiate higher marks. It was noticed that since these students have often experienced lower grades, they tended to offer and settle for lower grades, even when the I felt the need to offer higher scores based on their descriptions.
On the other end of the grade spectrum, students who often enjoyed higher marks in linear instruction continued to do so with the rubric. Of the four students who scored at or above 90% for their rubric scores, all scored slightly higher for their overall course grade, due to having completed all or nearly all of their rubric and non-rubric scored assignments. However, these students were more willing to offer higher grades for themselves and often had to presented a grade a few tenths lower than what they gave, and they often acquiesced. Students at the higher end knew to aim high and felt justified to do so, encouraging higher confidence for higher scores.
Of the competencies, Table 1 shows application scores were the highest at an 8.78 average. The lowest were Content scores for the Energy course, scoring at 8.53. While the spread of 0.25 for all of the competency category average scores do not indicate a significant statistical difference, there was an interesting emergence for students justifying application scores. Along with discussing practice of a described application competency in class, students also noted instances of when this application came into play in other courses, their personal lives and extracurricular activities. By not limiting scoring to immediately observable actions or assigned work, students were able to justify their practice of applications, and by following the rubric, led to higher scores in this category.
Overall, using the dichotomous rubric system helped students who have often experienced lower grades when scores were completely up to the discretion of the teacher and based on assignment completion. However, it does favor students who exhibit a certain moxie when it comes to their sustainability understanding and the confidence to seek higher scores. While the acquisition of grades still reflects a more extrinsic method to sustainability assessment, giving students the chance to discuss, share, and connect what is happening outside of the classroom as part of their learning gives a more complete picture of the student.
If an alteration could have been made to the dichotomous rubric, more weighted emphasis would be placed on students intentionally connecting a discussed competency to other competencies. In the second set of data, it shows that while interconnections of competencies were formed, higher emphasis of competency connection on the rubric could have helped make more connections occur.
3.2. Student Competency Meetings: Interviews and Coding
Sixty-six meetings were held with forty-four transcribed into text, giving a two-thirds sample size. The original intent was to code all sixty-six meetings, but due to time and funding constraints, two-thirds provided adequate statistical representation with each student having at least two meetings. After coding the meetings, the students cumulatively attempted 110 competencies for grades. Within those 110 competencies, 457 distinct connections were made.
However, when the individual student averages of how many competencies were mentioned per discussion were compared to grades, a slight correlation occurred. While the initial thought would be that students with higher grades would have higher frequency averages and students with lower grades would have lower mentions, that was only partially true. The top four students, all whose grades scored over a 90%, scored between 5.80 to 4.50 connections made, significantly higher than the class average of 3.88 connections per discussion. Conversely, while students with 80% or lower did have lesser scores, some scored in the higher range. And, there were high and low numbers from students in the B range, meaning that while higher grades may have a higher frequency of competency mentions per discussion, it did not mean the reverse, or that high competency mention averages meant higher grades. Students in the B range scored somewhat high to very low. Still, the highest averages came from the students with the highest grades.
The scores in Table 2 are represented in bar graph Figure 10, which shows slight correlation between higher grades and more frequent competency mentions.
While the connection between grades and frequency is not entirely clear, the type of competencies that students connected to showed a distinct correlation. Using a large scatter plot style graph as described in the research methodologies, students tended to connect competencies within the same category. For example, a student discussing a SMT competency tended to reference to SMT competencies. While there were plenty of connections made outside of a discussed competency’s respective category, recurring connections from multiple students made a clear picture of what students were and were not learning on a systems thinking level.
The scatterplot (Figure 11), was organized so the competency being discussed was on the left Y axis and the connected competency was on top on the X axis. The intersections indicate the connections that were made. While a connection was only counted once for a given student regardless of how many times they made the connection, they were counted repeatedly if multiple students made that connection. On the scatterplot, a color coded scheme following a ROY-G-BIV format (as described in Section 2.5 for blog post academic content) showed how many connections were made, red for very little to violet for very high. For instance, six of the students, when attempting the “transportation” competency (SMT 4), connected to the theoretical competency “Local to Global Nexus” (THO 15). In that intersecting cell, the number “6” was marked and color coded indigo, indicating that students in the class made a strong connection between these two ideas by understanding aspects of transportation by comparing and contrasting local and international examples and challenges. Most connections made were marked as singular red cells, meaning only one student made that connection.
While the individual cells in the scatterplot show how many students made the connection, the larger categorical boxes (defined by bolded lines) indicate the total number of connections made in that cross-category following the same ROY-G-BIV concept. In the scatterplot, the large blue box near the center, which is when theoretical competencies were connected with other theoretical competencies (THO, THO), indicates that was the most common relationship of all the categories. It should be noted that the theoretical category had the highest amount of competencies, possibly favoring this measure since the color coding was based on total amounts, but this measurement suggests students made significant connections between theoretical components of sustainability.
The data suggests students tend to cluster their competency connections, meaning the majority of their connections are made to same category competencies. By following the black diagonal line, the categorical boxes exhibit colors higher on the spectrum, such as yellows, green and the lone blue, whereas most other boxes are shaded on the lower end of the spectrum, such as red and orange, indicating a lower number of connections. White meant no connections were made. A Pareto Chart also displays this distribution in Figure 12.
On the third step of scoring criteria on the dichotomous rubric, only content and theoretical competencies were explicitly weighted for connections to other competences. This may explain why there were strong connections between content and theoretical competencies but not strong connections to research or application competencies. Besides an increase to an orange shade for application competencies connected to theoretical, all of the content or theoretical to research or application boxes are either red or white. To encourage increased connections to research and application competencies, the rubric should be altered to include these categories, either in addition to or in place of current third step criteria.
For the content courses taught, Table 3 shows Sustainable Materials and Technology had more connections than the Sustainable Energy course for all the students combined. When compared to overall course grades, both the dichotomous rubric score and overall grade class average is lower for Sustainable Energy.
And of the six content competencies for Energy, only fifty connections were made, averaging 8.33 connections per content competency. However, the Sustainable Materials and Technology course with slightly higher grades had much higher connections, with 123 made and 15.38 per competency, suggesting that increased competency connections result in higher scores.
As for evidence of the feasibility of implementing the systems curriculum, the results of the SMT course are very encouraging, signifying higher achievement and a rich sense of systems thinking connecting the course content to the larger themes of sustainability. However, while the scores of the SEN course are only slightly lower, the much lower level of connections made is concerning for the intent of systems thinking. An instructor could use this data to modify instruction and assessments in the SEN course to heighten connection to the other competencies.
The last significant take-away from this data set suggests students regularly revisited and connected to content competencies from prior courses. Students particularly used Sustainable Ecosystems (SEC) content competencies, taught during the fall semester of their sophomore year (a year and a half prior to this research), to discuss theoretical competencies for a grade. With that section shaded as green and others shaded yellow and orange, students often revisited prior content knowledge to discuss and explain their understanding of new concepts. This is strong evidence arguing the use of a systems curriculum that allows and encourages connecting to competencies from other courses.
3.3. Phenomenological Blog Post Analysis
The analysis of the students’ open blogs measuring their phenomenological experience while in the systems curriculum yielded not only personal positive experiences, but gave them a positive view on the role of sustainability in the world. All students responded with completed blog graphs filled with perspective, tone and academic content. Figure 13 is one of the completed student blogs.
It was originally anticipated that students would increase their use of academic items in their blog posts over time. That was not the case. As shown in Figure 14, there were peaks and valleys in the data, but no clear gain or decline over time. In fact, the sixteenth blog post had an average of 3.17 academic item inclusions, and the overall average for all posts was 3.11, signifying a relatively static level of academic item inclusions of just over three items per post.
Besides the slight peak in week nine showing a class-wide average of over four academic items per blog post, Figure 15 indicates only two weeks (four and sixteen) where at least half of the students included four or more academic items in their posts. Week four was the last week all students participated in the blog, and week sixteen where only six students were still writing.
When the number of academic items was compared to the students’ rubric and overall grades in Figure 16, a moderate and interesting correlation occurred (Pearson value of 0.4741).
Four of the five students who scored the highest grades (#4, #9, #10, #12, #13) were at or below 2.5 academic items per blog post. Conversely, the four of the five lowest students (#1, #2, #3, #8, #11) were nearly, at or well above 5 academic items per post, double that of the higher end students. The three students in the middle of score ranking (#5, #6, #7) were also in the middle for academic item inclusion.
For the purposes of how blogs were graded, the inclusion of academic content was not counted. However, when students were asked to electively write anything, just so long as it was about their experience in the CREST program and or sustainability in general, students who had lower grades tended to include more, whereas students with higher grades tended to include less. This is the opposite of what was expected and a very interesting outcome. It cannot be said that students with lower grades spent more time on their blog posts, as students with high grades also had lengthy posts. Also, the students who had lower grades tended to be the students who stopped writing blogs before the semester was over. Since these numbers were determined by average, even if a student had a high number of academic items in their posts, they may have written less than ten blogs. And all students knew completing all sixteen blog posts carried much more weight than the academic content of each post. Still, it is evident that when students are given the opportunity to write openly, what they choose to write may be a strong indicator of what they are learning, even if they are unable to complete all of the writing assignments.
The next correlation was if there was a connection between academic content and where on the graphical plane the posts fell. In Table 4, the table shows how many posts were made in each quadrant and what their academic inclusion was. This table shows a clear majority of posts were made in Quadrant II (Internal: Positive), followed by Quadrant I (External: Positive) and then Quadrant III (Negative: Internal) and Quadrant IV (Negative: External) substantially further behind.
While Quadrant II saw the majority of posts overall, the academic content of posts in Quadrant I had a higher frequency. When looking at Figure 17, the data suggests that when student’s posts were external in perspective and positive in tone, their use of academic items went up.
In Quadrant I, 86% of all posts ranged from 0–7 academic items. Whereas in the other quadrants, all of the posts only reached 0–5 items for about the same percentage. With this increase for Quadrant I, the model suggests that when students work with a positive outlook on the world, they could be more encouraged to use academic content covered in class.
On the blog graphs, each blog post is chronologically numbered. This number gives each post more numerical weight than the one made before it and heavier value the later in the semester it was written. In Table 5, those numeric weights were added up for each student in each quadrant, and each student’s highest totaling quadrant (majority) is also indicated.
The numbers on this table suggest a very encouraging outcome for the students’ phenomenological experience in the systems curriculum. Looking at the quadrant number majority column, there was an even balance of students who had Quadrant I as their highest amount and Quadrant II as their highest amount at six each. This indicates a balance in the class of those who developed a positive external perspective and a positive internal perspective in their open elective writing. Only one student had a majority of points in Quadrant III, the negative internal perspective and no students had a majority in Quadrant IV, negative external.
While the quadrant majorities show a balance, the total overall numbers give further detail on the nature of the student’s blog posts over the course of the semester. Quadrant II was 44 points more than Quadrant I, suggesting that through the entirety of the students’ work within the systems curriculum, their elective writing indicating their personal experience in the program developed a slight 9% preference to internal reflection than discussing external topics. While the slight preference of internal to external is not surprising, which is where the average was expected to line up on the X axis, it is surprising how overwhelmingly positive the students’ blogging tone was. The cumulative totals of Quadrant III was 222, less than half of Quadrant II and nearly less than half for Quadrant I. The negative, external Quadrant IV was only 158, distant to all the other quadrants.
These numbers are critical to explaining the student’s experience. The CREST Sustainability program was incredibly demanding by design, loading students with honors and AP courses in and outside of the sustainability program. In addition to the electives and often jobs these students take on, it would not have been a surprise if the stress at such a young age would have driven students toward Quadrant III. Or, while discussing and working with topics in sustainability, which typically address negative topics such as climate change, species loss, social injustice amongst others, it could have pulled student perspectives to Quadrant IV, but the complete opposite happened. The curriculum was deliberately and intentionally designed to be solutions oriented and encourage strong development of self (as indicated by application competencies) and community engagement (through the Community Events assignments). Incorporating these elements into sustainability curriculum is critical to encouraging and maintaining the drive and desire in students to want and make meaningful change toward a sustainable world, and the blog numbers indicate this is present in the systems curriculum.
4. Discussion
The analysis of data from student scores and the overwhelmingly positive phenomenological experience in the program and curriculum as measured by student blogging suggests the systems based curriculum serves as a viable model of curriculum design for sustainability education. When assessment scores were negotiated over assignment completion, discussion of competencies and relationships established with other competencies, it provided a deeper and clearer understanding of how students were connecting independent ideas together, providing a systems thinking context. To juxtapose those scores with the students’ voice that emerged in the phenomenological data, optimistic student perspectives were not deterred by stress or “grim” content.
Living systems aim to achieve homeostasis, a balance between the internal and external environments of the system, such as cells constantly attempting to maintain homeostasis within the body. The balance between internal and external perspectives was not expected to be as close as it was, nor as overwhelmingly positive, especially with how much work the students had and how potentially discouraging some of the subject matter was, including topics such as climate change, species extinction, pollution, and human rights and health in developing nations. Yet, and possibly at the hands of a curriculum designed to mimic living systems, a semblance of homeostasis was achieved within the students. This section presents a visual mental model mimicking cellular structure that captures the essence of the research to map how a student system thinks.
A Cellular Adaptation to Visually Map the Systems Curriculum
Capra wrote “the key to a comprehensive theory of living systems lies in the synthesis of two very different approaches, the study of substance (or structure) and the study of form (or pattern). In the study of structure we measure and weigh things. Patterns, however, cannot be measured or weighed; they must be mapped. To understand a pattern, we must map a configuration of relationships” [31] (p. 81). Linear education is good at measuring individual things (e.g., concepts, assignments, stand-alone disciplines). Regardless of structure, we still need to measure student outcomes when learning competencies, hence the dichotomous rubric scores. However, when a curriculum structure intentionally assesses how students do or do not make interconnections between competencies, as the data presents, we can map where clusters and gaps of interconnections form. By mapping interconnections, we can see patterns emerge of how a student interweaves competencies, giving us a glimpse of how they systems think. The question now is how do we map it?
Recall from the introduction the brief mention of networks and the basic structure of systems, consisting of elements and interconnections. In network science at its simplest form, those elements, or nodes, are connected by links, often forming a map of what looks like linked dots. The structure and connectivity of networks are dictated by certain rules while unique relationships are allowed to emerge, much like students going through the systems curricular structure (rules) while still making original connections (emergence). It is the individual student’s competency interconnections that demonstrate how they are internalizing and exercising competencies while influenced by unique interests, lived experiences, prior knowledge; a lot of which is left out in linear education but is allowed and encouraged to be included in systems curriculum assessment as described in Section 3.1. It is this unique emergence of competency interconnections from each student that honors each student as a complex system. As physicist Albert-László Barabási, a leading researcher in network theory wrote, “we will never understand complex systems unless we develop a deep understanding of the networks behind them” [32] (p. 24). Students are no different.
The structure of network maps ranges from simple to incredibly complex, but are often given detail and context to avoid looking like a jumbled web. In living systems structures, when we start at the organic molecule level, such as proteins, carbohydrates and lipids, we find they are made of a carbon atom backbone with various elemental atoms bonded to them. If we take that same structural design and replace atoms of elements with specific competencies of sustainability, particularly content, research, application, and theoretical elements of sustainability, we could see how they bond together. These bonds form the interrelationships between ideas and competencies. In keeping with concepts of chemistry, we can measure the strength and resiliency of a student’s relationship based understanding between ideas by using the same principles of chemical bonds:
- Single bonds are typically longer and are the weakest;
- Double bonds have a shorter length and are stronger;
- Triple bonds are the shortest and strongest, meaning they are the hardest to break.
Taking the very familiar sustainability concept of “The Triple Bottom Line”, what if we applied the idea of equity, economy and ecology to the bonds between sustainability competencies? If someone were to only understand one dimension of a relationship between two competencies, instead of three, comprehension of those ideas could be easier to forget or misinterpret, therefore being less resilient.
To continue growth, if competencies act like elemental atoms and come together to form molecules, the next step is for molecules to start forming the next structure of living systems, the cell. To start, see the hollow sphere that is Figure 18. This sphere is the cell membrane where a random sampling of non-content sustainability competencies (research, theoretical and application) are housed. Note the code within each atom serves as an identifier to the respective competency.
As content is introduced to the student, such as topics like energy production, social justice, and water conservation, content elements start to form inside the cell membrane, somewhat like organelles. In Figure 19, an example emerges of a student having discussed four content competencies. Looking at the bonds between competencies, you can see a couple of double bonds and triple bonds between contents, representing richer connections and reflecting the data that suggests students prefer to connect like-category concepts. This forms the content backbone and represents the natural shaping of organic molecules as they are pulled by the strength and lengths of their respective bonds, bending in whatever shape the molecule needs to be in to perform its function in living systems. What further forms the shape of the content backbone are the bonds to the membrane, forming the connections to the other three categories.
As more content is introduced, they begin to bond with other content ideas as well as cell membrane competencies. Serving as a model, as seen in Figure 20, we can draw and measure the strength of bonds between ideas and competencies inside the cell as it continues to grow.
Along with elements and interconnections serving as the basic structure of a system, Meadows includes purpose [15] (p. 11). As interrelationships form between competencies in the cellular model, and where densities and gaps can be seen, it gives a picture to a student’s purpose in regards to what they are learning and how they are tying together given competencies in their own unique way. As an interface for demonstrating adaptive individual learning outcomes, students and educators can use the cellular model to witness where a student’s inclination of systemic understanding of competencies form, giving guidance on how to best direct the student for research, coursework, higher education and career paths that match their interests.
Further, this purpose needs to be articulated and communicated. For cells to survive, the membrane needs to be permeable to allow material in and out. As Capra wrote in regards to the development of cellular systems, “[the] processes of growth and replication will occur only if there is a flow of energy and matter through the membrane” [16] (p. 20). This cell system curriculum model is no different. In any system, there needs to be a force that moves matter or energy through the structure of the system, and with education continuing into the age of information and technology, this force moves with the ability to communicate, particularly through digital communication, seen as an emerging and essential 21st Learning Skill [33,34,35].
The rapid evolution and diversification of modern communication, with changes ranging from different media to audiences of scale, have made the messaging of sustainability all the more complex while being directed at even more rapidly diversifying communities. In The Reality of the Mass Media, Luhmann discussed how the evolution of societal communication has yielded to mass media. He wrote that as human society has become increasingly interconnected through mass media—first with the printing press, then the birth of photography and broadcast, and now digital and social media—“whatever we know about society, or indeed the world in which we live, we know through the mass media. This is true not only of our knowledge of society but also of our knowledge of nature” [36] (p. 1).
It is this reasoning that led to the students using digital portfolios and online blogs to create and share digital artifacts as evidence of learning. With a curriculum model using a permeable cell membrane to allow content in and out the cell, it allows for communication input as well as sharing of gained knowledge output, critical aspects of systems thinking. Students, like cells, rely on rapid communication with others to achieve growth, much like the growth of tissues, organs, and the whole organism. If each class a student took were its own individual cell, they could start to clump together, forming tissues. As those tissues form over time, much like a student through their own educational journey, a measureable and distinct organism can grow, forming their “body” of knowledge.
5. Conclusions
The initial elements and concepts of relationship based thinking that gave rise to this model demonstrated increased achievement and measureable systems thinking among the students. The findings support the guiding questions and hypothesis of this curriculum by being both functional in its academic rigor and enjoyable for students to participate in and learn from. This was measured through assessments that shifted focus to how well students connected ideas, and not demonstrating mastery of ideas in isolation.
The next steps for the research is:
- to take this conceptual model and create a software program where educators can enter competency scores into a digital platform and a cellular model slowly emerges as ideas and competencies are demonstrated by the student;
- to further test the systems curriculum with students of various academic settings, scales, abilities and levels;
- develop appropriate packaging and organization of the systems curriculum for ease of educator understanding and implementation (pending further testing results).
As described near the start of the methods section, the original intent was to conduct the experiment via a control and experimental group. While the student population became too small to facilitate this, there are some aspects of the research that give insight to how this could look, such as in Figure 9, where the rubric scored cumulative grade was compared to the student’s overall grade which included non-rubric scored work. This alone does not provide sufficient evidence to claim that the systems curriculum is superior at student learning than the linear structure, which is why this paper concludes the systems curriculum as a viable model that could serve as an alternate, and not as a higher functioning, curriculum structure.
5.1. Stakeholder Recommendations
To formally evaluate, choose, and adopt curriculum of any kind requires the consideration of many stakeholders, from those who make the decision to use the curriculum to those who are impacted by it. In this section, the consideration of stakeholders who may be interested in this study is briefly discussed. This section is not intended to be exhaustive nor comprehensive, but rather the starting point of conversation to implementing the systems curriculum and how it may impact those who have an interest in sustainability and education.
School Administrators (Principals, Superintendents): Those in administrative positions have heavy influence in the curriculum models implemented in their schools. From curriculum specialists who work directly with teachers to the superintendent’s office at the top level of school districts, it is recommended that people in these positions focus on creating environments where students are able to spend more time with consistent teachers to foster stronger relationships. If assessment structures are school or district wide, help teachers to move towards assessment that focuses on relationships between concepts, disciplines, and classes. And if possible, enhance greater access to technology to enhance student’s development of digital media literacy.
Teachers: Teachers ultimately drive the implementation of the curriculum in the classroom. For those who teach, shift instruction and lesson design toward the relationships between ideas. More importantly, encourage students to start seeing their work as a body of evidence of their understanding, not just as singular grades. Additionally, being aware that assignments can be reused to justify their learning of other competencies, so organizing past work is critical. Adopting organization tools (calendars, portfolios, etc.) for students will help.
Students and Families: Students and their families can carry great weight to influence their schools of what and how content is taught. Not only should students become familiar with the competencies taught in class, but families should also become aware of the competencies. Families can also help the student connect development of competencies in their work outside of the classroom, where the teacher does not get to see the student’s efforts and the student may think their work does not count toward their grade. If this curriculum and research is of interest, families can start a dialogue with teachers, administrators and even at school board meetings.
Community Members (Local Professionals, Elected Officials, Group Leaders, Public): Members of the community, such as those who run local businesses, leaders of various interest groups, elected officials and the general public can exercise great influence onto the curriculum taught at their local public schools. As curriculum and quality of instruction shapes a student’s educational outcome and greatly influences their skills and abilities, this group may have great interest in the development of a community’s citizenry, workforce and electorate by elaborating on what skills and knowledge are needed to succeed in the community.
Other Researchers: This research needs to be evaluated in other educational settings. As discussed, the small sample size was a select group of advanced secondary students. Other settings such as higher education, private schools and K-8 may give different results or may not be compatible with the demands of elementary or higher education. Researchers who desire to expand upon this research are encouraged to have a firm understanding of the methodology, clearly identify the competencies to be assessed and establish contracts of participation with students and educators. It is also recommended that for future testing, researchers include an experimental and control group of similar students to have comparative analysis of linear and systemic structures.
5.2. Two Arguments against the Systems Curriculum
There are two areas of contention with the systems curriculum that persisted during the building of the program and collecting the data. The first is why the assembly line and the industrial revolution came about the first place: volume of workforce, inputs, and outputs. While this research worked with a small class size, it is not known how or if the systems curriculum would work with large class sizes. If class sizes are expected to rise, then this idea of “mass production” of assessment carries greater weight. It is hard to imagine a single teacher adequately facilitating the discussion component of the curriculum with class sizes of thirty to forty students. Additionally, if increased standards and learning expectations are placed on the students, and subsequently the teachers, it further exacerbates the stress on teachers to assess students as timely as possible for each assignment.
The second argument is the focus on digital media. Use of digital media and technology may conflict with other sustainability practitioner’s pedagogies, and may make inaccessible some components of the curriculum if certain aspects of technology (e.g., computer access) are not available. Certain changes would need to be made to the facilitation of the curriculum to accommodate this.
5.3. Final Considerations
Peter Senge states “a sustainable world will only be possible by thinking differently. With nature and not machines as their inspiration, today’s innovators are showing how to create a different future by learning how to see the larger systems of which they are a part” [37] (p. 10). This design shift offers a curriculum model to the field of sustainability education that directly adopts sustainability concepts into relationship based competencies. And this model of education is not made up or invented anew, but rather adopted from structures that have been in practice for over three billion years. When broken down to its simplest elements and magnified to entire biomes, we find the interconnected web of life supported by relationships, and that no living thing exists in isolation. Students do not learn in isolation either. While traditional subjects such as language arts, science, math and social studies may require more time to adapt this type of model, it is imperative for students of sustainability to learn not just of, but though systems as soon as they are introduced to the concept.
To continue sustainability education through linear models is to limit students’ abilities to make connections, establish relationships, communicate their work and truly understand the complexity of sustainability. And when students, teachers, and parents can visually see a model emerge as their student systemically learns sustainability, it may allow for a more targeted and individualized assessment rather than standardized test scores and grade structures that exclude so much of a student’s talents, interests, experiences, and abilities. For any educational setting serious about innovative and not reformative education, this living systems structured curriculum and instructional model commands attention as a viable and appropriate option for sustainability education.
Conflicts of Interest
The author declares no conflict of interest in this work.
References
- Ackoff, R.; Greenberg, D. Turning Learning Right Side Up: Putting Education Back on Track; Wharton School Publishing: Upper Saddle River, NJ, USA, 2008; pp. 49–56. [Google Scholar]
- Taylor, F. The Principles of Scientific Management; Harper and Brothers: New York, NY, USA, 1911. [Google Scholar]
- Dewey, J. Democracy in Education; The Free Press/Macmillian: New York, NY, USA, 1916. [Google Scholar]
- Freire, P. Pedagogy of the Oppressed; Bloomsbury: New York, NY, USA, 1970. [Google Scholar]
- Bowles, S.; Gintis, H. (Eds.) Schooling in Capitalist America: Educational Reform and the Contradictions of the Economic Life; Haymarket Books: Chicago, IL, USA, 2011. [Google Scholar]
- Bowles, S.; Gintis, H. Schooling in capitalist America revisited. Sociol. Educ. 2002, 75, 1–18. [Google Scholar] [CrossRef]
- Facing the Future. Global Sustainability Curriculum and Teacher Professional Development; Western Washington University: Seattle, WA, USA, 2014; Available online: http://www.facingthefuture.org/ (accessed on 4 September 2016).
- Science Education for Public Understanding Program. Science and Sustainability; Lawrence Hall of Science, University of California at Berkeley: Berkeley, CA, USA, 2005. [Google Scholar]
- Project WET. Healthy Water Healthy People: Water Quality Educators Guide; Project WET International Foundation: Bozeman, MT, USA, 2003. [Google Scholar]
- Wiland, H.; Bell, D. Going to Green: A Standards Based Environmental Education Curriculum for Schools, Colleges and Communities; Chelsea Green Publishing: White River Junction, VT, USA, 2009. [Google Scholar]
- Grant, T.; Littlejohn, G. (Eds.) Teaching Green: The High School Years; New Society Publishers: Gabriola Island, BC, Canada, 2009. [Google Scholar]
- Jenkins, L. From Systems Thinking to Systemic Action: 48 Key Questions to Guide the Journey; Rowman and Littlefield Education: Lanham, MD, USA, 2008. [Google Scholar]
- National Center for Education Statistics. The Condition of Education 2012; U.S. Department of Education: Washington, DC, USA, 2012.
- Bernier, A. Designing a Systems Based Curriculum to Develop 21st Century Sustainability Literacy and Communication Skills. Ph.D. Thesis, Prescott College, Prescott, AZ, USA, 2015. [Google Scholar]
- Meadows, D. Thinking in Systems: A Primer; Chelsea Green: White River Junction, VT, USA, 2008. [Google Scholar]
- Capra, F. The Hidden Connections: A Science for Sustainable Living; Anchor: New York, NY, USA, 2002. [Google Scholar]
- Walker, B.; Salt, D. Resilience Thinking: Sustaining Ecosystems and People in a Changing World; Island Press: Washington, DC, USA, 2006. [Google Scholar]
- Forrester, J.W. System Dynamics: The Foundation under Systems Thinking. 2010, pp. 1–3. Available online: http://clexchange.org/ftp/documents/system-dynamics/SD2011-01SDFoundationunderST.pdf (accessed on 6 September 2016).
- Luhmann, N. The world society as a social system. Int. J. Gen. Syst. 1982, 8, 131–138. [Google Scholar] [CrossRef]
- Luhmann, N.; Gilgen, P. Introduction to Systems Theory, English ed.; Polity: Cambridge, UK, 2013. [Google Scholar]
- Deming, W.E. The New Economics for Industry, Government, Education; MIT Press: Cambridge, MA, USA, 1994. [Google Scholar]
- Orr, D. The Nature of Design: Ecology, Culture, and Human Intention; Oxford University Press: New York, NY, USA, 2002. [Google Scholar]
- Orr, D.W. (Ed.) Designing minds. In Hope Is an Imperative: The Essential David Orr; Island Press: Washington, DC, USA, 2011; pp. 165–171. [Google Scholar]
- Benyus, J. Biomimicry; William Morrow and Company: New York, NY, USA, 1997. [Google Scholar]
- Maturana, H.R.; Valera, F.J. Autopoiesis and Cognition: The Realization of the Living; D. Reidel: Dordrecht, The Netherlands, 1980. [Google Scholar]
- Jackson, W. Becoming Native to This Place; Counterpoint: Washington, DC, USA, 1994; p. 73. [Google Scholar]
- Moustakas, C. Phenomenological Research Methods; Sage: Thousand Oaks, CA, USA, 1994. [Google Scholar]
- Connelly, F.M.; Clandinin, D.J. Narrative Inquiry in Handbook of Complementary Methods in Education Research; Green, J., Camilli, G., Elmore, P., Eds.; Lawrence Erlbaum: Mahwah, NJ, USA, 2006; pp. 375–385. [Google Scholar]
- Creswell, J.W. Research Design: Qualitative, Quantitative and Mixed Methods Approaches; Sage: Thousand Oaks, CA, USA, 2009. [Google Scholar]
- Bernier, A. Color Coded Class wide Cumulative Competency Meeting Coding Scatterplot. Ph.D. Thesis, Prescott College, Prescott, AZ, USA, 2015. Available online: https://docs.google.com/spreadsheets/d/1DGIf65c-ln4NDKWsZslCXL79orYsotqKsaCvsRYHb4I/edit#gid=0 (accessed on 23 September 2016).
- Capra, F. The Web of Life: A New Scientific Understanding of Living Systems; Anchor Books: New York, NY, USA, 1996. [Google Scholar]
- Barabási, A.L. Network Science; Cambridge University Press: Cambridge, UK, 2016. [Google Scholar]
- Jenkins, H.; Purushotma, R.; Weigel, M.; Clinton, K.; Robison, A. Confronting the Challenges of Participatory Culture: Media Education for the 21st Century; MIT Press: Cambridge, MA, USA, 2009. [Google Scholar]
- Trilling, B.; Fadel, C. 21st Century Skills: Learning for Life in Our Times; Jossey-Bass: San Francisco, CA, USA, 2009. [Google Scholar]
- Partnership for 21st Century Learning. Framework for 21st Century Learning; Partnership for 21st Century Learning: Washington, DC, USA, 2015; Available online: http://www.p21.org/our-work/p21-framework (accessed on 14 September 2016).
- Luhmann, N. The Reality of the Mass Media; Stanford University Press: Redwood City, CA, USA, 2000. [Google Scholar]
- Senge, P.M.; Smith, B.; Kruschwitz, N.; Laur, J.; Schley, S. The Necessary Revolution: How Organizations and Individuals Are Working Together to Create a Sustainable World; Doubleday: New York, NY, USA, 2008. [Google Scholar]
Figure 1.
The linear model of curriculum.

Figure 2.
The Center for Research, Engineering, Science and Technology (CREST) Sustainability dichotomous rubric.
Figure 2.
The Center for Research, Engineering, Science and Technology (CREST) Sustainability dichotomous rubric.
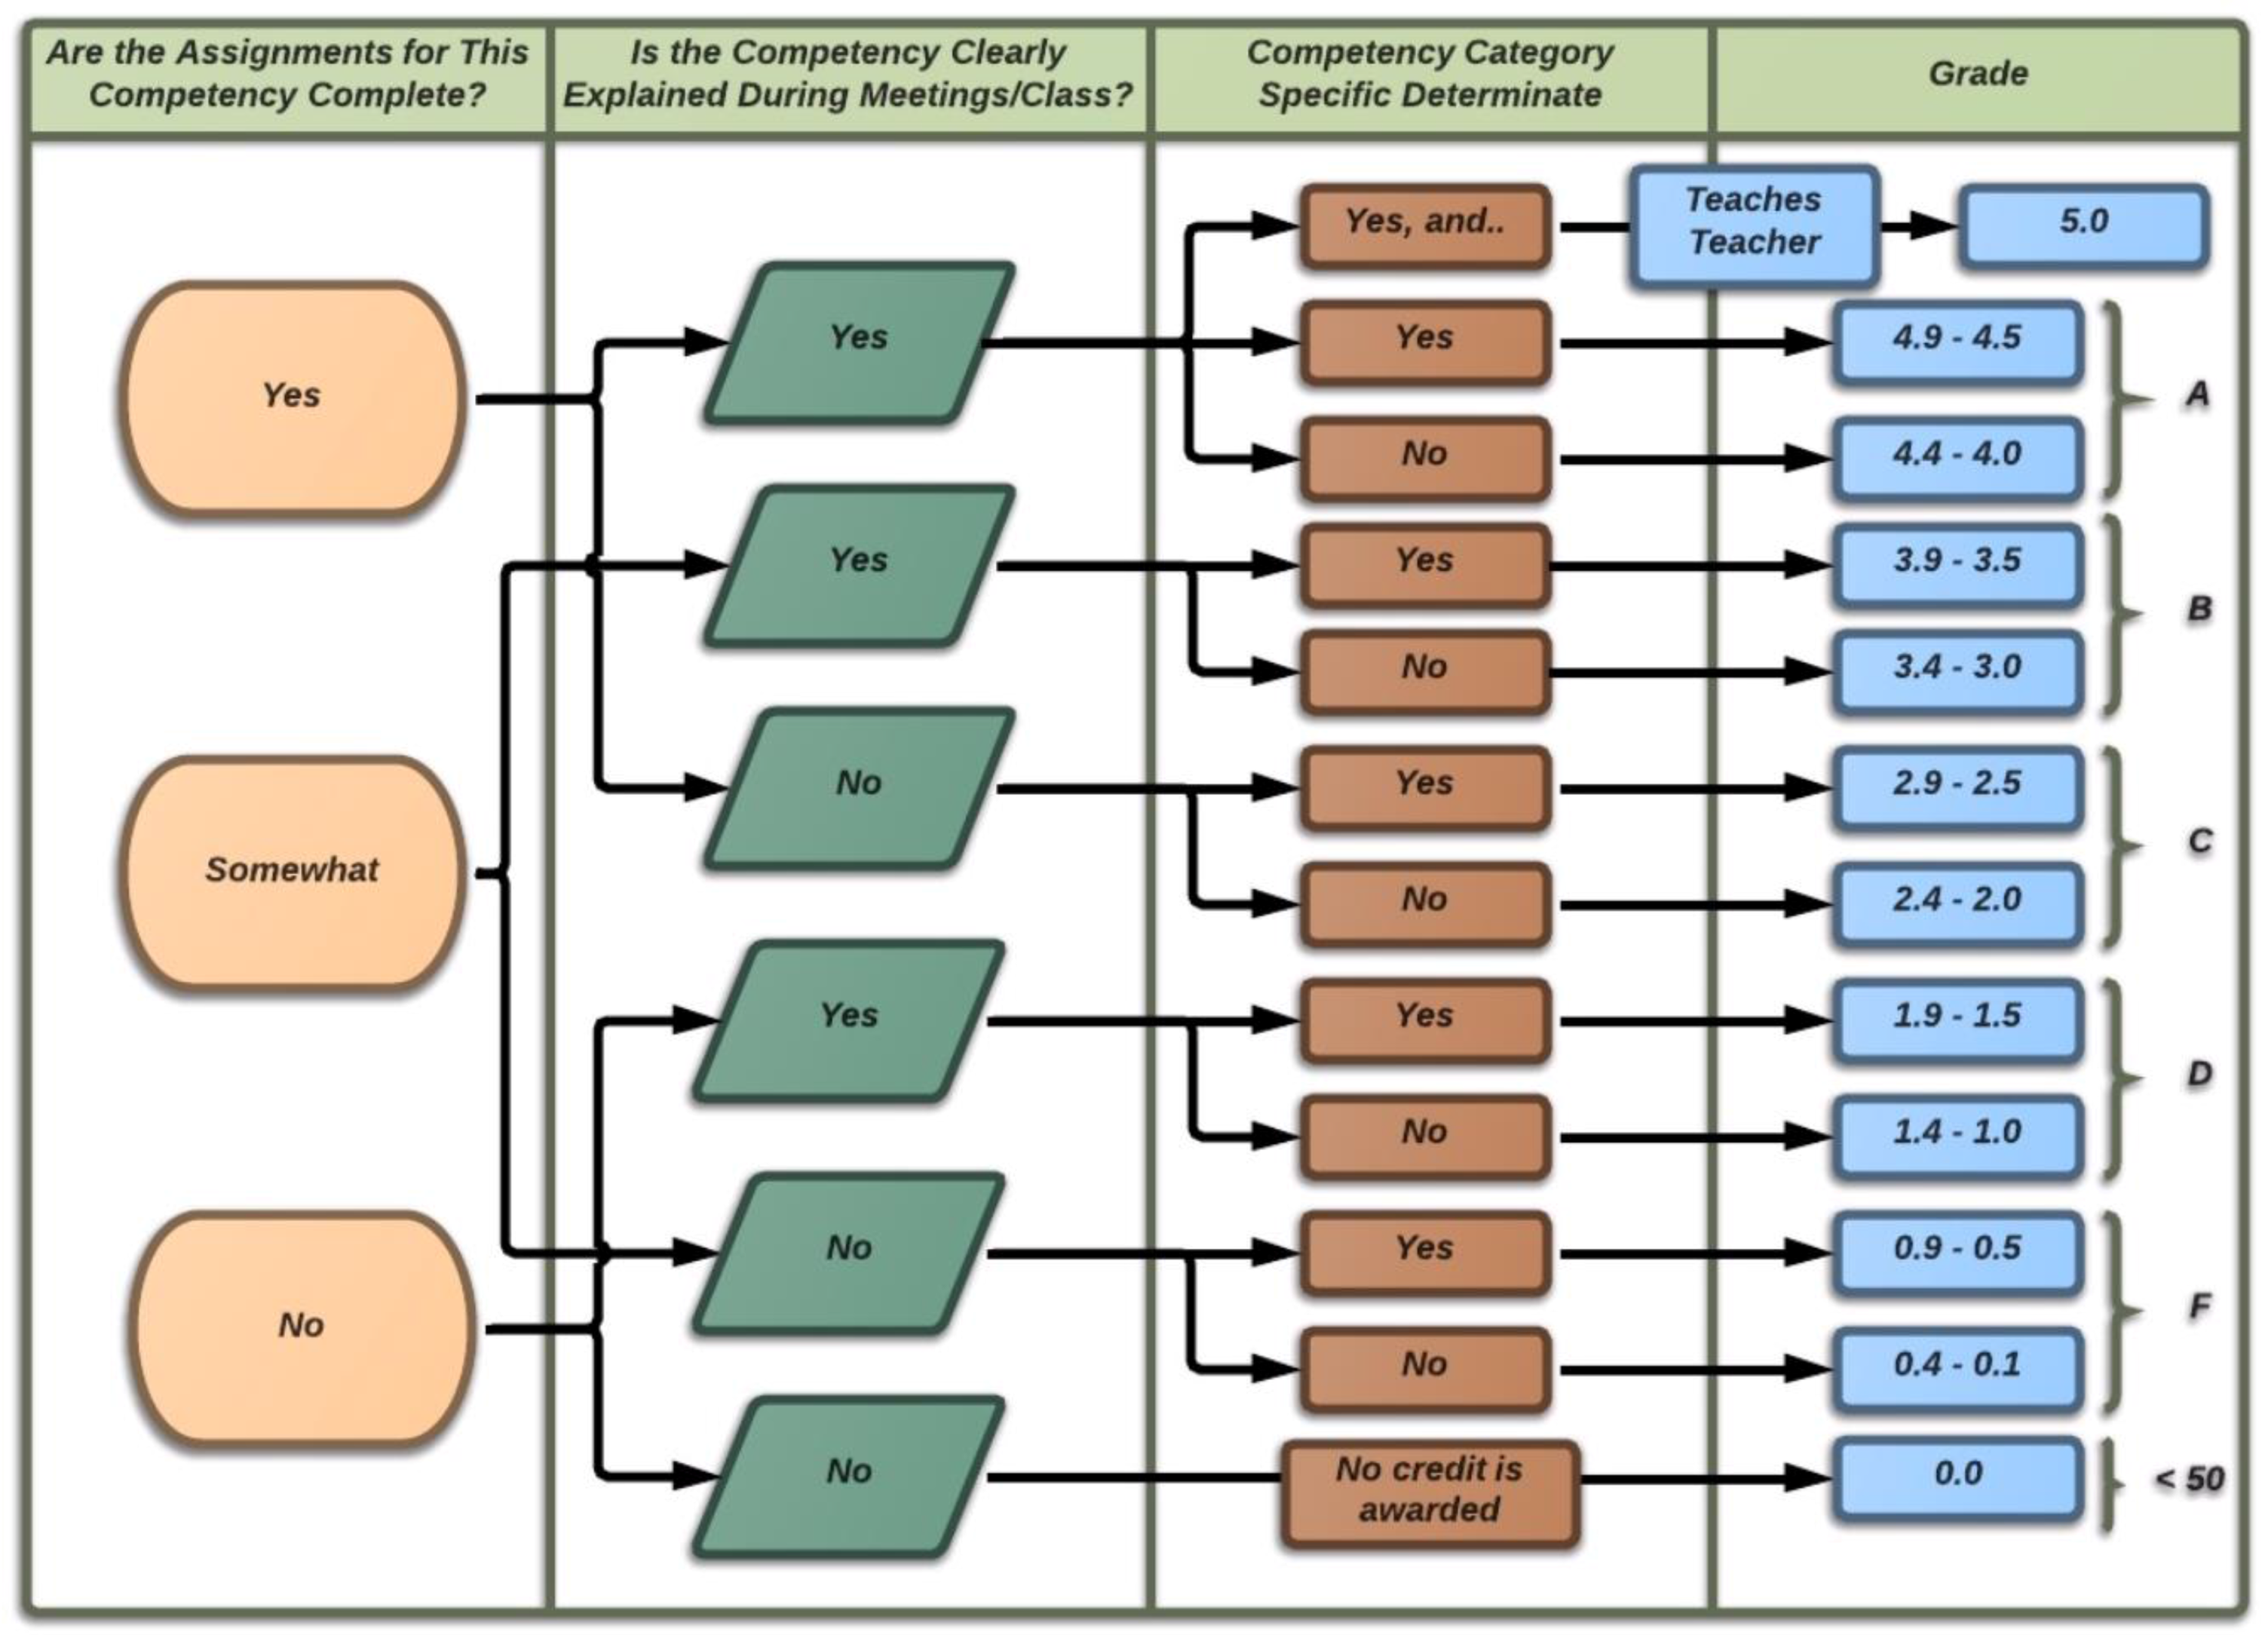
Figure 3.
A snapshot of the sustainability student competency scorecard.

Figure 4.
Sample of a student meeting transcription.

Figure 5.
Part of the student interview transcription coding sheet.
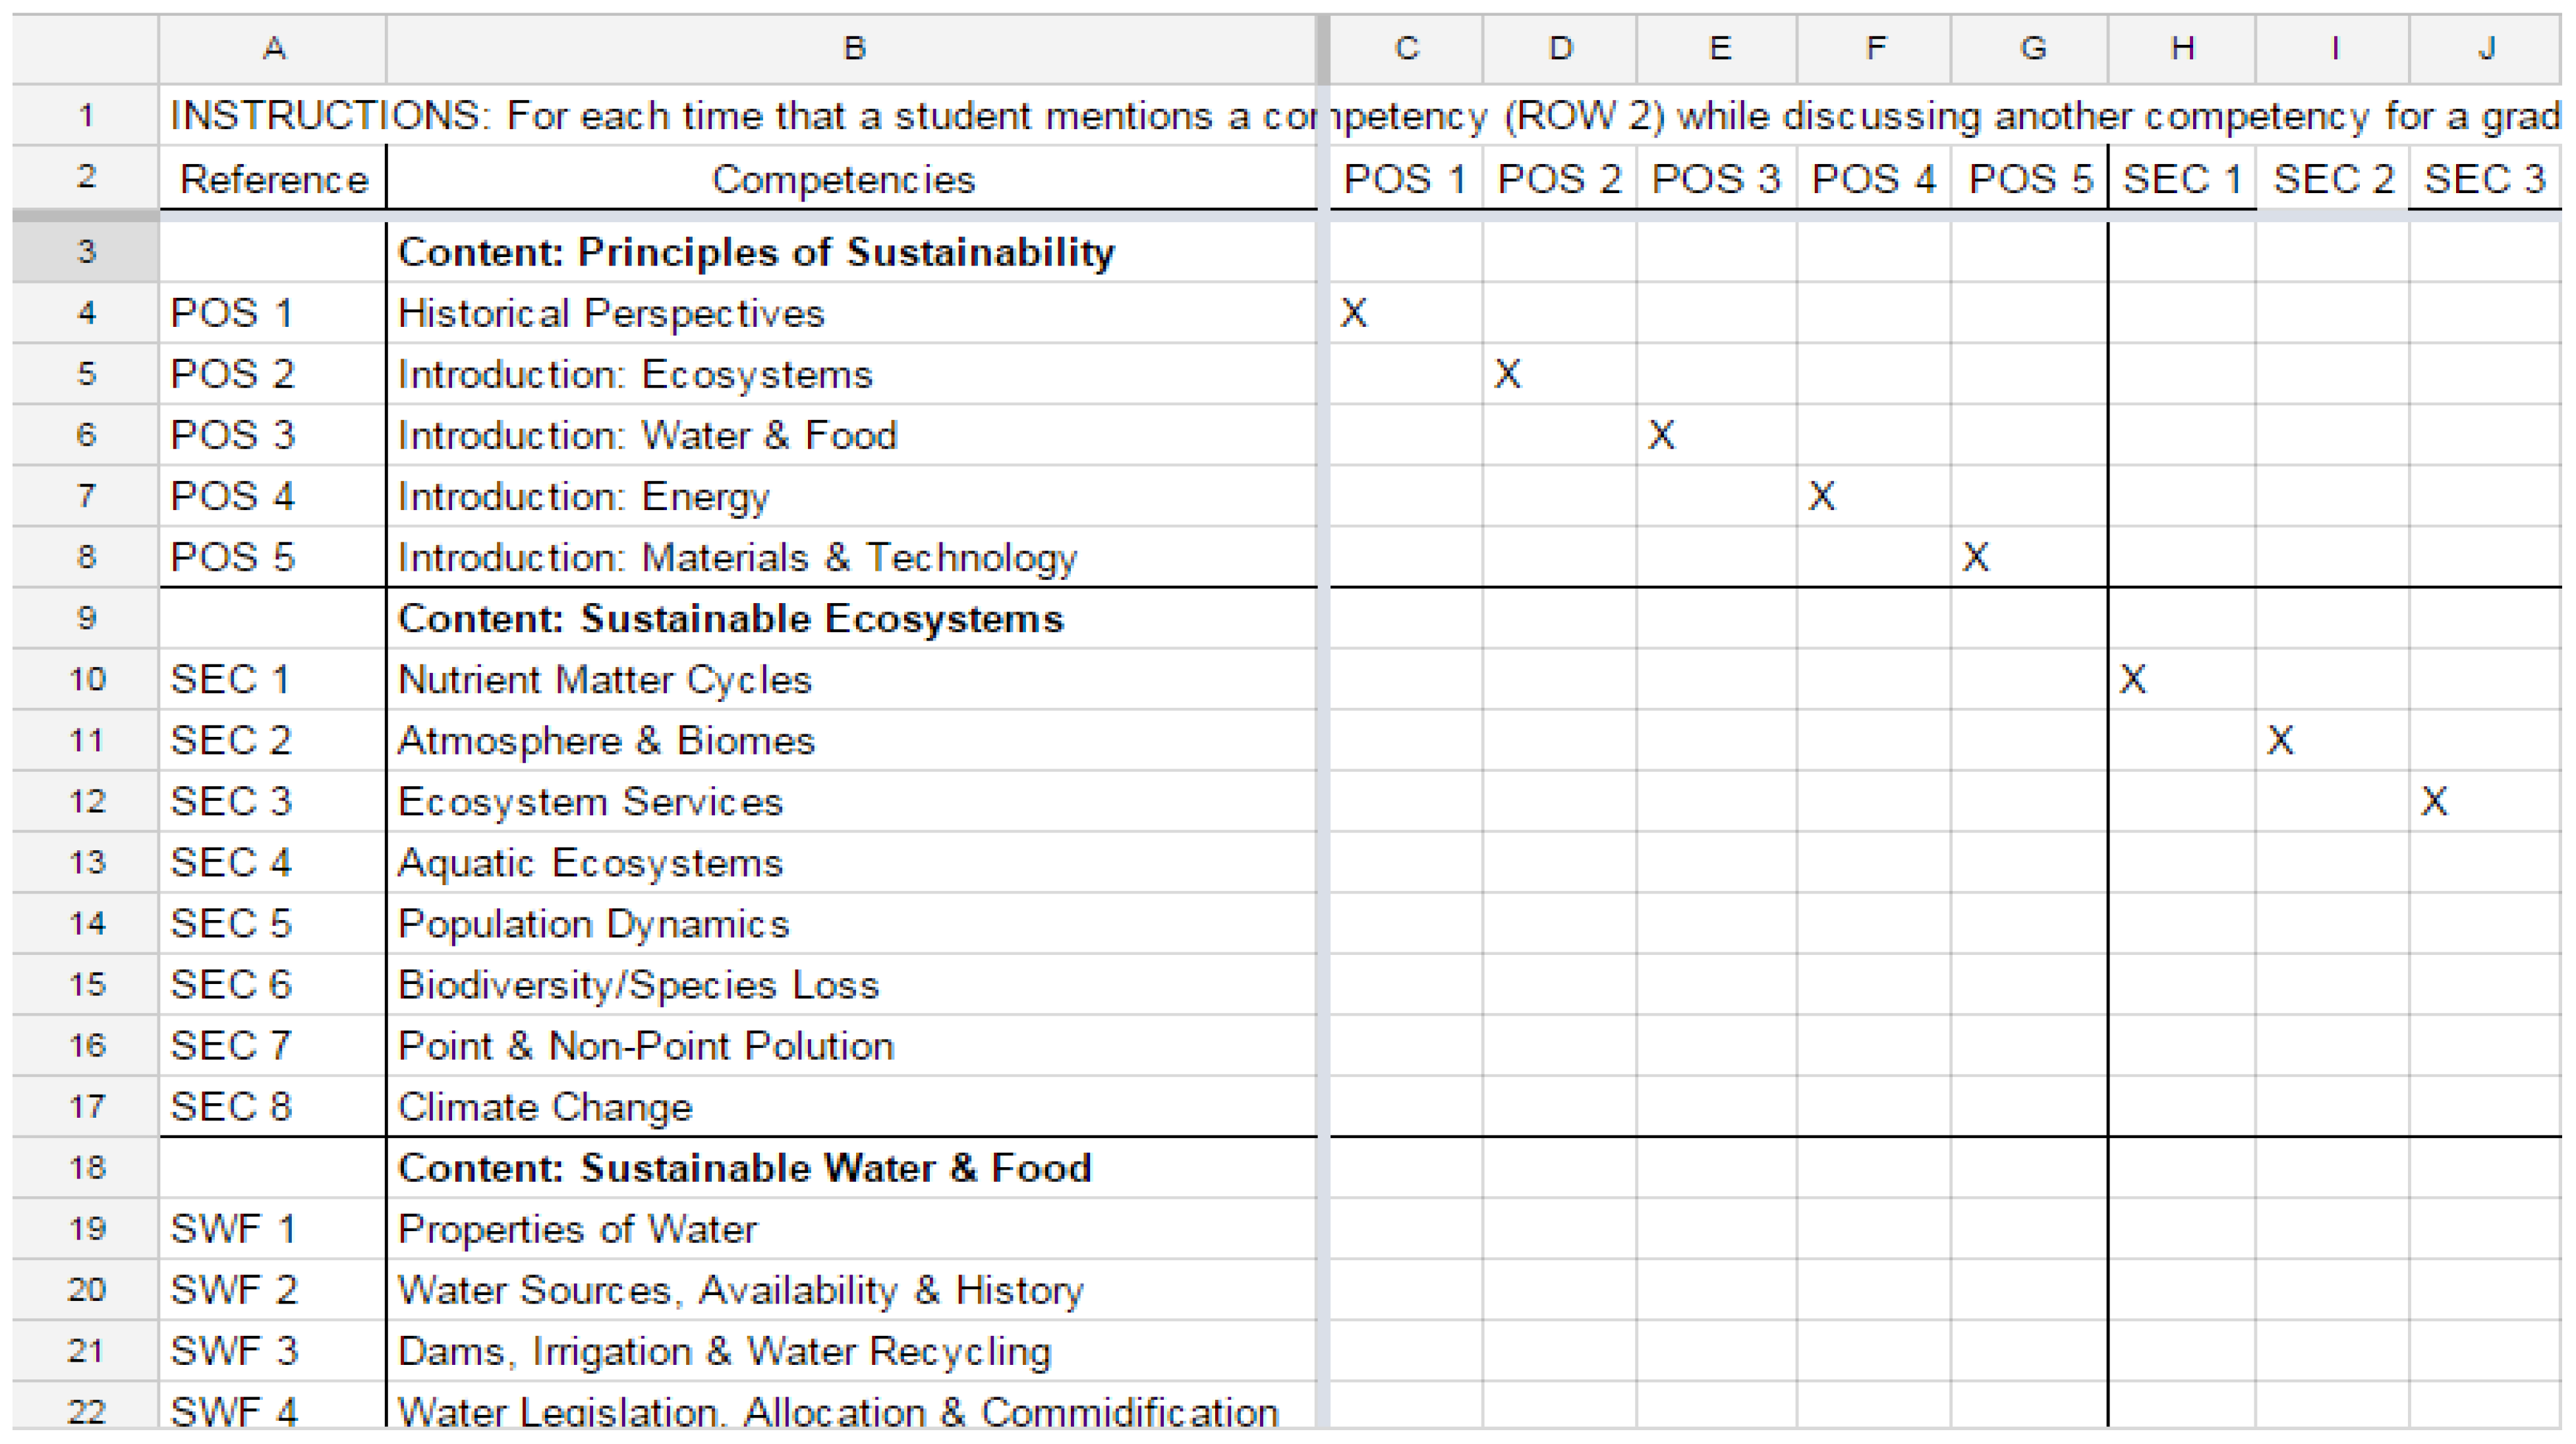
Figure 6.
Snapshot of one individual student’s interview transcription coding sheet.

Figure 7.
Blank graphing template for blog analysis (copied by students).

Figure 8.
Example of a completed graph analysis of a student blog.
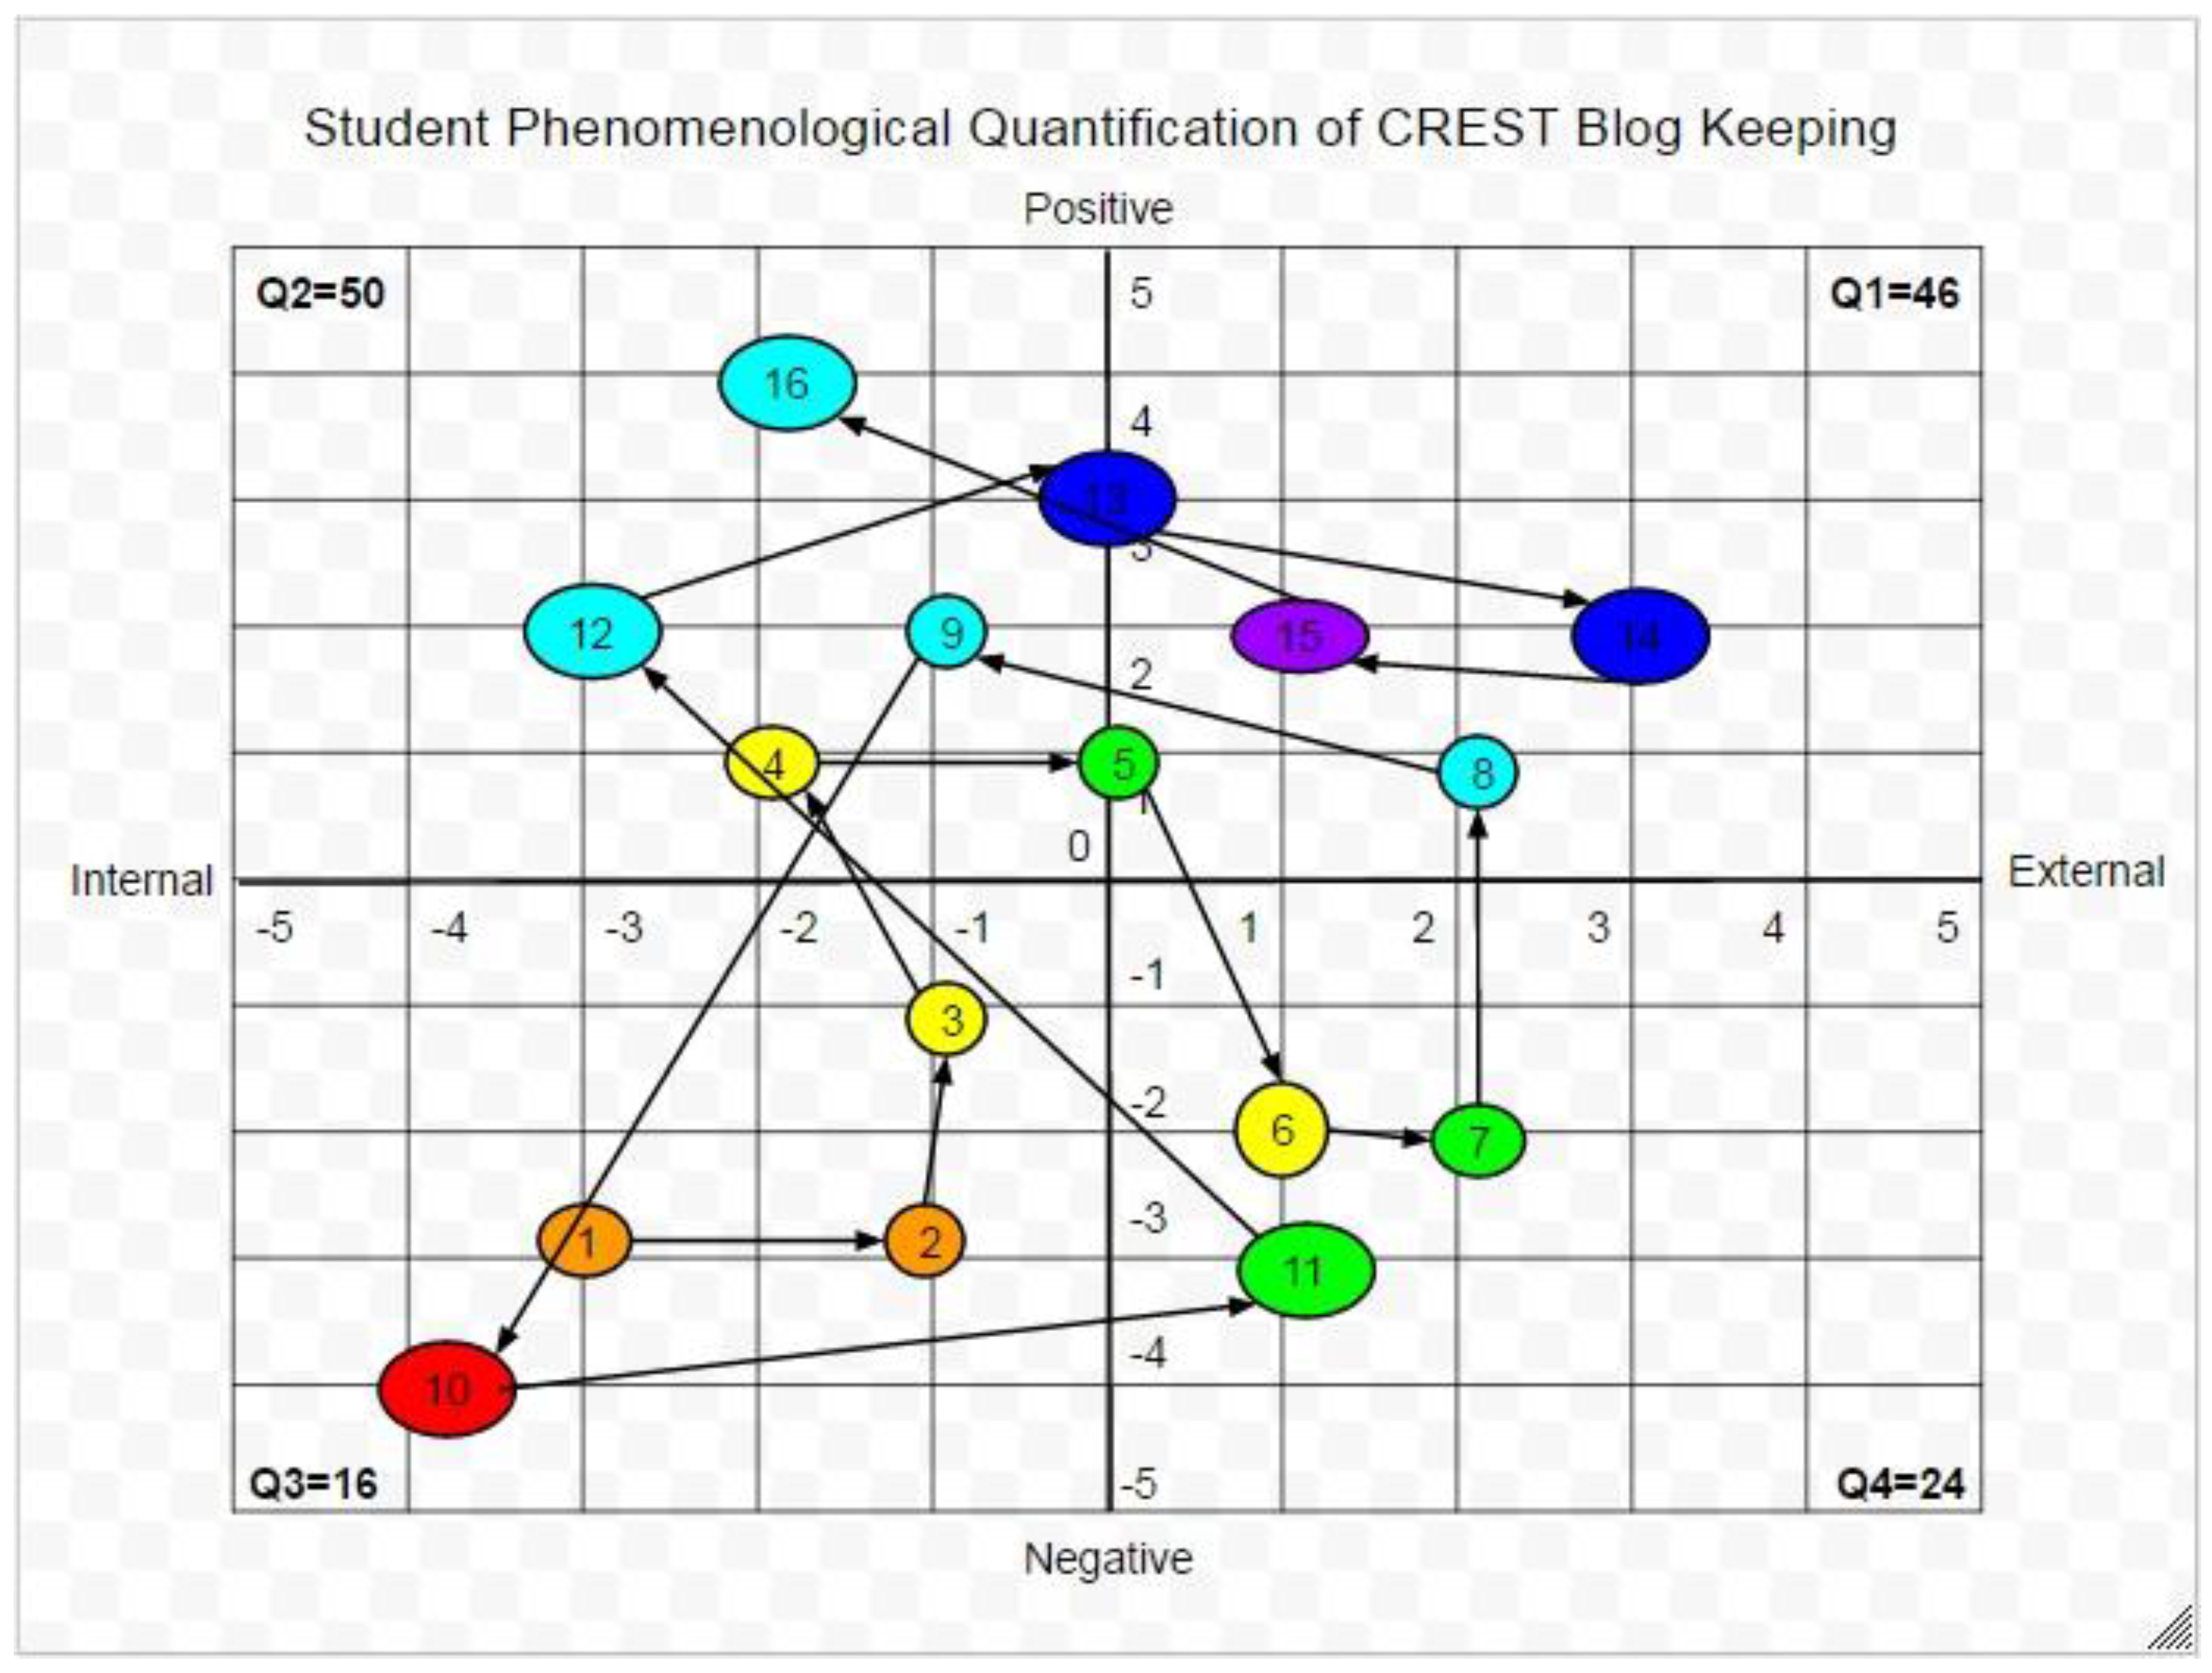
Figure 9.
Rubric grade vs. overall grade bar graph.
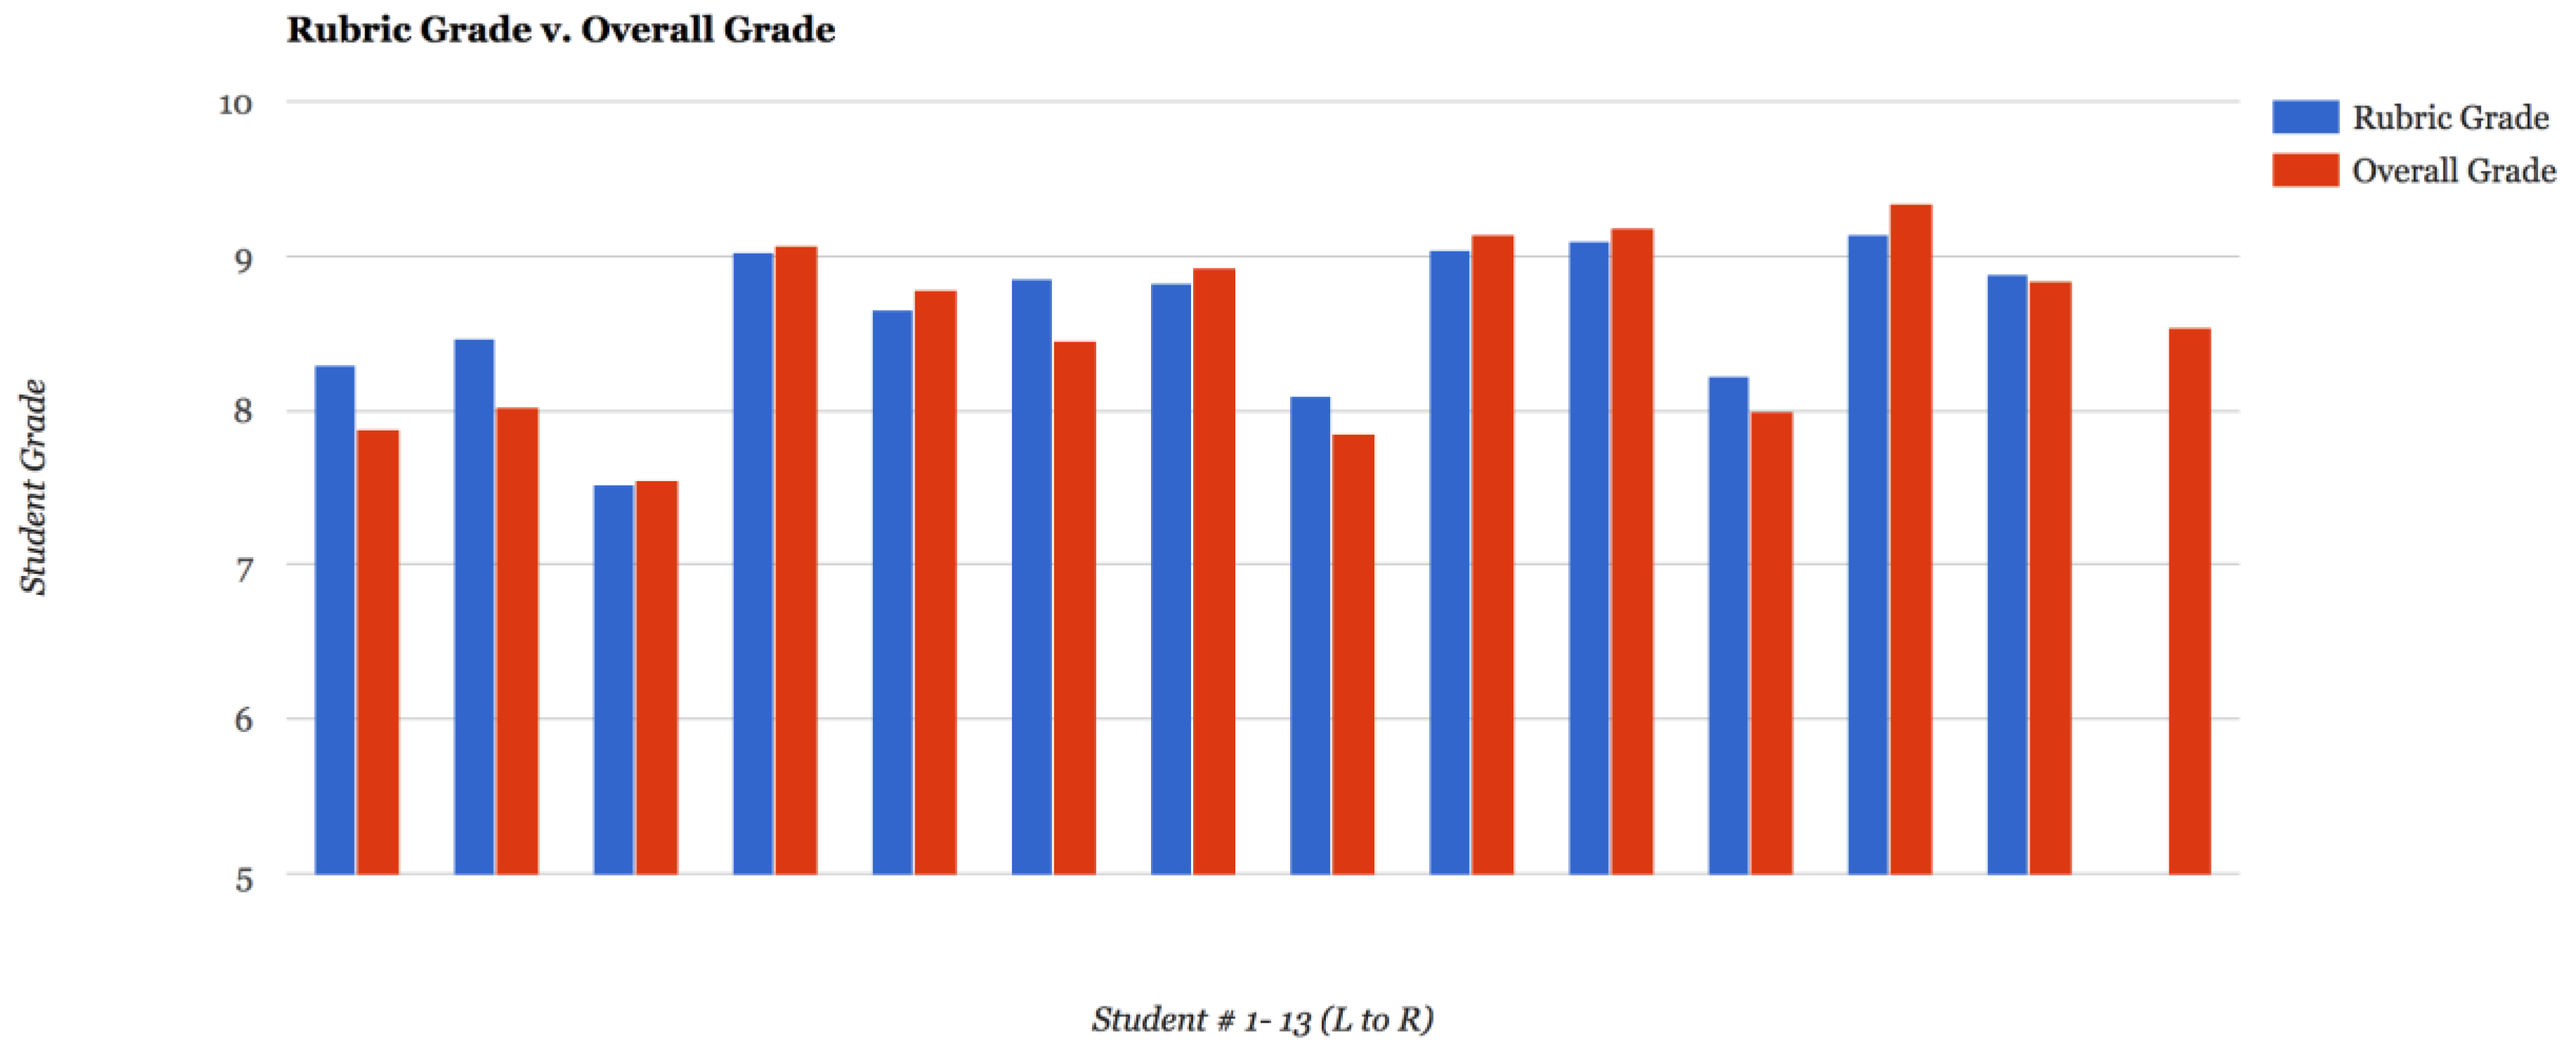
Figure 10.
Grades (rubric and overall) vs. competency mention frequency.
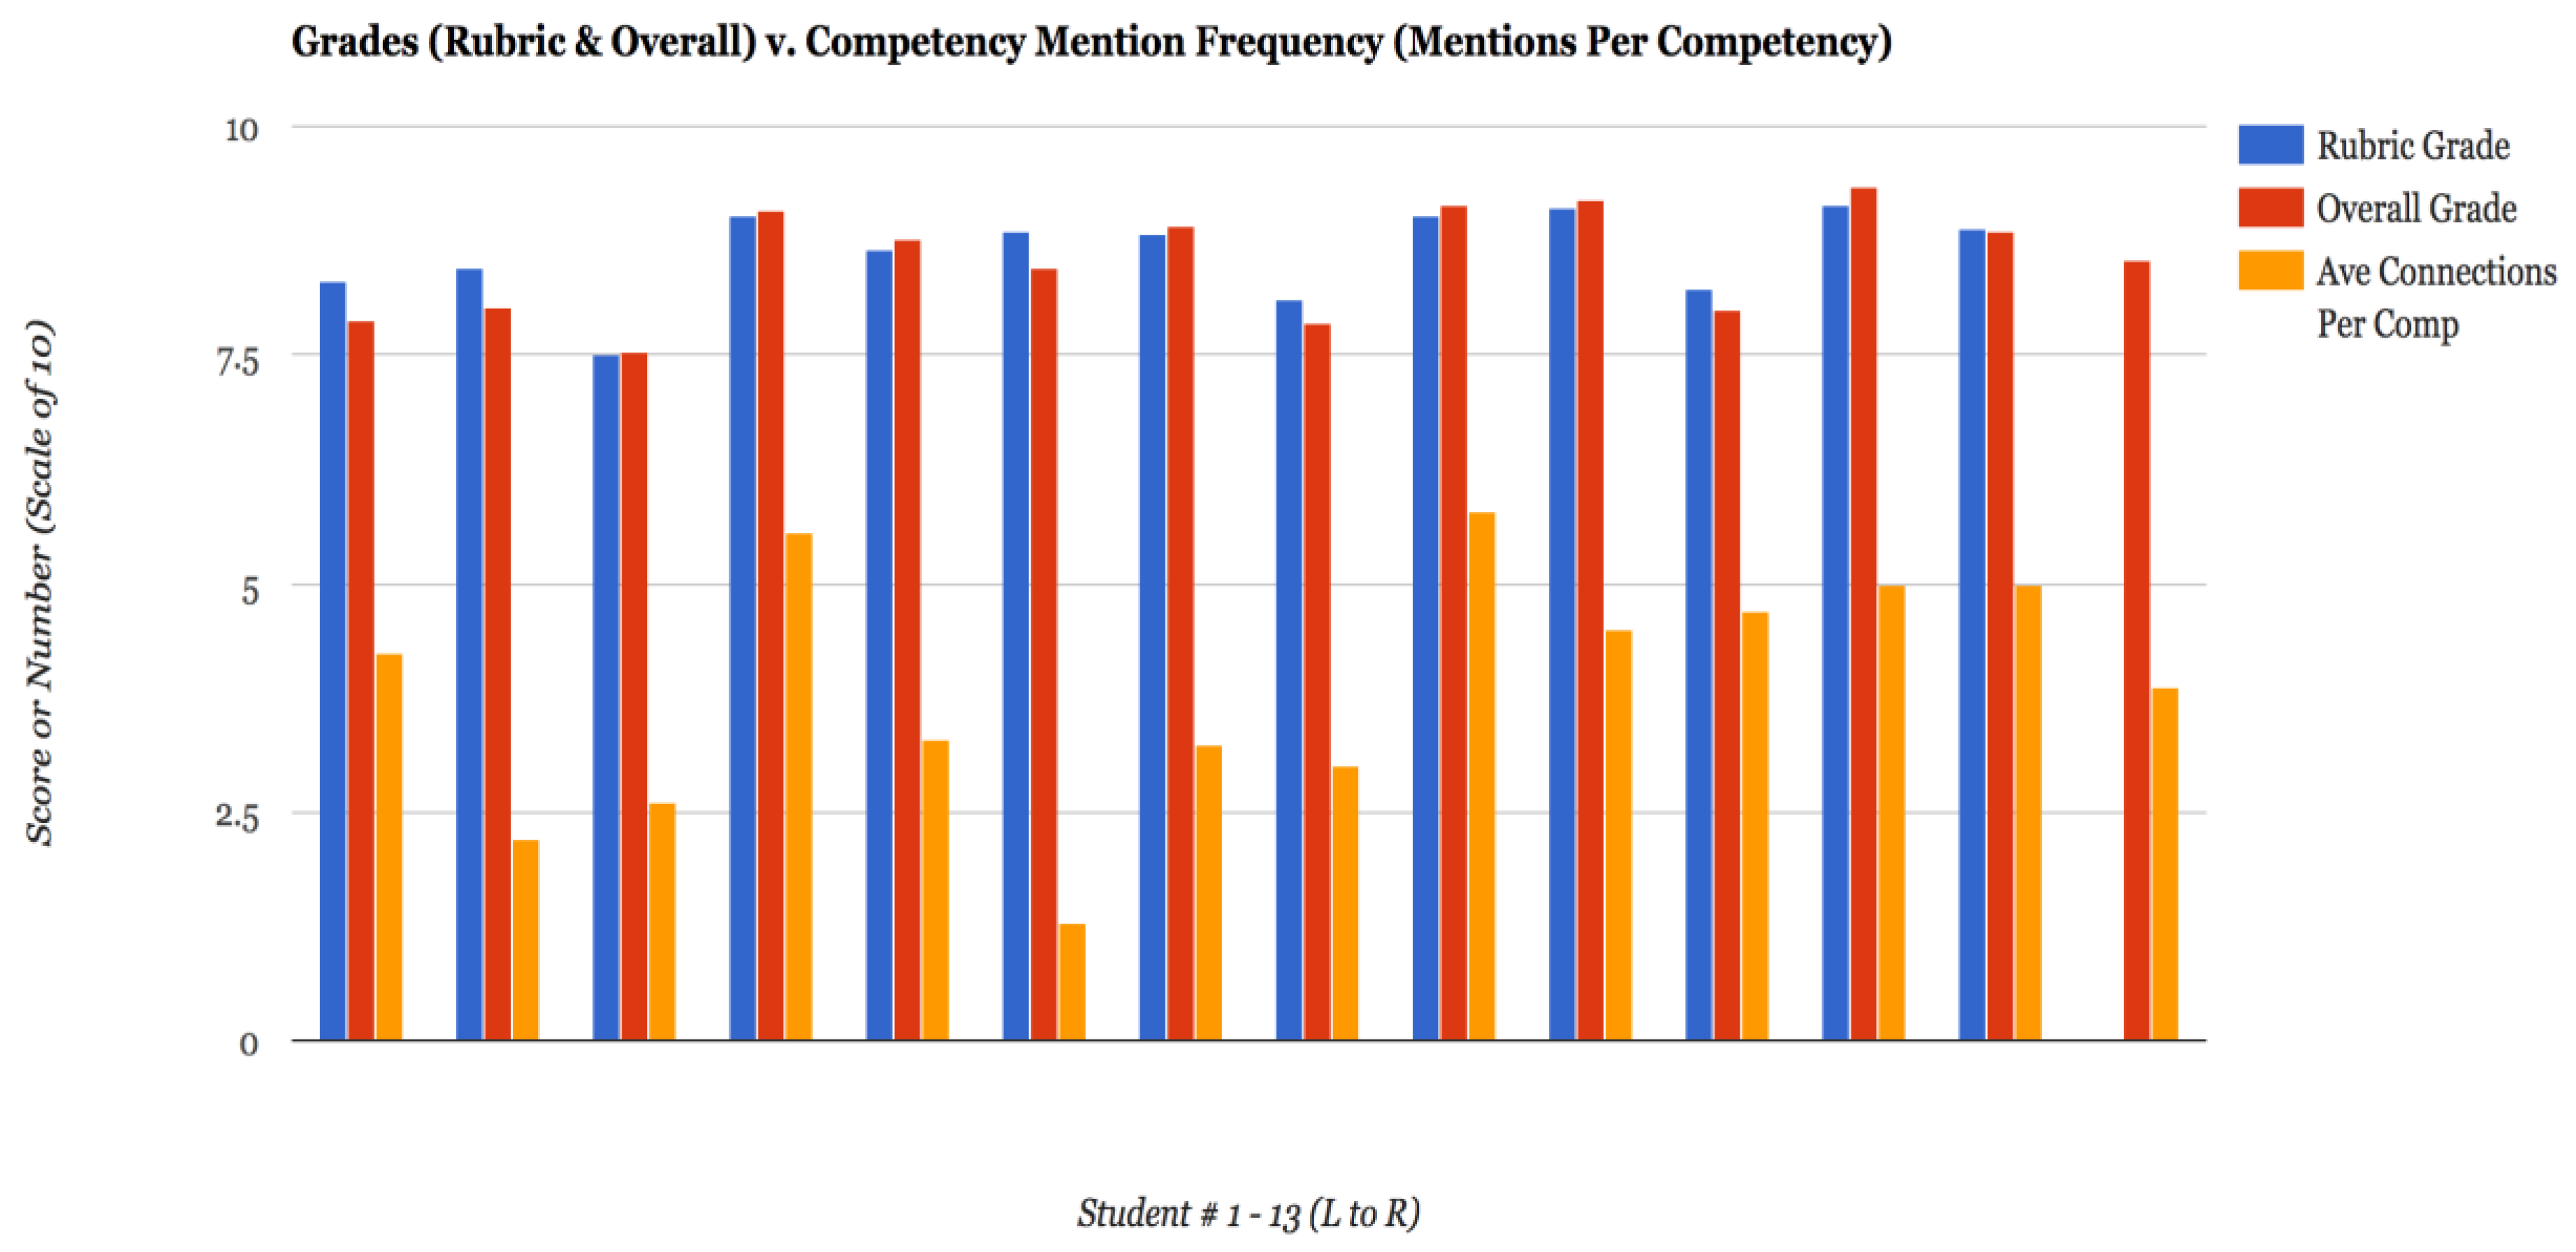
Figure 11.
Competency connection scatterplot [30].
Figure 11.
Competency connection scatterplot [30].

Figure 12.
A Pareto Chart displaying the concentration of connections made per category.

Figure 13.
A completed student blog graph analysis.

Figure 14.
Average number of academic item inclusions per blog post.

Figure 15.
Number of posts made per week with academic item totals.
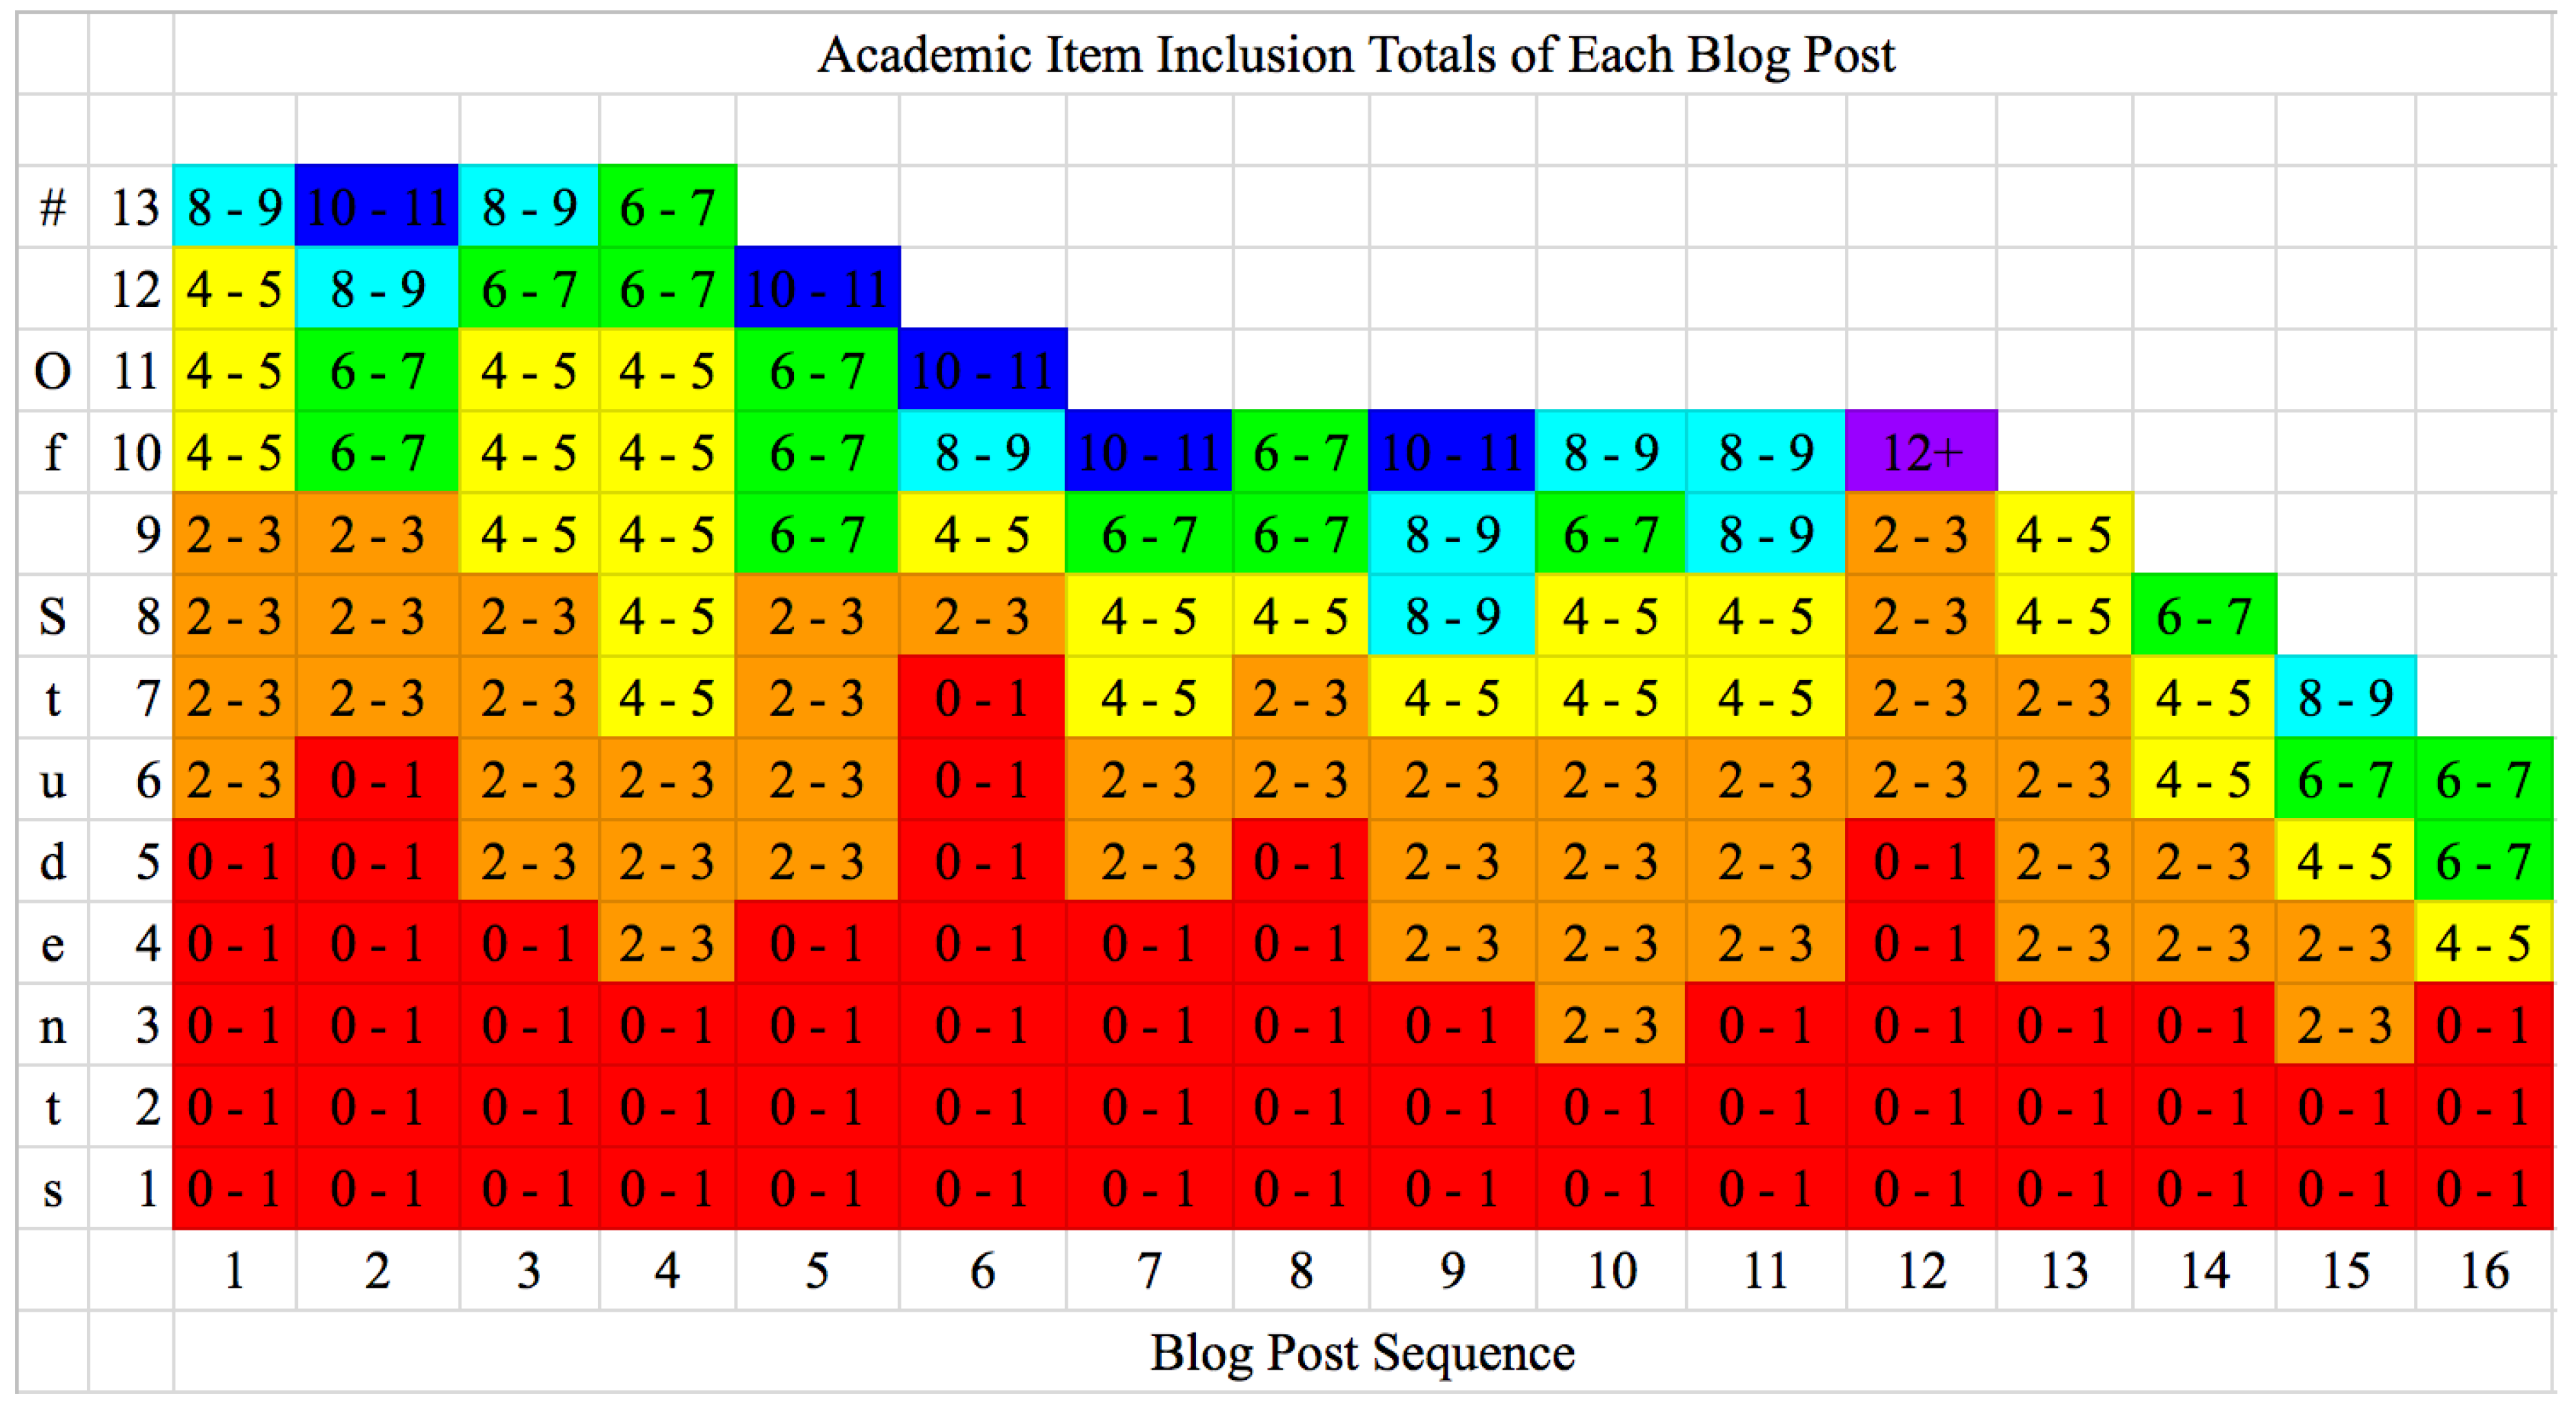
Figure 16.
Rubric and overall grade scores compared to blog academic item inclusion.
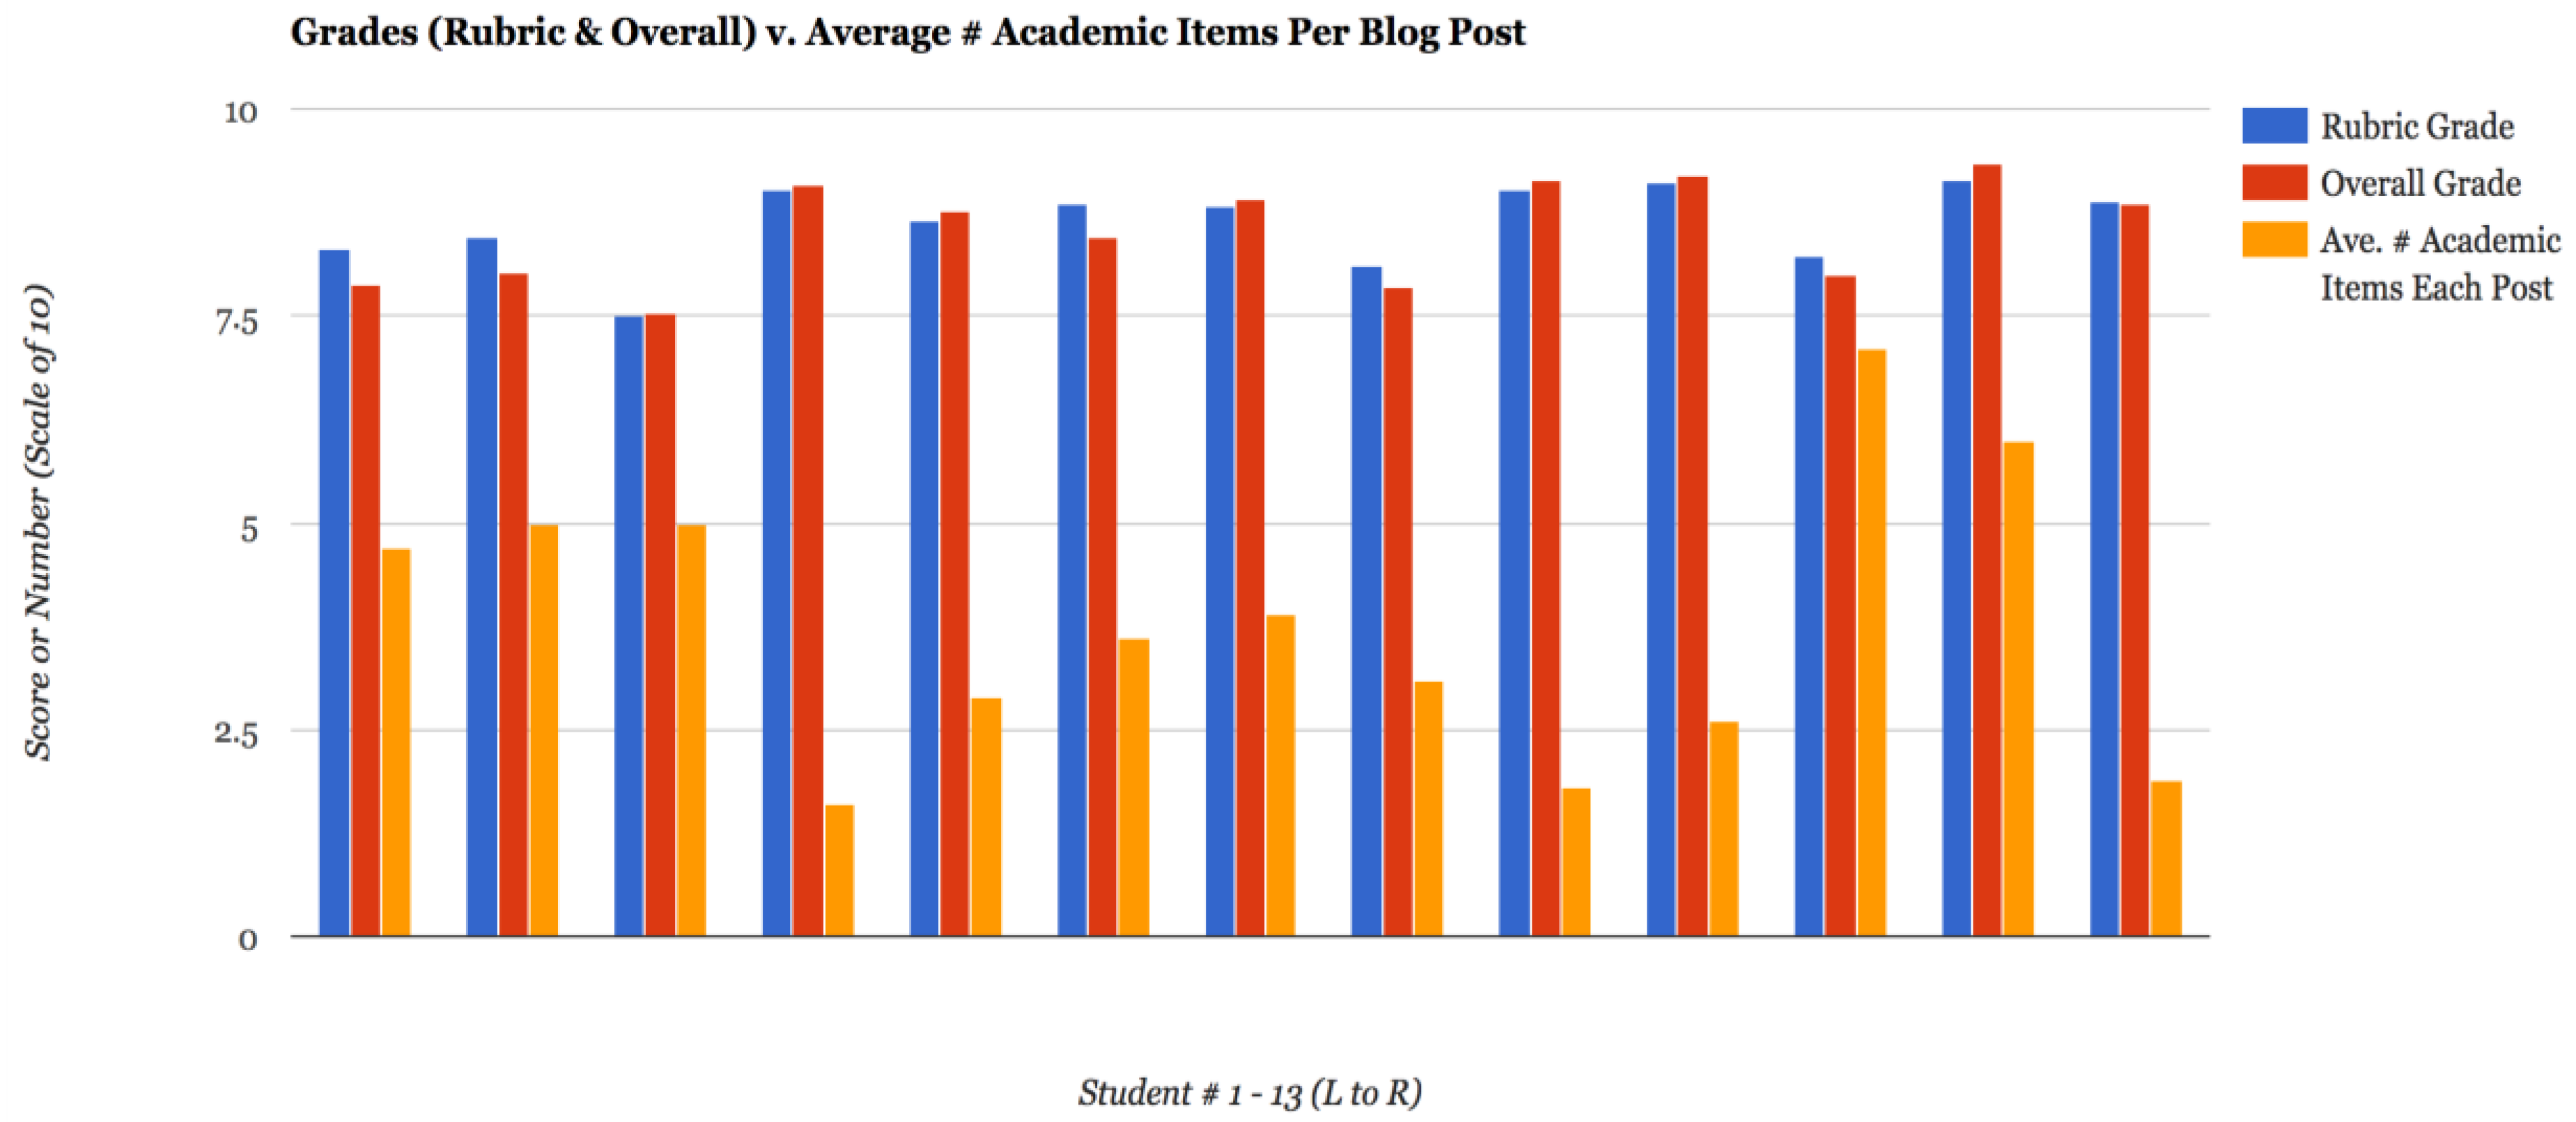
Figure 17.
Frequency of academic item inclusion in blog posts per quadrant.

Figure 18.
The membrane of the cell model.

Figure 19.
Content competencies begin to form and connect inside the cell.
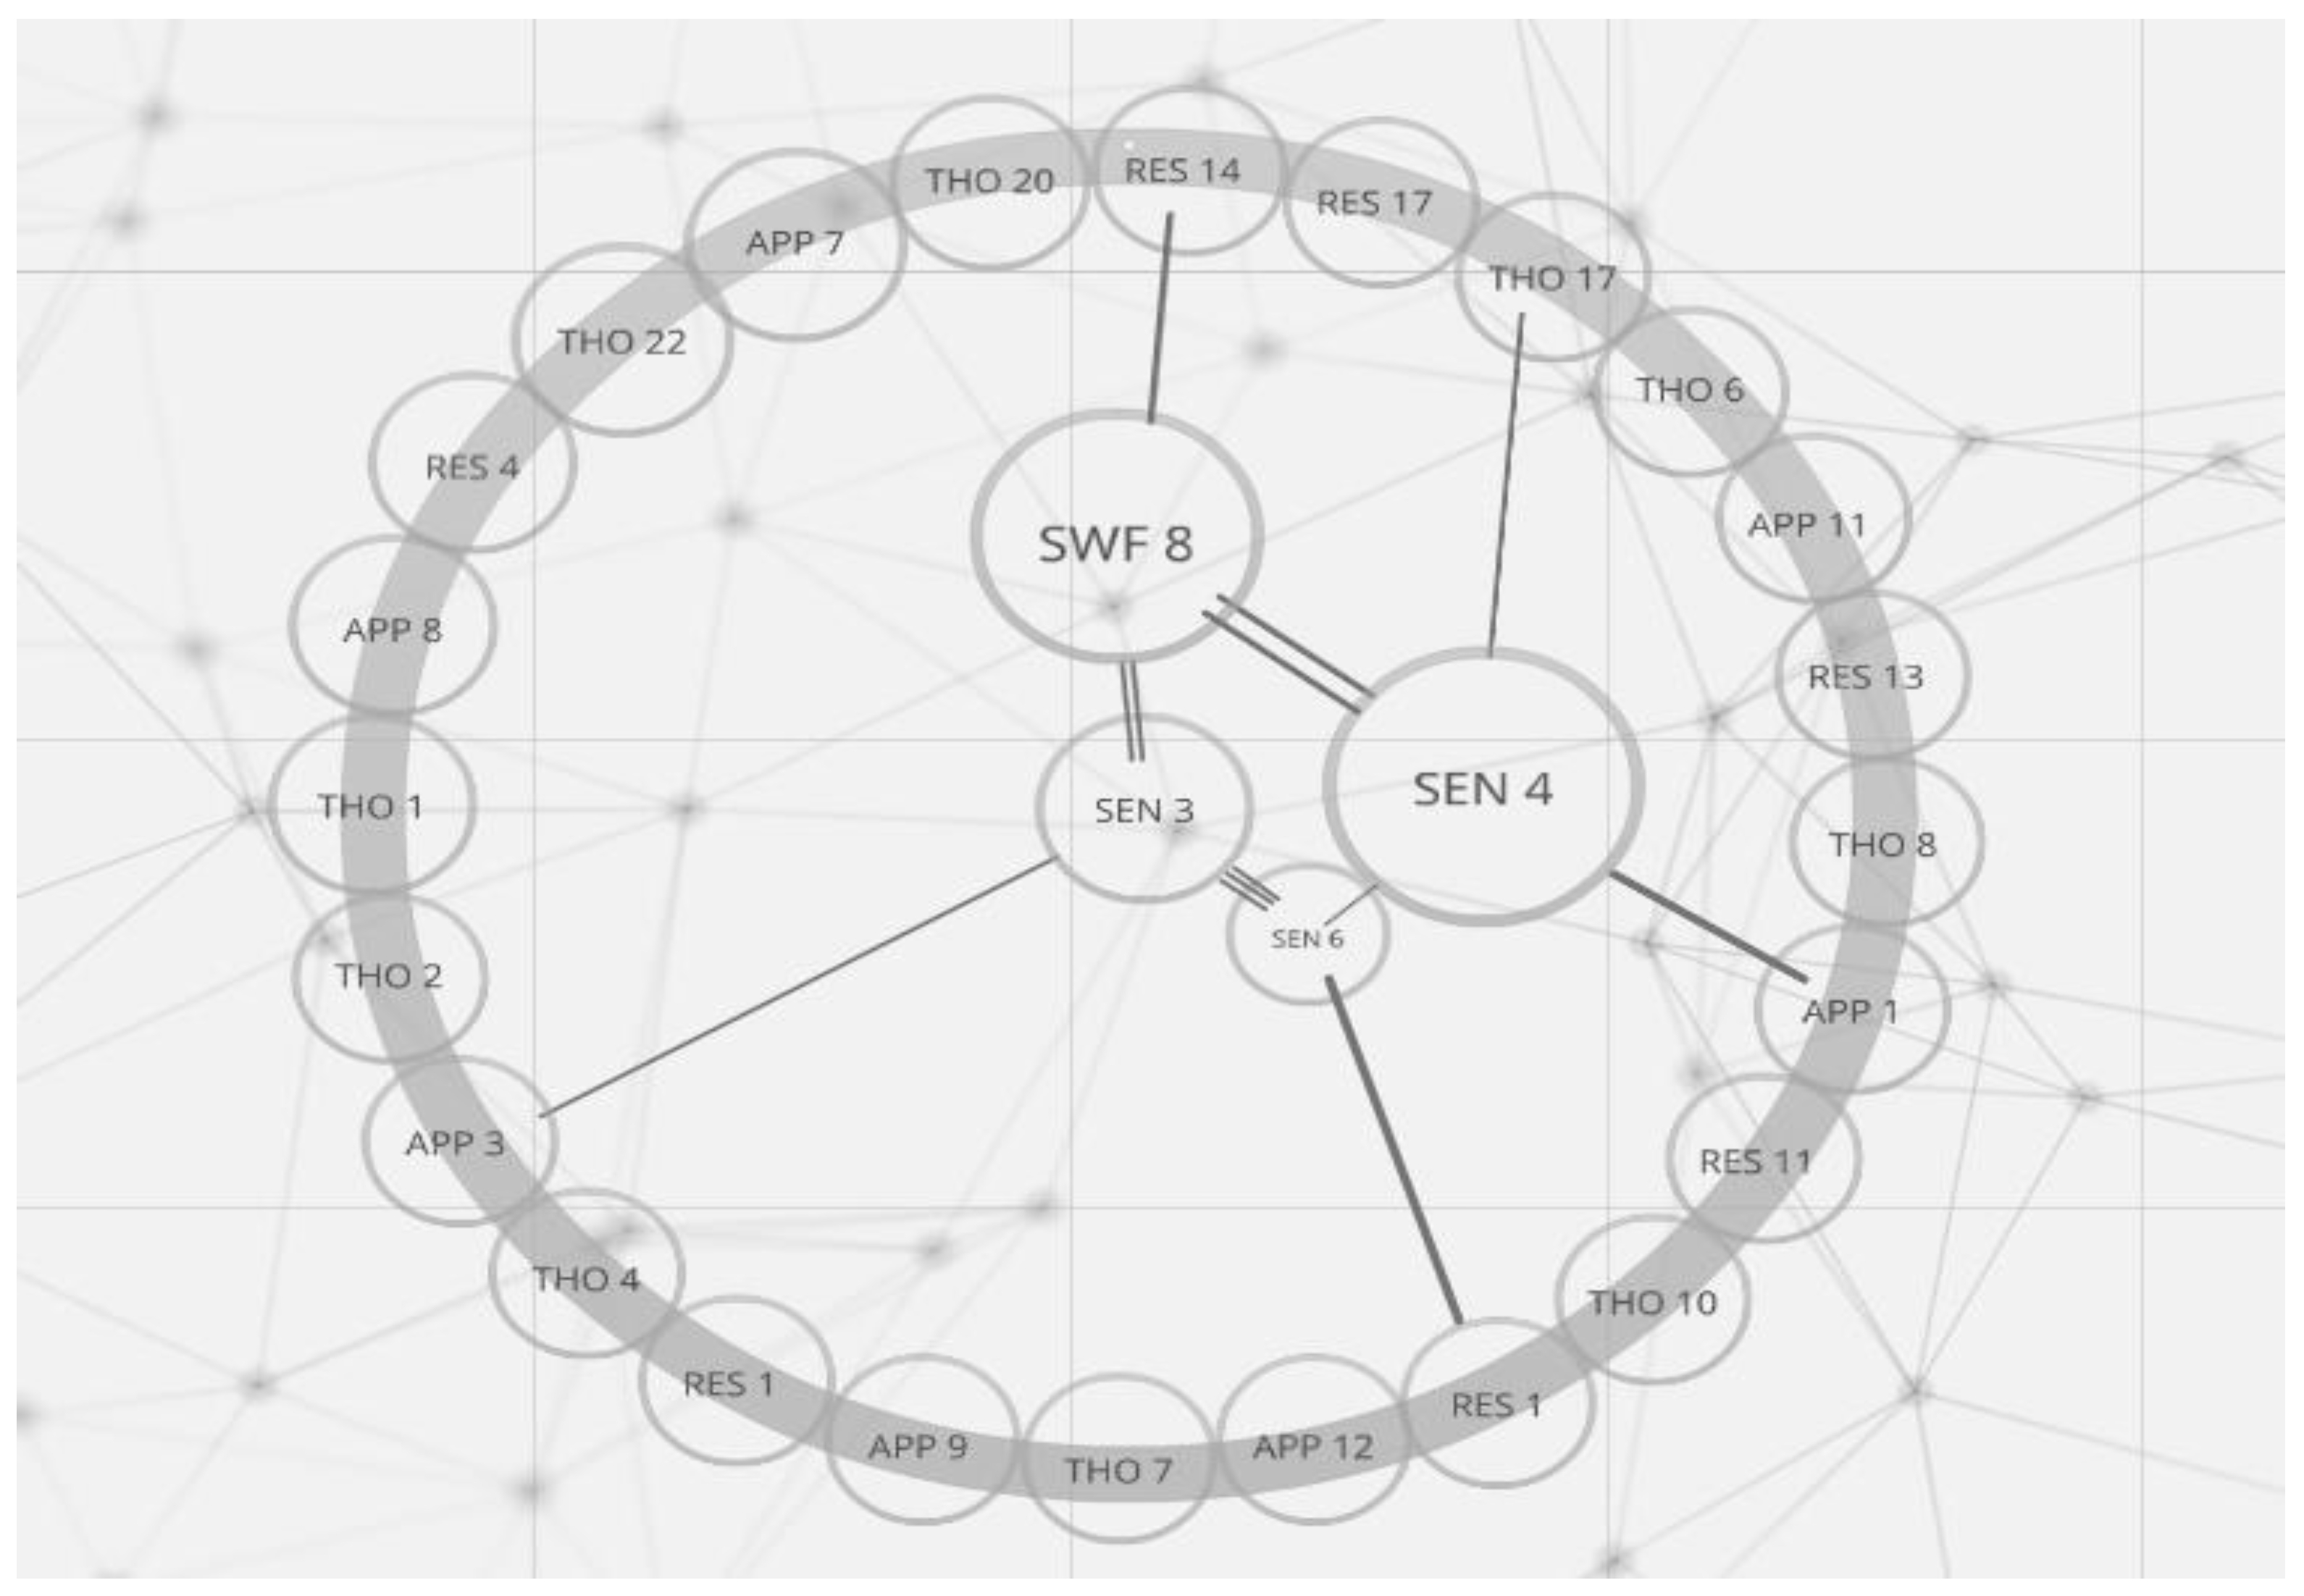
Figure 20.
A well-developed cell model displaying various strengths of relationship bonds.
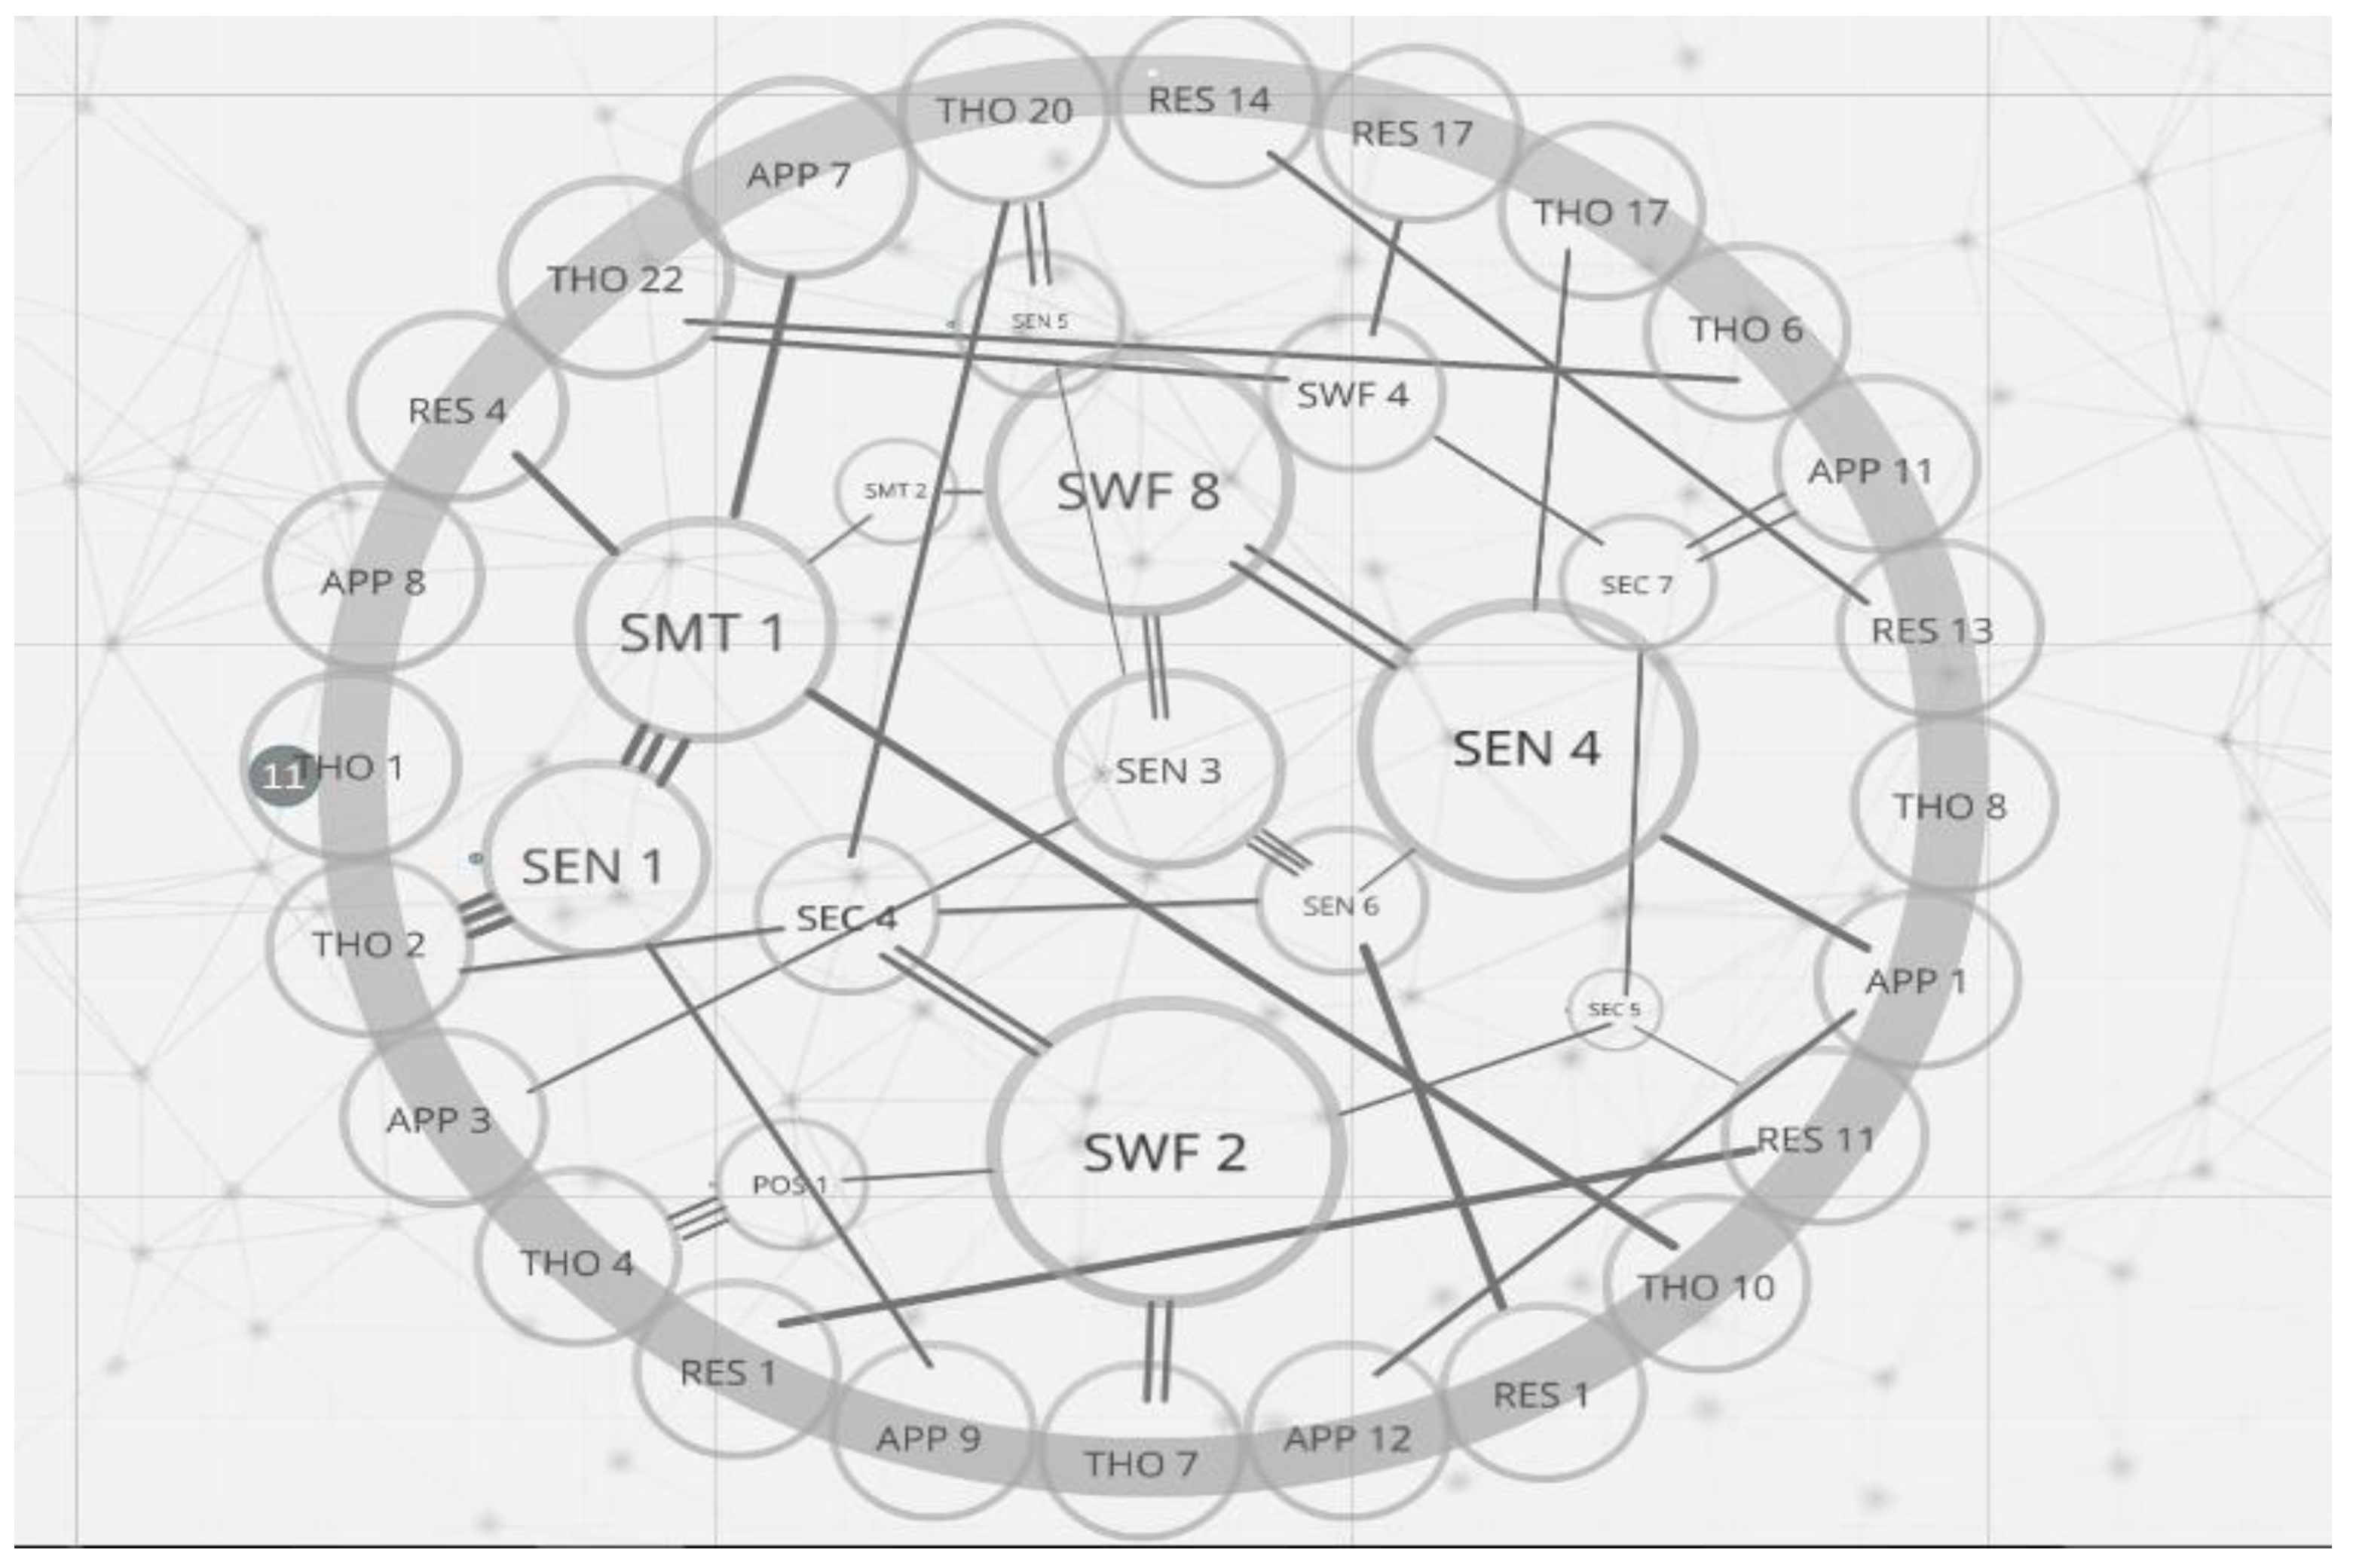

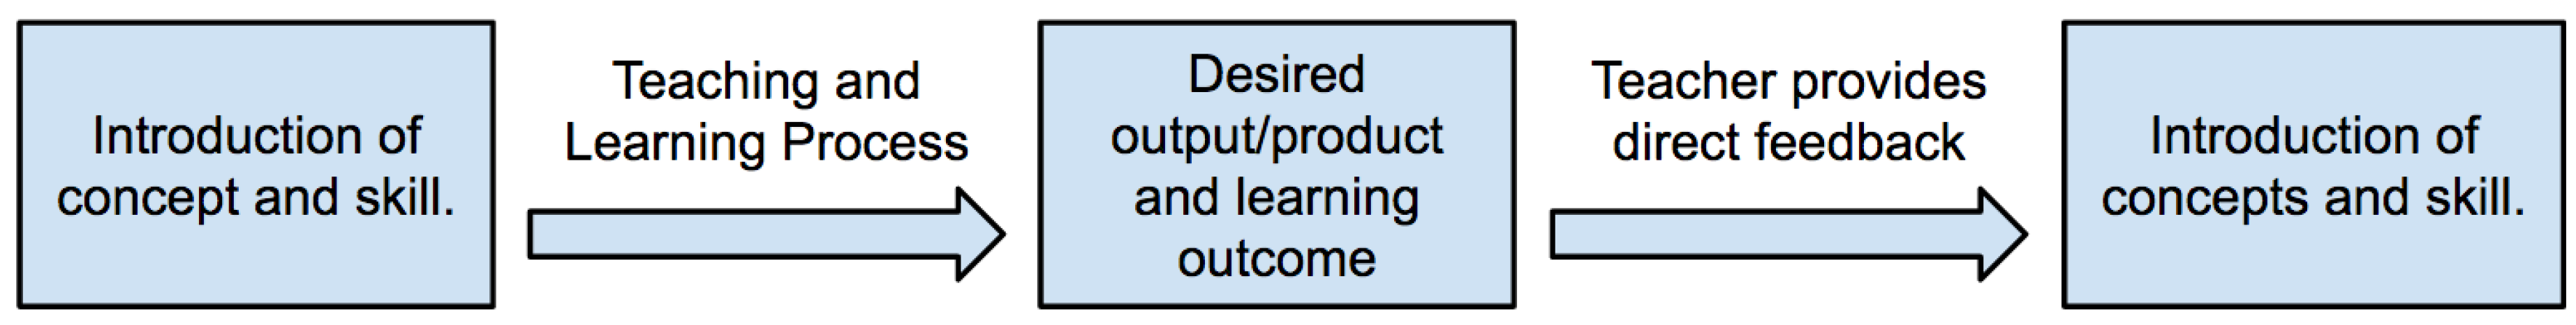
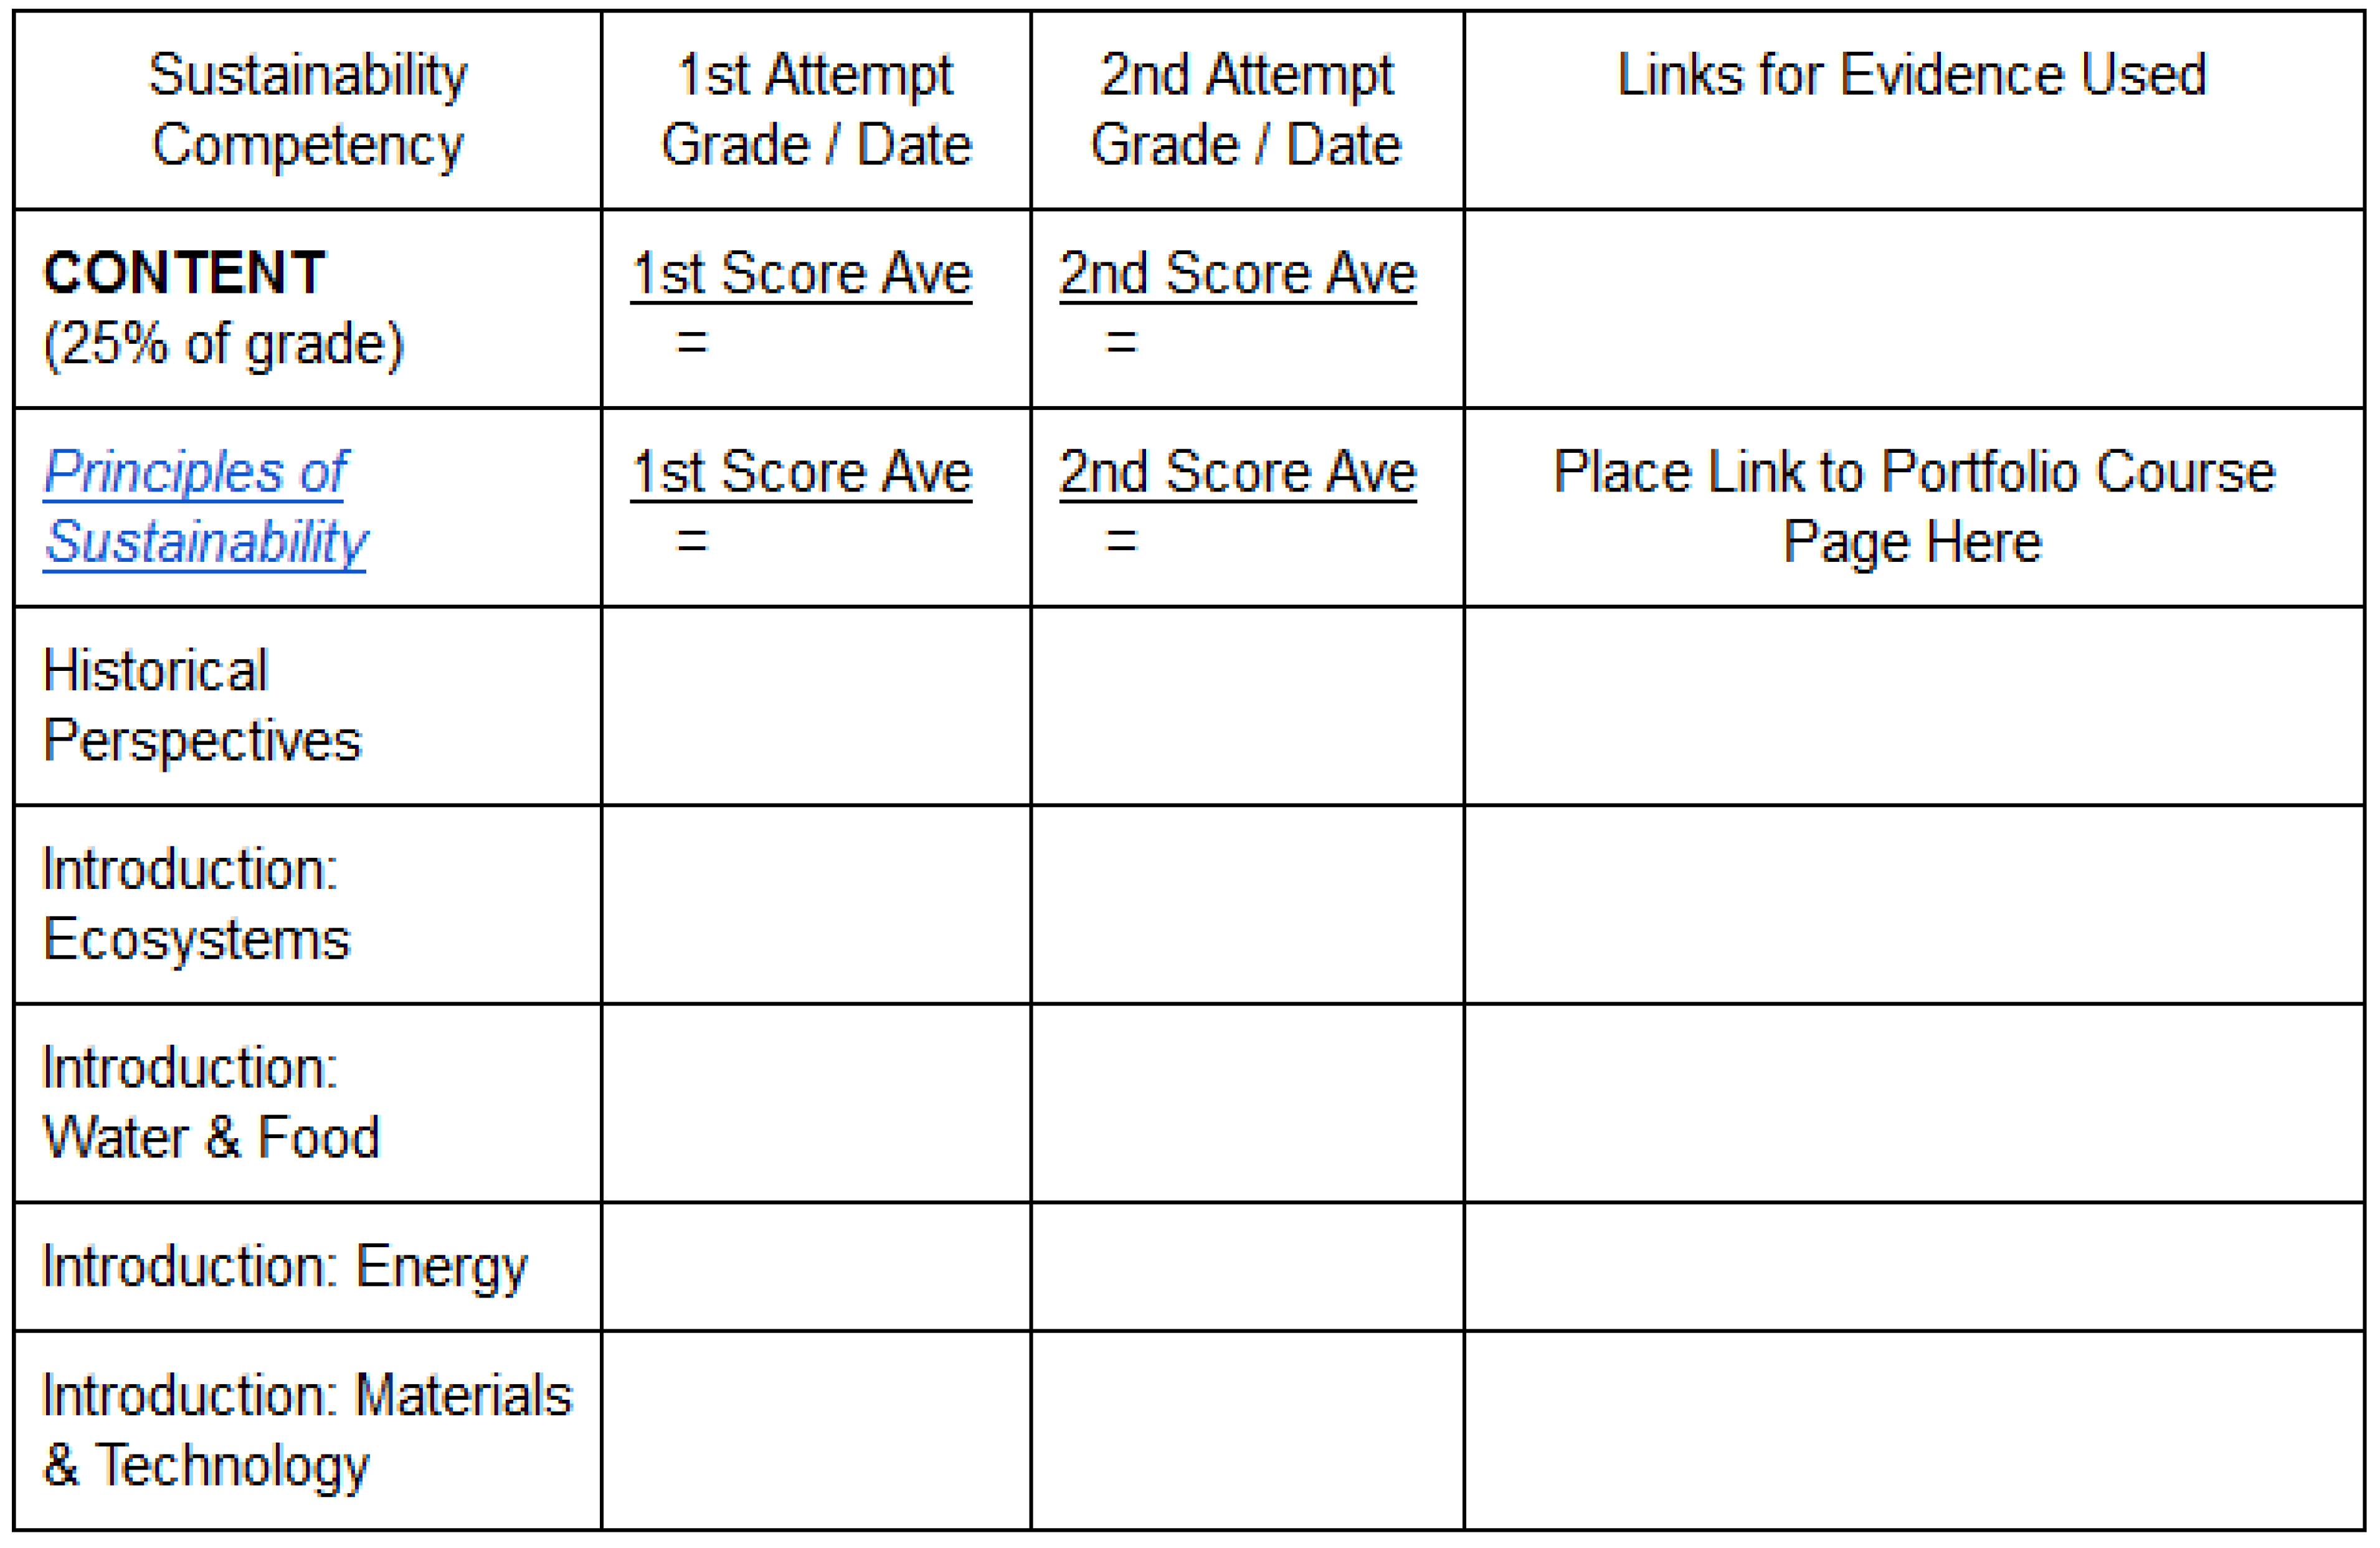
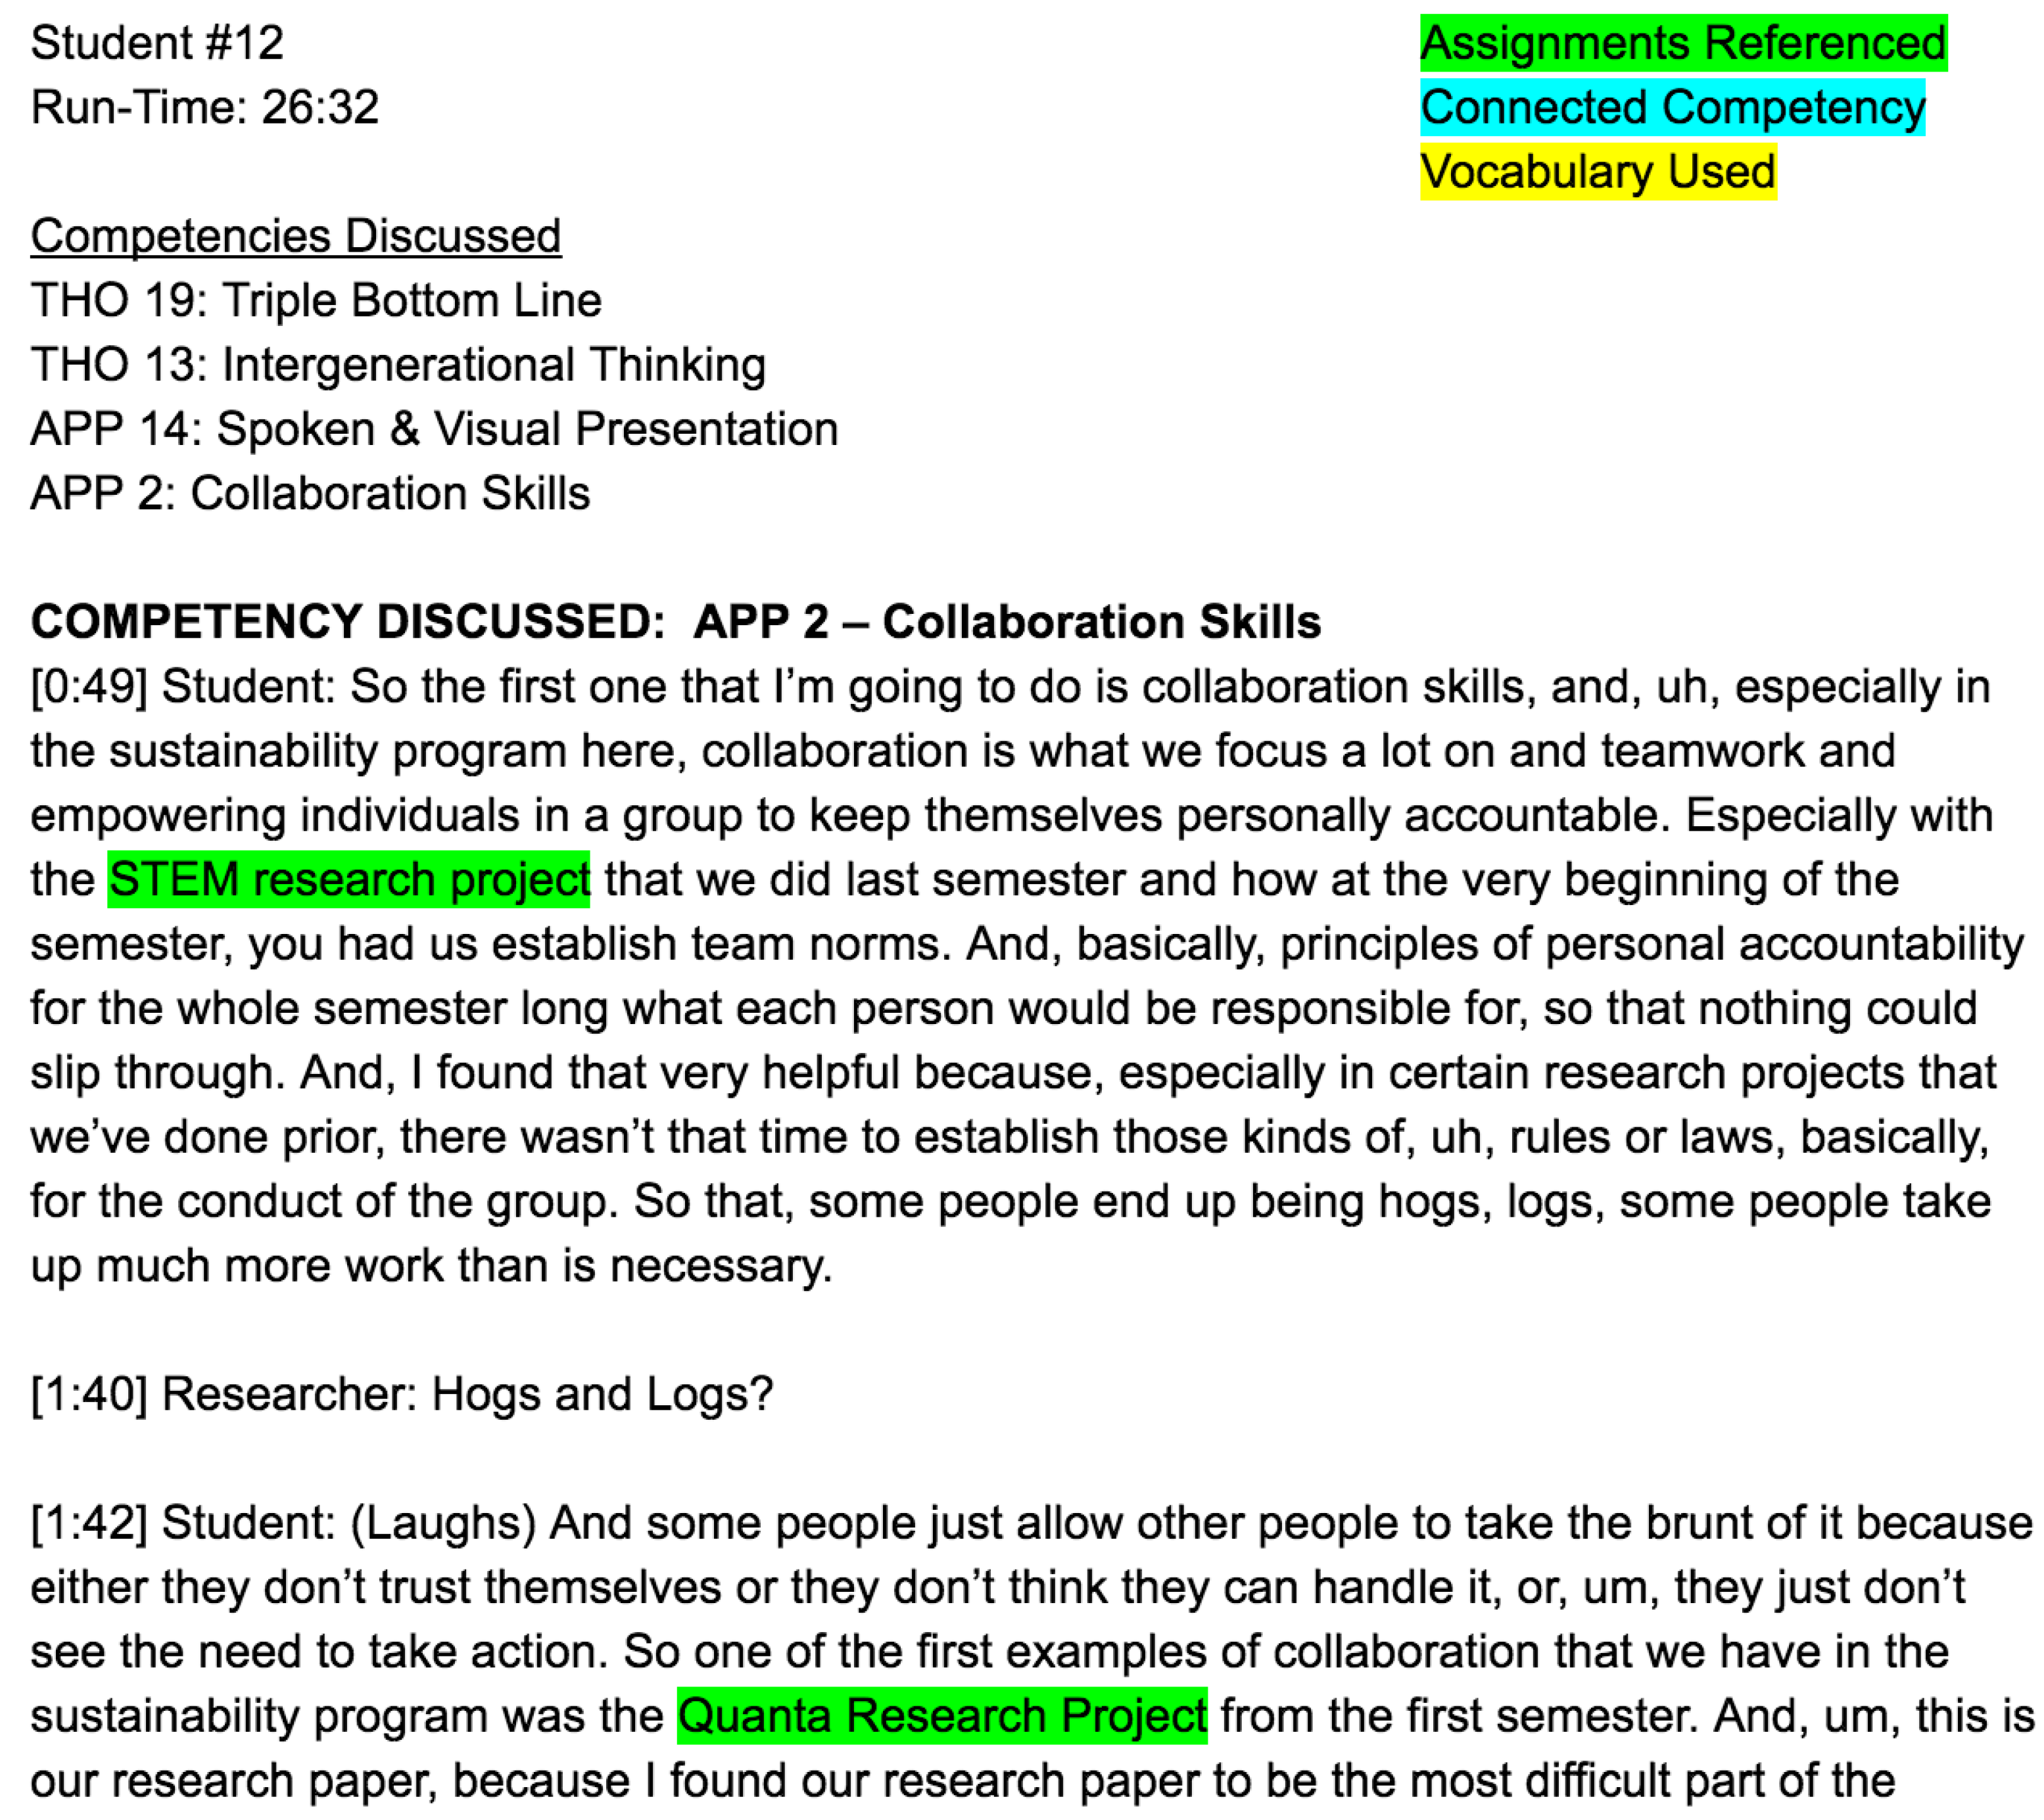
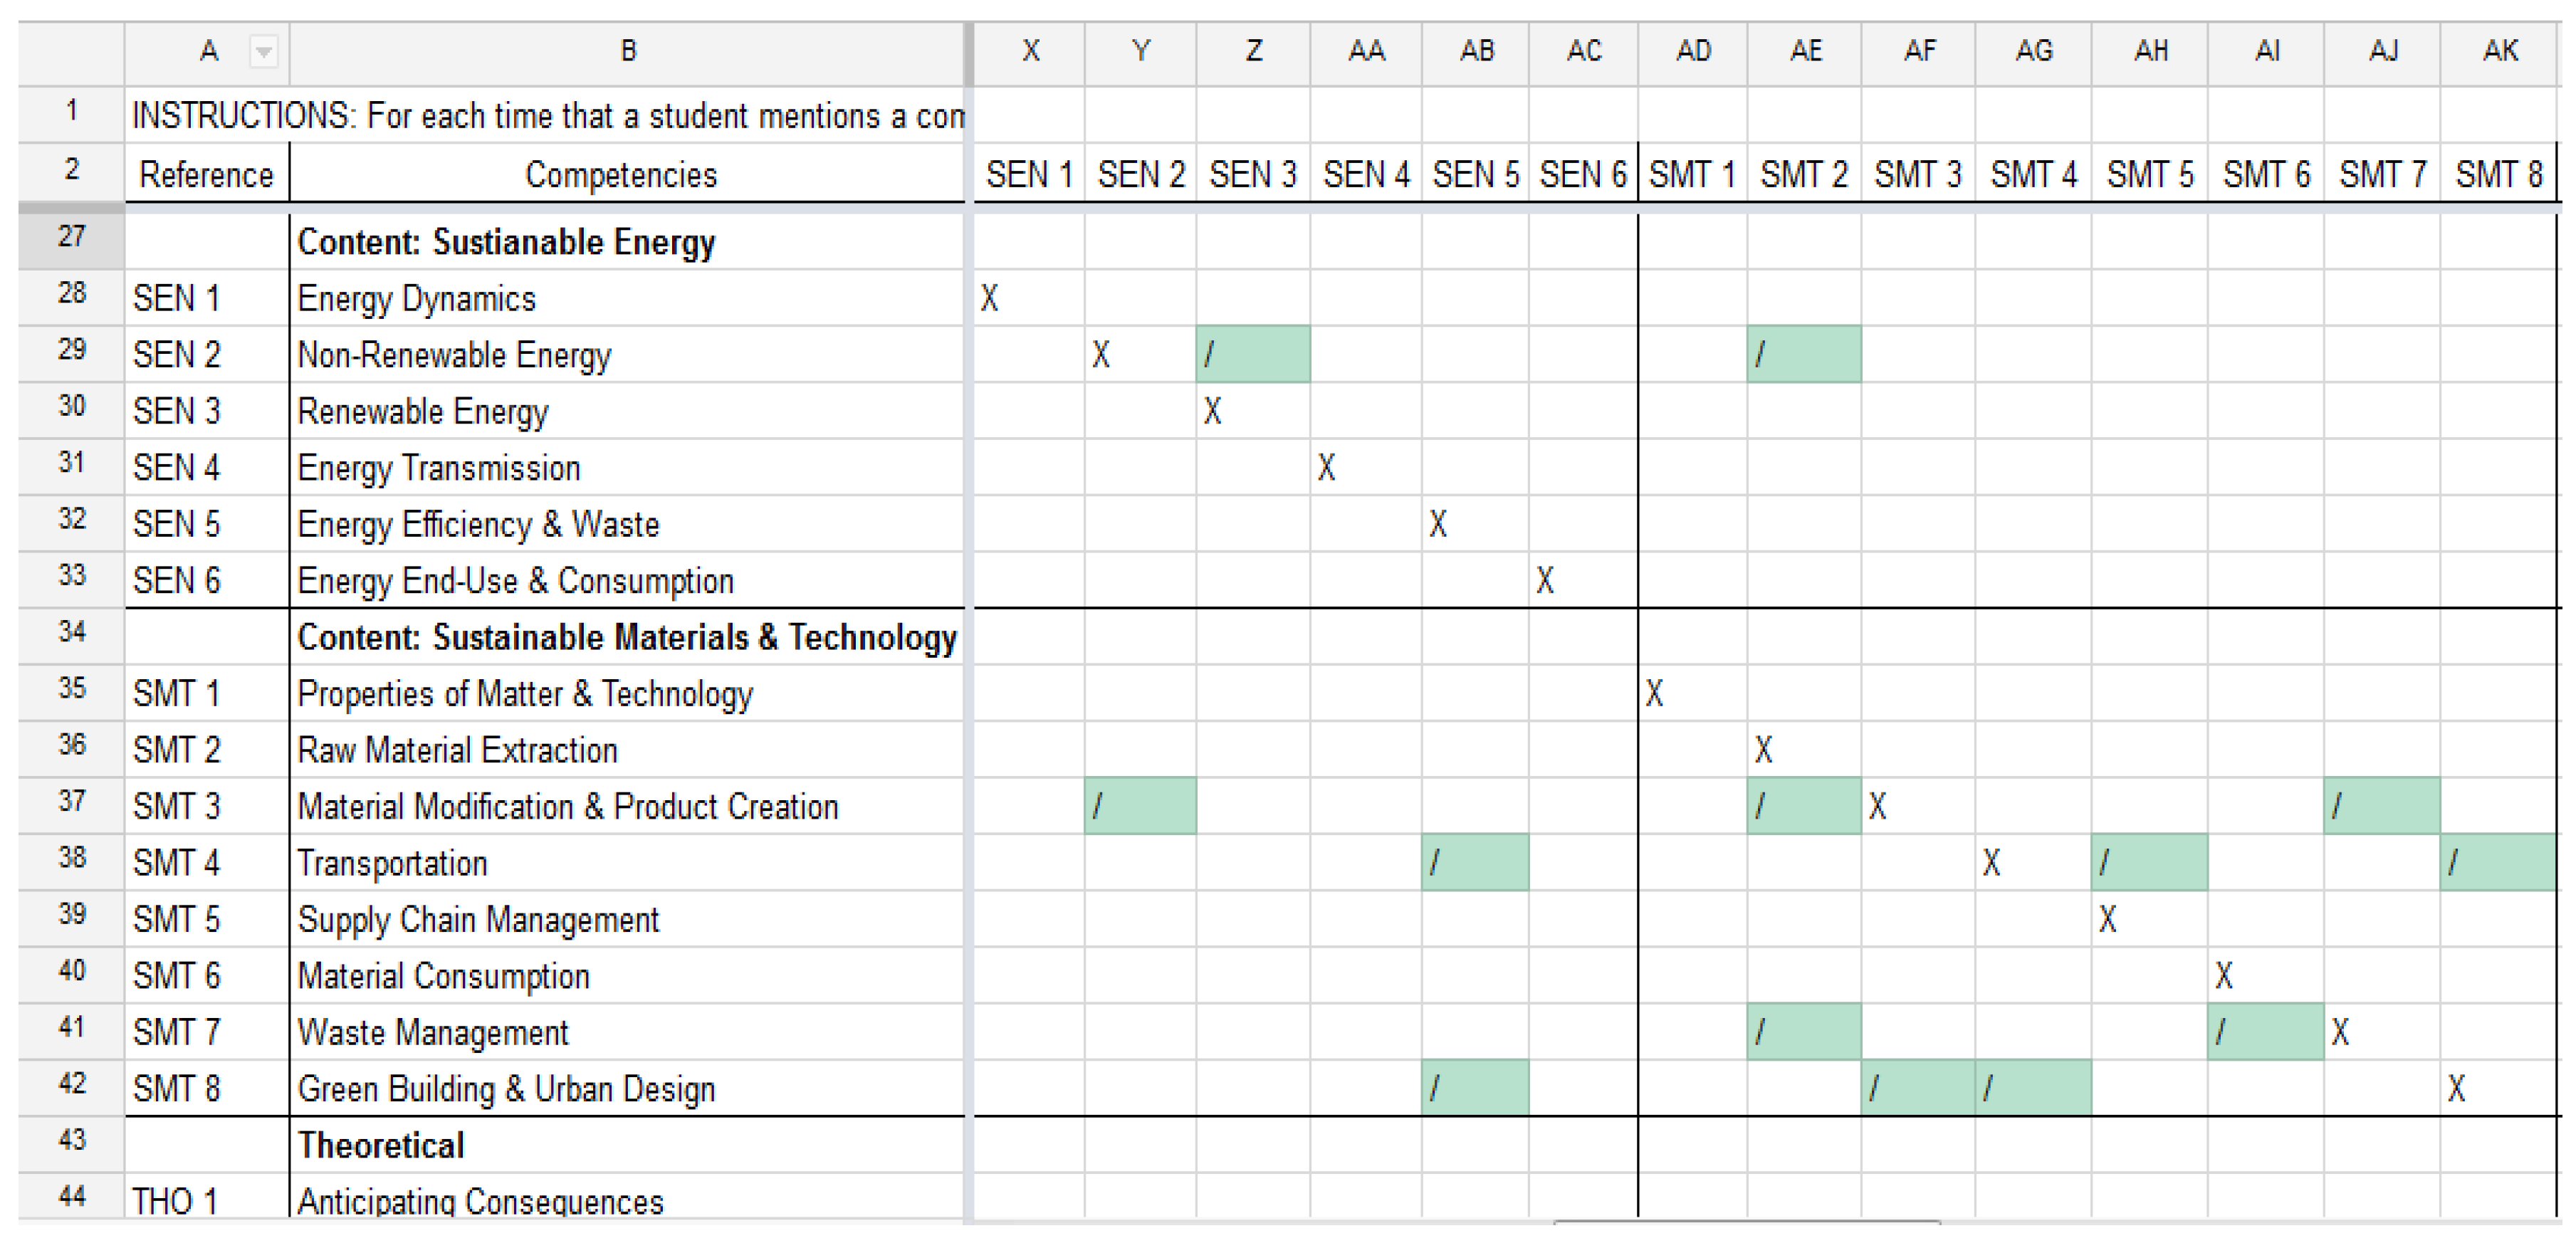
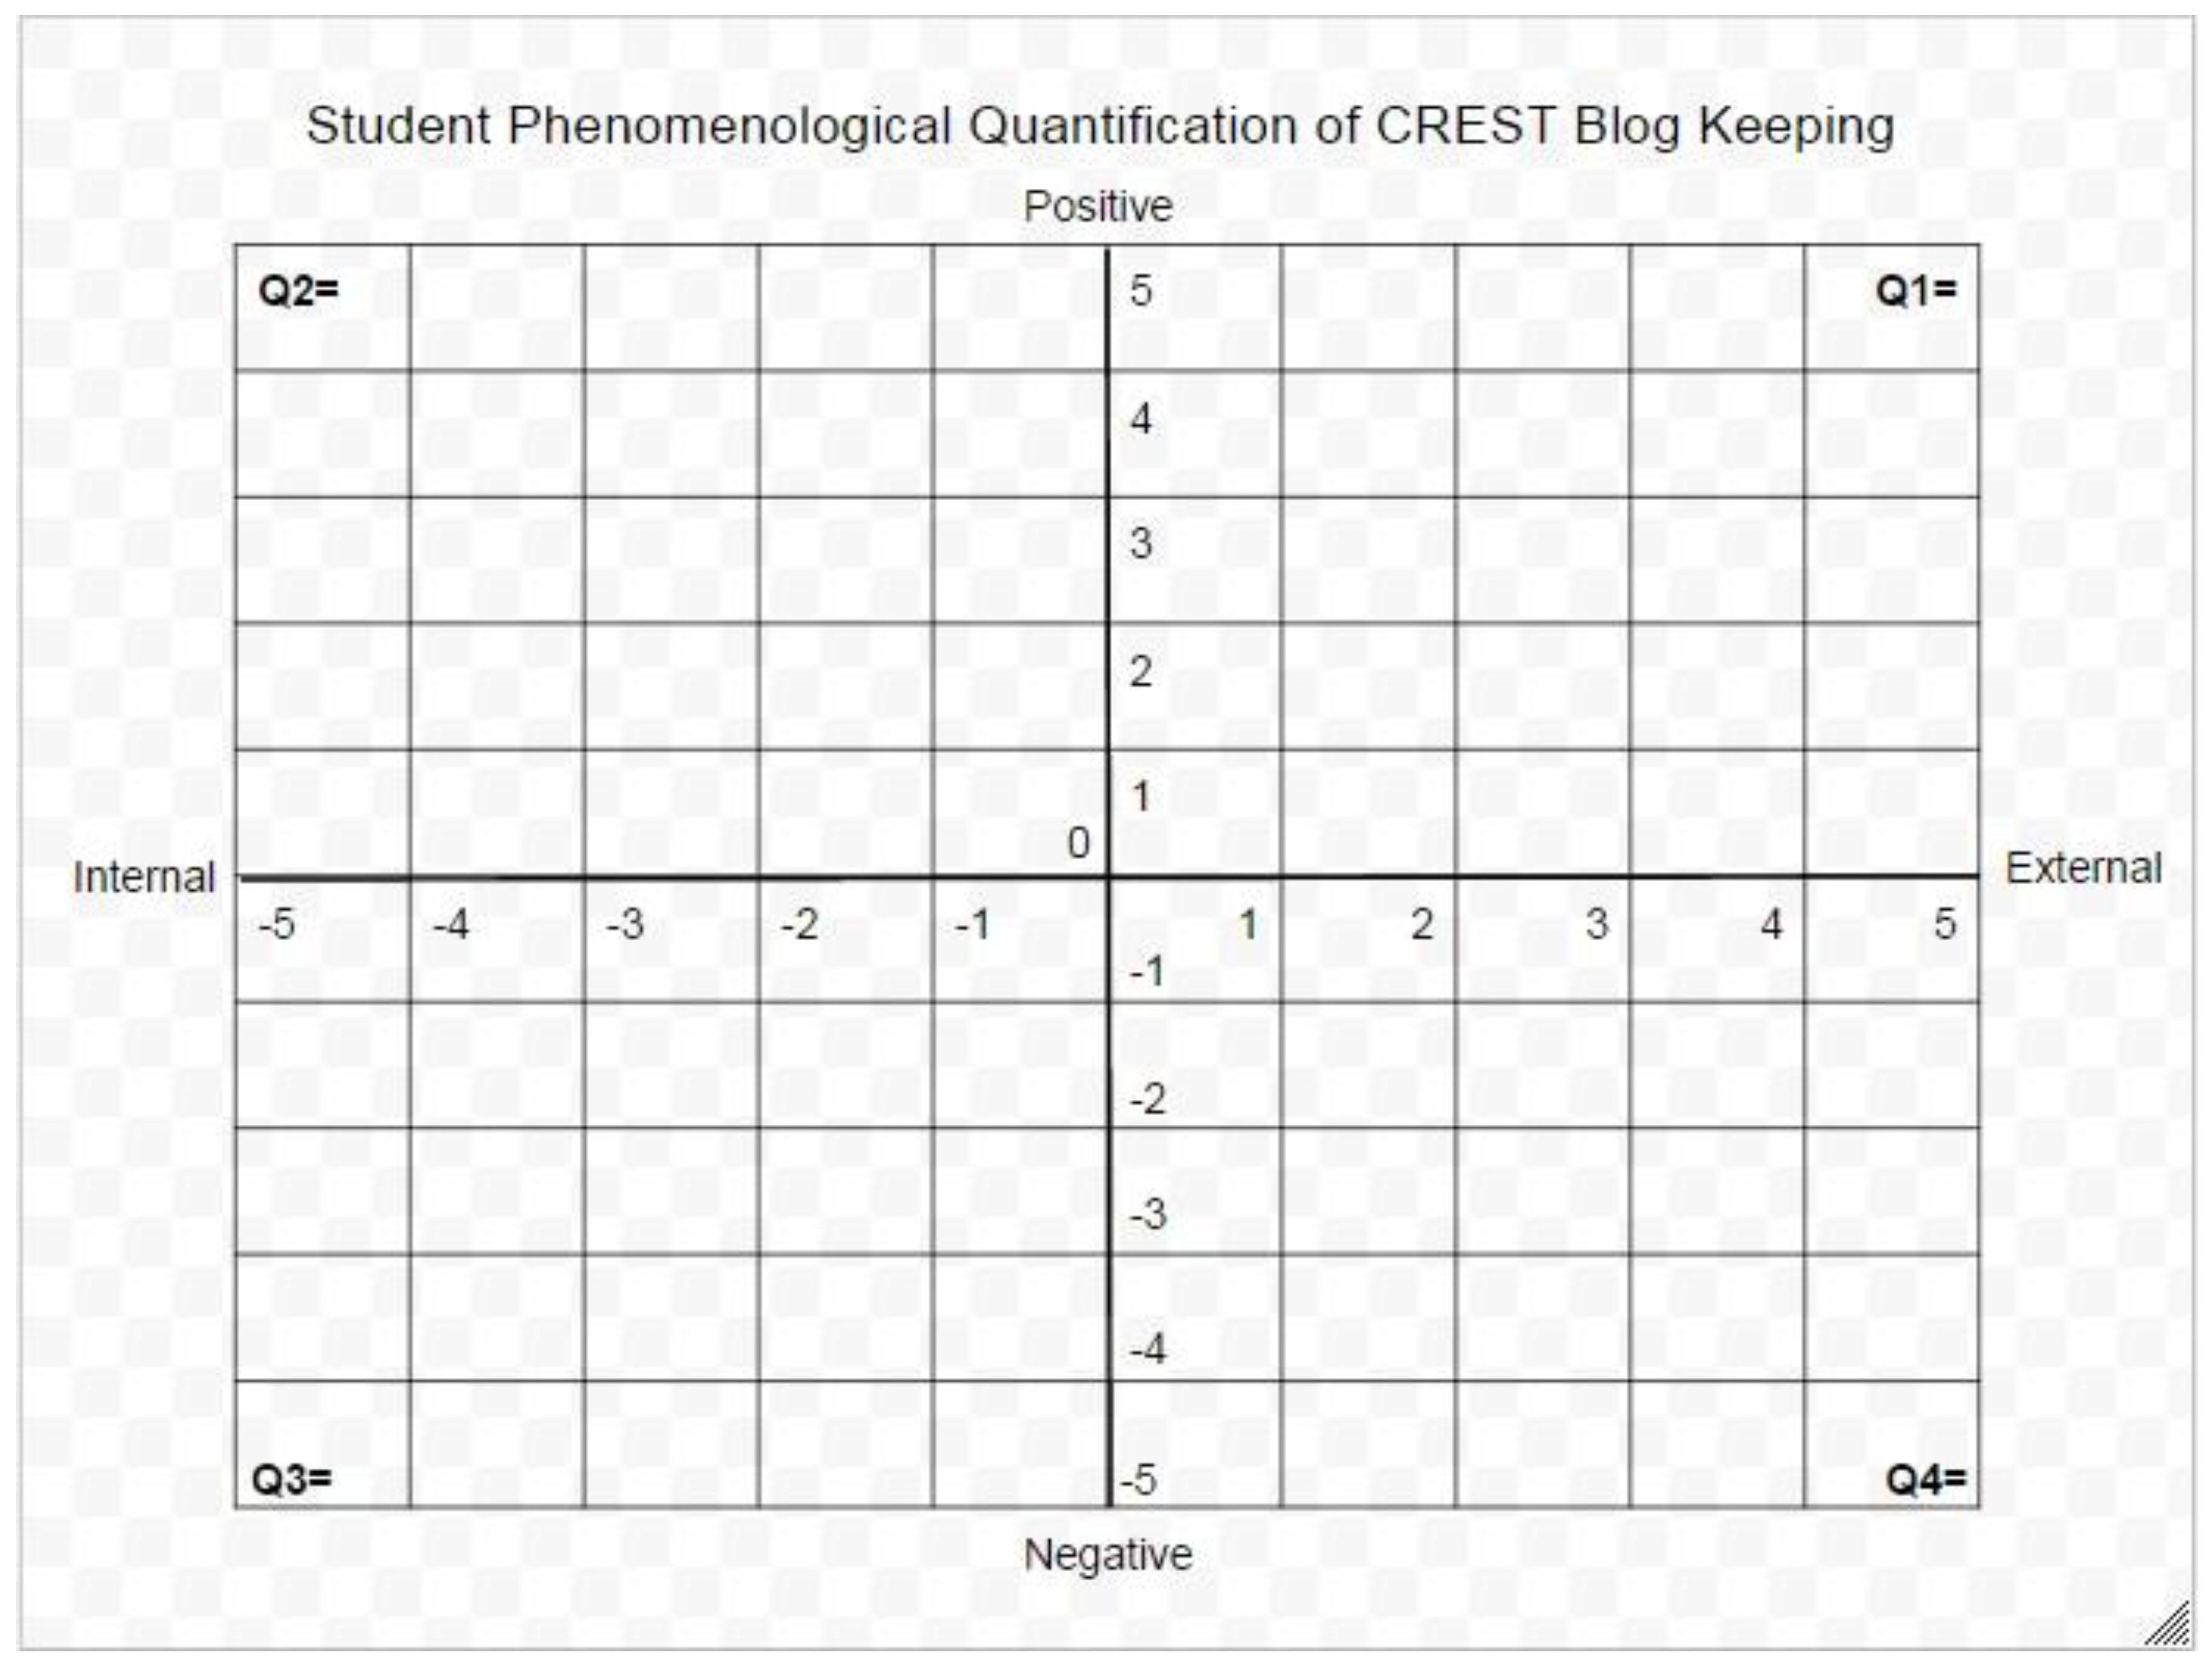
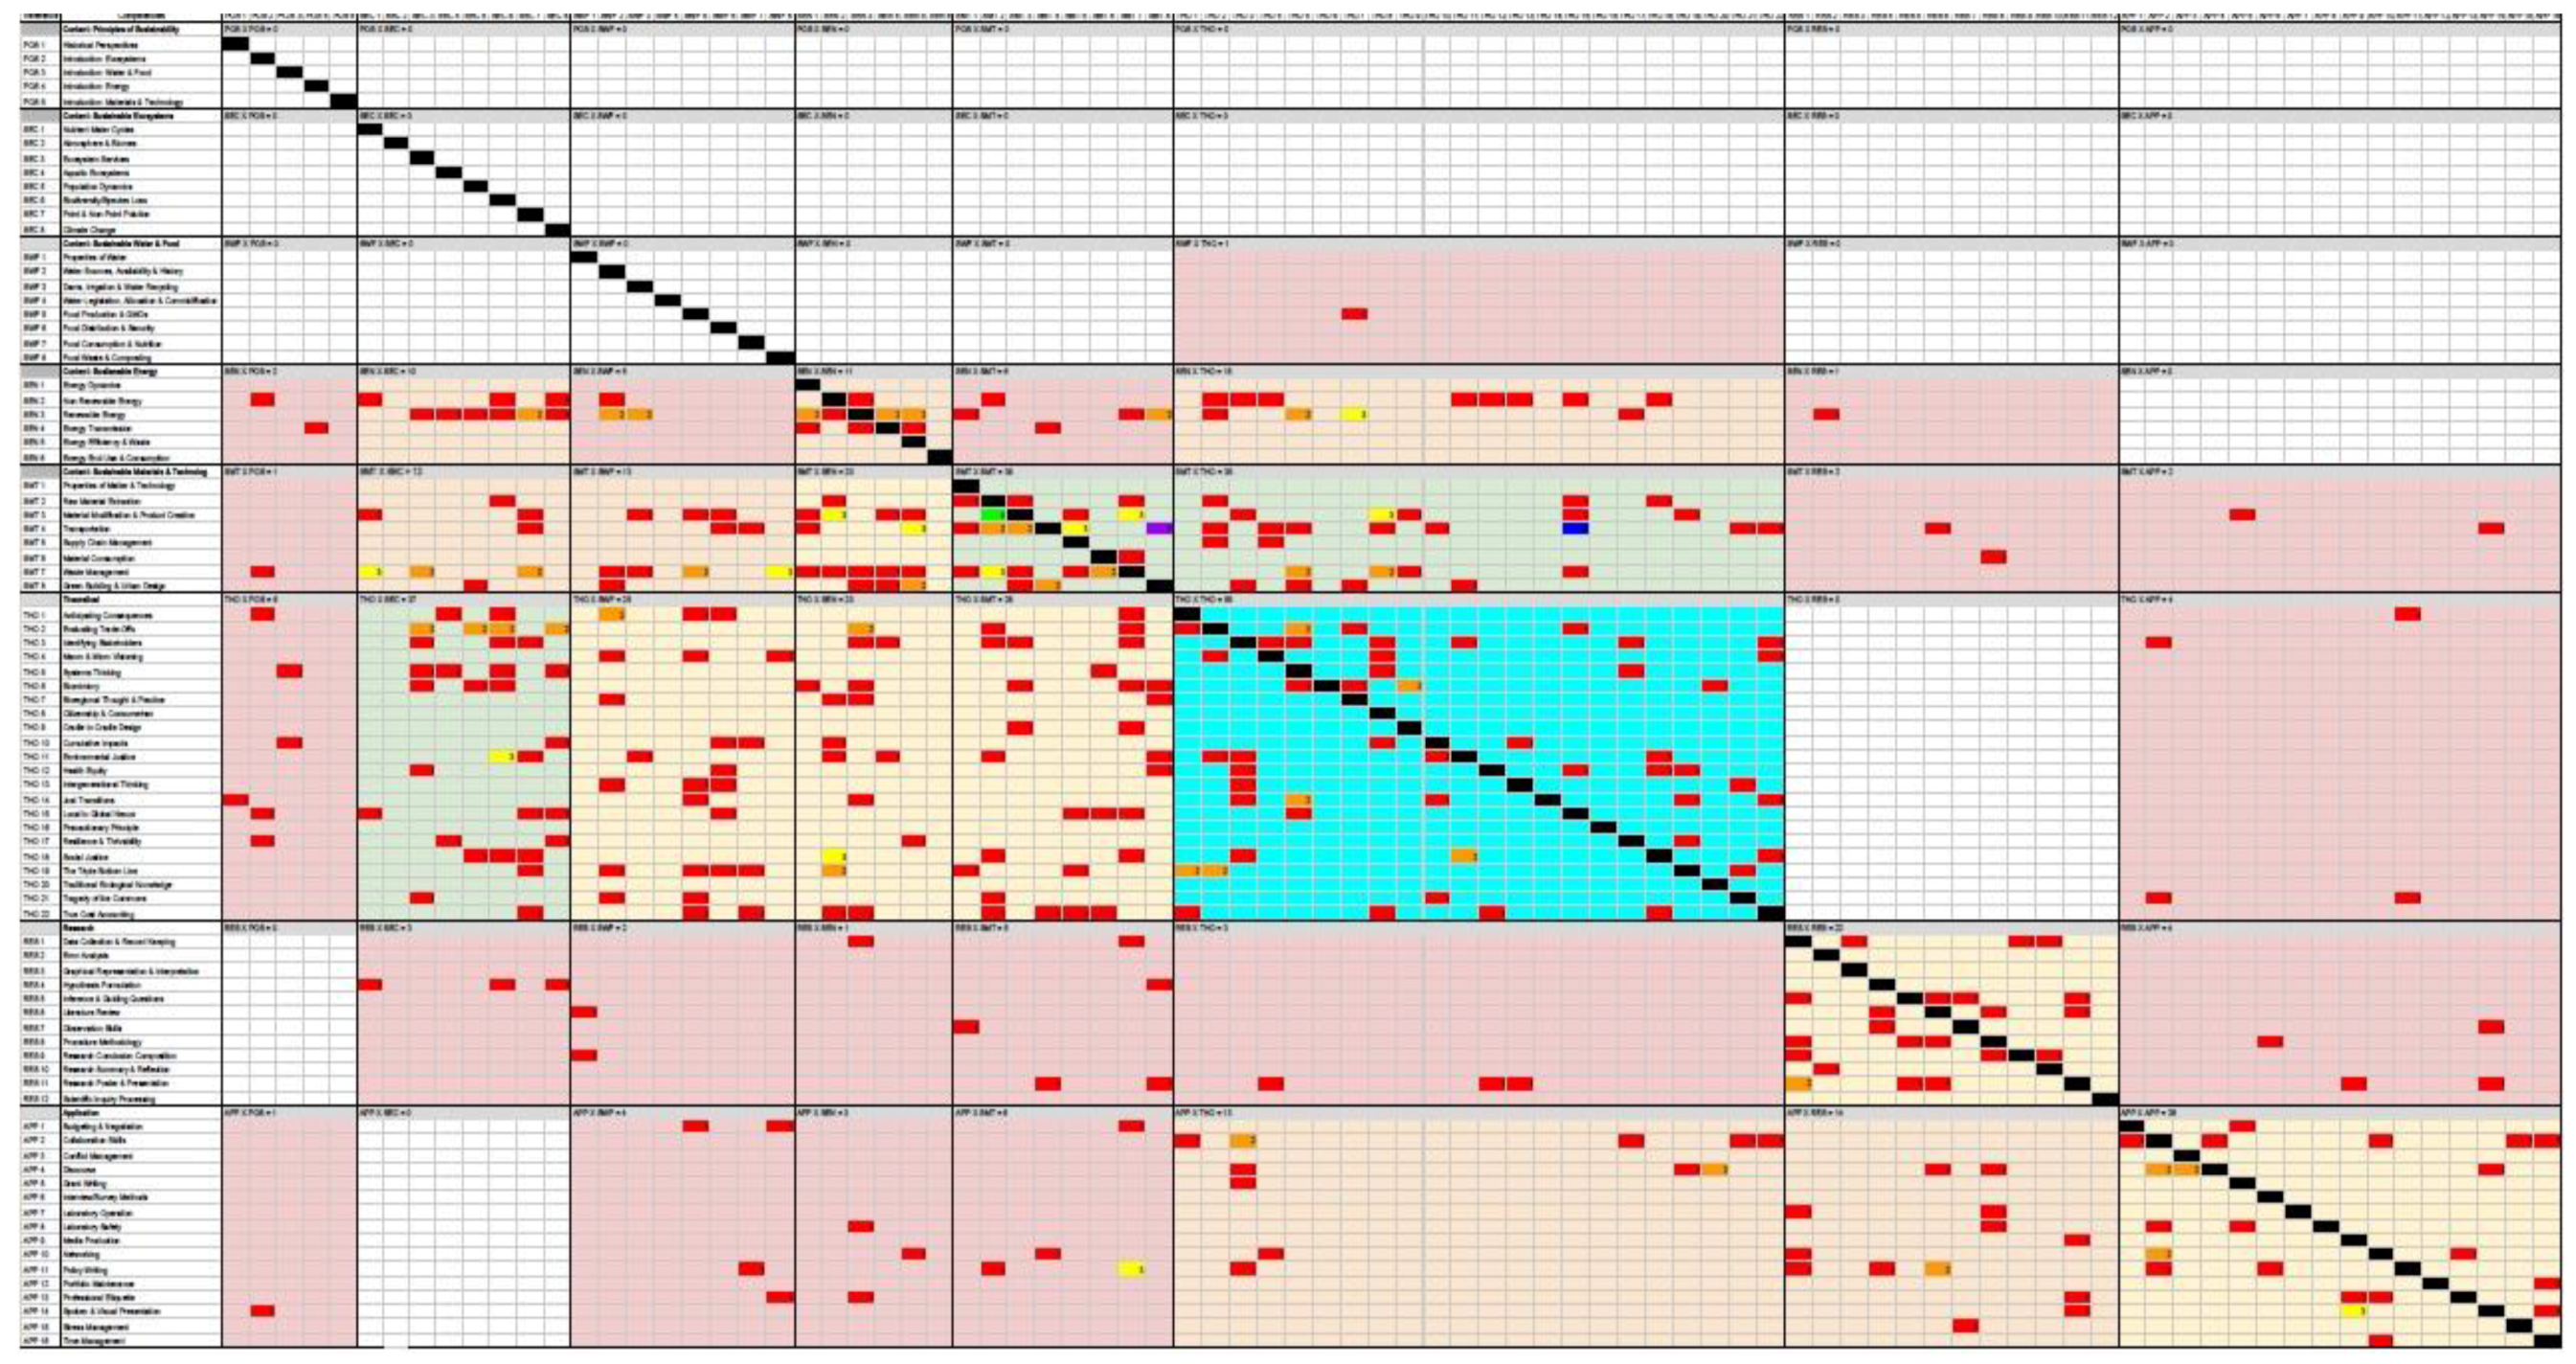
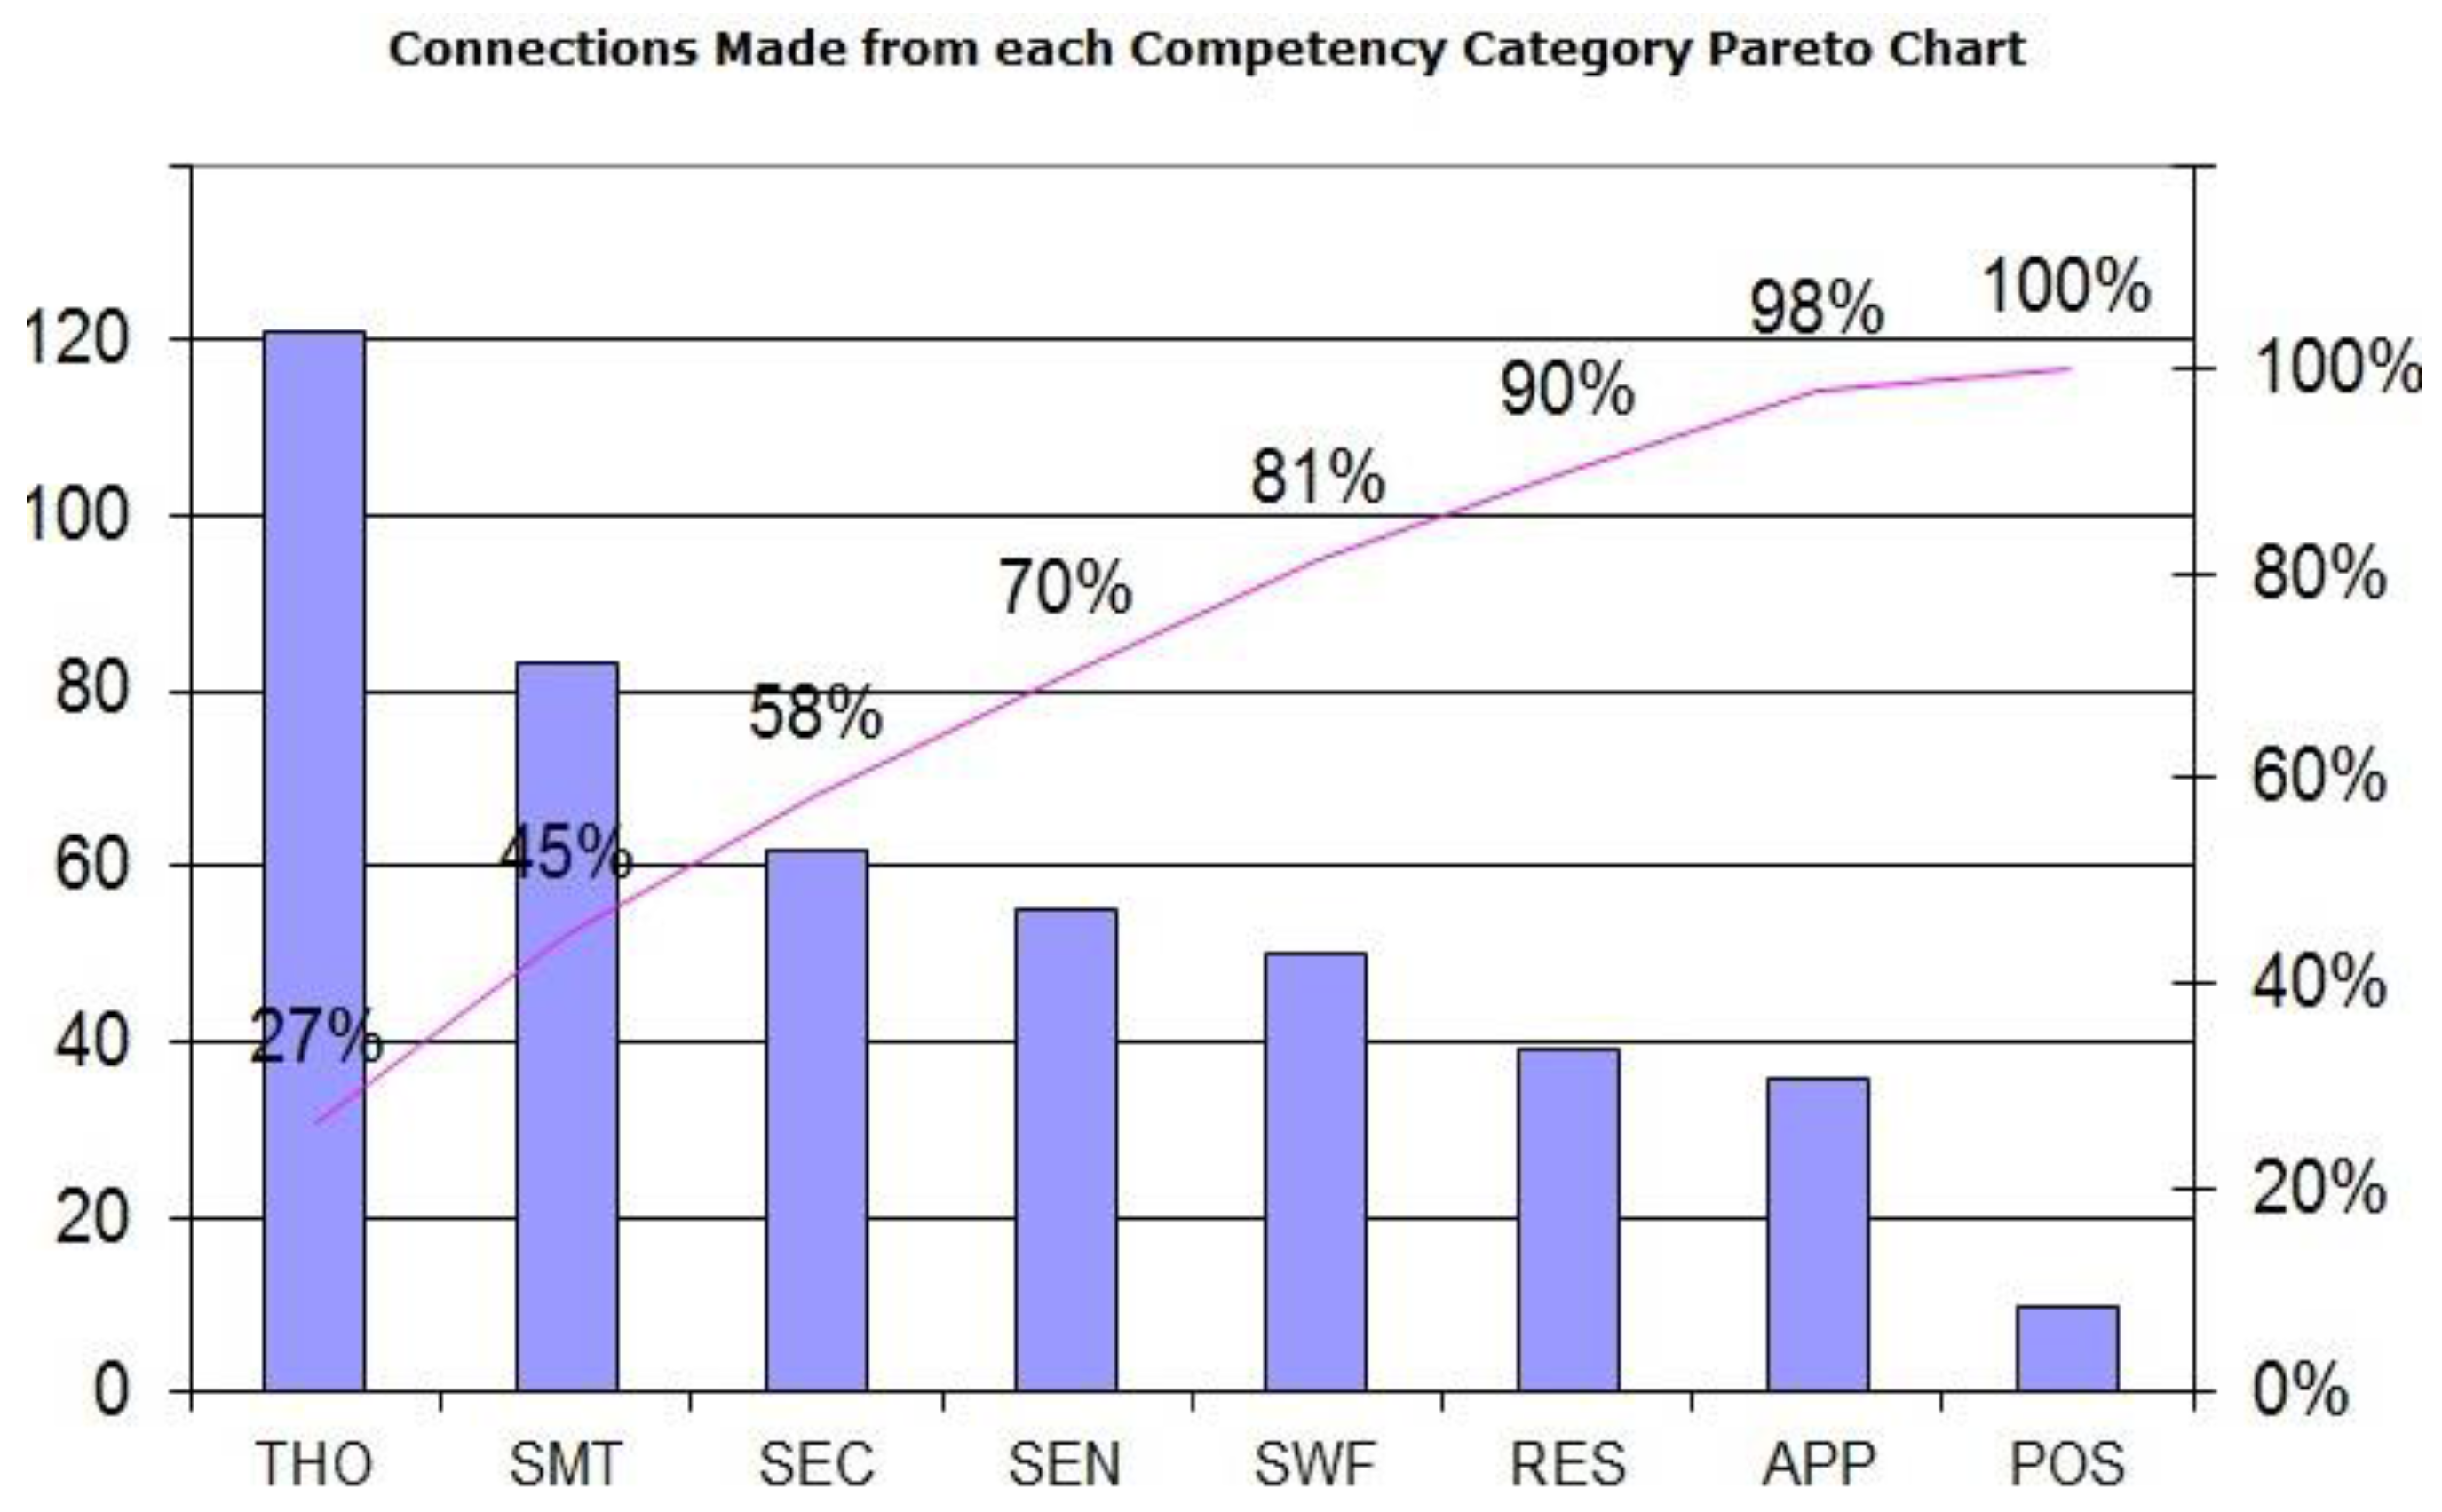
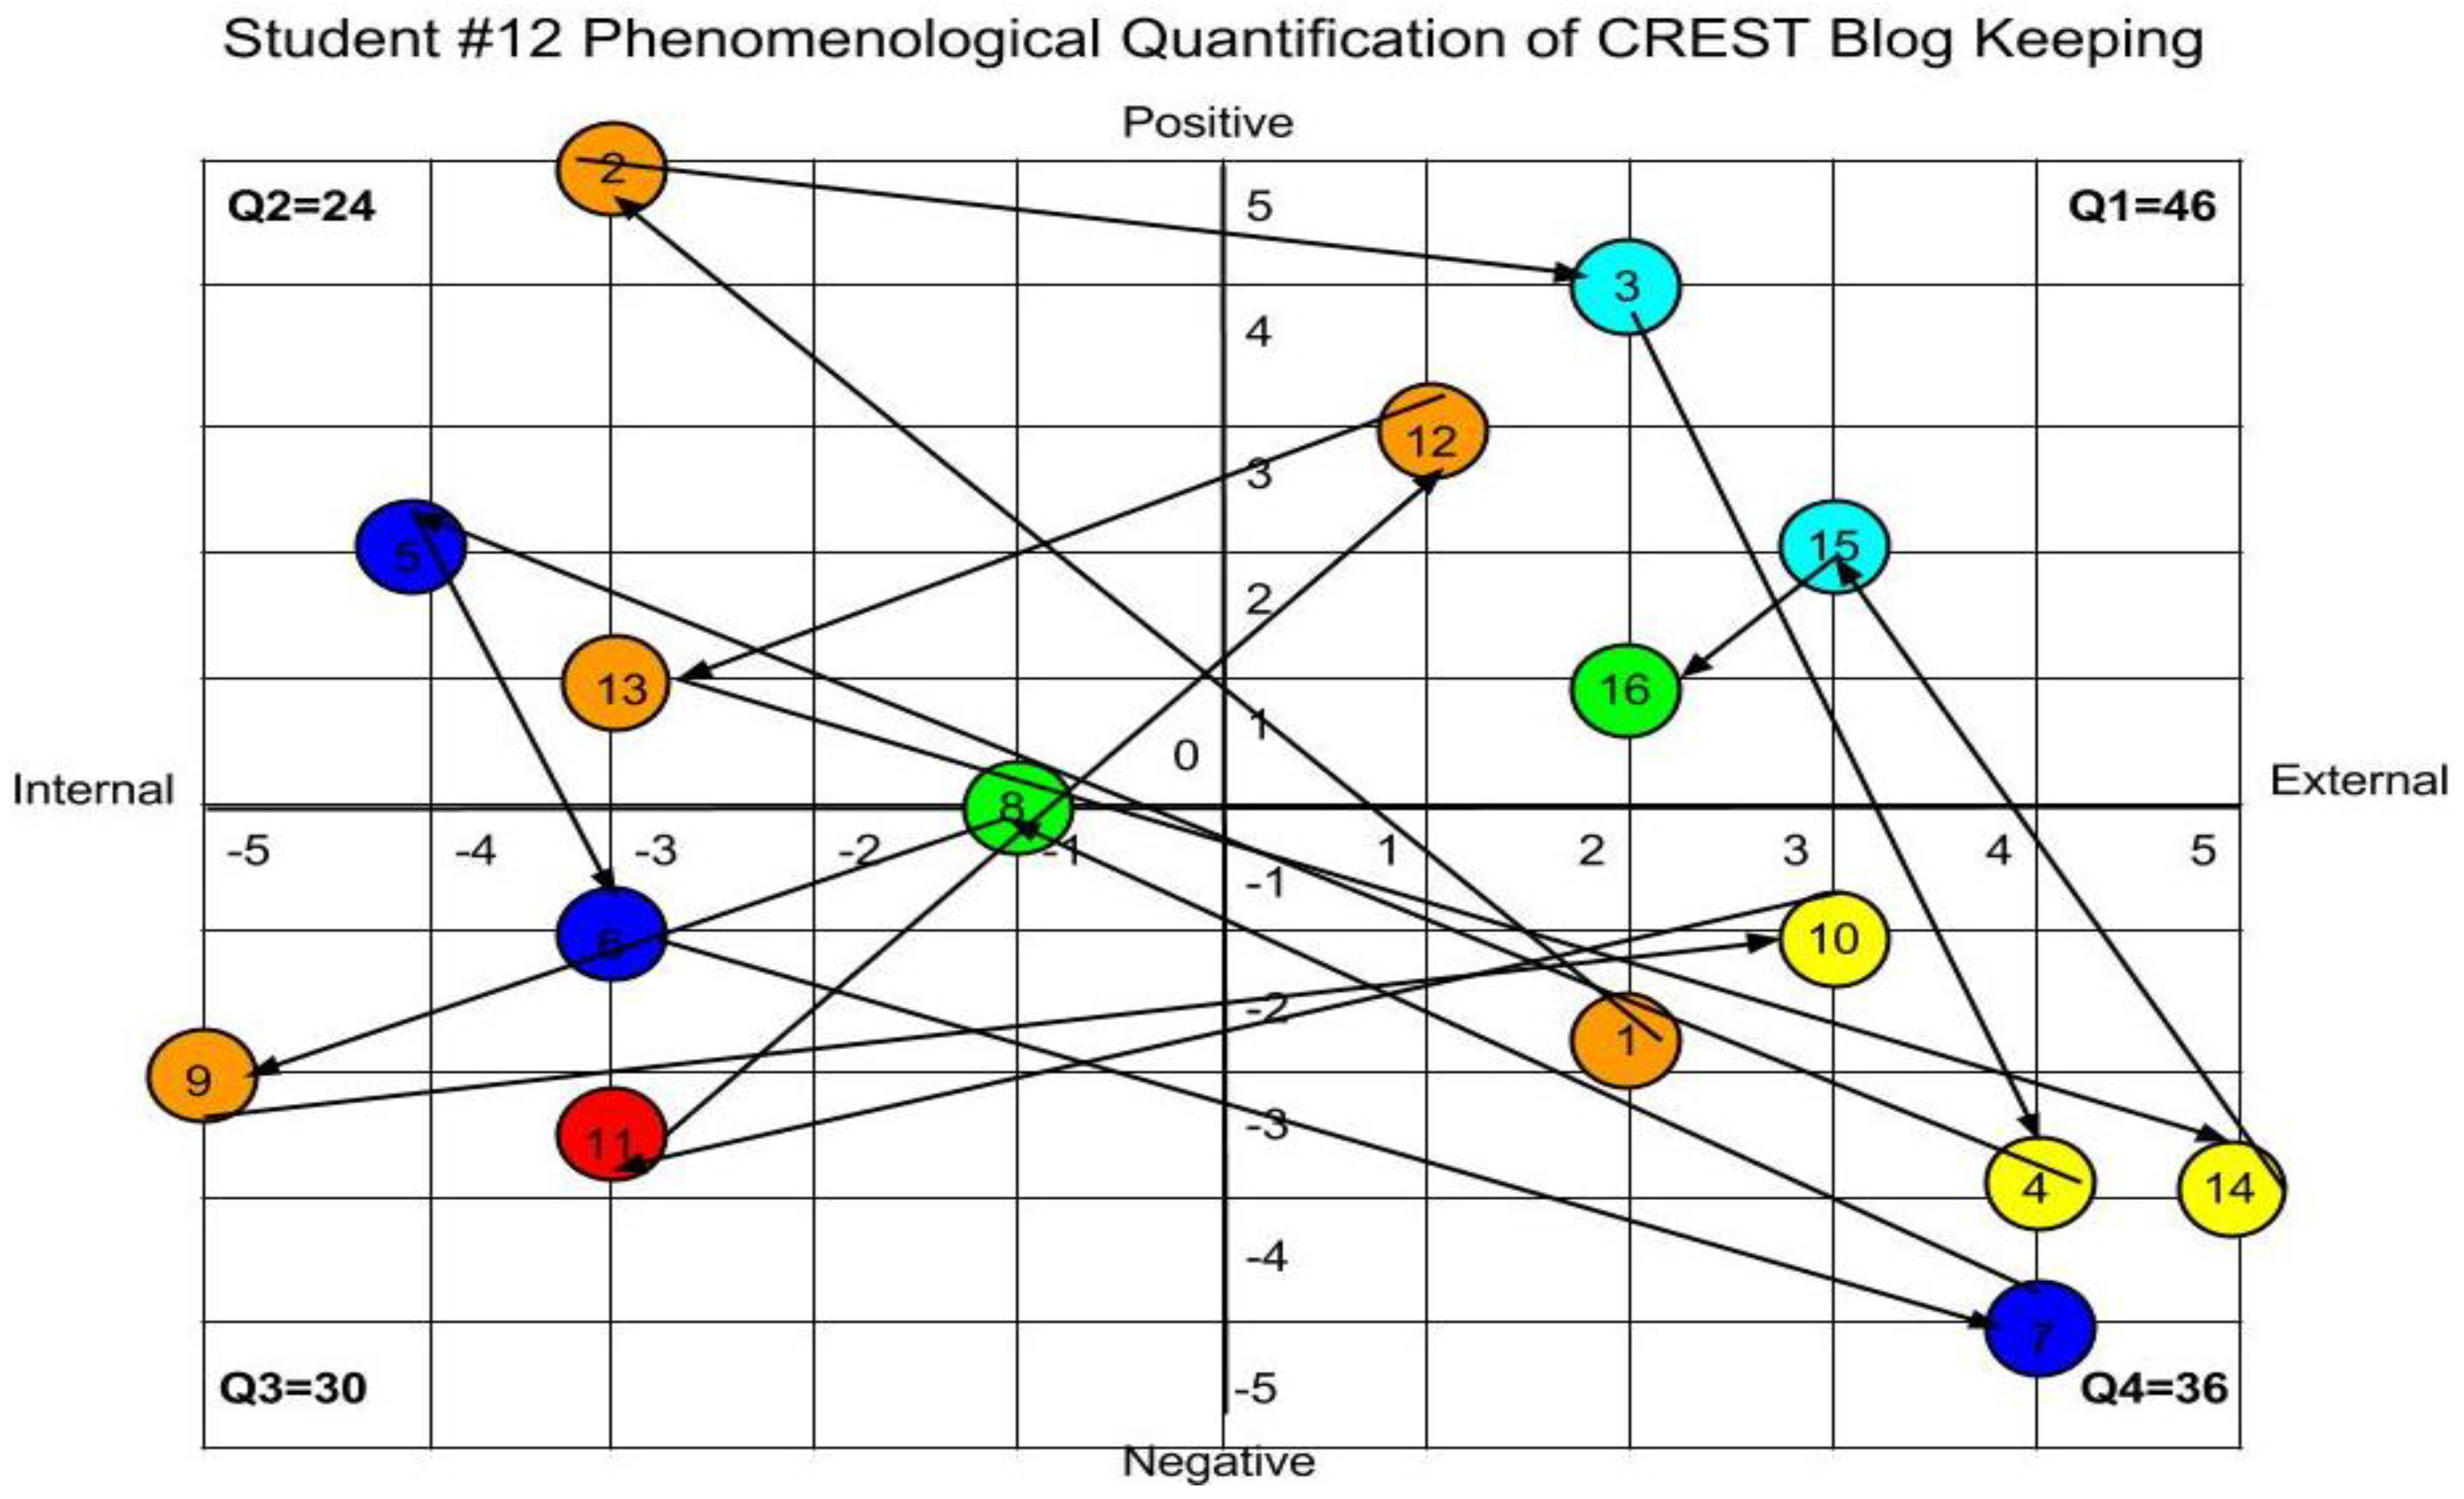
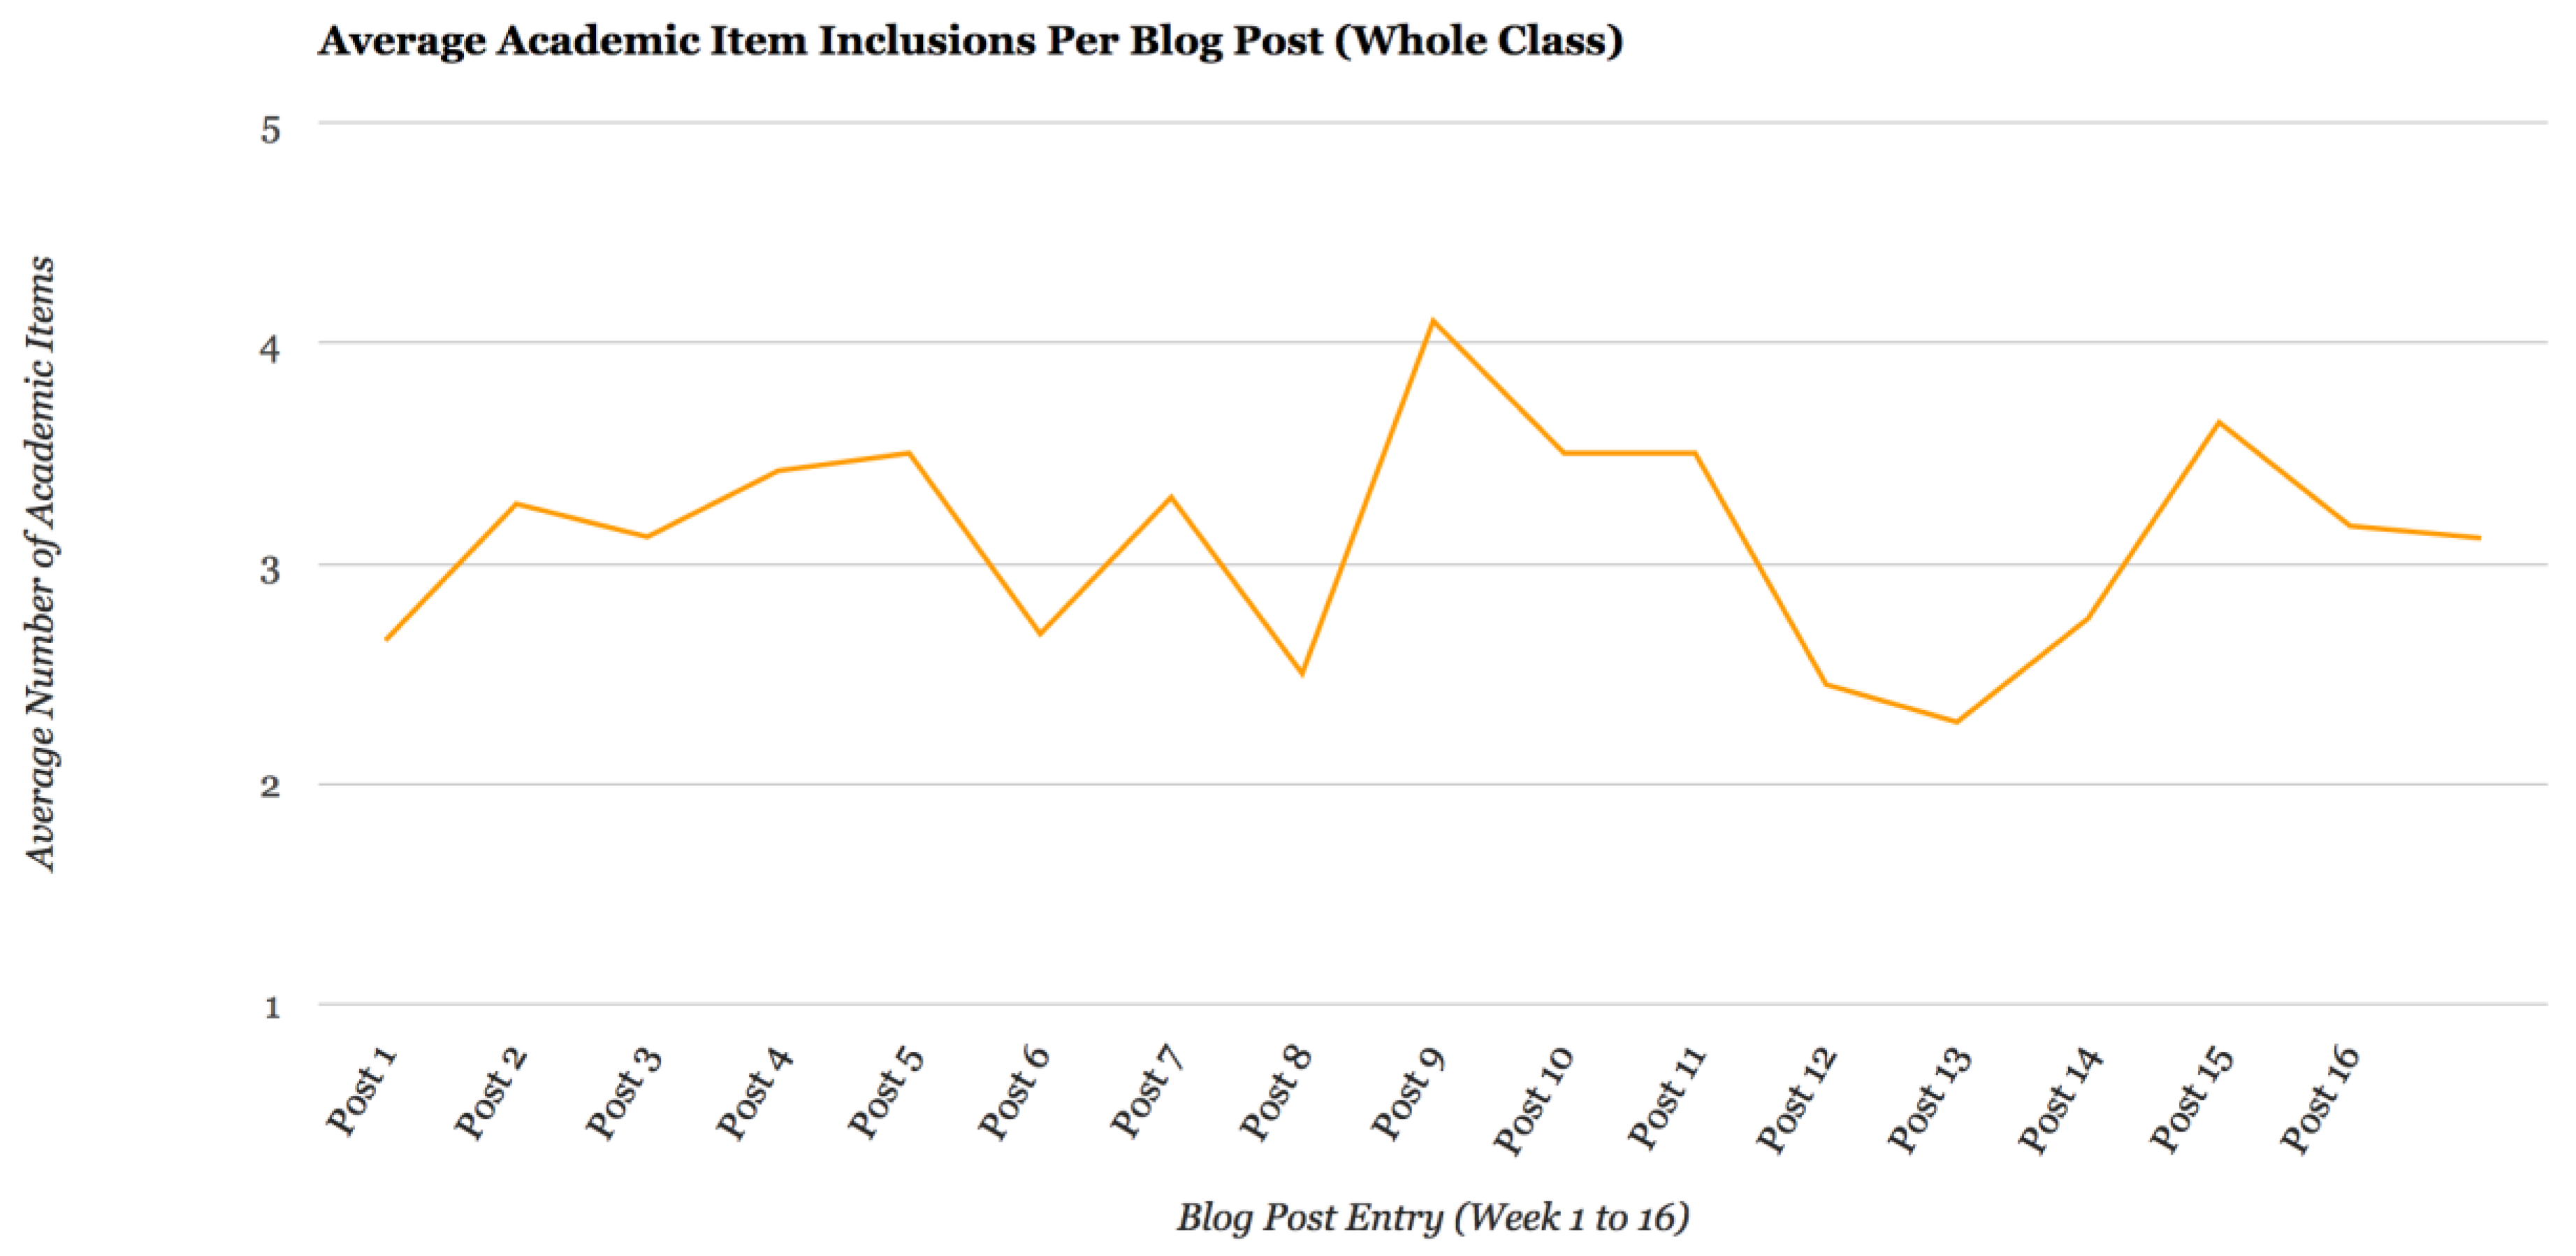
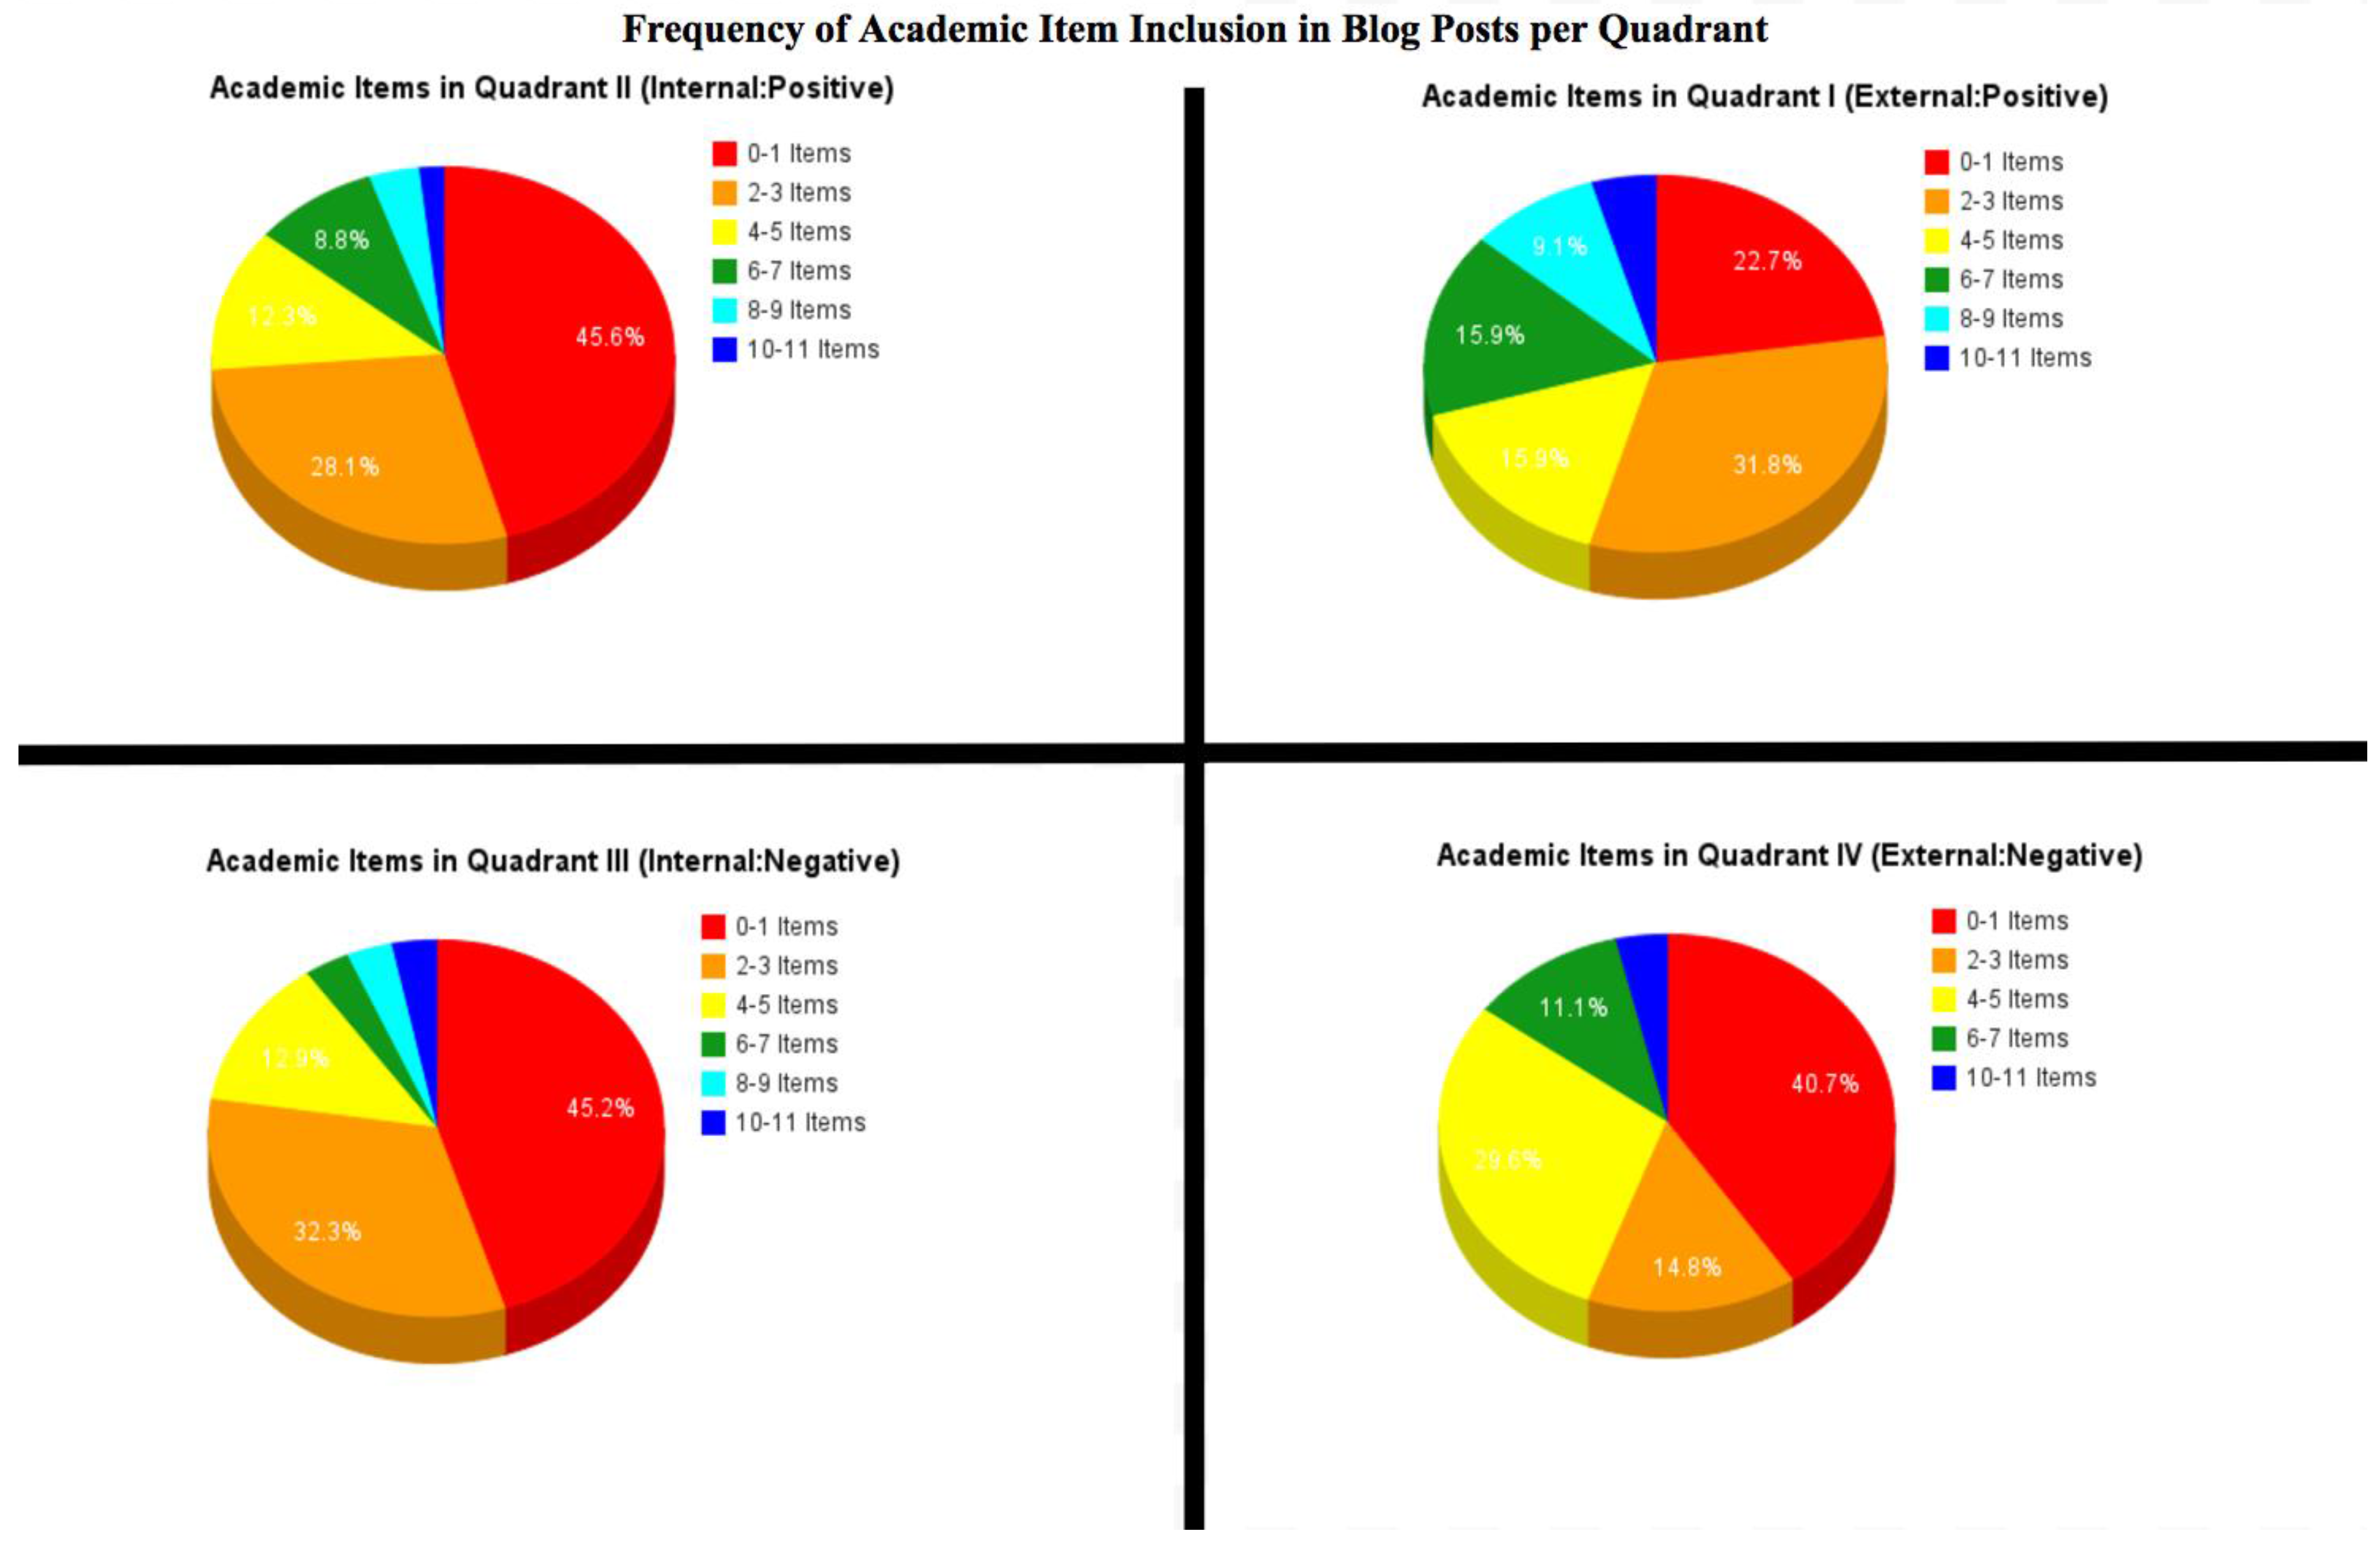
Table 1.
Class-wide average scores for competency categories.
| Competency Category (Code) | Class-Wide Average Score |
|---|---|
| Application (APP) | 8.784615385 |
| Content: Sustainable Energy (SMT) | 8.669230769 |
| Theoretical (THO) | 8.576923077 |
| Research (RES) | 8.561538462 |
| Content: Sustainable Energy (SEN) | 8.530769231 |
Table 2.
Student scores compared to competency connections during discussions.
| Student Number | Rubric Score | Overall Grade | Rubric to Overall Difference | # Connections Made | # of Comps Attempted | Ave Connections per Competency |
|---|---|---|---|---|---|---|
| 1 | 8.30 | 7.88 | −0.42 | 34 | 8 | 4.25 |
| 2 | 8.46 | 8.03 | −0.43 | 11 | 5 | 2.20 |
| 3 | 7.52 | 7.55 | +0.03 | 18 | 7 | 2.60 |
| 4 | 9.02 | 9.08 | +0.06 | 111 | 20 | 5.55 |
| 5 | 8.66 | 8.78 | +0.12 | 43 | 13 | 3.30 |
| 6 | 8.86 | 8.45 | −0.41 | 8 | 6 | 1.30 |
| 7 | 8.82 | 8.92 | +0.10 | 26 | 8 | 3.25 |
| 8 | 8.10 | 7.85 | −0.25 | 12 | 4 | 3.00 |
| 9 | 9.04 | 9.14 | +0.10 | 29 | 5 | 5.80 |
| 10 | 9.10 | 9.19 | +0.09 | 27 | 6 | 4.50 |
| 11 | 8.22 | 8.00 | −0.22 | 33 | 7 | 4.70 |
| 12 | 9.14 | 9.34 | +0.20 | 70 | 14 | 5.00 |
| 13 | 8.88 | 8.85 | −0.03 | 35 | 7 | 5.00 |
| Totals | 8.62 | 8.54 | −0.08 | 457 | 110 | 3.88 |
Table 3.
Overall course scores compared to overall course competencies connected.
| Course | Rubric Score | Overall Grade | Total Made/Ave per Content Comp |
|---|---|---|---|
| Sustainable Energy (SEN) | 8.53 | 8.44 (84.4%) | 50 total/8.33 per Content Comp |
| Sustainable Materials and Tech (SMT) | 8.67 | 8.64 (86.4%) | 123 total/15.38 per Content Comp |
Table 4.
Number of posts in each quadrant and their academic inclusions.
| Academic Items | Quadrant I | Quadrant II | Quadrant III | Quadrant IV |
|---|---|---|---|---|
| 0–1 Items | 10 | 26 | 14 | 11 |
| 2–3 Items | 14 | 16 | 10 | 4 |
| 4–5 Items | 7 | 7 | 4 | 8 |
| 6–7 Items | 7 | 5 | 1 | 3 |
| 8–9 Items | 4 | 2 | 1 | 0 |
| 10–11 Items | 2 | 1 | 1 | 1 |
| Total | 44 | 57 | 31 | 27 |
Table 5.
Weighted post totals for each student and each quadrant.
| Student # | Quadrant I | Quadrant II | Quadrant III | Quadrant IV | Quadrant # Majority |
|---|---|---|---|---|---|
| 1 | 41.5 | 33 | 4 | 12.5 | I |
| 2 | 3 | 6 | 1 | 0 | II |
| 3 | 9.5 | 3 | 0 | 2 | I |
| 4 | 28.5 | 88.5 | 16 | 2 | II |
| 5 | 15 | 42 | 69 | 0 | III |
| 6 | 5.5 | 12 | 1 | 2.5 | II |
| 7 | 68.5 | 77.5 | 0 | 12.5 | II |
| 8 | 32 | 63 | 10 | 0 | II |
| 9 | 68.5 | 33.5 | 5.5 | 27.5 | I |
| 10 | 23.5 | 52.5 | 43.5 | 16.5 | II |
| 11 | 48 | 17.5 | 5 | 7.5 | I |
| 12 | 46 | 41 | 30 | 36 | I |
| 13 | 40 | 4 | 37 | 39 | I |
| Total | 429.5 | 473.5 | 222 | 158 | I: 6, II: 6, III: 1, IV: 0 |
© 2017 by the author. Licensee MDPI, Basel, Switzerland. This article is an open access article distributed under the terms and conditions of the Creative Commons Attribution (CC BY) license (http://creativecommons.org/licenses/by/4.0/).
Share and Cite
MDPI and ACS Style
Bernier, A. From Linear Industrial Structures to Living Systems: A Design Shift in Education for Sustainability. Educ. Sci. 2017, 7, 43. https://doi.org/10.3390/educsci7020043
AMA Style
Bernier A. From Linear Industrial Structures to Living Systems: A Design Shift in Education for Sustainability. Education Sciences. 2017; 7(2):43. https://doi.org/10.3390/educsci7020043
Chicago/Turabian StyleBernier, Andrew. 2017. "From Linear Industrial Structures to Living Systems: A Design Shift in Education for Sustainability" Education Sciences 7, no. 2: 43. https://doi.org/10.3390/educsci7020043
Note that from the first issue of 2016, this journal uses article numbers instead of page numbers. See further details here.