Effects of Educational Efficiency on National Competitiveness Based on Cross-National Data


School of Public Policy and Management, Tsinghua University, Shuang Qing Road 30, Hai Dian District, Beijing 100084, China
*
Author to whom correspondence should be addressed.
Educ. Sci. 2017, 7(4), 81; https://doi.org/10.3390/educsci7040081
Submission received: 31 August 2017
/
Revised: 27 September 2017
/
Accepted: 22 October 2017
/
Published: 24 October 2017
Abstract
:The importance of education to national competitiveness and future development is self-evident. Resource input secures educational development. However, the efficiency of educational resources, their input–output ratio, and their effects on national competitiveness are matters of concern. This study aims to measure the efficiency of educational resources of a country within the scope of financial capacity. This study further evaluates the effects of educational efficiency on national competitiveness. Data envelopment analysis was applied to measure the efficiency of educational resources, and two-way fixed-effect panel data were used to evaluate the effects on national competitiveness. This study corroborated that among 53 countries, those with high educational efficiency and stable development are mainly concentrated in East and Southeast Asia. According to different levels of development and/or regional location, the driver of education is only significant in the most competitive economies. In addition, given the development stage, governments should depend on their own level of competitiveness in determining priority areas of development.
1. Introduction
The importance of education is evident in the advancement of global knowledge and development. Governments are increasing their budgetary investment in education every year to improve national education standards [1]. However, achievement in education should be accumulated. For example, the relatively low efficiency of R&D investment has been constantly criticized despite the significant growth in public R&D budget [2]. Lin et al. (2010) affirmed the varied outputs of education across countries given the increasing budgetary inputs [3]. Input–output efficiency is crucial in education and national development. Wu (2009) proved that output growth efficiency is the main driver of growth disparity [4]. Hence, evaluating educational efficiency depends not only on the amount of public input, but also on operational efficiency and policy sustainability. Several studies examined educational issues involving investment in educational resources and level of education for residents [5,6,7], but only a few have focused on educational efficiency and its lack of evaluation. Governments only focus on investment in educational resources by increasing the budget for education and constructing school buildings [8]. Allocated resources will be wasted if governments do not consider the input–output ratio [9]. This finding is also the main reason this study focused on the efficiency of education.
In terms of the importance of education, most governments realized that educational efficiency is more important than educational expenditure or input. Thus, the measurement of educational efficiency is valuable. Efficiency reflects not only the output of education, but also the capability to utilize educational resources. Data envelopment analysis (DEA) and the Malmquist index (MI) are appropriate evaluation indicators that represent educational efficiency. Based on literature review, DEA is normally used to assess government, public health, and science and technology investment efficiencies [10,11,12].
DEA is an effective tool for assessing efficiency through input–output analysis. The first objective of this study is to assess the efficiency of education and fill the gap in educational research by assessing the relationship between educational input and output variables. This study uses the standard method of DEA.
DEA is a non-parametric method used in operations research and economics to estimate frontier productions. DEA is a linear programming model that measures relative efficiencies of decision-making units (DMUs) [13], allowing each DMU to select the optimal weights of input and output that maximize its relative efficiency [14]. This method calculates relative efficiency scores for a set of peer entities in the range (0–1). Each entity that pursues the same objective is called a DMU and has common multiple input–output variables. The MI can possibly calculate these variables for an entire region or nation. The change rate and educational progress index [13] constitute the aggregate production function. MI was applied to evaluate alteration of efficiency. DEA is an appropriate approach for measuring input–output efficiency. A value close to 1 indicates high efficiency of input and output. If the value is more than 0.7, it belongs to a high-efficiency stage. MI can be applied to evaluate the degree of continuous progress. A value close to 1 indicates that the efficiency of change is small, and the input and output continue to be stable. Deviation from 1 indicates instability. MI value greater than 1 means that efficiency is increasing. MI value lesser than 1 indicates that efficiency is declining. Lavado and Cabanda (2009) defined efficiency as deviation from the frontier that exemplifies the maximum output attainable from each input level [15]. In addition, efficiency is estimated using DEA, which aids in allocating and rationalizing the budget [15]. Park (2015) claimed that DEA could be adopted to measure efficiency and productivity [16]. Cordero-Ferrera et al. (2008) measured educational efficiency using DEA to evaluate schools [17]. Lin et al. (2010) applied the performance framework in competitive advantage issues associated with DEA to evaluate relative efficiency across countries [3].
Thus, the first step of this study focuses on measuring educational efficiency. The succeeding section further identifies its effect on national competitiveness through global panel data, clustering analysis, and grouping multiple linear regression.
2. Literature Review
Education not only focuses on budget input, but also depends on efficiency and continuous input. High-efficiency and the guarantee and effects of long-term resource on national development are worthy of research [18]. Cohn (1974) explored several techniques that could assist education managers in their attempt to arrive at considerably optimal input and output mixes [19]. Educational performance assessment involves examining related input–output (cost–benefit) relationships. Goodman (1979) elucidated that “outcome orientation” is rooted in program budgeting theory, with emphasis on cost–benefit analysis and input–output relationships that can be demonstrated and measured [20]. Hough (1991) conducted an input–output analysis in education in the U.K. [21]. Geva-May (2001) provided a series of efficiency indicators to determine the extent and nature of the goal attainment of higher education policy in Israeli universities [22]. By examining the last two decades of DEA and the MI, Katharaki and Katharakis (2010) collated numerous inputs and outputs on university education efficiency [23]; their study provided fundamental indicators for later research on educational efficiency. Johnes (2006) evaluated the possibility of measuring efficiency in the context of higher education [24]. Campbell (2010) also conducted a study on educational productivity and the evaluation of educational efficiency [25]. Bursalioglu and Selim (2015) claimed that investigating efficiency in academic and research activities is important, along with exploring the factors that determine efficiency through DEA; these factors include public expenditure in higher education and ratio of higher education graduates to the total population [26]. Lassibille and Gomez (2000) [27] and Grosskopf et al. (2014) [28] selected secondary school enrollment to reflect school efficiency and describe national education systems. To evaluate the educational efficiency in the Philippines, Lavado and Cabanda (2009) selected expenditures and secondary enrollment rates [15]. Bates (1997) [29] developed a method to assess the efficiency of educational outputs using DEA to measure the corresponding inputs in a substantially satisfactory manner using the results from the Local Education Authorities of England in the early 1980s.
DEA is used to empirically measure productive efficiency of DMUs. Although DEA does not provide a general relationship (equation) relating output and input, it allows estimation of the best-practice relationship between multiple inputs and outputs. The framework was adapted from multi-input, multi-output production functions and applied in many industries. This study does not provide substantial contribution to the theoretical development of DEA and regression model, but it explores the impact of the evaluation of educational efficiency on national competitiveness. This study is focused on the exploration of educational efficiency. DEA methods have been widely used in the evaluation of efficiency and research. Science and technology and other related fields have adopted DEA to measure efficiency, which also used similar input and output variables.
As discussed, DEA can be used to assess educational efficiency [23,30]. Chang et al. (2012) applied DEA to evaluate allocated education resources [31]. Aristovnik and Obadić (2014) used DEA to investigate the educational efficiency provided in the secondary and tertiary education [32]. Tsamadias and Kyratzi (2014) measured changes in efficiency and productivity in the Greek public higher technological educational institutions from 2005 to 2009 by using input-oriented DEA to provide directories and indexes to management for improving the performance of their institutions [33]. Accordingly, total public expenditure in education (as a percentage of gross domestic product [GDP]) and total public expenditure on education per capita were selected as key input indicators [23,24,34]; whereas secondary school enrollment and higher education achievement were chosen as key output indicators [23,24]. Overall, DEA is viewed as an effective method for educational efficiency evaluation, and the MI is used to evaluate the degree of continuous progress in educational efficiency.
Sustainability of education policy is also a crucial development indicator. Shriberg (2002) analyzed recent efforts to measure sustainability in higher education across institutions [35]. Wals and Jickling (2002) believed that “sustainability” in higher education has vital influence and significance [36].
The effects of educational efficiency on national competitiveness also awakened the concern and merited the research efforts of many scholars. Ives (1992) proved that education is a sustainable national competitive advantage [37]. Weibust (1992) indicated the central role of education in national development plans [38]. Sahlberg (2006) demonstrated the importance of education and education reform in economic development and national competitiveness [39]. Ross (2010) considered the contribution of education to national development and of science education toward creating a climate of public opinion for the use of science and technology in industrial development [40]. Finally, Ramoniene and Lanskoronskis (2011) explored the relationship between higher education and competitive strategy while synthesizing higher education elements that are expressed in competitiveness [41]. Whether pertaining to education reform or higher education, only a few studies focused on educational efficiency. The assumption in the present study is based on educational efficiency to determine its impact on national competitiveness.
According to the Global Competitiveness Report of the World Economic Forum (WEF), the “national competitiveness” concept examines the ability of a national economy to grow. National competitiveness is measured by a set of factors, policies and institutions that determine the productivity level of a country. The World Competitiveness Yearbook (WCY), an annual report published by the Swiss-based International Institute for Management Development (IMD) on the competitiveness of nations, has been published since 1989. We selected the WCY to reflect the level of national competitiveness. The yearbook benchmarks the performance of 60 countries based on 333 criteria that measure different facets of competitiveness [42]. Each country has a yearly competitive score, with 100 as the highest score.
The second problem in this study indicates that educational efficiency has a positive impact on national competitiveness. Improvement in educational efficiency helps improve the level of national competitiveness. Factors that affect national competition not only include education, but also economic and technical factors as pointed out in literature. We will further study and demonstrate model assumptions in the next section.
3. Design and Data
3.1. Design and Methods
This study aims to measure the efficiency of educational resources using educational input–output analysis by employing DEA and the MI in a sample of countries selected from WCY. Educational input–output analysis further evaluates the effects of educational efficiency on national competitiveness using national panel data fixed-effect and mixed-effect regressions. This study is divided into three steps. The first step calculates educational efficiency using educational input and output indicators. The second step identifies the effects of educational efficiency on national competitiveness using international panel data. The last step is based on different levels of national competitiveness that we further classified to determine the extent of educational efficiency impact. Is the efficiency of education consistent with the degree of impact on countries with different levels of competitiveness? What is the reason for the difference? We will further tap levels of national competitiveness after exploring the impact of educational efficiency.
The current data sources are limited, and differences in the understanding of indicators in different countries are evident. The educational input and output variables we selected have theoretical bases from literature, which is the best choice for the current educational efficiency. Previously, in the process of exploring, more input or output variables were used but inherent deficiencies were encountered from the viewpoint of data accuracy, completeness, and theoretical explanation. The variables selected in this study came from the WCY [42] and World Bank databases [43], which have high consistency and credibility. According to the previous literature research, the selected indicators are supported by literature. However, some assumptions and indicators proposed in literature were not used in the study because of non-availability. This is the limitation of the study. Data with high quality and consistency cannot be easily obtained from 53 countries.
First, we calculated DEA and the MI as assessment indicators of educational efficiency through educational input and output indicators. Total public expenditure in education (as % of GDP) and total public expenditure on education per capita were selected as educational input indicators. For educational output indicators, secondary school enrollment (in %) of the relevant age group that receives full-time education and higher educational achievement (in %) of the population that has attained at least tertiary education were selected [44,45]. We compared and analyzed educational efficiency among the major economies in the world by measuring DEA and determining the subsequent effects.
According to the correspondence relationship shown in Figure 1, we selected the following indicators to reflect economy, technology, exports and stability. The higher the GDP per capita, the higher the level of international economic development. Energy intensity is the amount of energy consumed for each USD dollar of GDP. Energy intensity reflects the efficiency of energy use that can represent the energy technology level of a country to a certain extent. This variable is the embodiment of national scientific and technological capabilities [46]. Low-energy intensity indicates high energy efficiency and high output [47]. As the high-tech industry is indisputably important for national development, the proportion of exports with high-tech products to the manufacturing exports is also another indicator [48]. High-tech exports are products with high research and development intensity, such as those related to the aerospace industry, computers, pharmaceuticals, scientific instruments, and electrical machinery. Regarding employment, the higher the employment rate, the higher the stability of society [49]. The proportion of the employed population (in %) is one of the most precise representative indicators. Population market size (in millions) is an objective indicator, which can reflect the size of a country and the difficulty of governance [50]. We deduce that the greater the total population, the higher the difficulty and the complexity of the governance of a country. In conjunction with the above indicators, we used panel data to test the impact of educational efficiency on national competitiveness. We selected the results of competitiveness in the WCY as a comprehensive evaluation indicator of national competitiveness [42]. DEA, MI, IMD, WCY are defined in Abbreviations.
Based on previous literature reviews, we believe that the factors that affect national competitiveness not only include education (education efficiency), but also economy (GDP per capita), technology and energy (energy intensity), exports (export ration for high-tech products), and social stability and development (employment rate). Using WCY and the World Bank databases, we selected some representative indicators corresponding to the above factors. Literature pointed out that the national population will also affect national competitiveness, which we will have to consider. Based on the selection of factors and indicators, we will construct a multiple regression model using global panel data. Among the many factors of mutual influence, we will identify the extent to which education efficiency affects national competitiveness.
We included the following explanatory variables: (1) educational efficiency (EDEA); (2) ln GDP per capita (lnGDPpc); (3) ln energy intensity (lnEI); (4) high-tech exports (in %) (Hte%); (5) employment (in %); and (6) ln population market size (lnPop). Some independent variables use the logarithm, which can eliminate heteroscedasticity. The use of logarithm to process new data is effective in eliminating the impact of heteroscedasticity. Taking the logarithm can reduce the absolute value of the data, which is now easy to calculate. This approach does not change the nature and relevance of the data, but compresses the scale of the variable. The natural logarithm does not affect interrelationship among variables. The logarithm of the original index is used to avoid fluctuation between the data and the model, making it more stable. The dependent variable is also the target variable “national competitiveness” from WCY database, which is abbreviated as “Comp”.
The panel data model can be divided into two types: a fixed-effects model and a random-effects model. Based on the result of Hausman test (Prob > chi2 = 0.000), the null hypothesis is rejected at the 10% level, which suggests that the fixed-effects model is an appropriate choice.
In addition, we can use the said model to control for unobserved heterogeneity when such heterogeneity is constant over time. We applied a two-way fixed-effects panel-data model (also known as the within estimator) for estimation.
where represents the variables matrix and denotes the individual fixed effect that does not change with time but varies from region to region (for example, the living standard of each country, local consumption preferences, and cultural preferences). represents time-period fixed effects with no individual differences, which, however, vary with time. is an error vector that obeys i.i.d. (0, ).
3.2. Data Resource
Data were collected from the WCY and the World Bank. As pooled time series and cross-sectional data, the panel dataset covers 53 countries in the cross-section from 2000 to 2014 (year = 15) in the longitudinal section. The 53 countries cover the world’s major economies, which include developed and developing countries across the Americas, Europe, Asia, Africa and Oceania. Data in these countries are relatively complete. However, missing values are present in the panel data, which represents imbalance in the data. We added the missing values via K-means clustering, and the completed panel data reached 795 observations.
We calculated the input–output efficiency of education using the DEA software and further evaluated the effects of educational efficiency on national competitiveness using the STATA software.
The United States was not selected as a sample country in this study because some data were unavailable. This is a limitation of the study.
4. Results
4.1. Description of Educational Efficiency
The input–output efficiency of education for each country was calculated from 2000 to 2014, and their average level was considered.
According to the average results of educational efficiency through DEA (x axis) and educational continuous progress via the MI (y axis), we built a matrix of 53 countries or regions, as shown in Figure 2. This matrix was used to analyze the input–output efficiency of education in various countries.
Educational efficiencies in Singapore, the Philippines, India, Mainland China, Indonesia, Taiwan, South Korea, Russia and Japan are the most prominent (DEA > 0.8) among the 53 countries. In terms of sustainable development, the countries are stable and MI values were approximately 1.0. Only the MI values of Argentina and Indonesia are far from 1, which indicates that their educational inputs–outputs are unstable or not sustainable. This finding is possibly due to economic crises. The study corroborated that countries with high educational efficiency and stable development are mainly concentrated in East and Southeast Asia.
4.2. Panel Data and Clustering Analysis
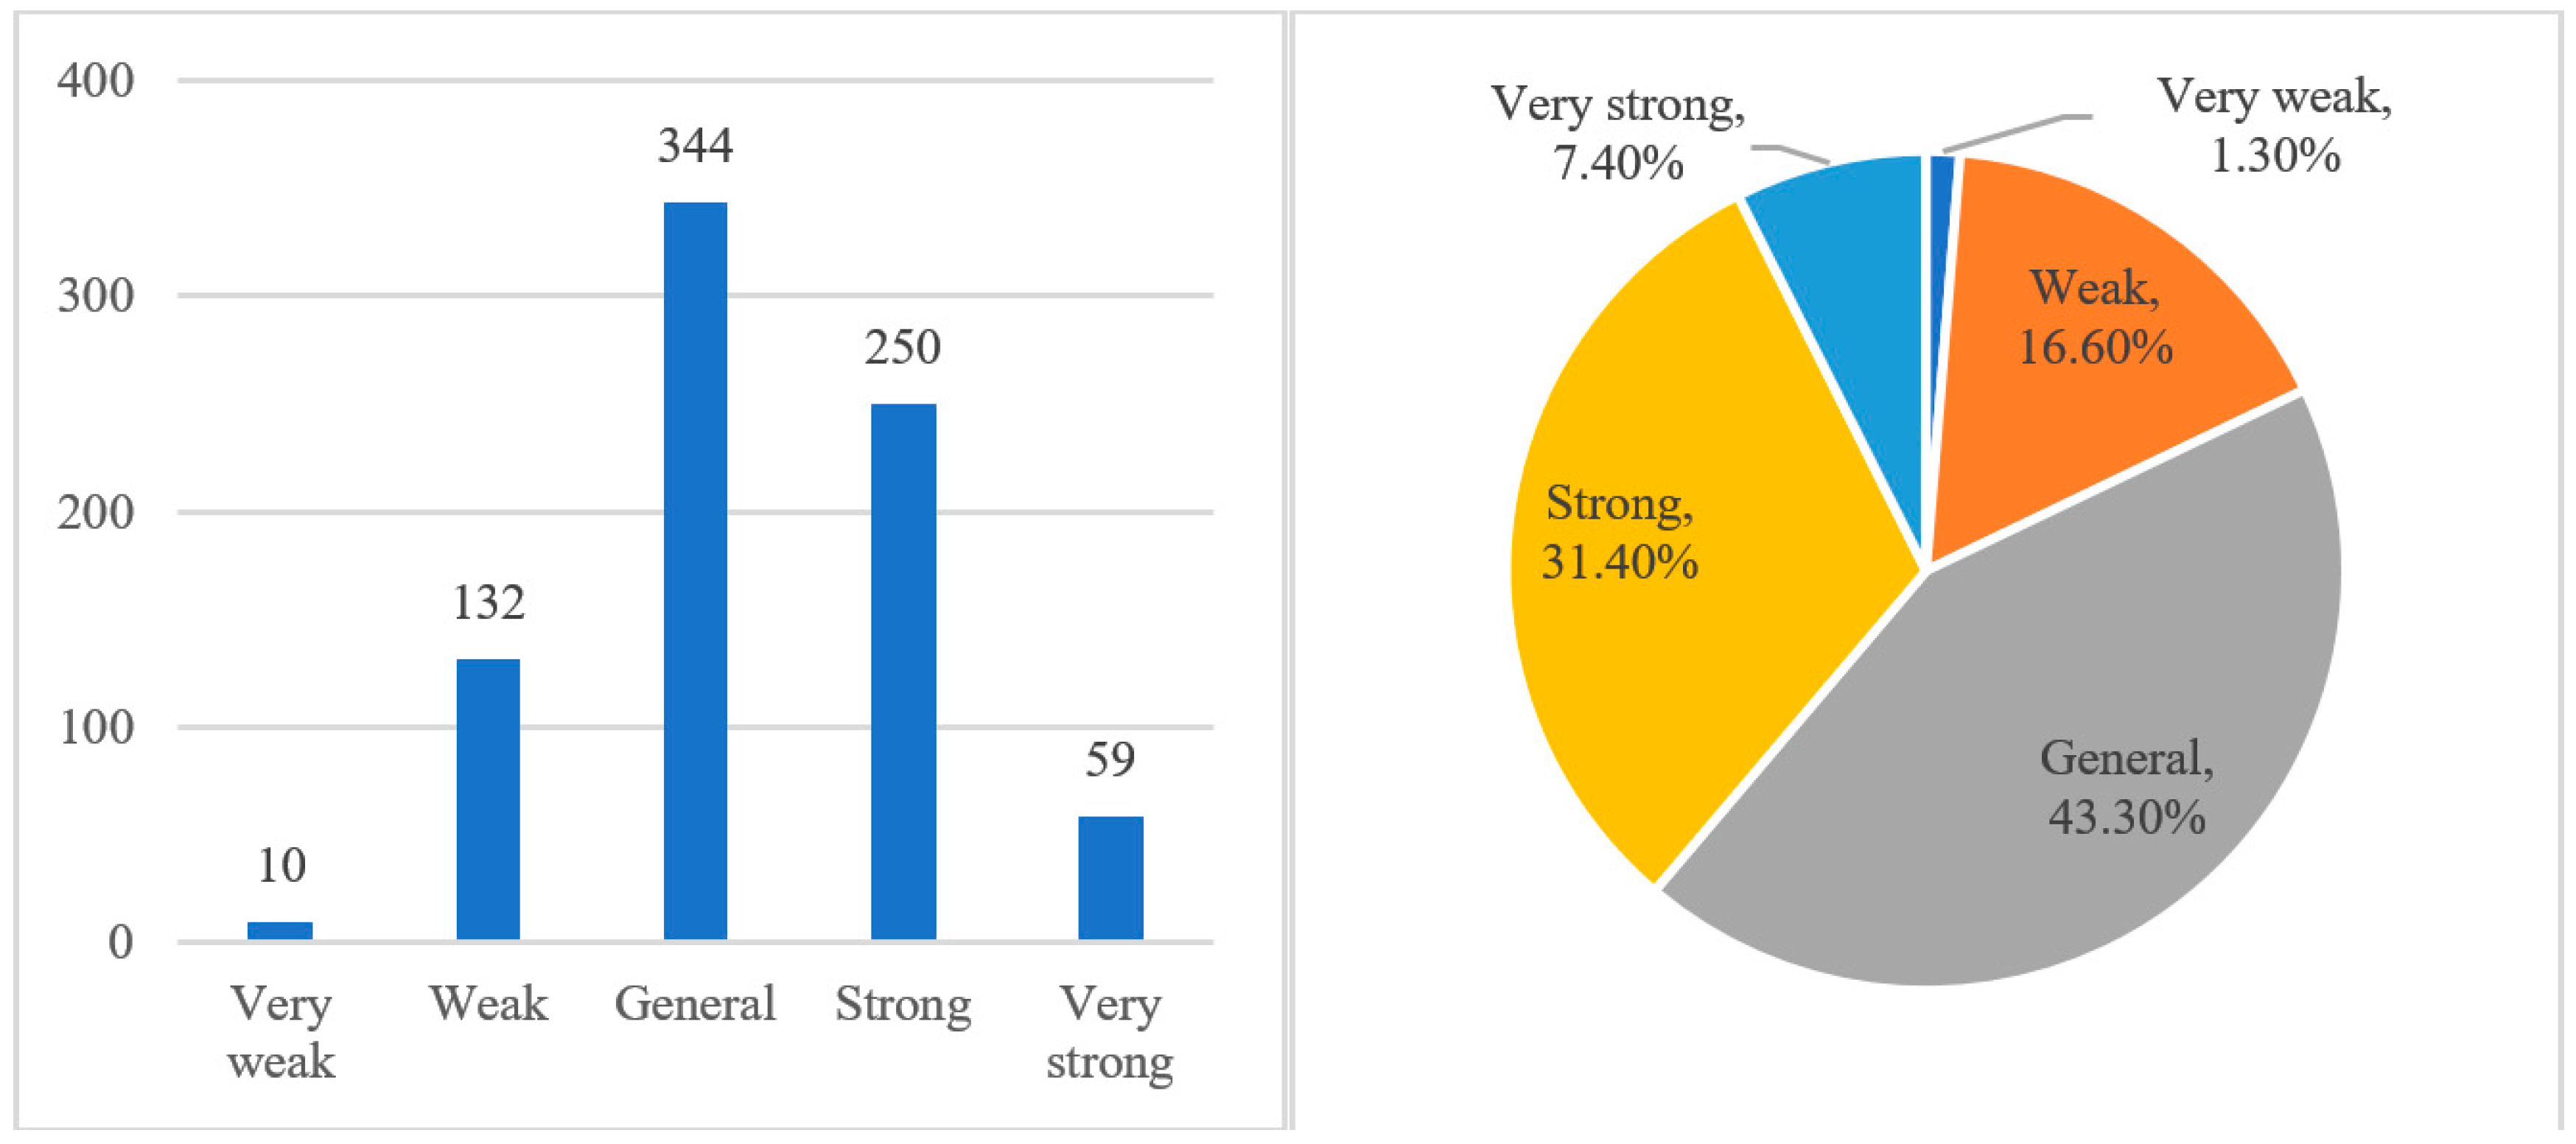
Using panel data analysis, the level of each indicator and the impact of indicators on the degree of national competitiveness are significantly different. GDP per capita is the most significant indicator in the panel data model (Appendix A and Appendix B), whether a single fixed-effect panel or a two-way fixed-effect panel is used. We identified the value of economic drivers on the competitiveness of a country. However, the effect of educational efficiency on national competitiveness is not consistent among single and two-way fixed-effect panels. The p value of educational efficiency (EDEA) is 0.055 based on the single fixed-effect panel. However, in the two-way fixed-effect panel, the p value of educational efficiency (EDEA) is 0.892. The significant difference in educational efficiency occurred after the addition of time effect. This finding proved that educational efficiency and time are related, that is, educational efficiency is likely to include time trends, and the impact on the dependent variable is formed through this time trend. Accordingly, educational efficiency indicates the need to improve the effectiveness of national competitiveness. Mayor et al. (2012) explored whether differences in competitiveness among these economies can be explained by their affiliation to a group or a cluster [51]. The effects of educational efficiency on national competitiveness in different groups were identified using cluster analysis. The level of national competitiveness was divided into five grades (from very weak to very strong) using hierarchical clustering methods. Clustering analysis is based on the different levels of competitiveness of different countries to measure the similarity between different data sources. A total of 795 observations, classified from very strong to very weak, were assigned to different clusters according to their competitiveness, as shown in Figure 3.
- ➢
- If national competitiveness is very strong, score ranges from 88.37 to 100 (N = 59, 7.4%).
- ➢
- If national competitiveness is strong, score ranges from 71.9 to 87.82 (N = 250, 31.4%).
- ➢
- If national competitiveness is in the general level, score ranges from 49.25 to 71.55 (N = 344, 43.3%).
- ➢
- If national competitiveness is weak, score ranges from 30.28 to 49.02 (N = 132, 16.6%).
- ➢
- If national competitiveness is very weak, the score ranges from 18.27 to 27.97 (N = 10, 1.3%).
Each country corresponds to an independent sample in each year. Some groups have insufficient sample size. Thus, the panel data cannot be used and are replaced by linear mixed-effects regression.
We used linear mixed-effects regression to further test the effects of educational efficiency on the different grades of national competitiveness based on the five clustering groups (Table 1). We set up Model 1 (all observations) and Models 2 to 6 (five groups) according to the different levels of competitiveness of the five group.
4.2.1. Model 1: All Observations (N = 795)
GDP per capita, high-tech exports (in %), employment (in %), and energy intensity have significant effect on national competitiveness level based on the linear mixed regression. After increasing GDP per capita, high-tech exports (in %), and employment (in %), and decreasing energy intensity, the overall significance of the model improved. This result indicates that these indicators have a positive effect on the level of national competitiveness. However, the role of educational efficiency in the model is insignificant. Thus, we separated the sample groups for further analysis.
4.2.2. Model 2: Countries with Very Strong National Competitiveness (N = 59)
Major countries in this group include Australia, Canada, Hong Kong, Denmark, Finland, Germany, Iceland, Luxembourg, Norway, Qatar, Singapore, Sweden, Switzerland and Taiwan. Educational efficiency and energy intensity have significant effect on samples with very strong competitiveness based on linear mixed regression analysis. Increasing the educational efficiency and decreasing energy intensity are effective approaches for enhancing national competitiveness. However, both indicators from economy, high-tech exports, employment and population are insignificant. Therefore, education and technology are the most effective drivers of national competitiveness in most developed economies.
4.2.3. Models 3 and 4: Countries with Strong (N = 250) and Average (N = 344) National Competitiveness
For these countries with average to strong national competitiveness, GDP per capita, high-tech exports (%), and employment (%) have significant positive impact on national competitiveness. However, educational efficiency and energy intensity became insignificant. Therefore, economic output, high-tech exports, and employment are the most effective driving forces for national competitiveness in mid-developed economies.
4.2.4. Models 5 and 6: Countries with Weak (N = 132) and Very Weak (N = 10) National Competitiveness
The effect of the indicators on national competitiveness is insignificant in these underdeveloped economies.
5. Reflections and Conclusions
In this study, we selected input and output indicators and measured the educational efficiency of 53 sample countries. The results of East and Southeast Asian countries were obtained based on the matrix analysis of educational efficiency (DEA) and the degree of continuous progress (MI). In addition to developed economies such as South Korea, Taiwan, Singapore and Japan, developing countries such as China, India and Russia have great educational development potential because their educational efficiency (DEA) is higher than 0.8 (see Figure 2). Based on these findings, East and Southeast Asian countries have significant potential for future development. We further evaluated the effects of educational efficiency on national competitiveness according to the 53 countries or regions from 2000 to 2014. Educational efficiency is insignificant in the total samples based on a fixed-effect panel. Through further clustering analysis, we divided the 795 samples into five grades according to the degree of national competitiveness (strong or weak). Finally, we discovered through linear mixed regression that educational efficiency has the most significant impact on the most competitive countries and regions but is insignificant in other economies. Data mining should be conducted to determine the reasons why educational efficiency is not significant in mid- and underdeveloped economies.
The impact of educational efficiency on national competitiveness is reflected not only in management implications, but also in policy formulation. National government, religious culture, and stages of economic development will have certain impact on educational efficiency. This study concludes that the value of educational efficiency will only be highlighted when the level of national competitiveness reaches a certain stage regardless of the strength of basic education in developing countries and the effectiveness of educational efficiency.
The drivers of education and technology are significant in most competitive economies according to different developed countries and regions. The driver of economy, high-tech exports, and employment are significant in the second (mid-developed countries) and third (underdeveloped countries) groups. Therefore, governments should depend on their own level of competitiveness to determine the priority areas of development based on their stage of development. The role of the economy in promoting competitiveness dominates that of education for developing countries.
In future research, not only do we focus on the efficiency of the input and output of education but also on the sustainability and change of the input and output of educational resources. The current study is used to determine the future trend, that is, to help the government with more scientific and effective allocation and use of educational resources.
Conflicts of Interest
The authors declare no conflict of interest.
Abbreviations
The following abbreviations are used in this manuscript:
| DEA | Data Envelopment Analysis |
| MI | Malmquist Index |
| DMUs | Decision-making units |
| WEF | World Economic Forum |
| WCY | World Competitiveness Yearbook |
| IMD | International Institute for Management Development |
| EDEA | Educational efficiency |
| lnGDPpc | Ln GDP per capita |
| lnEI | Ln energy intensity |
| Hte% | High-tech exports (in %) |
| Comp | National competitiveness |
Appendix A. Single Fixed-Effect Panel

Appendix B. Two-Way Fixed-Effect Panel

References
- Draine, A. Returns from Investment in Education in a Dynamic Model of International Trade. Available online: http://blogs.bu.edu/adraine/files/2015/10/Draine2015_JMP.pdf (accessed on 13 October 2015).
- So, Soon-Hu. Efficiency Analysis of R&D Investment for Technology Development in Regional Strategic Industries using Non-Radial SBM Model. J. Ind. Econ. Bus. 2011, 24, 1169–1188. [Google Scholar]
- Lin, C.-H.; Yang, H.L.; Liou, D.Y. A cross-national comparative analysis of industrial policy and competitive advantage. Int. J. Technol. Manag. 2010, 49, 93–106. [Google Scholar] [CrossRef]
- Wu, J.X. Technology, Efficiency, Capital Accumulation and Chinese Regional Development Disparity. Quant. Tech. Econ. 2009, 26, 28–38. [Google Scholar]
- Schröder, H.; Ganzeboom, H.B.G. Measuring and Modelling Level of Education in European Societies. Eur. Sociol. Rev. 2014, 30, 119–136. [Google Scholar] [CrossRef]
- Boser, U. Return on Educational Investment: 2014. A District-by-District Evaluation of U.S. Educational Productivity; Center for American Progress: Washington, DC, USA, 2014. [Google Scholar]
- Aturupane, H. Public Investment in Education: Benefits, Challenges and Opportunities. In Decentralization and Development of Sri Lanka within a Unitary State; Springer: New York, NY, USA, 2017; pp. 179–201. [Google Scholar]
- Leiringer, R.; Cardellino, P. Schools for the twenty-first century: School design and educational transformation. Br. Educ. Res. J. 2011, 37, 915–934. [Google Scholar] [CrossRef] [Green Version]
- Xiao, J.; Zhu, X.; Jiang, B. The Research on the Use Efficiency of Educational Resource Center with the Ecological System Structure. In Proceedings of the International Conference on Intelligent Environments IEEE Computer Society, Shanghai, China, 30 June–4 July 2014; pp. 346–352. [Google Scholar]
- Liao, Q.; Li, J.; Chen, Z.J. The integrated model based on DEA method and rough set for the assessment of government efficiency. Oper. Res. Manag. Sci. 2005, 6, 14. [Google Scholar]
- Wu, H.; Zheng, C. An empirical analysis on the relative efficiency of the input-output of science and technology. Sci. Manag. Res. 2003, 3, 93–96. [Google Scholar]
- Vitezic, N.; Segota, A.; Cankar, A.A. Measuring the Efficiency of Public Health Services by DEA. Mednarodna Revija Javno Upravo 2016, 14, 27. [Google Scholar] [CrossRef]
- Cooper, W.W.; Seiford, L.M.; Tone, K. Data Envelopment Analysis: Theory, Methodology, and Applications; Kluwer Academic: Boston, MA, USA, 2000. [Google Scholar]
- Cherchye, L.; Moesen, W.; Rogge, N.; van Puyenbroeck, T. An introduction to ‘benefit of the doubt’ composite indicators. Soc. Indic. Res. 2007, 82, 111–145. [Google Scholar] [CrossRef]
- Lavado, R.F.; Cabanda, E.C. The efficiency of health and education expenditures in the Philippines. Cent. Eur. J. Oper. Res. 2009, 17, 275–291. [Google Scholar] [CrossRef]
- Park, S. Evaluating the efficiency and productivity change within government subsidy recipients of a national technology innovation research and development program. R D Manag. 2015, 45, 549–568. [Google Scholar] [CrossRef]
- Cordero-Ferrera, J.M.; Pedraja-Chaparro, F.; Salinas-Jiménez, J. Measuring efficiency in education: An analysis of different approaches for incorporating non-discretionary inputs. Appl. Econ. 2008, 40, 1323–1339. [Google Scholar] [CrossRef]
- Ofspokesperson, O. Director-general calls for sustained investment in education at thematic debate on EFA. J. Exp. Zool. 2009, 2, 473–494. [Google Scholar]
- Cohn, E. Input-Output Analysis in Public Education; Ballinger Pub. Co.: Pensacola, FL, USA, 1974. [Google Scholar]
- Goodman, H.H. The Concept of Output in Education. Educ. Forum 1979, 44, 71–82. [Google Scholar] [CrossRef]
- Hough, J.R. Input-output analysis in education in the U.K.—Review Essay. Econ. Educ. Rev. 1991, 10, 73–81. [Google Scholar] [CrossRef]
- Geva-May, I. Higher education and attainment of policy goals: Interpretations for efficiency indicators in Israel. High. Educ. 2001, 42, 265–305. [Google Scholar] [CrossRef]
- Katharaki, M.; Katharakis, G. A comparative assessment of Greek universities’ efficiency using quantitative analysis. Int. J. Educ. Res. 2010, 49, 115–128. [Google Scholar] [CrossRef]
- Johnes, J. Data envelopment analysis and its application to the measurement of efficiency in higher education. Econ. Educ. Rev. 2006, 25, 273–288. [Google Scholar] [CrossRef]
- Campbell, R.E. A review article on advances in educational productivity volume I: The evaluation of educational efficiency: Constraints, issues, and policies edited by Herbert J. Walberg. Asian Econ. J. 2010, 6, 317–322. [Google Scholar] [CrossRef]
- Bursalioglu, S.A.; Selim, S. Factors Determining the Efficiency of Higher Education in the European Union and Turkey. BILIG 2015, 74, 45–69. [Google Scholar]
- Lassibille, G.; Navarro Gómez, L.U.C.Í. Organization and Efficiency of Education Systems: Some empirical findings. Comp. Educ. 2000, 36, 7–19. [Google Scholar] [CrossRef]
- Grosskopf, S.; Hayes, K.J.; Taylor, L.L. Efficiency in Education: Research and Implications. Appl. Econ. Perspect. Policy 2014, 36, 175–210. [Google Scholar] [CrossRef]
- Bates, J.M. Measuring predetermined socioeconomic “inputs” when assessing the efficiency of educational outputs. Appl. Econ. 1997, 29, 85–93. [Google Scholar] [CrossRef]
- Casalprim, M.; Rialp, J.; Prior, D.; Sabrià, B. An assessment of schools’ efficiency of different educational systems. Mediterr. J. Soc. Sci. 2013, 4, 631–639. [Google Scholar] [CrossRef]
- Chang, T.Y.; Chung, P.H.; Hsu, S.S. Two-stage performance model for evaluating the managerial efficiency of higher education: Application by the Taiwanese tourism and leisure department. J. Hosp. Leis. Sport Tour. Educ. 2012, 11, 168–177. [Google Scholar] [CrossRef]
- Aristovnik, A.; Obadić, A. Measuring relative efficiency of secondary education in selected EU and OECD countries: The case of Slovenia and Croatia. Technol. Econ. Dev. Econ. 2014, 20, 419–433. [Google Scholar] [CrossRef]
- Tsamadias, C.; Kyratzi, P. Efficiency and productivity of Greek higher technological educational institutions: An assessment over the period 2005–2009. Int. J. Educ. Econ. Dev. 2014, 5, 241–256. [Google Scholar] [CrossRef]
- Mu, R.; Ren, Z.; Song, H.; Chen, F. Innovative development and innovation capacity-building in China. Int. J. Technol. Manag. 2010, 51, 427–452. [Google Scholar] [CrossRef]
- Shriberg, M. Institutional assessment tools for sustainability in higher education: Strengths, weaknesses, and implications for practice and theory. High. Educ. Policy 2002, 15, 153–167. [Google Scholar] [CrossRef]
- Wals, A.E.J.; Jickling, B. “sustainability” in higher education: From doublethink and newspeak to critical thinking and meaningful learning. High. Educ. Policy 2002, 15, 121–131. [Google Scholar] [CrossRef]
- Ives, B. Education: A sustainable national competitive advantage. MIS Q. 1992, 16, 43–54. [Google Scholar]
- Weibust, P.S. Education’s Role in National Development Plans: Ten Country Cases; Thomas, R.M., Ed.; Greenwood Publishing Group: Westport, CT, USA, 1992; Volume 37, p. 295. [Google Scholar]
- Sahlberg, P.J. Education Reform for Raising Economic Competitiveness. J. Educ. Chang. 2006, 7, 259–287. [Google Scholar] [CrossRef]
- Ross, A.M. Education and national development. Sci. Educ. 2010, 68, 563–569. [Google Scholar]
- Ramoniene, L.; Lanskoronskis, M. Reflection of higher education aspects in the conception of national competitiveness. Balt. J. Manag. 2011, 6, 124–139. [Google Scholar] [CrossRef]
- IMD World Competitiveness Center. IMD World Competitiveness Yearbook 2016; Institute for Management Development (IMD): Lausanne, Switzerland, 2016. [Google Scholar]
- Ott, J. World Bank World Development Indicators; Springer: New York, NY, USA, 2014. [Google Scholar]
- Boateng, N.A. Does public expenditure management matter for education outcomes? Dev. South. Afr. 2014, 31, 535–552. [Google Scholar] [CrossRef]
- Neycheva, M.; Joensen, K. Higher educational attainment for growth: The MRW model for Iceland. Scand. J. Educ. Res. 2017, 1–16. [Google Scholar] [CrossRef]
- Tao, A. Research on relationship between energy consumption quality and education, science and technology based on grey relation theory. Energy Procedia 2011, 5, 1718–1721. [Google Scholar]
- Duro, J.A.; Alcántara, V.; Padilla, E. International inequality in energy intensity levels and the role of production composition and energy efficiency: an analysis of OECD countries. Ecol. Econ. 2010, 69, 2468–2474. [Google Scholar] [CrossRef]
- Srholec, M. High-tech exports from developing countries: A symptom of technology spurts or statistical illusion? Rev. World Econ. 2007, 143, 227–255. [Google Scholar] [CrossRef]
- Pigou, A.C. Some Considerations on Stability Conditions, Employment and Real Wage Rates. Econ. J. 1945, 55, 346–356. [Google Scholar] [CrossRef]
- Knack, S.; Azfar, O. Trade intensity, country size and corruption. Econ. Gov. 2003, 4, 1–18. [Google Scholar] [CrossRef]
- Mayor, G.O.; Davó, N.B.; Hera, M.L.B.D.L. Technological innovation as a determining factor on national competitiveness. Rev. Econ. Mund. 2012, 67, 137–166. [Google Scholar]
Figure 1.
Structure of educational efficiency and national competitiveness.
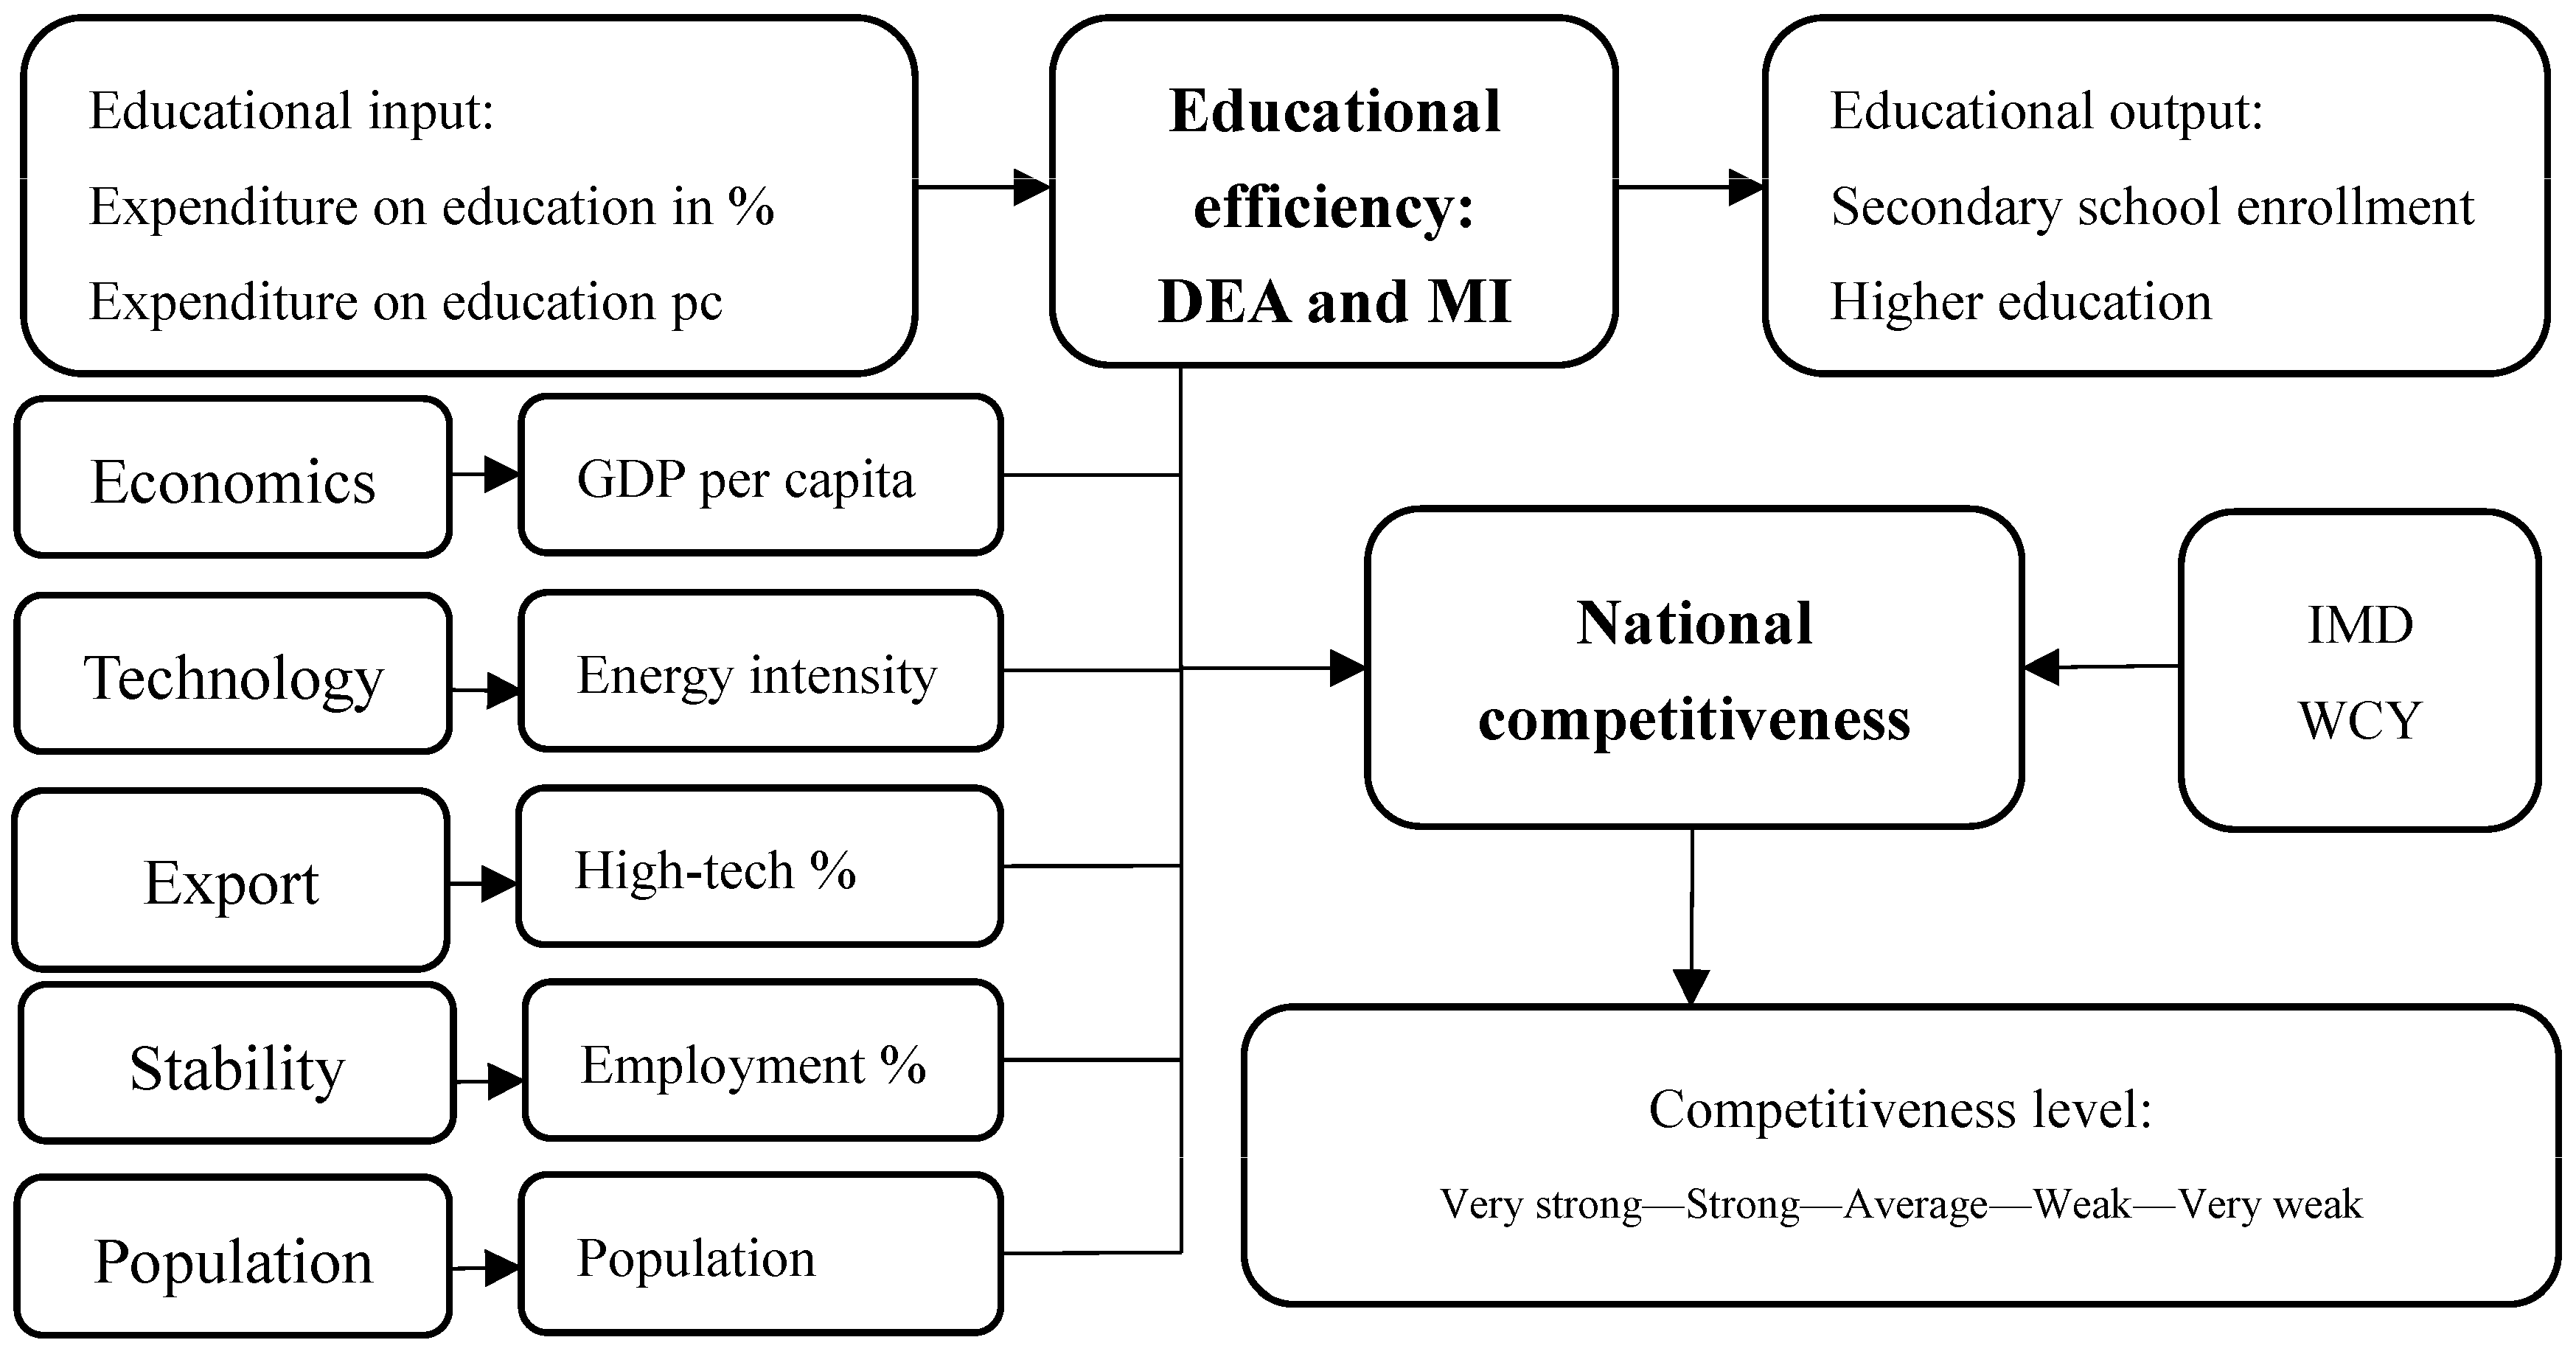
Figure 2.
DEA (x axis) and MI (y axis) of educational efficiency.
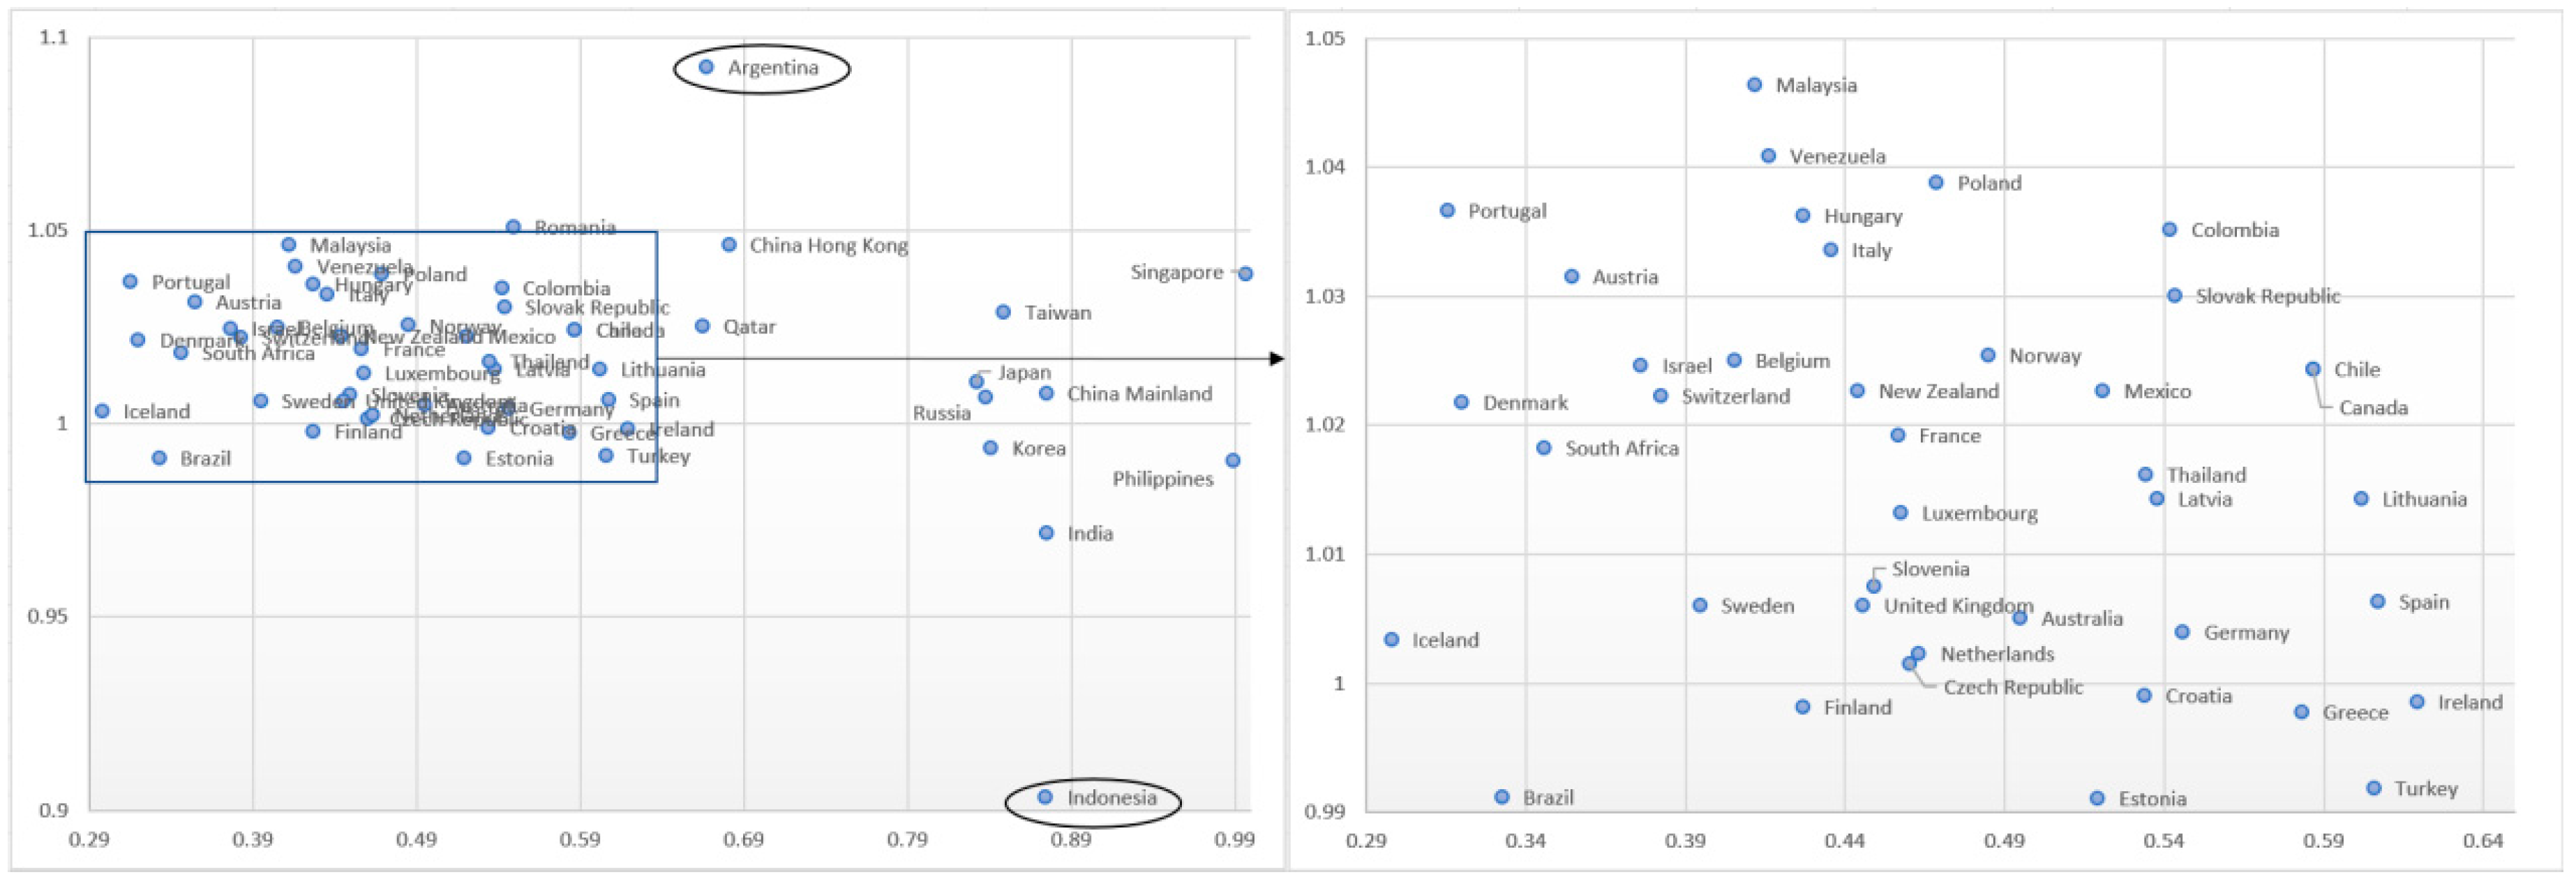
Figure 3.
Five grades of national competitiveness.

Table 1.
Linear mixed regression based on clustering groups.
| Model 1 | Model 2 | Model 3 | Model 4 | Model 5 | Model 6 | |
|---|---|---|---|---|---|---|
| Competitiveness | All observations | Very strong | Strong | Average | Weak | Very weak |
| Educational efficiency | −0.041 (1.882) | 0.506 ** (2.198) | −0.115 (1.681) | 0.029 (1.704) | −1.536 (24.100) | −0.050 (2.099) |
| GDP per capita | 0.404 ** (0.973) | −0.025 (3.169) | 0.383 ** (0.987) | 0.347 ** (0.870) | 2.139 (16.520) | 0.148 (1.299) |
| Energy intensity | −0.161 ** (0.828) | −0.586 ** (0.861) | 0.009 (0.616) | 0.110 (0.853) | 0.782 (12.027) | −0.214 (1.009) |
| High-tech exports (%) | 0.274 ** (0.027) | −0.064 (0.035) | 0.212 ** (0.025) | 0.144 ** (0.025) | 0.892 (0.381) | 0.232 (0.042) |
| Employment (%) | 0.348 ** (0.055) | 0.180 (0.161) | 0.223 ** (0.041) | 0.230 ** (0.057) | 0.935 (0.358) | 0.107 (0.083) |
| Population market size | 0.042 (0.278) | −0.088 (0.489) | 0.005 (0.222) | 0.073 (0.230) | 1.852 (4.175) | 0.035 (0.403) |
| R2adj | 0.639 | 0.308 | 0.199 | 0.135 | 0.377 | 0.081 |
| N | 795 | 59 | 250 | 344 | 132 | 10 |
Notes: * p < 0.05; ** p < 0.01.
© 2017 by the authors. Licensee MDPI, Basel, Switzerland. This article is an open access article distributed under the terms and conditions of the Creative Commons Attribution (CC BY) license (http://creativecommons.org/licenses/by/4.0/).
Share and Cite
MDPI and ACS Style
Liu, F.; Xu, H. Effects of Educational Efficiency on National Competitiveness Based on Cross-National Data. Educ. Sci. 2017, 7, 81. https://doi.org/10.3390/educsci7040081
AMA Style
Liu F, Xu H. Effects of Educational Efficiency on National Competitiveness Based on Cross-National Data. Education Sciences. 2017; 7(4):81. https://doi.org/10.3390/educsci7040081
Chicago/Turabian StyleLiu, Fangtao, and Huan Xu. 2017. "Effects of Educational Efficiency on National Competitiveness Based on Cross-National Data" Education Sciences 7, no. 4: 81. https://doi.org/10.3390/educsci7040081
Note that from the first issue of 2016, this journal uses article numbers instead of page numbers. See further details here.