Proteomic Analysis of Matched Formalin-Fixed, Paraffin-Embedded Specimens in Patients with Advanced Serous Ovarian Carcinoma

Abstract
:1. Introduction
2. Experimental
2.1. FFPE Collection, Processing for Proteomics
2.2. Liquid Chromatography Tandem Mass Spectrometry
2.3. Peptide Identification
2.4. Spectral Count Analysis
2.5. Ingenuity Pathways Analysis
2.6. Immunohistochemical Staining
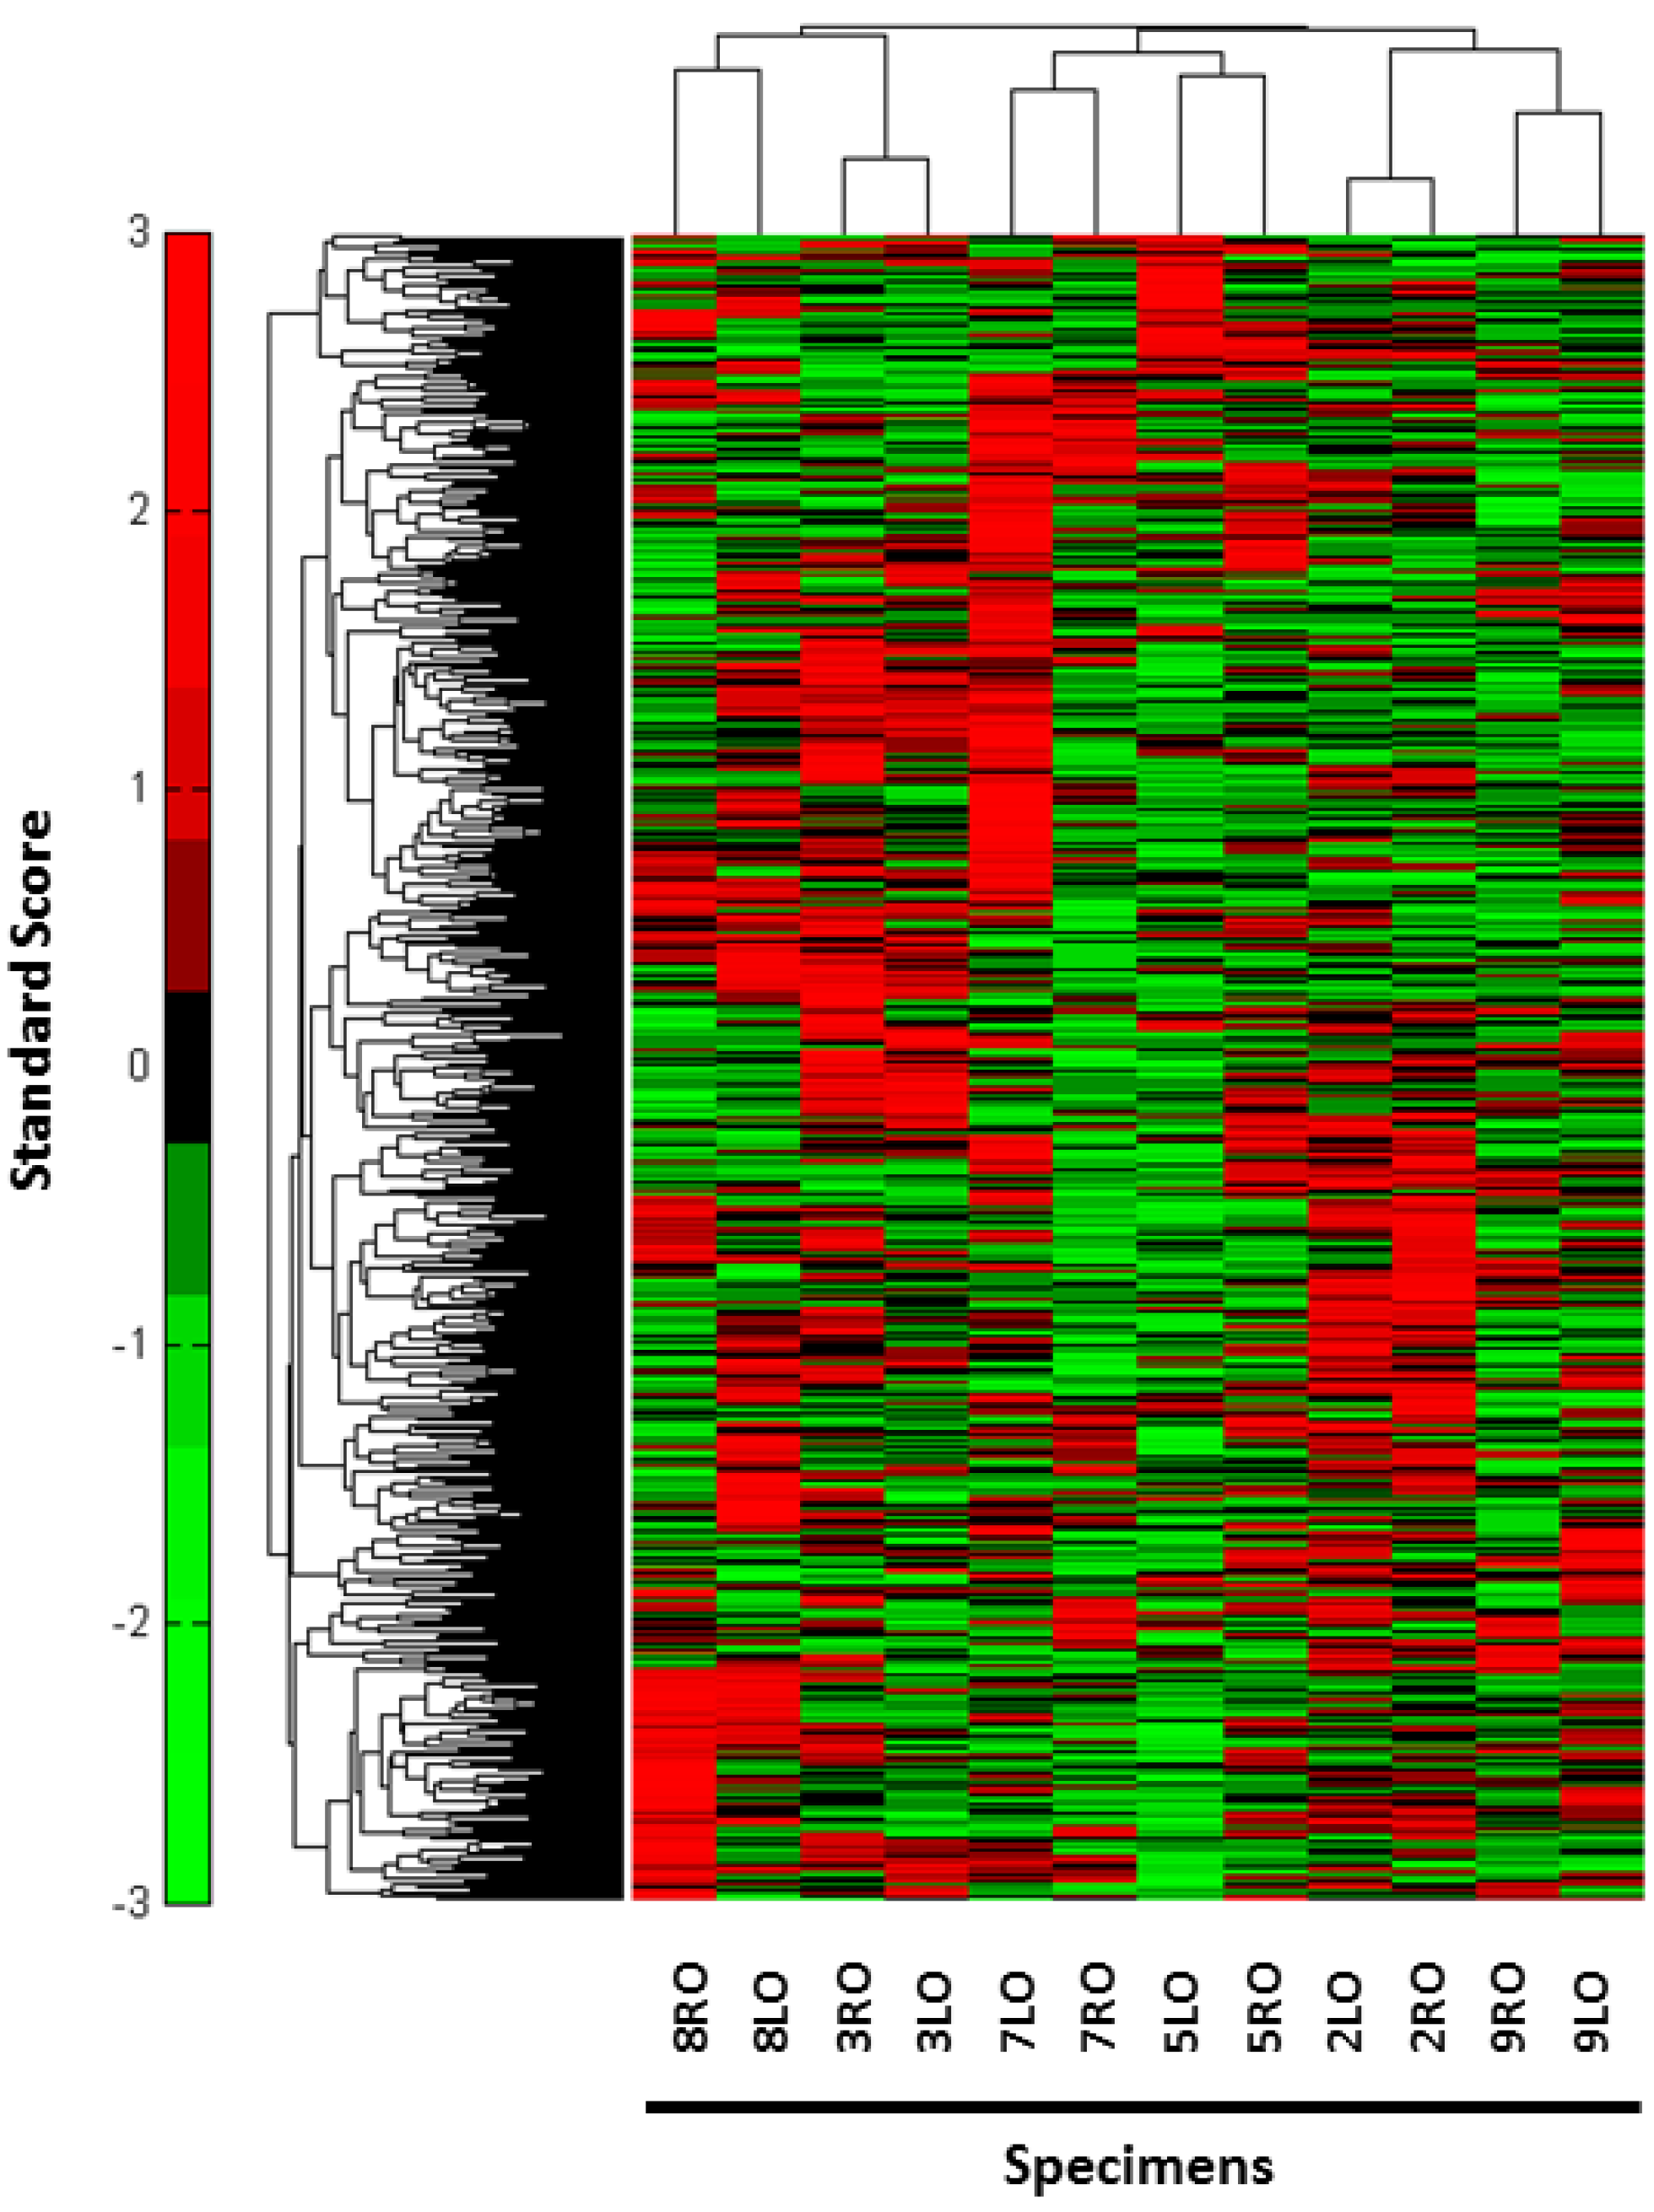
3. Results

| E-HGSOC Specimens a,*,** | V-HGSOC Specimens b,* | |
|---|---|---|
| (n = 6) | (n = 5) | |
| Age at Diagnosis (y) | ||
| Age Range | 45–50 | 45–50 |
| Race | ||
| Caucasian | 5 | 5 |
| African American | 1 | 0 |
| Stage | ||
| IIIB | 0 | 1 |
| IIIC | 4 | 4 |
| IV | 2 | 0 |

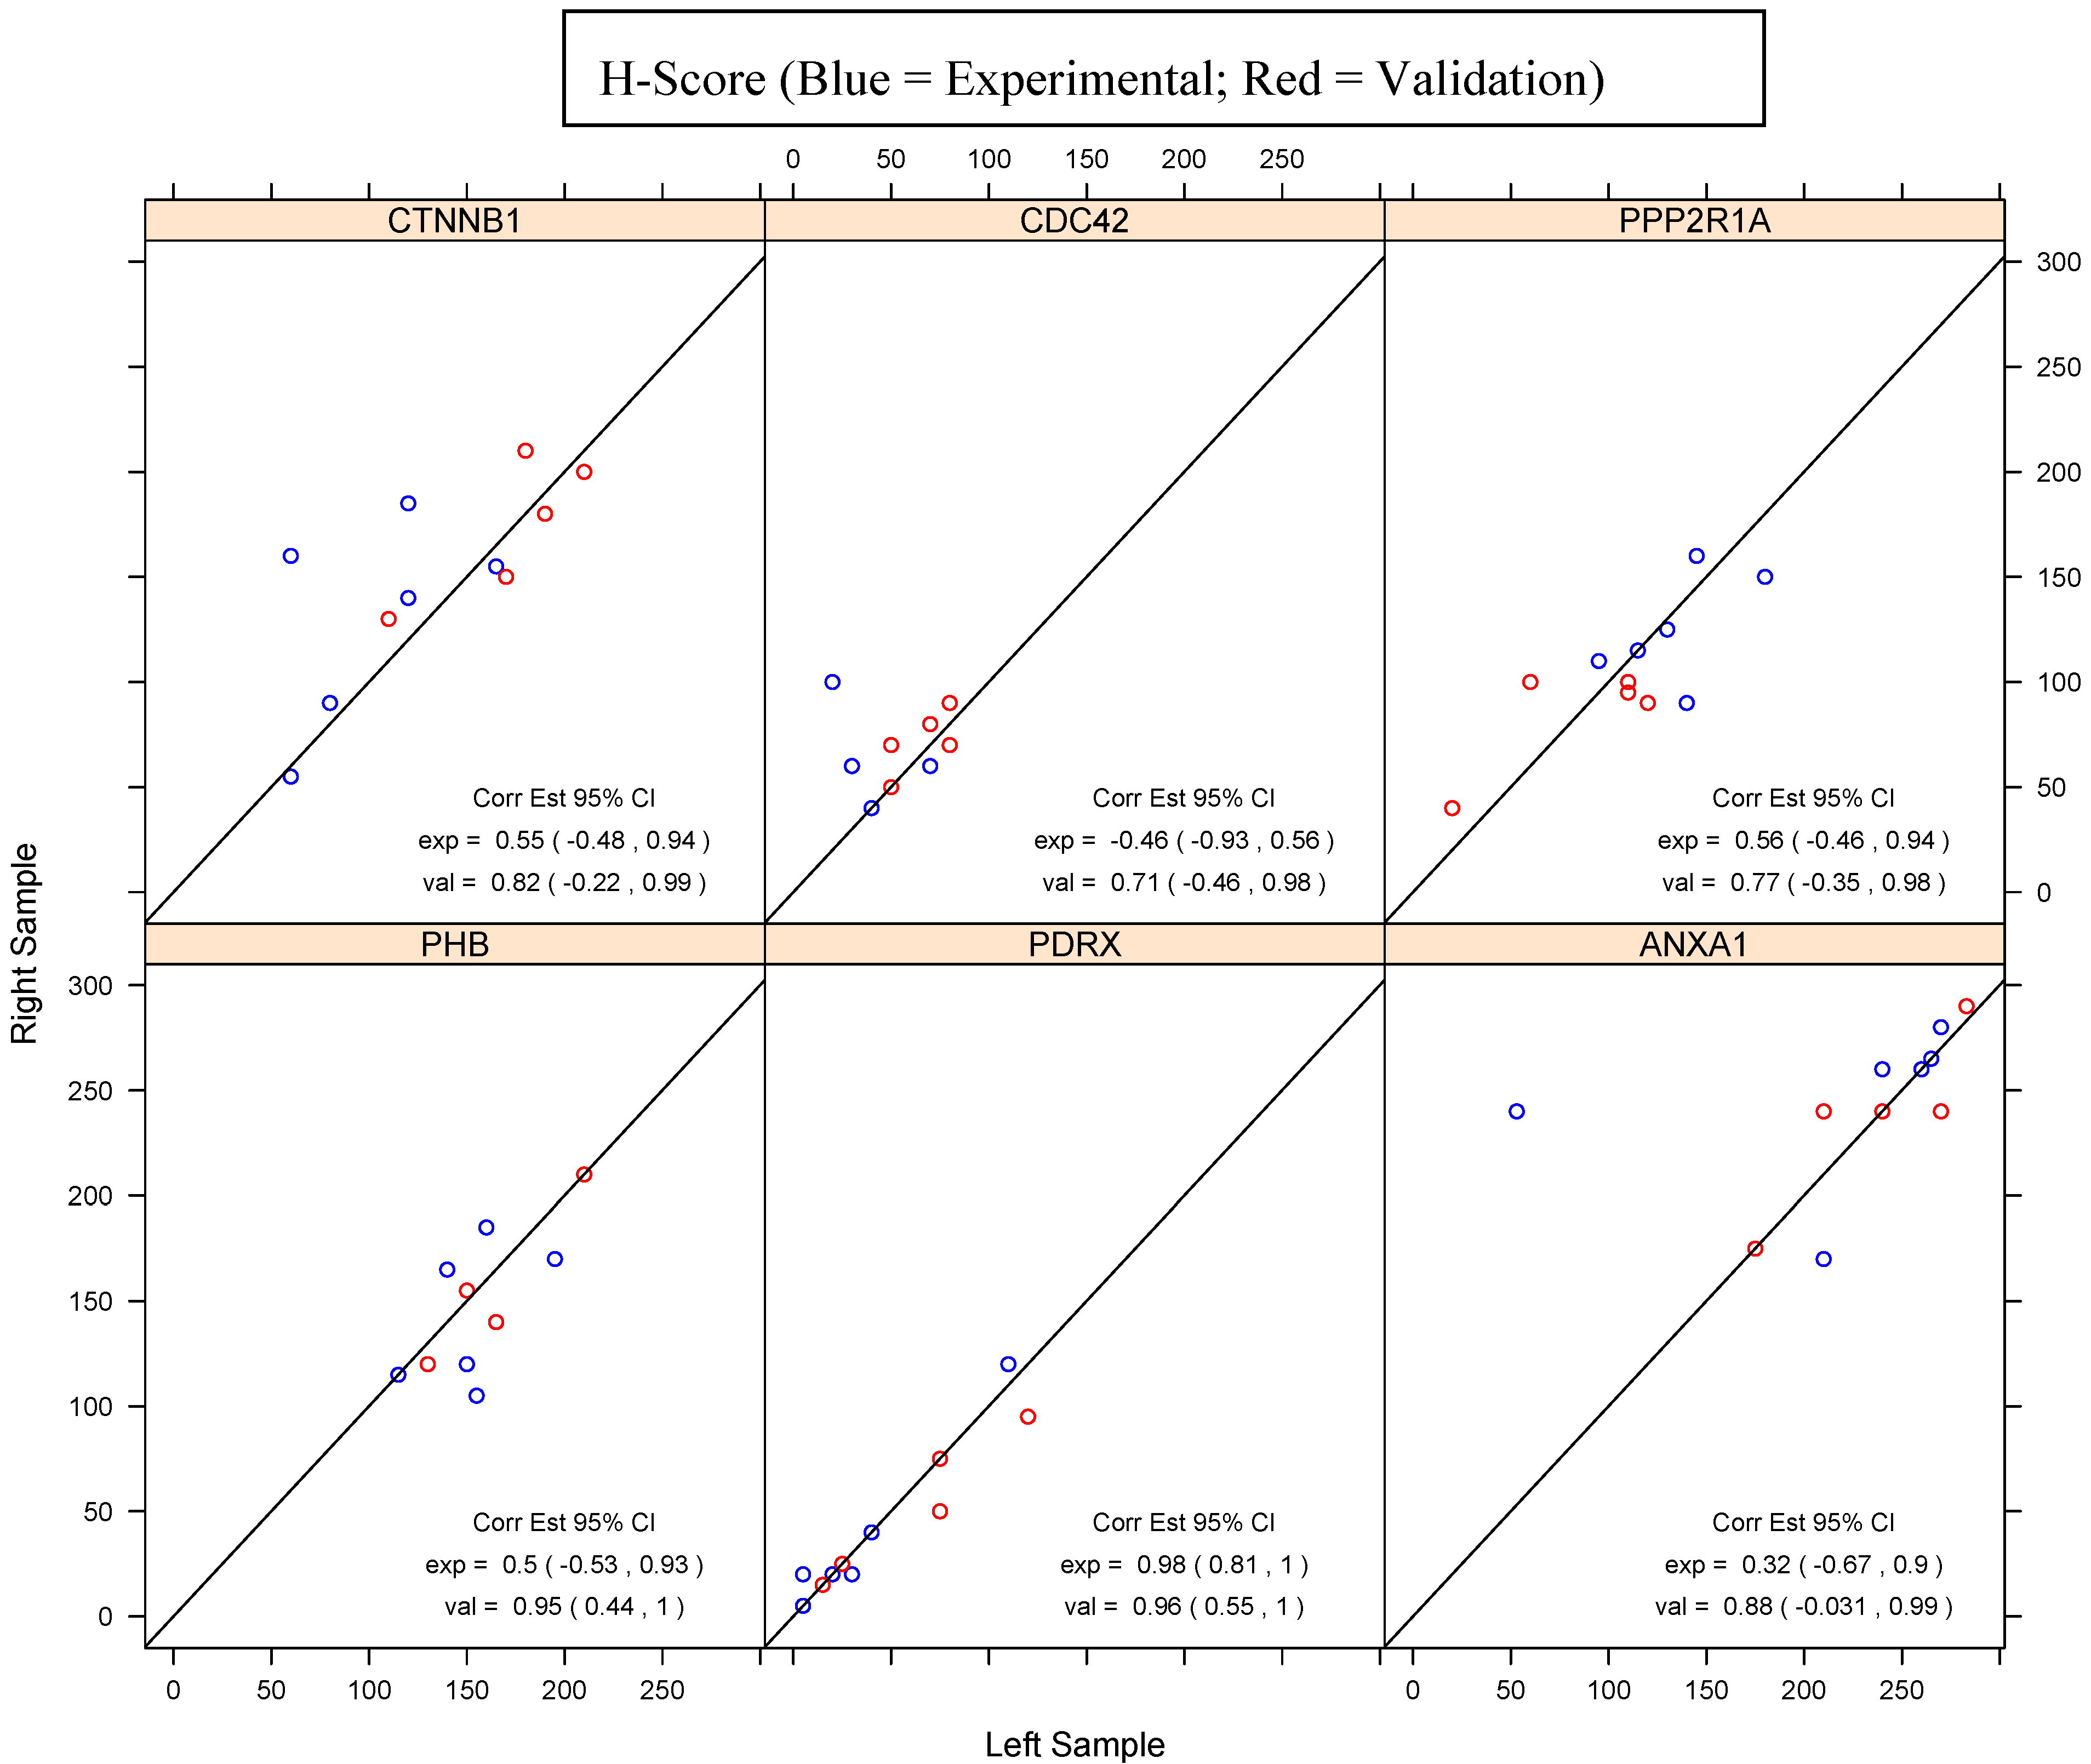
| PHB | PDRX | ANXA1 | ||||
|---|---|---|---|---|---|---|
| Sample | H-score | % staining of cells | H-score | % staining of cells | H-score | % staining of cells |
| E-HGSOC 2R | 115 | 70 | 120 | 80 | 280 | 95 |
| E-HGSOC 2L | 115 | 70 | 110 | 80 | 270 | 95 |
| E-HGSOC 3R | 120 | 70 | 20 | 20 | 260 | 90 |
| E-HGSOC 3L | 150 | 75 | 20 | 20 | 240 | 90 |
| E-HGSOC 5R | 170 | 90 | 40 | 30 | 240 | 95 |
| E-HGSOC 5L | 195 | 95 | 40 | 30 | 53 | 20 |
| E-HGSOC 7R | 185 | 95 | 20 | 20 | 265 | 95 |
| E-HGSOC 7L | 160 | 85 | 5 | 5 | 265 | 95 |
| E-HGSOC 8R | 105 | 60 | 5 | 5 | 260 | 100 |
| E-HGSOC 8L | 155 | 75 | 5 | 5 | 260 | 100 |
| E-HGSOC 9R | 165 | 90 | 20 | 20 | 170 | 60 |
| E-HGSOC 9L | 140 | 85 | 30 | 30 | 210 | 80 |
| V-HGSOC 1R | 210 | 100 | 25 | 25 | 240 | 80 |
| V-HGSOC 1L | 210 | 100 | 25 | 25 | 270 | 90 |
| V-HGSOC 2R | 140 | 90 | 95 | 60 | 240 | 80 |
| V-HGSOC 2L | 165 | 90 | 120 | 70 | 210 | 70 |
| V-HGSOC 3R | 155 | 95 | 50 | 40 | 240 | 80 |
| V-HGSOC 3L | 150 | 80 | 75 | 50 | 240 | 90 |
| V-HGSOC 4R | 120 | 70 | 15 | 10 | 175 | 60 |
| V-HGSOC 4L | 130 | 90 | 15 | 15 | 175 | 60 |
| V-HGSOC 5R | 120 | 90 | 75 | 50 | 290 | 100 |
| V-HGSOC 5L | 130 | 90 | 75 | 50 | 283 | 98 |
| CTNNB1 | CDC42 | PPP2R1A | ||||
|---|---|---|---|---|---|---|
| Sample | H-score | % staining of cells | H-score | % staining of cells | H-score | % staining of cells |
| E-HGSOC 2R | 55 | 50 | 60 | 60 | 150 | 90 |
| E-HGSOC 2L | 60 | 60 | 30 | 30 | 180 | 95 |
| E-HGSOC 3R | 155 | 80 | 60 | 60 | 110 | 60 |
| E-HGSOC 3L | 165 | 85 | 70 | 70 | 95 | 60 |
| E-HGSOC 5R | 160 | 100 | 100 | 80 | 160 | 90 |
| E-HGSOC 5L | 60 | 40 | 20 | 20 | 145 | 80 |
| E-HGSOC 7R | 140 | 85 | 60 | 60 | 125 | 90 |
| E-HGSOC 7L | 120 | 80 | 70 | 70 | 130 | 80 |
| E-HGSOC 8R | 90 | 60 | 50 | 50 | 90 | 70 |
| E-HGSOC 8L | 80 | 50 | 50 | 50 | 140 | 80 |
| E-HGSOC 9R | 185 | 95 | 40 | 30 | 115 | 70 |
| E-HGSOC 9L | 120 | 85 | 40 | 30 | 115 | 75 |
| V-HGSOC 1R | 150 | 100 | 90 | 90 | 100 | 70 |
| V-HGSOC 1L | 170 | 100 | 80 | 80 | 110 | 60 |
| V-HGSOC 2R | 180 | 100 | 80 | 80 | 95 | 75 |
| V-HGSOC 2L | 190 | 95 | 70 | 70 | 110 | 80 |
| V-HGSOC 3R | 130 | 80 | 70 | 70 | 100 | 70 |
| V-HGSOC 3L | 110 | 80 | 80 | 80 | 60 | 50 |
| V-HGSOC 4R | 200 | 100 | 70 | 70 | 90 | 70 |
| V-HGSOC 4L | 210 | 100 | 50 | 50 | 120 | 70 |
| V-HGSOC 5R | 210 | 100 | 50 | 50 | 40 | 40 |
| V-HGSOC 5L | 180 | 100 | 50 | 50 | 20 | 20 |

4. Discussion
5. Conclusions
Supplementary Materials
Supplementary File 1Acknowledgments
Conflicts of Interest
References
- Siegel, R.; Naishadham, D.; Jemal, A. Cancer statistics, 2012. CA Cancer J. Clin. 2012, 62, 10–29. [Google Scholar] [CrossRef]
- Bromley, A.B.; Altman, A.D.; Chu, P.; Nation, J.G.; Nelson, G.S.; Ghatage, P.; Kalloger, S.E.; Han, G.; Kobel, M. Architectural patterns of ovarian/pelvic high-grade serous carcinoma. Int. J. Gynecol. Pathol. 2012, 31, 397–404. [Google Scholar] [CrossRef]
- Schmeler, K.M.; Gershenson, D.M. Low-grade serous ovarian cancer: A unique disease. Curr. Oncol. Rep. 2008, 10, 519–523. [Google Scholar] [CrossRef]
- Gerlinger, M.; Rowan, A.J.; Horswell, S.; Larkin, J.; Endesfelder, D.; Gronroos, E.; Martinez, P.; Matthews, N.; Stewart, A.; Tarpey, P.; et al. Intratumor heterogeneity and branched evolution revealed by multiregion sequencing. N. Engl. J. Med. 2012, 366, 883–892. [Google Scholar] [CrossRef]
- Cadron, I.; van Gorp, T.; Moerman, P.; Waelkens, E.; Vergote, I. Proteomic analysis of laser microdissected ovarian cancer tissue with SELDI-TOF MS. Methods Mol. Biol. 2011, 755, 155–163. [Google Scholar] [CrossRef]
- Tian, Y.; Yao, Z.; Roden, R.B.; Zhang, H. Identification of glycoproteins associated with different histological subtypes of ovarian tumors using quantitative glycoproteomics. Proteomics 2011, 11, 4677–4687. [Google Scholar] [CrossRef]
- Davidson, B. Anatomic site-related expression of cancer-associated molecules in ovarian carcinoma. Curr. Cancer Drug Targets 2007, 7, 109–120. [Google Scholar] [CrossRef]
- Espina, V.; Dettloff, K.A.; Cowherd, S.; Petricoin, E.F., 3rd.; Liotta, L.A. Use of proteomic analysis to monitor responses to biological therapies. Expert Opin. Biol. Ther. 2004, 4, 83–93. [Google Scholar] [CrossRef]
- Zorn, K.K.; Bonome, T.; Gangi, L.; Chandramouli, G.V.; Awtrey, C.S.; Gardner, G.J.; Barrett, J.C.; Boyd, J.; Birrer, M.J. Gene expression profiles of serous, endometrioid, and clear cell subtypes of ovarian and endometrial cancer. Clin. Cancer Res. 2005, 11, 6422–6430. [Google Scholar] [CrossRef]
- Klopfleisch, R.; Weiss, A.T.; Gruber, A.D. Excavation of a buried treasure—DNA, mRNA, miRNA and protein analysis in formalin fixed, paraffin embedded tissues. Histol. Histopathol. 2011, 26, 797–810. [Google Scholar]
- Magdeldin, S.; Yamamoto, T. Toward deciphering proteomes of formalin-fixed paraffin-embedded (FFPE) tissues. Proteomics 2012, 12, 1045–1058. [Google Scholar] [CrossRef]
- Tanca, A.; Pagnozzi, D.; Addis, M.F. Setting proteins free: Progresses and achievements in proteomics of formalin-fixed, paraffin-embedded tissues. Proteomics Clin. Appl. 2012, 6, 7–21. [Google Scholar] [CrossRef]
- Li, X.Q.; Zhang, S.L.; Cai, Z.; Zhou, Y.; Ye, T.M.; Chiu, J.F. Proteomic identification of tumor-associated protein in ovarian serous cystadenocarinoma. Cancer Lett. 2009, 275, 109–116. [Google Scholar] [CrossRef]
- Sethi, N.; Kang, Y. Unravelling the complexity of metastasis—Molecular understanding and targeted therapies. Nat. Rev. Cancer 2011, 11, 735–748. [Google Scholar] [CrossRef]
- Amon, L.M.; Law, W.; Fitzgibbon, M.P.; Gross, J.A.; O’Briant, K.; Peterson, A.; Drescher, C.; Martin, D.B.; McIntosh, M. Integrative proteomic analysis of serum and peritoneal fluids helps identify proteins that are up-regulated in serum of women with ovarian cancer. PLoS One 2010, 5, e11137. [Google Scholar] [CrossRef]
- Elschenbroich, S.; Ignatchenko, V.; Clarke, B.; Kalloger, S.E.; Boutros, P.C.; Gramolini, A.O.; Shaw, P.; Jurisica, I.; Kislinger, T. In-depth proteomics of ovarian cancer ascites: Combining shotgun proteomics and selected reaction monitoring mass spectrometry. J. Proteome Res. 2011, 10, 2286–2299. [Google Scholar]
- Hoskins, E.R.; Hood, B.L.; Sun, M.; Krivak, T.C.; Edwards, R.P.; Conrads, T.P. Proteomic analysis of ovarian cancer proximal fluids: Validation of elevated peroxiredoxin 1 in patient peripheral circulation. PLoS One 2011, 6, e25056. [Google Scholar]
- Kim, S.W.; Kim, S.; Nam, E.J.; Jeong, Y.W.; Lee, S.H.; Paek, J.H.; Kim, J.H.; Kim, J.W.; Kim, Y.T. Comparative proteomic analysis of advanced serous epithelial ovarian carcinoma: Possible predictors of chemoresistant disease. OMICS 2011, 15, 281–292. [Google Scholar] [CrossRef]
- An, H.J.; Kim, D.S.; Park, Y.K.; Kim, S.K.; Choi, Y.P.; Kang, S.; Ding, B.; Cho, N.H. Comparative proteomics of ovarian epithelial tumors. J. Proteome Res. 2006, 5, 1082–1090. [Google Scholar] [CrossRef]
- Bloom, G.C.; Eschrich, S.; Zhou, J.X.; Coppola, D.; Yeatman, T.J. Elucidation of a protein signature discriminating six common types of adenocarcinoma. Int. J. Cancer 2007, 120, 769–775. [Google Scholar] [CrossRef]
- Cadron, I.; van Gorp, T.; Amant, F.; Vergote, I.; Moerman, P.; Waelkens, E.; Daemen, A.; van de Plas, R.; de Moor, B.; Zeillinger, R. The use of laser microdissection and SELDI-TOF MS in ovarian cancer tissue to identify protein profiles. Anticancer Res. 2009, 29, 1039–1045. [Google Scholar]
- Gagne, J.P.; Ethier, C.; Gagne, P.; Mercier, G.; Bonicalzi, M.E.; Mes-Masson, A.M.; Droit, A.; Winstall, E.; Isabelle, M.; Poirier, G.G. Comparative proteome analysis of human epithelial ovarian cancer. Proteome Sci. 2007, 5, e16. [Google Scholar] [CrossRef]
- Ikeda, K.; Monden, T.; Kanoh, T.; Tsujie, M.; Izawa, H.; Haba, A.; Ohnishi, T.; Sekimoto, M.; Tomita, N.; Shiozaki, H.; et al. Extraction and analysis of diagnostically useful proteins from formalin-fixed, paraffin-embedded tissue sections. J. Histochem. Cytochem. 1998, 46, 397–403. [Google Scholar] [CrossRef]
- Rodriguez-Rigueiro, T.; Valladares-Ayerbes, M.; Haz-Conde, M.; Blanco, M.; Aparicio, G.; Fernandez-Puente, P.; Blanco, F.J.; Lorenzo, M.J.; Aparicio, L.A.; Figueroa, A. A novel procedure for protein extraction from formalin-fixed paraffin-embedded tissues. Proteomics 2011, 11, 2555–2559. [Google Scholar] [CrossRef]
- Gustafsson, J.O.; Oehler, M.K.; McColl, S.R.; Hoffmann, P. Citric acid antigen retrieval (CAAR) for tryptic peptide imaging directly on archived formalin-fixed paraffin-embedded tissue. J. Proteome Res. 2010, 9, 4315–4328. [Google Scholar] [CrossRef]
- Ostasiewicz, P.; Zielinska, D.F.; Mann, M.; Wisniewski, J.R. Proteome, phosphoproteome, and N-glycoproteome are quantitatively preserved in formalin-fixed paraffin-embedded tissue and analyzable by high-resolution mass spectrometry. J. Proteome Res. 2010, 9, 3688–3700. [Google Scholar] [CrossRef]
- Magrane, M. UniProt Knowledgebase: A Hub of Integrated Protein Data. Available online: http://www.ebi.ac.uk/integr8 (accessed on 21 March 2013).
- Keller, A.; Nesvizhskii, A.I.; Kolker, E.; Aebersold, R. Empirical statistical model to estimate the accuracy of peptide identifications made by MS/MS and database search. Anal. Chem. 2002, 74, 5383–5392. [Google Scholar] [CrossRef]
- Keller, A.; Eng, J.; Zhang, N.; Li, X.J.; Aebersold, R. A uniform proteomics MS/MS analysis platform utilizing open XML file formats. Mol. Syst. Biol. 2005, 1, e2005.0017. [Google Scholar]
- Liu, H.; Sadygov, R.G.; Yates, J.R., 3rd. A model for random sampling and estimation of relative protein abundance in shotgun proteomics. Anal. Chem. 2004, 76, 4193–4201. [Google Scholar] [CrossRef]
- Hood, B.L.; Conrads, T.P.; Veenstra, T.D. Mass spectrometric analysis of formalin-fixed paraffin-embedded tissue: Unlocking the proteome within. Proteomics 2006, 6, 4106–4114. [Google Scholar] [CrossRef]
- Hood, B.L.; Conrads, T.P.; Veenstra, T.D. Unravelling the proteome of formalin-fixed paraffin-embedded tissue. Brief. Funct. Genomic. Proteomic. 2006, 5, 169–175. [Google Scholar] [CrossRef]
- Hood, B.L.; Grahovac, J.; Flint, M.S.; Sun, M.; Charro, N.; Becker, D.; Wells, A.; Conrads, T.P. Proteomic analysis of laser microdissected melanoma cells from skin organ cultures. J. Proteome Res. 2010, 9, 3656–3663. [Google Scholar] [CrossRef]
- Flanagan, M.B.; Dabbs, D.J.; Brufsky, A.M.; Beriwal, S.; Bhargava, R. Histopathologic variables predict Oncotype DX recurrence score. Mod. Pathol. 2008, 21, 1255–1261. [Google Scholar] [CrossRef]
- McCarty, K.S., Jr.; Miller, L.S.; Cox, E.B.; Konrath, J.; McCarty, K.S.S. Estrogen receptor analyses. Correlation of biochemical and immunohistochemical methods using monoclonal antireceptor antibodies. Arch. Pathol. Lab. Med. 1985, 109, 716–721. [Google Scholar]
- Ding, L.; Ellis, M.J.; Li, S.; Larson, D.E.; Chen, K.; Wallis, J.W.; Harris, C.C.; McLellan, M.D.; Fulton, R.S.; Fulton, L.L.; et al. Genome remodelling in a basal-like breast cancer metastasis and xenograft. Nature 2010, 464, 999–1005. [Google Scholar] [CrossRef]
- Campbell, P.J.; Yachida, S.; Mudie, L.J.; Stephens, P.J.; Pleasance, E.D.; Stebbings, L.A.; Morsberger, L.A.; Latimer, C.; McLaren, S.; Lin, M.L.; et al. The patterns and dynamics of genomic instability in metastatic pancreatic cancer. Nature 2010, 467, 1109–1113. [Google Scholar] [CrossRef]
- Chung, K.H.; Lee, D.H.; Kim, Y.; Kim, T.H.; Huh, J.H.; Chung, S.G.; Lee, S.; Lee, C.; Ko, J.J.; An, H.J. Proteomic identification of overexpressed PRDX 1 and its clinical implications in ovarian carcinoma. J. Proteome Res. 2010, 9, 451–457. [Google Scholar] [CrossRef]
- Basu, A.; Banerjee, H.; Rojas, H.; Martinez, S.R.; Roy, S.; Jia, Z.; Lilly, M.B.; de Leon, M.; Casiano, C.A. Differential expression of peroxiredoxins in prostate cancer: Consistent upregulation of PRDX3 and PRDX4. Prostate 2011, 71, 755–765. [Google Scholar] [CrossRef]
- Canet, B.; Pons, C.; Espinosa, I.; Prat, J. Ovarian clear cell carcinomas: RHO GTPases may contribute to explain their singular biologic behavior. Hum. Pathol. 2011, 42, 833–839. [Google Scholar] [CrossRef]
- Gadducci, A.; Guerrieri, M.E.; Riccardo, G.A. New insights on the pathogenesis of ovarian carcinoma: Molecular basis and clinical implications. Gynecol. Endocrinol. 2012, 28, 582–586. [Google Scholar] [CrossRef]
- Lalwani, N.; Prasad, S.R.; Vikram, R.; Shanbhogue, A.K.; Huettner, P.C.; Fasih, N. Histologic, molecular, and cytogenetic features of ovarian cancers: Implications for diagnosis and treatment. Radiographics 2011, 31, 625–646. [Google Scholar] [CrossRef]
- Shih, I.; Panuganti, P.K.; Kuo, K.T.; Mao, T.L.; Kuhn, E.; Jones, S.; Velculescu, V.E.; Kurman, R.J.; Wang, T.L. Somatic mutations of PPP2R1A in ovarian and uterine carcinomas. Am. J. Pathol. 2011, 178, 1442–1447. [Google Scholar] [CrossRef]
- McConechy, M.K.; Anglesio, M.S.; Kalloger, S.E.; Yang, W.; Senz, J.; Chow, C.; Heravi-Moussavi, A.; Morin, G.B.; Mes-Masson, A.M.; Australian Ovarian Cancer Study Group; et al. Subtype-specific mutation of PPP2R1A in endometrial and ovarian carcinomas. J. Pathol. 2011, 223, 567–573. [Google Scholar] [CrossRef]
© 2013 by the authors; licensee MDPI, Basel, Switzerland. This article is an open access article distributed under the terms and conditions of the Creative Commons Attribution license (http://creativecommons.org/licenses/by/3.0/).
Share and Cite
Smith, A.L.; Sun, M.; Bhargava, R.; Stewart, N.A.; Flint, M.S.; Bigbee, W.L.; Krivak, T.C.; Strange, M.A.; Cooper, K.L.; Zorn, K.K. Proteomic Analysis of Matched Formalin-Fixed, Paraffin-Embedded Specimens in Patients with Advanced Serous Ovarian Carcinoma. Proteomes 2013, 1, 240-253. https://doi.org/10.3390/proteomes1030240
Smith AL, Sun M, Bhargava R, Stewart NA, Flint MS, Bigbee WL, Krivak TC, Strange MA, Cooper KL, Zorn KK. Proteomic Analysis of Matched Formalin-Fixed, Paraffin-Embedded Specimens in Patients with Advanced Serous Ovarian Carcinoma. Proteomes. 2013; 1(3):240-253. https://doi.org/10.3390/proteomes1030240
Chicago/Turabian StyleSmith, Ashlee L., Mai Sun, Rohit Bhargava, Nicolas A. Stewart, Melanie S. Flint, William L. Bigbee, Thomas C. Krivak, Mary A. Strange, Kristine L. Cooper, and Kristin K. Zorn. 2013. "Proteomic Analysis of Matched Formalin-Fixed, Paraffin-Embedded Specimens in Patients with Advanced Serous Ovarian Carcinoma" Proteomes 1, no. 3: 240-253. https://doi.org/10.3390/proteomes1030240