Article

Concurrent Label-Free Mass Spectrometric Analysis of Dystrophin Isoform Dp427 and the Myofibrosis Marker Collagen in Crude Extracts from mdx-4cv Skeletal Muscles

1
Department of Biology, Maynooth University, National University of Ireland, Maynooth Co. Kildare, Ireland
2
Department of Physiology II, University of Bonn, Bonn D-53115, Germany
3
National Institute for Cellular Biotechnology, Dublin City University, Dublin 9, Ireland
*
Author to whom correspondence should be addressed.
Proteomes 2015, 3(3), 298-327; https://doi.org/10.3390/proteomes3030298
Submission received: 30 June 2015 / Revised: 18 August 2015 / Accepted: 3 September 2015 / Published: 16 September 2015
(This article belongs to the Special Issue Striated Muscle Proteomics)

Abstract

:
The full-length dystrophin protein isoform of 427 kDa (Dp427), the absence of which represents the principal abnormality in X-linked muscular dystrophy, is difficult to identify and characterize by routine proteomic screening approaches of crude tissue extracts. This is probably related to its large molecular size, its close association with the sarcolemmal membrane, and its existence within a heterogeneous glycoprotein complex. Here, we used a careful extraction procedure to isolate the total protein repertoire from normal versus dystrophic mdx-4cv skeletal muscles, in conjunction with label-free mass spectrometry, and successfully identified Dp427 by proteomic means. In contrast to a considerable number of previous comparative studies of the total skeletal muscle proteome, using whole tissue proteomics we show here for the first time that the reduced expression of this membrane cytoskeletal protein is the most significant alteration in dystrophinopathy. This agrees with the pathobiochemical concept that the almost complete absence of dystrophin is the main defect in Duchenne muscular dystrophy and that the mdx-4cv mouse model of dystrophinopathy exhibits only very few revertant fibers. Significant increases in collagens and associated fibrotic marker proteins, such as fibronectin, biglycan, asporin, decorin, prolargin, mimecan, and lumican were identified in dystrophin-deficient muscles. The up-regulation of collagen in mdx-4cv muscles was confirmed by immunofluorescence microscopy and immunoblotting. Thus, this is the first mass spectrometric study of crude tissue extracts that puts the proteomic identification of dystrophin in its proper pathophysiological context.

1. Introduction

Dystrophin proteins exist in a large number of isoforms with greatly differing tissue distributions and are encoded by the largest gene in the human genome within the Xp21 region of the X-chromosome [1,2,3]. The full-length muscle isoform of dystrophin, termed Dp427-M, functions as a membrane cytoskeletal actin-binding protein in contractile fibers [4,5,6]. Dystrophin is tightly linked to the muscle sarcolemma via close interactions with a membrane-associated glycoprotein complex [7,8,9]. Progressive diseases of skeletal and cardiac muscles with primary abnormalities in the dystrophin gene include Duchenne muscular dystrophy, Becker muscular dystrophy, and X-linked dilated cardiomyopathy [10,11,12]. In X-linked muscular dystrophy, the almost complete absence of full-length dystrophin triggers a significant reduction in the dystrophin-associated glycoprotein complex and a plethora of down-stream pathophysiological changes, such as an altered coupling between neuronal excitation and muscle contraction, stretch-induced fiber injury, higher levels of plasmalemmal calcium influx, impaired luminal calcium buffering, and an accelerated proteolytic degradation rate [13,14,15]. In order to elucidate the enormous complexity and potential interconnectivity of these many secondary changes, damage pathways in dystrophic muscles involved in fiber degeneration, inflammation, fatty deposition, and progressive fibrosis are ideally studied by large-scale and comprehensive bioanalytical approaches, such as mass spectrometry-based proteomics [16].
Proteomic profiling is a core discipline of modern systems biology and has been widely applied to basic and applied myology [17,18,19], including the evaluation of the secondary effects of dystrophin deficiency in muscular dystrophy [20]. Both gel electrophoretic techniques and liquid chromatography have been employed for the systematic separation of the assessable skeletal muscle proteome. A variety of changes in skeletal muscle-associated proteins involved in energy metabolism, excitation-contraction coupling, fiber contraction, ion homeostasis, the stress response, and cellular signaling have been identified by mass spectrometry, as reviewed by Dowling et al. [21]. This included differential alterations in muscle-associated proteins, such as adenylate kinase isoform AK1 [22], the luminal Ca2+-binding protein calsequestrin [23], the cytosolic Ca2+-binding proteins regucalcin [24] and parvalbumin [25], carbonic anhydrase isoform CA3 [26], various molecular chaperones and heat shock proteins including αB-crystallin/HSPB5, cvHsp/HSPB7, Hsp70/HSPA and Hsp90/HSPC [27,28,29,30], the cytoskeletal proteins vimentin and desmin [31,32,33], metabolic proteins regulated by PGC1-α [34], the extracellular matrix protein dermatopontin [35,36], and the matricellular protein periostin [37]. Elevated levels of muscle-derived proteins in body fluids have been described for fibronectin, the matrix metalloproteinase MMP-9, creatine kinase, carbonic anhydrase CA3, myosin light chain MLC3, malate dehydrogenase MDH2, transforming growth factor TGFβ1, electron transfer flavoprotein ETFA, fragments of the contractile apparatus-associated protein titin, and the lysosomal-associated membrane protein LAMP1 [38,39,40,41,42,43]. However, the comparative proteomic profiling of crude tissue extracts has not routinely identified the members of the dystrophin-glycoprotein complex, which is probably due to the low concentration and the tight membrane association of this protein assembly [20].
Although dystrophin has been listed in proteomic catalogues describing the overall protein constellation of normal skeletal muscles, the full-length Dp427 isoform of this membrane cytoskeletal protein has not been identified in comparative proteomic analyses using whole tissue preparations [21]. We have therefore attempted the application of sensitive label-free mass spectrometry to evaluate total skeletal muscle tissue extracts from wild type versus the dystrophic mdx-4cv mouse. The main underlying objective was to analyze in parallel the primary abnormality in muscular dystrophy and the many secondary changes triggered by the deficiency of dystrophin. Previous proteomic studies with a focus on dystrophin have used pre-fractionation approaches, including immuno precipitation, elaborate density gradient centrifugation, and liquid chromatography procedures [44,45,46,47], or specialized mass spectrometric methodology with a stable isotope labelled dystrophin as a spike-in standard for the quantitation of select peptides representing dystrophin within a heterogeneous protein mixture [48]. The recent application of organelle proteomics, in conjunction with label-free mass spectrometry, has succeeded in the identification of dystrophin isoform Dp427, dystroglycan, δ-sarcoglycan, γ-sarcoglycan, and α1-syntrophin by decisively reducing sample complexity using differential centrifugation to enrich the microsomal fraction [49]. However, since subcellular fractionation steps may introduce artifacts in comparative proteomic studies, mainly due to the differences in membrane organization and myofibrosis, the identification of muscle-associated biomarker candidates in crude muscle extracts is more promising for the establishment of a superior marker signature. In addition, the findings from this new study, using whole tissue proteomics, present important verification results in relation to previous subproteomic investigations. Importantly, since skeletal muscles from this animal model of dystrophinopathy are characterized by very few revertant fibers and exhibit myofibrosis [50,51,52,53], the proteomic analysis of total mdx-4cv muscle extracts was ideally suited to simultaneously study dystrophin deficiency and secondary fibrotic changes within the same analytical run.

2. Experimental Section

2.1. Chemicals and Materials

The mass spectrometry-based proteomic profiling of crude tissue extracts from mdx-4cv versus wild-type hind limb muscles was conducted using analytical grade reagents and materials obtained from GE Healthcare (Little Chalfont, Buckinghamshire, UK) and Bio-Rad Laboratories (Hemel-Hempstead, Hertfordshire, UK). Ultrapure acrylamide stock solutions were purchased from National Diagnostics (Atlanta, GA, USA). Sequencing grade modified trypsin and Lys-C were from Promega (Madison, WI, USA). Whatman nitrocellulose transfer membranes were obtained from Invitrogen (Carlsbad, CA, USA). The chemiluminescence substrate and protease inhibitors were attained from Roche Diagnostics (Mannheim, Germany). Primary antibodies were purchased from Abcam, Cambridge, UK (ab41803 to annexin 2; ab8592 to desmin; ab11427 to parvalbumin; ab21754 to the β-subunit of tubulin; ab58475 to the α-subunit of the Na+/K+-ATPase; ab6588 to collagen VI; ab2818 to the fast SERCA1 isoform of the sarcoplasmic reticulum Ca2+-ATPase and ab52488 to lactate dehydrogenase). Chemicon International (Temecula, CA, USA) provided peroxidase-conjugated secondary antibodies. For immunofluorescence microscopy, normal goat serum, goat anti-rabbit Alexa Fluor 488, and goat anti-mouse IgG RRX (Rhodamine Red-X) were purchased from Molecular Probes, Life Technologies (Darmstadt, Germany), and Jackson ImmunoResearch (West Grove, PA, USA), respectively. The embedding medium Fluoromount G was from Southern Biotech (Birmingham, AL, USA). A variety of other general chemicals, including bis-benzimide Hoechst-33342, were obtained from Sigma Chemical Company (Dorset, UK).

2.2. Animal Model of X-Linked Muscular Dystrophy

Duchenne muscular dystrophy is a monogenic disorder caused by mutations or genetic rearrangements in the 79 exon-spanning gene that encodes the cytoskeletal protein dystrophin [3]. In analogy, the internationally established mdx mouse model of dystrophinopathy is almost completely missing the full-length Dp427 isoform of dystrophin due to a point mutation in exon 23 [54,55,56]. Since mdx skeletal muscles may exhibit a large number of dystrophin-positive revertant fibers, we have here used the mdx-4cv mouse model as an alternative model for studying X-linked muscular dystrophy. Chemical mutagenesis with N-ethylnitrosourea has been used to induce a C to T transition at position 7916 in exon 53 [52], generating a nonsense point mutation that leads to premature translation termination [51]. Truncated dystrophin products in mutant mice appear to be highly unstable and are probably quickly degraded in dystrophic muscle tissues, since they cannot be detected by standard immunoblotting [9]. This genetic model has the advantage of displaying 10-fold fewer revertant fibers as compared to the conventional mdx mouse [50], which renders it an attractive model for evaluating the efficacy of novel therapeutic strategies [57,58,59]. While the mdx-4cv model does not express the full-length Dp427 isoform of dystrophin in either skeletal muscle or brain tissue, it has been shown to express the Dp71 dystrophin isoform in brain tissue at levels comparable to those seen in control mice [53]. This may be due to the fact that the premature stop codon found in exon 53 of the mdx-4cv strain is considerably downstream from the internal promoters that give rise to shorter dystrophin isoforms [53]. As a means of investigating altered protein expression in dystrophic muscle, total tissue extracts of hind limb muscles from six-month old mdx-4cv mice versus age-matched control C57BL6 mice were analyzed, representing a moderate dystrophic phenotype with segmental necrosis [25,31,33]. Fresh tissue samples were acquired from the Bioresource Unit of the University of Bonn [60]. The mice were kept under standard conditions according to German and Irish legislation on the use of animals in experimental research. The animals were sacrificed by cervical dislocation and muscle tissues were isolated immediately. The tissues used for proteomic analysis were quick-frozen in liquid nitrogen and stored at −80 °C prior to analysis.

2.3. Preparation of Tissue Extracts from Normal and Dystrophic Hind Limb Muscles

Skeletal muscle samples (100 mg wet weight) from combined muscles of the entire hind limbs (including bulk muscle from the lower and upper leg, but excluding the grasping foot-paw) of six-month-old dystrophic mdx-4cv mice (n = 4) and age-matched wild-type (wt) mice (n = 4) were finely chopped and homogenized in 10 volumes of homogenization buffer (20 mM sodium pyrophosphate, 20 mM sodium phosphate, 1 mM MgCl2, 0.303 M sucrose, 0.5 mM EDTA, pH 7.0), using a hand-held IKA T10 Basic Homogenizer (IKA Labortechnik, Staufen, Germany) [49]. This buffer was supplemented with a protease inhibitor cocktail from Roche Diagnostics (Mannheim, Germany) to minimize degradation of skeletal muscle proteins [61]. Protein extracts were gently shaken at 8 °C for 2 h using a Thermomixer from Eppendorf (Hamburg, Germany). Following centrifugation at 14,000 g for 20 min at 4 °C, the supernatant fractions from wt and mdx-4cv muscle homogenates were isolated and used for comparative proteomic profiling.

2.4. Sample Preparation for Label-Free Liquid Chromatography Mass Spectrometry

Prior to mass spectrometric analysis, total skeletal muscle extracts were purified of interfering agents using the Ready Prep 2D clean-up kit from Bio-Rad Laboratories (Hemel-Hempstead). Subsequent protein pellets were re-suspended in label-free solubilization buffer (6 M urea, 2 M thiourea, 10 mM Tris, pH 8.0 in LC-MS grade water). Following vortexing and sonication, the protein concentration was determined using a Bradford assay protocol [62]. For label-free mass spectrometric analysis, volumes were equalized with label-free solubilization buffer, followed by chemical reduction with 10 mM DTT for 30 min at 37 °C and alkylation with 25 mM iodoacetamide in 50 mM ammonium bicarbonate for 20 min in the dark at room temperature [60]. To quench any remaining unreacted iodoacetamide and limit potential alkylation of trypsin, samples were further reduced with an additional 10 mM DTT for 15 min in the dark at room temperature. Proteolytic digestion was facilitated by a combination of the enzymes Lys-C and trypsin. The initial digestion was conducted with sequencing-grade Lys-C at a ratio of 1:100 (protease:protein) for 4 h at 37 °C. Following digestion, samples were diluted with four times the initial sample volume in 50 mM ammonium bicarbonate. Subsequent digestion was performed with sequencing-grade trypsin at a ratio of 1:25 (protease:protein) overnight at 37 °C. Digestion was terminated by acidification with 2% trifluoroacetic acid (TFA) in 20% acetonitrile (ACN) (3:1 (v/v) dilution). Peptide suspensions were then purified with Pierce C18 Spin Columns from Thermo Fisher Scientific (Dublin, Ireland) and the resulting peptide samples were dried through vacuum centrifugation and re-suspended in loading buffer consisting of 2% ACN and 0.05% TFA in LC-MS grade water [63]. Samples were vortexed and sonicated to ensure an even suspension of peptides, and were stored at −80 °C prior to mass spectrometric analysis.

2.5. Label-Free Liquid Chromatography Mass Spectrometric Analysis

As previously described in detail [64], nano-LC-MS/MS analysis was conducted using an Ultimate 3000 NanoLC system (Dionex Corporation, Sunnyvale, CA, USA) coupled to a Q-Exactive mass spectrometer from Thermo Fisher Scientific (Dublin, Ireland). Peptide mixtures (3 µL, with a total protein amount of 0.72 µg) were loaded by an auto-sampler onto a C18 trap column (C18 PepMap, 300 µm id × 5 mm, 5 µm particle size, 100 Å pore size; Thermo Fisher Scientific). The trap column was switched on-line with an analytical Biobasic C18 Picofrit column (C18 PepMap, 75 µm id × 50 cm, 2 µm particle size, 100 Å pore size; Dionex Corporation). Peptides derived from muscle protein digestion were eluted using the following gradient (solvent B: 80% (v/v) ACN and 0.1% (v/v) formic acid in LC-MS grade water): 0% solvent B for 10.5 min, 2% solvent B for 110 min, 40% solvent B for 2.5 min, 90% solvent B for 9 min, and 2% solvent B for 43 min. The column flow rate was set to 0.25 µL/min. Data were acquired with Xcalibur software (Thermo Fisher Scientific, Dublin, Ireland, version 3.0 of Xcalibur software). The mass spectrometer was operated in positive, data-dependent mode and was externally calibrated. Survey MS scans were conducted in the mass spectrometer in the 300–1700 m/z range with a resolution of 140,000 (m/z 200) and lock mass set to 445.12003 u. Collision-induced dissociation (CID) fragmentation was carried out with the fifteen most intense ions per scan and at a resolution of 17,500. A dynamic exclusion window was applied within 30 s. An isolation window of 2 m/z and one microscan were used to collect suitable tandem mass spectra.

2.6. Quantitative Proteomic Profiling by Label-Free LC-MS/MS Analysis

Processing of the raw data generated from LC-MS/MS analysis was achieved using Progenesis QI for Proteomics software (version 3.1; Non-Linear Dynamics, a Waters company, Newcastle upon Tyne, UK). Firstly the data was aligned based on the LC retention time of each sample [65]. This allows for any drift in retention time, thus giving an adjusted time for all runs in the analysis. The sample run with the greatest number of peptide ions was selected as a reference run, to which the retention times of all other runs were aligned, and peak intensities were normalized [60]. Prior to exporting the MS/MS data files to Proteome Discoverer 1.4 (Thermo Fisher Scientific, Dublin, Ireland); the data was filtered using the following criteria: (i) peptide features with ANOVA ≤ 0.05 between experimental groups; (ii) mass peaks with charge states from +1 to +5; and (iii) greater than one isotope per peptide. A PepXML generic file was generated from all exported MS/MS spectra from Progenesis software (version 3.1; Non-Linear Dynamics, a Waters company, Newcastle upon Tyne, UK). This file was used for peptide identification using Proteome Discoverer 1.4 against Mascot (version 2.3, Matrix Science, Boston, MA, USA) and Sequest HT (SEQUEST HT algorithm, licence Thermo Scientific, registered trademark University of Washington, Seattle, WA, USA) and searched against the UniProtKB-SwissProt database (taxonomy: Mus musculus; http://www.uniprot.org/proteomes/UP000000589). A number of search parameters were used for protein identification: (i) peptide mass tolerance set to 10 ppm; (ii) MS/MS mass tolerance set to 0.02 Da; (iii) allowance of up to two missed cleavages; (iv) carbamidomethylation set as a fixed modification; and (v) methionine oxidation set as a variable modification [66]. For re-importation back into Progenesis LC-MS software for further analysis, only peptides with either ion scores of 40.00 or more (from Mascot) and peptides with XCorr scores >1.9 for singly-charged ions, >2.2 for doubly-charged ions, and >3.75 for triply-charged ions or more (from Sequest HT) were selected. Crucially, the following criteria were applied to assign a muscle-associated protein as properly identified: (i) an ANOVA score between experimental groups of ≤0.05; and (ii) proteins with ≥2 unique peptides matched and a MASCOT score ≥40. Standard bioinformatics software programs were used to group proteins based on their protein class and to identify potential protein interactions. These analyses were performed on the MS-identified proteins with a changed abundance in mdx-4cv fractions. This bioinformatics analysis was performed with the PANTHER database of protein families [67,68] (http://pantherdb.org/) and the STRING database of known and putative protein interactions that include both direct physical and indirect functional protein associations [69,70] (http://string-db.org/).

2.7. Independent Verification of Key Proteomic Hits by Comparative Immunoblot Analysis

In order to verify alterations in protein expression in crude extracts from dystrophic skeletal muscles, as identified by label-free mass spectrometry, immunoblotting of select muscle proteins was carried out per standard procedure [49]. Electrophoretic separation of proteins was achieved using standard 10% polyacrylamide gels, followed by wet transfer at 100 V for 70 min at 4 °C to Whatman Protan nitrocellulose sheets in a Transblot Cell from Bio-Rad Laboratories (Hemel-Hempstead). To minimize non-specific antibody binding, membranes were blocked for 1 h at room temperature with a milk protein solution (2.5% (w/v) fat-free milk powder in 10% phosphate-buffered saline). Nitrocellulose sheets were incubated with sufficiently-diluted primary antibodies overnight at 4 °C with gentle agitation. Membranes were subsequently washed twice with the milk protein solution for 10 min each time, followed by incubation for 1.5 h with peroxidase-conjugated secondary antibodies, diluted in the blocking buffer [60]. Further washing steps with the milk protein solution and 10% phosphate-buffered saline were carried out prior to visualization of antibody-labeled protein bands using enhanced chemiluminescence as per manufacturer’s guidelines. Densitometric scanning and statistical analysis of immunoblots were performed with a HP PSC-2355 scanner and ImageJ software (NIH, Bethesda, MD, USA; version 1.42), in conjunction with GraphPad Prism software (Graphpad Prism, San Diego, CA, USA, version 5.00), in which a p value < 0.05 was deemed to be statistically significant. Silver staining of protein gels and antibody labeling of the protein product of the house keeping gene that encodes lactate dehydrogenase were employed as loading controls for comparative immunoblot analyses.

2.8. Immunofluorescence Microscopy

In order to correlate the severe reduction of dystrophin (as a dystrophic biomarker) with the concomitant increase of collagen (as a myofibrosis biomarker), as revealed here by the mass spectrometric survey of crude mdx-4cv hind limb extracts, an immunofluorescence microscopical analysis of the gastrocnemius muscle was carried out. Freshly dissected muscles from six-month-old mdx-4cv mice and control C57BL/6 mice were quick-frozen in liquid nitrogen-cooled isopentane and 10 µm sections cut in a cryostat [27]. For routine immuno-labeling, tissue sections were fixed in a 1:1 (v/v) mixture of methanol and acetone for 10 min at room temperature. For dystrophin immuno-staining, unfixed cryosections were boiled in phosphate-buffered saline for 5 min as previously described in detail [71]. Tissue sections were permeabilized in 0.1% (v/v) Triton X-100 for 10 min and then blocked with 1:20 diluted normal goat serum for 30 min at room temperature. Primary antibodies to dystrophin and collagen were diluted 1:20 in phosphate-buffered saline for overnight incubation at 4 °C. Specimens were carefully washed and then incubated with fluorescently-labeled secondary antibodies, using either 1:200 diluted anti-rabbit Alexa Fluor 488 antibody or 1:200 diluted anti-mouse RRX antibody for 45 min at room temperature. Nuclei were counter-stained with 1 μg/mL bis-benzimide Hoechst 33342. Antibody-labeled tissue sections were embedded in Fluoromount G medium and viewed under a Zeiss Axioskop 2 epifluorescence microscope equipped with a digital Zeiss AxioCam HRc camera (Carl Zeiss Jena GmbH, Jena, Germany).

3. Results and Discussion

Although X-linked muscular dystrophy is a primary muscle disease of the membrane cytoskeleton [72], i.e., the almost complete loss of the full-length Dp427 isoform of dystrophin is the underlying pathobiochemical defect that triggers progressive fiber degeneration [73], a crucial secondary alteration in dystrophinopathy is presented by extensive myofibrosis [74]. Thus, in addition to central nucleation, rounded fibers, altered myofiber sizes, inflammation, fiber branching, necrosis, and fatty deposition [75], the progressive accumulation of extracellular matrix components plays a major role in contractile weakness [76]. Due to a hyperactive connective tissue, collagens and associated proteins of the extracellular matrix accumulate in dystrophic muscles causing tissue scarring and the loss of skeletal muscle elasticity [77]. Biochemical and cell biological studies have clearly shown an increased abundance of a variety of proteoglycans and other components of the matrisome in dystrophic fibers [78,79,80,81]. Clinical investigations have established fibrosis as a pathological hallmark of dystrophinopathies [82], whereby the systematic evaluation of myofibrosis in a 10-year longitudinal study with a large number of Duchenne patients suggests that endomysial fibrosis correlates significantly with weakened muscle performance [83]. This makes changes in the extracellular matrix surrounding dystrophic fibers a robust myopathological characteristic of X-linked muscular dystrophy. In analogy to the fact that muscle-derived fibroblasts from Duchenne patients show signs of a pro-fibrotic phenotype and an enhanced proliferation rate coupled to the increased production of collagens [84,85], fibrotic changes are also observed in animal models of muscular dystrophy [86,87,88,89]. Since fibrosis is intrinsically involved in the molecular pathogenesis of muscular dystrophy, systematic studies of global protein changes in dystrophic fibers should be able to correlate the deficiency in dystrophin with altered expression levels of key components of the extracellular matrix [37].
However, a variety of mass spectrometry-based proteomic surveys of crude tissue extracts from dystrophic skeletal muscles have so far failed to properly identify the full-length dystrophin isoform and its tightly associated glycoproteins, but have exclusively shown secondary changes down-stream of the primary abnormality in Dp427 [21]. Here, we could overcome these bioanalytical issues and identify dystrophin in total muscle extracts by label-free mass spectrometry and simultaneously analyze increased levels of the fibrosis biomarker collagen. Hence, this study enabled the concurrent and systematic determination of the primary deficiency in dystrophin and its secondary effects on the entire skeletal muscle protein complement. The mass spectrometry-based proteomic classification of the assessable protein repertoire from total mouse skeletal muscle extracts resulted in the identification of 851 distinct protein species (not shown). The systematic comparison of total tissue extracts from wild type versus mdx-4cv hind limb muscles by label-free LC-MS/MS analysis established a change in a considerable number of these proteomically catalogued elements, i.e., an altered abundance in 197 muscle-associated proteins in the dystrophic phenotype (Table 1 and Table 2). A decreased concentration was established for 43 proteins and 154 proteins exhibited a significantly increased expression level.
Table 1. List of identified proteins that exhibit a significantly reduced concentration in crude mdx-4cv hind limb muscle preparations as revealed by label-free LC-MS/MS analysis.
Accession No.Protein NameUnique PeptidesConfidence ScoreAnova (p)Fold Change
P11531Dystrophin Dp4279457.70.000053−14.61
Q8VCT4Carboxylesterase 1D4175.00.001943−5.85
O55137Acyl-coenzyme A thioesterase 12139.310.002283−4.35
P19096Fatty acid synthase3198.370.006235−3.99
Q9JJW5Myozenin-2267.30.016575−3.98
Q8C0M9Isoaspartyl peptidase/L-asparaginase3202.60.000870−3.97
P97823Acyl-protein thioesterase 12115.70.017276−3.96
P32848Parvalbumin alpha4262.00.040028−3.94
Q61234Alpha-1-syntrophin3101.60.000873−3.68
P51667Myosin regulatory light chain MLC2, slow6319.10.029470−3.64
Q08642Protein-arginine deiminase type-210498.30.003334−3.55
P09542Myosin light chain MLC38548.50.016031−3.50
P16015Carbonic anhydrase CA3211652.10.001537−3.43
Q8QZS13-hydroxyisobutyryl-CoA hydrolase, mitochondrial3202.70.002445−3.14
Q64105Sepiapterin reductase7515.00.002035−3.14
P70695Fructose-1,6-bisphosphatase isozyme 29592.70.003223−3.09
Q9DAK914 kDa phosphohistidine phosphatase2208.60.000263−3.01
P04247Myoglobin161768.30.000652−2.93
Q8BVI4Dihydropteridine reductase5336.00.000315−2.91
Q9DBB8Trans-1,2-dihydrobenzene-1,2-diol dehydrogenase2119.50.026280−2.90
Q9D358Low molecular weight phosphotyrosine protein phosphatase2115.60.002473−2.89
P06801NADP-dependent malic enzyme8348.20.005720−2.84
P21107Tropomyosin alpha-3 chain3113.60.024475−2.71
O55103Periaxin250.90.014583−2.66
Q8R1G2Carboxymethylenebutenolidase homolog4418.40.005828−2.64
Q9D0K2Succinyl-CoA:3-ketoacid coenzyme A transferase 1, mitochondrial2143.40.009917−2.60
Q9WUZ5Troponin I, slow skeletal muscle2114.00.033414−2.50
P56375Acylphosphatase-23227.80.000551−2.39
P17563Selenium-binding protein 17398.90.000733−2.35
P14152Malate dehydrogenase, cytoplasmic8588.60.000441−2.33
Q9CRB9Coiled-coil-helix-coiled-coil-helix domain-containing protein 3, mitochondrial2191.90.008307−2.28
P70349Histidine triad nucleotide-binding protein 16504.10.004703−2.27
P11404Fatty acid-binding protein, FABP3, heart5407.20.011413−2.21
Q01768Nucleoside diphosphate kinase B3216.10.029418−2.21
Q9D0S9Histidine triad nucleotide-binding protein 2, mitochondrial288.70.007985−2.14
Q9CQR4Acyl-coenzyme A thioesterase 132155.30.009677−2.14
P15626Glutathione S-transferase Mu 25300.40.019473−2.13
P08228Superoxide dismutase [Cu-Zn]5205.90.004575−2.08
Q8BZA9Fructose-2,6-bisphosphatase (TIGAR)2106.50.003999−2.08
Q91ZJ5UTP-glucose-1-phosphate uridylyltransferase15949.20.002697−2.08
P63017Heat shock cognate 71 kDa4465.80.003124−2.03
P15327Bisphosphoglycerate mutase3213.30.013366−2.02
Q60864Stress-induced-phosphoprotein 13175.80.001854−2.01
Table 2. List of identified proteins that exhibit a significantly increased concentration in crude mdx-4cv hind limb muscle preparations as revealed by label-free LC-MS/MS analysis.
Accession No.Protein NameUnique PeptidesConfidence ScoreAnova (p)Fold Change
Q61879Myosin-10289.20.000004mdx only
P11276Fibronectin2133.40.002667271.95
Q00898Alpha-1-antitrypsin 1–55571.10.000004187.00
Q02788Collagen alpha-2(VI) chain2102.60.00099344.37
P28653Biglycan4232.40.00416617.82
Q8R5J9PRA1 family protein 3245.70.00021216.11
Q9ESD7Dysferlin262.50.00413216.08
Q8VDD5Myosin-94267.70.00912615.75
Q9D154Leukocyte elastase inhibitor A9608.00.00012012.58
P09541Myosin light chain MLC47467.00.00000012.04
Q8VCM7Fibrinogen gamma chain375.50.00034111.00
Q8K0E8Fibrinogen beta chain11586.90.00020310.96
P62835Ras-related protein Rap-1A2111.60.00482310.62
P99024Tubulin beta-5 chain4211.90.0010159.81
Q3TMP8Trimeric intracellular cation channel type A2192.70.0040548.93
P21981Protein-glutamine gamma-glutamyltransferase 2298.60.0232858.77
O89053Coronin-1A283.20.0045208.09
P51881ADP/ATP translocase 2256.40.0040988.06
P97449Aminopeptidase N260.60.0025627.79
Q9D1G3Protein-cysteine N-palmitoyltransferase HHAT-like protein5363.50.0097306.54
P28665Murinoglobulin-115759.70.0024566.50
P03921NADH-ubiquinone oxidoreductase chain 53200.00.0188746.27
Q8VDN2Sodium/potassium-transporting ATPase subunit alpha-15274.20.0151036.07
P68433Histone H3.13261.40.0117465.98
P11087Collagen alpha-1(I) chain4205.20.0164815.91
Q99JY9Actin-related protein 33152.90.0000845.58
Q7TSH2Phosphorylase b kinase regulatory subunit beta272.70.0357825.49
Q99MQ4Asporin5354.10.0005465.42
Q61233Plastin-26251.20.0001085.38
P41216Long-chain-fatty-acid-CoA ligase 15242.70.0200465.19
Q91V79Fat storage-inducing transmembrane protein 12114.10.0123215.15
Q6PIE5Sodium/potassium-transporting ATPase subunit alpha-26279.10.0109795.02
P10107Annexin A15349.40.0007514.98
Q68FD5Clathrin heavy chain 110600.20.0004164.81
Q00623Apolipoprotein A-I14959.80.0003864.63
A2AMM0Muscle-related coiled-coil protein4173.60.0001734.60
Q9CR62Mitochondrial 2-oxoglutarate/malate carrier protein261.50.0321194.60
P14094Sodium/potassium-transporting ATPase subunit beta-1299.20.0107494.38
Q9DBG6Dolichyl-diphosphooligosaccharide-protein glycosyltransferase subunit 22123.20.0178384.26
P13020Gelsolin10696.40.0000024.17
P6290840S ribosomal protein S33191.50.0155784.15
Q6ZWV360S ribosomal protein L102130.30.0356674.11
Q01339Beta-2-glycoprotein 1376.30.0161814.11
Q61147Ceruloplasmin2104.50.0059754.08
Q60854Serpin B613834.50.0001053.99
Q99P72Reticulon-42145.70.0077113.95
Q8BH59Calcium-binding mitochondrial carrier protein Aralar17511.80.0141473.91
P20918Plasminogen2160.20.0184373.88
O09161Calsequestrin-23162.30.0004143.87
Q61838Alpha-2-macroglobulin271386.60.0046223.78
P16546Spectrin alpha chain, non-erythrocytic 15348.10.0069233.74
O89104Synaptophysin-like protein 22236.00.0098443.73
E9PZQ0Ryanodine receptor 1271821.40.0092603.71
Q71LX4Talin-2246.70.0244883.69
P68369Tubulin alpha-1A chain12719.00.0064063.67
P22752Histone H2A type 14199.00.0019163.67
P29621Serine protease inhibitor A3C2240.90.0025583.66
P01872Ig mu chain C region3242.20.0045803.65
Q9EQK5Major vault protein2108.40.0028703.58
P07356Annexin A29662.80.0009163.55
P00405Cytochrome c oxidase subunit 23118.80.0153873.52
P22599Alpha-1-antitrypsin 1-23186.10.0040033.46
Q6ZWY9Histone H2B type 1-C/E/G3310.50.0064823.46
P26039Talin-13199.20.0011773.36
P18826Phosphorylase b kinase regulatory subunit alpha, skeletal muscle isoform3235.70.0080943.34
P15864Histone H1.2294.90.0110663.28
P62806Histone H45312.40.0106663.28
Q8BMS1Trifunctional enzyme subunit alpha, mitochondrial9762.30.0115133.25
P26041Moesin5180.30.0005633.23
P1414860S ribosomal protein L73181.60.0133133.22
Q8VEM8Phosphate carrier protein, mitochondrial5264.80.0148803.22
Q61207Sulfated glycoprotein 13122.30.0031933.13
Q04857Collagen alpha-1(VI) chain387.70.0180193.12
P61027Ras-related protein Rab-103118.30.0015773.12
P28654Decorin5350.60.0165443.10
Q9D783Kelch-like protein 406330.10.0010343.09
P97927Laminin subunit alpha-43144.00.0022783.03
O08532Voltage-dependent calcium channel subunit alpha-2/delta-15289.90.0117423.03
Q8BTM8Filamin-A3123.00.0066752.98
A2AUC9Kelch-like protein 4112774.90.0082402.96
P07758Alpha-1-antitrypsin 1-19691.90.0142772.93
Q9CVB6Actin-related protein 2/3 complex subunit 23154.10.0003072.91
P18760Cofilin-15305.00.0045112.90
Q8CI43Myosin light chain 6B266.60.0075752.89
P48962ADP/ATP translocase 19579.20.0172422.85
Q9D6F9Tubulin beta-4A chain5478.90.0037302.78
Q8R429Sarcoplasmic/endoplasmic reticulum calcium ATPase 1393489.20.0199262.77
P09405Nucleolin2453.60.0051122.75
P24369Peptidyl-prolyl cis-trans isomerase B2132.90.0005962.72
P13541Myosin-35425.10.0180312.71
P48036Annexin A58459.70.0031102.70
P29391Ferritin light chain 19652.00.0055732.68
P62874Guanine nucleotide-binding protein G(I)/G(S)/G(T) subunit beta-13178.50.0013442.67
P32261Antithrombin-III3178.10.0047032.65
P07759Serine protease inhibitor A3K9716.80.0029342.64
Q7TMM9Tubulin beta-2A chain10632.20.0013802.64
P4791160S ribosomal protein L62145.70.0112382.59
Q91X72Hemopexin13636.30.0169452.58
P1486960S acidic ribosomal protein386.00.0049992.56
Q9JK53Prolargin5227.20.0052812.56
P48678Prelamin-A/C251641.10.0003492.55
Q9CQQ7ATP synthase F(0) complex subunit B1, mitochondrial5211.70.0036722.54
Q9CZM260S ribosomal protein L152104.90.0248282.51
P62962Profilin-14270.90.0155202.49
Q91VI7Ribonuclease inhibitor7339.10.0133702.48
Q07076Annexin A72120.80.0016002.46
Q8R4E4Myozenin-32100.50.0011802.45
P62141Serine/threonine-protein phosphatase PP1-beta catalytic subunit2177.10.0015082.45
Q70IV5Synemin2104.40.0001862.43
P20152Vimentin151088.50.0022582.42
P3598060S ribosomal protein L183154.70.0181702.41
Q62000Mimecan7497.70.0160652.41
Q60930Voltage-dependent anion-selective channel protein 29649.60.0409132.36
Q8BFR5Elongation factor Tu, mitochondrial9509.10.0048152.36
Q9WTR5Cadherin-133245.50.0060362.36
P47757F-actin-capping protein subunit beta2143.10.0034312.34
Q9Z1E4Glycogen [starch] synthase, muscle4199.60.0194182.32
P97384Annexin A115201.60.0004222.32
P68040Guanine nucleotide-binding protein subunit beta-2-like 16311.80.0006932.31
Q91WD5NADH dehydrogenase [ubiquinone] iron-sulfur protein 2, mitochondrial8305.40.0014142.31
P4796360S ribosomal protein L132109.20.0230952.30
P50543Protein S100-A112136.80.0033492.30
Q61425Hydroxyacyl-coenzyme A dehydrogenase, mitochondrial2115.40.0128222.29
P05213Tubulin alpha-1B chain2209.90.0160432.29
P68368Tubulin alpha-4A chain3305.20.0063572.28
Q8BG05Heterogeneous nuclear ribonucleoprotein A3282.40.0401722.28
Q6ZWX6Eukaryotic translation initiation factor 2 subunit 1273.20.0186022.27
A2AAJ9Obscurin9474.20.0044262.26
P6288960S ribosomal protein L304279.40.0018872.26
Q9DC69NADH dehydrogenase 1 alpha subcomplex subunit 9, mitochondrial3184.70.0143622.26
P50544Very long-chain specific acyl-CoA dehydrogenase, mitochondrial3148.70.0027232.25
P6310114-3-3 protein zeta/delta4390.80.0069912.23
Q8BK84Dual specificity phosphatase DUPD12146.80.0047562.21
Q9DB20ATP synthase subunit O, mitochondrial4277.80.0102212.18
Q3MI48Junctional sarcoplasmic reticulum protein 13145.60.0209612.17
P14824Annexin A65539.10.0030472.15
Q03265ATP synthase subunit alpha, mitochondrial11778.30.0011582.10
Q9JJZ2Tubulin alpha-8 chain268.20.0236422.10
Q60605Myosin light polypeptide 64300.20.0104402.09
Q99JB8Protein kinase C and casein kinase II substrate protein 38439.71.20E-052.09
P31001Desmin181622.80.0014512.09
Q61292Laminin subunit beta-25233.60.0133692.08
P40124Adenylyl cyclase-associated protein 1252.10.0014652.07
Q8VHX6Filamin-C201257.40.0382982.07
P51885Lumican5346.10.0210662.07
Q9CZU6Citrate synthase, mitochondrial5373.20.0147602.07
O35129Prohibitin-23122.30.0040542.06
Q9DB60Prostamide/prostaglandin F synthase248.50.0011442.05
O88342WD repeat-containing protein 13205.60.0046252.04
P14602Heat shock protein beta-16349.60.0020162.04
P14733Lamin-B15244.40.0018972.03
Q60936Chaperone activity of bc1 complex-like, mitochondrial298.40.0282762.02
P3597960S ribosomal protein L123172.60.0201282.02
Q02053Ubiquitin-like modifier-activating enzyme 12170.90.0308102.01

3.1. Label-Free LC-MS/MS Analysis of Decreased Proteins in Total mdx-4cv Muscle Extracts

The most crucial aspect of this report is the mass spectrometric classification of dystrophin (P11531) in whole tissue preparations using comparative proteomics, and the unequivocal identification of this membrane cytoskeletal component as the most significantly reduced protein in crude mdx-4cv skeletal muscle extracts (Table 1). This is a considerable bioanalytical achievement in relation to the biochemical identification of a low-abundance and membrane-associated muscle protein within total tissue homogenates [90]. The skeletal muscle proteome has been extensively catalogued and characterized in its fiber type specific composition by mass spectrometry-based proteomics [91,92,93,94,95]. Although individual members of the large family of dystrophin proteins ranging from approximately 45 to 427 kDa [3] have been described in large-scale proteomic surveys [95], a considerable number of investigations employing comparative proteomics of crude tissue extracts have failed to identify the dystrophin-glycoprotein complex [20]. The reduced density of dystrophin in mdx-4cv muscles, as shown here by label-free mass spectrometric analysis, agrees with the pathobiochemical concept that the drastic reduction in the full-length dystrophin isoform Dp427 is the primary defect in dystrophinopathies [2]. This proteomic finding also supports the results from previous studies that have shown a very low rate of revertant Dp427-positive fibers in the mdx-4cv mouse model of Duchenne muscular dystrophy [50,51,52,53]. In addition to Dp427, another member of the dystrophin-glycoprotein complex that exhibits a drastically reduced concentration in muscular dystrophy was identified by mass spectrometry in total extracts, i.e., the adapter protein α1-syntrophin of 54 kDa (Q61234). This agrees with the previous immunoblot analysis of skeletal muscles from the conventional mdx mouse [96] and biopsy specimens from Duchenne patients [97].
In addition, interesting muscle proteins of reduced density in dystrophin-deficient fibers, that are potentially useful for the establishment of a comprehensive biomarker signature of muscular dystrophy [98], are the Z-line protein myozenin-2 (Q9JJW5), parvalbumin (P32848), myoglobin (P04247), carbonic anhydrase CA3 (P16015), glutathione S-transferase (P15626), and fatty acid binding protein FABP3 (P11404), as listed in Table 1. These changes indicate alterations in α-actinin- and γ-filamin-binding, impaired cytosolic Ca2+-buffering, modified CO2-removal mechanisms and a changed biotransformation capacity, as well as a reduced ability for oxygen transportation and fatty acid utilization. The metabolite transporter FABP3 appears to be a limiting factor of oxidative muscle metabolism [99] and was established as a proteomic biomarker of aerobic capacity in skeletal muscles [100]. The change in FABP3 expression indicates alterations or physiological adaptations in relation to oxidative metabolism in dystrophic fibers. A reduced concentration of contractile and regulatory proteins was shown to occur in the thick filament (myosin light chains MLC2 and MLC3) and the thin filament (tropomyosin alpha-3, troponin TnI), suggesting considerable rearrangements within the contractile apparatus of dystrophic fibers [101].
A recent comparative label-free mass spectrometric analysis of mildly versus severely affected mdx skeletal muscles has revealed a reduced concentration of myoglobin in diaphragm, soleus, extensor digitorum longus, and flexor digitorum brevis muscle, lower levels of parvalbumin in diaphragm, soleus, and flexor digitorum brevis muscle, as well as decreases of myozenin in diaphragm, extensor digitorum longus, and flexor digitorum brevis muscle [102]. This agrees with the evaluation of the mdx-4cv hind limb musculature shown here and suggests that the relatively abundant proteins myoglobin, parvalbumin, and myozenin present suitable biomarker candidates for the general verification of secondary changes in muscular dystrophy.

3.2. Label-Free LC-MS/MS Analysis of Increased Proteins in Total mdx-4cv Muscle Extracts

A large number of muscle-associated proteins were identified to exhibit an increased concentration in Dp427-deficient skeletal muscles. As listed in Table 2, the label-free mass spectrometric analysis of crude tissue extracts from mdx-4cv hind limb muscles revealed drastically elevated levels of components of the extracellular matrix and the cytoskeletal network. These proteome-wide changes suggest both a myofibrosis-related accumulation of collagens and their associated components of the matrisome [20], as well as the compensatory up-regulation of cytoskeletal structures to partially counterbalance the loss of dystrophin [21]. The statistical q-values of the proteins listed in Table 1 and Table 2 are presented in supplementary Table S1.
The most significantly increased protein was identified as myosin-10, which is defined as an unconventional non-muscle type of myosin with specialized cellular functions in cell shape provision, cytokinesis and actin cytoskeletal organization, as well as stabilization of collagen synthesis [103]. Immunoblotting with an antibody to myosin-10 did not result in sufficiently specific labeling of this protein, so this proteomic finding could not be further evaluated by Western blotting (not shown). The increased levels of myosin-9 (Q8VDD5) and myosin-10 (Q61879), also referred to as non-muscle myosin heavy chains NMMHC II-A and II-B, in dystrophic muscle agree with the idea of enhanced cellular proliferation rates and increased synthesis of components of the matrisome in muscular dystrophy [37]. Crucial extracellular matrix proteins with an increased concentration were identified as collagen alpha-1(VI) chain (Q04857), alpha-2(VI) chain (Q02788), and collagen alpha-1(I) chain (P11087), as well as fibronectin (P11276), biglycan (P28653), asporin (Q99MQ4), decorin (P28654), prolargin (Q9JK53), mimecan (Q62000), and lumican (P51885). Fibronectin is an established serum biomarker of X-linked muscular dystrophy [40] and released at high levels into the circulatory system of Duchenne patients [21]. These severe changes in the extracellular matrix strongly suggest that myofibrosis plays a central pathobiochemical role in the molecular pathogenesis of progressive muscular dystrophy [77]. Collagen type IV was previously shown to be drastically increased in diaphragm, flexor digitorum brevis, and interosseus muscles [35,102]. The up-regulated collagen type VI is a major filament-forming collagen of the interstitial matrix that closely interacts with other collagens, fibronectin, biglycan, decorin, and integrins [104]. Hence, the dystrophinopathy-related accumulation of the fibrillar extracellular matrix is clearly associated with the concomitant increase in decorin, asporin, and prolargin, as shown in this report, as well as dermatopontin and the matricellular protein periostin, as previously shown by comparative subproteomic and proteomic studies [35,36,37,49]. Subunits of fibrinogen (Q8VCM7, Q8KOE8) were also identified as being increased in mdx-4cv hind limb muscles, as previously shown to occur in the aged and severely fibrotic mdx diaphragm [35]. This supports the concept that significant myofibrotic changes alter the extracellular environment of dystrophic muscle fibers [80], since fibrinogen affects the transforming growth factor-β/alternative macrophage activation pathway in dystrophin-deficient muscles [105].
The apparent up-regulation of tubulin (Q9ERD7; Q9D6F9; P99024), vinculin (Q64727), talin (P26039, Q71LX4), and vimentin (P20152) suggests a compensatory rebalancing of the weakened cytoskeletal system in Dp427-lacking muscle fibers. The restructuring of intermediate filaments and microtubular networks may stabilize the intracellular matrix in the absence of the sarcolemmal dystrophin lattice during contractile and mechanical strains. Importantly, vimentin was recently identified as being increased in all investigated contractile tissues from the conventional mdx mouse, ranging from mildly to moderately to severely dystrophic skeletal muscles. This study included the comparative proteomic evaluation of interosseus, flexor digitorum brevis, soleus, extensor digitorum longus, and diaphragm muscles [102]. The increased levels of the nuclear envelope protein lamin (isoforms A/C (P48678) and B (P14733)) also agrees with the proteomic evaluation of individual mdx hind limb muscles and the diaphragm [102]. In skeletal muscles, isoforms of annexin are linked to the continued maintenance of the cytoskeletal network and the provision of extracellular matrix integrity [106]. This would agree with the proteomic finding that annexin isoforms A1, A2, A5, A6, A7, and A11 (P10107; P07356; P14824; P48036; Q07076; P97384), which are also majorly involved in Ca2+-handling, are increased in mdx-4cv muscles (Table 2). Annexin isoforms therefore represent universal biomarkers of muscular dystrophy, since they were also shown to be increased in diaphragm, soleus, extensor digitorum longus, interosseus, and flexor digitorum brevis muscles [102]. In addition, the presence of high levels of dysferlin (Q9ESD7) indicates the initiation of sarcolemmal repair mechanisms to counteract micro-rupturing of the deteriorated muscle surface membrane system [107]. A highly elevated protein in dystrophic muscle preparations was identified as the anti-protease molecule named alpha-1-antitrypsin (Q00898, P22599). Since alpha-1-antitrypsin is also involved in anti-inflammatory responses [108], the increased abundance of this protein might be a protective reaction to reduce the pathobiochemical impact of excessive proteolytic degradation and inflammatory damage to dystrophin-deficient fibers. In contrast to the observed increase in non-muscle myosin-9 (Q8VDD5) and myosin-10 (Q61879) and their proposed role in myofibrosis, the elevated levels of the embryonic myosin heavy chain isoforms myosin-3 (P13541) and myosin-8 (Accession No.: P13542; Confidence score: 499.8; Anova (p): 0.013850; Fold change: 8.63; identified by only 1 unique peptide, and therefore not listed in Table 2) has to be interpreted as changes downstream of the cytoskeletal damage pathway within the overall organization of the contractile apparatus. Although perinatal myosin-8 is clearly present in adult skeletal muscles [92], its drastic increase in dystrophic fibers indicates remodelling within dystrophic fibers and/or the increased recruitment of newly differentiated myofibers with a predominant embryonic protein expression pattern. A variety of conventional myosin light chains (P09541, Q8CI43, and Q60605) were shown to be increased in mdx-4cv hind limb muscles, agreeing with the above outlined idea that substantial rearrangements occur within the contractile apparatus of dystrophic fibers [101].
A considerable number of comparative proteomic studies of muscular dystrophy have used gel electrophoretic approaches for large-scale protein separation [20]. These investigations have usually not covered potential changes in extremely high-molecular-mass proteins and/or integral membrane proteins in a comprehensive way [90]. In this report, the application of liquid chromatography and sensitive label-free mass spectrometry has at least partially overcome this bioanalytical problem and successfully identified major metabolic and physiological players involved in the regulation of a variety of cellular processes. This included a large number of mitochondrial proteins and metabolite transporters, such as ADP/ATP translocase, NADH-ubiquinone oxidoreductase, NADH dehydrogenase, Ca2+-binding mitochondrial carrier protein, cytochrome c oxidase, phosphate carrier protein, ATP synthase, citrate synthase, acyl-CoA dehydrogenase, and the voltage-dependent anion-selective channel VDAC2 (Table 2). The mass spectrometric identification of extremely large muscle-associated proteins included obscurin (A2AAJ9), a giant myofibrillar protein of approximately 720 kDa [109], whose molecular dimensions would be too bulky for routine proteomic analysis by two-dimensional gel electrophoresis [90].
Importantly, the mass spectrometric analysis has identified elevated levels of major high-molecular mass proteins involved in the regulation and maintenance of the muscle membrane potential, excitation-contraction coupling and muscle relaxation, such as the Na+/K+-ATPase (Q6PIE5, P14094), the voltage-sensing dihydropyridine receptor (O08532), the ryanodine receptor (E9PZQ0) and the sarcoplasmic reticulum Ca2+-ATPase (Q8R429). The interplay between the l-type Ca2+-channel dihydropyridine receptor of the transverse tubules and the ryanodine receptor RyR1 Ca2+-release channel complex of the triads is responsible for the swift coupling between sarcolemmal depolarization and Ca2+-release to trigger muscle contraction, the Na+/K+-ATPase maintains the resting membrane potential over the sarcolemma, and the fast SERCA1 type Ca2+-ATPase induces muscle relaxation by the re-uptake of Ca2+-ions into the lumen of the sarcoplasmic reticulum [110]. All four proteins exist in high-molecular-mass complexes as integral protein assemblies and exhibit extensive hydrophobic peptide domains. The successful identification of these key physiological regulators demonstrates the improved protein coverage of label-free mass spectrometry as compared to purely gel-based comparative studies [49]. The increased concentration of the ion pumps and ion channels suggests major restructuring within the regulatory pathways of mdx-4cv hind limb muscles. Degenerating and fibrotic skeletal muscles seem to counteract impaired cellular signaling and ion fluxes by the up-regulation of essential voltage sensors, ion release channels and ion pumps to maintain optimum excitation-contraction coupling and stabilize the resting membrane potential over the sarcolemma in dystrophic fibers [111].

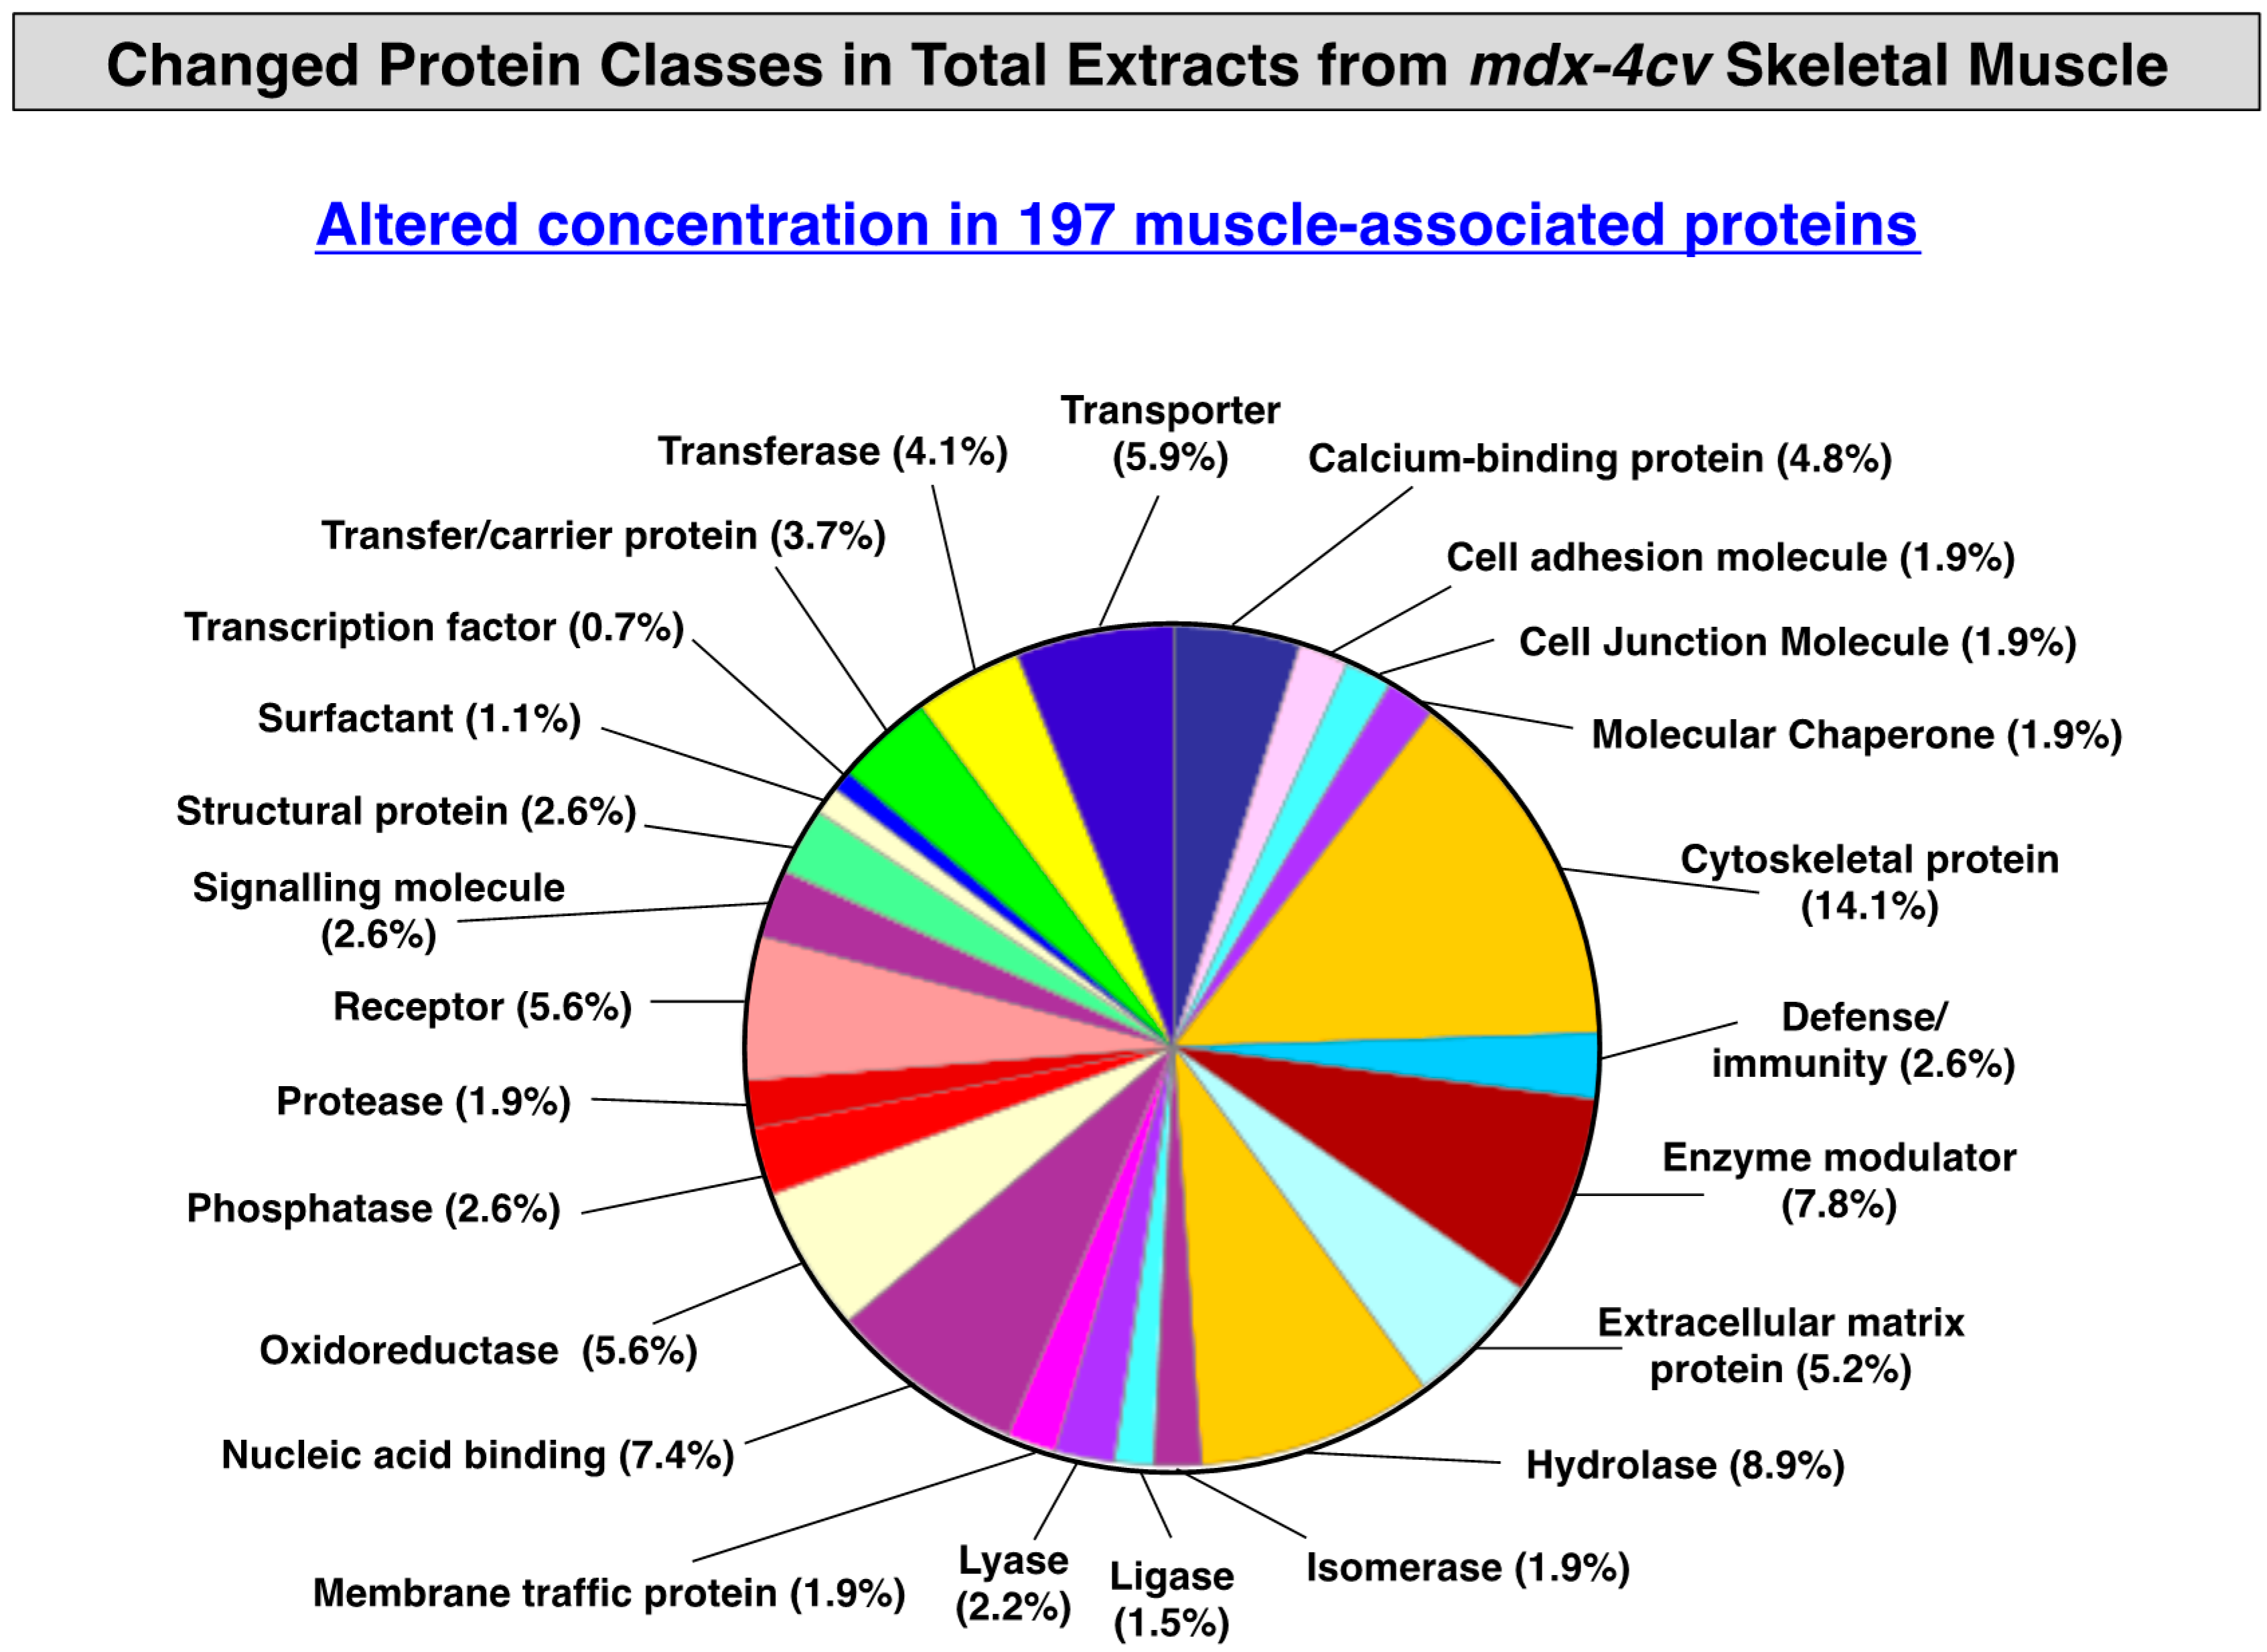
3.3. Distribution of Protein Changes in Dystrophic mdx-4cv Hind Limb Muscles

To illustrate the overall distribution of variations in the expression of protein classes and potential interaction patterns between altered proteins, standard bioinformatics analyses of the mass spectrometrically-identified proteins with a changed density in mdx-4cv hind limb muscles were carried out. As shown in the PANTHER analysis of Figure 1 [67,68], the proteomic analysis of crude tissue extracts from dystrophic skeletal muscles revealed the highest number of alterations in the class of cytoskeletal proteins. This agrees with the biomedical fact that X-linked muscular dystrophy is a primary disorder of the membrane cytoskeleton and that the almost complete loss of dystrophin isoform Dp427 triggers massive changes in the overall cytoskeletal network within muscle fibers. This would include secondary reductions of directly and indirectly associated cytoskeletal elements, but also the compensatory up-regulation of stabilizing proteins belonging to the microtubules and intermediate filament systems (Table 1 and Table 2).
Figure 1. Summary of changed protein classes in total tissue extracts from mdx-4cv hind limb muscle. In order to identify the clustering of protein classes based on the mass spectrometric analysis of crude extracts from wild type versus dystrophic skeletal muscle specimens (Table 1 and Table 2), the bioinformatics software program PANTHER [67,68] was used.
Proteomes 03 00298 g001
A bioinformatics STRING analysis was carried out [69,70] and the resulting interaction map of changed proteins in total muscle extracts from mdx-4cv muscles highlights the central position of Dp427 within the large network of altered protein species. Figures S1 and S2 in the supplementary materials show the interaction patterns between the membrane cytoskeletal change due to dystrophin deficiency and secondary effects on other major protein hubs, such as the extracellular matrix, the contractile apparatus and the intracellular matrix consisting of a variety of interconnecting cytoskeletal systems (Table 1 and Table 2). Protein changes in essential cellular processes that are involved in the excitation-contraction-relaxation cycle, physiological regulation, the uptake and transportation of metabolites, muscle energy metabolism, the extracellular matrix, the cytoskeleton and the stress response appear to majorly affect contractile functions in X-linked muscular dystrophy.

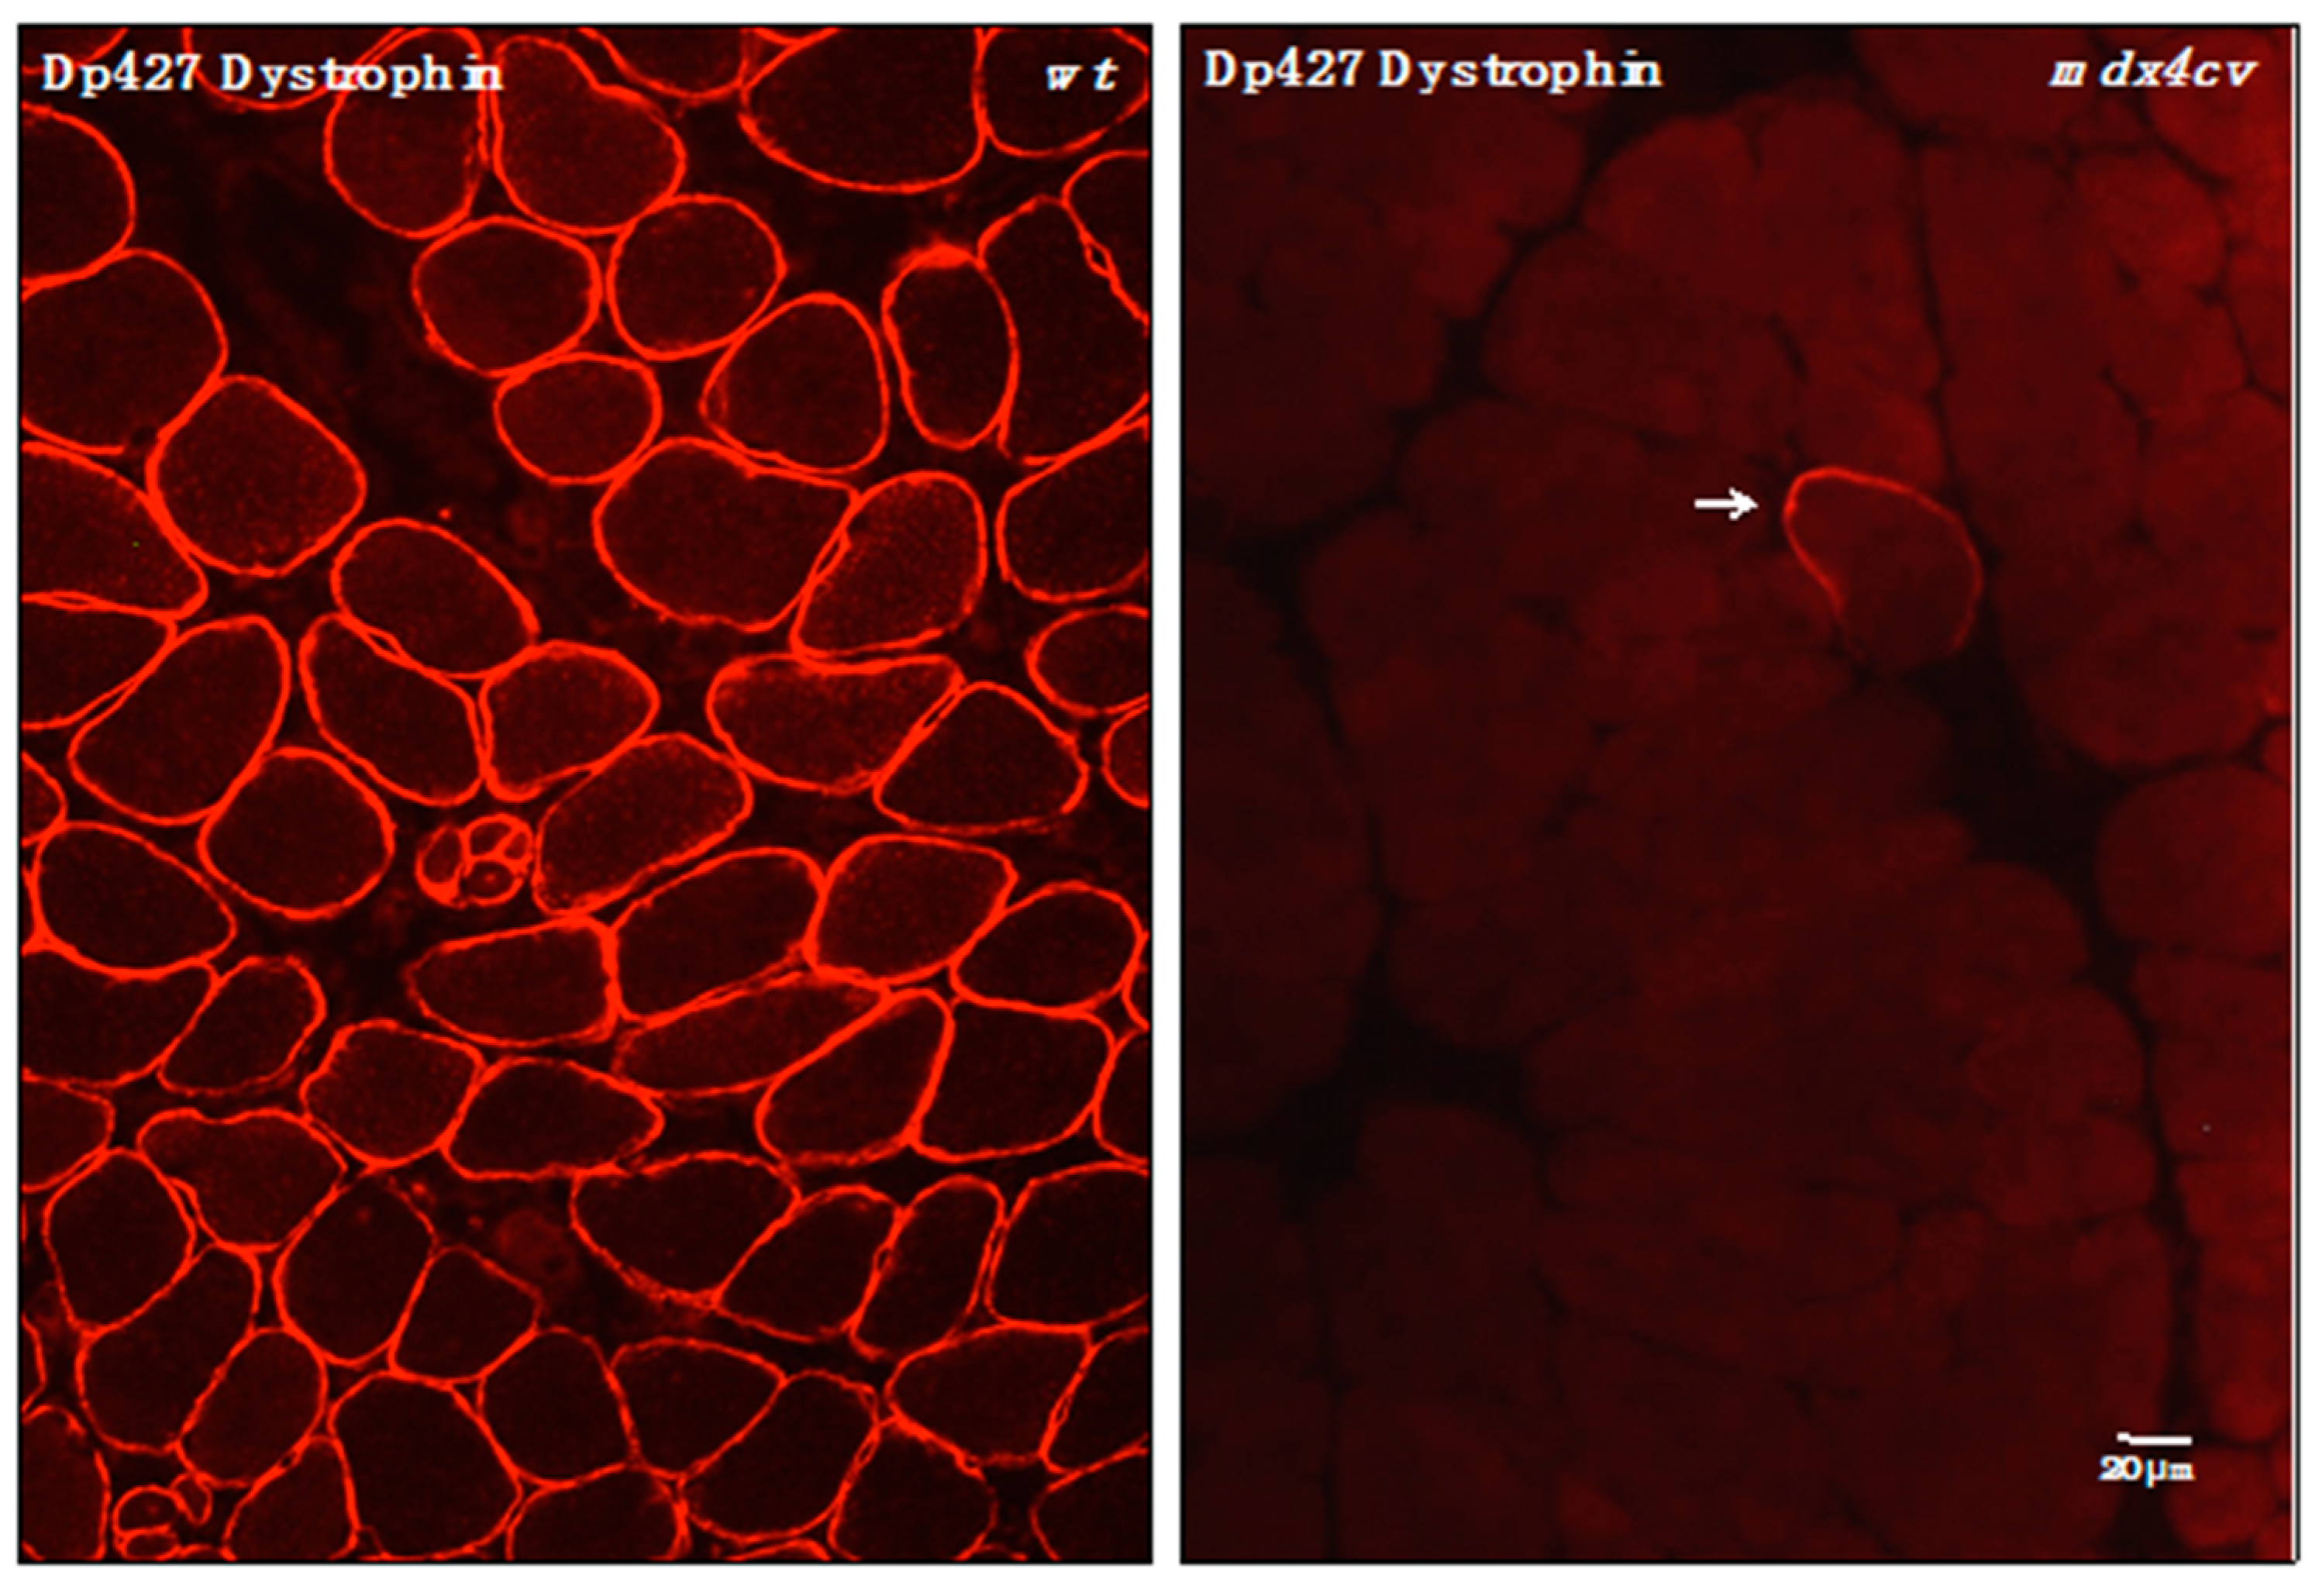
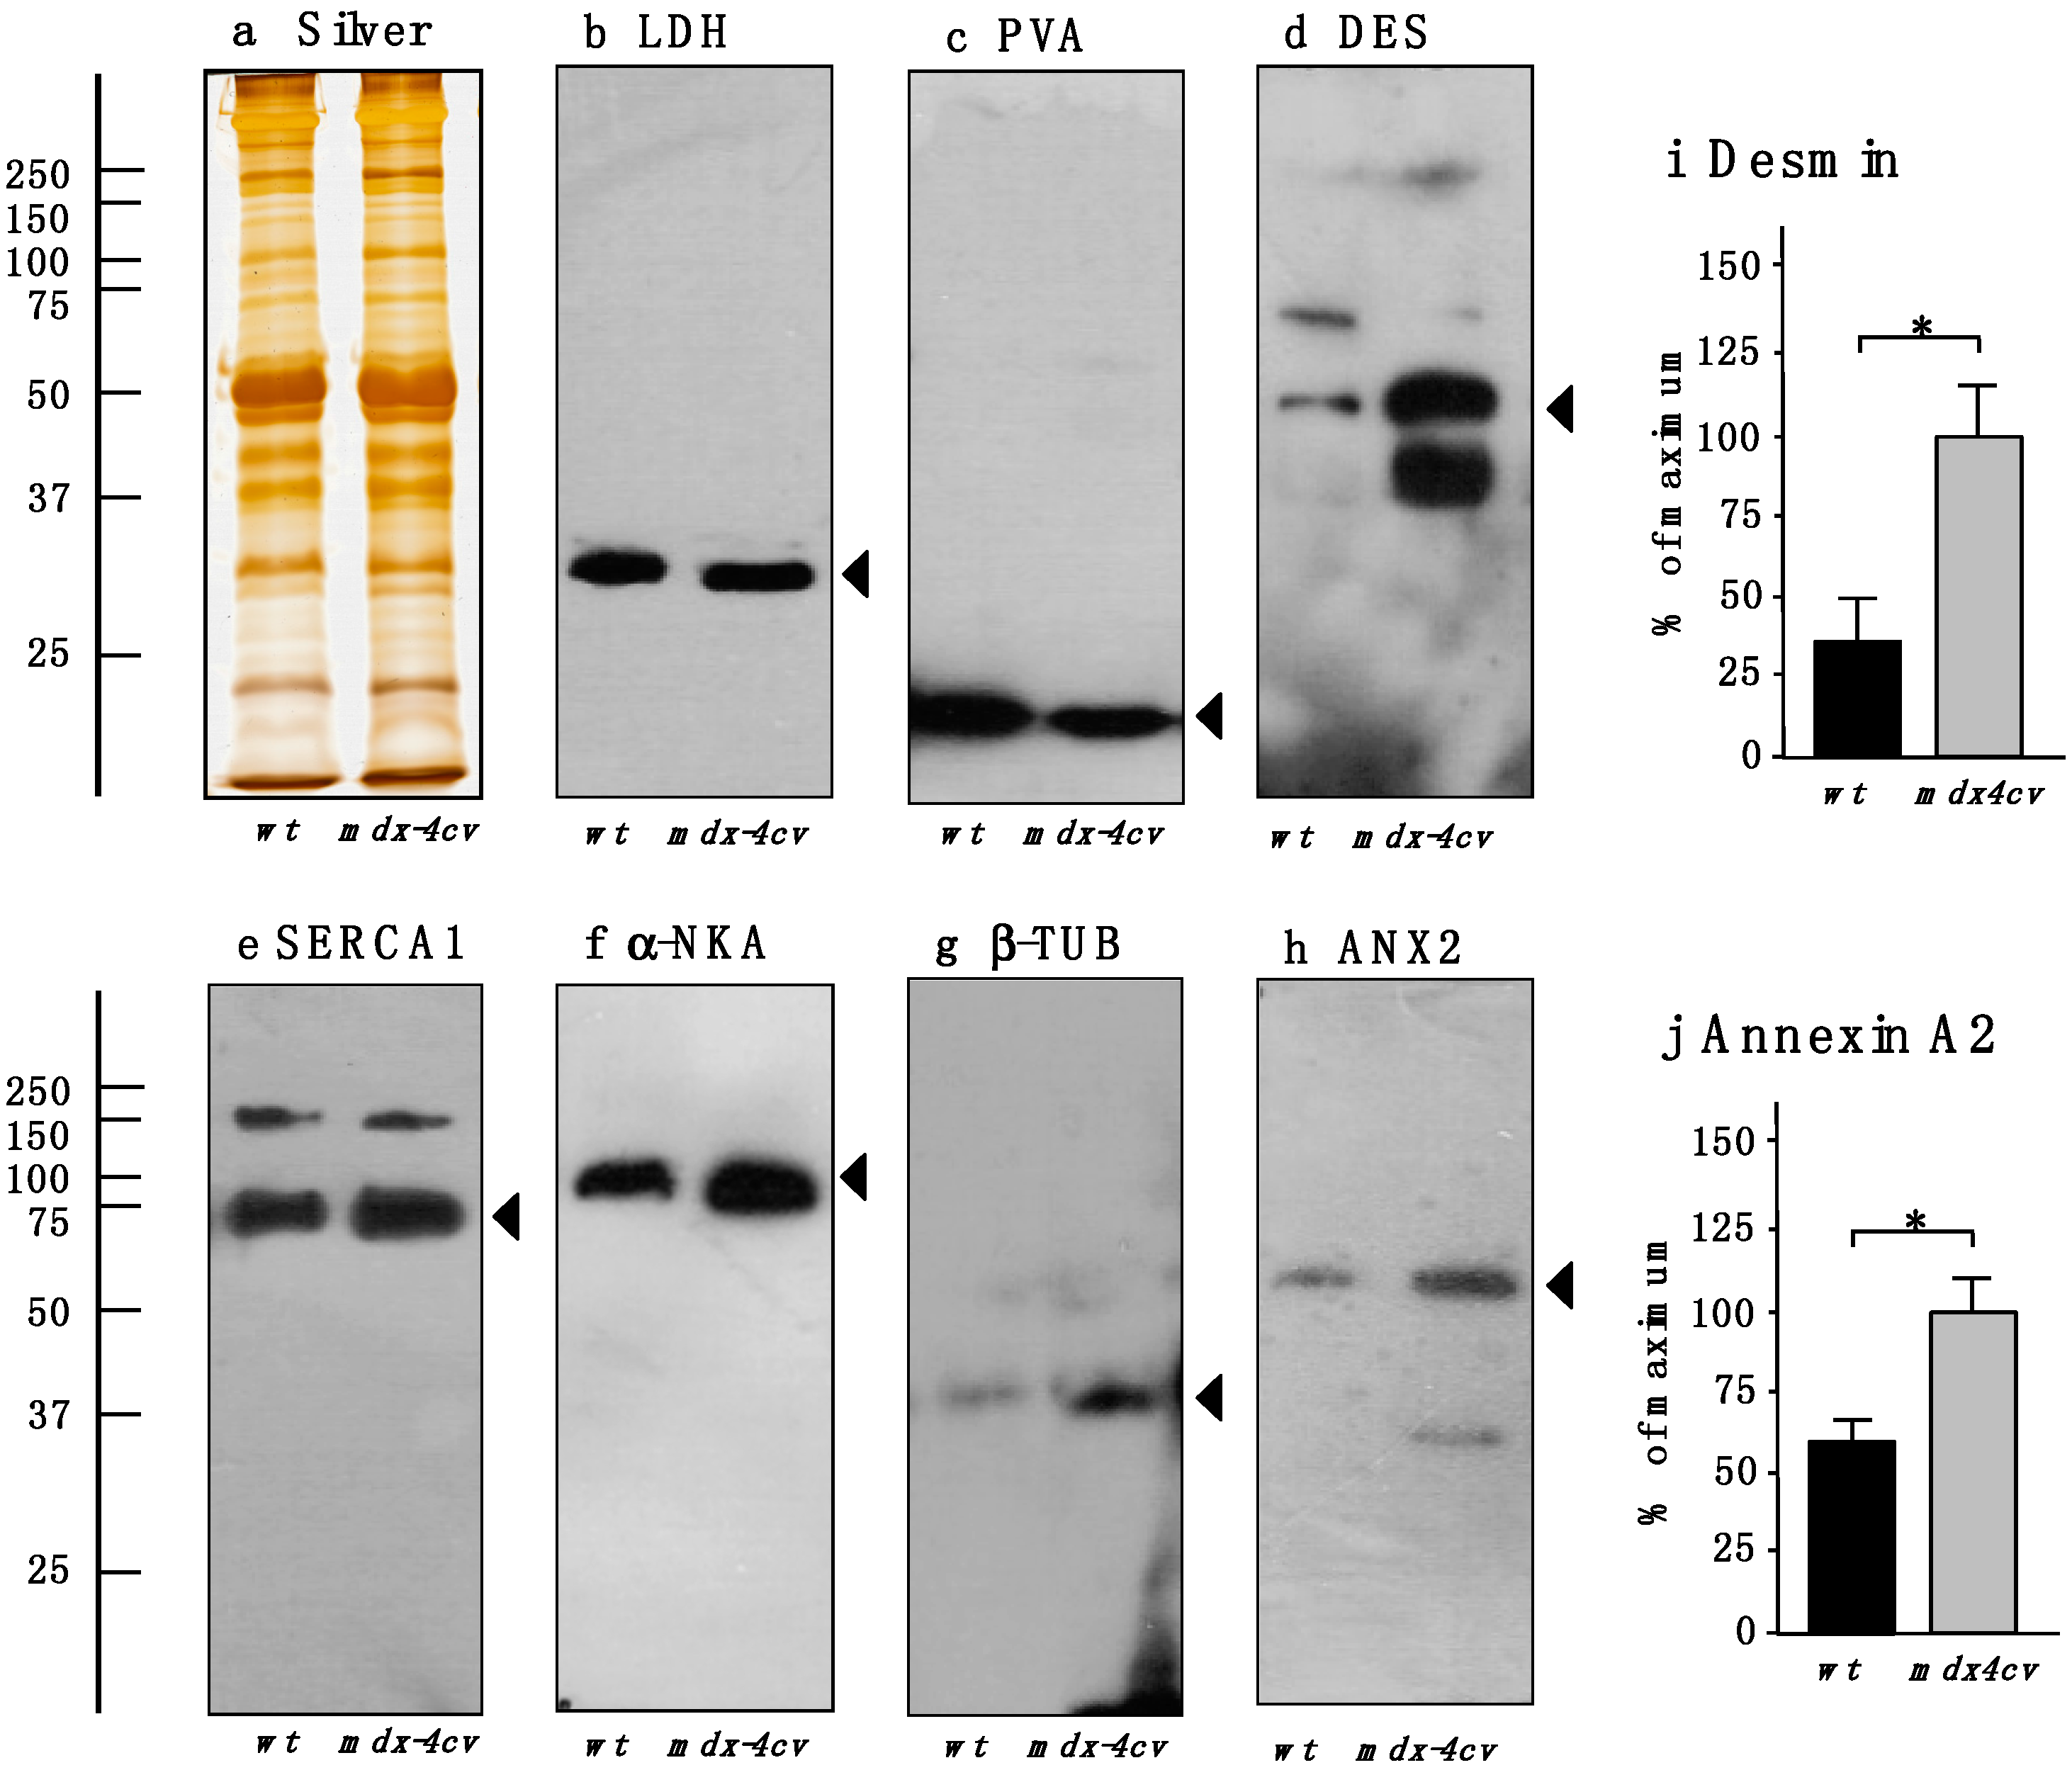
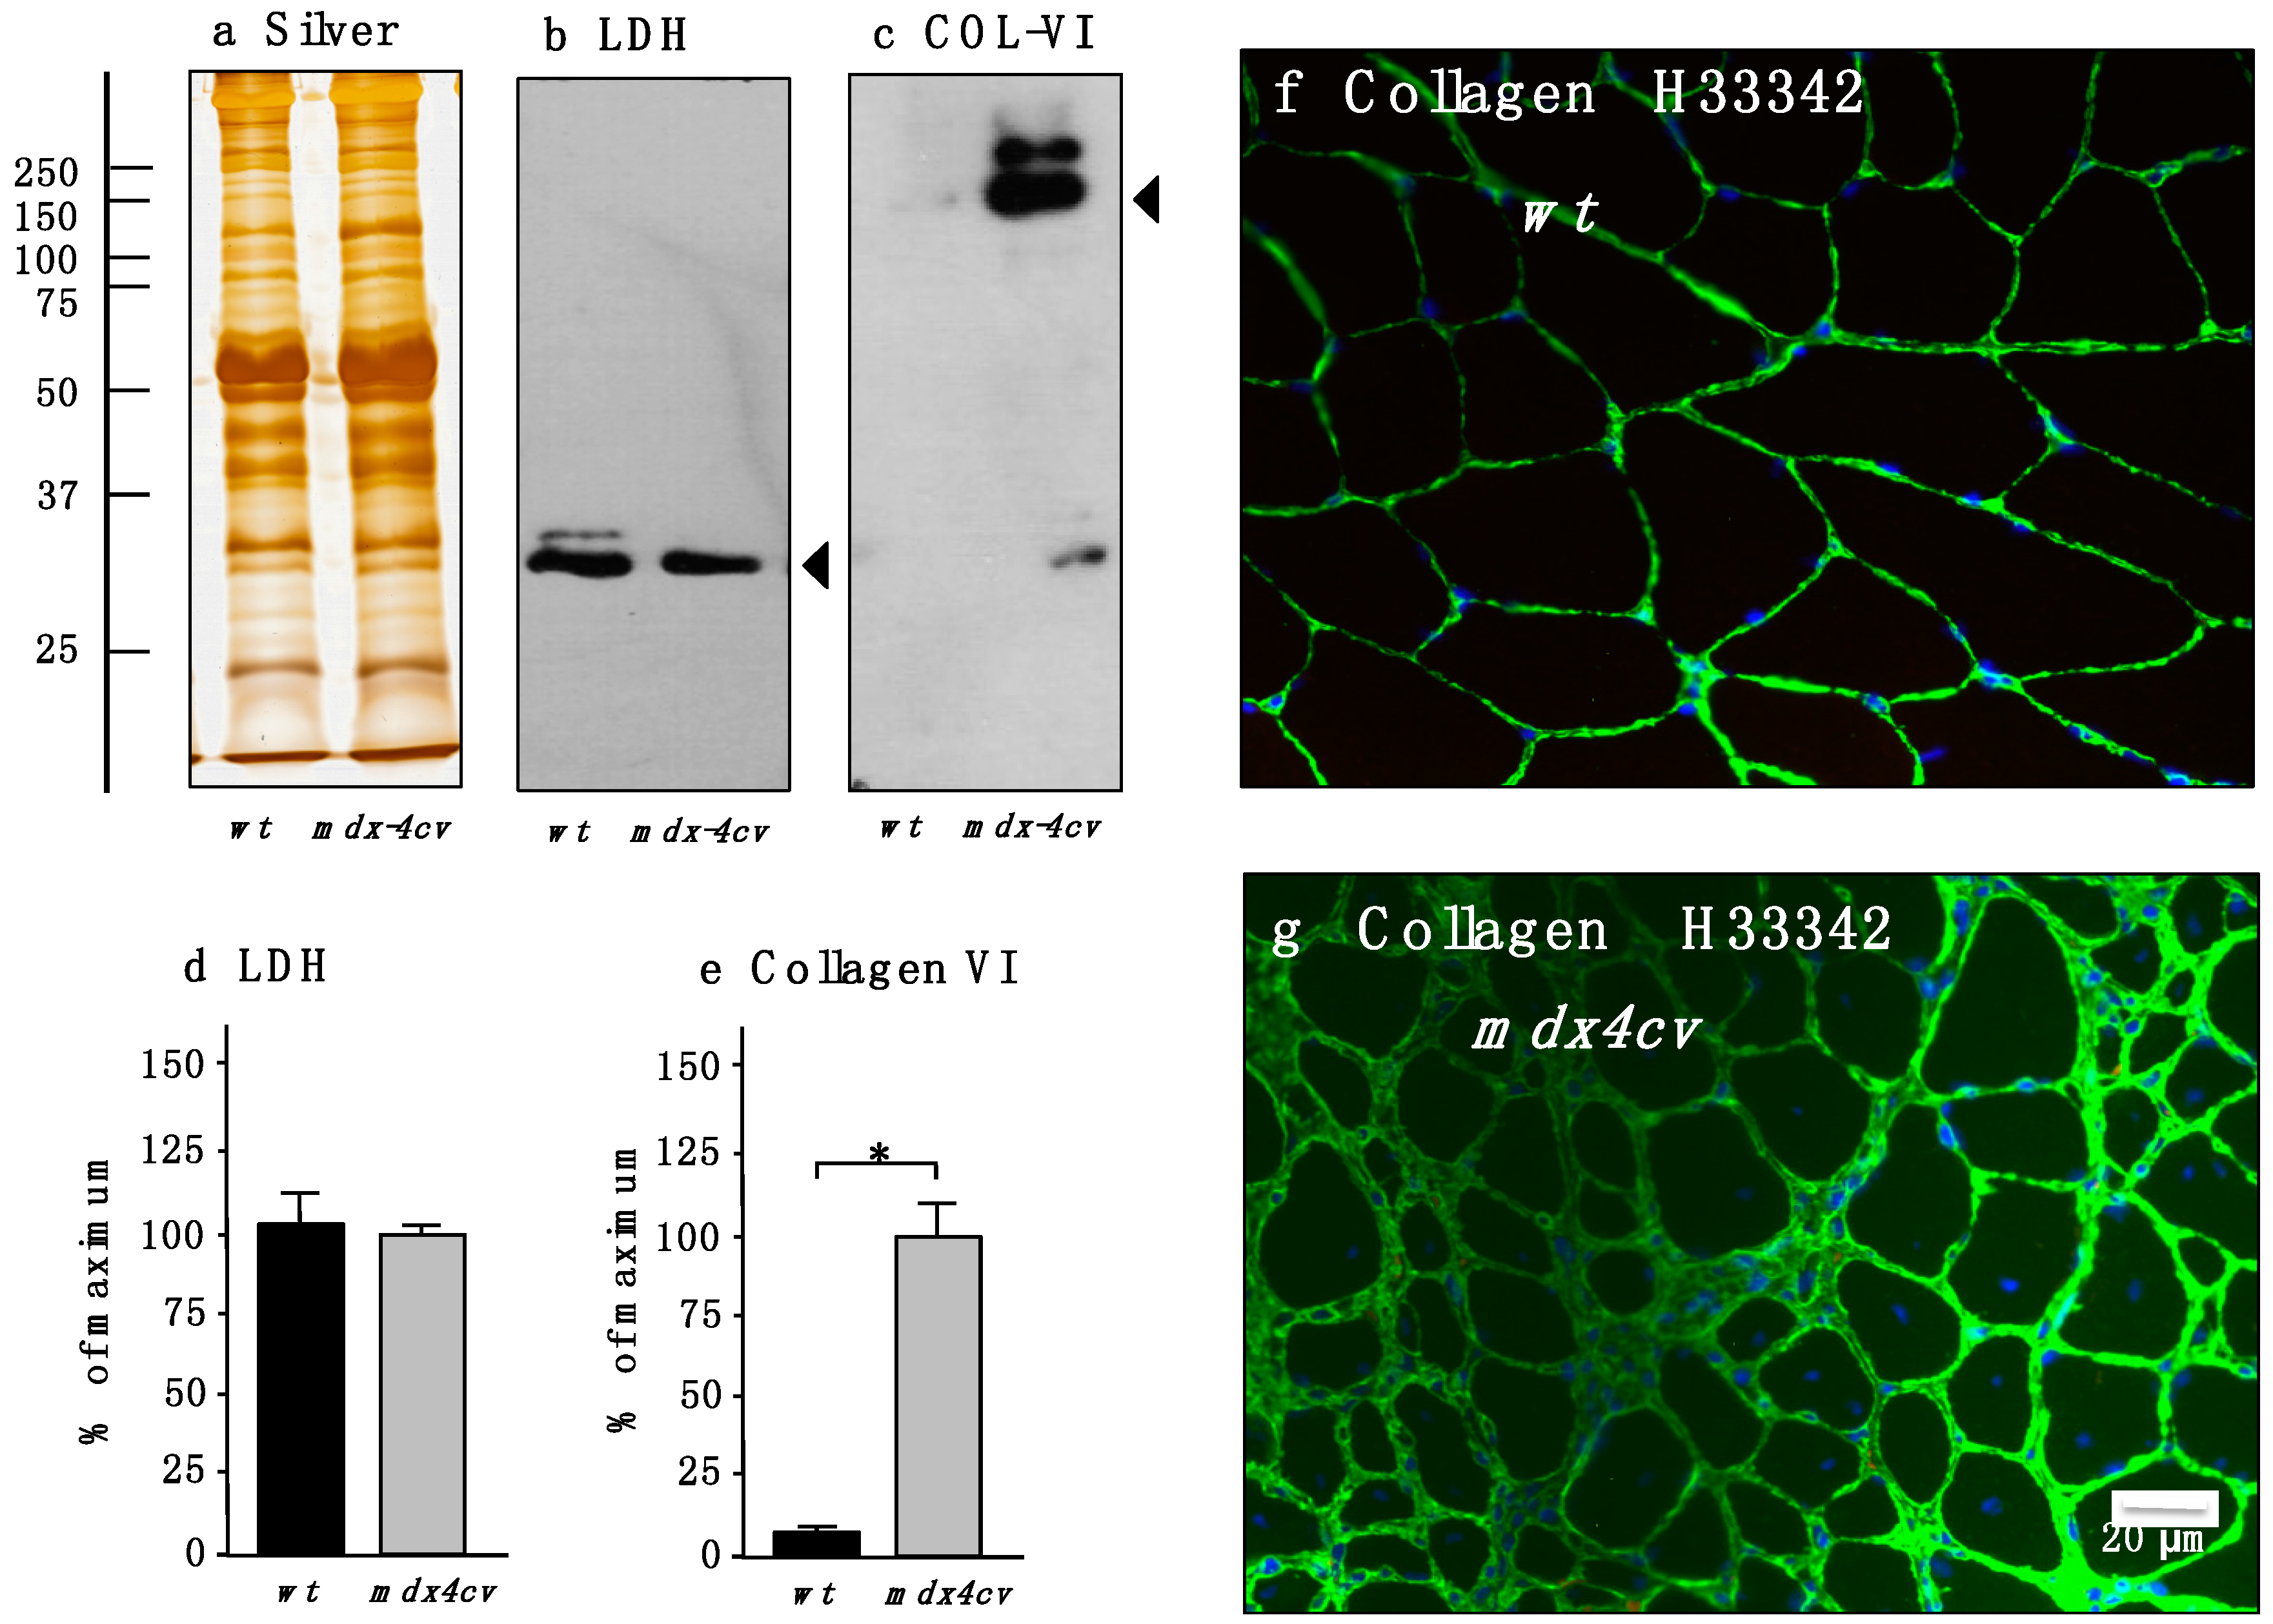
3.4. Verification of Proteomic Changes in Dystrophic mdx-4cv Hind Limb Muscles

In order to independently verify the findings from the proteomic analysis of total tissue extracts from wild-type versus mdx-4cv hind limb muscles, immunofluorescence microscopy and immunoblotting was carried out. The label-free mass spectrometric analysis of crude tissue extracts from mdx-4cv hind limb muscles, presented here, has for the first time identified the full-length Dp427 isoform of the membrane cytoskeletal protein dystrophin in a comparative proteomic study. In contrast to previous mass spectrometric surveys of normal versus dystrophic tissue preparations [20,21], that have not used pre-fractionation methodology or immuno precipitation approaches, this report has enabled the simultaneous evaluation of dystrophin deficiency and secondary downstream changes in the muscle proteome. Figure 2 clearly demonstrates that the mdx-4cv mouse model of X-linked muscular dystrophy exhibits only very few dystrophin-positive revertant fibers [50]. This agrees with the mass spectrometric data presented in Table 1 and the well-established pathobiochemical finding that the almost complete absence of dystrophin is the underlying primary defect in dystrophinopathies [3,72].
Figure 2. Immunofluorescence microscopical localization of dystrophin isoform Dp427 in transverse cryosections from normal wild-type (wt) versus dystrophic mdx-4cv gastrocnemius muscle. Shown is the labeling of the sarcolemma in normal wt muscle using antibodies to dystrophin [71]. In stark contrast, the Dp427 isoform is almost completely absent from mdx-4cv muscle tissue. The arrow indicates a dystrophin-positive revertant fiber, which is extremely rare in the mdx-4cv mouse model of Duchenne muscular dystrophy [50].
Proteomes 03 00298 g002
The immunoblotting survey shown in Figure 3 outlines the comparative analysis of a select number of key proteomic hits listed in Table 1 and Table 2. For loading controls, a silver-stained protein gel and the unchanged abundance of lactate dehydrogenase is presented in Figure 3a,b. The drastic reduction in the cytosolic Ca2+-binding protein parvalbumin was confirmed by immunoblotting (Figure 3c), as well as the general trend of an increased concentration of the intermediate filament protein desmin, the sarcoplasmic reticulum SERCA1 Ca2+-ATPase, the sarcolemmal Na+/K+-ATPase, the microtubulular protein β-tubulin and annexin isoform ANX2 (Figure 3d–h). The statistical evaluation of the increased abundance of desmin and annexin is shown in Figure 3i,j. These findings are in agreement with the proteomic data presented in this report and verify that X-linked muscular dystrophy is associated with impaired ion homeostasis in the cytosol and luminal compartments in muscle fibers, and the compensatory up-regulation of regulatory and stabilizing proteins of the cytoskeletal network.
Figure 3. Comparative immunoblot analysis of normal wild-type (wt) versus dystrophic mdx-4cv hind limb skeletal muscles. Shown is a representative silver-stained gel (a) and immunoblots (bh). Lanes one and two represent total extracts from control wt muscle and dystrophic mdx-4cv skeletal muscle, respectively. Blots were labeled with antibodies to lactate dehydrogenase (LDH) (b); the cytosolic Ca2+-binding protein parvalbumin (PVA) (c); the intermediate filament protein desmin (DES) (d); the fast SERCA1 isoform of the sarcoplasmic reticulum Ca2+-ATPase (e) the α-subunit of the sarcolemmal Na+/K+-ATPase (α-NKA) (f); the microtubular protein β-tubulin (β-TUB) (g) and annexin isoform ANX2 (h). Arrowheads mark the main immuno-labeled protein bands in individual panels. Graphical representations of the immuno-decoration levels for desmin and annexin in normal versus mdx-4cv skeletal muscles are shown in panels (i,j): Student’s t-test, unpaired; n = 4; * p < 0.05.
Proteomes 03 00298 g003
Since myofibrosis is an important clinical feature of Duchenne muscular dystrophy [77] and in order to correlate the loss of dystrophin with the dramatic increase in collagen, as demonstrated here by the label-free mass spectrometric analysis of total mdx-4cv skeletal muscle extracts, the molecular fate of collagen isoform COL-VI was evaluated by immunoblotting and immunofluorescence microscopy. Figure 4 clearly demonstrates an increased abundance of this extracellular matrix protein. In contrast to comparable levels of overall protein and lactate dehydrogenase (Figure 4a,b,d), the concentration of collagen is significantly elevated in Dp427-deficient muscle preparations (Figure 4c,e). Immunofluorescence microscopy agreed with this finding and showed considerably increased labeling of collagen in the interstitial space of muscle fibers in transverse cryosections (Figure 4f,g).
Figure 4. Immunoblot analysis and immunofluorescence microscopical localization of collagen in normal versus dystrophic mdx-4cv gastrocnemius muscle. Shown is a representative silver-stained gel (a) and immunoblots (b,c). Lanes one and two represent total extracts from control wt muscle and dystrophic mdx-4cv skeletal muscle, respectively. Blots were labeled with antibodies to lactate dehydrogenase (LDH) (b) and collagen isoform COL-VI (c). Arrowheads mark the main immuno-labeled protein bands in individual panels. Graphical representations of the immuno-decoration levels for lactate dehydrogenase and collagen in normal versus mdx-4cv skeletal muscles are shown in panels (d,e): Student’s t-test, unpaired; n = 4; * p < 0.05. The immunofluorescence microscopy panels (f,g) show the labeling of the extracellular matrix in normal wt versus mdx gastrocnemius muscle, respectively, using antibodies to collagen COL-VI. In Dp427-deficient mdx-4cv muscle tissue the levels of collagen are greatly increased. Nuclei were stained with the DNA binding dye bis-benzimide Hoechst 33342 (H33342).
Proteomes 03 00298 g004

4. Conclusions

Although Duchenne muscular dystrophy is a monogenic disorder of the neuromuscular system with defined genetic abnormalities and distinct clinical features, the secondary pathobiochemical changes due to the primary loss of the membrane cytoskeletal protein dystrophin are extremely complex. In the past, comparative proteomic studies using total muscle tissue extracts have greatly helped to improve our general understanding of the molecular pathogenesis of dystrophinopathies, but have mostly focused on alterations downstream of the dystrophin-glycoprotein complex. Here, we have tried to address this issue in the field of muscular dystrophy research by employing sensitive label-free mass spectrometry for the unequivocal identification of the full-length Dp427 isoform of dystrophin in total tissue extracts from hind limb homogenates in a comparative study. Dystrophin was found to be the most significantly reduced protein species in the mdx-4cv animal model of dystrophinopathy. This agrees with the very low rate of dystrophin-positive revertant fibers in mdx-4cv skeletal muscles, as confirmed by immunofluorescence microscopy. Since dystrophin was identified by mass spectrometry, the reduction in the Dp427 isoform could then be directly related to secondary changes in other muscle protein families. Muscular dystrophy was shown to be associated with alterations in contractile proteins, molecular chaperones, metabolite transporters, cell signaling proteins, ion handling proteins, and a variety of enzymes. The identified proteome-wide disturbances reflect the high degree of cellular stress, physiological impairments, and metabolic changes in muscular dystrophy, as well as potential compensatory mechanisms to maintain cytoskeletal stability in Dp427-deficient muscle fibers. Importantly, the simultaneous pathoproteomic evaluation of dystrophin and downstream changes in the mdx-4cv mouse model of Duchenne muscular dystrophy revealed considerable increases in markers of myofibrosis, such as collagens, fibronectin, biglycan, asporin, decorin, prolargin, mimecan, and lumican. This is a crucial proteomic finding, since the progressive accumulation of collagen and associated fibrotic changes directly correlate with the loss in motor function in Duchenne patients. This makes certain collagen isoforms and other proteins of the matrisome excellent biomarker candidates for the improved diagnostic and prognostic evaluation of muscular dystrophy-related myofibrosis. A select group of altered muscle proteins, as identified by label-free mass spectrometry in this report, could form the scientific basis for establishing an improved list of robust and muscle-associated biomarkers of dystrophinopathy. These new indicators of secondary changes in muscular dystrophy may be especially useful for the objective monitoring of new therapeutic approaches, such as stem cell therapy, codon read-through approaches, and exon-skipping therapy.

Supplementary Materials

Supplementary File 1

Acknowledgments

Research was supported by a Hume scholarship from Maynooth University and project grants from the Deutsche Duchenne Stiftung aktion benni & co e.V. and Muscular Dystrophy Ireland. The authors thank Caroline Batchelor for help with LC-MS/MS analysis. The Q-Exactive quantitative mass spectrometer was funded under the SFI Research Infrastructure Call 2012 (SFI-12/RI/2346/3) to Sean Doyle and James Carolan (Maynooth University).

Author Contributions

Sandra Murphy designed and performed the main analytical experiments and the mass spectrometric analysis. Dieter Swandulla and Kay Ohlendieck conceived this collaborative study and provided scientific oversight. Margit Zweyer and Rustam R. Mundegar were involved in the maintenance of the mouse colonies and performed the preparation of tissue samples, as well as histochemical analyses and immunofluorescence microscopy. Michael Henry and Paula Meleady provided the detailed analysis of mass spectrometric data. All authors were involved in interpreting of data, as well as the writing and correcting of the manuscript.

Conflicts of Interest

The authors declare no conflict of interest.

References

  1. Tennyson, C.N.; Klamut, H.J.; Worton, R.G. The human dystrophin gene requires 16 hours to be transcribed and is cotranscriptionally spliced. Nat. Genet. 1995, 9, 184–190. [Google Scholar] [CrossRef] [PubMed]
  2. Hoffman, E.P.; Brown, R.H., Jr.; Kunkel, L.M. Dystrophin: The protein product of the Duchenne muscular dystrophy locus. Cell 1987, 51, 919–928. [Google Scholar] [CrossRef]
  3. Muntoni, F.; Torelli, S.; Ferlini, A. Dystrophin and mutations: One gene, several proteins, multiple phenotypes. Lancet Neurol. 2003, 2, 731–740. [Google Scholar] [PubMed]
  4. Koenig, M.; Monaco, A.P.; Kunkel, L.M. The complete sequence of dystrophin predicts a rod-shaped cytoskeletal protein. Cell 1988, 53, 219–228. [Google Scholar] [CrossRef]
  5. Rybakova, I.N.; Patel, J.R.; Ervasti, J.M. The dystrophin complex forms a mechanically strong link between the sarcolemma and costameric actin. J. Cell Biol. 2000, 150, 1209–1214. [Google Scholar] [CrossRef] [PubMed]
  6. Henderson, D.M.; Lin, A.Y.; Thomas, D.D.; Ervasti, J.M. The carboxy-terminal third of dystrophin enhances actin binding activity. J. Mol. Biol. 2012, 416, 414–424. [Google Scholar] [CrossRef] [PubMed]
  7. Campbell, K.P.; Kahl, S.D. Association of dystrophin and an integral membrane glycoprotein. Nature 1989, 338, 259–262. [Google Scholar] [CrossRef] [PubMed]
  8. Yoshida, M.; Ozawa, E. Glycoprotein complex anchoring dystrophin to sarcolemma. J. Biochem. 1990, 108, 748–752. [Google Scholar] [PubMed]
  9. Ervasti, J.M.; Ohlendieck, K.; Kahl, S.D.; Gaver, M.G.; Campbell, K.P. Deficiency of a glycoprotein component of the dystro- phin complex in dystrophic muscle. Nature 1990, 345, 315–319. [Google Scholar] [CrossRef] [PubMed]
  10. Bushby, K.; Finkel, R.; Birnkrant, D.J.; Case, L.E.; Clemens, P.R.; Cripe, L.; Kaul, A.; Kinnett, K.; McDonald, C.; Pandya, S.; et al. Diagnosis and management of Duchenne muscular dystrophy, part 1: Diagnosis, and pharmacological and psychosocial management. Lancet Neurol. 2010, 9, 77–93. [Google Scholar] [CrossRef]
  11. Beggs, A.H.; Hoffman, E.P.; Snyder, J.R.; Arahata, K.; Specht, L.; Shapiro, F.; Angelini, C.; Sugita, H.; Kunkel, L.M. Exploring the molecular basis for variability among patients with Becker muscular dystrophy: Dystrophin gene and protein studies. Am. J. Hum. Genet. 1991, 49, 54–67. [Google Scholar] [PubMed]
  12. Diegoli, M.; Grasso, M.; Favalli, V.; Serio, A.; Gambarin, F.I.; Klersy, C.; Pasotti, M.; Agozzino, E.; Scelsi, L.; Ferlini, A.; et al. Diagnostic work-up and risk stratification in X-linked dilated cardiomyopathies caused by dystrophin defects. J. Am. Coll. Cardiol. 2011, 58, 925–934. [Google Scholar] [CrossRef] [PubMed]
  13. Allen, D.G.; Gervasio, O.L.; Yeung, E.W.; Whitehead, N.P. Calcium and the damage pathways in muscular dystrophy. Can. J. Physiol. Pharmacol. 2010, 88, 83–91. [Google Scholar] [CrossRef] [PubMed]
  14. Shin, J.; Tajrishi, M.M.; Ogura, Y.; Kumar, A. Wasting mechanisms in muscular dystrophy. Int. J. Biochem. Cell Biol. 2013, 45, 2266–2279. [Google Scholar] [CrossRef] [PubMed]
  15. Vallejo-Illarramendi, A.; Toral-Ojeda, I.; Aldanondo, G.; López de Munain, A. Dysregulation of calcium homeostasis in muscular dystrophies. Expert Rev. Mol. Med. 2014, 16, e16. [Google Scholar] [CrossRef] [PubMed]
  16. Ohlendieck, K. Proteomics of skeletal muscle differentiation, neuromuscular disorders and fiber aging. Expert Rev. Proteomics 2010, 7, 283–296. [Google Scholar] [PubMed]
  17. Burniston, J.G.; Hoffman, E.P. Proteomic responses of skeletal and cardiac muscle to exercise. Expert Rev. Proteomics 2011, 8, 361–377. [Google Scholar] [CrossRef] [PubMed]
  18. Ohlendieck, K. Skeletal muscle proteomics: Current approaches, technical challenges and emerging techniques. Skelet. Muscle 2011, 1, 6. [Google Scholar] [CrossRef] [PubMed]
  19. Gelfi, C.; Vasso, M.; Cerretelli, P. Diversity of human skeletal muscle in health and disease: Contribution of proteomics. J. Proteomics 2011, 74, 774–795. [Google Scholar] [CrossRef] [PubMed]
  20. Holland, A.; Carberry, S.; Ohlendieck, K. Proteomics of the dystrophin-glycoprotein complex and dystrophinopathy. Curr. Protein Pept. Sci. 2013, 14, 680–697. [Google Scholar] [CrossRef] [PubMed]
  21. Dowling, P.; Holland, A.; Ohlendieck, K. Mass spectrometry-based identification of muscle-associated and muscle-derived proteomic biomarkers of dystrophinopathies. J. Neuromuscul. Dis. 2014, 1, 15–40. [Google Scholar]
  22. Ge, Y.; Molloy, M.P.; Chamberlain, J.S.; Andrews, P.C. Proteomic analysis of mdx skeletal muscle: Great reduction of adenylate kinase 1 expression and enzymatic activity. Proteomics 2003, 3, 1895–1903. [Google Scholar] [CrossRef] [PubMed]
  23. Doran, P.; Dowling, P.; Lohan, J.; McDonnell, K.; Poetsch, S.; Ohlendieck, K. Subproteomics analysis of Ca2+-binding proteins demonstrates decreased calsequestrin expression in dystrophic mouse skeletal muscle. Eur. J. Biochem. 2004, 271, 3943–3952. [Google Scholar] [PubMed]
  24. Doran, P.; Dowling, P.; Donoghue, P.; Buffini, M.; Ohlendieck, K. Reduced expression of regucalcin in young and aged mdx diaphragm indicates abnormal cytosolic calcium handling in dystrophin-deficient muscle. Biochim. Biophys. Acta 2006, 1764, 773–785. [Google Scholar] [CrossRef] [PubMed]
  25. Carberry, S.; Brinkmeier, H.; Zhang, Y.; Winkler, C.K.; Ohlendieck, K. Comparative proteomic profiling of soleus, extensor digitorum longus, flexor digitorum brevis and interosseus muscle from the mdx mouse model of Duchenne muscular dystrophy. Int. J. Mol. Med. 2013, 32, 544–556. [Google Scholar] [PubMed]
  26. Carberry, S.; Zweyer, M.; Swandulla, D.; Ohlendieck, K. Profiling of age-related changes in the tibialis anterior muscle proteome of the mdx mouse model of dystrophinopathy. J. Biomed. Biotechnol. 2012, 2012, 691641. [Google Scholar] [CrossRef] [PubMed]
  27. Doran, P.; Martin, G.; Dowling, P.; Jockusch, H.; Ohlendieck, K. Proteome analysis of the dystrophin-deficient MDX diaphragm reveals a drastic increase in the heat shock protein cvHSP. Proteomics 2006, 6, 4610–4621. [Google Scholar] [CrossRef] [PubMed]
  28. Doran, P.; Wilton, S.D.; Fletcher, S.; Ohlendieck, K. Proteomic profiling of antisense-induced exon skipping reveals reversal of pathobiochemical abnormalities in dystrophic mdx diaphragm. Proteomics 2009, 9, 671–685. [Google Scholar] [PubMed]
  29. Carberry, S.; Zweyer, M.; Swandulla, D.; Ohlendieck, K. Comparative proteomic analysis of the contractile protein-depleted fraction from normal versus dystrophic skeletal muscle. Anal. Biochem. 2014, 446, 108–115. [Google Scholar] [CrossRef] [PubMed]
  30. Brinkmeier, H.; Ohlendieck, K. Chaperoning heat shock proteins: Proteomic analysis and relevance for normal and dystrophin-deficient muscle. Proteomics Clin. Appl. 2014, 8, 875–895. [Google Scholar] [CrossRef] [PubMed]
  31. Gardan-Salmon, D.; Dixon, J.M.; Lonergan, S.M.; Selsby, J.T. Proteomic assessment of the acute phase of dystrophin deficiency in mdx mice. Eur. J. Appl. Physiol. 2011, 111, 2763–2773. [Google Scholar] [CrossRef] [PubMed]
  32. Matsumura, C.Y.; Menezes de Oliveira, B.; Durbeej, M.; Marques, M.J. Isobaric Tagging-Based Quantification for Proteomic Analysis: A Comparative Study of Spared and Affected Muscles from mdx Mice at the Early Phase of Dystrophy. PLoS ONE 2013, 8, e65831. [Google Scholar] [CrossRef] [PubMed]
  33. Rayavarapu, S.; Coley, W.; Cakir, E.; Jahnke, V.; Takeda, S.; Aoki, Y.; Grodish-Dressman, H.; Jaiswal, J.K.; Hoffman, E.P.; Brown, K.J.; et al. Identification of disease specific pathways using in vivo SILAC proteomics in dystrophin deficient mdx mouse. Mol. Cell. Proteomics 2013, 12, 1061–1073. [Google Scholar] [CrossRef] [PubMed]
  34. Guevel, L.; Lavoie, J.R.; Perez-Iratxeta, C.; Rouger, K.; Dubreil, L.; Feron, M.; Talon, S.; Brand, M.; Megeney, L.A. Quantitative proteomic analysis of dystrophic dog muscle. J. Proteome Res. 2011, 10, 2465–2478. [Google Scholar] [CrossRef] [PubMed]
  35. Carberry, S.; Zweyer, M.; Swandulla, D.; Ohlendieck, K. Proteomics reveals drastic increase of extracellular matrix proteins collagen and dermatopontin in aged mdx diaphragm muscle. Int. J. Mol. Med. 2012, 30, 229–234. [Google Scholar] [PubMed]
  36. Carberry, S.; Zweyer, M.; Swandulla, D.; Ohlendieck, K. Application of fluorescence two-dimensional difference in-gel electrophoresis as a proteomic biomarker discovery tool in muscular dystrophy research. Biology 2013, 2, 1438–1464. [Google Scholar] [CrossRef] [PubMed]
  37. Holland, A.; Dowling, P.; Meleady, P.; Henry, M.; Zweyer, M.; Mundegar, R.R.; Swandulla, D.; Ohlendieck, K. Label-free mass spectrometric analysis of the mdx-4cv diaphragm identifies the matricellular protein periostin as a potential factor involved in dystrophinopathy-related fibrosis. Proteomics 2015, 15, 2318–2331. [Google Scholar] [CrossRef] [PubMed]
  38. Nadarajah, V.D.; van Putten, M.; Chaouch, A.; Garrood, P.; Straub, V.; Lochmüller, H.; Ginjaar, H.B.; Aartsma-Rus, A.M.; van Ommen, G.J.; den Dunnen, J.T.; et al. Serum matrix metalloproteinase-9 (MMP-9) as a biomarker for monitoring disease progression in Duchenne muscular dystrophy (DMD). Neuromuscul. Disord. 2011, 21, 569–578. [Google Scholar] [CrossRef] [PubMed]
  39. Duguez, S.; Duddy, W.; Johnston, H.; Lainé, J.; le Bihan, M.C.; Brown, K.J.; Bigot, A.; Hathout, Y.; Butler-Browne, G.; Partridge, T. Dystrophin deficiency leads to disturbance of LAMP1-vesicle-associated protein secretion. Cell. Mol. Life Sci. 2013, 70, 2159–2174. [Google Scholar] [PubMed]
  40. Martin, C.F.; Hiller, M.; Spitali, P.; Oonk, S.; Dalebout, H.; Palmblad, M.; Chaouch, A.; Guglieri, M.; Straub, V.; Lochmüller, H.; et al. Fibronectin is a serum biomarker for Duchenne muscular dystrophy. Proteomics Clin. Appl. 2014, 8, 269–278. [Google Scholar] [CrossRef] [PubMed]
  41. Hathout, Y.; Marathi, R.L.; Rayavarapu, S.; Zhang, A.; Brown, K.J.; Seol, H.; Gordish-Dressman, H.; Cirak, S.; Bello, L.; Nagaraju, K.; et al. Discovery of serum protein biomarkers in the mdx mouse model and cross-species comparison to Duchenne muscular dystrophy patients. Hum. Mol. Genet. 2014, 23, 6458–69. [Google Scholar] [PubMed]
  42. Ayoglu, B.; Chaouch, A.; Lochmüller, H.; Politano, L.; Bertini, E.; Spitali, P.; Hiller, M.; Niks, E.H.; Gualandi, F.; Pontén, F.; et al. Affinity proteomics within rare diseases: A BIO-NMD study for blood biomarkers of muscular dystrophies. EMBO Mol. Med. 2014, 6, 918–936. [Google Scholar] [CrossRef] [PubMed]
  43. Rouillon, J.; Zocevic, A.; Leger, T.; Garcia, C.; Camadro, J.M.; Udd, B.; Wong, B.; Servais, L.; Voit, T.; Svinartchouk, F. Proteomics profiling of urine reveals specific titin fragments as biomarkers of Duchenne muscular dystrophy. Neuromuscul. Disord. 2014, 24, 563–573. [Google Scholar] [CrossRef] [PubMed]
  44. Yoon, J.H.; Johnson, E.; Xu, R.; Martin, L.T.; Martin, P.T.; Montanaro, F. Comparative proteomic profiling of dystroglycan-associated proteins in wild type, mdx, and Galgt2 transgenic mouse skeletal muscle. J. Proteome Res. 2012, 11, 4413–4424. [Google Scholar] [CrossRef] [PubMed]
  45. Johnson, E.K.; Zhang, L.; Adams, M.E.; Phillips, A.; Freitas, M.A.; Froehner, S.C.; Green-Church, K.B.; Montanaro, F. Proteomic analysis reveals new cardiac-specific dystrophin-associated proteins. PLoS ONE 2012, 7, e43515. [Google Scholar] [CrossRef] [PubMed]
  46. Lewis, C.; Ohlendieck, K. Mass spectrometric identification of dystrophin isoform Dp427 by on-membrane digestion of sarcolemma from skeletal muscle. Anal. Biochem. 2010, 404, 197–203. [Google Scholar] [CrossRef] [PubMed]
  47. Swiderski, K.; Shaffer, S.A.; Gallis, B.; Odom, G.L.; Arnett, A.L.; Scott Edgar, J.; Baum, D.M.; Chee, A.; Naim, T.; Gregorevic, P.; et al. Phosphorylation within the cysteine-rich region of dystrophin enhances its association with β-dystroglycan and identifies a potential novel therapeutic target for skeletal muscle wasting. Hum. Mol. Genet. 2014, 23, 6697–6711. [Google Scholar] [CrossRef] [PubMed]
  48. Brown, K.J.; Marathi, R.; Fiorillo, A.A.; Ciccimaro, E.F.; Sharma, S.; Rowlands, D.S.; Rayavarapu, S.; Nagaraju, K.; Hoffman, E.P.; Hathout, Y. Accurate Quantitation of Dystrophin Protein in Human Skeletal Muscle Using Mass Spectrometry. J. Bioanal. Biomed. 2012, Suppl. 7, 001. [Google Scholar] [CrossRef] [PubMed]
  49. Murphy, S.; Henry, M.; Meleady, P.; Zweyer, M.; Mundegar, R.R.; Swandulla, D.; Ohlendieck, K. Simultaneous pathoproteomic evaluation of the dystrophin-glycoprotein complex and secondary changes in the mdx-4cv mouse model of Duchenne muscular dystrophy. Biology 2015, 4, 397–423. [Google Scholar] [CrossRef] [PubMed]
  50. Danko, I.; Chapman, V.; Wolff, J.A. The frequency of revertants in mdx mouse genetic models for Duchenne muscular dystrophy. Pediatr. Res. 1992, 32, 128–131. [Google Scholar] [CrossRef] [PubMed]
  51. Shin, J.H.; Hakim, C.H.; Zhang, K.; Duan, D. Genotyping mdx, mdx3cv, and mdx4cv mice by primer competition polymerase chain reaction. Muscle Nerve 2011, 43, 283–286. [Google Scholar] [CrossRef] [PubMed]
  52. Chapman, V.M.; Miller, D.R.; Armstrong, D.; Caskey, C.T. Recovery of induced mutations for X chromosome-linked muscular dystrophy in mice. Proc. Natl. Acad. Sci. USA 1989, 86, 1292–1296. [Google Scholar] [CrossRef] [PubMed]
  53. Im, W.B.; Phelps, S.F.; Copen, E.H.; Adams, E.G.; Slightom, J.L.; Chamberlain, J.S. Differential expression of dystrophin isoforms in strains of mdx mice with different mutations. Hum. Mol. Genet. 1996, 5, 1149–1153. [Google Scholar] [CrossRef] [PubMed]
  54. Sicinski, P.; Geng, Y.; Ryder-Cook, A.S.; Barnard, E.A.; Darlison, M.G.; Barnard, P.J. The molecular basis of muscular dystrophy in the mdx mouse: A point mutation. Science 1989, 244, 1578–1580. [Google Scholar] [CrossRef] [PubMed]
  55. Partridge, T.A. The mdx mouse model as a surrogate for Duchenne muscular dystrophy. FEBS J. 2013, 280, 4177–4186. [Google Scholar] [PubMed]
  56. McGreevy, J.W.; Hakim, C.H.; McIntosh, M.A.; Duan, D. Animal models of Duchenne muscular dystrophy: From basic mechanisms to gene therapy. Dis. Model Mech. 2015, 8, 195–213. [Google Scholar] [PubMed]
  57. Judge, L.M.; Haraguchiln, M.; Chamberlain, J.S. Dissecting the signaling and mechanical functions of the dystrophin-glycoprotein complex. J. Cell Sci. 2006, 119, 1537–1546. [Google Scholar] [CrossRef] [PubMed]
  58. Mitrpant, C.; Fletcher, S.; Iversen, P.L.; Wilton, S.D. By-passing the nonsense mutation in the 4 CV mouse model of muscular dystrophy by induced exon skipping. J. Gene Med. 2009, 11, 46–56. [Google Scholar] [CrossRef] [PubMed]
  59. Kimura, E.; Li, S.; Gregorevic, P.; Fall, B.M.; Chamberlain, J.S. Dystrophin delivery to muscles of mdx mice using lentiviral vectors leads to myogenic progenitor targeting and stable gene expression. Mol. Ther. 2010, 18, 206–213. [Google Scholar] [CrossRef] [PubMed]
  60. Holland, A.; Dowling, P.; Zweyer, M.; Swandulla, D.; Henry, M.; Clynes, M.; Ohlendieck, K. Proteomic profiling of cardiomyopathic tissue from the aged mdx model of Duchenne muscular dystrophy reveals a drastic decrease in laminin, nidogen and annexin. Proteomics 2013, 13, 2312–2323. [Google Scholar] [CrossRef] [PubMed]
  61. Staunton, L.; Ohlendieck, K. Mass spectrometric characterization of the sarcoplasmic reticulum from rabbit skeletal muscle by on-membrane digestion. Protein Pept. Lett. 2012, 19, 252–263. [Google Scholar] [CrossRef] [PubMed]
  62. Bradford, M.M. A rapid and sensitive method for the quantitation of microgram quantities of protein utilizing the principle of protein-dye binding. Anal. Biochem. 1976, 72, 248–254. [Google Scholar] [PubMed]
  63. Meleady, P.; Gallagher, M.; Clarke, C.; Henry, M.; Sanchez, N.; Barron, N.; Clynes, M. Impact of miR-7 over-expression on the proteome of Chinese hamster ovary cells. J. Biotechnol. 2012, 160, 251–262. [Google Scholar] [CrossRef] [PubMed]
  64. Meleady, P.; Hoffrogge, R.; Henry, M.; Rupp, O.; Bort, J.H.; Clarke, C.; Brinkrolf, K.; Kelly, S.; Müller, B.; Doolan, P.; et al. Utilization and evaluation of CHO-specific sequence databases for mass spectrometry based proteomics. Biotechnol. Bioeng. 2012, 109, 1386–1394. [Google Scholar] [CrossRef] [PubMed]
  65. Linge, A.; Maurya, P.; Friedrich, K.; Baretton, G.B.; Kelly, S.; Henry, M.; Clynes, M.; Larkin, A.; Meleady, P. Identification and functional validation of RAD23B as a potential protein in human breast cancer progression. J. Proteome Res. 2014, 13, 3212–3222. [Google Scholar] [CrossRef] [PubMed]
  66. Holland, A.; Schmitt-John, T.; Dowling, P.; Meleady, P.; Henry, M.; Clynes, M.; Ohlendieck, K. Intricate effects of primary motor neuronopathy on contractile proteins and metabolic muscle enzymes as revealed by label-free mass spectrometry. Biosci. Rep. 2014, 34, pii: e00119. [Google Scholar] [CrossRef] [PubMed]
  67. PANTHER Gene List Analysis. Available online: http://pantherdb.org/ (accessed on 4 May 2015).
  68. Mi, H.; Muruganujan, A.; Thomas, P.D. PANTHER in 2013: Modeling the evolution of gene function, and other gene attributes, in the context of phylogenetic trees. Nucleic Acids Res. 2013, 41, D377–D386. [Google Scholar] [CrossRef] [PubMed]
  69. STRING Functional Protein Association Network. Available online: http://string-db.org/ (accessed on 3 February 2015).
  70. Franceschini, A.; Szklarczyk, D.; Frankild, S.; Kuhn, M.; Simonovic, M.; Roth, A.; Lin, J.; Minguez, P.; Bork, P.; von Mering, C.; et al. STRING v9.1: Protein-protein interaction networks, with increased coverage and integration. Nucleic Acids Res. 2013, 41, D808–D815. [Google Scholar] [CrossRef] [PubMed]
  71. Mundegar, R.R.; Franke, E.; Schäfer, R.; Zweyer, M.; Wernig, A. Reduction of high background staining by heating unfixed mouse skeletal muscle tissue sections allows for detection of thermostable antigens with murine monoclonal antibodies. J. Histochem. Cytochem. 2008, 56, 969–975. [Google Scholar] [CrossRef] [PubMed]
  72. Guiraud, S.; Aartsma-Rus, A.; Vieira, N.M.; Davies, K.E.; van Ommen, G.J.; Kunkel, L.M. The Pathogenesis and Therapy of Muscular Dystrophies. Annu. Rev. Genomics Hum. Genet. 2015, 16, 281–308. [Google Scholar] [CrossRef] [PubMed]
  73. Bonilla, E.; Samitt, C.E.; Miranda, A.F.; Hays, A.P.; Salviati, G.; DiMauro, S.; Kunkel, L.M.; Hoffman, E.P.; Rowland, L.P. Duchenne muscular dystrophy: Deficiency of dystrophin at the muscle cell surface. Cell 1988, 54, 447–452. [Google Scholar] [PubMed]
  74. Zhou, L.; Lu, H. Targeting fibrosis in Duchenne muscular dystrophy. J. Neuropathol. Exp. Neurol. 2010, 69, 771–776. [Google Scholar] [CrossRef] [PubMed]
  75. Duddy, W.; Duguez, S.; Johnston, H.; Cohen, T.V.; Phadke, A.; Gordish-Dressman, H.; Nagaraju, K.; Gnocchi, V.; Low, S.; Partridge, T. Muscular dystrophy in the mdx mouse is a severe myopathy compounded by hypotrophy, hypertrophy and hyperplasia. Skelet. Muscle 2015, 5, 16. [Google Scholar] [CrossRef] [PubMed]
  76. Holland, A.; Murphy, S.; Dowling, D.; Ohlendieck, K. Pathoproteomic profiling of the skeletal muscle matrisome in dystrophinopathy-associated myofibrosis. Proteomics 2015. [Google Scholar] [CrossRef] [PubMed]
  77. Kharraz, Y.; Guerra, J.; Pessina, P.; Serrano, A.L.; Muñoz-Cánoves, P. Understanding the process of fibrosis in Duchenne muscular dystrophy. BioMed Res. Int. 2014, 2014, 965631. [Google Scholar] [CrossRef] [PubMed]
  78. Alvarez, K.; Fadic, R.; Brandan, E. Augmented synthesis and differential localization of heparan sulfate proteoglycans in Duchenne muscular dystrophy. J. Cell. Biochem. 2002, 85, 703–713. [Google Scholar] [CrossRef] [PubMed]
  79. Cáceres, S.; Cuellar, C.; Casar, J.C.; Garrido, J.; Schaefer, L.; Kresse, H.; Brandan, E. Synthesis of proteoglycans is augmented in dystrophic mdx mouse skeletal muscle. Eur. J. Cell Biol. 2000, 79, 173–181. [Google Scholar] [CrossRef]
  80. Zanotti, S.; Negri, T.; Cappelletti, C.; Bernasconi, P.; Canioni, E.; di Blasi, C.; Pegoraro, E.; Angelini, C.; Ciscato, P.; Prelle, A.; et al. Decorin and biglycan expression is differentially altered in several muscular dystrophies. Brain 2005, 128, 2546–2555. [Google Scholar] [CrossRef] [PubMed]
  81. Fadic, R.; Mezzano, V.; Alvarez, K.; Cabrera, D.; Holmgren, J.; Brandan, E. Increase in decorin and biglycan in Duchenne Muscular Dystrophy: Role of fibroblasts as cell source of these proteoglycans in the disease. J. Cell. Mol. Med. 2006, 10, 758–769. [Google Scholar] [CrossRef] [PubMed]
  82. Klingler, W.; Jurkat-Rott, K.; Lehmann-Horn, F.; Schleip, R. The role of fibrosis in Duchenne muscular dystrophy. Acta Myol. 2012, 31, 184–195. [Google Scholar] [PubMed]
  83. Desguerre, I.; Mayer, M.; Leturcq, F.; Barbet, J.P.; Gherardi, R.K.; Christov, C. Endomysial fibrosis in Duchenne muscular dystrophy: A marker of poor outcome associated with macrophage alternative activation. J. Neuropathol. Exp. Neurol. 2009, 68, 762–773. [Google Scholar] [CrossRef]
  84. Zanotti, S.; Saredi, S.; Ruggieri, A.; Fabbri, M.; Blasevich, F.; Romaggi, S.; Morandi, L.; Mora, M. Altered extracellular matrix transcript expression and protein modulation in primary Duchenne muscular dystrophy myotubes. Matrix Biol. 2007, 26, 615–624. [Google Scholar] [CrossRef] [PubMed]
  85. Zanotti, S.; Gibertini, S.; Mora, M. Altered production of extra-cellular matrix components by muscle-derived Duchenne muscular dystrophy fibroblasts before and after TGF-beta1 treatment. Cell Tissue Res. 2010, 339, 397–410. [Google Scholar] [CrossRef] [PubMed]
  86. Marshall, P.A.; Williams, P.E.; Goldspink, G. Accumulation of collagen and altered fiber-type ratios as indicators of abnormal muscle gene expression in the mdx dystrophic mouse. Muscle Nerve 1989, 12, 528–537. [Google Scholar] [CrossRef] [PubMed]
  87. Goldspink, G.; Fernandes, K.; Williams, P.E.; Wells, D.J. Age-related changes in collagen gene expression in the muscles of mdx dystrophic and normal mice. Neuromuscul. Disord. 1994, 4, 183–191. [Google Scholar] [CrossRef]
  88. Trensz, F.; Haroun, S.; Cloutier, A.; Richter, M.V.; Grenier, G. A muscle resident cell population promotes fibrosis in hindlimb skeletal muscles of mdx mice through the Wnt canonical pathway. Am. J. Physiol. Cell Physiol. 2010, 299, C939–C947. [Google Scholar] [CrossRef] [PubMed]
  89. Lessa, T.B.; de Abreu, D.K.; Rodrigues, M.N.; Brólio, M.P.; Miglino, M.A.; Ambrósio, C.E. Morphological and ultrastructural evaluation of the golden retriever muscular dystrophy trachea, lungs, and diaphragm muscle. Microsc. Res. Tech. 2014, 77, 857–861. [Google Scholar] [CrossRef] [PubMed]
  90. Holland, A.; Ohlendieck, K. Comparative Proteomics for Studying Muscular Dystrophy: Intrinsic Biological and Analytical Issues Associated with the Systematic Utilization of Tissue Specimens. J. Proteomics Bioinform. 2014, S10. in press. [Google Scholar] [CrossRef]
  91. Gelfi, C.; Viganò, A.; de Palma, S.; Ripamonti, M.; Begum, S.; Cerretelli, P.; Wait, R. 2-D protein maps of rat gastrocnemius and soleus muscles: A tool for muscle plasticity assessment. Proteomics 2006, 6, 321–340. [Google Scholar] [CrossRef]
  92. Drexler, H.C.; Ruhs, A.; Konzer, A.; Mendler, L.; Bruckskotten, M.; Looso, M.; Günther, S.; Boettger, T.; Krüger, M.; Braun, T. On marathons and Sprints: An integrated quantitative proteomics and transcriptomics analysis of differences between slow and fast muscle fibers. Mol. Cell. Proteomics 2012, 11, M111.010801. [Google Scholar] [CrossRef] [PubMed]
  93. Burniston, J.G.; Connolly, J.; Kainulainen, H.; Britton, S.L.; Koch, L.G. Label-free profiling of skeletal muscle using high-definition mass spectrometry. Proteomics 2014, 14, 2339–2344. [Google Scholar] [CrossRef] [PubMed]
  94. Murgia, M.; Nagaraj, N.; Deshmukh, A.S.; Zeiler, M.; Cancellara, P.; Moretti, I.; Reggiani, C.; Schiaffino, S.; Mann, M. Single muscle fiber proteomics reveals unexpected mitochondrial specialization. EMBO Rep. 2015, 16, 387–395. [Google Scholar] [CrossRef] [PubMed]
  95. Deshmukh, A.S.; Murgia, M.; Nagaraja, N.; Treebak, J.T.; Cox, J.; Mann, M. Deep proteomics of mouse skeletal muscle enables quantitation of protein isoforms, metabolic pathways and transcription factors. Mol. Cell. Proteomics 2015, 14, 841–853. [Google Scholar] [CrossRef] [PubMed]
  96. Ohlendieck, K.; Campbell, K.P. Dystrophin-associated proteins are greatly reduced in skeletal muscle from mdx mice. J. Cell Biol. 1991, 115, 1685–1694. [Google Scholar] [CrossRef] [PubMed]
  97. Ohlendieck, K.; Matsumura, K.; Ionasescu, V.V.; Towbin, J.A.; Bosch, E.P.; Weinstein, S.L.; Sernett, S.W.; Campbell, K.P. Duchenne muscular dystrophy: Deficiency of dystrophin-associated proteins in the sarcolemma. Neurology 1993, 43, 795–800. [Google Scholar] [CrossRef] [PubMed]
  98. Ohlendieck, K. Proteomic identification of biomarkers of skeletal muscle disorders. Biomark. Med. 2013, 7, 169–186. [Google Scholar] [CrossRef] [PubMed]
  99. Donoghue, P.; Doran, P.; Wynne, K.; Pedersen, K.; Dunn, M.J.; Ohlendieck, K. Proteomic profiling of chronic low-frequency stimulated fast muscle. Proteomics 2007, 7, 3417–3430. [Google Scholar] [CrossRef] [PubMed]
  100. Malik, Z.A.; Cobley, J.N.; Morton, J.P.; Close, G.L.; Edwards, B.J.; Koch, L.G.; Britton, S.L.; Burniston, J.G. Label-Free LC-MS Profiling of Skeletal Muscle Reveals Heart-Type Fatty Acid Binding Protein as a Candidate Biomarker of Aerobic Capacity. Proteomes 2013, 1, 290–308. [Google Scholar] [CrossRef] [PubMed]
  101. Holland, A.; Ohlendieck, K. Proteomic profiling of the contractile apparatus from skeletal muscle. Expert Rev. Proteomics 2013, 10, 239–257. [Google Scholar] [CrossRef] [PubMed]
  102. Holland, A.; Henry, M.; Meleady, P.; Winkler, C.K.; Krautwald, M.; Brinkmeier, H.; Ohlendieck, K. Comparative label-free mass spectrometric analysis of mildly versus severely affected mdx mouse skeletal muscles identifies annexin, lamin and vimentin as universal dystrophic markers. Molecules 2015, 20, 11317–11344. [Google Scholar] [CrossRef] [PubMed]
  103. Cai, L.; Fritz, D.; Stefanovic, L.; Stefanovic, B. Nonmuscle myosin-dependent synthesis of type I collagen. J. Mol. Biol. 2010, 401, 564–578. [Google Scholar] [CrossRef] [PubMed]
  104. Lieber, R.L.; Ward, S.R. Cellular mechanisms of tissue fibrosis. 4. Structural and functional consequences of skeletal muscle fibrosis. Am. J. Physiol. Cell Physiol. 2013, 305, C241–C252. [Google Scholar] [CrossRef] [PubMed]
  105. Vidal, B.; Serrano, A.L.; Tjwa, M.; Suelves, M.; Ardite, E.; de Mori, R.; Baeza-Raja, B.; Martínez de Lagrán, M.; Lafuste, P.; Ruiz-Bonilla, V.; et al. Fibrinogen drives dystrophic muscle fibrosis via a TGFbeta/alternative macrophage activation pathway. Genes Dev. 2008, 22, 1747–1752. [Google Scholar] [CrossRef] [PubMed]
  106. Bizzarro, V.; Petrella, A.; Parente, L. Annexin A1: Novel roles in skeletal muscle biology. J. Cell. Physiol. 2012, 227, 3007–3015. [Google Scholar] [CrossRef] [PubMed]
  107. Vontzalidis, A.; Terzis, G.; Manta, P. Increased dysferlin expression in Duchenne muscular dystrophy. Anal. Quant. Cytopathol. Histpathol. 2014, 36, 15–22. [Google Scholar] [PubMed]
  108. Jonigk, D.; Al-Omari, M.; Maegel, L.; Müller, M.; Izykowski, N.; Hong, J.; Hong, K.; Kim, S.H.; Dorsch, M.; Mahadeva, R.; et al. Anti-inflammatory and immunomodulatory properties of α1-antitrypsin without inhibition of elastase. Proc. Natl. Acad. Sci. USA 2013, 110, 15007–15012. [Google Scholar] [CrossRef] [PubMed]
  109. Meyer, L.C.; Wright, N.T. Structure of giant muscle proteins. Front. Physiol. 2013, 4, 368. [Google Scholar] [CrossRef] [PubMed]
  110. Murray, B.E.; Froemming, G.R.; Maguire, P.B.; Ohlendieck, K. Excitation-contraction-relaxation cycle: Role of Ca2+-regulatory membrane proteins in normal, stimulated and pathological skeletal muscle (review). Int. J. Mol. Med. 1998, 1, 677–687. [Google Scholar] [CrossRef] [PubMed]
  111. Dunn, J.F.; Burton, K.A.; Dauncey, M.J. Ouabain sensitive Na+/K+-ATPase content is elevated in mdx mice: Implications for the regulation of ions in dystrophic muscle. J. Neurol. Sci. 1995, 133, 11–15. [Google Scholar] [CrossRef]

