A Microsomal Proteomics View of H2O2- and ABA-Dependent Responses


1
Cambridge Centre for Proteomics, Cambridge Systems Biology Centre, Department of Biochemistry, University of Cambridge Tennis Court Road, Cambridge CB2 1QR, UK
2
Biological and Environmental Sciences & Engineering Division, King Abdullah University of Science and Technology, Thuwal 23955-6900, Saudi Arabia
3
HM. Clause, rue Louis Saillant, Z.I. La Motte, BP83, 26802 Portes-lès-Valence, France
4
Department of Chemistry, Biology & Biotechnology, University of Perugia, Borgo XX giugno 74, 06121 Perugia, Italy
5
Laboratoire de Physiologie Cellulaire et Végétale, Université Grenoble Alpes, CEA/BIG, 17, avenue des Martyrs, 38054 Grenoble, France
*
Author to whom correspondence should be addressed.
†
These authors contributed equally to this work.
Proteomes 2017, 5(3), 22; https://doi.org/10.3390/proteomes5030022
Submission received: 18 May 2017
/
Revised: 28 July 2017
/
Accepted: 16 August 2017
/
Published: 18 August 2017
(This article belongs to the Special Issue Plant Proteomics 2017)
Abstract
:The plant hormone abscisic acid (ABA) modulates a number of plant developmental processes and responses to stress. In planta, ABA has been shown to induce reactive oxygen species (ROS) production through the action of plasma membrane-associated nicotinamide adenine dinucleotide phosphate (NADPH)-oxidases. Although quantitative proteomics studies have been performed to identify ABA- or hydrogen peroxide (H2O2)-dependent proteins, little is known about the ABA- and H2O2-dependent microsomal proteome changes. Here, we examined the effect of 50 µM of either H2O2 or ABA on the Arabidopsis microsomal proteome using tandem mass spectrometry and identified 86 specifically H2O2-dependent, and 52 specifically ABA-dependent proteins that are differentially expressed. We observed differential accumulation of proteins involved in the tricarboxylic acid (TCA) cycle notably in response to H2O2. Of these, aconitase 3 responded to both H2O2 and ABA. Additionally, over 30 proteins linked to RNA biology responded significantly to both treatments. Gene ontology categories such as ‘response to stress’ and ‘transport’ were enriched, suggesting that H2O2 or ABA directly and/or indirectly cause complex and partly overlapping cellular responses. Data are available via ProteomeXchange with identifier PXD006513.
1. Introduction
Plants, much like animals, are susceptible to oxidative damage by reactive oxygen species (ROS). The production of ROS, and in particular hydrogen peroxide (H2O2), increases during exposure to abiotic stress [1,2,3] and pathogen infection [4]. In pathogen infections, suppression of ascorbate peroxidase and catalase during the hypersensitive response enhances pathogen-induced programmed cell death [4]. The mitochondrial electron transport chain also synthesises a significant amount of ROS, mainly in the form of superoxide [5] that can cause oxidative stress [6,7]. Previous studies have shown that the oxidative stress imposed by H2O2 is a potent inhibitor of tricarboxylic acid (TCA) cycle enzymes such as citrate synthase [8], aconitase, and succinyl CoA ligase [9,10,11]. However, at low concentrations, H2O2 functions as a stress signal [12,13].
It has been demonstrated that ROS production is required for abscisic acid (ABA) signal transduction in guard cells [14,15]. In the guard cells, ABA is perceived by PYRABACTIN resistance (PYR)/PYR-Like 1/Regulatory components of ABA receptors (RCAR) [16,17], which in turn induce the production of ROS including H2O2, by nicotinamide adenine dinucleotide phosphate (NADPH) -oxidase [18,19]. ABA also induces stomatal closure but interestingly, treating the guard cells of ABA-insensitive mutants, abi1-1, with ABA did not induce ROS production but activation of hyperpolarised-activated Ca2+ (ICa) channels and the induction of stomatal closure by H2O2, suggesting that abi1-1 disrupts ABA signalling between ABA reception and ROS production [20]. Besides, ABA regulates many plant developmental processes and induces increased tolerance to different stresses such as drought, salinity and low temperature [21]. ABA-induced ROS in the mitochondria of root tip cells operates as retrograde signal that regulate meristem activity in Arabidopsis [22]. In maize (Zea mays) leaves, water stress-induced ABA accumulation has been detected to elicit an increased production of H2O2 [23,24]. Also, in rice (Oryza sativa) seedlings, exogenous ABA has been observed to increase H2O2 content in leaves grown under potassium sufficient conditions [25].
Despite the considerable body of information on role of ABA in stress responses, the post-translational molecular targets at the microsomal level and particularly their relation with H2O2 is yet to be properly understood. Therefore, we set to find out whether H2O2 and ABA can induce a common response at the microsomal proteome level. To do this, downstream microsomal protein changes were investigated using label-free quantitative mass spectrometry analysis. Further, to find out whether ABA induces H2O2 production or vice versa, we tested for H2O2 production upon ABA treatment of Arabidopsis thaliana ecotype Columbia-0 cell suspension cultures or ABA production upon H2O2 treatment. In this study we showed that H2O2 and ABA have common and independent responses. The former is however, not surprising, as ABA has previously been shown to induce production of H2O2, thus the common response suggests an H2O2-dependent response, which can also be elicited via ABA.
2. Materials and Methods
2.1. Treatments of Arabidopsis Cell Suspension Culture
Cells derived from Arabidopsis thaliana (ecotype Columbia-0) roots were grown in Gamborg’s B5 basal salt mixture (Sigma-Aldrich, St. Louis, MO, USA), as described in [26,27]. At Day 7 post-subculturing, three biological replicate flasks containing cells were treated with 50 μM ABA or 50 μM H2O2 for 0 min (mock treatment), 5 min and 20 min. Cells were then harvested by draining off the media using a Stericup® filter unit (Millipore, Billerica, MA, USA), immediately flash frozen in liquid nitrogen, and stored at −140 °C until further use.
2.2. Microsomal Protein Isolation
Approximately 1 g of cells was ground to a fine powder in liquid nitrogen and subjected to microsomal isolation, as described in [28]. The powder was incubated in a sucrose buffer (50 mM Tris(hydroxymethyl)aminomethane (pH 8.0), 2 mM ethylenediaminetetraacetic acid (EDTA), 2 mM dithiothreitol (DTT), 0.25 M sucrose and 1× protease inhibitor cocktail tablet (Sigma-Aldrich, St. Louis, MO, USA)) and centrifuged at 8000× g for 15 min. The supernatant was subjected to ultracentrifugation using an Optima™ L-100K ultracentrifuge (Beckman Coulter, Brea, CA, USA) at 100,000× g for 1 h. The supernatant, representing the cytosolic fraction, was pipetted out. The pellet, the microsomal fraction, at the bottom of the tube, was washed once in sucrose buffer and centrifuged at 100,000× g for 1 h. The microsomal fraction corresponding to the final pellet was suspended in sucrose buffer, aliquoted into separate tubes and either used immediately or stored at −80 °C.
2.3. Trypsin Digestion and Protein Identification by Tandem Mass Spectrometry
Approximately 0.2 mg of total microsomal protein extract was reduced with 5 mM DTT for 2 h at 37 °C and cooled. The sample was then alkylated with 14 mM iodoacetamide for 30 min at room temperature in the dark. Unreacted iodoacetamide was quenched by increasing DTT concentration to 10 mM and incubated for 15 min at room temperature in the dark. Proteins were incubated at 50:1 ratio with sequencing-grade modified trypsin (Promega, Madison, WI, USA) overnight at 37 °C with gentle agitation. Protein digestion was stopped by acidification of the mixture to pH 2.0 with trichloroacetic acid. Peptides were desalted using Sep-Pak Vac tC18 100 mg cartridges (Waters, Milford, MA), as described previously [27]. After desalting, peptides were re-suspended in 5% (v/v) acetonitrile and 0.1% (v/v) formic acid and analysed by the LTQ-Orbitrap Velos mass spectrometer (Thermo-Scientific, Bremen, Germany) coupled with a nanoelectrospray ion source (Proxeon Biosystems, Odense, Denmark) for nano-liquid chromatography tandem mass spectrometry (LC-MS/MS) analyses as described in [29]. Five microlitres of the peptide mixtures was injected onto a 50 mm long × 0.3 mm Magic C18AQ (Michrom) column. A spray voltage of 1500 V was applied and the MS scan range used was m/z 350 to 1600. The top 10 precursor ions were selected in the MS scan by the Orbitrap with a resolution r = 60,000 for fragmentation in the linear ion trap using collision-induced dissociation. Normalised collision-induced dissociation was set at 35.0 and spectra were submitted to a local MASCOT (Matrix Science, London, UK) server and searched against Arabidopsis in the Arabidopsis Information Resource (TAIR, Release 10), with a precursor mass tolerance of 10 ppm, a fragment ion mass tolerance of 0.6 Da, and strict trypsin specificity allowing up to one missed cleavage. Carbamidomethyl modification on cysteine residues was selected as fixed modification, and oxidation of methionine residues as variable modification. Identified proteins were further validated with Scaffold version 4.0.4 (Proteome Software, Portland, OR, USA). Identified proteins were considered positive with a molecular weight search (MOWSE) score ≥32, number of peptides ≥2, a 95% protein and peptide probability, and a false discovery rate (FDR) ≤1%. Label-free quantitative analysis was performed using spectral counts with Scaffold software. Proteins were deemed responsive to treatment when present in at least two replicates with a fold change (FC) greater or equal to |±2|, verified by Student t-test (p-value ≤ 0.05) in comparison to the mock-treated samples. All proteomics methods are extensively detailed elsewhere [26,29,30,31].
2.4. Intracellular ROS Assay and ABA Measurements
Cellular ROS levels were measured using OxiSelect™ intracellular ROS assay kit green fluorescence (Cambridge Bioscience, Cambridge, UK) after 20 min of 50 μM ABA treatment. The procedure used was according to the manufacturer’s protocol. ABA contents in samples treated with 50 μM H2O2 for 5 and 20 min were measured using Phytodetek® immunoassay kit for ABA (Agdia, Elkhart, IN, USA) according to the manufacturer’s instructions.
2.5. Bioinformatic Analyses
The gene ontology (GO) analysis toolkit in the database AgriGO [32] was used for the detection of enriched cellular components, biological processes and molecular functions.
3. Results
To gain insight on the microsomal cellular responses to H2O2 and ABA, a comparative proteomic analysis was undertaken. Microsomal proteins were isolated from Arabidopsis cell suspension cultures pre-treated with 50 µM of either H2O2 or ABA for 5 min or 20 min, digested with trypsin and analysed by MS/MS. Data was processed with MASCOT and Scaffold for identification and label-free quantitation. A total of 906 proteins from the enriched samples were identified (Table S1). Of these, 86 proteins were significantly (p ≤ 0.05) responsive to H2O2 treatment (Table 1) and 52 proteins to ABA treatment (Table 2). A total of 21 responsive proteins were common to both ABA and H2O2 treatments and majority of the proteins displayed similar response signatures (Table 3).
3.1. H2O2-Responsive Microsomal Proteins
Of the 86 H2O2-dependent significantly changing proteins, 24 proteins increased and 42 proteins decreased in abundance at 5 min, while, 38 proteins increased and 18 proteins decreased in abundance at 20 min. These proteins were classified into 12 major functional categories [31] (Table 1, in depth detail in Table S2). The most represented functional categories include transporters (17%), energy (15%) and protein synthesis (14%) (Table 1). Gene ontology (GO) analysis of the H2O2 responsive proteins revealed enrichment in biological processes such as ‘cellular process’, ‘metabolic process’, ‘response to stress’ and ‘transport’ (Table S2). In addition, enriched molecular function categories included ‘structural molecule activity’, ‘transporter activity’ and ‘oxidoreductase activity’ (Table S2).
Further, we performed metabolic pathway analyses using the Kyoto Encyclopedia of Genes and Genomes (KEGG) database to find out if any pathways were represented. The ‘purine metabolism’ (13 proteins), ‘thiamine biosynthesis’ (11 proteins), and ‘citrate cycle (TCA cycle)’ (six proteins) (Table S2) were the most represented. The abundance of five of the six proteins associated with the TCA cycle increased, particularly at 20 min after H2O2 treatment (Figure 1). The responsive proteins included pyruvate dehydrogenase (AT1G24180), an essential precursor that links glycolysis to the TCA cycle, citrate synthase (AT2G44350), aconitase 3 (AT2G05710), isocitrate dehydrogenase (AT1G65930), succinyl-CoA ligase, alpha subunit (AT5G08300), and ATP citrate lyase/succinyl-CoA synthetase (AT2G20420), an enzyme that cleaves citrate to oxaloacetate and acetyl CoA in the presence of ATP and CoA, and is implicated in carbohydrate metabolism and production of fatty acids (Table 1; Figure 1). Citrate synthase catalyses the first committed step in the TCA cycle, and has been shown to decrease in activity by 54% upon oxidation by H2O2 [8]. Site-directed mutagenesis of six cysteine residues of citrate synthase showed that the mutant proteins could convert acetyl CoA to oxaloacetate with decreased efficiencies compared to the unmodified citrate synthase. The Cys108Ser and Cys325Ser had their activities decreased by 98%, suggesting that the Cys108 and Cys325 are important for citrate synthase activity. These two nearly inactive forms showed high insensitivity to H2O2, while other mutants just like the unmodified citrate synthase had decreased activities upon H2O2 treatment [8]. Similar to the observed change in citrate synthase upon H2O2 treatment [8], we observed citrate synthase together with pyruvate dehydrogenase significantly decreasing in abundance, particularly 20 min after treatment. Furthermore, it has been shown that pyruvate dehydrogenase and the TCA enzymes, including citrate synthase and aconitase, are sensitive to H2O2 [9]. Of these, aconitase is the most sensitive to the H2O2 effect [9]. Aconitase is one of the five enzymes that exerted the most influence on controlling the TCA, with a control coefficient of 0.964 (the control coefficient is the measure of the ratio of relative change in flux and the relative change in enzyme amount [33]), the second highest after malate dehydrogenase (1.76) [34]. Other enzymes identified that changed in response to H2O2 had a lower control coefficient; for example citrate synthase −0.4, isocitrate dehydrogenase −0.123 and succinyl CoA ligase 0.0008 [34]. Aconitase converts citrate to isocitrate and contains a Fe-S cluster that is one of the primary target sites for ROS effect [35]. In animals, aconitase activity is suppressed by treatment with 50 μM H2O2, that in turn causes reduced TCA cycle activity in the cardiac cells [36]. In plants, aconitase affects superoxide dismutase transcription, and has been implicated in regulating resistance to oxidative stress, cell death and salt stress in Arabidopsis and Nicotiana benthamiana [37]. This phenomenal role of aconitase in regulating oxidative stress was also supported by our data, in which the abundance of aconitase increased in response to H2O2 as well as ABA (Table 2). The latter may have been an ABA-dependent response or potentially an ABA-dependent H2O2 response. Aconitase has also been observed to increase in abundance in response to cyclic guanosine 3′, 5′-monophosphate (cGMP), a second messenger that also showed a time- and concentration-dependent ROS production [28]. It is important to note that the observed increase in aconitase 3 did not necessarily reflect an increase in its activity that consequently could lead to a TCA flux. This is so because it has been shown that aconitase activity is strongly reduced by H2O2 [9,10,11]. Rather, the increase may have been channelled towards its role as RNA-binding protein, where it regulates transcription and stability of mRNA transcripts, including its own [38,39]. Besides, the role of aconitase in RNA-binding and oxidative stress requires further analysis. Overall, a total of 36 H2O2—responsive proteins were experimentally linked to potential RNA interaction, including the other TCA cycle enzymes, isocitrate dehydrogenase, succinyl CoA ligase, and succinyl CoA synthase, that increased in abundance at 20 min post H2O2 treatment [39]. Taken together, an increase in the aconitase in response to ABA, cGMP or H2O2 may suggest a potential role of these signalling molecules in modulating oxidative stress as well as energy supplies.
3.2. ABA-Responsive Microsomal Proteins
A total of 52 proteins showed differential accumulation in response to ABA and 26 of these proteins have been identified as either RNA-binding proteins or candidate RNA interactors [39]. Abundance of 31 proteins increased and 18 decreased at 5 min after treatment with ABA, while at 20 min, 28 proteins increased and 17 proteins decreased (Table 2). The 52 proteins were classified into 11 functional categories [31], and the most represented functional categories were protein synthesis (19%), metabolism (13%), cell structure (13%), and energy (12%) (Table 2; extended summary in Table S3). A functional enrichment analysis of the ABA-responsive proteins revealed significant enrichment of biological processes, including ‘primary metabolic process’, ‘developmental process’, ‘response to stress’, ‘transport’, and ‘translation’ (Table S3). In addition, the molecular functions were also enriched, and these included ‘structural molecule activity’ and ‘transporter activity’ (Table S3). A metabolic pathway analysis was also performed on the ABA-responsive proteins using KEGG, and ‘purine metabolism’ (seven proteins), ‘thiamine metabolism’ (six proteins), and ‘methane metabolism’ (four proteins) were the most represented pathways (Table S3).
Fifteen proteins decreased in abundance at both 5 and 20 min after ABA treatment, and these included six cytoskeleton-associated proteins (Table 2). Three of these were transporter-associated proteins namely clathrin, heavy chains (AT3G08530 and AT3G11130) and a plasma membrane intrinsic protein 2A (PIP2A, AT3G53420). The latter has been linked to other stress-responses, including temperature and salt [40,41], in addition to a potential role in mRNA binding [39]. The abundance of PIP2A, in particular, has been shown to decrease in response to salt stress [41,42], and much like in the current study, the abundance of PIP2A decreased after 5 and 20 min (although at 20 min it was only 0.6 fold change, and hence less than the cutoff of two-fold) of ABA-treatment. PIP2A is a member of the PIP2 subfamily proteins. PIP2A has water transport activity as depicted in Xenopus laevis oocytes [43], and facilitates the diffusion of H2O2 into cells of yeast [44]. Exposing of Arabidopsis roots to 0.5 mM H2O2 has been observed to induce significant depletion of PIP homologs in the plasma membrane fractions after 15 min. In addition, in late endosomal compartments, H2O2 has been shown to cause oxidative stress-induced redistribution of AtPIP2.1 [45]. On another hand, an ABA-dependent phosphoproteomics analysis detected four members of the aquaporin family including PIP2 decreasing in phosphorylation state at a carboxyl-terminal serine that is anticipated to instigate closure of the water-transporting aquaporin gate [46]. PIP2 dephosphorylation prevents rehydration during ABA-regulated seed germination and dormancy, and decreases water flux in response to drought [46]. Arabidopsis knockout mutants lacking the PIP2:1 aquaporin have a stomatal closure defect particularly in response to ABA [47]. In pip2:1 plants, ABA treatment induced an increase in osmotic water permeability of guard cell protoplasts while abolishing accumulation of ROS [47], supporting the involvement of aquaporins in ABA-dependent stomatal movements. The work by Grondin et al. [47] implies that PIP2:1 does significantly contribute to guard cell water permeability in the presence of ABA. Moreover, just like Kline et al. [46], Grondin et al. [47] showed that PIP2 phosphorylation is critical for responses to ABA, in particular in guard cell movements. In the current study, differential analysis of microsomal proteins showed that accumulation of PIP2 decreased in the presence of ABA, suggesting a potential direct or indirect regulation of aquaporins in ABA signalling. This may correlate with the decrease in phosphorylation of PIP2 upon ABA treatment [46].
Among the microsomal proteins that increased in abundance after ABA treatment, D-mannose-binding lectin protein (AT1G78850) and LRR transmembrane protein kinase (LTPK, AT3G14840) (Table 2) showed the greatest increase specifically at 20 min. The two proteins play a role in inmate immunity against microbial attack. D-mannose-binding lectin recognises certain carbohydrate moieties on pathogen surfaces [48]. It is involved in the regulation of gene expression and cellular activities in response to increasing levels of hormones such as ABA and jasmonate, or biotic and abiotic (e.g., osmotic) stresses [49,50,51,52,53]. On the other hand, LTPK [also known as LYSM RLK1-INTERACTING KINASE 1 (LIK1)], a plasma membrane localised protein, also increased in abundance at 20 min after H2O2 treatment. Direct interaction between chitin elicitor receptor kinase (AtCERK1) and LIK1, both in vitro and in vivo studies showed that LIK1 is directly phosphorylated by AtCERK1 [54]. In Arabidopsis, AtCERK1 mutants show impairment in chitin responses including the activation of a MAPK cascade, ROS production and expression of chitin-induced genes consequently leading to failure of chitin-induced pathogen resistance [55,56]. Furthermore, Lik1 T-DNA mutant plants produced significantly more ROS in response to chitin and showed an increased resistance to Pseudomonas syringae pv. tomato [54]. The increase in abundance of LTPK in response to the ABA and H2O2 treatments we observed was consistent with the role of LTPK in ROS responses for regulating ROS accumulation that, if in excess, can facilitate necrotrophic infection and promotes programmed cell death [57].
3.3. The Microsomal Proteome of the ABA and H2O2 Responses Show Similarity
A total of 21 proteins were common among proteins significantly changing in response to ABA and H2O2 treatments. Ten of these proteins have been linked in RNA biology [39]. Changes in abundance for most of these proteins were similar (Table 3). Expression of six of these proteins increased in abundance at both 5 and 20 min post-treatment, while six decreased after either ABA or H2O2 treatment (Table 3). The other nine proteins showed dissimilar regulation patterns between the two treatments.
Three proteins, ubiquinol-cytochrome C reductase hinge (UQCRH, AT1G15120), D-3-phosphoglycerate dehydrogenase (AT1G17745) and NADH:cytochrome B5 reductase 1 (Cytb5R, AT5G17770), belonging to the molecular function category ‘oxidoreductase activity’ (Table S2), showed differential accumulation in response to either ABA or H2O2 (Table 3). Oxidoreductase-related proteins have been shown to control responses to calcium homeostasis in organelles such as endoplasmic reticulum [58]. Besides, amongst the identified ABA and H2O2 –responsive proteins, UQCRH was one of the proteins increasing in abundance the most at both time points. It is a component of the mitochondrial respiratory chain complex III. Cytb5R is an integral membrane-bound flavoprotein that is localised mainly in the endoplasmic reticulum and the outer mitochondrial membrane [59]. It is an electron donor for Cytb5, a membrane-haeme-containing protein [60]. Non-cytotoxic concentration of H2O2 (24 μM) has been shown to induce a significant up-regulation of Cytb5R, suggesting a redox regulation [61]. However, in this study, we observed that a higher concentration of H2O2 (50 μM) can cause a decrease of Cytb5R abundance as an early response, and an increase at 20 min. This may suggest concentration-dependent redox regulation by Cytb5R in response H2O2 as well as ABA.
Within the common proteins set, the most represented functional category was the cell structure, comprising of four tubulins and one actin. Tubulin/FtsZ protein (AT4G14960), an α-tubulin isoform that is required for right handed helical growth, is part of the tubulin complex or structural constituent of the cytoskeleton [62]. Tubulins showed differential expression in response to salt stress, for example, abundance of tubulin β-chain 2 (AT5G62690) decreased after salt treatment [63]. Tubulin has also been shown to regulate low nitrate-induced anthocyanin biosynthesis and plant nitrate response regulatory network in collaboration with other signalling pathways including ABA and H2O2 [64]. The four tubulins and actin 7 identified in the current study were all down-regulated in response to ABA and H2O2, and showed reduction in transcriptional level during senescence suggesting that the cytoskeletal organization-related proteins are affected by oxidative stress. Further, the cytoskeleton has been shown to be essential for mitochondrial morphology, movement and immobilization. The actin cytoskeleton, for example, is involved in the immobilization of mitochondria at the cortex in cultured tobacco cells, and the cytoskeleton may be critical for retaining mitochondria at sites of high ATP demand (for review see [65]).
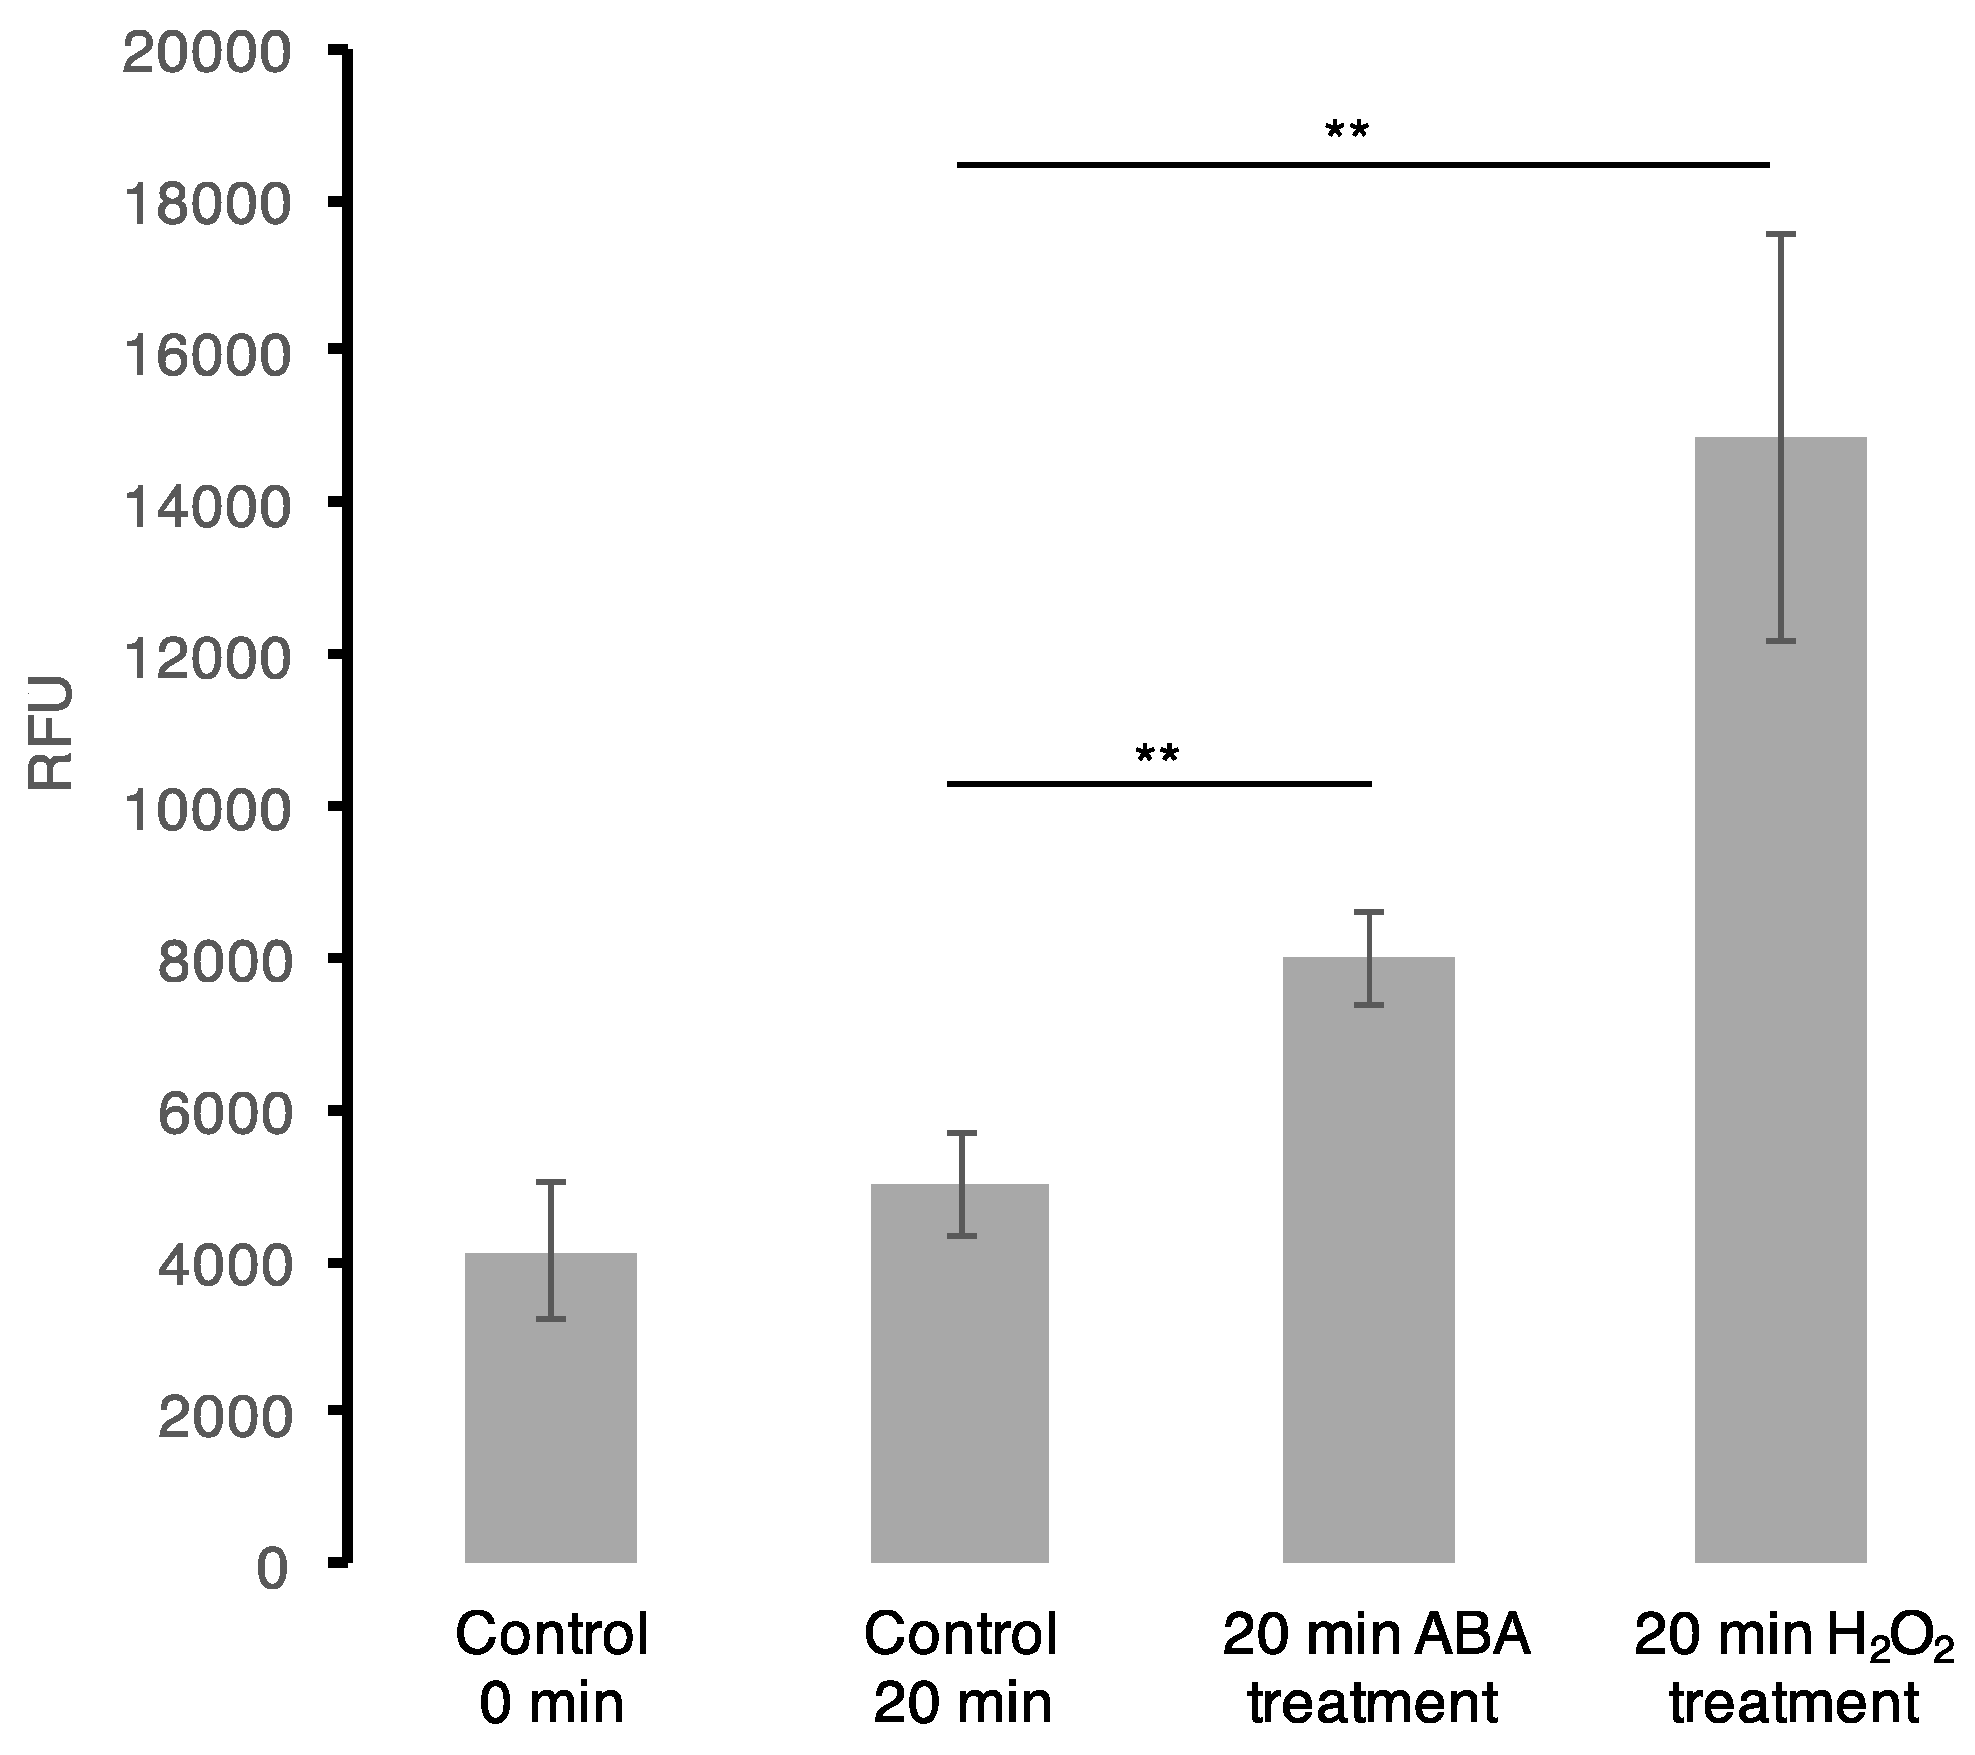
To further examine the mutual effect of ABA and H2O2, in particular to shed light on the common protein cohort whether the ABA effect is a result of the H2O2 signalling initiated via ABA pathway, we performed an ABA assay following H2O2 treatment of Arabidopsis cell suspension cultures and vise-versa. We noted no significant change in ABA quantity at 5 and 20 min post-H2O2 treatment. This may be attributed to the short treatment times aimed at observing early stimuli responses, or potentially from the low concentration of H2O2 used. Previously, it has been revealed that treating Arabidopsis guard cells with 100 μM H2O2 for 25 and 30 min induced an ABA-mediated nitric oxide production, which in turn is dependent on ABA-induced H2O2 synthesis [66]. Furthermore, a ROS assay was performed after treating Arabidopsis cell suspension cultures with 50 μM ABA. Here, we observed an increase in ROS accumulation at 20 min when compared with the controls (collected at 0 and 20 min) (Figure 2). This observation is not new as previously, ABA has been shown to induce H2O2 production through NADPH oxidase [67] and in guard cells of Vicia faba, ABA was also observed to generate H2O2 [68]. Additionally, in Arabidopsis, ROS accumulation was noted to occur upon ABA-induced stomatal closure [69]. Therefore, this suggests that ABA directly and/or indirectly induce ROS production in the cells that may lead to the observed common regulation of downstream processes with H2O2.
4. Conclusions
Shotgun proteomics approaches can distinguish common and specific responses linked to ABA or H2O2 treatments. The analysed proteomics data also revealed over 30 microsomal proteins associated with RNA interaction [70]. Furthermore, amongst the common set of proteins, we detected three proteins, namely aconitase 3, UQCRH, and inner mitochondrial membrane translocase 13, to be the most responsive and potentially as promising signatures for both ABA and H2O2 although they require further investigation to determine their mode of action. Besides, the fact that most of the common proteins changed in abundance in a similar manner is consistent with ABA-induced ROS production. Finally, we also show that a significant protein subset responds specifically to either ABA or H2O2, suggesting that these molecules also modulate independent complex intracellular responses.
Supplementary Materials
The following are available online https://www.mdpi.com/2227-7382/5/3/22/s1, Table S2: H2O2 differentially expressed proteins and GO analysis, Table S3: ABA differentially expressed proteins and GO analysis.
Acknowledgments
The authors would like to thank Bothayna Algashgari for technical assistance. The mass spectrometry proteomics data have been deposited to the ProteomeXchange Consortium via the PRIDE [71] partner repository with the dataset identifier PXD006513.
Author Contributions
C.M. and C.G. conceived and designed the experiments; M.A. and L.T. performed the experiments; C.M., M.A. and L.T. analysed the data; C.M. wrote the paper; C.M. and C.G. critically revised the manuscript.
Conflicts of Interest
The authors declare no conflict of interest.
References
- Dat, J.; Vandenabeele, S.; Vranova, E.; Van Montagu, M.; Inze, D.; Van Breusegem, F. Dual action of the active oxygen species during plant stress responses. Cell Mol. Life Sci. 2000, 57, 779–795. [Google Scholar] [CrossRef] [PubMed]
- Luna, C.M.; Pastori, G.M.; Driscoll, S.; Groten, K.; Bernard, S.; Foyer, C.H. Drought controls on H2O2 accumulation, catalase (CAT) activity and CAT gene expression in wheat. J. Exp. Bot. 2005, 56, 417–423. [Google Scholar] [CrossRef] [PubMed]
- Zhang, F.; Wang, Y.; Yang, Y.; Wu, H.; Wang, D.; Liu, J. Involvement of hydrogen peroxide and nitric oxide in salt resistance in the calluses from Populus euphratica. Plant Cell Environ. 2007, 30, 775–785. [Google Scholar] [CrossRef] [PubMed]
- Mittler, R.; Herr, E.H.; Orvar, B.L.; van Camp, W.; Willekens, H.; Inze, D.; Ellis, B.E. Transgenic tobacco plants with reduced capability to detoxify reactive oxygen intermediates are hyperresponsive to pathogen infection. Proc. Natl. Acad. Sci. USA 1999, 96, 14165–14170. [Google Scholar] [CrossRef] [PubMed]
- Halliwell, B. Free radicals, reactive oxygen species and human disease: A critical evaluation with special reference to atherosclerosis. Br. J. Exp. Pathol. 1989, 70, 737–757. [Google Scholar] [PubMed]
- Moller, I.M. Plant mitochondria and oxidative stress: Electron transport, NADPH turnover, and metabolism of reactive oxygen species. Annu. Rev. Plant Physiol. Plant Mol. Biol. 2001, 52, 561–591. [Google Scholar] [CrossRef] [PubMed]
- Millar, H.; Considine, M.J.; Day, D.A.; Whelan, J. Unraveling the role of mitochondria during oxidative stress in plants. IUBMB Life 2001, 51, 201–205. [Google Scholar] [PubMed]
- Schmidtmann, E.; Konig, A.C.; Orwat, A.; Leister, D.; Hartl, M.; Finkemeier, I. Redox regulation of Arabidopsis mitochondrial citrate synthase. Mol. Plant 2014, 7, 156–169. [Google Scholar] [CrossRef] [PubMed]
- Verniquet, F.; Gaillard, J.; Neuburger, M.; Douce, R. Rapid inactivation of plant aconitase by hydrogen peroxide. Biochem. J. 1991, 276, 643–648. [Google Scholar] [CrossRef] [PubMed]
- Millar, A.H.; Leaver, C.J. The cytotoxic lipid peroxidation product, 4-hydroxy-2-nonenal, specifically inhibits decarboxylating dehydrogenases in the matrix of plant mitochondria. FEBS Lett. 2000, 481, 117–121. [Google Scholar] [CrossRef]
- Sweetlove, L.J.; Heazlewood, J.L.; Herald, V.; Holtzapffel, R.; Day, D.A.; Leaver, C.J.; Millar, A.H. The impact of oxidative stress on Arabidopsis mitochondria. Plant J. 2002, 32, 891–904. [Google Scholar] [CrossRef] [PubMed]
- Desikan, R.; Reynolds, A.; Hancock, J.T.; Neill, S.J. Harpin and hydrogen peroxide both initiate programmed cell death but have differential effects on defence gene expression in Arabidopsis suspension cultures. Biochem. J. 1998, 330, 115–120. [Google Scholar] [CrossRef] [PubMed]
- Pei, Z.M.; Murata, Y.; Benning, G.; Thomine, S.; Klusener, B.; Allen, G.J.; Grill, E.; Schroeder, J.I. Calcium channels activated by hydrogen peroxide mediate abscisic acid signaling in guard cells. Nature 2000, 406, 731–734. [Google Scholar] [CrossRef] [PubMed]
- Kwak, J.M.; Mori, I.C.; Pei, Z.M.; Leonhardt, N.; Torres, M.A.; Dangl, J.L.; Bloom, R.E.; Bodde, S.; Jones, J.D.G.; Schroeder, J.I. NADPH oxidase AtrbohD and AtrbohF genes function in ROS-dependent ABA signaling in Arabidopsis. EMBO J. 2003, 22, 2623–2633. [Google Scholar] [CrossRef] [PubMed]
- Guan, L.M.; Zhao, J.; Scandalios, J.G. Cis-elements and trans-factors that regulate expression of the maize Cat1 antioxidant gene in response to ABA and osmotic stress: H2O2 is the likely intermediary signaling molecule for the response. Plant J. 2000, 22, 87–95. [Google Scholar] [CrossRef] [PubMed]
- Gonzalez-Guzman, M.; Pizzio, G.A.; Antoni, R.; Vera-Sirera, F.; Merilo, E.; Bassel, G.W.; Fernandez, M.A.; Holdsworth, M.J.; Perez-Amador, M.A.; Kollist, H.; et al. Arabidopsis PYR/PYL/RCAR receptors play a major role in quantitative regulation of stomatal aperture and transcriptional response to abscisic acid. Plant Cell 2012, 24, 2483–2496. [Google Scholar] [CrossRef] [PubMed] [Green Version]
- Joshi-Saha, A.; Valon, C.; Leung, J. A brand new START: Abscisic acid perception and transduction in the guard cell. Sci. Signal. 2011, 4, re4. [Google Scholar] [CrossRef] [PubMed]
- Arve, L.E.; Carvalho, D.R.; Olsen, J.E.; Torre, S. ABA induces H2O2 production in guard cells, but does not close the stomata on Vicia faba leaves developed at high air humidity. Plant Signal. Behav. 2014, 9, e29192. [Google Scholar] [CrossRef] [PubMed]
- Desikan, R.; Cheung, M.K.; Bright, J.; Henson, D.; Hancock, J.T.; Neill, S.J. ABA, hydrogen peroxide and nitric oxide signaling in stomatal guard cells. J. Exp. Bot. 2004, 55, 205–212. [Google Scholar] [CrossRef] [PubMed]
- Murata, Y.; Pei, Z.M.; Mori, I.C.; Schroeder, J. Abscisic acid activation of plasma membrane Ca2+ channels in guard cells requires cytosolic NAD(P)H and is differentially disrupted upstream and downstream of reactive oxygen species production in abi1–1 and abi2–1 protein phosphatase 2C mutants. Plant Cell 2001, 13, 2513–2523. [Google Scholar] [CrossRef] [PubMed]
- Giraudat, J.; Parcy, F.; Bertauche, N.; Gosti, F.; Leung, J.; Morris, P.C.; Bouvier-Durand, M.; Vartanian, N. Current advances in abscisic acid action and signaling. Plant Mol. Biol. 1994, 26, 1557–1577. [Google Scholar] [CrossRef] [PubMed]
- Yang, L.; Zhang, J.; He, J.; Qin, Y.; Hua, D.; Duan, Y.; Chen, Z.; Gong, Z. ABA-mediated ROS in mitochondria regulate root meristem activity by controlling PLETHORA expression in Arabidopsis. PLoS Genet. 2014, 10, e1004791. [Google Scholar] [CrossRef] [PubMed]
- Hu, X.; Zhang, A.; Zhang, J.; Jiang, M. Abscisic acid is a key inducer of hydrogen peroxide production in leaves of maize plants exposed to water stress. Plant Cell Physiol. 2006, 47, 1484–1495. [Google Scholar] [CrossRef] [PubMed]
- Jiang, M.; Zhang, J. Involvement of plasma-membrane NADPH oxidase in abscisic acid- and water stress-induced antioxidant defense in leaves of maize seedlings. Planta 2002, 215, 1022–1030. [Google Scholar] [CrossRef] [PubMed]
- Liu, C.-H.; Chao, Y.-Y.; Kao, C.H. Abscisic acid is an inducer of hydrogen peroxide production in leaves of rice seedlings grown under potassium deficiency. Bot. Stud. 2012, 53, 229–237. [Google Scholar]
- Marondedze, C.; Turek, I.; Parrott, B.; Thomas, L.; Jankovic, B.; Lilley, K.S.; Gehring, C. Structural and functional characteristics of cGMP-dependent methionine oxidation in Arabidopsis thaliana proteins. Cell Commun. Signal. 2013, 11. [Google Scholar] [CrossRef] [PubMed]
- Marondedze, C.; Wong, A.; Groen, A.; Serrano, N.; Jankovic, B.; Lilley, K.; Gehring, C.; Thomas, L. Exploring the Arabidopsis proteome: Influence of protein solubilization buffers on proteome coverage. Int. J. Mol. Sci. 2015, 16, 857–870. [Google Scholar] [CrossRef] [PubMed]
- Ordonez, N.M.; Marondedze, C.; Thomas, L.; Pasqualini, S.; Shabala, L.; Shabala, S.; Gehring, C. Cyclic mononucleotides modulate potassium and calcium flux responses to H2O2 in Arabidopsis roots. FEBS Lett. 2014, 588, 1008–1015. [Google Scholar] [CrossRef] [PubMed]
- Thomas, L.; Marondedze, C.; Ederli, L.; Pasqualini, S.; Gehring, C. Proteomic signatures implicate cAMP in light and temperature responses in Arabidopsis thaliana. J. Proteom. 2013, 83, 47–59. [Google Scholar] [CrossRef] [PubMed]
- Groen, A.; Thomas, L.; Lilley, K.; Marondedze, C. Identification and quantitation of signal molecule-dependent protein phosphorylation. Methods Mol. Biol. 2013, 1016, 121–137. [Google Scholar] [PubMed]
- Bevan, M.; Bancroft, I.; Bent, E.; Love, K.; Goodman, H.; Dean, C.; Bergkamp, R.; Dirkse, W.; van Staveren, M.; Stiekema, W.; et al. Analysis of 1.9 Mb of contiguous sequence from chromosome 4 of Arabidopsis thaliana. Nature 1998, 391, 485–488. [Google Scholar] [CrossRef] [PubMed]
- AgriGO. Available online: http://bioinfo.cau.edu.cn/agriGO/ (accessed on 1 February 2017).
- Moreno-Sanchez, R.; Saavedra, E.; Rodriguez-Enriquez, S.; Gallardo-Perez, J.C.; Quezada, H.; Westerhoff, H.V. Metabolic control analysis indicates a change of strategy in the treatment of cancer. Mitochondrion 2010, 10, 626–639. [Google Scholar] [CrossRef] [PubMed]
- Araujo, W.L.; Nunes-Nesi, A.; Nikoloski, Z.; Sweetlove, L.J.; Fernie, A.R. Metabolic control and regulation of the tricarboxylic acid cycle in photosynthetic and heterotrophic plant tissues. Plant Cell Environ. 2012, 35, 1–21. [Google Scholar] [CrossRef] [PubMed]
- Tretter, L.; Adam-Vizi, V. Alpha-ketoglutarate dehydrogenase: A target and generator of oxidative stress. Philos. Trans. R. Soc. Lond. Biol. Sci. 2005, 360, 2335–2345. [Google Scholar] [CrossRef] [PubMed]
- Janero, D.R.; Hreniuk, D. Suppression of TCA cycle activity in the cardiac muscle cell by hydroperoxide-induced oxidant stress. Am. J. Physiol. 1996, 270, C1735–C1742. [Google Scholar] [PubMed]
- Moeder, W.; Del Pozo, O.; Navarre, D.A.; Martin, G.B.; Klessig, D.F. Aconitase plays a role in regulating resistance to oxidative stress and cell death in Arabidopsis and Nicotiana benthamiana. Plant Mol. Biol. 2007, 63, 273–287. [Google Scholar] [CrossRef] [PubMed]
- Hentze, M.W.; Argos, P. Homology between IRE-BP, a regulatory RNA-binding protein, aconitase, and isopropylmalate isomerase. Nucleic Acids Res. 1991, 19, 1739–1740. [Google Scholar] [CrossRef] [PubMed]
- Marondedze, C.; Thomas, L.; Serrano, N.L.; Lilley, K.S.; Gehring, C. The RNA-binding protein repertoire of Arabidopsis thaliana. Sci. Rep. 2016, 6, 29766. [Google Scholar] [CrossRef] [PubMed]
- Heyndrickx, K.S.; Vandepoele, K. Systematic identification of functional plant modules through the integration of complementary data sources. Plant Physiol. 2012, 159, 884–901. [Google Scholar] [CrossRef] [PubMed] [Green Version]
- Martiniere, A.; Li, X.; Runions, J.; Lin, J.; Maurel, C.; Luu, D.T. Salt stress triggers enhanced cycling of Arabidopsis root plasma-membrane aquaporins. Plant Signal. Behav. 2012, 7, 529–532. [Google Scholar] [CrossRef] [PubMed]
- Niittyla, T.; Fuglsang, A.T.; Palmgren, M.G.; Frommer, W.B.; Schulze, W.X. Temporal analysis of sucrose-induced phosphorylation changes in plasma membrane proteins of Arabidopsis. Mol. Cell Proteom. 2007, 6, 1711–1726. [Google Scholar] [CrossRef] [PubMed]
- Kammerloher, W.; Fischer, U.; Piechottka, G.P.; Schaffner, A.R. Water channels in the plant plasma membrane cloned by immunoselection from a mammalian expression system. Plant J. 1994, 6, 187–199. [Google Scholar] [CrossRef] [PubMed]
- Dynowski, M.; Schaaf, G.; Loque, D.; Moran, O.; Ludewig, U. Plant plasma membrane water channels conduct the signaling molecule H2O2. Biochem. J. 2008, 414, 53–61. [Google Scholar] [CrossRef] [PubMed]
- Wudick, M.M.; Li, X.; Valentini, V.; Geldner, N.; Chory, J.; Lin, J.; Maurel, C.; Luu, D.T. Subcellular redistribution of root aquaporins induced by hydrogen peroxide. Mol. Plant 2015, 8, 1103–1114. [Google Scholar] [CrossRef] [PubMed]
- Kline, K.G.; Barrett-Wilt, G.A.; Sussman, M.R. In planta changes in protein phosphorylation induced by the plant hormone abscisic acid. Proc. Natl. Acad. Sci. USA 2010, 107, 15986–15991. [Google Scholar] [CrossRef] [PubMed]
- Grondin, A.; Rodrigues, O.; Verdoucq, L.; Merlot, S.; Leonhardt, N.; Maurel, C. Aquaporins contribute to ABA-Triggered stomatal closure through OST1-mediated phosphorylation. Plant Cell 2015, 27, 1945–1954. [Google Scholar] [CrossRef] [PubMed]
- Hwang, I.S.; Hwang, B.K. The pepper mannose-binding lectin gene CaMBL1 is required to regulate cell death and defense responses to microbial pathogens. Plant Physiol. 2011, 155, 447–463. [Google Scholar] [CrossRef] [PubMed]
- Leonhardt, N.; Kwak, J.M.; Robert, N.; Waner, D.; Leonhardt, G.; Schroeder, J.I. Microarray expression analyses of Arabidopsis guard cells and isolation of a recessive abscisic acid hypersensitive protein phosphatase 2C mutant. Plant Cell 2004, 16, 596–615. [Google Scholar] [CrossRef] [PubMed]
- Zhang, W.L.; Peumans, W.J.; Barre, A.; Astoul, C.H.; Rovira, P.; Rouge, P.; Proost, P.; Truffa-Bachi, P.; Jalali, A.A.H.; Van Damme, E.J.M. Isolation and characterization of a jacalin-related mannose-binding lectin from salt-stressed rice (Oryza sativa) plants. Planta 2000, 210, 970–978. [Google Scholar] [PubMed]
- Feng, H.; Xu, W.Z.; Lin, H.H.; Chong, K. Transcriptional regulation of wheat VER2 promoter in rice in response to abscisic acid, jasmonate, and light. J. Genet. Genom. 2009, 36, 371–377. [Google Scholar] [CrossRef]
- Fouquaert, E.; Van Damme, E.J. Promiscuity of the euonymus carbohydrate-binding domain. Biomolecules 2012, 2, 415–434. [Google Scholar] [CrossRef] [PubMed]
- Song, M.; Xu, W.Q.; Xiang, Y.; Jia, H.Y.; Zhang, L.X.; Ma, Z.Q. Association of jacalin-related lectins with wheat responses to stresses revealed by transcriptional profiling. Plant Mol. Biol. 2014, 84, 95–110. [Google Scholar] [CrossRef] [PubMed]
- Le, M.H.; Cao, Y.; Zhang, X.C.; Stacey, G. LIK1, a CERK1-interacting kinase, regulates plant immune responses in Arabidopsis. PLoS ONE 2014, 9, e102245. [Google Scholar] [CrossRef] [PubMed]
- Wan, J.; Zhang, X.C.; Neece, D.; Ramonell, K.M.; Clough, S.; Kim, S.Y.; Stacey, M.G.; Stacey, G. A LysM receptor-like kinase plays a critical role in chitin signaling and fungal resistance in Arabidopsis. Plant Cell 2008, 20, 471–481. [Google Scholar] [CrossRef] [PubMed]
- Miya, A.; Albert, P.; Shinya, T.; Desaki, Y.; Ichimura, K.; Shirasu, K.; Narusaka, Y.; Kawakami, N.; Kaku, H.; Shibuya, N. CERK1, a LysM receptor kinase, is essential for chitin elicitor signaling in Arabidopsis. Proc. Natl. Acad. Sci. USA 2007, 104, 19613–19618. [Google Scholar] [CrossRef] [PubMed]
- Williams, B.; Kabbage, M.; Kim, H.J.; Britt, R.; Dickman, M.B. Tipping the balance: Sclerotinia sclerotiorum secreted oxalic acid suppresses host defenses by manipulating the host redox environment. PLoS Pathog. 2011, 7, e1002107. [Google Scholar] [CrossRef] [PubMed] [Green Version]
- Groenendyk, J.; Peng, Z.; Dudek, E.; Fan, X.; Mizianty, M.J.; Dufey, E.; Urra, H.; Sepulveda, D.; Rojas-Rivera, D.; Lim, Y.; et al. Interplay between the oxidoreductase PDIA6 and microRNA-322 controls the response to disrupted endoplasmic reticulum calcium homeostasis. Sci. Signal. 2014, 7, ra54. [Google Scholar] [CrossRef] [PubMed]
- Borgese, N.; Aggujaro, D.; Carrera, P.; Pietrini, G.; Bassetti, M. A role for N-myristoylation in protein targeting: NADH-cytochrome b5 reductase requires myristic acid for association with outer mitochondrial but not ER membranes. J. Cell Biol. 1996, 135, 1501–1513. [Google Scholar] [CrossRef] [PubMed]
- Fukuchi-Mizutani, M.; Mizutani, M.; Tanaka, Y.; Kusumi, T.; Ohta, D. Microsomal electron transfer in higher plants: cloning and heterologous expression of NADH-cytochrome b5 reductase from Arabidopsis. Plant Physiol. 1999, 119, 353–362. [Google Scholar] [CrossRef] [PubMed]
- Bello, R.I.; Alcain, F.J.; Gomez-Diaz, C.; Lopez-Lluch, G.; Navas, P.; Villalba, J.M. Hydrogen peroxide- and cell-density-regulated expression of NADH-cytochrome b5 reductase in HeLa cells. J. Bioenerg. Biomembr. 2003, 35, 169–179. [Google Scholar] [CrossRef] [PubMed]
- Abe, T.; Hashimoto, T. Altered microtubule dynamics by expression of modified alpha-tubulin protein causes right-handed helical growth in transgenic Arabidopsis plants. Plant J. 2005, 43, 191–204. [Google Scholar] [CrossRef] [PubMed]
- Jiang, Y.; Yang, B.; Harris, N.S.; Deyholos, M.K. Comparative proteomic analysis of NaCl stress-responsive proteins in Arabidopsis roots. J. Exp. Bot. 2007, 58, 3591–3607. [Google Scholar] [CrossRef] [PubMed]
- Wang, X.; Bian, Y.; Cheng, K.; Zou, H.; Sun, S.S.; He, J.X. A comprehensive differential proteomic study of nitrate deprivation in Arabidopsis reveals complex regulatory networks of plant nitrogen responses. J. Proteom. Res. 2012, 11, 2301–2315. [Google Scholar] [CrossRef] [PubMed]
- Boldogh, I.R.; Pon, L.A. Interactions of mitochondria with the actin cytoskeleton. Biochim. Biophys. Acta 2006, 1763, 450–462. [Google Scholar] [CrossRef] [PubMed]
- Bright, J.; Desikan, R.; Hancock, J.T.; Weir, I.S.; Neill, S.J. ABA-induced NO generation and stomatal closure in Arabidopsis are dependent on H2O2 synthesis. Plant J. 2006, 45, 113–122. [Google Scholar] [CrossRef] [PubMed]
- Foreman, J.; Demidchik, V.; Bothwell, J.H.; Mylona, P.; Miedema, H.; Torres, M.A.; Linstead, P.; Costa, S.; Brownlee, C.; Jones, J.D.; et al. Reactive oxygen species produced by NADPH oxidase regulate plant cell growth. Nature 2003, 422, 442–446. [Google Scholar] [CrossRef] [PubMed]
- Zhang, X.; Zhang, L.; Dong, F.; Gao, J.; Galbraith, D.W.; Song, C.P. Hydrogen peroxide is involved in abscisic acid-induced stomatal closure in Vicia faba. Plant Physiol. 2001, 126, 1438–1448. [Google Scholar] [CrossRef] [PubMed]
- Penson, S.P.; Schuurink, R.C.; Fath, A.; Gubler, F.; Jacobsen, J.V.; Jones, R.L. cGMP is required for gibberellic acid-induced gene expression in barley aleurone. Plant Cell 1996, 8, 2325–2333. [Google Scholar] [CrossRef] [PubMed]
- Marondedze, C.; Groen, A.J.; Thomas, L.; Lilley, K.S.; Gehring, C. A Quantitative phosphoproteome analysis of cGMP-dependent cellular responses in Arabidopsis thaliana. Mol. Plant 2016, 9, 621–623. [Google Scholar] [CrossRef] [PubMed]
- Vizcaíno, J.A.; Csordas, A.; Del-Toro, N.; Dianes, J.A.; Griss, J.; Lavidas, I.; Mayer, G.; Perez-Riverol, Y.; Reisinger, F.; Ternent, T.; et al. 2016 update of the PRIDE database and related tools. Nucleic Acids Res. 2016, 44, D447–D456. [Google Scholar] [CrossRef] [PubMed]
Figure 1.
Tricarboxylic acid (TCA) cycle highlighted proteins changing in abundance after H2O2 treatment of cells. Maroon arrows represent proteins changing at 5 min after treatment and green arrows at 20 min after treatment. “−” signifies no change or a change of less than two-fold, “↑” signifies an increase in abundance, and “↓” signifies a decrease in abundance. Respective protein fold changes are indicated on top of each arrow.
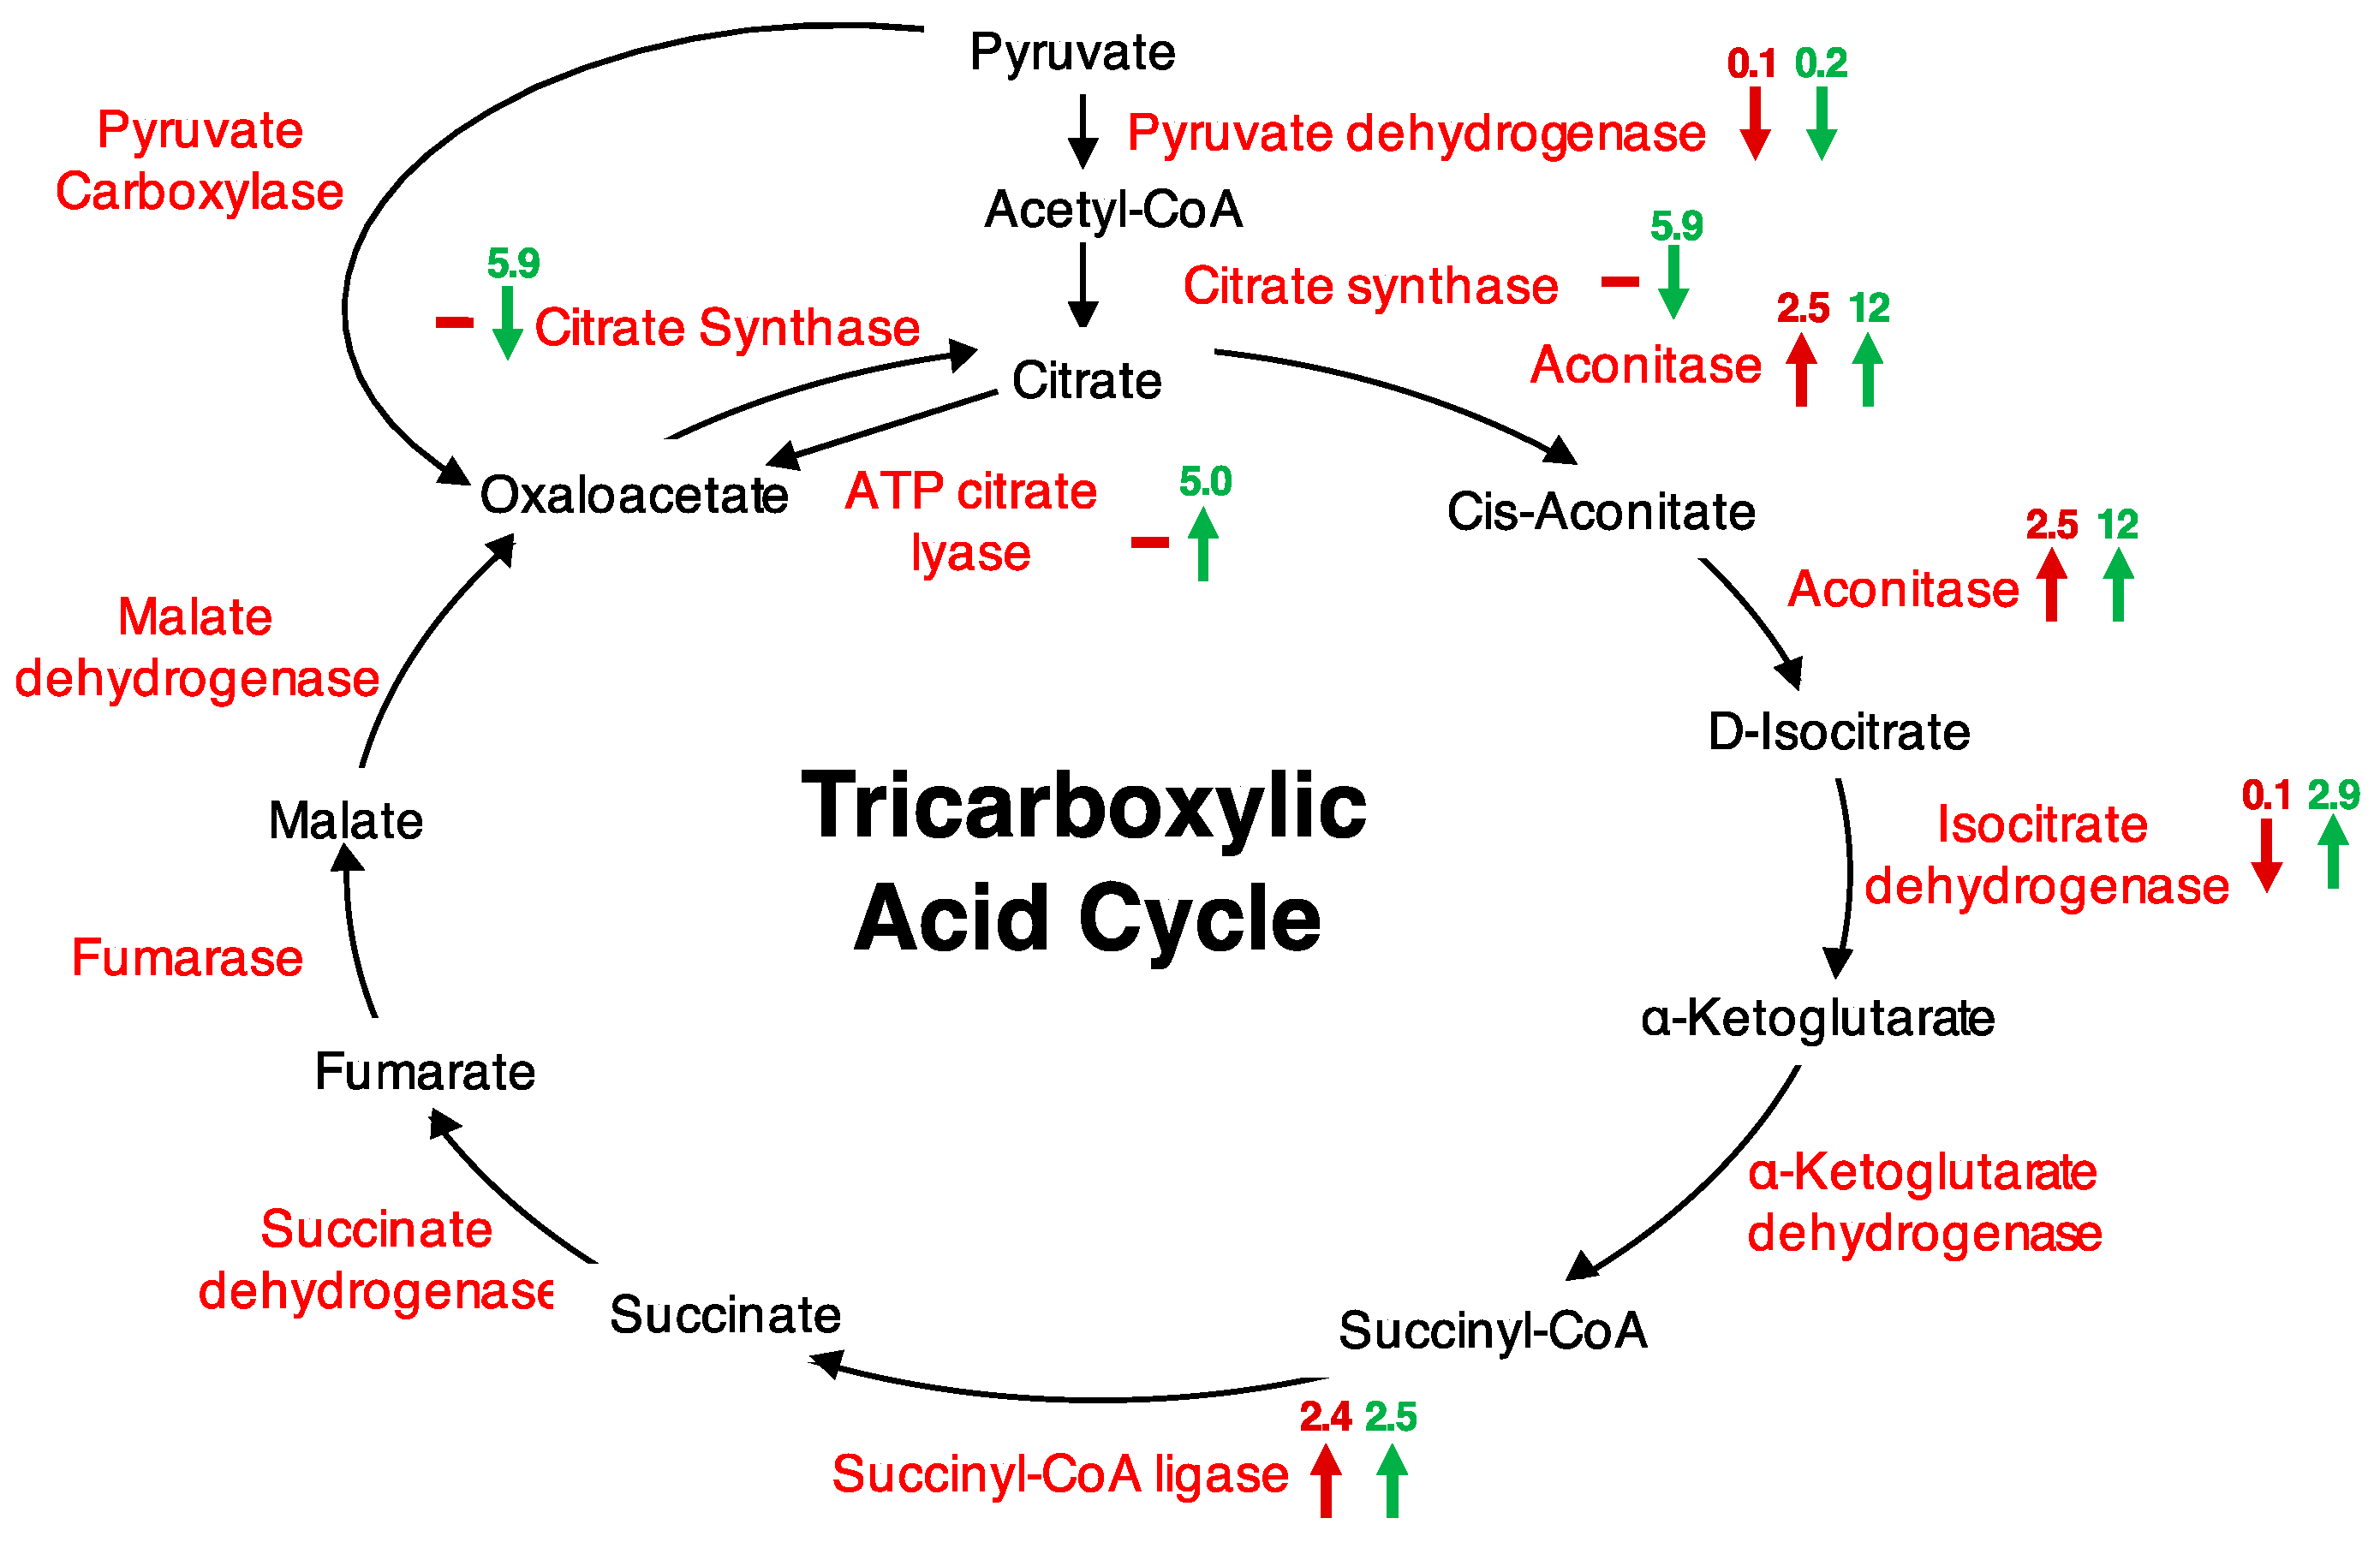
Figure 2.
Reactive oxygen species (ROS) assay. OxiSelect™ Intracellular ROS assay kit (Cell Biolabs, Inc., San Diego, CA, USA) was used in the in vivo oxidation experiments using cultured Arabidopsis (Col-0) cells according to the assay protocol provided by the manufacturer. Each bar represents data from four biological replicates (n = 4) with a calculated standard error. Treatment of cells with ABA at the final concentration of 50 μM induces a statistically significant increase in H2O2 production, p < 0.001 (represented by two asterisks (**) symbols) using a two-sample t-test.

Table 1.
Proteins responsive to H2O2 treatment.
| Accession Number | Protein Name | ANOVA (p-Value) | FC 5 min | FC 20 min |
|---|---|---|---|---|
| 1. Metabolism | ||||
| AT1G17745 | D-3-phosphoglycerate dehydrogenase 2 | 0.0089 | 0.1 | 0.1 |
| AT5G26780 | Serine hydroxymethyltransferase 2 | 0.036 | 2.1 | 13 |
| AT3G61440 | Cysteine synthase C1 | 0.00074 | ns | 5 |
| AT4G14880 | O-acetylserine (thiol) lyase isoform A1 | 0.015 | 0.1 | 7.9 |
| AT5G23300 | Pyrimidine d | 0.013 | 0.2 | ns |
| AT3G09820 | Adenosine kinase 1 | 0.0042 | 0.1 | 14.0 |
| AT5G17770 | NADH:cytochrome B5 reductase 1 | 0.017 | 0.4 | 2.5 |
| AT1G74790 | Catalytics | 0.045 | 5.7 | 4.6 |
| AT4G23850 | AMP-dep. synthetase and ligase protein | 0.017 | 0.5 | ns |
| AT1G65290 | Mitochondrial acyl carrier protein 2 | 0.044 | 2.9 | ns |
| AT3G47930 | L-galactono-1,4-lactone dehydrogenase | 0.019 | 0.2 | ns |
| 2. Energy | ||||
| AT1G79550 | Phosphoglycerate kinase | 0.0069 | 0.2 | 2.0 |
| AT1G24180 | Pyruvate dehydrogenase E1 comp. α-2 | 0.014 | 0.1 | 0.2 |
| AT3G48000 | Aldehyde dehydrogenase 2B4 | 0.022 | 4.3 | 7.1 |
| AT3G60750 | Transketolase | 0.0087 | 0.5 | 4.5 |
| AT2G05710 | Aconitase 3 | 0.0002 | 2.5 | 12.0 |
| AT2G20420 | ATP citrate lyase | 0.022 | ns | 5.0 |
| AT5G08300 | Succinyl-CoA ligase, alpha subunit | 0.006 | 2.4 | 2.5 |
| AT2G44350 | Citrate synthase family protein | 0.026 | ns | 5.9 |
| AT1G65930 | Cyt. NADP+-dep. isocitrate dehydrogenase | 0.033 | 0.1 | 2.9 |
| AT1G15120 | Ubiquinol-cytochrome C reductase hinge | 0.016 | 19 | 20 |
| AT3G03100 | NADH:ubiquinone oxidoreductase,17.2kDa | 0.0029 | 0.5 | ns |
| AT5G13430 | Ubiquinol-cytochrome C reductase, Fe-S | 0.02 | 0.2 | ns |
| AT3G14610 | Cytochrome P450, 72A, polypeptide 7 | 0.0026 | 0.1 | 5.4 |
| 3. Cell growth/division | ||||
| AT5G52240 | Membrane steroid binding protein 1 | 0.02 | 0.1 | 7.5 |
| AT1G10930 | DNA helicase (RECQl4A) | 0.0036 | 4.6 | 0.1 |
| AT3G44310 | Nitrilase 1 | 0.023 | 2.9 | ns |
| 4. Transcription | ||||
| AT1G14850 | Nucleoporin 155 | 0.00094 | ns | 0.3 |
| 5. Protein synthesis | ||||
| AT1G01100 | 60S acidic ribosomal | 0.022 | ns | 0.4 |
| AT3G48930 | Nucleic acid-binding, OB-fold-like protein | 0.024 | 2.1 | ns |
| AT3G10090 | Nucleic acid-binding, OB-fold-like protein | 0.027 | ns | 0.3 |
| AT3G09200 | Ribosomal protein L10 | 0.012 | 2.9 | ns |
| AT3G04400 | Ribosomal protein L14p/L23e | 0.0095 | 3.8 | 3.0 |
| AT1G23290 | Ribosomal protein L18e/L15 | 0.017 | ns | 0.5 |
| AT4G02230 | Ribosomal protein L19e | 0.0089 | ns | 0.3 |
| AT2G44120 | Ribosomal protein L30/L7 | 0.027 | ns | 0.5 |
| AT5G56710 | Ribosomal protein L31e | 0.013 | 4.6 | ns |
| AT3G45030 | Ribosomal protein S10p/S20e | 0.03 | ns | 2.2 |
| AT5G02960 | Ribosomal protein S12/S23 | 0.016 | 2.3 | ns |
| AT3G60245 | Zinc-binding ribosomal protein | 0.036 | 2.4 | ns |
| 6. Protein destination and storage | ||||
| AT1G14980 | Chaperonin 10 | 0.022 | ns | 2.9 |
| AT3G02530 | Chaperonin 60 family protein | 0.045 | 2.2 | 0.4 |
| AT3G03960 | Chaperonin 60 family protein | 0.041 | 2.1 | ns |
| AT5G56030 | Heat shock protein 81-2 | 0.012 | 0.4 | ns |
| AT3G52140 | Tetratricopeptide repeat-containing protein | 0.04 | 5.3 | ns |
| 7. Transporters | ||||
| AT4G38580 | Farnesylated protein 6 | 0.017 | 0.4 | ns |
| AT3G15660 | Glutaredoxin 4 | 0.011 | ns | 6.0 |
| AT1G27950 | Glycosylphosphatidylinositol-anchored lipid protein transfer 1 | 0.027 | 16.0 | 44.0 |
| AT1G07670 | Endomembrane-type CA-ATPase 4 | 0.0026 | 0.1 | 5.0 |
| AT4G27500 | Proton pump interactor 1 | 0.006 | ns | 2.4 |
| AT4G39080 | Vacuolar proton ATPase A3 | 0.0041 | 0.5 | ns |
| AT3G58730 | Vacuolar proton pump D subunit | 0.044 | 0.4 | ns |
| AT1G15500 | TLC ATP/ADP transporter | 0.0099 | 0.3 | ns |
| AT4G28390 | ADP/ATP carrier 3 | 0.014 | 0.1 | ns |
| AT5G60460 | Preprotein translocase Sec, Sec61-β subunit | 0.0081 | 4.7 | 4 |
| AT3G51890 | Clathrin light chain protein | 0.019 | ns | 0.5 |
| AT3G08530 | Clathrin, heavy chain | 0.0021 | 0.5 | 0.2 |
| AT3G11130 | Clathrin, heavy chain | 0.00044 | 0.5 | 0.4 |
| AT5G19760 | Mitochondrial substrate carrier protein | 0.038 | ns | 2.2 |
| AT5G40810 | Cytochrome C1 | 0.021 | 0.3 | ns |
| 8. Intracellular traffic | ||||
| AT3G49560 | Mit. import inner membrane translocase Tim17 | 0.0031 | 0.1 | ns |
| AT1G61570 | Mit. import inner membrane translocase 13 | 0.0044 | 17 | 23 |
| AT1G27390 | Translocase outer membrane 20-2 | 0.0015 | 0.1 | 2.1 |
| AT3G60600 | Vesicle associated protein | 0.051 | ns | 3 |
| AT4G34660 | SH3 domain-containing protein | 0.039 | 4.7 | ns |
| 9. Cell structure | ||||
| AT5G09810 | Actin 7 | 0.0038 | 0.5 | ns |
| AT5G19770 | Tubulin alpha-3 | 0.016 | 0.1 | ns |
| AT5G62690 | Tubulin beta chain 2 | 0.006 | 0.4 | 0.4 |
| AT2G29550 | Tubulin beta-7 chain | 0.0034 | 0.3 | 0.4 |
| AT4G14960 | Tubulin/FtsZ family protein | 0.036 | 0.4 | 0.5 |
| AT3G08950 | Electron transport SCO1/SenC protein | 0.045 | 0.1 | 4.3 |
| 10. Signal transduction | ||||
| AT3G14840 | LRR transmembrane protein kinase | 0.025 | ns | 11 |
| AT5G59840 | Ras-related small GTP-binding protein | 0.0084 | 0.1 | 2.7 |
| AT3G51800 | Metallopeptidase M24 | 0.0015 | 5.1 | ns |
| 11. Disease/Defence | ||||
| AT3G57280 | Transmembrane proteins 14C | 0.014 | 0.1 | ns |
| AT3G12500 | Basic chitinase | 0.035 | ns | 2.1 |
| AT3G32980 | Peroxidase superfamily protein | 0.012 | ns | 3 |
| AT4G36430 | Peroxidase superfamily protein | 0.015 | 0.1 | ns |
| 12. Unclassified | ||||
| AT2G40765 | Unknown protein | 0.019 | 2 | ns |
| AT2G46540 | Unknown protein | 0.033 | ns | 3.5 |
| AT4G12590 | Transmembrane protein, DUF106 | 0.033 | 0.3 | ns |
| AT1G08480 | Unknown protein | 0.048 | 0.2 | 0.4 |
| AT3G20370 | TRAF-like family protein | 0.0058 | 0.2 | 3 |
| AT3G49720 | Unknown protein | 0.016 | 0.1 | 0.3 |
| AT4G24330 | DUF1682, unknown protein | 0.0077 | 0.1 | 2.2 |
| AT2G33585 | Unknown protein | 0.019 | 0.1 | 13 |
Notes: no significant change against the mock treated samples; dep.: dependent; comp.: component; cyt.: cytosolic; ANOVA: Analysis Of Variance.
Table 2.
Proteins responsive to abscisic acid (ABA) treatment.
| Accession Number | Protein Name | ANOVA (p-Value) | FC 5 min | FC 20 min |
|---|---|---|---|---|
| 1. Metabolism | ||||
| AT2G26400 | Acireductone dioxygenase 3 | 0.035 | 3.9 | 6.8 |
| AT4G34200 | D-3-phosphoglycerate dehydrogenase 1 | 0.017 | 0.5 | ns |
| AT1G17745 | D-3-phosphoglycerate dehydrogenase 2 | 0.029 | 0.1 | 0.2 |
| AT4G13940 | S-adenosyl-L-homocysteine hydrolase | 0.028 | 2.5 | 2.0 |
| AT3G17820 | Glutamine synthetase 1.3 | 0.023 | 3.7 | 3.5 |
| AT5G17770 | NADH cytochrome B5 reductase 1 | 0.046 | 2.3 | 2.3 |
| AT3G15730 | Phospholipase D α 1 | 0.014 | 3.2 | 3.8 |
| 2. Energy | ||||
| AT2G01140 | Aldolase superfamily protein | 0.0075 | 5.0 | 5.1 |
| AT5G43940 | GroES-like zinc-binding dehydrogenase | 0.014 | 4.5 | 5.2 |
| AT4G34870 | Rotamase cyclophilin 5 | 0.0015 | 3.1 | 2.7 |
| AT2G05710 | Aconitase 3 | 0.035 | 8.0 | 9.9 |
| AT1G15120 | Ubiquinol-cytochrome C reductase hinge | 0.041 | 15.0 | 11.0 |
| AT2G33220 | GRIM-19 protein | 0.017 | 2.9 | 7.1 |
| 3. Cell growth/division | ||||
| AT5G43070 | WPP domain protein 1 | 0.042 | 0.4 | 0.2 |
| 4. Transcription | ||||
| AT2G18740 | Small nuclear ribonucleoprotein | 0.02 | 7.7 | 4.3 |
| AT5G40480 | Embryo defective 3012 | 0.0084 | 5.6 | 7.9 |
| AT1G14850 | Nucleoporin 155 | 0.0058 | 0.1 | 0.2 |
| 5. Protein synthesis | ||||
| AT1G08360 | Ribosomal protein L1p/L10e | 0.037 | 3.1 | ns |
| AT4G10450 | Ribosomal protein L6 | 0.00092 | 12.0 | >0.1 |
| AT5G08180 | Ribosomal protein L7Ae | 0.022 | 11.0 | 8.7 |
| AT3G04400 | Ribosomal protein L14p | 0.016 | 3.5 | 2.6 |
| AT3G14600 | Ribosomal protein L18ae | 0.033 | 3.4 | 3.3 |
| AT3G45030 | Ribosomal protein S10p/S20e | 0.0041 | 2.3 | ns |
| AT5G47930 | Zinc-binding ribosomal protein | 0.027 | 8.6 | 7.0 |
| AT4G00810 | 60S acidic ribosomal protein family | 0.042 | 0.4 | 0.4 |
| AT1G01100 | 60S acidic ribosomal protein family | 0.045 | 0.4 | 0.4 |
| AT5G47700 | 60S acidic ribosomal protein family | 0.0085 | 0.3 | 0.4 |
| 6. Protein destination and storage | ||||
| AT1G14980 | Chaperonin 10 | 0.0061 | 2.5 | 3.0 |
| AT3G16420 | PYK10-binding protein 1 | 0.017 | 0.3 | 0.5 |
| AT5G56030 | Heat shock protein 81-2 | 0.0038 | 0.4 | 0.5 |
| AT1G03220 | Eukaryotic aspartyl protease | 0.0045 | 2.3 | 2.5 |
| 7. Transporters | ||||
| AT3G53420 | Plasma membrane intrinsic protein 2A | 0.031 | 0.3 | ns |
| AT3G42050 | Vacuolar ATP synthase subunit H | 0.045 | 4.4 | 4.2 |
| AT4G27500 | Proton pump interactor 1 | 0.0048 | ns | 2.3 |
| AT2G34250 | SecY protein transport | 0.011 | 2.5 | 3.9 |
| AT3G08530 | Clathrin, heavy chain | 0.0019 | 0.2 | 0.4 |
| AT3G11130 | Clathrin, heavy chain | 0.00054 | 0.3 | 0.4 |
| 8. Intracellular traffic | ||||
| AT2G29530 | TIM10 zinc finger protein | 0.021 | 6.0 | 5.0 |
| AT1G61570 | Mit. import inner membrane 13 translocase | 0.042 | 19.0 | 11.0 |
| 9. Cell structure | ||||
| AT4G30270 | Xyloglucan endotransglucosylase | 0.045 | ns | 3.0 |
| AT3G18780 | Actin 2 | 0.016 | 0.3 | ns |
| AT5G09810 | Actin 7 | 0.00073 | 0.5 | 0.5 |
| AT5G19770 | Tubulin alpha-3 | 0.044 | 0.5 | 0.3 |
| AT5G62690 | Tubulin beta chain 2 | 0.003 | 0.3 | 0.4 |
| AT2G29550 | Tubulin beta-7 chain | 0.0072 | 0.3 | 0.4 |
| AT4G14960 | Tubulin/FtsZ family protein | 0.019 | 0.4 | 0.3 |
| 10. Signal transduction | ||||
| AT3G14840 | LRR transmembrane protein kinase | 0.014 | 8.3 | 14.0 |
| AT3G51800 | Metallopeptidase M24 | 0.027 | 3.4 | ns |
| 11. Disease/Defence | ||||
| AT1G78850 | D-mannose binding lectin protein | 0.0013 | 14.0 | 18.0 |
| AT2G43610 | Chitinase family protein | 0.05 | ns | 0.3 |
| AT4G38740 | Rotamase CYP 1 | 0.02 | 2.6 | ns |
| AT1G20620 | Catalase 3 | 0.0064 | 3.5 | 2.1 |
Notes: no significant change against the mock treated samples.
Table 3.
Comparison differential protein accumulation in response to ABA and H2O2.
| Accession Number | Protein Name | H2O2 5 min | H2O2 20 min | ABA 5 min | ABA 20 min |
|---|---|---|---|---|---|
| 1. Metabolism | |||||
| AT1G17745 | D-3-phosphoglycerate dehydrogenase 2 | 0.1 | 0.1 | 0.1 | 0.2 |
| AT5G17770 | NADH:cytochrome B5 reductase 1 | 0.4 | 2.5 | 2.3 | 2.3 |
| 2. Energy | |||||
| AT2G05710 | Aconitase 3 | 2.5 | 12 | 8 | 9.9 |
| AT1G15120 | Ubiquinol-cytochrome C reductase hinge | 19 | 20 | 15 | 11 |
| 3. Transcription | |||||
| AT1G14850 | Nucleoporin 155 | ns | 0.3 | 0.1 | 0.2 |
| 4. Protein synthesis | |||||
| AT3G04400 | Ribosomal protein L14p/L23e | 3.8 | 3 | 3.5 | 2.6 |
| AT3G45030 | Ribosomal protein S10p/S20e | ns | 2.2 | 2.3 | ns |
| AT1G01100 | 60S acidic ribosomal protein family | ns | 0.4 | 0.4 | 0.4 |
| 5. Protein destination and storage | |||||
| AT1G14980 | Chaperonin 10 | ns | 2.9 | 2.5 | 3 |
| AT5G56030 | Heat shock protein 81-2 | 0.4 | ns | 0.4 | 0.5 |
| 6. Transporters | |||||
| AT4G27500 | Proton pump interactor 1 | ns | 2.4 | ns | 2.3 |
| AT3G08530 | Clathrin, heavy chain | 0.5 | 0.2 | 0.2 | 0.4 |
| AT3G11130 | Clathrin, heavy chain | 0.5 | 0.4 | 0.3 | 0.4 |
| 7. Intracellular traffic | |||||
| AT1G61570 | Mit. import inner membrane 13 translocase | 17 | 23 | 19 | 11 |
| 8. Cell structure | |||||
| AT5G09810 | Actin 7 | 0.5 | ns | 0.5 | 0.5 |
| AT4G14960 | Tubulin/FtsZ family protein | 0.4 | 0.5 | 0.4 | 0.3 |
| AT5G62690 | Tubulin beta chain 2 | 0.4 | 0.4 | 0.3 | 0.4 |
| AT2G29550 | Tubulin beta-7 chain | 0.3 | 0.4 | 0.3 | 0.4 |
| AT5G19770 | Tubulin alpha-3 | 0.1 | ns | 0.5 | 0.3 |
| 9. Signal transduction | |||||
| AT3G51800 | Metallopeptidase M24 family protein | 5.1 | ns | 3.4 | ns |
| AT3G14840 | LRR transmembrane protein kinase | ns | 11 | 8.3 | 14 |
© 2017 by the authors. Licensee MDPI, Basel, Switzerland. This article is an open access article distributed under the terms and conditions of the Creative Commons Attribution (CC BY) license (http://creativecommons.org/licenses/by/4.0/).
Share and Cite
MDPI and ACS Style
Alqurashi, M.; Thomas, L.; Gehring, C.; Marondedze, C. A Microsomal Proteomics View of H2O2- and ABA-Dependent Responses. Proteomes 2017, 5, 22. https://doi.org/10.3390/proteomes5030022
AMA Style
Alqurashi M, Thomas L, Gehring C, Marondedze C. A Microsomal Proteomics View of H2O2- and ABA-Dependent Responses. Proteomes. 2017; 5(3):22. https://doi.org/10.3390/proteomes5030022
Chicago/Turabian StyleAlqurashi, May, Ludivine Thomas, Chris Gehring, and Claudius Marondedze. 2017. "A Microsomal Proteomics View of H2O2- and ABA-Dependent Responses" Proteomes 5, no. 3: 22. https://doi.org/10.3390/proteomes5030022
Note that from the first issue of 2016, this journal uses article numbers instead of page numbers. See further details here.