Modeling Melanoma In Vitro and In Vivo

1
The Centenary Institute, Newtown, New South Wales 2042, Australia
2
School of Biological Sciences, Universiti Sains Malaysia, 11800 Georgetown, Penang, Malaysia
3
Discipline of Dermatology, University of Sydney, New South Wales 2006, Australia
4
The University of Queensland Diamantina Institute, Translational Research Institute, The University of Queensland, Brisbane, Queensland 4102, Australia
*
Author to whom correspondence should be addressed.
Healthcare 2014, 2(1), 27-46; https://doi.org/10.3390/healthcare2010027
Submission received: 12 November 2013
/
Revised: 7 December 2013
/
Accepted: 10 December 2013
/
Published: 23 December 2013
(This article belongs to the Special Issue Melanoma and Neoplasms of Skin)
Abstract
:The behavior of melanoma cells has traditionally been studied in vitro in two-dimensional cell culture with cells adhering to plastic dishes. However, in order to mimic the three-dimensional architecture of a melanoma, as well as its interactions with the tumor microenvironment, there has been the need for more physiologically relevant models. This has been achieved by designing 3D in vitro models of melanoma, such as melanoma spheroids embedded in extracellular matrix or organotypic skin reconstructs. In vivo melanoma models have typically relied on the growth of tumor xenografts in immunocompromised mice. Several genetically engineered mouse models have now been developed which allow the generation of spontaneous melanoma. Melanoma models have also been established in other species such as zebrafish, which are more conducive to imaging and high throughput studies. We will discuss these models as well as novel techniques that are relevant to the study of the molecular mechanisms underlying melanoma progression.
1. Introduction
Melanoma is the most aggressive and deadly form of skin cancer. Patients with distant metastases have a five-year survival rate of 16% [1] and a median survival of four to six months [2]. Until very recently, melanoma has been branded by the failure of chemotherapy and other therapeutic attempts. However, the discovery that 40%–50% of melanomas harbor activating BRAF mutations [3,4,5] prompted the development of selective BRAF inhibitors. The first specific ones were the lead compound PLX4720 [6], and the pharmacokinetically superior PLX4032/vemurafenib [7]. The extraordinarily quick bench-to-bedside history of this drug is a great example of using the appropriate melanoma models at different steps of preclinical development. Targeting oncogenic BRAF with PLX4720 or PLX4032 resulted in inhibition of growth and invasion of three-dimensional melanoma spheroids into a collagen matrix and caused tumor regression of melanoma xenografts without evidence of toxicity [6,7]. This was mirrored in phase II and phase III patient trials and has finally lead FDA-approval of vemurafenib; however, despite these unprecedented response rates, rapid onset of resistance is a major issue [4,5,8].
The interaction of cancer cells with the tumor microenvironment plays a major role in the function and regulation of cancer cells and is therefore a critical determinant of the response of cancer cells to therapeutic agents [9,10]. An important feature of a melanoma model system is that melanoma cells recapitulate their proliferative, migratory, and invasive properties. The ability to maintain features of the primary tumor can as well as tumor progression aid in the selection of the model system in which to study melanoma cells. The goal is to recreate, as closely as possible, the features of the tumor in the proper microenvironmental context. However, it is also important to consider factors, such as ease of use, data interpretation, cost, and applicability issues, such as genetic manipulation and drug delivery, when selecting a model system [11]. Here we will discuss the major model systems and their application in the study of melanoma.
2. Two-Dimensional Cell Culture
Most studies of melanoma cell biology and anti-melanoma drug activity have come from work done with two-dimensional (2D) adherent cell culture assays. Under these conditions, the cells are usually grown as monocultures on plastic tissue culture plates (Figure 1A,B). The principal advantages of such models are simplicity, convenience, and cost. The cells are grown in the manner to which they have been accustomed with maximal access to nutrients, oxygen, and applied drugs. It is often the case that drugs that do not work in 2D culture have no effect in more realistic models, thus, 2D assays are useful and required for preliminary high-throughput screens before employing more sophisticated preclinical models. There are of course drugs that rely on poor access to nutrients and oxygen, or upon metabolic conversion in an animal (such as dacarbazine), or which stimulate the immune response (e.g., interferons). 2D models are of no help in these cases.
In general, conventional 2D culture is utilized for selected assays, such as protein-expression, cytotoxicity, migration and adhesion assays. For example, the effect of drugs on proliferation is monitored by manual or automatic cell counting or by high throughput colorimetric or fluorescence assays based on metabolic activity or DNA content. Cell migration and invasion are assayed by the simple scratch (wound closure) and Boyden chamber assays, respectively. To study effects on different adhesion molecules [12,13], culture plates can be coated with the appropriate matrices.
Figure 1.
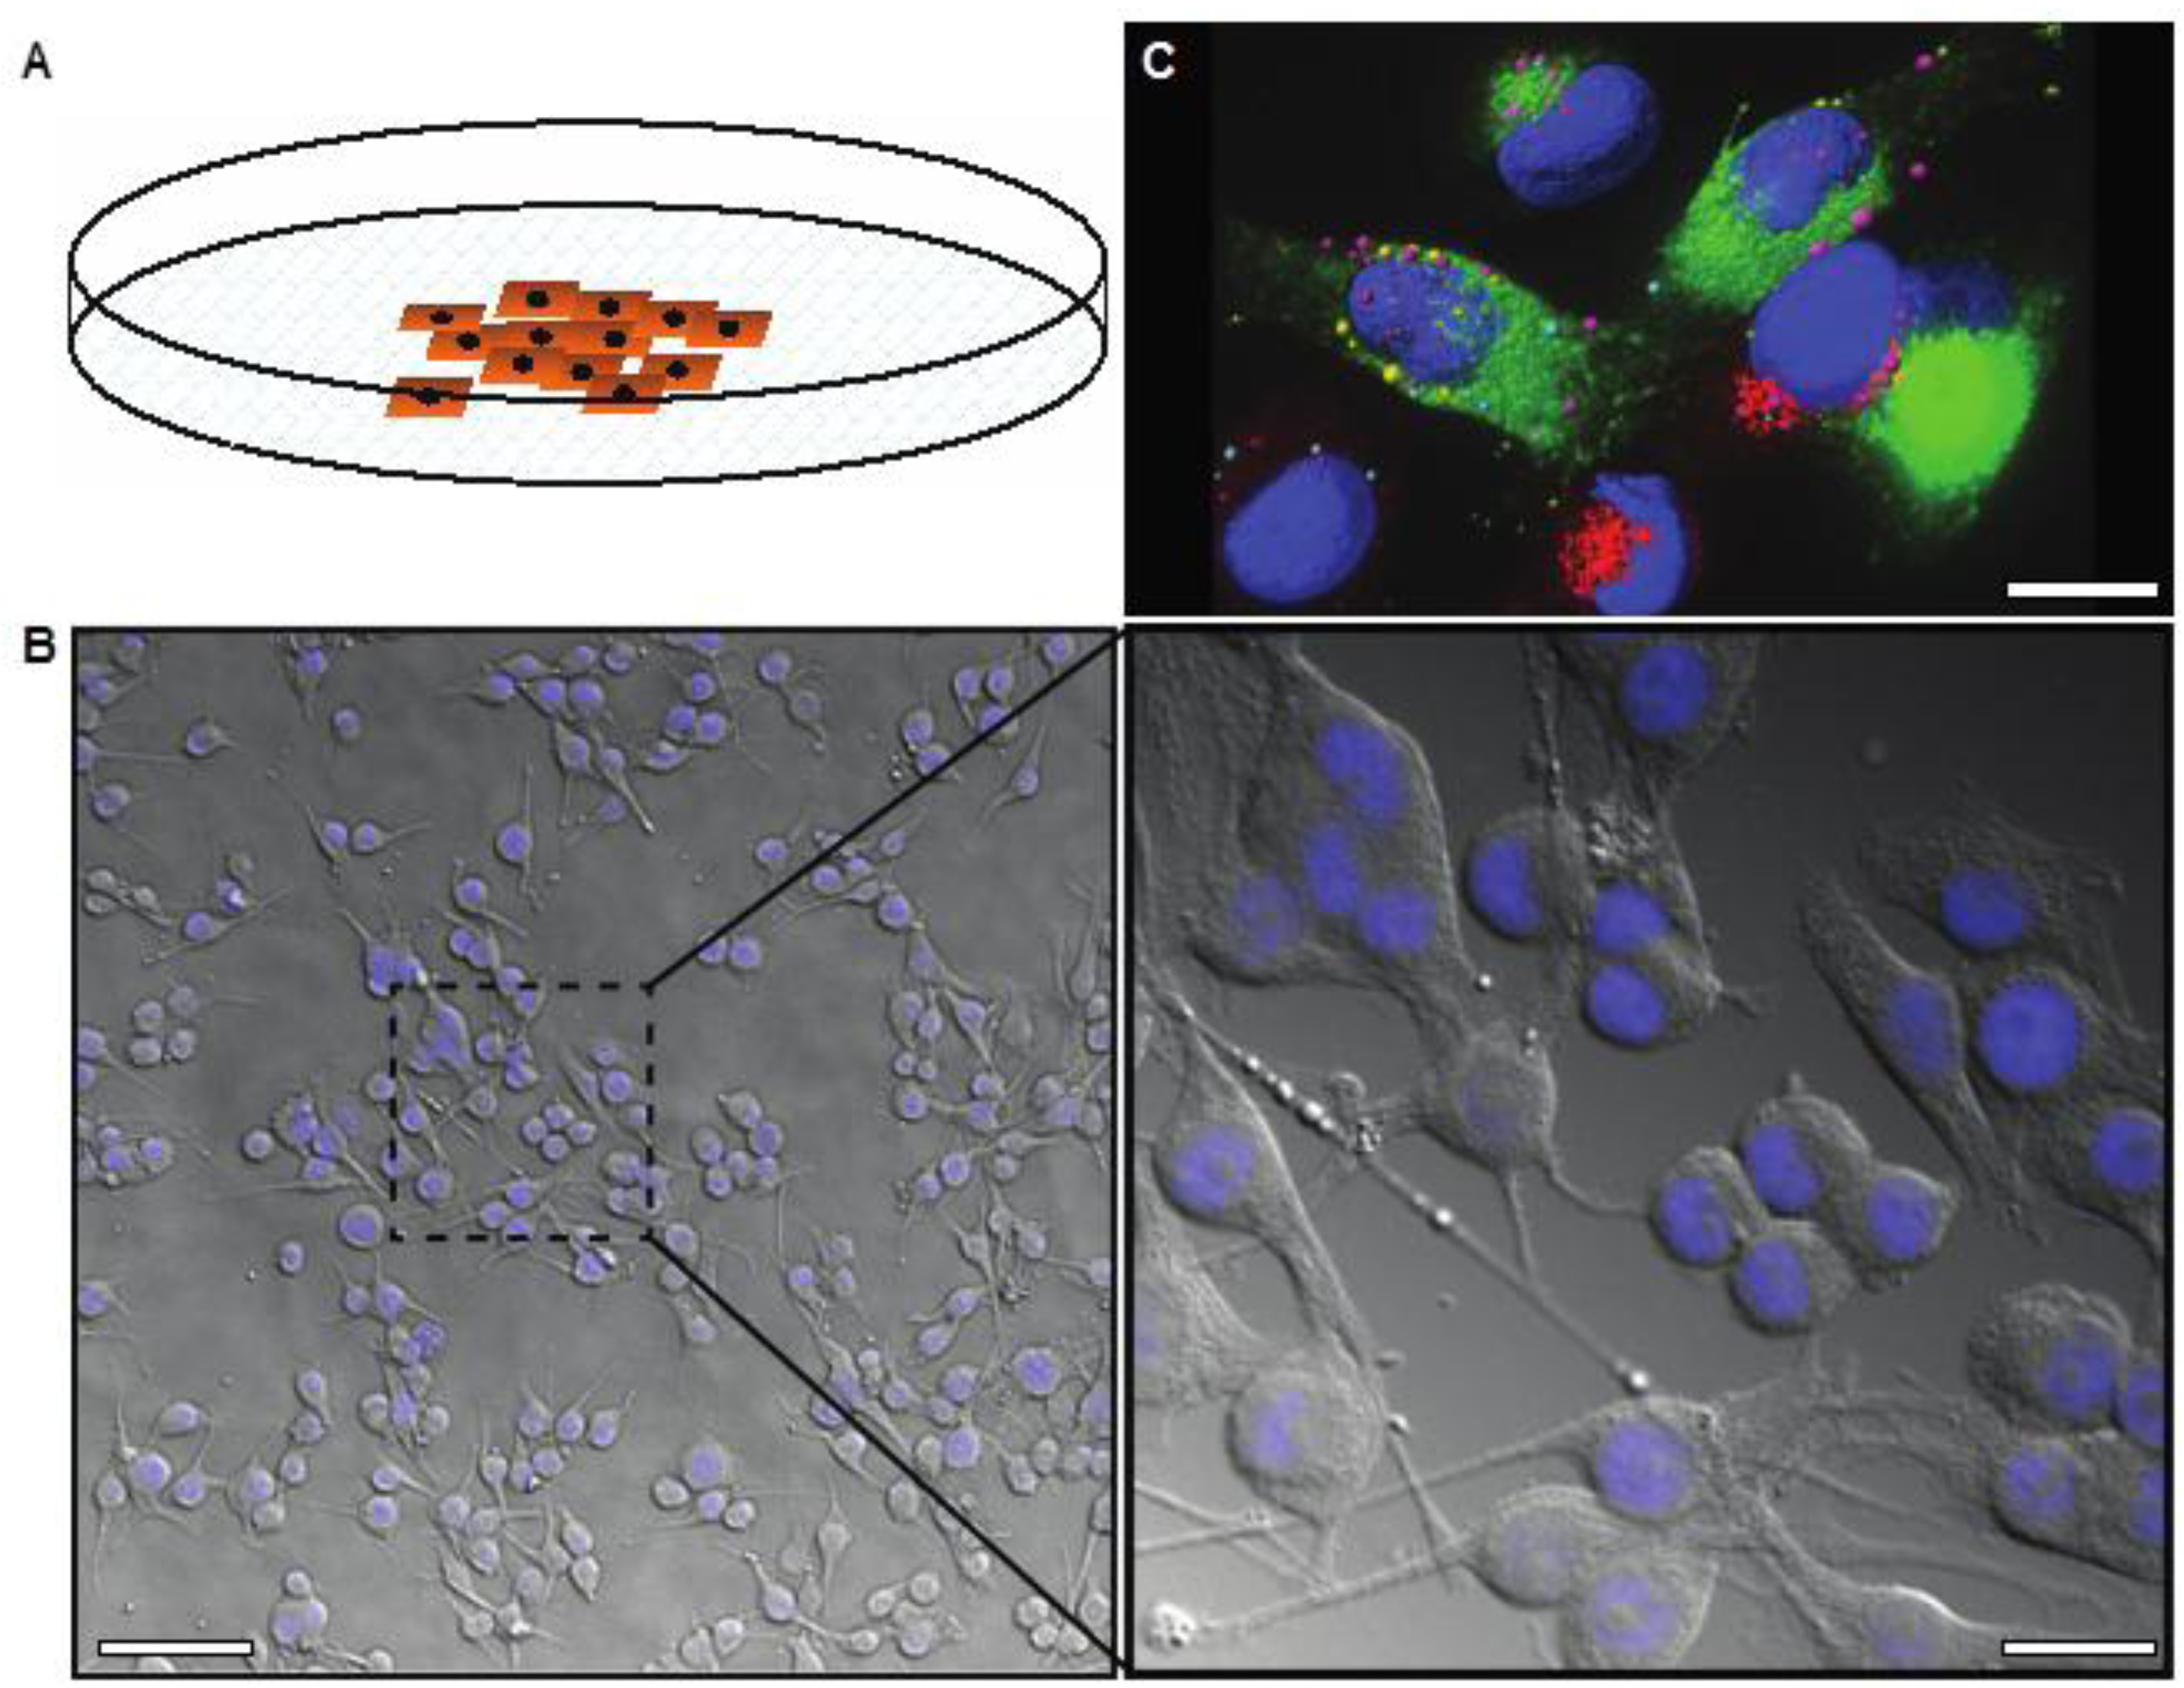
(A) Image showing two-dimensional cell growth in adherent cell culture in a plastic culture dish; (B) Differential interference contrast image overlaid with DAPI stain (nuclei, blue) demonstrating the morphology of melanoma cells in 2D culture, low and high magnification; (C) Deconvolved immunofluorescence image representing the highly complex internal structure of melanoma cells, labeled with markers for different endosomes or secretory vesicles (pink, red, or green) and the nucleus (blue). Scale bars: (B) 50 μm (left), 12 μm (right); (C) 6 μm.
Figure 1.
(A) Image showing two-dimensional cell growth in adherent cell culture in a plastic culture dish; (B) Differential interference contrast image overlaid with DAPI stain (nuclei, blue) demonstrating the morphology of melanoma cells in 2D culture, low and high magnification; (C) Deconvolved immunofluorescence image representing the highly complex internal structure of melanoma cells, labeled with markers for different endosomes or secretory vesicles (pink, red, or green) and the nucleus (blue). Scale bars: (B) 50 μm (left), 12 μm (right); (C) 6 μm.

Cells in 2D culture are easily visualized using conventional light microscopy (Figure 1B). There are no problems with light penetration, which can occur in thicker samples, and no autofluorescence due to other non-cellular structures that occur in tissue samples. Live imaging is also relatively simple with the use of humidified, temperature and gas controlled imaging chambers. Further, growing cells on thin glass coverslips or imaging plates allows optical sectioning and 3D rendering of fluorescently tagged cells/proteins can be performed using confocal or wide field deconvolution microscopy (Figure 1C). Intracellular trafficking, in particular aberrant protein trafficking, is becoming increasingly implicated in cancer cell biology, including melanoma [14,15]. High-resolution, live cell imaging is necessary in order to analyze these dynamic processes, as well as other dynamic processes important in cancer progression such as cell migration and invasion.
Monoculture experiments have the enormous advantage that they are pure and free from contaminating cells important for protein, RNA or DNA extraction. However, other cells in the microenvironment can influence the RNA expression or protein synthesis patterns. To allow for that, co-culture experiments are of advantage—this is especially important when studying the biology of melanocytes. While melanocytes in monoculture show aberrant proliferation behavior, morphology and RNA expression, or protein synthesis patterns, in co-culture with keratinocytes they exhibit a phenotype much more similar to that in vivo [16,17].
3. Three-Dimensional Cell Culture
Although adherent cell culture models are useful for investigating basic principles of tumor cell biology, they do not take into consideration that melanoma cells do not grow in isolation. Instead they are oriented in a three-dimensional space, establishing continuous dynamic interaction with the stroma, i.e., extracellular matrix and other cell types such as endothelial cells, fibroblasts, and immune cells. This is often referred to as the ‘tumor organ’ [18,19]. Therefore, growing melanoma cells in culture flasks is not always an adequate and reliable system to study melanoma biology and drug resistance [20,21,22]. Three-dimensional (3D) cultures represent a good compromise between the lack of a microenvironment encountered under 2D culture conditions and the great complexity of the in vivo animal models [18]. 3D cultures are inexpensive and less time-consuming than animal studies and are therefore a useful tool to prescreen single agent drugs and drug combinations. 3D models allow the researcher to narrow down the experiments that need to be done in animals and thus to reduce the number of animals used in preclinical studies. This has both an ethical and economical advantage.
3.1. 3D Spheroid Model
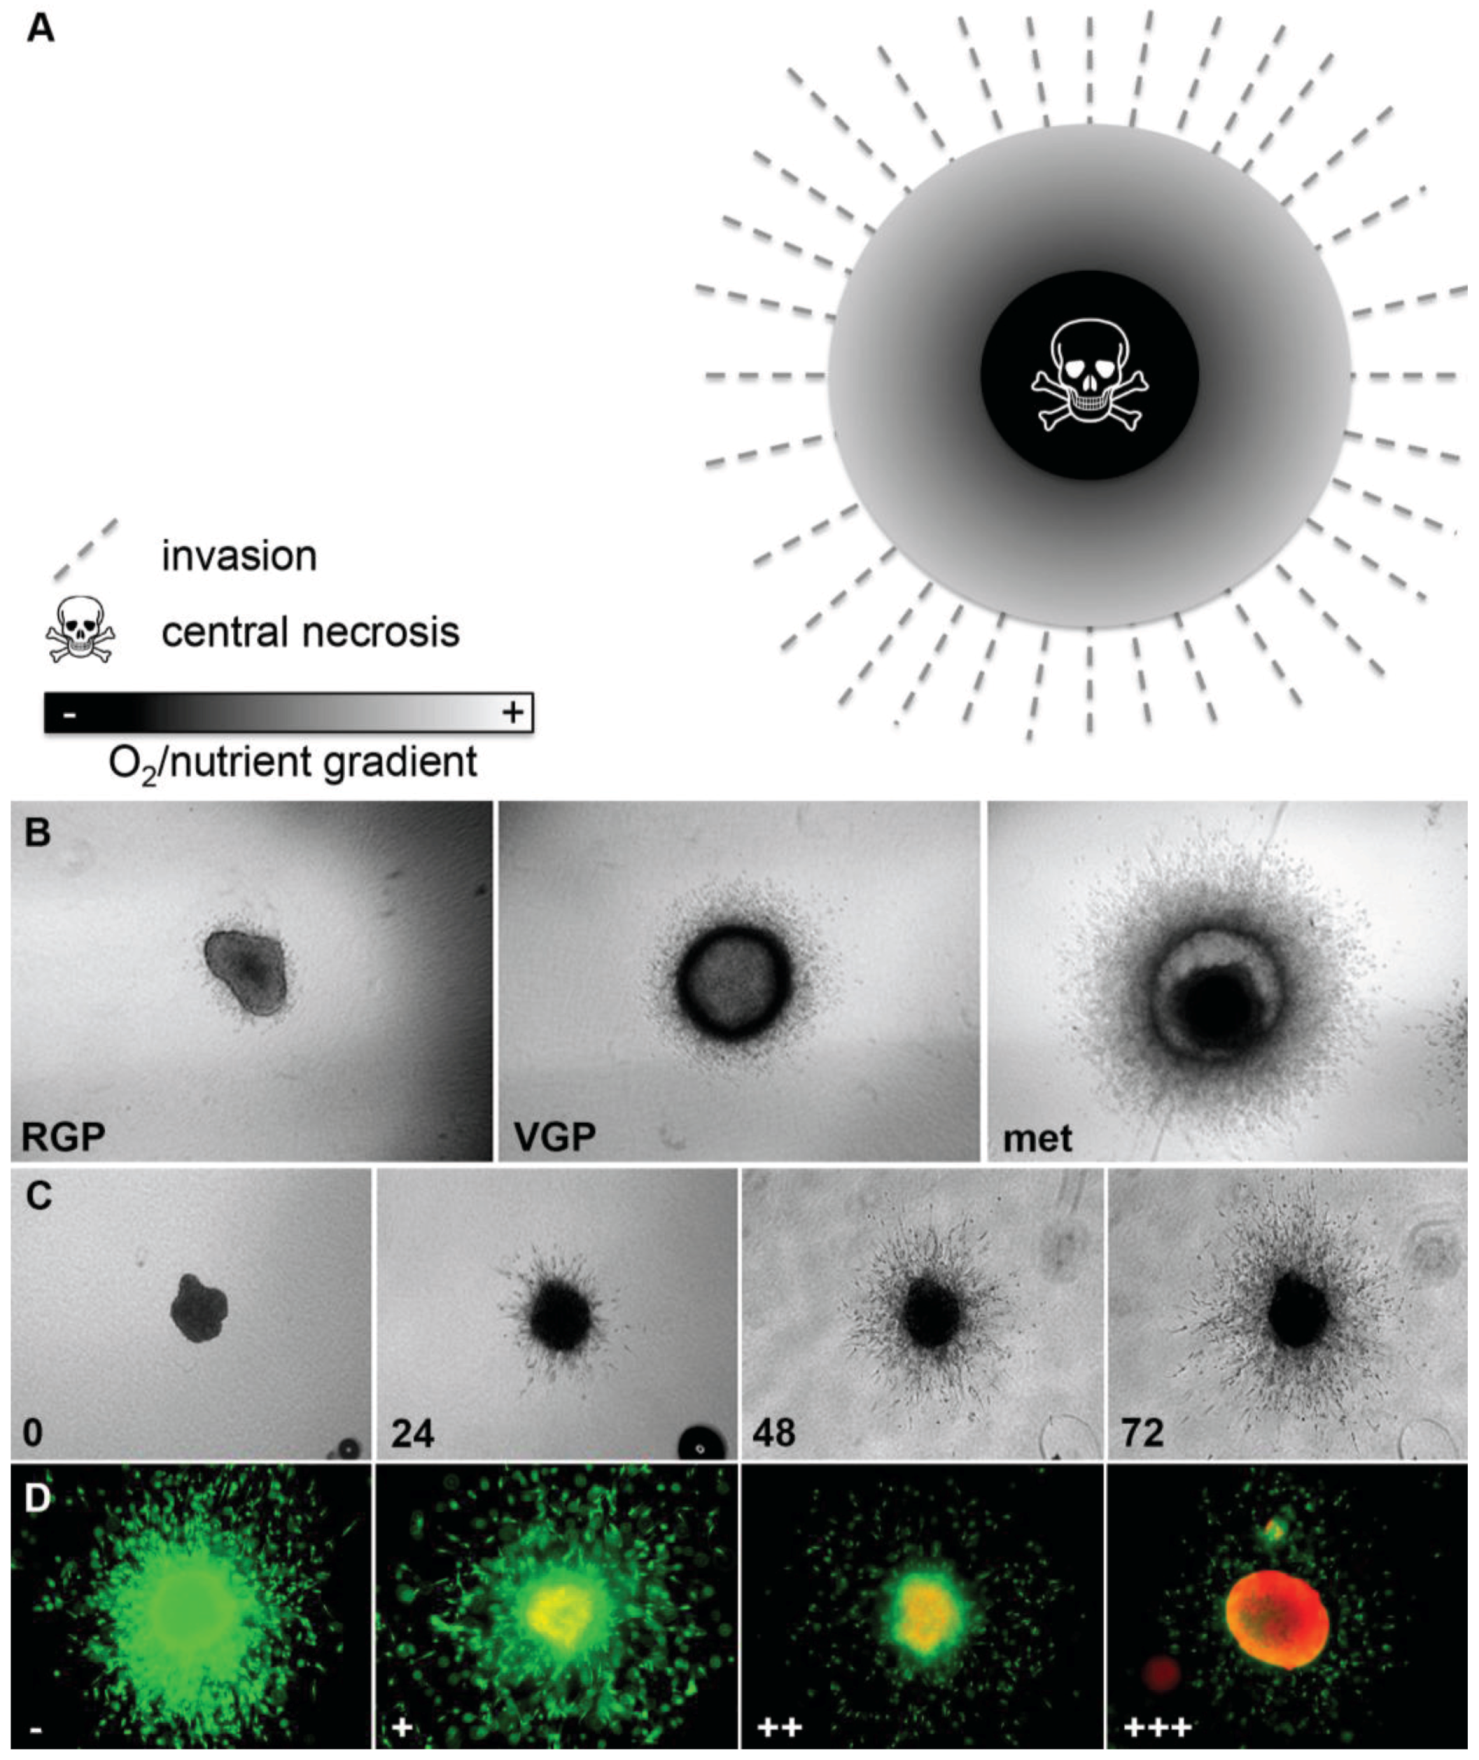
3D melanoma spheroids implanted into a collagen gel matrix mirror the in vivo tumor architecture and microenvironment more closely than adherent cell culture [11,18,23]. We have previously described the generation of spheroids using the liquid overlay method and the technical aspects of this model in detail [18,23]. This model mimics the tumor heterogeneity seen in vivo as it recreates the oxygen/nutrient gradient with a hypoxic zone and a central necrosis and allows interaction between melanoma cells and their stroma (Figure 2A). For example, activity of the extracellular signal-regulated kinase (ERK), which indicates proliferative activity, is homogeneous in 2D culture and can be inhibited totally through treatment with small-molecule inhibitors of the MAPK pathway [24]. In contrast, in 3D spheroids ERK-activity is mainly found in the growing periphery [24], similar to melanoma lesions in patients [25], indicating that this heterogeneous sub-compartmental expression of active signaling molecules in solid tumors will have important implications for the successful translation of novel targeted therapies or combinations. Furthermore, the 3D spheroid model faithfully recapitulates the behavior of melanomas in vivo in that cell lines of different origin (i.e., primary tumors, radial (RGP) and vertical growth phase (VGP), and metastasis-derived cells) display different growth and invasion characteristics reflecting the original state of aggressiveness (Figure 2B) [23]. This close resemblance to the situation encountered in vivo facilitates more realistic study of melanoma growth, invasion (Figure 2C), and drug response (Figure 2D and Figure 5A,B). For example, targeting oncogenic BRAF with PLX4720 or PLX4032 resulted in inhibition of growth and invasion of 3D spheroids and caused tumor regression of melanoma xenografts [6,7], which was mirrored in phase II and phase III patient trials and has finally lead FDA-approval of vemurafenib [4,26]. Similarly, we have utilized the spheroid model to study the contribution of zonula occludens protein 1 (ZO-1) to the oncogenic behavior of melanoma [27], the response to MEK-inhibitors (MAPK pathway) and/or PI3K-inhibitors (PI3K/AKT/mTOR pathway) [23,24], BH3-mimetics (intrinsic apoptosis pathway) [20,21], and a novel class of anti-tropomyosin compounds (cytoskeleton) [28]. While in most of these studies 72-h spheroid assays predicted the outcome in xenograft studies in vivo [6,7,24,28], this did not seem to be the case in the BH3-mimetic study [20]. To model the growth of xenografts that did not respond to the drug, spheroids were here allowed seven days growth before treatment with the BH3-mimetic ABT-737, resulting in a noticeable effect on viability in the periphery of the spheroids but not the center, suggesting that diffusion of this particular drug into larger melanoma masses may be limiting [20]. Thus, this model can be utilized to study both drug efficacy and bioavailability.
Another advantage of the 3D spheroid model is its versatility. The collagen gel itself can be easily manipulated to alter elasticity and stiffness. Increased substrate stiffness results in activation of the non-receptor focal adhesion kinase (FAK) and small GTP binding protein (RhoGTPase) pathways, leading to increased cell proliferation and invasive phenotype changes including changes in gene expression [29].
There are alternative methods. For example, Kramer and colleagues described a modified spheroid migration assay, in which tumor spheroids are formed and applied to confluent fibroblasts (e.g., cancer associated fibroblasts, CAFs), which are grown on a conventional plastic dish. This ‘2D/3D hybrid’ model can be used to analyze the migratory changes upon interaction between the two cell types [30]. Ghajar and colleagues have used fibrin hydrogels instead of collagen I gels for 3D spheroid studies [31]. The basement membrane matrix secreted by Engelbreth-Holm-Swarm (EHS) mouse sarcoma cells (Matrigel®, San Jose, CA, USA) is commonly used for 3D culture assays. Its heterogeneous composition is an advantage and disadvantage at the same time. Advantage because it provides all components to create an ideal environment for cancer cells. Disadvantage because this heterogeneity is difficult to control. In contrast, the above-described collagen I system is well defined. If additional components (e.g., certain growth factors or even other additional cell types) are needed, they can be easily added to the system [32].
3.2. Tumor Sphere Model
Growth of melanoma spheres was initially developed because it was thought that the stem cell conditions would enrich an otherwise small ‘cancer stem cell’ population [33,34]. Whether these conditions are really enriching for true melanoma cancer stem cells is controversial [35]. However, growing melanoma cells as spheres has been shown to increase tumorigenicity and heterogeneity. Long-term non-adherent growth of cells in “spheres” is achieved via growth of cells in non-adherent plates [36], or via spontaneous formation of spheres in adherent monoculture in the presence of stem cell media [33,37]. Similar to the spheroid model—melanoma spheres can also be implanted into different matrices to assay melanoma growth and invasion.
Figure 2.
Melanoma spheroid model. (A) Image demonstrating oxygen and nutrient gradient within a 3D spheroid, central necrosis and invasion of melanoma cells into the tumor stroma; (B) Growth and invasion behavior of melanoma spheroids reflects that of the original tumors: radial (RGP), vertical growth phase (VGP), metastasis (met); (C) Growth and invasion of a spheroid derived from a metastatic cell line (numbers: time in h); (D) Spheroid treated with increasing doses of the BRAF inhibitor vemurafenib (−, +, ++, +++) and stained with a live/dead assay (green: calcein-AM, live; red: ethidium bromide, dead). Note the increasing growth and invasion inhibition, as well as cell death.

3.3. 3D Skin Reconstruct Model
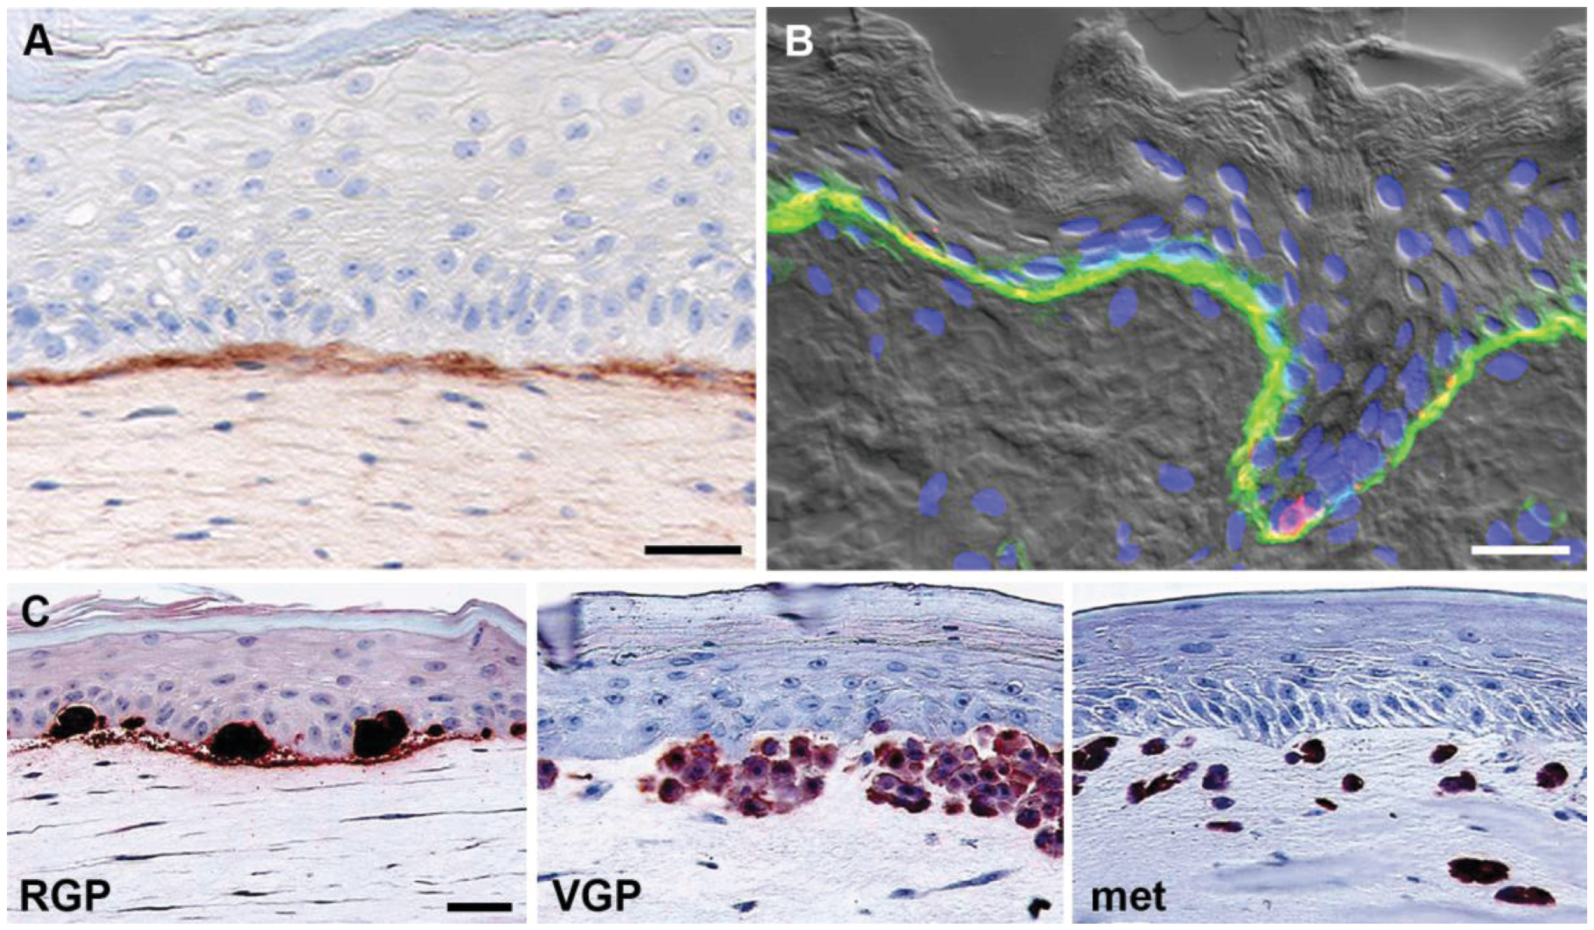
Skin reconstructs consist of artificial skin rebuilt from isolated cell populations and composed of a stratified, terminally differentiated epidermal compartment of keratinocytes and melanocytes, a dermal compartment consisting of fibroblasts embedded in collagen, and a well established basement membrane deposited by skin cells (Figure 3A) [38,39]. We have previously described the generation of 3D skin reconstructs and the technical aspects of this model in detail [18]. Reconstructed skin closely resembles histologically human skin (Figure 3B) in architecture and composition, with all major cell types represented in physiologically relevant ratios. In human skin reconstructs, melanoma cells from different stages of progression have the same properties as in the patients’ skin, i.e., cells derived from a melanoma in situ/RGP are unable to invade the dermis from the epidermis, whereas advanced primary (VGP) and metastatic melanoma cells readily invade the dermis (Figure 3C) [12,38,39]. A number of recent studies have assessed the effects of novel anti-cancer drugs in 3D skin reconstructs. For example, we made use of this model to show that selective BRAF-inhibitors (PLX4720 and vemurafenib) are capable of decreasing proliferation, as well as inducing apoptosis in mutant BRAF melanomas, while non-transformed cells were unaffected indicating that therapeutic toxicities in patients may be minimal [6,7]. Meier and colleagues reported that combinations of MAPK and AKT inhibitors completely suppressed invasive tumor growth of melanoma cells in a similar model of regenerated human skin [40].
Figure 3.
3D skin reconstruct model. (A) Model: Keratinocytes and fibroblasts in human skin reconstructs produce a basement membrane (stained with a monoclonal antibody against collagen IV). Note the clear demarcation of the basement membrane; (B) Skin: Human fetal foreskin stained with a monoclonal antibody against α6 integrin (green) and the melanocyte marker HMB45 (red), highlighting the continuous basement membrane between epidermis including basal keratinocytes and melanocytes (co-localization, yellow) and dermis. Note the similarity between model and original; (C) Melanoma cells recapitulate original tumor phenotype in reconstructed skin. Melanoma cells were stained for S100. Radial growth phase (RGP) melanoma cells proliferate and form nests in the epidermis, but do not invade the dermis. Vertical growth phase (VGP) cells cross the basement membrane, invade and proliferate in the dermis. Cells from metastatic (met) melanoma rapidly invade deep into the dermal compartment. Figure adapted from Haass et al., 2005 [12] and Santiago-Walker et al., 2009 [11]. Scale bars: 30 μm.

These 3D skin reconstruct models, which are technically demanding and require constant monitoring by trained personnel during the prolonged culture times of up to 21 days, are mainly used for studying the biology and drug response of melanoma cells at early stages, i.e., when they are still part of the cross-talk between epidermis and dermis. In contrast, the above-discussed 3D spheroid model is used for high-throughput proliferation, invasion and drug response assays mimicking distant metastatic melanoma, where the context to the skin is lost.
3.4. 3D Neoangiogenesis Model
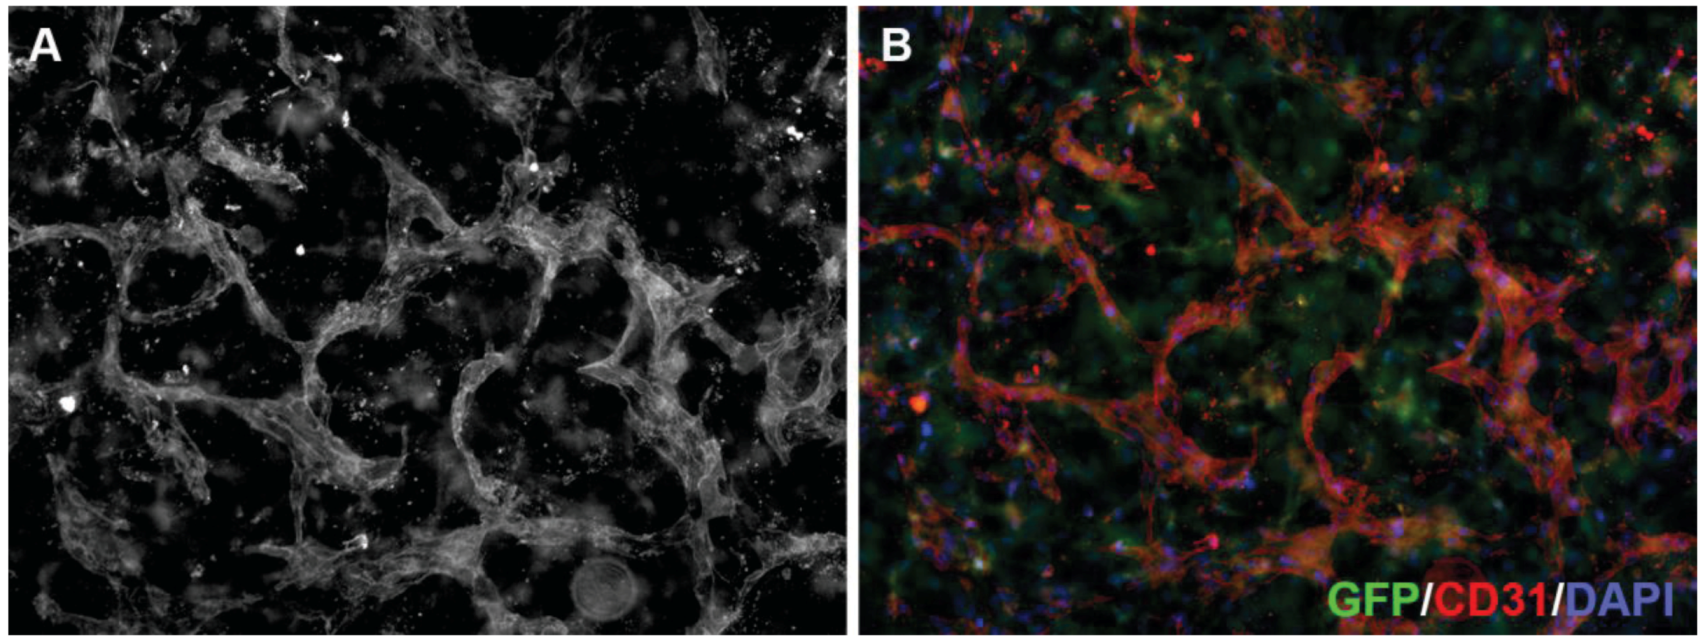
Oxygen and nutrient supply is an important factor for solid tumor cell survival and proliferation [41,42]. Tumors quickly grow beyond the reach of the physiological blood supply and thus form their own tumor vasculature. This complex process, driven by the secretion of pro-angiogenic factors from the tumor cells themselves and from the tumor stroma cells, is called neoangiogenesis. These tumor blood vessels are—in contrast to normal blood vessels—disorganized, tortuous and often leaky [43]. Many cancer therapies are directed against the tumor vasculature. The common view is that anti-angiogenic therapy should destroy the tumor vasculature, thereby depriving the tumor of oxygen and nutrients. However, there is emerging evidence supporting the hypothesis that anti-angiogenic agents can also transiently ‘normalize’ the abnormal structure and function of tumor vasculature to make it more efficient for oxygen and drug delivery [43]. It is, thus, very important to assess on- or also off-target anti-angiogenic activity of novel drugs. This can be addressed in vitro using the 3D neoangiogenesis model, the generation and technical aspects of which have previously been described in detail [18,44]. As early MAPK pathway inhibitors were known to be multikinase inhibitors that also affected (neo)angiogenesis (e.g., sorafenib inhibits not only RAF but also VEGFR (Vascular Endothelial Growth Factor Receptor) and PDGFR (Platelet Derived Growth Factor Receptor)), we utilized this model to show that the MEK inhibitor AZD6244 despite strong activity in melanoma cells has no significant effect on angiogenesis (Figure 4) [24].
Figure 4.
3D neoangiogenesis model. Human microvascular endothelial cells grown in a collagen gel containing green fluorescent protein (GFP)-expressing fibroblasts (green in B) for 144 h to allow the formation of a three-dimensional vascular network, were fixed and incubated with an antibody against CD31 (A; red in B) and stained with DAPI (blue in B). Tube formation and branching frequency are used to quantify anti-angiogenic drug effects.

4. Xenograft Models
Preclinical testing of anti-cancer drugs currently employs an approach in which efficacy endpoints are determined by the growth responses of established human melanoma cell lines after subcutaneous engraftment into immunocompromised mice (cell line xenografts) [45]. This model allows human melanoma cells to directly establish interactions with the murine stroma, including lymphatic and blood vessels and therefore allows the investigation of growth behavior and drug response of human melanoma cells in vivo (Figure 5). Moreover, utilization of standardized techniques (i.e., same number, passage and culture conditions of injected cells) allows relative control over the timing of tumor growth and the time points of drug administration leading to easily comparable data. Most commonly cells are injected subcutaneously and less frequently intradermally. While the latter reflects the situation of a primary melanoma it has the disadvantage that tumor formation can quickly cause ulceration of the thin mouse skin and therefore to forced termination of the experiment. Subcutaneous injection leads to a tumor more comparable to a skin metastasis.
Figure 5.
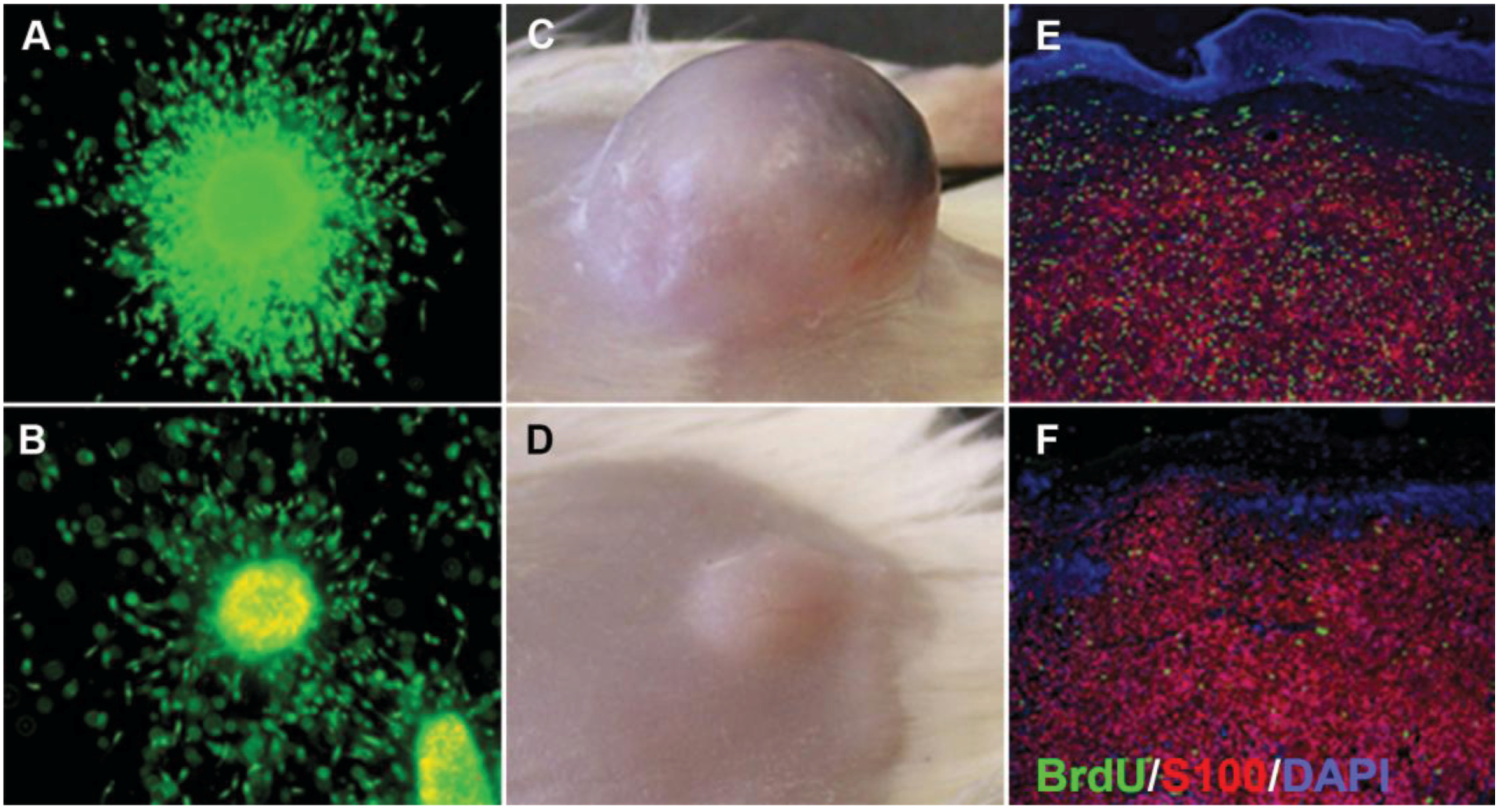
Comparison of 3D melanoma spheroid and xenograft. (A) Untreated spheroid; (B) spheroid treated with 10 μM selumetinib (MEK1/2 inhibitor AZD6244; Astra Zeneca) and stained with a live/dead assay (green: calcein-AM, live; red: ethidium bromide, dead). Note growth and invasion inhibition as well as increased cell death in the treated spheroid; (C) Untreated xenograft; (D) xenograft after treatment with 50 mg/kg selumetinib. Note the growth inhibition of the treated tumor. Sections of an untreated (E) and treated (F) xenograft stained for BrdU (green; proliferation marker), S100 (red, used here as a melanoma marker), and DAPI (blue, nuclear marker) showing a decrease in BrdU uptake after selumetinib treatment. Figure adapted from Haass et al., 2008 [24].
Figure 5.
Comparison of 3D melanoma spheroid and xenograft. (A) Untreated spheroid; (B) spheroid treated with 10 μM selumetinib (MEK1/2 inhibitor AZD6244; Astra Zeneca) and stained with a live/dead assay (green: calcein-AM, live; red: ethidium bromide, dead). Note growth and invasion inhibition as well as increased cell death in the treated spheroid; (C) Untreated xenograft; (D) xenograft after treatment with 50 mg/kg selumetinib. Note the growth inhibition of the treated tumor. Sections of an untreated (E) and treated (F) xenograft stained for BrdU (green; proliferation marker), S100 (red, used here as a melanoma marker), and DAPI (blue, nuclear marker) showing a decrease in BrdU uptake after selumetinib treatment. Figure adapted from Haass et al., 2008 [24].

Some cell lines metastasize spontaneously from these primary xenograft sites to distant sites such as the lung, so that this model can also be used to study spontaneous metastasis. However, not all cells of a subcutaneous xenograft have the capacity to metastasize readily. Isolation of cells that have spontaneously metastasized to the lung and re-grafted subcutaneously for several passages through immunosuppressed mice leads to selection for an aggressive metastatic sub-population of the originating cell line (e.g., 1,205 Lu and 451 Lu are selected aggressive metastatic sub-lines of WM793B and WM164, respectively). These studies demonstrate that melanoma cells, derived from a heterogeneous population, have distinct phenotypic characteristics, suggesting that metastases are produced by the selective growth of specialized aggressive subpopulations of metastatic cells that pre-existed in the parent tumor [46,47].
Alternatively, tumor cells can be injected into the tail vein to force ‘metastasis’ to the lungs. However, although this approach is frequently used as a metastasis model, it does not represent the actual events of metastasis in a patient scenario, as the first steps of metastasis from the primary tumor into lymph or blood vessels are bypassed in this model [48].
The limitation of established cell lines is that due to continuous selection they eventually differ significantly from the originating cells. As a consequence cell line xenograft models are often poorly predictive of clinical outcome, and drugs tested positive in this model often fail in clinical trials [45]. Hence, more recently it has become a standard to use primary melanoma cells rather than established melanoma cell lines for xenografting. To determine the percentage of tumor-initiating melanoma cells, numbers of primary melanoma cells have been titered down to single cells to generate xenografts in NOD/SCID IL-2 receptor gamma chain knockout (NSG) mice [49]. Another technique is the orthotopic patient-derived xenograft, in which fresh biopsy samples are implanted subcutaneously into NSG mice. By creating avatars of a patient’s melanoma that has relapsed on a drug, ‘mini human-in-mouse trials’ or ‘co-clinical trials’ can be conducted to facilitate the selection of effective drugs, drug combinations, and dosing regimens for that specific patient [45].
Melanoma xenografts, whether they use established cell lines or primary tumor cells, subject transplanted cells to strong selection for defective apoptosis. Moreover, xenografts do not grow in their natural tissue setting. Even orthotopic xenograft models are approximations that do not perfectly reproduce the microenvironment of a tumor during its development. Similarly, xenografts require immunodeficient hosts and, thus, do not grow in the context of an intact immune system. This can be overcome by utilizing a syngeneic xenograft model. The most widely used syngeneic model is the B16 cell line series, which was originally derived from a chemically induced melanoma arising in C57BL/6J mice [50]. While this model is good for studying immune response, its major disadvantage is the use of murine melanoma cell lines, which are limited in their range and are not a good match for the human counterparts. The B16 model is limited due to it being derived from an inbred mouse strain with little genetic diversity. In addition, mouse melanoma cells differ from human melanoma cells in several important respects, such as the mutatome [51,52]. Finally, while there is a large number of human cell lines with various genotypes and phenotypes, there is only one murine cell line with different subclones [48]. To overcome this issue, human melanoma cells can be xenografted into so-called humanized mice, in which a functional human immune system is generated by introducing human CD34+ hematopoietic stem cells into mice previously subjected to gamma irradiation-induced myeloablation [45]. While this approach is relatively new and expensive, classic genetically defined predisposed mouse models provide useful information that complements in vitro and xenograft studies.
5. Genetically Engineered Mouse Models (GEM)
Mice rarely develop melanoma spontaneously, but can be genetically manipulated (transgenic and/or knockout mice) to do so by activating oncogenes relevant to human melanoma, such as mutant BRAF or mutant NRAS, and/or via inactivation of key tumor suppressors, including CDKN2A or PTEN, i.e., they harbor defined genetic aberrations, which mimic the genetic lesions (or their consequences) that occur in human melanomas [45]. In these GEM tumor models, tumors normally occur spontaneously and—importantly—at their natural site. Unintended selection for cells that are resistant to apoptosis, an unavoidable problem with cell-line-based models, is obviated. Mice can also be manipulated to include other mutations to test their effects on drug sensitivity or resistance of the model melanomas. Unlike xenograft hosts, mice used for GEM models have a fully functional immune system, which impinges on tumor growth. They therefore serve as reliable and repeatable (every tumor has the same basal mutations) models to study the role of altered genes/pathways and the role of the immune system cells in melanoma biology and drug resistance [53,54]. The main challenge of utilizing GEM models is the cost and the effort involved.
It is also important to consider the different histology to human skin: Mouse melanocytes are located in the hair follicles and are mainly responsible for the pigmentation of the mouse fur. In contrast, in human skin there are interfollicular melanocytes, which are responsible for delivering pigment to the surrounding keratinocytes to protect epidermal cells from ultraviolet irradiation-induced genetic damage. Thus, melanomagenesis may not happen at the same site or may be different altogether in human and mice.
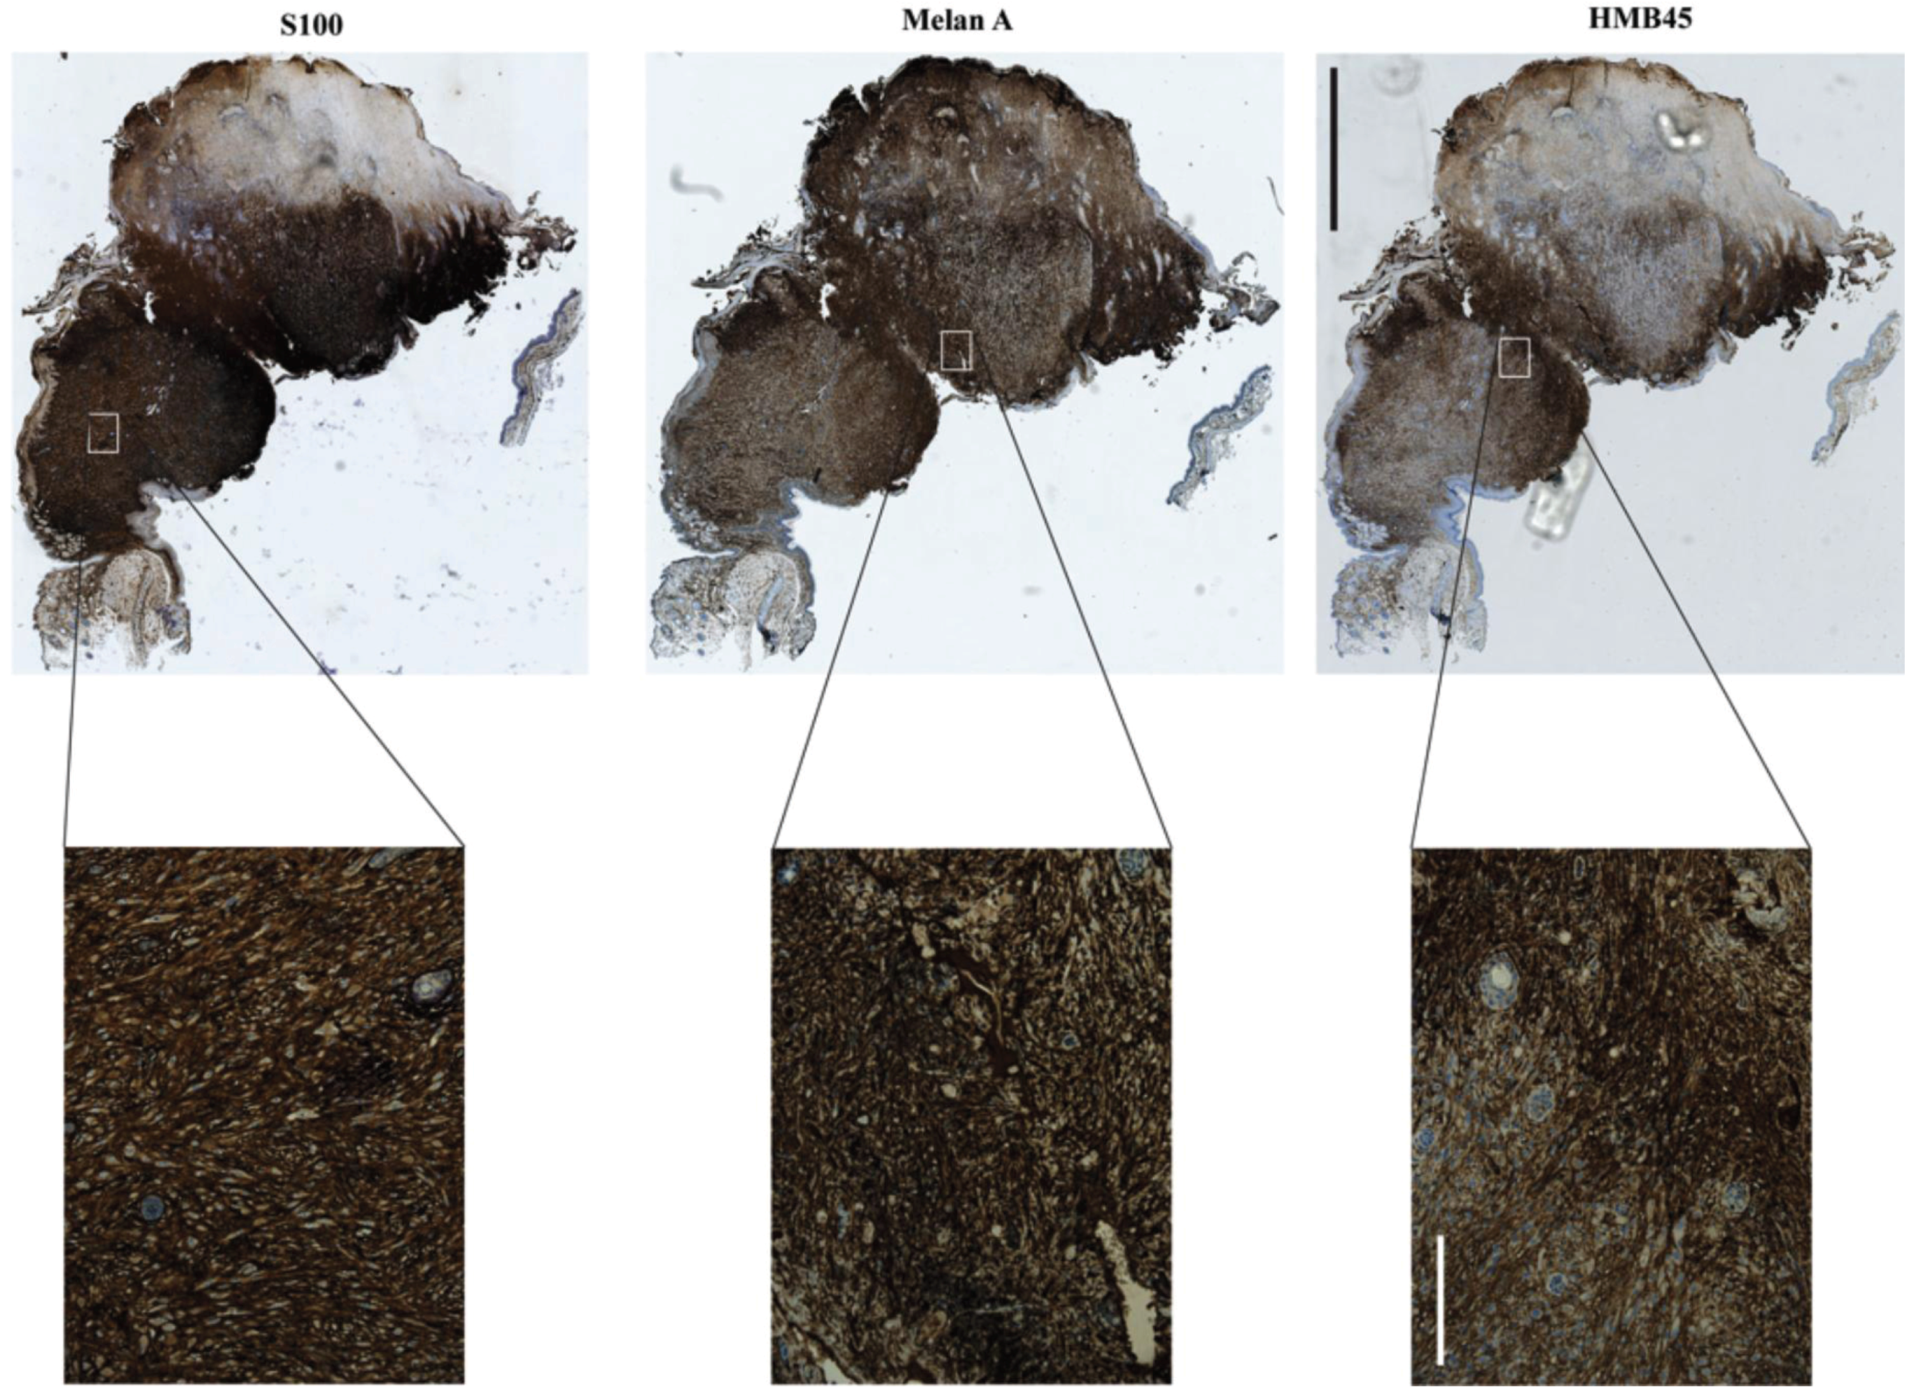
The first transgenic mouse melanoma model was the Tyr-SV40 model. In this model SV40, which represses p53 and pRb, is under control of a tyrosinase promoter active throughout the melanocyte lineage and melanomas develop either spontaneously or after UV irradiation [55]. Lynda Chin and colleagues developed one of the first mouse melanoma models targeting more melanoma-specific genes: the Cdkn2a−/−, Tyr-HRAS model [56]. This model is null for both products of the Cdkn2a locus, p16INK4A and p19ARF, mirroring this common lesion in human melanomas, and it carries the HRAS transgene under control of the tyrosinase promoter, activating the MAPK pathway, as occurs in human melanomas through NRAS or BRAF mutation. Cdkn2a−/−, Tyr-HRAS mice develop spontaneous melanoma (Figure 6) before other tumors in the majority of cases [56]. However, Cdkn2a−/−, Tyr-HRAS melanomas do not metastasize and other cancers, predominantly B cell lymphomas and soft-tissue sarcomas, also occur [57].
Dhomen and colleagues developed a melanoma model driven by BRafV600E, however, the long latency required for the development of melanomas demonstrated that additional genetic lesions were required [58]. Most notably, Dankort and colleagues developed a mouse melanoma model in which BRafV600E cooperates with Pten loss to induce metastatic melanoma [59]. This model provides a system to study features of melanoma metastasis and evaluate drugs, which could be used to prevent melanoma metastasis. The Wnt/β-catenin signaling pathway is frequently upregulated in melanoma but its functional implication is unclear. Damsky and colleagues studied the functional role of β-catenin by modulating it in the BRafV600EPten−/− model. They showed that β-catenin is the mediator of melanoma metastasis to lymph nodes and lungs. In addition to its role in metastasis, β-catenin levels control cell differentiation and regulate both the MAPK and the PI3K/AKT signaling pathways [60].
Figure 6.
Spontaneous melanoma, which manifested on the ear of a UVB irradiated Cdkn2a−/−, Tyr-HRAS mouse. Staining positivity for all three markers (S100, Melan A and HMB45) as well as their pattern and localization are indicative of melanoma. Scale bars are 2 mm for the low (5×) and 200 μm for the high magnification (20×) images.

Locally invasive melanoma and distant metastatic phenotypes were reported in the HGF/SF-transgene Ink4aARF−/−, Tyr-N-RasQ61K INK4A−/− and in the BRaf V600E Pten−/− mouse models of melanoma [59,61,62]. Inducible GEM model systems as well as the novel retrovirally-based gene transfer model (RCAS/TVA) permits temporal and spatial control of gene expression, which facilitates tumor progression and maintenance studies. Tumors evolve from mutations in developmentally normal cells in the context of an unaltered microenvironment, which closely mimics the context of human disease [45,63].
Chemical carcinogens, such as 7,12-dimethylbenz(a)anthracene (DMBA) and 12-O-tetradecanoylphobol-13-acetate (TPA), applied topically to the skin, have been used to induce melanoma in mice, or to decrease the latency of melanomagenesis. The application of chemical carcinogens can be replaced by UVB irradiation on the grounds that UVB exposure is part of the etiology of human melanoma and because of the ease to irradiate newborn mice evenly and consistently in contrast to the application of mutagens.
6. Other Animal Models
6.1. Fish Models
As outlined in the previous section, mouse models are commonly used in cancer research, since mice are physiologically most similar to humans, with directly comparable cell lineage and differentiation pathways. However, fish models of melanoma have several advantages over mouse models. Fish have a much shorter generation time, large number of progeny, low cost/small housing and there is the ability to do high throughput studies [64]. The first fish models of both spontaneous and induced melanoma formation were discovered in the genus Xiphophorus (platyfish and swordtails) [65,66,67]; Steven Kazianis was one of the pioneers in this field [68]. The spontaneous melanoma that developed in certain strains of Xiphophorus is histologically similar to human melanoma. These studies have shed light on several genes that are involved in melanoma development.
More recently, transgenic fish melanoma models have been developed in zebrafish Danio rerio [69] and in medaka Oryzias latipes [70]. Of these, especially, zebrafish have been gaining popularity recently as a model for melanoma as well as other cancers [71]. Due to the transparency of their embryos, which develop externally, high-resolution visualization of transplanted fluorescent melanoma cells in vivo is possible with relative ease [72]. Genetic manipulation in these fish is simple, with transgenes or morpholinos injected into the embryo (at the single cell or later developmental stages). The most famous use of zebrafish in melanoma was to demonstrate the role of the BRAF V600E mutation in nevus formation, and to show that an additional mutation was needed to develop melanoma [69]. Further, the zebrafish model has been proven to be useful for drug screening [64,73].
6.2. Avian and More Mammalian Models
In addition to the above-discussed mouse models, there is a variety of other mammalian melanoma models including Syrian hamster [74], swine [75,76], horse [77,78,79], and gray short-tailed opossum Monodelphis domestica [80].
Very elegant is the chick embryo melanoma model [81,82,83,84,85]. The neural tube transplant serves as a model for spontaneous neural crest migration; while there is spontaneous neural crest migration of melanoma cells, this is not the case for primary human melanocytes. The optic cup transplant serves as a model for melanoma invasion and the rhombencephalon transplant as a model for brain metastasis [85,86].
7. Conclusions
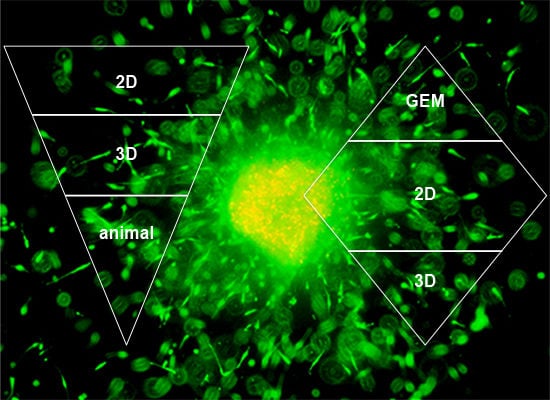
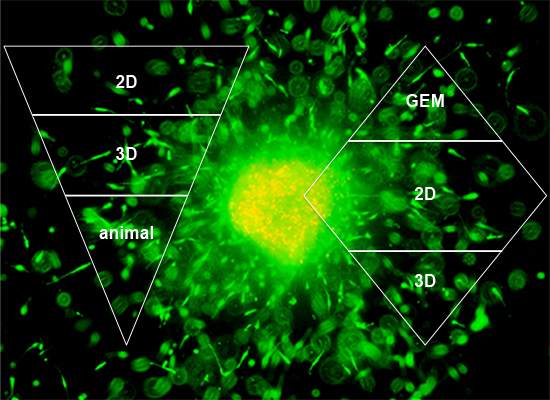
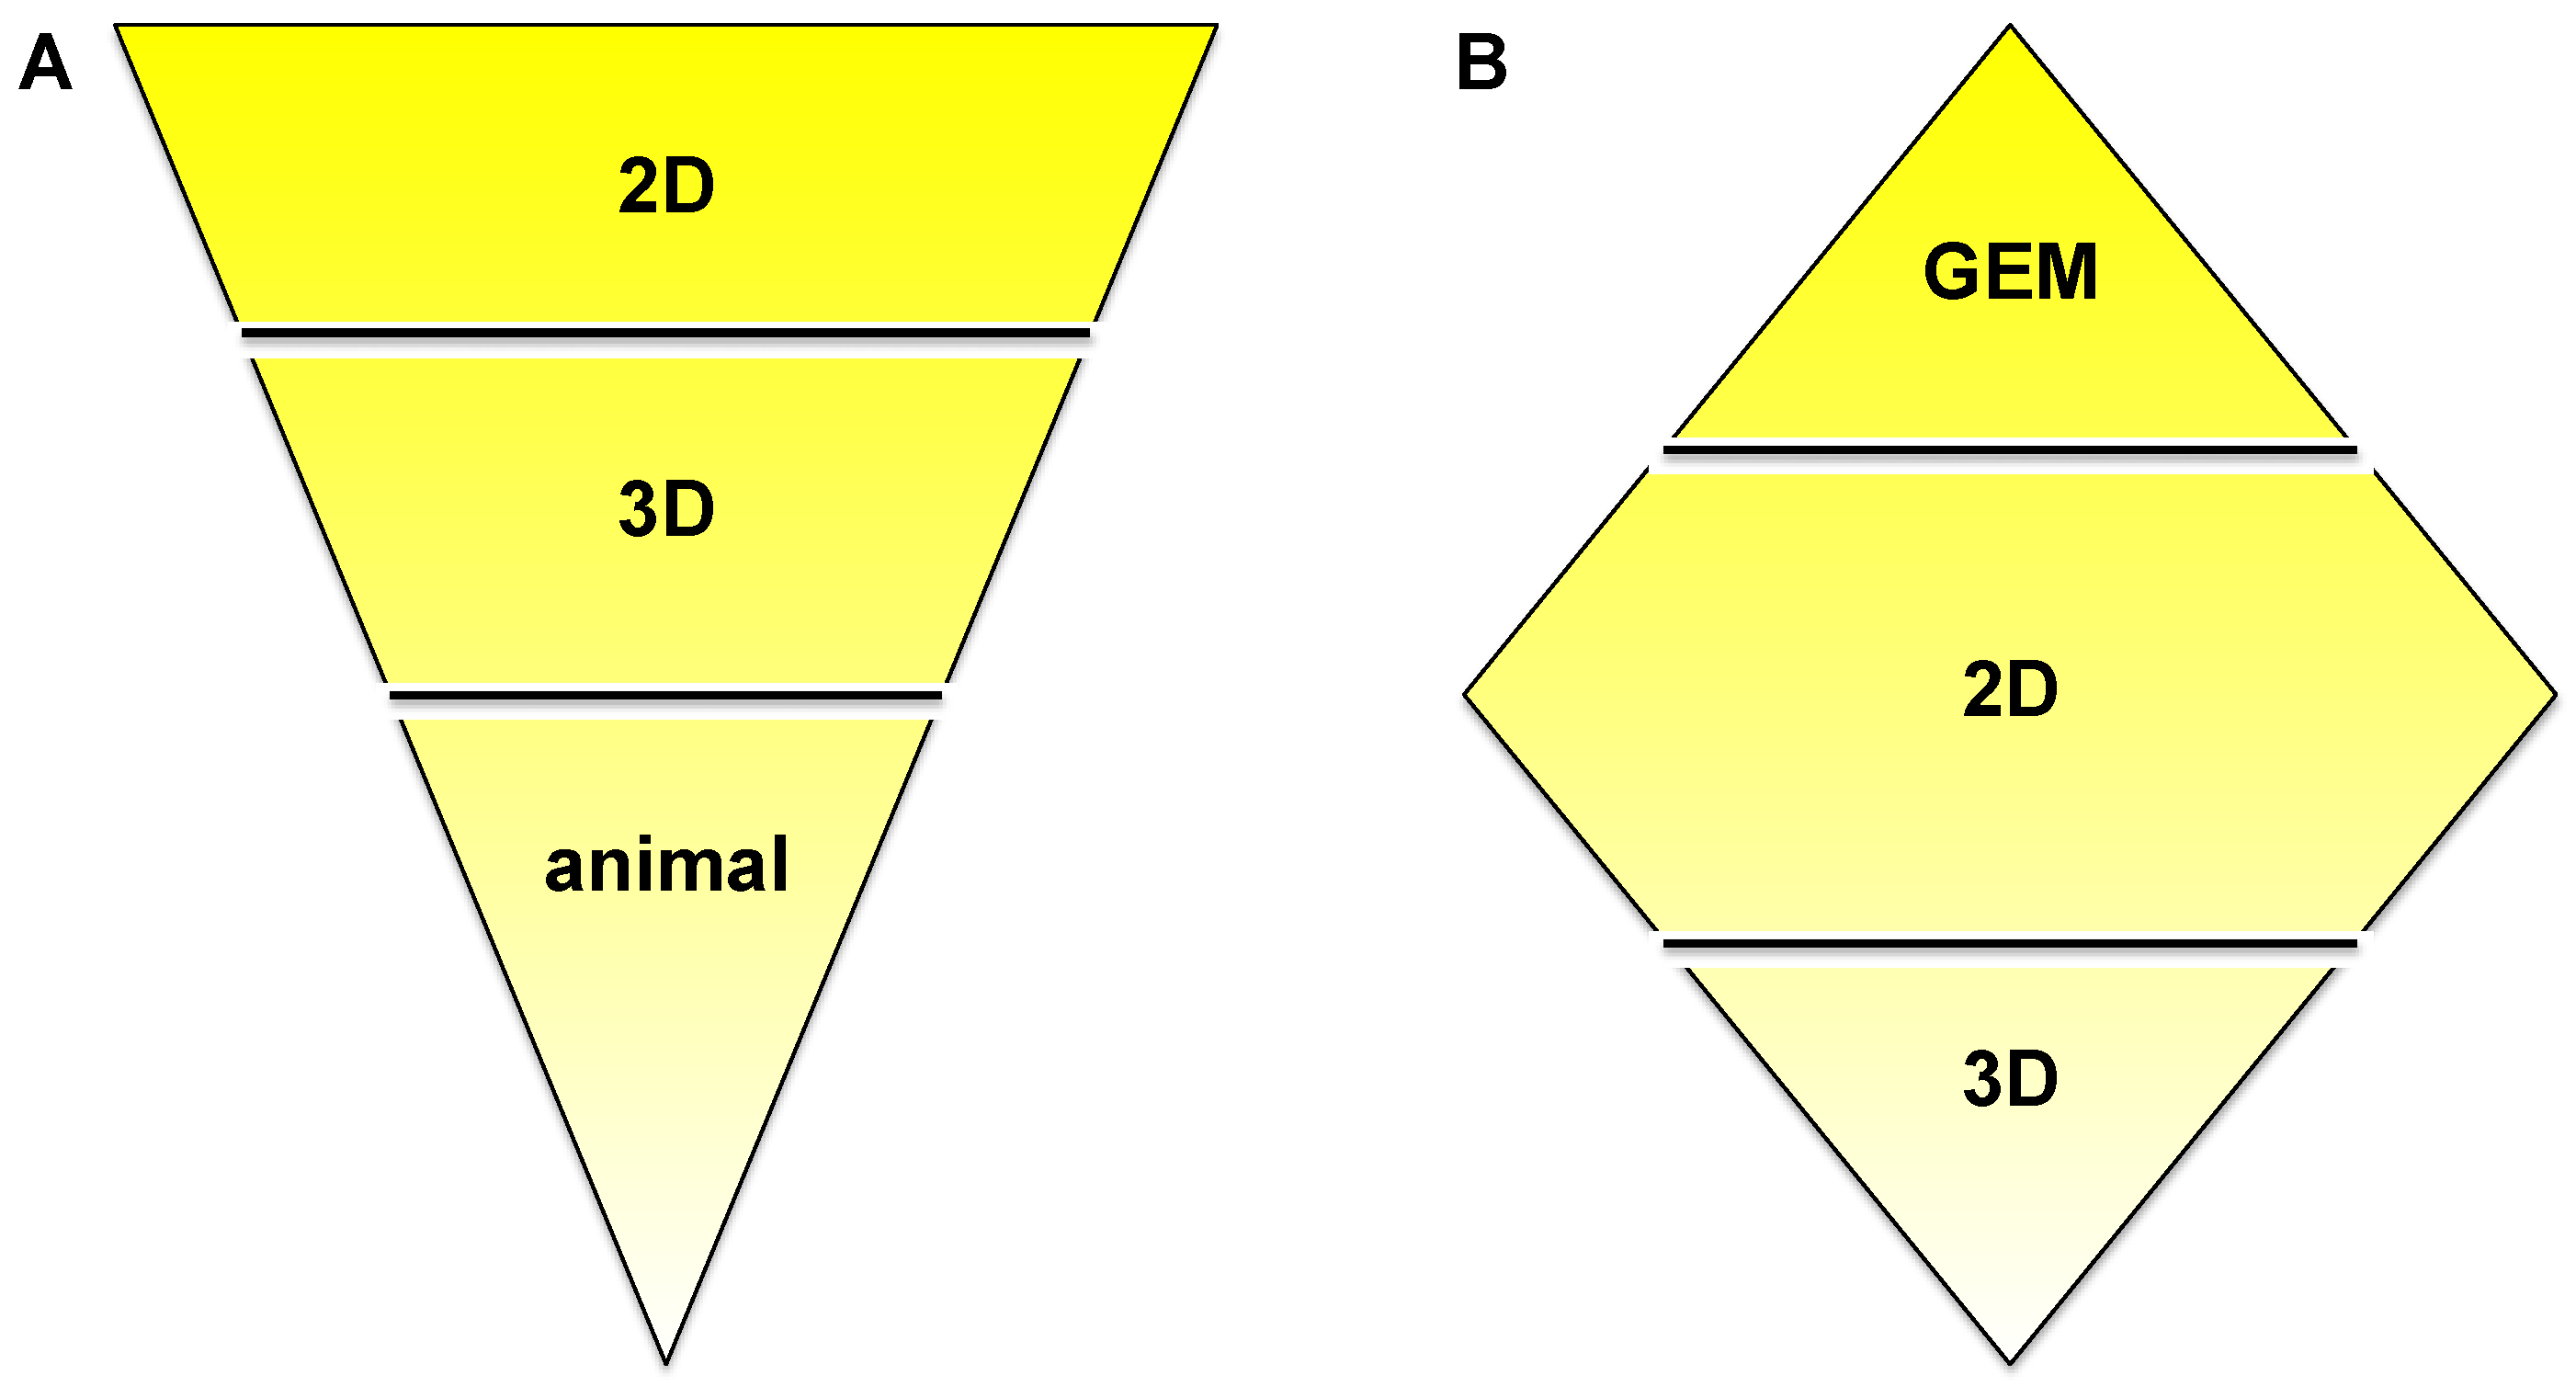
In order to accommodate all claims listed in the introduction—to recreate tumor progression, migration, invasion, its interaction with the microenvironment, drug delivery and bioavailability, but also ease of use and cost—we suggest a combination of multiple models as outlined in Figure 7. The ‘upside-down triangle approach’ (Figure 7A) is often used to perform drug discovery/development studies: Initial high-throughput screening in 2D culture using a high number of cell lines or primary cells and/or compounds or drug combinations. From the 2D experiments certain conditions of interest may be chosen for the next step, a semi-high-throughput screen in 3D culture. Based on data generated in 3D models, the final step should be the appropriate animal experiments. In vitro pre-screening should lead to the involvement of significantly fewer animals and therefore should provide a cost- and time-effective as well as ethically acceptable approach. An alternative is the ‘diamond approach’, in which cell lines can be isolated from a tumor growing in a GEM and characterized in 2D and then 3D culture. Similarly, either approach can be applied for mechanistic studies. The decision on which approach to apply may be guided by the pros and cons discussed in this review.
Figure 7.
‘Upside-down triangle approach’ (A) and ‘diamond approach’ (B).

Acknowledgments
K.A.B. is Principal Investigator on Project Grant 1051996 (Priority-driven collaborative cancer research scheme/Cancer Australia/Cure Cancer Australia Foundation). N.M.-K. is a recipient of a Cancer Institute NSW Scholar Award and the Academic Staff Training Scheme Fellowship from the Government of Malaysia. N.K.H. is a recipient of the Cameron Fellowship from the Melanoma and Skin Cancer Research Institute Australia, and is a Sydney Medical School Foundation Fellow. N.K.H. is Principal Investigator on Project Grants RG 09-08 and RG 13-06 (Cancer Council NSW), Project Grant 570778 (Priority-driven collaborative cancer research scheme/Cancer Australia/Cure Cancer Australia Foundation), Research Innovation Grant 08/RFG/1-27 (Cancer Institute NSW) and Project Grant 1003637 (National Health and Medical Research Council).
Conflicts of Interest
The authors declare no conflict of interest.
References
- Jemal, A.; Siegel, R.; Ward, E.; Murray, T.; Xu, J.; Smigal, C.; Thun, M.J. Cancer statistics, 2006. CA Cancer J. Clin. 2006, 56, 106–130. [Google Scholar] [CrossRef]
- Balch, C.M.; Soong, S.J.; Gershenwald, J.E.; Thompson, J.F.; Reintgen, D.S.; Cascinelli, N.; Urist, M.; McMasters, K.M.; Ross, M.I.; Kirkwood, J.M.; et al. Prognostic factors analysis of 17,600 melanoma patients: Validation of the American Joint Committee on Cancer melanoma staging system. J. Clin. Oncol. 2001, 19, 3622–3634. [Google Scholar]
- Davies, H.; Bignell, G.R.; Cox, C.; Stephens, P.; Edkins, S.; Clegg, S.; Teague, J.; Woffendin, H.; Garnett, M.J.; Bottomley, W.; et al. Mutations of the BRAF gene in human cancer. Nature 2002, 417, 949–954. [Google Scholar] [CrossRef]
- Flaherty, K.T.; Puzanov, I.; Kim, K.B.; Ribas, A.; McArthur, G.; Sosman, J.; O’Dwyer, P.J.; Lee, R.J.; Grippo, J.F.; Nolop, K.; et al. Inhibition of mutated, activated BRAF in metastatic melanoma. N. Engl. J. Med. 2010, 363, 809–819. [Google Scholar] [CrossRef]
- Sosman, J.A.; Kim, K.B.; Schuchter, L.; Gonzalez, R.; Pavlick, A.C.; Weber, J.S.; McArthur, G.A.; Hutson, T.E.; Moschos, S.J.; Flaherty, K.T.; et al. Survival in BRAF V600-mutant advanced melanoma treated with vemurafenib. N. Engl. J. Med. 2012, 366, 707–714. [Google Scholar] [CrossRef]
- Tsai, J.; Lee, J.T.; Wang, W.; Zhang, J.; Cho, H.; Mamo, S.; Bremer, R.; Gillette, S.; Kong, J.; Haass, N.K.; et al. Discovery of a selective inhibitor of oncogenic B-Raf kinase with potent antimelanoma activity. Proc. Natl. Acad. Sci. USA 2008, 105, 3041–3046. [Google Scholar] [CrossRef]
- Lee, J.T.; Li, L.; Brafford, P.A.; van den Eijnden, M.; Halloran, M.B.; Sproesser, K.; Haass, N.K.; Smalley, K.S.; Tsai, J.; Bollag, G.; et al. PLX4032, a potent inhibitor of the B-Raf V600E oncogene, selectively inhibits V600E-positive melanomas. Pigment Cell Melanoma Res. 2010, 23, 820–827. [Google Scholar] [CrossRef]
- Chapman, P.B.; Hauschild, A.; Robert, C.; Haanen, J.B.; Ascierto, P.; Larkin, J.; Dummer, R.; Garbe, C.; Testori, A.; Maio, M.; et al. Improved survival with vemurafenib in melanoma with BRAF V600E mutation. N. Engl. J. Med. 2011, 364, 2507–2516. [Google Scholar] [CrossRef]
- Brandner, J.M.; Haass, N.K. Melanoma’s connections to the tumour microenvironment. Pathology 2013, 45, 443–452. [Google Scholar] [CrossRef]
- Bissell, M.J.; Radisky, D. Putting tumours in context. Nat. Rev. Cancer 2001, 1, 46–54. [Google Scholar] [CrossRef]
- Santiago-Walker, A.; Li, L.; Haass, N.K.; Herlyn, M. Melanocytes: From morphology to application. Skin Pharmacol. Physiol. 2009, 22, 114–121. [Google Scholar] [CrossRef]
- Haass, N.K.; Smalley, K.S.; Li, L.; Herlyn, M. Adhesion, migration and communication in melanocytes and melanoma. Pigment Cell Res. 2005, 18, 150–159. [Google Scholar] [CrossRef]
- Kuphal, S.; Haass, N.K. Cell-cell and cell-matrix contacts in melanoma and the tumor microenvironment. In Melanoma Development—Molecular Biology, Genetics and Clinical Application; Bosserhoff, A.K., Ed.; Springer-Verlag: Wien, Austria, 2011; pp. 181–215. [Google Scholar]
- Parachoniak, C.A.; Park, M. Dynamics of receptor trafficking in tumorigenicity. Trends Cell Biol. 2012, 22, 231–240. [Google Scholar] [CrossRef]
- Hung, M.C.; Link, W. Protein localization in disease and therapy. J. Cell Sci. 2011, 124, 3381–3392. [Google Scholar] [CrossRef]
- Hsu, M.Y.; Meier, F.E.; Nesbit, M.; Hsu, J.Y.; van Belle, P.; Elder, D.E.; Herlyn, M. E-cadherin expression in melanoma cells restores keratinocyte-mediated growth control and down-regulates expression of invasion-related adhesion receptors. Am. J. Pathol. 2000, 156, 1515–1525. [Google Scholar] [CrossRef]
- Fukunaga-Kalabis, M.; Martinez, G.; Liu, Z.J.; Kalabis, J.; Mrass, P.; Weninger, W.; Firth, S.M.; Planque, N.; Perbal, B.; Herlyn, M. CCN3 controls 3D spatial localization of melanocytes in the human skin through DDR1. J. Cell Biol. 2006, 175, 563–569. [Google Scholar] [CrossRef]
- Smalley, K.S.; Lioni, M.; Noma, K.; Haass, N.K.; Herlyn, M. In vitro three-dimensional tumor microenvironment models for anticancer drug discovery. Expert Opin. Drug Discov. 2008, 3, 1–10. [Google Scholar] [CrossRef]
- Egeblad, M.; Nakasone, E.S.; Werb, Z. Tumors as organs: Complex tissues that interface with the entire organism. Dev. Cell 2010, 18, 884–901. [Google Scholar] [CrossRef]
- Lucas, K.M.; Mohana-Kumaran, N.; Lau, D.; Zhang, X.D.; Hersey, P.; Huang, D.C.; Weninger, W.; Haass, N.K.; Allen, J.D. Modulation of NOXA and MCL-1 as a strategy for sensitizing melanoma cells to the BH3-mimetic ABT-737. Clin. Cancer Res. 2012, 18, 783–795. [Google Scholar] [CrossRef]
- Wroblewski, D.; Mijatov, B.; Mohana-Kumaran, N.; Lai, F.; Gallagher, S.J.; Haass, N.K.; Zhang, X.D.; Hersey, P. The BH3-mimetic ABT-737 sensitizes human melanoma cells to apoptosis induced by selective BRAF inhibitors but does not reverse acquired resistance. Carcinogenesis 2013, 34, 237–247. [Google Scholar] [CrossRef]
- Vorsmann, H.; Groeber, F.; Walles, H.; Busch, S.; Beissert, S.; Walczak, H.; Kulms, D. Development of a human three-dimensional organotypic skin-melanoma spheroid model for in vitro drug testing. Cell Death Dis. 2013, 4, e719. [Google Scholar] [CrossRef]
- Smalley, K.S.; Haass, N.K.; Brafford, P.A.; Lioni, M.; Flaherty, K.T.; Herlyn, M. Multiple signaling pathways must be targeted to overcome drug resistance in cell lines derived from melanoma metastases. Mol. Cancer Ther. 2006, 5, 1136–1144. [Google Scholar]
- Haass, N.K.; Sproesser, K.; Nguyen, T.K.; Contractor, R.; Medina, C.A.; Nathanson, K.L.; Herlyn, M.; Smalley, K.S. The mitogen-activated protein/extracellular signal-regulated kinase kinase inhibitor AZD6244 (ARRY-142886) induces growth arrest in melanoma cells and tumor regression when combined with docetaxel. Clin. Cancer Res. 2008, 14, 230–239. [Google Scholar] [CrossRef]
- Zhuang, L.; Lee, C.S.; Scolyer, R.A.; McCarthy, S.W.; Palmer, A.A.; Zhang, X.D.; Thompson, J.F.; Bron, L.P.; Hersey, P. Activation of the extracellular signal regulated kinase (ERK) pathway in human melanoma. J. Clin. Pathol. 2005, 58, 1163–1169. [Google Scholar] [CrossRef]
- Bollag, G.; Hirth, P.; Tsai, J.; Zhang, J.; Ibrahim, P.N.; Cho, H.; Spevak, W.; Zhang, C.; Zhang, Y.; Habets, G.; et al. Clinical efficacy of a RAF inhibitor needs broad target blockade in BRAF-mutant melanoma. Nature 2010, 467, 596–599. [Google Scholar] [CrossRef]
- Smalley, K.S.; Brafford, P.; Haass, N.K.; Brandner, J.M.; Brown, E.; Herlyn, M. Up-regulated expression of zonula occludens protein-1 in human melanoma associates with N-cadherin and contributes to invasion and adhesion. Am. J. Pathol. 2005, 166, 1541–1554. [Google Scholar] [CrossRef]
- Stehn, J.R.; Haass, N.K.; Bonello, T.; Desouza, M.; Kottyan, G.; Treutlein, H.; Zeng, J.; Nascimento, P.R.; Sequeira, V.B.; Butler, T.L.; et al. A novel class of anticancer compounds targets the actin cytoskeleton in tumor cells. Cancer Res. 2013, 73, 5169–5182. [Google Scholar] [CrossRef]
- Provenzano, P.P.; Inman, D.R.; Eliceiri, K.W.; Keely, P.J. Matrix density-induced mechanoregulation of breast cell phenotype, signaling and gene expression through a FAK-ERK linkage. Oncogene 2009, 28, 4326–4343. [Google Scholar] [CrossRef]
- Kramer, N.; Walzl, A.; Unger, C.; Rosner, M.; Krupitza, G.; Hengstschlager, M.; Dolznig, H. In vitro cell migration and invasion assays. Mutat. Res. 2013, 752, 10–24. [Google Scholar] [CrossRef]
- Ghajar, C.M.; Suresh, V.; Peyton, S.R.; Raub, C.B.; Meyskens, F.L., Jr.; George, S.C.; Putnam, A.J. A novel three-dimensional model to quantify metastatic melanoma invasion. Mol. Cancer Ther. 2007, 6, 552–561. [Google Scholar] [CrossRef]
- Flach, E.H.; Rebecca, V.W.; Herlyn, M.; Smalley, K.S.; Anderson, A.R. Fibroblasts contribute to melanoma tumor growth and drug resistance. Mol. Pharm. 2011, 8, 2039–2049. [Google Scholar] [CrossRef]
- Fang, D.; Nguyen, T.K.; Leishear, K.; Finko, R.; Kulp, A.N.; Hotz, S.; van Belle, P.A.; Xu, X.; Elder, D.E.; Herlyn, M. A tumorigenic subpopulation with stem cell properties in melanomas. Cancer Res. 2005, 65, 9328–9337. [Google Scholar] [CrossRef]
- Schatton, T.; Murphy, G.F.; Frank, N.Y.; Yamaura, K.; Waaga-Gasser, A.M.; Gasser, M.; Zhan, Q.; Jordan, S.; Duncan, L.M.; Weishaupt, C.; et al. Identification of cells initiating human melanomas. Nature 2008, 451, 345–349. [Google Scholar] [CrossRef]
- Quintana, E.; Shackleton, M.; Sabel, M.S.; Fullen, D.R.; Johnson, T.M.; Morrison, S.J. Efficient tumour formation by single human melanoma cells. Nature 2008, 456, 593–598. [Google Scholar] [CrossRef]
- Mo, J.; Sun, B.; Zhao, X.; Gu, Q.; Dong, X.; Liu, Z.; Ma, Y.; Zhao, N.; Liu, Y.; Chi, J.; Sun, R. The in-vitro spheroid culture induces a more highly differentiated but tumorigenic population from melanoma cell lines. Melanoma Res. 2013, 23, 254–263. [Google Scholar]
- Thurber, A.E.; Douglas, G.; Sturm, E.C.; Zabierowski, S.E.; Smit, D.J.; Ramakrishnan, S.N.; Hacker, E.; Leonard, J.H.; Herlyn, M.; Sturm, R.A. Inverse expression states of the BRN2 and MITF transcription factors in melanoma spheres and tumour xenografts regulate the NOTCH pathway. Oncogene 2011, 30, 3036–3048. [Google Scholar] [CrossRef] [Green Version]
- Berking, C.; Herlyn, M. Human skin reconstruct models: A new application for studies of melanocyte and melanoma biology. Histol. Histopathol. 2001, 16, 669–674. [Google Scholar]
- Meier, F.; Nesbit, M.; Hsu, M.Y.; Martin, B.; van Belle, P.; Elder, D.E.; Schaumburg-Lever, G.; Garbe, C.; Walz, T.M.; Donatien, P.; et al. Human melanoma progression in skin reconstructs: Biological significance of bFGF. Am. J. Pathol. 2000, 156, 193–200. [Google Scholar] [CrossRef]
- Meier, F.; Busch, S.; Lasithiotakis, K.; Kulms, D.; Garbe, C.; Maczey, E.; Herlyn, M.; Schittek, B. Combined targeting of MAPK and AKT signalling pathways is a promising strategy for melanoma treatment. Br. J. Dermatol. 2007, 156, 1204–1213. [Google Scholar] [CrossRef]
- Hanahan, D.; Weinberg, R.A. The hallmarks of cancer. Cell 2000, 100, 57–70. [Google Scholar] [CrossRef]
- Hanahan, D.; Weinberg, R.A. Hallmarks of cancer: The next generation. Cell 2011, 144, 646–674. [Google Scholar] [CrossRef]
- Jain, R.K. Normalization of tumor vasculature: An emerging concept in antiangiogenic therapy. Science 2005, 307, 58–62. [Google Scholar] [CrossRef]
- Velazquez, O.C.; Snyder, R.; Liu, Z.J.; Fairman, R.M.; Herlyn, M. Fibroblast-dependent differentiation of human microvascular endothelial cells into capillary-like 3-dimensional networks. FASEB J. 2002, 16, 1316–1318. [Google Scholar]
- Merlino, G.; Flaherty, K.; Acquavella, N.; Day, C.P.; Aplin, A.; Holmen, S.; Topalian, S.; van Dyke, T.; Herlyn, M. Meeting report: The future of preclinical mouse models in melanoma treatment is now. Pigment Cell Melanoma Res. 2013, 26, E8–E14. [Google Scholar] [CrossRef]
- Herlyn, D.; Iliopoulos, D.; Jensen, P.J.; Parmiter, A.; Baird, J.; Hotta, H.; Adachi, K.; Ross, A.H.; Jambrosic, J.; Koprowski, H.; et al. In vitro properties of human melanoma cells metastatic in nude mice. Cancer Res. 1990, 50, 2296–2302. [Google Scholar]
- Juhasz, I.; Albelda, S.M.; Elder, D.E.; Murphy, G.F.; Adachi, K.; Herlyn, D.; Valyi-Nagy, I.T.; Herlyn, M. Growth and invasion of human melanomas in human skin grafted to immunodeficient mice. Am. J. Pathol. 1993, 143, 528–537. [Google Scholar]
- Khanna, C.; Hunter, K. Modeling metastasis in vivo. Carcinogenesis 2005, 26, 513–523. [Google Scholar] [CrossRef]
- Quintana, E.; Shackleton, M.; Foster, H.R.; Fullen, D.R.; Sabel, M.S.; Johnson, T.M.; Morrison, S.J. Phenotypic heterogeneity among tumorigenic melanoma cells from patients that is reversible and not hierarchically organized. Cancer Cell 2010, 18, 510–523. [Google Scholar] [CrossRef]
- Fidler, I.J.; Nicolson, G.L. Organ selectivity for implantation survival and growth of B16 melanoma variant tumor lines. J. Natl. Cancer Inst. 1976, 57, 1199–1202. [Google Scholar]
- Castle, J.C.; Kreiter, S.; Diekmann, J.; Lower, M.; van de Roemer, N.; de Graaf, J.; Selmi, A.; Diken, M.; Boegel, S.; Paret, C.; et al. Exploiting the mutanome for tumor vaccination. Cancer Res. 2012, 72, 1081–1091. [Google Scholar] [CrossRef]
- Herraiz, C.; Journe, F.; Abdel-Malek, Z.; Ghanem, G.; Jimenez-Cervantes, C.; Garcia-Borron, J.C. Signaling from the human melanocortin 1 receptor to ERK1 and ERK2 mitogen-activated protein kinases involves transactivation of cKIT. Mol. Endocrinol. 2011, 25, 138–156. [Google Scholar] [CrossRef]
- Larue, L.; Beermann, F. Cutaneous melanoma in genetically modified animals. Pigment Cell Res. 2007, 20, 485–497. [Google Scholar] [CrossRef]
- Walker, G.J.; Soyer, H.P.; Terzian, T.; Box, N.F. Modelling melanoma in mice. Pigment Cell Melanoma Res. 2011, 24, 1158–1176. [Google Scholar] [CrossRef]
- Mintz, B.; Silvers, W.K. Transgenic mouse model of malignant skin melanoma. Proc. Natl. Acad. Sci. USA 1993, 90, 8817–8821. [Google Scholar] [CrossRef]
- Chin, L.; Pomerantz, J.; Polsky, D.; Jacobson, M.; Cohen, C.; Cordon-Cardo, C.; Horner, J.W., 2nd; DePinho, R.A. Cooperative effects of INK4a and ras in melanoma susceptibility in vivo. Genes Dev. 1997, 11, 2822–2834. [Google Scholar] [CrossRef]
- Serrano, M.; Lee, H.; Chin, L.; Cordon-Cardo, C.; Beach, D.; DePinho, R.A. Role of the INK4a locus in tumor suppression and cell mortality. Cell 1996, 85, 27–37. [Google Scholar] [CrossRef]
- Dhomen, N.; Reis-Filho, J.S.; da Rocha Dias, S.; Hayward, R.; Savage, K.; Delmas, V.; Larue, L.; Pritchard, C.; Marais, R. Oncogenic Braf induces melanocyte senescence and melanoma in mice. Cancer Cell 2009, 15, 294–303. [Google Scholar] [CrossRef]
- Dankort, D.; Curley, D.P.; Cartlidge, R.A.; Nelson, B.; Karnezis, A.N.; Damsky, W.E., Jr.; You, M.J.; DePinho, R.A.; McMahon, M.; Bosenberg, M. Braf(V600E) cooperates with Pten loss to induce metastatic melanoma. Nat. Genet. 2009, 41, 544–552. [Google Scholar] [CrossRef]
- Damsky, W.E.; Curley, D.P.; Santhanakrishnan, M.; Rosenbaum, L.E.; Platt, J.T.; Gould Rothberg, B.E.; Taketo, M.M.; Dankort, D.; Rimm, D.L.; McMahon, M.; et al. beta-catenin signaling controls metastasis in Braf-activated Pten-deficient melanomas. Cancer Cell 2011, 20, 741–754. [Google Scholar] [CrossRef]
- Recio, J.A.; Noonan, F.P.; Takayama, H.; Anver, M.R.; Duray, P.; Rush, W.L.; Lindner, G.; de Fabo, E.C.; DePinho, R.A.; Merlino, G. Ink4a/arf deficiency promotes ultraviolet radiation-induced melanomagenesis. Cancer Res. 2002, 62, 6724–6730. [Google Scholar]
- Ackermann, J.; Frutschi, M.; Kaloulis, K.; McKee, T.; Trumpp, A.; Beermann, F. Metastasizing melanoma formation caused by expression of activated N-RasQ61K on an INK4a-deficient background. Cancer Res. 2005, 65, 4005–4011. [Google Scholar] [CrossRef]
- McKinney, A.J.; Holmen, S.L. Animal models of melanoma: A somatic cell gene delivery mouse model allows rapid evaluation of genes implicated in human melanoma. Chin. J. Cancer 2011, 30, 153–162. [Google Scholar] [CrossRef]
- Patton, E.E.; Mitchell, D.L.; Nairn, R.S. Genetic and environmental melanoma models in fish. Pigment Cell Melanoma Res. 2010, 23, 314–337. [Google Scholar] [CrossRef]
- Nairn, R.S.; Kazianis, S.; Della Coletta, L.; Trono, D.; Butler, A.P.; Walter, R.B.; Morizot, D.C. Genetic analysis of susceptibility to spontaneous and UV-induced carcinogenesis in Xiphophorus hybrid fish. Mar. Biotechnol. 2001, 3, S24–S36. [Google Scholar] [CrossRef]
- Kazianis, S.; Gimenez-Conti, I.; Trono, D.; Pedroza, A.; Chovanec, L.B.; Morizot, D.C.; Nairn, R.S.; Walter, R.B. Genetic analysis of neoplasia induced by N-nitroso-N-methylurea in Xiphophorus hybrid fish. Mar. Biotechnol. 2001, 3, S37–S43. [Google Scholar] [CrossRef]
- Walter, R.B.; Kazianis, S. Xiphophorus interspecies hybrids as genetic models of induced neoplasia. ILAR J. 2001, 42, 299–321. [Google Scholar] [CrossRef]
- Haass, N.K. From Xiphophorus to melanoma—A tribute to Steven Kazianis (1966–2008). Zebrafish 2008, 5, 91–92. [Google Scholar] [CrossRef]
- Patton, E.E.; Widlund, H.R.; Kutok, J.L.; Kopani, K.R.; Amatruda, J.F.; Murphey, R.D.; Berghmans, S.; Mayhall, E.A.; Traver, D.; Fletcher, C.D.; et al. BRAF mutations are sufficient to promote nevi formation and cooperate with p53 in the genesis of melanoma. Curr. Biol. 2005, 15, 249–254. [Google Scholar] [CrossRef]
- Schartl, M.; Wilde, B.; Laisney, J.A.; Taniguchi, Y.; Takeda, S.; Meierjohann, S. A mutated EGFR is sufficient to induce malignant melanoma with genetic background-dependent histopathologies. J. Invest. Dermatol. 2010, 130, 249–258. [Google Scholar] [CrossRef]
- Patton, E.E.; Zon, L.I. The art and design of genetic screens: Zebrafish. Nat. Rev. Genet. 2001, 2, 956–966. [Google Scholar] [CrossRef]
- Spitsbergen, J. Imaging neoplasia in zebrafish. Nat. Methods 2007, 4, 548–549. [Google Scholar] [CrossRef]
- Stern, H.M.; Zon, L.I. Cancer genetics and drug discovery in the zebrafish. Nat. Rev. Cancer 2003, 3, 533–539. [Google Scholar] [CrossRef]
- Bardeesy, N.; Wong, K.K.; DePinho, R.A.; Chin, L. Animal models of melanoma: Recent advances and future prospects. Adv. Cancer Res. 2000, 79, 123–156. [Google Scholar] [CrossRef]
- Greene, J.F., Jr.; Morgan, C.D.; Rao, A.; Amoss, M.S., Jr.; Arguello, F. Regression by differentiation in the Sinclair swine model of cutaneous melanoma. Melanoma Res. 1997, 7, 471–477. [Google Scholar] [CrossRef]
- Millikan, L.E.; Boylon, J.L.; Hook, R.R.; Manning, P.J. Melanoma in Sinclair swine: A new animal model. J. Invest. Dermatol. 1974, 62, 20–30. [Google Scholar]
- Fleury, C.; Berard, F.; Leblond, A.; Faure, C.; Ganem, N.; Thomas, L. The study of cutaneous melanomas in Camargue-type gray-skinned horses (2): Epidemiological survey. Pigment Cell Res. 2000, 13, 47–51. [Google Scholar]
- Fleury, C.; Berard, F.; Balme, B.; Thomas, L. The study of cutaneous melanomas in Camargue-typegray-skinned horses (1): Clinical-pathological characterization. Pigment Cell Res. 2000, 13, 39–46. [Google Scholar]
- Rosengren Pielberg, G.; Golovko, A.; Sundstrom, E.; Curik, I.; Lennartsson, J.; Seltenhammer, M.H.; Druml, T.; Binns, M.; Fitzsimmons, C.; Lindgren, G.; et al. A cis-acting regulatory mutation causes premature hair graying and susceptibility to melanoma in the horse. Nat. Genet. 2008, 40, 1004–1009. [Google Scholar] [CrossRef]
- Ley, R.D. Animal models of ultraviolet radiation (UVR)-induced cutaneous melanoma. Front. Biosci. 2002, 7, d1531–d1534. [Google Scholar] [CrossRef]
- Schriek, G.; Oppitz, M.; Busch, C.; Just, L.; Drews, U. Human SK-Mel 28 melanoma cells resume neural crest cell migration after transplantation into the chick embryo. Melanoma Res. 2005, 15, 225–234. [Google Scholar] [CrossRef]
- Oppitz, M.; Busch, C.; Schriek, G.; Metzger, M.; Just, L.; Drews, U. Non-malignant migration of B16 mouse melanoma cells in the neural crest and invasive growth in the eye cup of the chick embryo. Melanoma Res. 2007, 17, 17–30. [Google Scholar] [CrossRef]
- Busch, C.; Drews, U.; Garbe, C.; Eisele, S.R.; Oppitz, M. Neural crest cell migration of mouse B16-F1 melanoma cells transplanted into the chick embryo is inhibited by the BMP-antagonist noggin. Int. J. Oncol. 2007, 31, 1367–1378. [Google Scholar]
- Busch, C.; Drews, U.; Eisele, S.R.; Garbe, C.; Oppitz, M. Noggin blocks invasive growth of murine B16-F1 melanoma cells in the optic cup of the chick embryo. Int. J. Cancer 2008, 122, 526–533. [Google Scholar] [CrossRef]
- Busch, C.; Krochmann, J.; Drews, U. The chick embryo as an experimental system for melanoma cell invasion. PLoS One 2013, 8, e53970. [Google Scholar] [CrossRef]
- Krochmann, J.; Sinnberg, T.; Meier, F.; Garbe, C.; Busch, C. Melanoma cells in distinct growth phases retain specific invasive qualities during brain metastasis in vivo. Pigment Cell Melanoma Res. 2012, 25, 113–114. [Google Scholar] [CrossRef]
© 2013 by the authors; licensee MDPI, Basel, Switzerland. This article is an open access article distributed under the terms and conditions of the Creative Commons Attribution license (http://creativecommons.org/licenses/by/3.0/).
Share and Cite
MDPI and ACS Style
Beaumont, K.A.; Mohana-Kumaran, N.; Haass, N.K. Modeling Melanoma In Vitro and In Vivo. Healthcare 2014, 2, 27-46. https://doi.org/10.3390/healthcare2010027
AMA Style
Beaumont KA, Mohana-Kumaran N, Haass NK. Modeling Melanoma In Vitro and In Vivo. Healthcare. 2014; 2(1):27-46. https://doi.org/10.3390/healthcare2010027
Chicago/Turabian StyleBeaumont, Kimberley A., Nethia Mohana-Kumaran, and Nikolas K. Haass. 2014. "Modeling Melanoma In Vitro and In Vivo" Healthcare 2, no. 1: 27-46. https://doi.org/10.3390/healthcare2010027