
Preventive Healthcare: A Neural Network Analysis of Behavioral Habits and Chronic Diseases

Abstract
:1. Introduction
2. Research Background
2.1. Behavioral Factors and Chronic Diseases
2.2. Neural Networks in Healthcare
2.3. The Neural Network Model
3. Research Methodology
3.1. Data Collection
3.2. Analytics Tool Selection
4. Analysis and Results
4.1. Neural Network Training and Testing
4.2. Comparison with Other Models
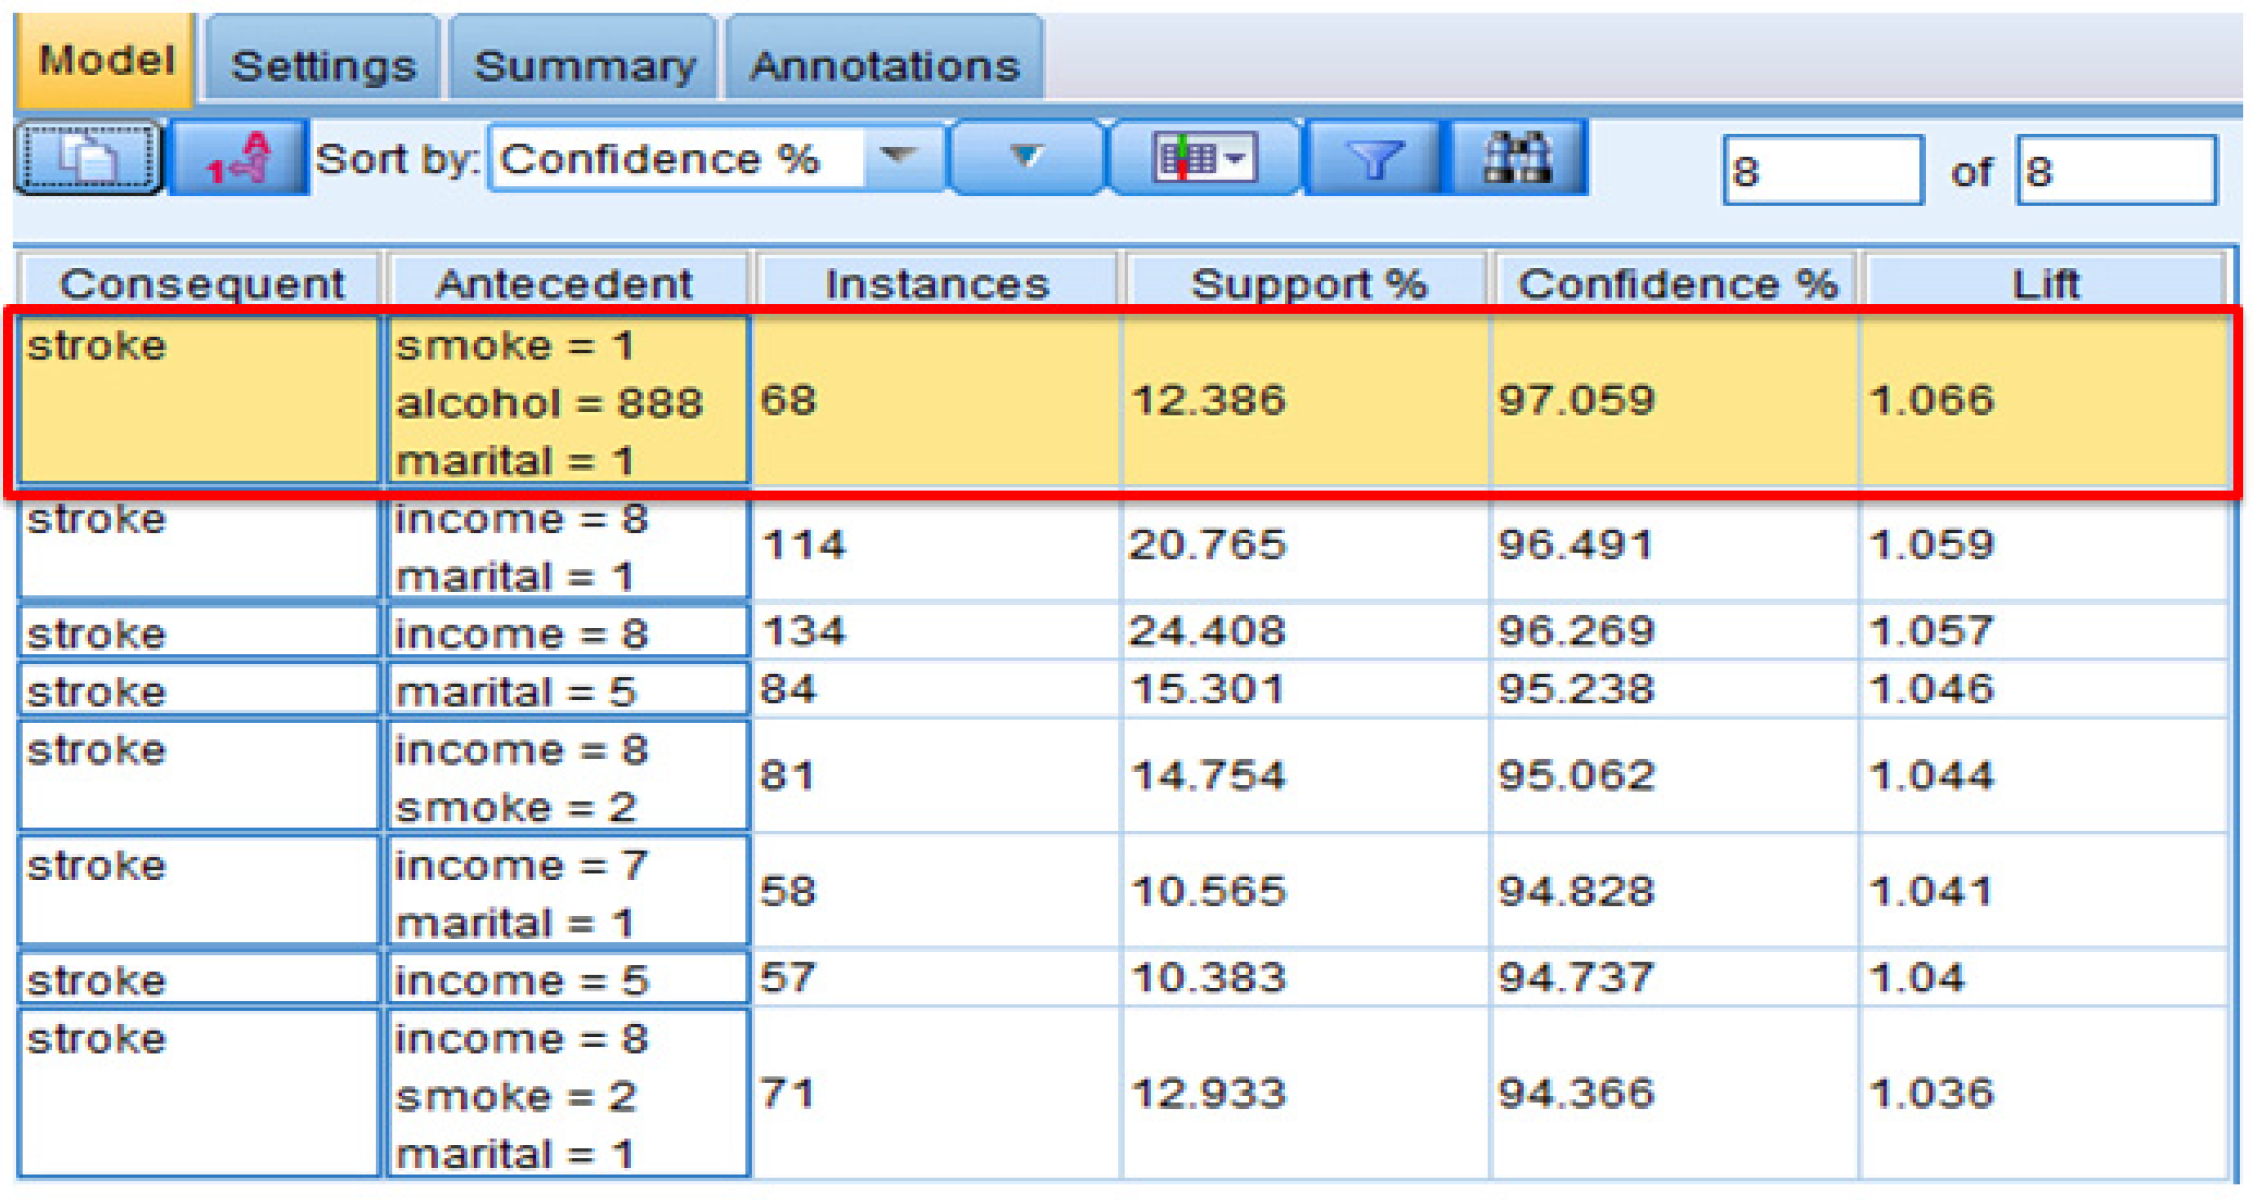
4.2.1. Association
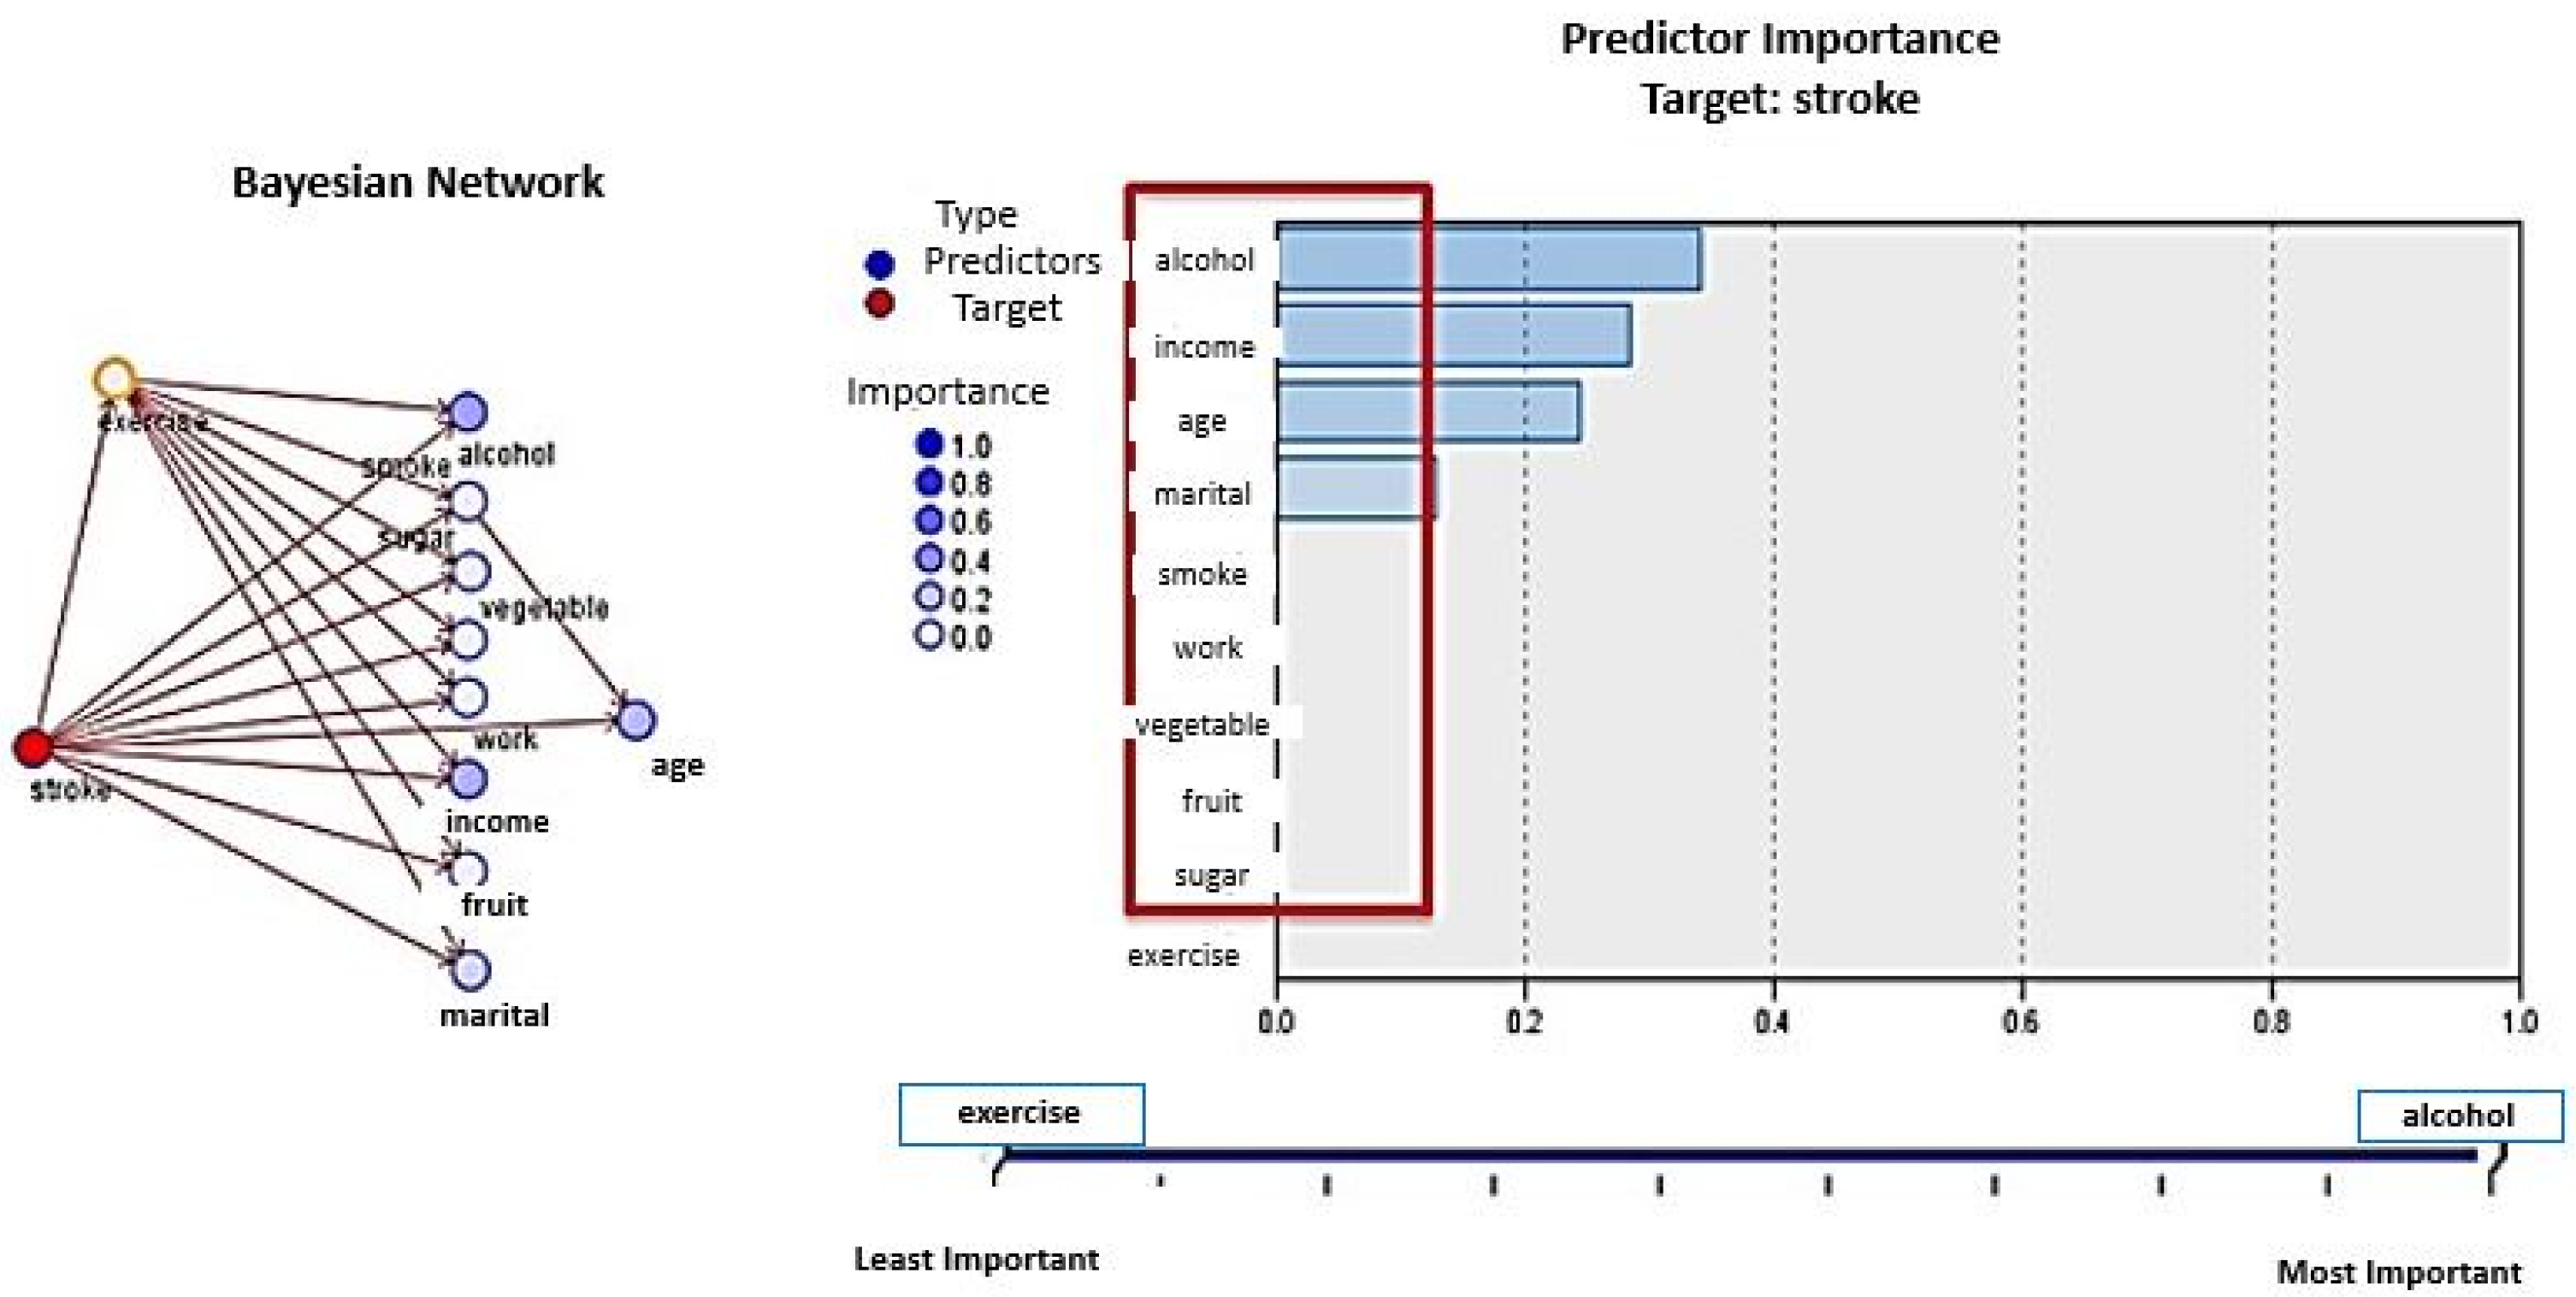
4.2.2. Bayesian Networks
5. Scope and Limitations
6. Conclusions and Policy Implications
Author Contributions
Conflicts of Interest
References
- Centers for Disease Control and Prevention. National Center for Chronic Disease Prevention and Health Promotion 2010. Available online: http://www.cdc.gov/chronicdisease/overview/index.htm (accessed on 16 September 2016).
- Bodenheimer, T.; Chen, E.; Bennett, H.D. Confronting the growing burden of chronic disease: Can the U.S. health care workforce do the job? Health Aff. 2009, 28, 64–74. [Google Scholar] [CrossRef] [PubMed]
- Centers for Disease Control and Prevention. National Center for Chronic Disease Prevention and Health Promotion 2016. Available online: http://www.cdc.gov/chronicdisease (accessed on 16 September 2016).
- Harris, J.R.; Wallace, R.B. The institute of medicine’s new report on living well with chronic illness. Prev. Chronic Dis. 2012, 9. [Google Scholar] [CrossRef] [PubMed]
- Anderson, G.; Horvath, J. The growing burden of chronic disease in America. Public Health Rep. 2002, 119, 263–270. [Google Scholar] [CrossRef] [PubMed]
- Centers for Disease Control and Prevention. The Four Domains of Chronic Disease Prevention. Available online: http://www.cdc.gov/chronicdisease/resources/publications/four-domains.htm (accessed on 16 September 2016).
- World Health Organization. The World Health Report 2002: Reducing Risks, Promoting Healthy Life. Available online: http://www.who.int/whr/2002/en/ (accessed on 16 September 2016).
- World Health Organization. Global Strategy on Diet, Physical Activity and Health. Available online: http://www.who.int/dietphysicalactivity/en/ (accessed on 16 September 2016).
- NCD Alliance. NCD Alliance Activity Report 2015: Advocacy Milestones, Changing Gears, Listening and Convening. Available online: https://ncdalliance.org/news-events/blog/ncd-alliance-activity-report-2015-advocacy-milestones-changing-gears-listening-convening (accessed on 16 September 2016).
- Bonita, R.; Beaglehole, R.; Kjellström, T. Basic Epidemiology; World Health Organization: Geneva, Switzerland, 2006. [Google Scholar]
- Warburton, D.E.; Nicol, C.W.; Bredin, S.S. Health benefits of physical activity: The evidence. Can. Med. Assoc. J. 2006, 174, 801–809. [Google Scholar] [CrossRef] [PubMed]
- World Health Organization. Cardiovascular diseases (CVDs): Fact Sheet No. 317. 2016. Available online: http://www.who.int/mediacentre/factsheets/fs317/en/ (accessed on 16 September 2016).
- Li, J.; Siegrist, J. Physical activity and risk of cardiovascular disease—A meta-analysis of prospective cohort studies. Int. J. Environ. Res. Public Health 2012, 9, 391–407. [Google Scholar] [CrossRef] [PubMed]
- Bhupathiraju, S.N.; Tucker, K.L. Greater variety in fruit and vegetable intake is associated with lower inflammation in Puerto Rican adults. Am. J. Clin. Nutr. 2011, 93, 37–46. [Google Scholar] [CrossRef]
- Dossus, L.; Kaaks, R. Nutrition, metabolic factors and cancer risk. Best Pract. Res. Clin. Endocrinol. Metab. 2008, 22, 551–571. [Google Scholar] [CrossRef] [PubMed]
- Hursting, S.D.; Lashinger, L.M.; Wheatley, K.W.; Rogers, C.J.; Colbert, L.H.; Nunez, N.P.; Perkins, S.N. Reducing the weight of cancer: Mechanistic targets for breaking the obesity—Carcinogenesis link. Best Pract. Res. Clin. Endocrinol. Metab. 2008, 22, 659–669. [Google Scholar] [CrossRef] [PubMed]
- Calder, P.C.; Ahluwalia, N.; Brouns, F.; Buetler, T.; Clement, K.; Cunningham, K.; Esposito, K.; Jönsson, L.S.; Kolb, H.; Lansink, M.; et al. Dietary factors and low grade inflammation in relation to overweight and obesity dietary factors and low grade inflammation in relation to the metabolic syndrome. Br. J. Nutr. 2011, 106, S1–S78. [Google Scholar] [CrossRef] [PubMed]
- Taghizadeh, N.; Vonk, J.M.; Boezen, H.M. Lifetime smoking history and cause-specific mortality in a cohort study with 43 years of follow-up. PLoS ONE 2016, 11, e0153310. [Google Scholar] [CrossRef] [PubMed]
- Lim, S.S.; Vos, T.; Flaxman, A.D.; Danaei, G.; Shibuya, K.; Adair-Rohani, H.; AlMazroa, M.A.; Amann, M.; Anderson, H.R.; Andrews, K.G.; et al. A comparative risk assessment of burden of disease and injury attributable to 67 risk factors and risk factor clusters in 21 regions, 1990–2010: A systematic analysis for the global burden of disease study 2010. Lancet 2013, 380, 2224–2260. [Google Scholar] [CrossRef]
- Blane, D. The Life Course, the Social Gradient and Health. In Social Determinants of Health; Marmot, M., Wilkinson, R.G., Eds.; Oxford University Press: Oxford, UK, 2006; pp. 54–77. [Google Scholar]
- Lafortune, L.; Martin, S.; Kelly, S.; Kuhn, I.; Remes, O.; Cowan, A.; Brayne, C. Behavioural risk factors in mid-life associated with successful ageing, disability, dementia and frailty in later life: A rapid systematic review. PLoS ONE 2016, 11, e0144405. [Google Scholar] [CrossRef] [PubMed]
- Verplanken, B.; Wood, W. Interventions to break and create consumer habits. J. Public Policy Mark. 2006, 25, 90–103. [Google Scholar] [CrossRef]
- Raghupathi, W.; Raghupathi, V. An overview of health analytics. J. Health Med. Inform. 2013, 4, 132–136. [Google Scholar] [CrossRef]
- Using analytics and collaboration to improve healthcare quality and outcomes. Available online: http://resources.information-management.com/content50200 (accessed on 16 September 2016).
- Fernández-Granero, M.A.; Sánchez-Morillo, D.; León-Jiménez, A.; Crespo, L.F. Automatic prediction of chronic obstructive pulmonary disease exacerbations through home telemonitoring of symptoms. Biomed. Mater. Eng. 2014, 24, 3825–3832. [Google Scholar] [PubMed]
- Baxt, W.G.; Shofer, F.S.; Sites, F.D.; Hollander, J.E. A neural computational aid to the diagnosis of acute myocardial infarction. Ann. Intern. Med. 1991, 115, 843–848. [Google Scholar] [CrossRef] [PubMed]
- Eggers, K.M.; Ellenius, J.; Dellborg, M.; Groth, T.; Oldgren, J.; Swahn, E.; Lindahl, B. Artificial neural network algorithms for early diagnosis of acute myocardial infarction and prediction of infarct size in chest pain patients. Int. J. Cardiol. 2007, 114, 366–374. [Google Scholar] [CrossRef] [PubMed]
- Ellenius, J.; Groth, T.; Lindahl, B.; Wallentin, L. Early assessment of patients with suspected acute myocardial infarction by biochemical monitoring and neural networks analysis. Clin. Chem. 1997, 43, 1919–1925. [Google Scholar] [PubMed]
- Pedersen, S.M.; Joegensen, J.S.; Pedersen, J.B. Use of neural networks to diagnose acute myocardial infarction II, A clinical application. Clin. Chem. 1996, 42, 613–617. [Google Scholar] [PubMed]
- Lewenstein, K. Radial basis function neural network approach for the diagnosis of Coronary artery disease based on the standard ECG exercise test. Med. Biol. Eng. Comput. 2001, 39, 1–6. [Google Scholar] [CrossRef]
- Mobley, B.A.; Schechter, E.; Moore, W.E.; Mckee, P.A.; Eichner, J.E. Predictions of coronary stenosis by artificial neural network. Artif. Intell. Med. 2000, 18, 187–203. [Google Scholar] [CrossRef]
- Shen, Z.; Clarke, M.; Jones, R.; Alberti, T. A new neural network structure for detection of coronary heart disease. Neural Comput. Appl. 1995, 3, 171–177. [Google Scholar] [CrossRef]
- Leslie, S.J.; Hartswood, M.; Meurig, C.; McKee, S.P.; Slack, R.; Procter, R.; Denvir, M.A. Clinical decision support software for management of chronic heart failure: Development and evaluation. Comput. Biol. Med. 2006, 36, 495–506. [Google Scholar] [CrossRef] [PubMed]
- Carlucci, D.; Renna, P.; Schiuma, G. Evaluating service quality dimensions as antecedents to outpatient satisfaction using back propagation neural network. Health Care Manag. Sci. 2013, 16, 37–44. [Google Scholar] [CrossRef] [PubMed]
- Yan, H.; Jiang, J.; Zheng, J.; Peng, C.; Li, Q. A multilayer perceptron based medical decision support system for heart disease diagnosis. Expert Syst. Appl. 2006, 30, 272–281. [Google Scholar] [CrossRef]
- Xu, M.; Wong, T.C.; Chin, K.S. Modeling daily patient arrivals at Emergency Department and quantifying the relative importance of contributing variables using artificial neural network. Decis. Support Syst. 2013, 54, 1488–1498. [Google Scholar] [CrossRef]
- Bates, D.W.; Saria, S.; Ohno-Machado, L.; Shah, A.; Escobar, G. Big data in healthcare: Using analytics to identify and manage high-risk and high-cost patients. Health Affair. 2014, 33, 1123–1131. [Google Scholar] [CrossRef] [PubMed]
- Karan, O.; Bayraktar, C.; Gumuskaya, H.; Karlık, B. Diagnosing diabetes using neural networks on small mobile devices. Expert Syst. Appl. 2012, 39, 54–60. [Google Scholar] [CrossRef]
- Raghupathi, V.; Raghupathi, W. A neural network analysis of treatment quality and efficiency of hospitals. J. Health Med. Inform. 2015, 6. [Google Scholar] [CrossRef]
- McKinney, J.; Lithwick, D.J.; Morrison, B.N.; Nazzari, H.; Isserow, S.H.; Heilbron, B.; Krah, A.D. The Health Benefits of Physical Activity and Cardiorespiratory Fitness. BC Med. J. 2016, 58, 131–137. [Google Scholar]
- Yanbaeva, D.G.; Dentener, M.A.; Creutzberg, E.C.; Wesseling, G.; Wouters, E.F. Systemic effects of smoking. Chest 2007, 131, 1557–1566. [Google Scholar] [CrossRef] [PubMed]
- Rehm, J.; Baliunas, D.; Borges, G.L.G.; Graham, K.; Irving, H.; Kehoe, T.; Parry, C.D.; Patra, J.; Popova, S.; Poznyak, V.; et al. The relation between different dimensions of alcohol consumption and burden of disease: An overview. Addiction 2010, 105, 817–843. [Google Scholar] [CrossRef] [PubMed]
- Shield, K.D.; Parry, C.; Rehm, J. Focus on: Chronic diseases and conditions related to alcohol use. Alcohol Res. Curr. Rev. 2013, 35, 155–171. [Google Scholar]
- Boeing, H.; Bechthold, A.; Bub, A.; Ellinger, S.; Haller, D.; Kroke, A.; Leschik-Bonnet, E.; Müller, M.J.; Oberritter, H.; Schulze, M.; et al. Critical review: Vegetables and fruit in the prevention of chronic diseases. Eur. J. Nutr. 2012, 51, 637–663. [Google Scholar] [CrossRef] [PubMed]
- Virtanen, M.; Heikkila, K.; Jokela, M.; Ferrie, J.E.; Batty, G.D.; Vahtera, J.; Kivimäki, M. Long working hours and coronary heart disease: A systematic review and meta-analysis. Am. J. Epidemiol. 2012, 176, 586–596. [Google Scholar] [CrossRef] [PubMed]
- Yang, H.; Schnall, P.L.; Jauregui, M.; Su, T.-C.; Baker, D. Work hours and self-reported hypertension among working people in California. Hypertension 2006, 48, 744–750. [Google Scholar] [CrossRef] [PubMed]
- Kawakami, N.; Araki, S.; Takatsuka, N.; Shimizu, H.; Ishibashi, H. Overtime, psychosocial working conditions, and occurrence of non-insulin dependent diabetes mellitus in Japanese men. J. Epidemiol. Commun. Health 1999, 53, 359–363. [Google Scholar] [CrossRef]
- Serrano, E.; Kowaleska, A.; Hosig, K. Status and goals of local school wellness policies in virginia: A response to the child nutrition and WIC reauthorization act of 2004. J. Nutr. Educ. Behav. 2007, 39, 95–100. [Google Scholar] [CrossRef] [PubMed]
- Let’s Move! Available online: http://www.letsmove.gov/ (accessed on 16 September 2016).
- Health and Human Services. Be Tobacco Free. Available online: http://betobaccofree.hhs.gov/campaigns/ (accessed on 23 September 2016).
- Butler, A.B.; Grzywacz, J.G.; Ettner, S.L.; Liu, B. Workplace flexibility, self-reported health, and health care utilization. Work Stress 2009, 23, 45–59. [Google Scholar] [CrossRef]
- Grzywacz, J.G.; Carlson, D.S.; Shulkin, S. Schedule flexibility and stress: Linking formal flexible arrangements and perceived flexibility to employee health. Community Work Fam. 2008, 11, 199–214. [Google Scholar] [CrossRef]
- Tabas, I.; Glass, C.K. Anti-Inflammatory therapy in chronic disease: Challenges and opportunities. Science 2013, 339, 166–172. [Google Scholar] [CrossRef] [PubMed]
- Kushner, R.F.; Sorensen, K.W. Lifestyle medicine: The future of chronic disease management. Curr. Opin. Endocrinol. 2013, 20, 389–395. [Google Scholar] [CrossRef] [PubMed]
- Siwicki, B. Are Social Networks the Future of Chronic Disease Care? Available online: http://www.healthcareitnews.com/news/are-social-networks-future-chronic-disease-care (accessed on 16 September 2016).
- Himes, B.E.; Weitzman, E.R. Innovations in health information technologies for chronic pulmonary diseases. Respir. Res. 2016, 17, 38–44. [Google Scholar] [CrossRef] [PubMed]


| Variable | Description of Variables |
|---|---|
| Behavioral Habits: | |
| Smoking history | Smoked at least 100 cigarettes in the entire life or not |
| Frequency of drinking alcohol | Number of days of having at least one alcoholic drink per week or per month during the past 30 days |
| Frequency of drinking soda (sugar) | Frequency of drinking regular soda during the last 30 days: |
| 1__ - Times per day (00–99) | |
| 2__ - Times per week (00–99) | |
| 3__ - Times per month (00–99) | |
| Frequency of eating fruits | Times per day, week, or month eating fruit (not counting juice): |
| 1__ - Times per day (00–99) | |
| 2__ - Times per week (00–99) | |
| 3__ - Times per month (00–99) | |
| Frequency of eating vegetables | Times per day, week, or month eating vegetables (include tomatoes, tomato juice or V-8 juice, corn, eggplant, peas, lettuce, cabbage, and white potatoes that are not fried such as baked or mashed potatoes): |
| 1__ - Times per day (00–99) | |
| 2__ - Times per week (00–99) | |
| 3__ - Times per month (00–99) | |
| Exercise | Participated in any physical activity or exercise, other than a regular job, such as running, calisthenics, golf, gardening, or walking |
| Chronic Diseases: | |
| Heart attack | If the person had a heart attack |
| Stroke | If the person had a stroke |
| Asthma | If the person had an asthma attack |
| Diabetes | If the person had diabetes |
| Weekly working hours | Hours working per week at all jobs and businesses combined |
| Demographics: | |
| Marital status | Married, Divorced, Widowed, Separated, Never married, a member of an unmarried couple (1–6) |
| Income level | Annual household income level |
| Age | Age of the person |
| Chronic Disease | Input | Output | Training | Testing | Hidden Layers | Nodes | Accuracy | Top 3 Predictor Importance |
|---|---|---|---|---|---|---|---|---|
| Data Size 2907 | ||||||||
| Heart Attack | 10 | 1 | 50 | 50 | 1 | Auto 5 | 95.0 | age, work, fruit |
| 10 | 1 | 70 | 30 | 1 | Auto 2 | 96.0 | age, vegetable, work | |
| 10 | 1 | 60 | 40 | 1 | Auto 3 | 95.1 | age, fruit, alcohol | |
| 10 | 1 | 50 | 50 | 2 | (3,8) | 95.0 | age, vegetable, income | |
| 10 | 1 | 50 | 50 | 1 | 6 | 95.0 | age, fruit, sugar | |
| 10 | 1 | 50 | 50 | 2 | (4,5) | 95.0 | age, sugar, work | |
| Stroke | 10 | 1 | 50 | 50 | 1 | Auto 1 | 96.8 | Marital, sugar, fruit |
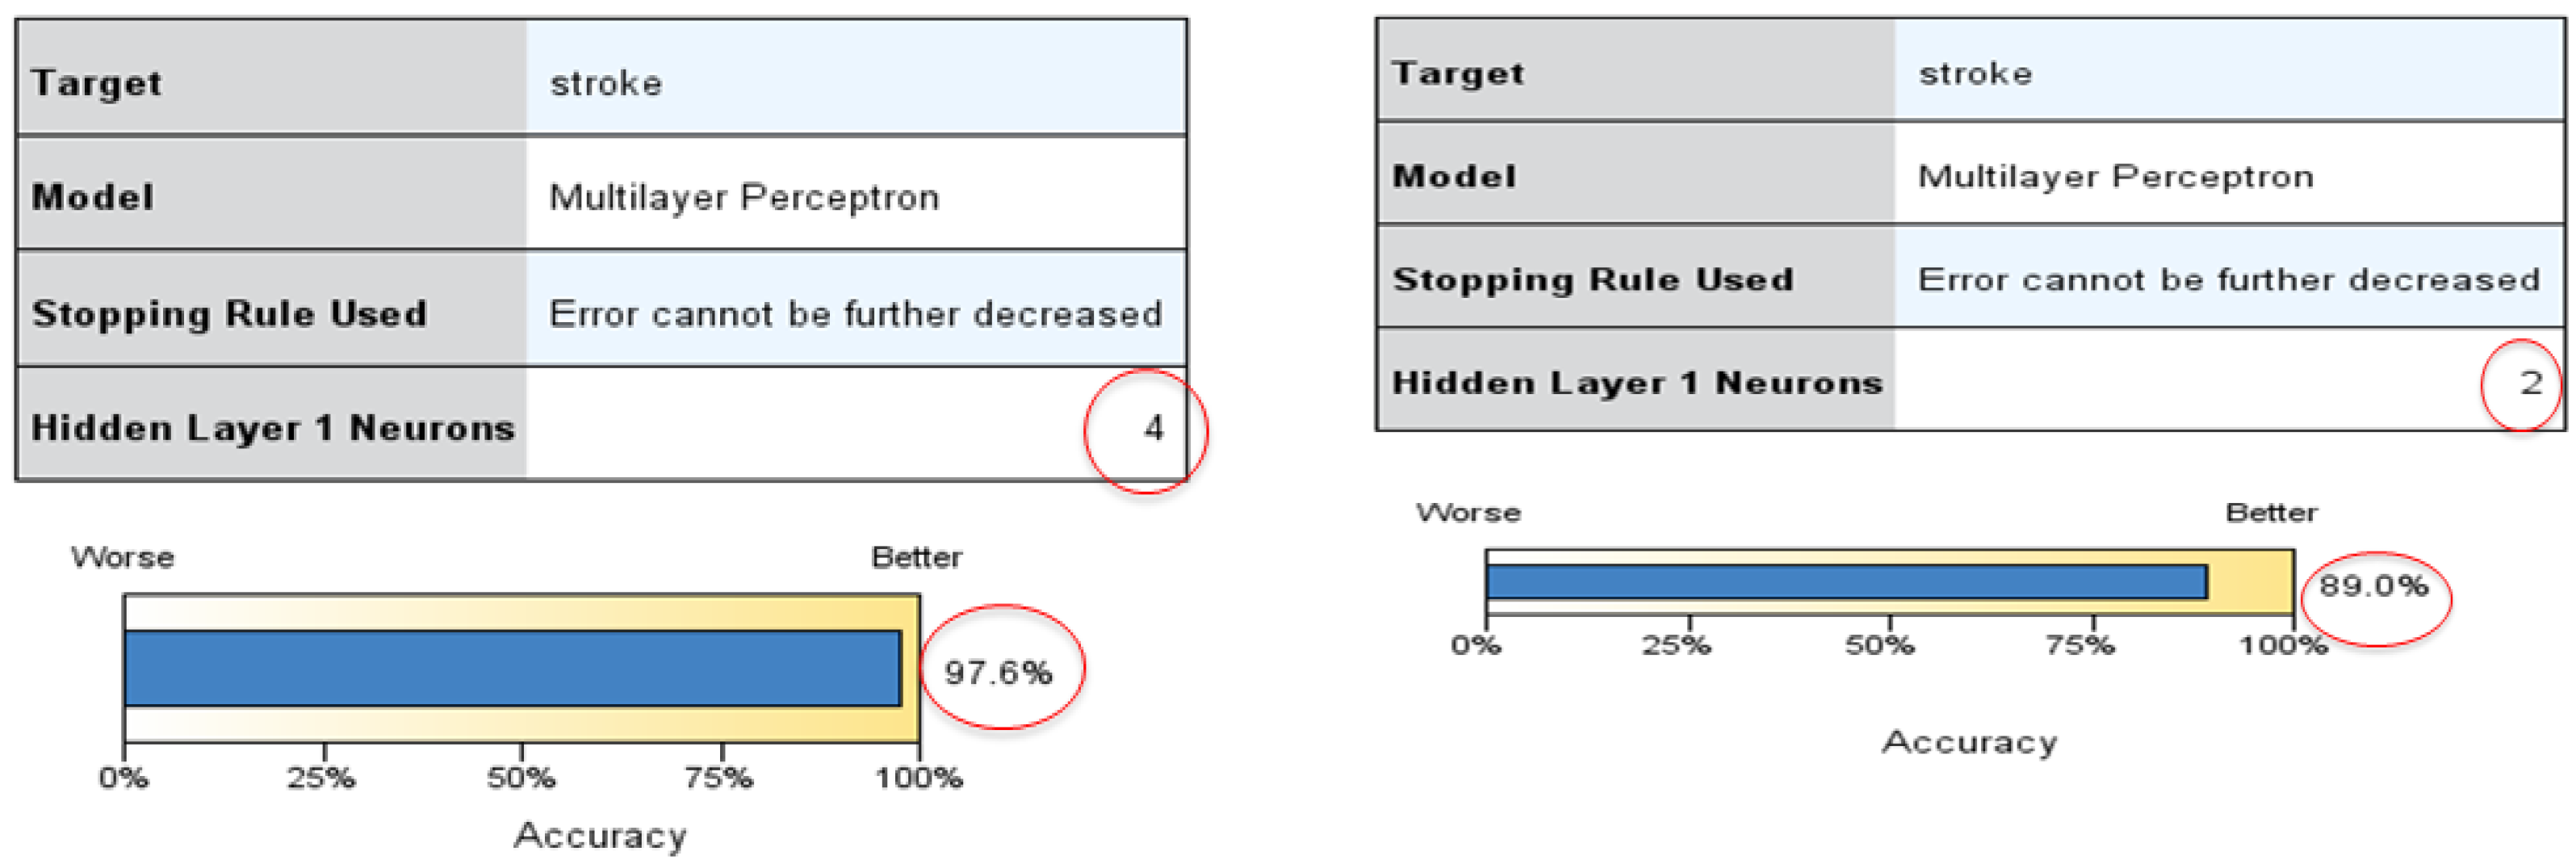
| 10 | 1 | 70 | 30 | 1 | Auto 4 | 97.6 | Age, work sugar | |
| 10 | 1 | 60 | 40 | 1 | Auto 2 | 96.6 | Age, marital, sugar | |
| 10 | 1 | 50 | 50 | 1 | 9 | 96.8 | Sugar, work, fruit | |
| 10 | 1 | 50 | 50 | 2 | (2,9) | 96.8 | Age, work alcohol | |
| 10 | 1 | 50 | 50 | 2 | (9,9) | 96.8 | Smoke, fruit, work | |
| 10 | 1 | 50 | 50 | 2 | (3,3) | 96.8 | Age, work, income | |
| Data Size 550 | ||||||||
| Stroke | 10 | 1 | 50 | 50 | 1 | Auto 2 | 89.0 | Work, marital fruit |
| 10 | 1 | 70 | 30 | 1 | Auto 2 | 89.1 | Vegetable, marital, work | |
| 10 | 1 | 60 | 40 | 1 | Auto 3 | 87.7 | Age, marital, work | |
| 10 | 1 | 50 | 50 | 1 | 9 | 85.1 | Fruit, vegetable, sugar | |
| 10 | 1 | 50 | 50 | 2 | (3,3) | 86.8 | Work, vegetable, income | |
© 2017 by the authors. Licensee MDPI, Basel, Switzerland. This article is an open access article distributed under the terms and conditions of the Creative Commons Attribution (CC BY) license ( http://creativecommons.org/licenses/by/4.0/).
Share and Cite
Raghupathi, V.; Raghupathi, W. Preventive Healthcare: A Neural Network Analysis of Behavioral Habits and Chronic Diseases. Healthcare 2017, 5, 8. https://doi.org/10.3390/healthcare5010008
Raghupathi V, Raghupathi W. Preventive Healthcare: A Neural Network Analysis of Behavioral Habits and Chronic Diseases. Healthcare. 2017; 5(1):8. https://doi.org/10.3390/healthcare5010008
Chicago/Turabian StyleRaghupathi, Viju, and Wullianallur Raghupathi. 2017. "Preventive Healthcare: A Neural Network Analysis of Behavioral Habits and Chronic Diseases" Healthcare 5, no. 1: 8. https://doi.org/10.3390/healthcare5010008