
The Impact of Hemodialysis on Spatio-Temporal Characteristics of Gait and Role of Exercise: A Systematic Review

1
London Health Sciences Center, London, ON N6G 5A5, Canada
2
Department of Physiotherapy, Western University, London, ON N6G 1H1, Canada
*
Author to whom correspondence should be addressed.
Healthcare 2017, 5(4), 92; https://doi.org/10.3390/healthcare5040092
Submission received: 13 November 2017
/
Revised: 28 November 2017
/
Accepted: 30 November 2017
/
Published: 5 December 2017
(This article belongs to the Special Issue The Socio-Economic Impact of End Stage Kidney Disease)
Abstract
:Background: People with end-stage kidney disease (ESKD) on hemodialysis (HD) commonly have functional impairments. The purpose of this systematic review was to evaluate the effect of HD on spatio-temporal characteristics of gait, and effect of exercise on these parameters. Methods: Electronic databases were searched to identify relevant citations. Extracted data was computed using a random effects model for means (Hedges’ and 95% confidence interval (CI). Results: 27 studies met inclusion criteria. Mean values: gait speed (GS)—1.0 m/s (CI: 0.9–1.1 m/s; 16 studies), fast walking speed (FWS)—1.5 m/s (CI: 1.3–1.6 m/s; 7 studies), timed get-up & go test (TUG) —6.8 s (CI: 6.1–7.5 s; 2 studies), walk tests (WT) 193.0 s (CI: 116.0–270.0; 5 studies), 6 min-walk-test (6MWT)—386.6 m (CI: 243.2–530.0 m; 11 studies). 4 studies compared participants on HD with normal controls and 10 studies evaluated the effect of nutrition/exercise. Conclusions: Compared to age-matched populations, people with ESKD/HD had significantly slower GS and reduced walk distances; with intervention, the change in the distance walked was significant. Further research is required to evaluate the effect of HD on gait parameters, and the type of exercise/nutrition that will lead to meaningful changes.
1. Introduction
Chronic kidney disease is the progressive failure of renal function over a period of years. In its end-stage, renal replacement therapies (RRT) such as hemodialysis (HD), peritoneal dialysis (PD), or kidney transplants are required to supplement the metabolic homeostatic functions of the kidney. The aging of the Canadian population is reflected in the demographic profile of new end-stage kidney diseases (ESKD) patients: 53% of those who initiated RRT in 2010 were aged 65 years and older, compared to 39% in 1991 [1].
People with ESKD on HD experience multiple catabolic processes, including loss of albumin and amino acids during dialysis, metabolic derangements, and changes in skeletal muscle associated with conditions of muscle disuse [2]. These changes result in muscle atrophy (loss of lean muscle mass). The presence of neurogenic (muscle atrophy or loss associated with nerve disorder), myogenic (damage intrinsic to the muscle), and mixed (neurogenic and myogenic) changes intrinsic to the skeletal muscle in people with ESKD on HD [3] may further compromise the integrity of the motor-unit complex and contribute to muscle atrophy [4]. As a result, such changes can lead to overall decreases in gait and mobility [5].
People with ESKD on HD are also known to have renal osteo-dystrophy [6] predisposing them to increased risk for falls [7,8] and long bone fractures [9]. This incidence of falls in people on HD is higher than their non-uremic community-dwelling counterparts; for the community-dwelling older adults, the fall rate ranges from 0.32 to 0.70 fall/person-year [10,11] whereas the same amongst people requiring HD ranges from 1.18 [7] to 1.6 [8] falls per person-year. Since falls commonly predict morbidity, mortality and perhaps need for institutional care, it is important to initiate appropriate interventions in a timely manner to prevent falls and related consequences [11].
The deleterious consequences of falls are not restricted to wounds, fractures, hospitalization, or death. Post-fall anxiety syndrome and fear of falling again result in a loss of self-confidence and self-restriction of activity creating a vicious circle leading to reduced exercise and muscle mass. Falls also are a leading cause of admission to nursing homes. Finally, the cost inherent to falls is substantial: they account for 6% of all medical expenditures in non-uremic patients 65 years or older [10].
Walking speed (WS) or gait speed (GS) is a well-recognized prognostic factor in the geriatric population. It provides information on patient outcomes and hospitalization risk [12]. It has been considered a reliable and sensitive outcome to measure functional abilities, and ability to predict future health status and quality of life. Fritz and Lusardi [13] argue that GS can be used as a functional “vital sign” to help determine risk for falls in people on HD [14], and outcomes such as functional status [15,16], discharge location [17], and the need for rehabilitation in geriatric population [18]. The clinical findings of impaired GS may alert the health care professionals to initiate appropriate exercise interventions and/or introduce suitable gait-aids for that individual. Therefore, it is essential to understand the impact of HD on spatial (distance walked) or temporal (gait speed) characteristics of gait. The primary objective of this study was to determine the effects of HD on spatio-temporal gait parameters. The secondary objective was to review the effect of exercises on these parameters within the cluster of studies selected for this review.
2. Materials and Methods
2.1. Literature Search
Electronic databases (PubMed, Medline, Embase, EBSCO, and Scopus) were searched from their inception until May 2017, using different strategies that encompass the wide range of gait parameters that may be affected by HD. The following keywords were searched as MeSH or “mapped terms” and as text words: (chronic OR end-stage) AND (kidney OR renal) AND (disease OR failure) AND (dialysis OR hemodialysis OR haemodialysis) AND (walk OR walking OR ambulation OR ambulatory OR ambulate OR gait) and (speed OR velocity).
2.2. Inclusion Criteria
The inclusion criteria were as follows: (a) the paper was published in the English language; (b) participants on HD were adults; (c) one of the outcome measures measured spatial or temporal parameters of gait (d) full text articles was available.
2.3. Exclusion Criteria
The exclusion criteria were the following: (a) study participants on peritoneal dialysis or any other form of renal replacement therapy other than HD; (b) animal studies or trials; (c) case studies or literature reviews.
2.4. Outcome Measures
Outcome measures such as GS, timed up-and-go test (TUG) [19], six minute walk test (6MWT) [20], and the intermittent shuttle walk test (ISWT) [21], were considered as appropriate outcome measures for inclusion in this review. All gait speed measurements that were reported in formats other than meters per second (m/s) were adjusted to meet this standardized unit of GS as m/s.
2.5. Data Collection and Analysis
Following the primary search, the primary authors independently reviewed the titles, abstracts and full texts to establish the inclusion of the study for this review. Discussions in case of discrepancy were adequate for resolution. All articles were included by consensus.
Required data for calculations of cumulative means and the 95% confidence interval (CI) around the mean were extracted using a standardized form, from the included studies by one author and reviewed by the second author for accuracy. In studies with experimental designs baseline values of the outcome measures in various groups was included for estimation of effect of HD.
2.6. Statistical Analyses
A statistical package, Comprehensive Meta-Analysis (Version 2.2.064, Biostat, Englewood, NJ, USA) software for meta-analysis of binary, continuous and diagnostic data, was used for computation of the cumulative means. The confidence interval at a 95% confidence limit was constructed around the point estimate of the cumulative mean.
The results reported were calculations using the random effects model to account for methodological differences amongst studies. The significance level for all statistical tests evaluating the effect of exercises or comparison with normal was set at p < 0.05.
3. Results
The initial search yielded 431 citations. Of these 27 [5,22,23,24,25,26,27,28,29,30,31,32,33,34,35,36,37,38,39,40,41,42,43,44,45,46,47] studies met inclusion criteria (Figure 1). Characteristics of the studies included are presented in Table 1. Sixteen [5,22,23,25,27,31,32,33,34,35,36,37,39,40,42,45] of the 27 studies published a single point data, four studies [28,29,30,34] utilized pre-post design to evaluate the effect of exercises and seven studies [24,26,38,41,44,46,47] used a controlled trial design to evaluate effect of either nutritional or exercise intervention in this population. The baseline values of the participants in these studies were utilized for analysis evaluating the effect of HD on spatio-temporal gait parameters.
3.1. Effect of Hemodialysis on Spatiotemoporal Gait Parameters
Gait speed (GS): A total of 16 studies [5,23,25,27,29,32,33,34,35,36,37,39,44,45,46,47] reported GS in 23 sub-groups of participants (Table 2). The mean GS was 1.01 m/s (95% CI: 0.95–1.07 m/s).
Fast walking speed (FWS): A total of 7 studies [22,23,29,39,42,44,46] reported FWS in 8 sub-groups of participants (Table 3). The mean FWS was 1.4 m/s (95% CI 1.3–1.6 m/s).
Timed up and go test (TUG): A total of 2 [38,47] studies reported TUG in 6 sub-groups of participants (Table 4). The mean value of TUG was 6.8 s (95% CI 6.1–7.5 s).
6 min walk test (6MWT): A total of 10 studies [24,25,26,27,29,30,38,41,42,44] reported 6MWT in 16 sub-groups of participants. The mean 6MWT distance in this group was 411.6 (95% CI: 377.0–446.1 m) (Table 5).
Walk tests: A total of 5 studies reported walk tests presented as time required in seconds for the completion of tests (Table 6). Bulckaen et al. [24] reported treadmill walk tests, Jeong et al. [32] reported intermittent shuttle walk test (ISWT), Lane et al. [40] and Tomayako et al. [47] reported shuttle walk tests (SWT), and Mercer et al. [43] reported 50 m walk tests. The data extracted from these studies was grouped together to estimate the effect of HD on walk timings. The mean time taken to complete these tests was 193.5 s (95% CI 116.3–270.7 s).
3.2. Comparison with Normal Controls
Four studies [5,23,35,45] presented comparison of GS with normal control participants or established normative values (Table 7). For the GS, participants on HD were slower by 1.26 m/s (95% CI 0.76–1.76 m/s; p < 0.001) when compared to age-matched normal controls with no kidney disease. Table 8 presents the analysis from the GAITRite investigation by Shin et al. [45].
3.3. Effect of Exercise or Nutritional Intervention on Spatiotemoporal Gait Parameters
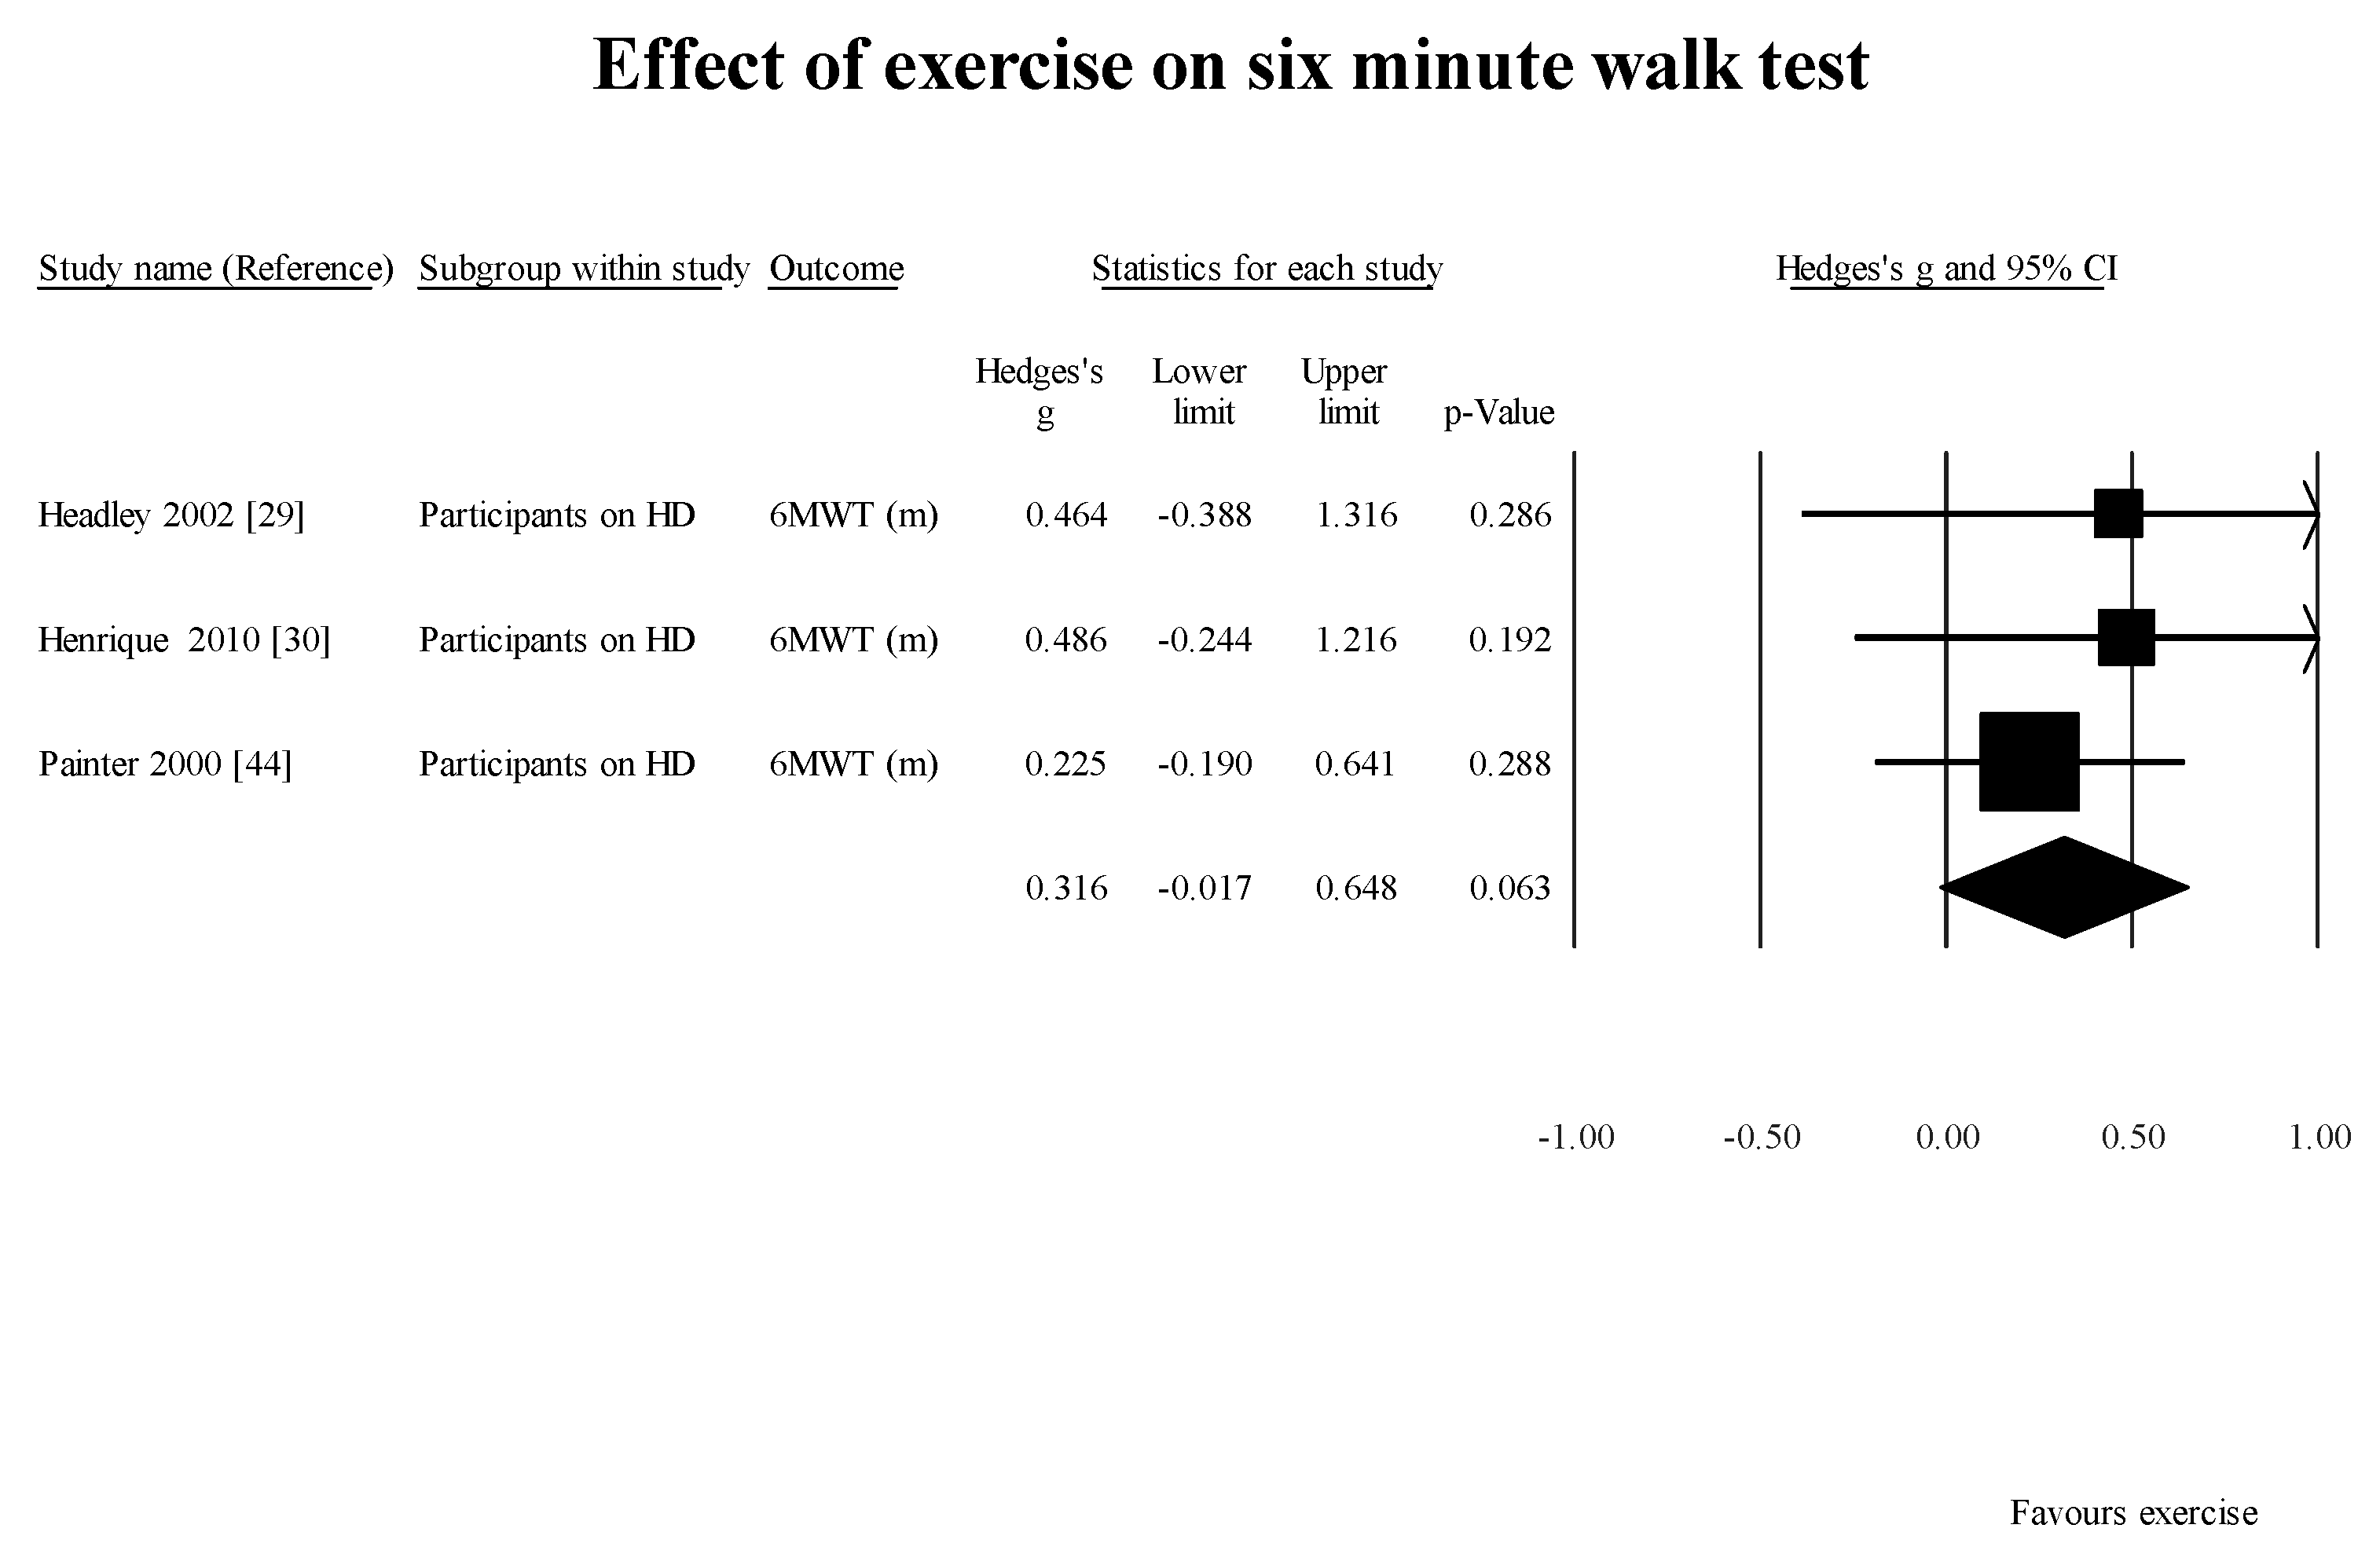
Studies using pre- and post-design for intervention: Three studies [29,30,44] within the cluster of studies included in this review utilized pre- and post-intervention study design to evaluate the effect of exercises in three subgroups of participants. The mean changes were as follows:
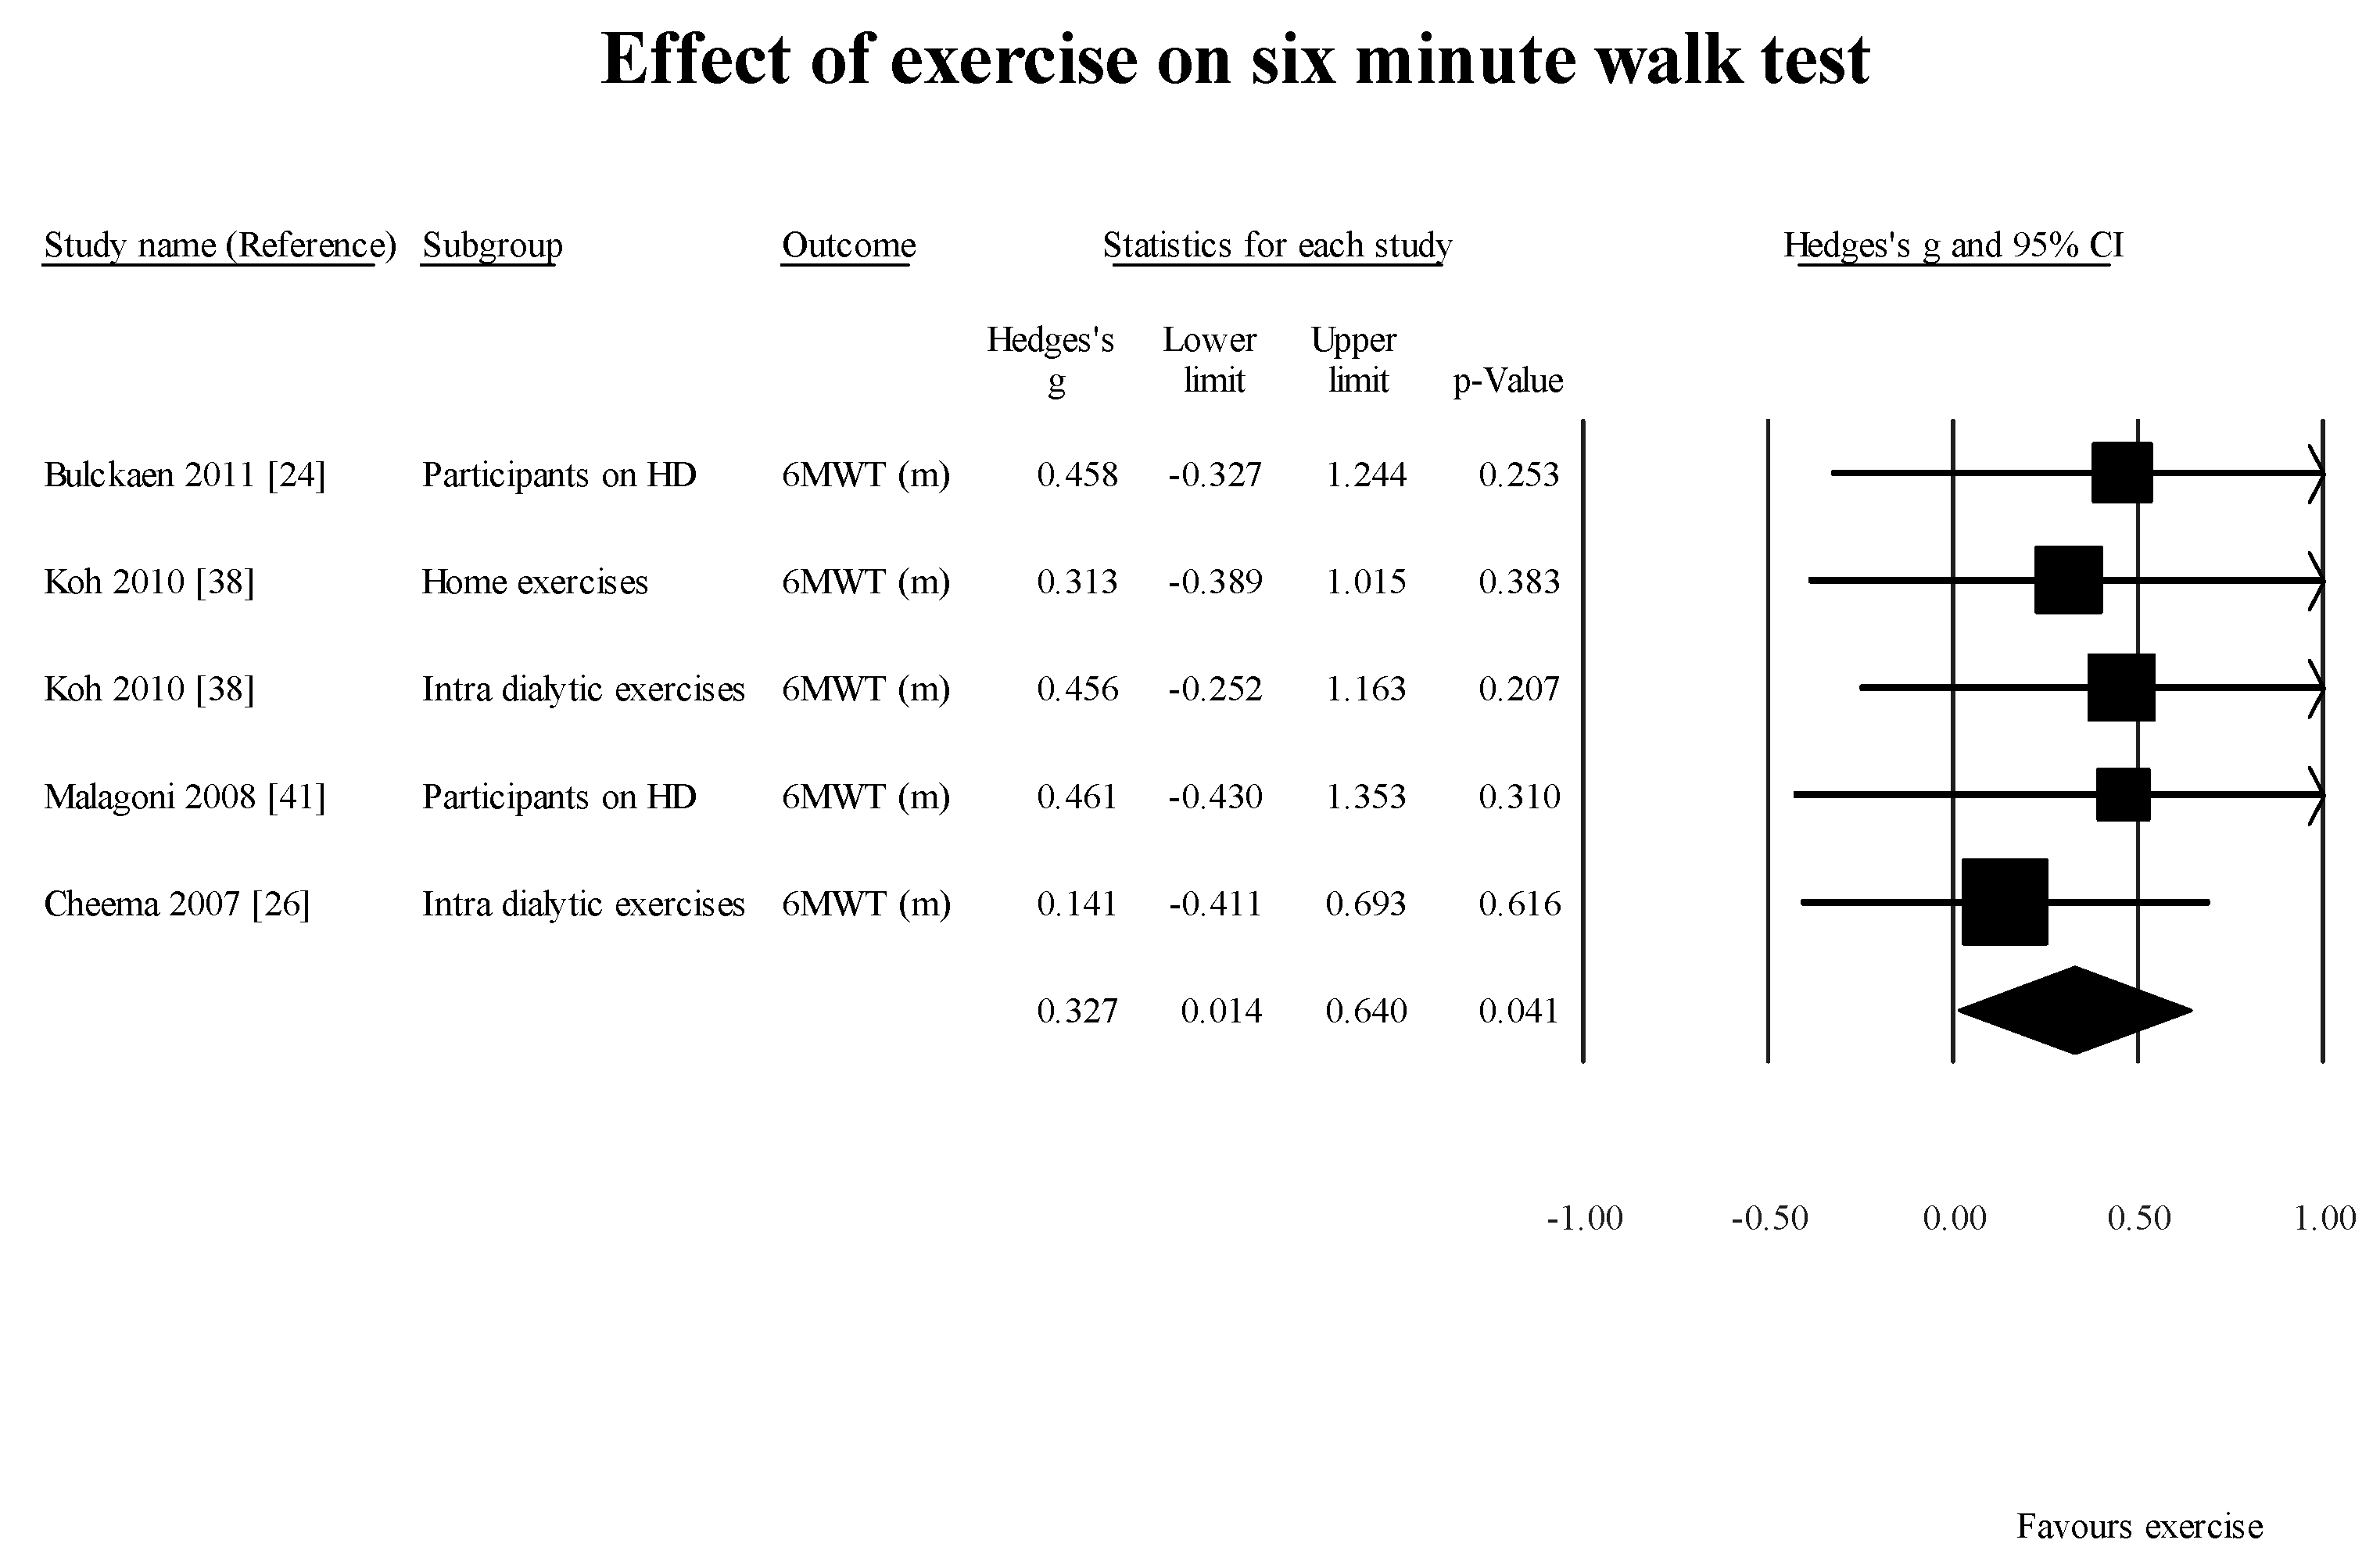
FWS [29] (1 study, 1 group): 0.92 m/s (95% CI: 0.0–1.85; p = 0.05); 6MWT [28,29,44] (3 studies 3 subgroups): 0.32 m/s (95% CI: −0.02–0.65; p = 0.0.06) (Figure 3);
Studies using intervention and control design for intervention: Six studies within the cluster of studies included in this review utilized controlled experimental study design to evaluate the effect of exercises/nutrition in eight subgroups of participants. The mean changes were as follows:
4. Discussion
The results of this systematic review confirm the earlier findings of reduced GS (normal walking) and distance walked in six minutes by participants on HD in the literature. The mean dialysis vintage of the participants included in the studies reporting dialysis vintage was 53 months. This indicates that within a period of 53 months, people on HD have a significantly slower gait speed when compared to an age-matched population without ESKD. One of the studies [47] selected in this review did not report the dialysis vintage of the participants in the study. According to Roshanravan et al. [48], GS measured with a 4-m walk test in participants with CKD stages 2 to 4 was about 30% lower than predicted. Hence, at this time it is unclear whether the participants who progressed to requiring HD continued to decline after the treatment was started. Further longitudinal studies are required to elucidate the effect of HD on GS as a function of time.
We evaluated the effect of whole body fluid loss following HD on tibialis anterior (TA) strength and water content [49]. Overall, a significant reduction (p < 0.05) in peak strength by 1.54 Nm (95% CI: 0.05, 3.02), and extra cellular fluid (ECF) (measured using transverse relaxation times on magnetic resonance spectroscopy (T2) shortened by 2.38 ms; 95% CI: 1.04, 3.71) of TA were observed between before- and after-HD measurements. Based on these findings, we recommended that deteriorating muscle functions such as gait and mobility should be added as a symptom of chronic dehydration, requiring further assessment of dry weight of a HD patient. This is important, as reduction in muscle strength has been associated with whole-body fluid loss [50], and Edwards et al. [51] suggest that a weaker muscle, unable to meet functional demands such as standing or walking made upon it, leads to further muscle weakness.
Although we set out to evaluate the effect of HD on GS, we did not find any longitudinal study reporting the time frame following HD when measurable reductions in GS and/or mobility occur. However, we recommend that gait assessments be conducted at three-month intervals as Johansen and colleagues [28] have demonstrated a decrement in the Human Activity Profile (HAP) Questionnaire (measure of self reported physical activity) adjusted activity score (HAP–AAS) scores in HD participants at a follow-up data collection after three months.
Two [46,47] of the six case-control studies evaluating the effect of exercise established a significant increment in GS. These findings are in alignment with what has been reported in the literature [52,53]. However, adherence and uptake of these exercises is limited [54]. Hence, it is important to identify people on HD with deteriorating GS or self-reported physical function. These findings can lead to initiating multi-disciplinary intervention to optimize patient’s functional abilities, reduce the risk for falls and related co-morbidities.
Another factor requiring further investigation is whether supervised exercise is superior to home-based exercise for improving GS among these patients. All the case-control studies included in this review did not conclusively determine if home-based exercise program or supervised exercise programs are superior. Tomayako et al. [47] indicated that a supervised exercise program resulted in improved gait speed, whereas Koh et al. [38] suggested that home-based exercises were as effective as supervised exercise programs.
Donat and Özcan [55] compared the effectiveness of supervised group exercise and unsupervised home exercise programs on parameters related to risk of falls among older adults. Both groups showed significant improvements in balance, but the supervised group also showed significant improvement in strength and proprioception, which are important, factors in overall postural control. There are several reasonable hypotheses as to why supervised exercise interventions produce more favorable outcomes compared to home-based exercise programs. In a supervised exercise class, the patient will engage in social interaction with other participants, which will improve mood, attitude and motivation which can be depressed in patients with a chronic illness such as ESKD requiring maintenance HD [56]. Especially for some elderly patients who may have become more socially isolated, this camaraderie can allow them to interact with others who share the same experiences in everyday life. During supervised exercise, patients will also have the advantage of receiving complete or semi-personalized attention in order to ensure that the intervention is being applied correctly in order to maximize results.
This finding is extremely relevant in today’s political environment. The Canadian provincial governments have decided to promote self-management as the main intervention for chronic disease in order to relieve some of the burden on the health care system. Using the Stanford program (USA) and the Expert Patient Programmed (UK) as models, the Ontario (Canada) government conducted a systematic review in 2008 in order to determine the efficacy of self-management strategies in chronic diseases [57]. The intervention involved patient education and counseling in order to inform patient about their disease and how to manage the symptoms. The aim is that patients will then take on the responsibility of managing their disease under self-supervision after the initial education. However, our results, at least in the chronic disease of ESKD on HD, show that relying on the patient as the sole supervisor of their own health and wellness program does not produce favorable results, as evidenced by ongoing deterioration of GS and distance walked. We believe that self-management in combination with periods of supervised intervention may be more beneficial when new deficits of gait or new challenges arise particularly in patients with ESKD/HD. Access to appropriate health professionals in a timely manner will help address the gait and mobility impairments, reduce the risk of falls and related consequences and in turn save valuable dollars associated with hospitalizations and need for institutional care. Further research is required to elucidate the benefits of supervised versus home-based exercise programs leading to clinically meaningful changes in GS and distances walked.
Limitations
We have comprehensively reviewed the effect of chronic hemodialysis on physical function. We have not reviewed several factors that can impact the outcome of the studies. For example, the relative and absolute reliability of the outcome measures require consideration when used in studies utilizing repeated measures designs. We established that for a stable estimate of 6MWT, a minimum of two measures are required [58]. None of the studies included in this review collected the measure on two occasions for stable baseline value of the measure. We did not find any study that evaluated the relative and absolute reliability of the GS, or TUG in the population of interest.
The effect of whole-body fluid loss following HD may impact the assessment of the functional outcome measure collected. Hence, it is important to report the time of data collection in relation to the participants’ HD treatment schedule; e.g., data was collected on non-dialysis day, or just prior to HD treatment. Most of the studies included here did not categorically indicate the time of data collection.
It was not the intent of this review to comprehensively evaluate the effect of exercise/nutrition on gait parameters. We have reviewed the studies reporting the benefits of exercise /nutrition within the cluster of studies selected for addressing the primary objective of looking at the effect of HD on spatio-temporal gait parameters.
5. Conclusions
In conclusion, the results of this systematic review indicate that the people with ESKD on HD treatment experience deterioration of spatial and temporal characteristics of their gait. It is important to ensure that people with such conditions have access to a multi-disciplinary health-care team for timely intervention and to reduce the deleterious consequences of the disease and related disorders. This, in turn, may reduce the burden of kidney disease and related healthcare costs.
Acknowledgments
We would like to thank Coco Ang ([email protected]), Cassandra Duchesne ([email protected]) Melayna Sager ([email protected]) and Andrea Trembley ([email protected]), students of the Masters in Physical Therapy Program, Western University for assisting with partial data collection and search for this study as a part of their student project undertaken for completion of the program.
Author Contributions
Anuradha Sawant conceived the research project and designed the data collection and analysis plan together with Tom Overend; Anuradha Sawant performed the literature search, data extraction and analysis; Tom Overend reviewed the data collected and the results for accuracy and appropriateness; Anuradha Sawant and Tom Overend wrote the paper.
Conflicts of Interest
The authors declare no conflict of interest. This study did not receive any funding.
References
- Canadian Institute of Health Information. Canadian Organ Replacement Register Annual Report: Treatment of End-Stage Organ Failure in Canada, 2002 to 2011. Available online: https://secure.cihi.ca/free_products/2013_CORR_Annua_Report_EN.pdf (accessed on 7 July 2013).
- Ikizler, T.A.; Himmelfarb, J. Muscle wasting in kidney disease: Let’s get physical. J. Am. Soc. Nephrol. 2006, 17, 2097–2098. [Google Scholar] [CrossRef] [PubMed]
- Sawant, A.; Garland, S.J.; House, A.A.; Overend, T.J. Morphological, electrophysiological, and metabolic characteristics of skeletal muscle in people with end-stage renal disease: A critical review. Physiother. Can. 2011, 63, 355–376. [Google Scholar] [CrossRef] [PubMed]
- Appell, H.J. Muscular atrophy following immobilization. A review. Sports Med. 1990, 10, 42–58. [Google Scholar] [CrossRef] [PubMed]
- Johansen, K.L.; Shubert, T.; Doyle, J.; Soher, B.; Sakkas, G.K.; Kent-Braun, J.A. Muscle atrophy in patients receiving hemodialysis: Effects on muscle strength, muscle quality, and physical function. Kidney Int. 2003, 63, 291–297. [Google Scholar] [CrossRef] [PubMed]
- Sakhaee, K.; Gonzalez, G.B. Update on renal osteodystrophy: Pathogenesis and clinical management. Am. J. Med. Sci. 1999, 317, 251–260. [Google Scholar] [CrossRef]
- Desmet, C.; Beguin, C.; Swine, C.; Jadoul, M. Falls in hemodialysis patients: Prospective study of incidence, risk factors and complications. Am. J. Kid Dis. 2005, 45, 148–153. [Google Scholar] [CrossRef] [PubMed]
- Cook, W.L.; Tomlinson, G.; Donaldson, M.; Markowitz, S.N.; Nagle, G.; Sobolev, B.; Jassal, V. Falls and fall-related injuries in older dialysis patients. Clin. J. Am. Soc. Nephrol. 2006, 1, 1197–1204. [Google Scholar] [CrossRef] [PubMed]
- Jamal, S.A.; Leiter, R.E.; Jassal, V.; Hamilton, C.J.; Baur, D.C. Impaired muscle strength is associated with fractures in hemodialysis patients. Osteoporos. Int. 2006, 17, 1390–1397. [Google Scholar] [CrossRef] [PubMed]
- The Public Health Agency of Canada: Report on Seniors’ Falls in Canada. 2005. Available online: http://publications.gc.ca/collections/Collection/HP25-1-2005E.pdf (accessed on 14 October 2013).
- Sattin, R.W. Falls among older persons: A public health perspective. Annu. Rev. Public Health 1992, 13, 489–508. [Google Scholar] [CrossRef] [PubMed]
- Kutner, N.G.; Zhang, R.; Huang, Y.; Wasse, H. Gait speed and hospitalization among ambulatory hemodialysis patients: USRDS special study data. World J. Nephrol. 2014, 3, 101–106. [Google Scholar] [CrossRef] [PubMed]
- Fritz, S.; Lusardi, M. White paper: “Walking speed: The sixth vital sign”. J. Geriatr. Phys. Ther. 2009, 32, 2–5. [Google Scholar] [CrossRef]
- Hong, C.; Won, C.W.; Kim, B.; Choi, H.; Kim, S.; Choi, S.; Hong, S. Gait speed cut-off as a predictor of falls in community dwelling older adults: Three-year prospective finding from living profiles of elderly people surveys in Korea. Korean J. Fam. Pract. 2016, 6, 105–110. [Google Scholar] [CrossRef]
- Perry, J.; Garrett, M.; Gronley, J.K.; Mulroy, S.J. Classification of walking handicap in the stroke population. Stroke 1995, 26, 982–989. [Google Scholar] [CrossRef] [PubMed]
- Studenski, S.; Perera, S.; Wallace, D.; Chandler, J.M.; Duncan, P.W.; Rooney, E.; Fox, M.; Gurainik, J.M. Physical performance measures in the clinical setting. J. Am. Geriatr. Soc. 2003, 51, 314–322. [Google Scholar] [CrossRef] [PubMed]
- Rabadi, M.H.; Blau, A. Admission ambulation velocity predicts length of stay and discharge disposition following stroke in an acute rehabilitation hospital. Neurorehabilit. Neural Repair 2005, 19, 20–26. [Google Scholar] [CrossRef] [PubMed]
- Montero-Odasso, M.; Schapira, M.; Soriano, E.R.; Varela, M.; Kaplan, R.; Camera, L.A.; Mayorga, L.M. Gait velocity as a single predictor of adverse events in healthy seniors aged 75 years and older. J. Gerontol. A Biol. Sci. Med. Sci. 2005, 60, 1304–1309. [Google Scholar] [CrossRef] [PubMed]
- Herman, T.; Giladi, N.; Hausdorff, J.M. Properties of the Timed Up and Go Test: More than meets the eye. Gerontology 2011, 57, 203–210. [Google Scholar] [CrossRef] [PubMed]
- Enright, P.L. The six-minute walk test. Respir. Care 2003, 48, 783–785. [Google Scholar] [PubMed]
- Shuttle Walk Test (Internet). Assoc. Respir. Technol. Physiol. 2013. Available online: http://www.artp.org.uk/en/patient/exercise/SWT.cfm (accessed on 12 July 2016).
- Abe, Y.; Matsunga, A.; Matsuzawa, R.; Kutsuna, T.; Yamamoto, S.; Yoneki, K.; Harada, M.; Ishikawa, R.; Watanabe, T.; Yoshida, A. Determinants of slow walking speed in ambulatory patients undergoing maintenance hemodialysis. PLoS ONE 2016. [Google Scholar] [CrossRef] [PubMed]
- Blake, C.; O’Meara, Y.M. Subjective and objective physical limitations in high-functioning renal dialysis patients. Nephrol. Dial. Transplant. 2004, 19, 3124–3129. [Google Scholar] [CrossRef] [PubMed]
- Bulckaen, M.; Capitanini, S.L.; Lange, S.; Caciula, A.; Giuntoil, F.; Cupisti, A. Implementation of exercise training programs in a hemodialysis unit: Effects on physical performance. J. Nephrol. 2011, 24, 790–797. [Google Scholar] [CrossRef] [PubMed]
- Chang, J.; Koo, M.; Chen, C. Effects of a 12-week program of Tai Chi exercise on the kidney disease quality of life and physical functioning of patients with end-stage renal disease on hemodialysis. Compliment. Ther. Med. 2017, 30, 79–83. [Google Scholar] [CrossRef] [PubMed]
- Cheema, B.; Abas, H.; Smith, B.; O’Sullivan, A.; Chan, M.; Patwardhan, A.; Kelly, J.; Gillin, A.; Pang, G.; Lloyd, B.; et al. Progressive exercise for anabolism in kidney disease (PEAK): A randomized, controlled trial of resistance training hemodialysis. J. Am. Soc. Nephrol. 2007, 18, 1594–15601. [Google Scholar] [CrossRef] [PubMed]
- Cheema, B.; Haifa, A.; Smith, B.; O’Sullivan, A.; Chan, M.; Patwardhan, A.; Kelly, J.; Gillin, A.; Pang, G.; Lloyd, B.; et al. Investigation of skeletal muscle quantity and quality in end-stage renal disease. Nephrology 2010, 15, 454–463. [Google Scholar] [CrossRef] [PubMed]
- Golebiowski, T.; Kusztal, M.; Weyde, W.; Dziubek, W.; Wozniewski, M.; Krajewska, M.; Letachowicz, K.; Strempska, B.; Klinger, M. A program of physical rehabilitation during hemodialysis sessions improves the fitness of dialysis patients. Kidney Blood Press Res. 2012, 35, 290–296. [Google Scholar] [CrossRef] [PubMed]
- Headley, S.; Germain, M.; Mailoux, P.; Mulhern, J.; Ashworth, B.; Burris, J.; Brewer, B.; Nindl, B.C.; Coughlin, M.; Welles, R.; et al. Resistance training improves strength and functional measures in patients with end-stage renal disease. Am. J. Kidney Dis. 2002, 40, 355–364. [Google Scholar] [CrossRef] [PubMed]
- Henrique, D.M.N.; de Moura Roberedo, M.; Chaoubah, A.; de Paula, R.B. Aerobic Exercise Improves Physical Capacity in Patients under Chronic Hemodialysis. Master’s Thesis, Universidade Federal de Juiz de Fora, Juiz de Fora, Brazil, 2009. [Google Scholar]
- Hotta, C.; Hiraki, K.; Wakamiya, A.; Otobe, Y.; Watanabe, S.; Izawa, K.P.; Kaneshiro, N.; Konno, Y.; Sakurada, T.; Shibagaki, Y.; et al. Relation of physical function and physical activity to sarcopenia in hemodialysis patient: A preliminary study. Int. J. Cardiol. 2015, 191, 198–200. [Google Scholar] [CrossRef] [PubMed]
- Jeong, J.H.; Wu, P.; Kistler, B.M.; Fitschen, P.J.; Fitschen, P.J.; Biruete, A.G.; Phillips, S.A.; Ali, M.M.; Fernhall, B.; Wilund, K.R. The presence and impact of diastolic dysfunction on physical function and body composition in hemodialysis patients. J. Nephrol. 2015, 28, 739–747. [Google Scholar] [CrossRef] [PubMed]
- Jin, S.H.; Park, Y.S.; Park, Y.H.; Chang, H.J.; Kim, S.R. Comparison of gait speed and peripheral nerve function between chronic kidney disease patients with and without diabetes. Ann. Rehabilit. Med. 2017, 41, 72–79. [Google Scholar] [CrossRef] [PubMed]
- Johansen, K.L.; Chertow, G.M.; Silva, M.; Carey, S.; Painter, P. Determinants of physical performance in ambulatory patients on hemodialysis. Kidney Int. 2001, 60, 1586–1591. [Google Scholar] [CrossRef] [PubMed]
- Johansen, K.L.; Painter, P.; Kent-Brown, J.A.; Ng, A.V.; Carey, S.; Da Silva, M.; Chertow, G.M. Validation of questionnaires to estimate physical activity and functioning in end-stage renal disease. Kidney Int. 2001, 59, 1121–1127. [Google Scholar] [CrossRef] [PubMed]
- Johansen, K.L.; Painter, P.; Delgado, C.; Doyle, J. Characterization of physical activity and sitting time among patients on hemodialysis using a new physical activity instrument. J. Ren. Nutr. 2015, 25, 25–30. [Google Scholar] [CrossRef] [PubMed]
- Johansen, K.L.; Dairymple, L.S.; Delgado, C.; Kaysen, G.A.; Kornak, J.; Grimes, B.; Chertow, G.M. Comparison of self report-based and physical performance-based frailty definitions among patient receiving maintenance hemodialysis. Am. J. Kidney Dis. 2014, 64, 600–607. [Google Scholar] [CrossRef] [PubMed]
- Koh, K.P.; Fassett, R.G.; Sharman, J.E.; Coombes, J.S.; Williams, A.D. Effect of intradialytic versus home-based aerobic exercise training on physical function and vascular parameters in hemodialysis patients: A randomized pilot study. Am. J. Kidney Dis. 2010, 55, 88–99. [Google Scholar] [CrossRef] [PubMed]
- Kutsuna, T.; Matsunago, A.; Matsumoto, M.; Ishii, A.; Yamamoto, K.; Hotta, K.; Aiba, N.; Takagi, Y.; Yoshida, A.; Takahira, N.; et al. Physical activity is necessary to prevent deterioration of the walking ability of patients undergoing maintenance hemodialysis. Ther. Apher. Dial. 2010, 14, 193–200. [Google Scholar] [CrossRef] [PubMed]
- Lane, A.D.; Wu, P.; Kistler, B.; Fitschen, P.; Tomayko, E.; Jeong, J.H.; Chung, H.R.; Yan, H.; Ranadive, S.M.; Phillips, S.; et al. Arterial stiffness and walk time in patients with end-stage renal disease. Kidney Blood Press Res. 2013, 37, 142–150. [Google Scholar] [CrossRef] [PubMed]
- Malagoni, A.M.; Catozone, L.; Mandini, S.; Soffritti, S.; Manfredini, R.; Boari, B.; Russo, G.; Basaglia, N.; Zamboni, P.; Manfredini, F. Acute and long-term effects of an exercise program for dialysis patients prescribed in hospital and performed at home. J. Nephrol. 2008, 21, 871–878. [Google Scholar] [PubMed]
- Manfredini, F.; Rigolin, G.M.; Malagoni, A.M.; Soffritti, S.; Boari, B.; Conconi, F.; Castoldi, G.L.; Catizone, L.; Zamboni, P.; Manfredini, R. Exercise capacity and circulating endothelial progenitor calls in hemodialysis patients. Int. J. Sports Med. 2007, 28, 368–373. [Google Scholar] [CrossRef] [PubMed]
- Mercer, T.H.; Crawford, C.; Gleeson, N.P.; Naish, P.F. Low-volume exercise rehabilitation capacity and self-reported functional status of dialysis patients. Am. J. Phys. Med. Rehabilit. 2002, 81, 162–167. [Google Scholar] [CrossRef]
- Painter, P.; Carlson, L.; Carey, S.; Paul, S.M.; Myll, J. Physical functioning and health-related quality-of-life changes with exercise training in hemodialysis patients. Am. J. Kidney Dis. 2000, 35, 482–492. [Google Scholar] [CrossRef]
- Shin, S.; Chung, H.R.; Kistler, B.M.; Fitschen, P.J.; Wilund, K.R.; Sosnoff, J.J. Walking and talking in maintenance hemodialysis patients. Arch. Phys. Med. Rehabilit. 2013, 94, 127–131. [Google Scholar] [CrossRef] [PubMed]
- Tao, X.; Chow, S.K.; Wong, F.K. A nurse-led case management program on home exercise training for hemodialysis patients: A randomized controlled trial. Int. J. Nurs. Stud. 2015, 52, 1029–1041. [Google Scholar] [CrossRef] [PubMed]
- Tomayko, E.J.; Kistler, B.M.; Fitschen, P.J.; Wilund, K.R. Intradialytic protein supplementation reduces inflammation and improves physical function in maintenance hemodialysis patients. J. Ren. Nutr. 2015, 25, 276–283. [Google Scholar] [CrossRef] [PubMed]
- Roshanravan, B.; Robinson-Cohen, C.; Patel, K.V.; Ayers, E.; Littman, A.J.; de Boer, I.H.; Ikizler, T.A.; Himmelfarb, J.; Katzel, L.I.; Kestenbaum, B.; et al. Association between physical performance and all-cause mortality in CKD. J. Am. Soc. Nephrol. 2013, 24, 822–830. [Google Scholar] [CrossRef] [PubMed]
- Sawant, A. Effect of Fluid Loss Following Hemodialysis on Tibialis Anterior Muscle Strength in People with End-Stage Renal Disease. Available online: https://core.ac.uk/display/61640547 (accessed on 7 November 2017).
- Schoffstall, J.E.; Branch, J.D.; Leutholtz, B.C.; Swain, D.P. Effects of dehydration and rehydration one the one-repetition maximum bench press of weight trained athletes. J. Strength Cond. Res. 2001, 15, 102–108. [Google Scholar] [PubMed]
- Edwards, R.H.; Newham, D.J.; Jones, D.A.; Chapman, S.J. Role of mechanical damage in pathogenesis of proximal myopathy in man. Lancet 1984, 1, 548–552. [Google Scholar] [CrossRef]
- Sawant, A.; House, A.A.; Overend, T.J. Anabolic Effect of Exercise Training in People with End-Stage Renal Disease on Hemodialysis: A Systematic Review with Meta-analysis. Physiother. Can. 2014, 66, 44–53. [Google Scholar] [CrossRef] [PubMed]
- Smart, N.; Steele, M. Exercise training in haemodialysis patients: A systematic review and meta-analysis. Nephrology 2011, 16, 626–632. [Google Scholar] [PubMed]
- Torkington, M.; MacRae, M.; Isles, C. Uptake of and adherence to exercise during hospital haemodialysis. Physiotherapy 2006, 92, 83–87. [Google Scholar] [CrossRef]
- Donat, H.; Özcan, A. Comparison of the effectiveness of two programmes on older adults at risk of falling: Unsupervised home exercise and supervised group exercise. Clin. Rehabilit. 2007, 21, 273–283. [Google Scholar] [CrossRef] [PubMed]
- Herring, M.P.; Puetz, T.W.; O’Connor, P.J.; Dishman, R.K. Effect of exercise training on depressive symptoms among patients with a chronic illness: A systematic review and meta-analysis of randomized controlled trials. Arch. Intern. Med. 2012, 172, 101–111. [Google Scholar] [CrossRef] [PubMed]
- Johnston, S.; Liddy, C.; Ives, S.M.; Soto, E. Literature Review on Chronic Disease Self-Management. Submitted to The Champlain LHIN. Available online: http://www.ontla.on.ca/library/repository/mon/24006/302504.pdf (accessed on 28 June 2012).
- Overend, T.; Anderson, C.; Sawant, A.; Perryman, B.; Locking-Cusoliti, H. Relative and absolute reliability of physical function measures in people with End-Stage Renal Disease. Physiother. Can. 2010, 62, 122–128. [Google Scholar] [CrossRef] [PubMed]
Figure 1.
Flow Chart of Study Selection for the systematic review.
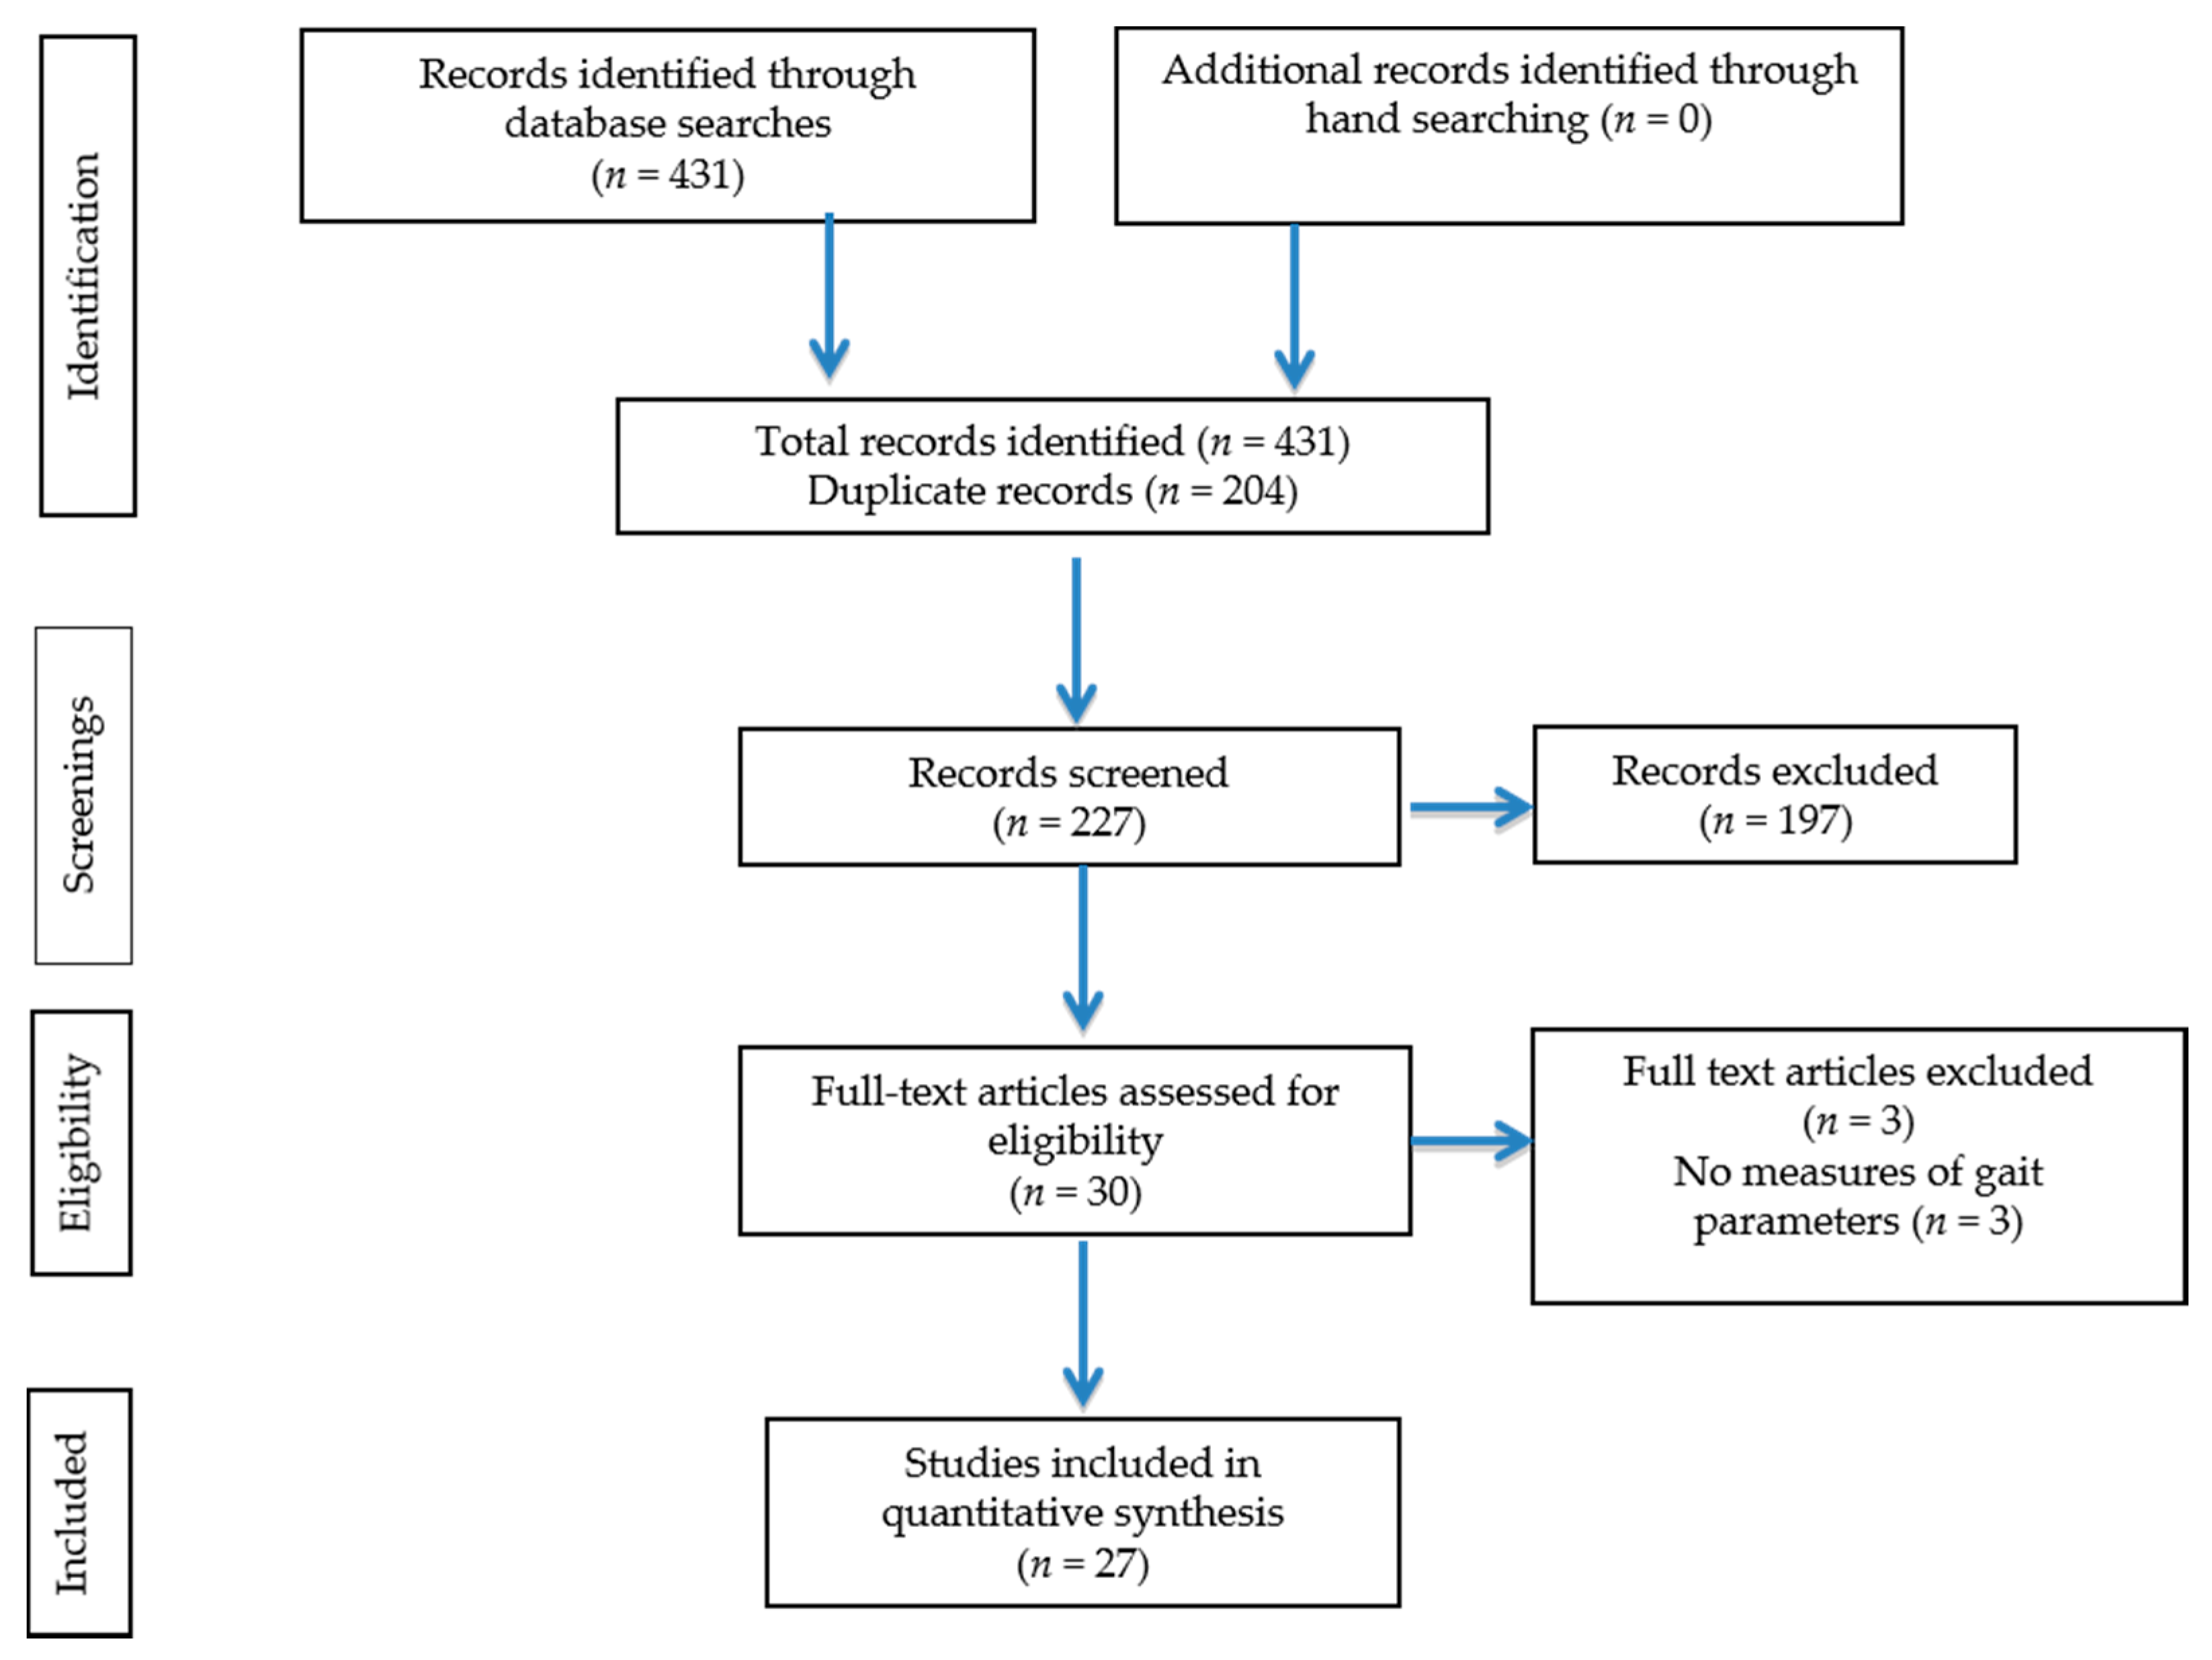
Figure 2.
Results of effect of exercise on gait speed in studies using pre-post design. 6MWT: six min walk test; HD: hemodialysis; m/s: meters per second.
Figure 2.
Results of effect of exercise on gait speed in studies using pre-post design. 6MWT: six min walk test; HD: hemodialysis; m/s: meters per second.
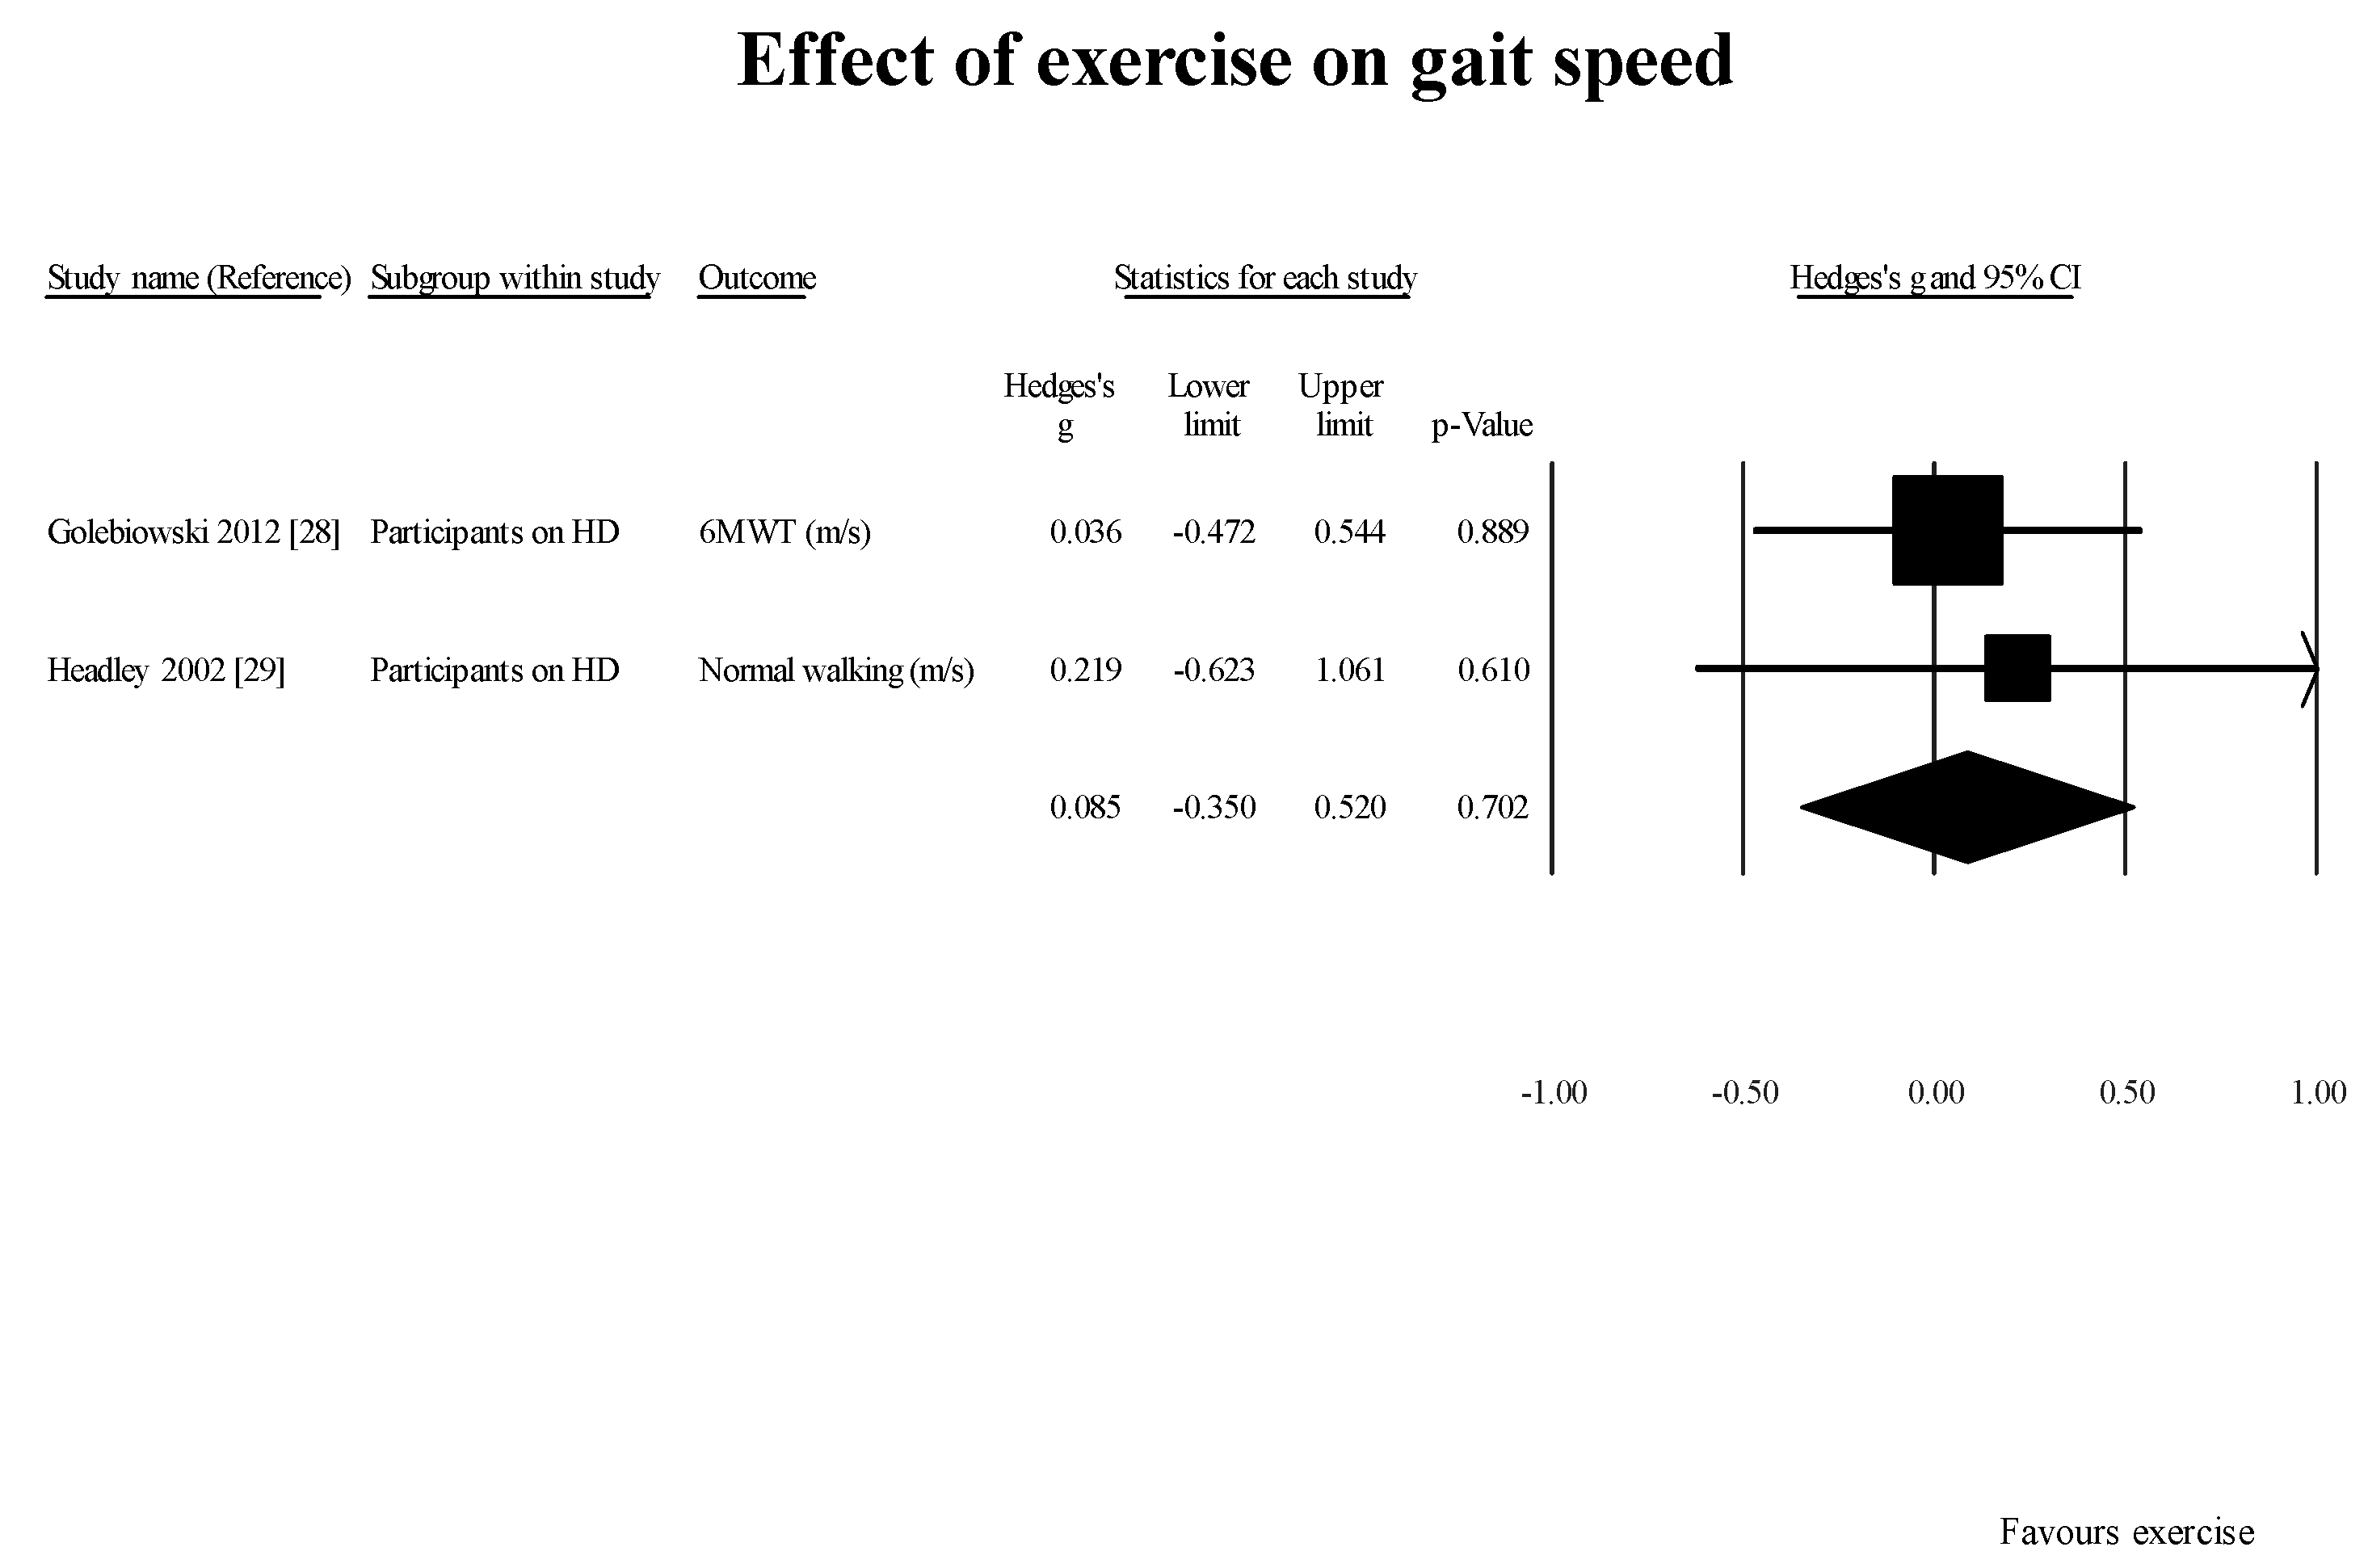
Figure 3.
Results of effect of exercise on 6MWT in studies using pre-post design. 6MWT: six minute walk test; HD: hemodialysis.
Figure 3.
Results of effect of exercise on 6MWT in studies using pre-post design. 6MWT: six minute walk test; HD: hemodialysis.

Figure 4.
Results of effect of exercise on gait speed in studies using controlled study design.

Figure 5.
Results of effect of exercise on TUG in studies using controlled study design. TUG: timed get-up and go test.
Figure 5.
Results of effect of exercise on TUG in studies using controlled study design. TUG: timed get-up and go test.
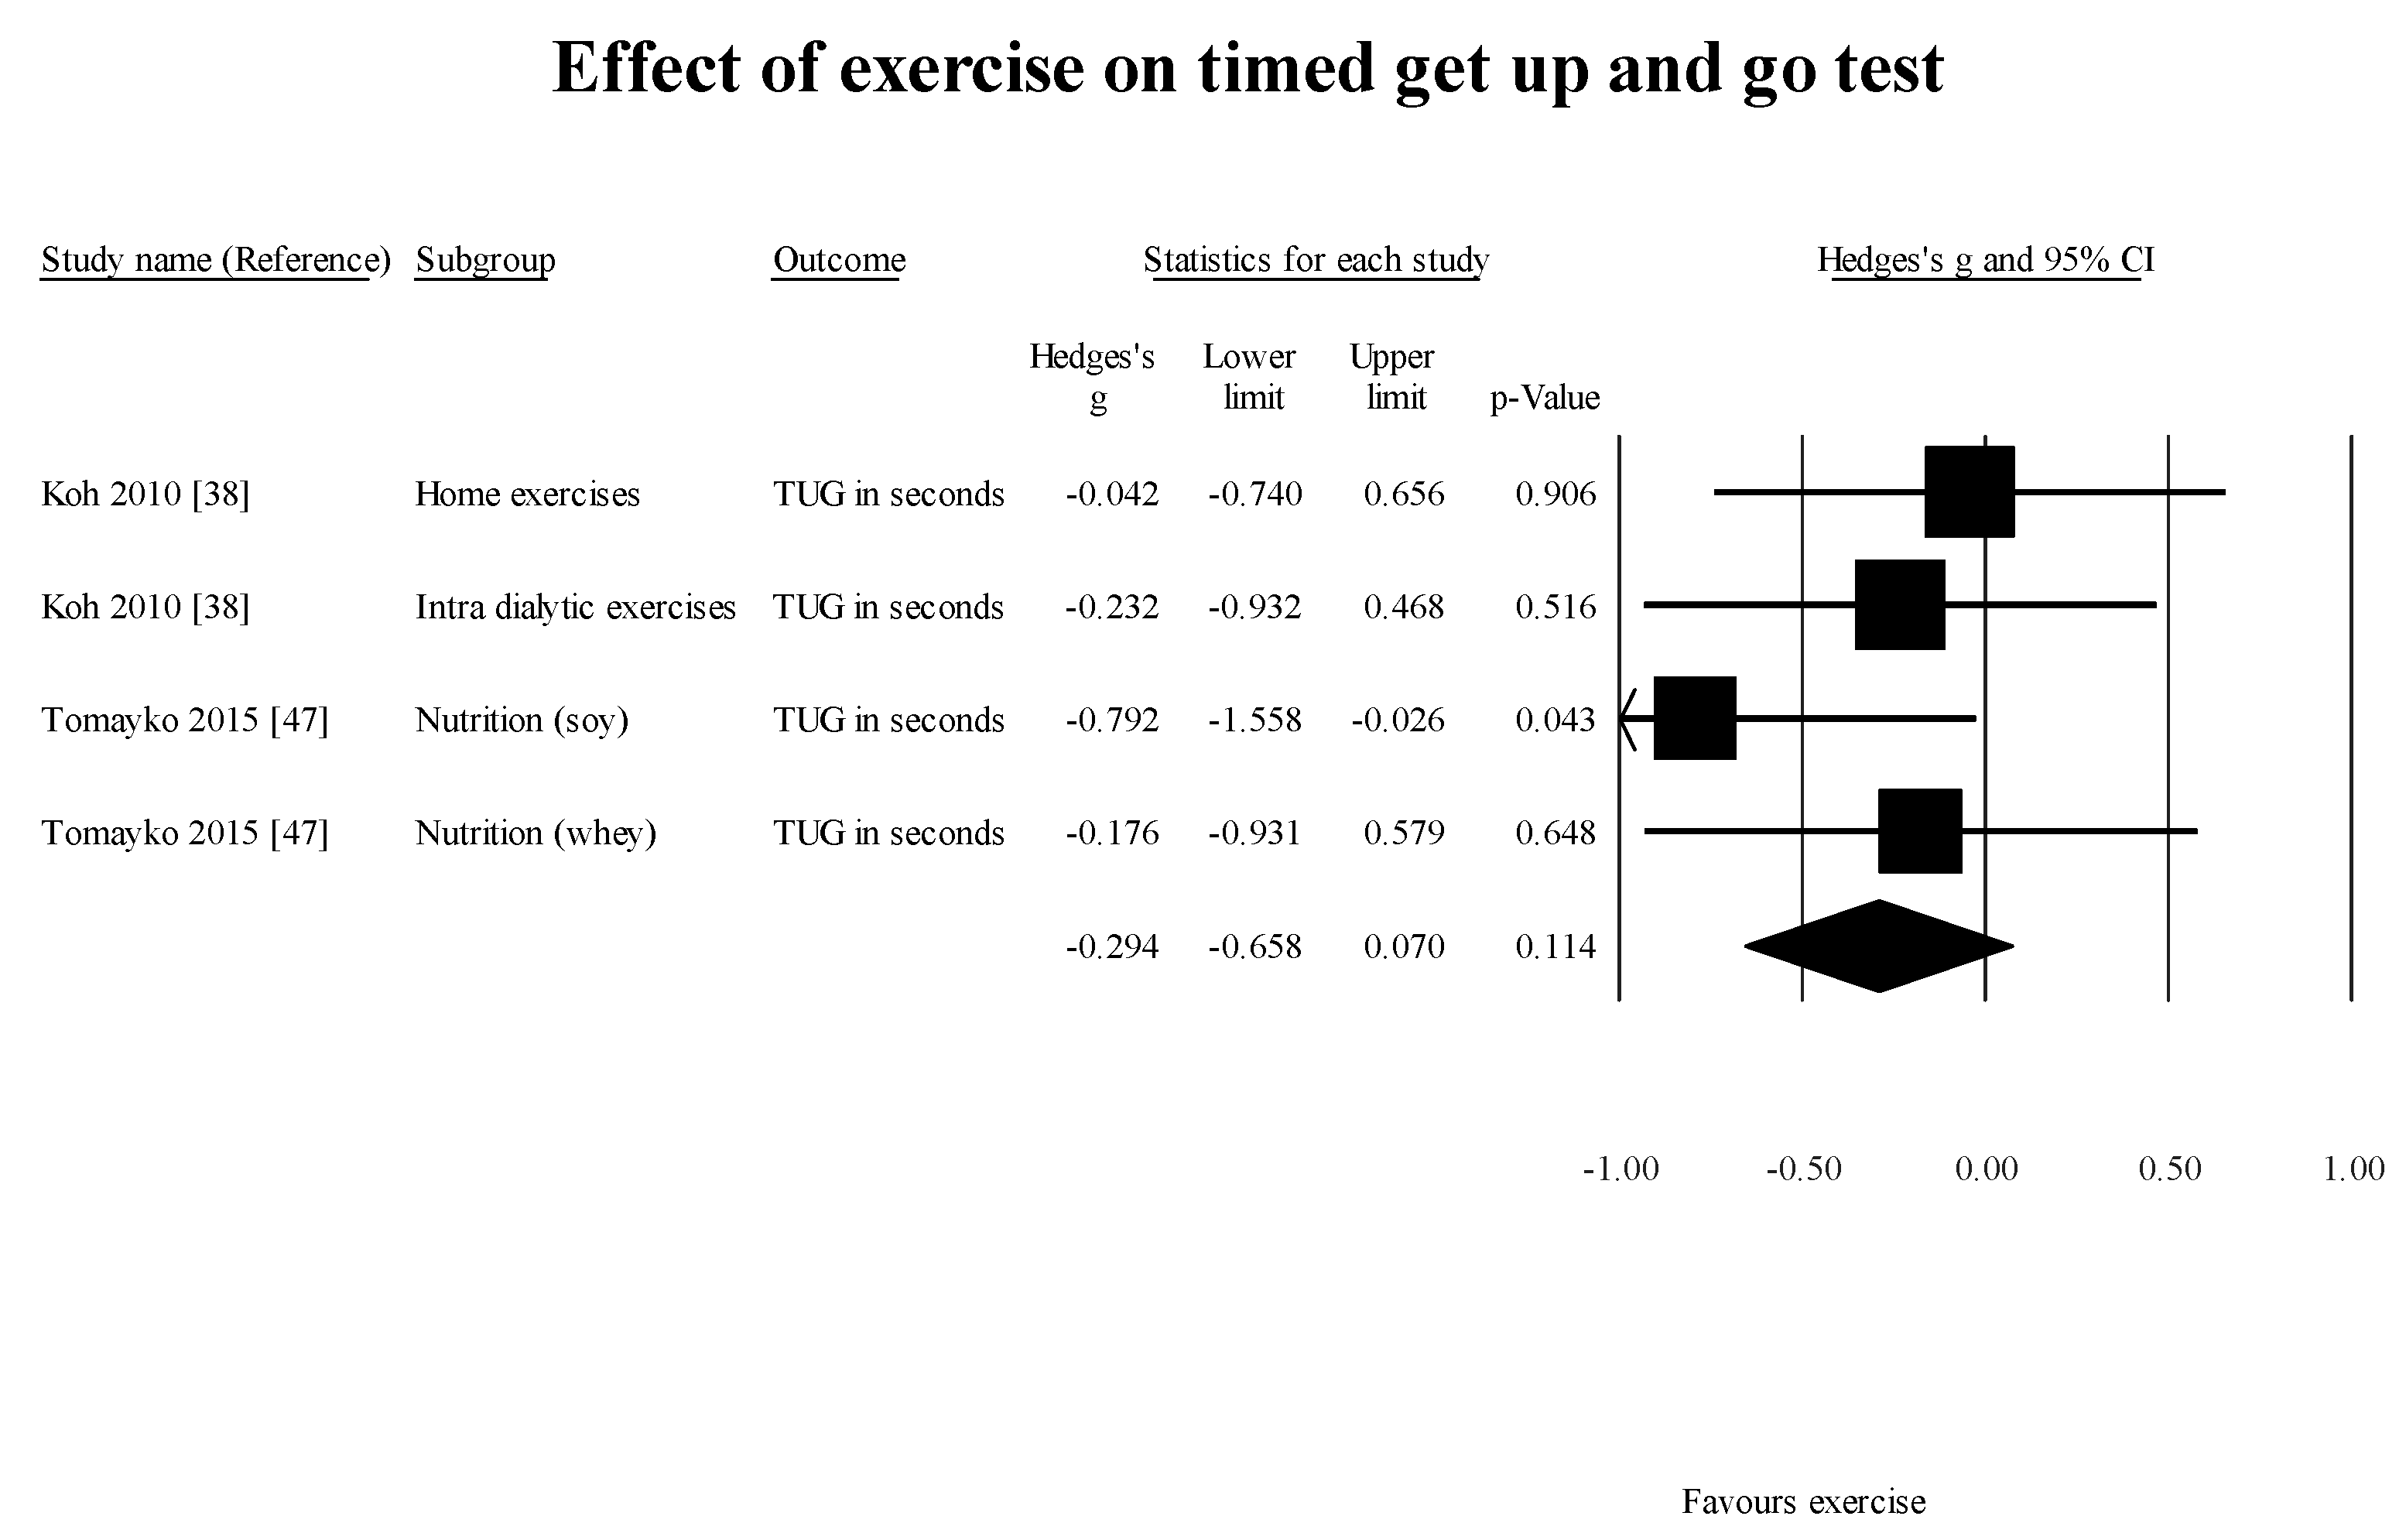
Figure 6.
Effect of exercises on six minute walk test. 6MWT: six minute walk test; HD: hemodialysis; m: meter.
Figure 6.
Effect of exercises on six minute walk test. 6MWT: six minute walk test; HD: hemodialysis; m: meter.

Table 1.
Characteristics of the studies included.
| Study Name | Subgroup within Study | Outcome | Mean (Standard Deviation) | Sample Size (N) | Age of Participants in Years | Dialysis Vintage in Months (Mean (Standard Deviation) or Range) |
|---|---|---|---|---|---|---|
| Abe 2016 [22] | Participants on HD | Fast walking (m/s) | 1.52 (0.34) | 122 | 68.0 (9) | 103.2 (103.2) |
| Blake 2004 [23] | Participants on HD | Normal walking (m/s) | 1.31 (0.12) | 12 | 42 (8.5) | Median 11.5 (4.25) |
| Fast walking (m/s) | 1.74 (0.18) | 12 | ||||
| Bulckaen 2011 [24] | Participants on HD (AWG group) | Treadmill walk Test | 242 (208) | 9 | 60 (9) | 25.8 |
| 6MWT (m) | 436 (139) | 9 | ||||
| Steps per day | 2908 (1622) | 9 | ||||
| Participants on HD (SWG group) | Treadmill walk Test | 248 (197) | 18 | 51 (12) | ||
| 6MWT (m) | 439 (124) | 18 | ||||
| Steps per day | 5000 (2904) | 18 | ||||
| Chang 2016 [25] | Participants on HD (intervention group) | 6MWT (m) | 389.9 (36.1) | 21 | 54.2 15.2) | 2.0 (1.3) |
| Gait speed (m/s) | 98.9 (23.9) | 21 | ||||
| Participants on HD (control group) | 6MWT (m) | 387.2 (63.9) | 25 | 54.6 12.7) | 1.6 (0.9) | |
| Gait speed (m/s) | 102.2 (17.6) | 25 | ||||
| Cheema 2007 [26] | Participants on HD (PRT group) | 6MWT | 496.6 (133.2) | 24 | 60.0(15.3) | 39.6 Mean Range (3.6–200.4) |
| Participants on HD (Control group) | 6MWT | 406.4 (122.8) | 25 | |||
| Cheema 2010 [27] | Participants on HD | 6MWT (m) | 450.6 (134.7) | 49 | 62.5 (14.2) | 26.4 (16.7) |
| Normal walking (m/s) | 1.0 (0.28) | 49 | ||||
| Golebiowski 2012 [28] | Participants on HD | 6MWT (m) | 0.99(1.3) | 29 | 64.2 (13.1) | 4–192 Range |
| Headley 2002 [29] | Participants on HD | 6MWT (m) | 522.1 (46.2) | 10 | 42.8 (4.4) | 41.6 (19) |
| Fast walking (m/s) | 1.83 (0.13) | 10 | ||||
| Normal walking (m/s) | 1.21 (0.61) | 10 | ||||
| Henrique 2010 [30] | Participants on HD | 6MWT (m) | 509 (91.9) | 14 | 47.6 (12.7) | 93.7 (43.9) |
| Hotta 2015 [31] | Participants on HD with sarcopenia | Gait speed (m/s) | 1.4 (0.1) | 14 | 70.5 (2.2 | 53.3 (5.5) |
| Participants on HD without sarcopenia | Gait speed (m/s) | 2.0 (0.1) | 19 | 65.5 (2.4) | 50.1 (8.8) | |
| Jeong 2015 [32] | Patients with LVDD | Gait speed (m/s) | 0.7 (0.2) | 40 | 54.5 (11.1) | 42.9 (37.9) |
| ISWT (seconds) | 188 (102.1) | 40 | ||||
| Patients without LVDD | Gait speed (m/s) | 0.9 (0.3) | 42 | |||
| ISWT (seconds) | 261.4 (117.7) | 42 | ||||
| Jin 2017 [33] | Participants on HD with T2DM | Gait speed (m/s) | 0.87 (0.21) | 35 | 63.89 (9.57) | 54.26 (49.61) |
| Participants on HD without T2DM | Gait speed (m/s) | 1.0 (0.23) | 25 | 56.4 (14.67) | 81.64 (70.12) | |
| Johansen 2001 [34] | Participants on HD | Gait speed (m/s) | 1.13 (0.34) | 46 | 52 (17) | 27.6 (27.5) |
| Johansen 2001 [35] | Participants on HD | Gait Speed (m/s) | 1.15 (0.34) | 39 | 52 (16) | 28.8 (28.8) |
| Johansen 2003 [5] | Participants on HD | Gait speed (m/s) | 1.0 (0.33) | 38 | 55 (15) | 34.8 (32.7) |
| Johansen 2015 [36] | Participants on HD | Gait speed (m/s) | 0.93 (0.68) | 68 | 69 (14) | 44.4 Mean Range (19.2–75.6) |
| Johansen 2014 [37] | Participants on HD (Non-frail group) | Normal walking speed m/s | 1.0 (0.2) | 321 | 53.8 (14.4) | 44.4 Mean Range (19.2–75.6) |
| Koh 2010 [38] | HD participants on home exercises | 6MWT (m) | 444 (127) | 14 | 52.1 (13.6) | 37.0 (31.1) |
| TUG in seconds | 5.7 (2.0) | 14 | ||||
| HD participants on intradialytic exercise | 6MWT (m) | 463 (127) | 14 | 52.3 (10.9) | 32.1 (26.7) | |
| TUG in seconds | 5.8 (1.5) | 14 | ||||
| HD participants receiving usual care | 6MWT (m) | 431 (160) | 16 | 51.3 (14.4) | 25.8 (22.2) | |
| TUG in seconds | 6.3 (2.5) | 16 | ||||
| Kutsuna 2010 [39] | Participants on HD | Fast walking (m/s) | 1.52 (0.42) | 153 | 64 (11) | 93.6 (80.4) |
| Normal walking (m/s) | 1.13 (0.28) | 153 | ||||
| Lane 2013 [40] | Participants on HD | SWT (in seconds) | 251 (120) | 42 | 44(5) | 51 (42) |
| Malagoni 2008 [41] | Participants on HD (control group) | 6MWT (m) | 275 (69) | 7 | 66 (14) | 90 (73) |
| Participants on HD (experimental group) | 6MWT (m) | 308 (105) | 13 | 62 (10) | 78 (50) | |
| Manfredini 2007 [42] | Participants on HD | 6MWT (m) | 283 (122) | 16 | 65.1 (11.4) | 82 (77) |
| Max. treadmill speed m/s | 0.92 (0.31) | 16 | ||||
| Mercer 2002 [43] | Participants on HD + PD (experimental group) | 50 m walk test | 146 (38.1) | 7 | 63..0 (14.5) | 30 (18) |
| Participants on HD + PD (control group) | 50 m walk test | 139.1 (21.3) | 9 | 59 (12.3) | 45.6 (33.6) | |
| Painter 2000 [44] | Participants on HD | 6MWT (m) | 347.10 (127.10) | 44 | 55.9 (15.15) | 33.7 (35.6) |
| Fast walking (m/s) | 1.30 (0.40) | 131 | ||||
| Normal walking (m/s) | 0.9 (0.26) | 131 | ||||
| Shin 2013 [45] | Participants on HD | Normal walking (m/s) | 1.0 (0.247) | 14 | 50.0 (11.8) | 51.6 (35.5) |
| Cadence (steps/min) | 100.1 (12.6) | 14 | ||||
| Step length (cm) | 59.7 (12.7) | 14 | ||||
| Step width (cm) | 62.05 (11.7) | 14 | ||||
| Double support (%GC) | 34.5 (6.8) | 14 | ||||
| Swing phase (%GC) | 32.9 (3.5) | 14 | ||||
| Tao 2015 [46] | Participants on HD (experimental group) | Fast walking (m/s) | 1.17 (0.27) | 56 | 53.02 (11.62) | 83.46 (63.7) |
| Normal walking (m/s) | 1.21(0.25) | 57 | ||||
| Participants on HD (Control group) | Fast walking (m/s) | 1.6 (0.4) | 56 | 56.68 (9.67) | 84.7 (70.55) | |
| Normal walking (m/s) | 1.17 (0.27) | 56 | ||||
| Tomayko 2015 [47] | Participants on HD receiving Nutrition (Whey) group | Gait speed (m/s) | 0.84 (0.27) | 11 | 57 (4.8) | Not reported |
| Shuttle walk test | 216 (36) | |||||
| TUG in seconds | 7.3 (1.0) | |||||
| Participants on HD (Control group) | Gait speed (m/s) | 0.86 (0.29) | 15 | 53.3 (2.4) | ||
| Shuttle walk test | 222 (34) | |||||
| TUG in seconds | 7.7 (0.9) | |||||
| Participants on HD receiving Nutrition (Soy) group | Shuttle walk Test | 268 (35) | 12 | 52.5 (4.3) | ||
| TUG in seconds | 7.6 (1.1) | |||||
| Gait speed (m/s) | 0.86 (0.23) |
6MWT: 6 min walk test; AWG: advised walking group; cm: centimeters; HD: hemodialysis, m: meters, m/s: meters per second; GC: gait cycle; ISWT: intermittent shuttle walk test; LVDD: left ventricular diastolic dysfunction; m: meters, m/s: meters per second; Max: maximum; PD: peritoneal dialysis; SWG: supervised walking group; SWT: shuttle walk test; T2DM: type II diabetes mellitus; TUG: timed get up and go test.
Table 2.
Effect of hemodialysis on gait speed.
| Study Name | Subgroup within Study | Outcome Measure | Mean | 95% Confidence Interval | |
|---|---|---|---|---|---|
| Lower Limit | Upper Limit | ||||
| Blake 2004 [23] | Participants on HD | Normal walking (m/s) | 1.31 | 1.24 | 1.38 |
| Chang 2016 [25] | Participants on HD (intervention group) | Gait Speed (m/s) | 1.02 | 0.95 | 1.09 |
| Participants on HD (control group) | Gait Speed (m/s) | 0.99 | 0.89 | 1.09 | |
| Cheema 2010 [27] | Participants on HD | Normal walking (m/s) | 1.00 | 0.92 | 1.08 |
| Headley 2002 [29] | Participants on HD | Normal walking (m/s) | 1.21 | 0.83 | 1.59 |
| Jeong 2015 [32] | Patients with LVDD | Gait Speed (m/s) | 0.70 | 0.64 | 0.76 |
| Patients without LVDD | Gait Speed (m/s) | 0.90 | 0.81 | 0.99 | |
| Jin 2017 [33] | Participants on HD with T2DM | Gait Speed (m/s) | 0.87 | 0.80 | 0.94 |
| Participants on HD without T2DM | Gait Speed (m/s) | 1.00 | 0.91 | 1.09 | |
| Johansen 2001 [34] | Participants on HD | Gait Speed (m/s) | 1.13 | 1.03 | 1.23 |
| Johansen 2001 [35] | Participants on HD | Gait Speed (m/s) | 1.15 | 1.04 | 1.26 |
| Johansen 2003 [5] | Participants on HD | Gait Speed (m/s) | 1.00 | 0.90 | 1.11 |
| Johansen 2015 [36] | Participants on HD | Gait Speed (m/s) | 0.93 | 0.77 | 1.09 |
| Johansen 2014 [37] | Participants on HD (Non-frail group) | Normal walking (m/s) | 1.00 | 0.98 | 1.02 |
| Kutsuna 2010 [39] | Participants on HD | Normal walking (m/s) | 1.13 | 1.09 | 1.17 |
| Painter 2000 [44] | Participants on HD | Normal walking (m/s) | 0.90 | 0.86 | 0.94 |
| Shin 2013 [45] | Participants on HD | Normal walking (m/s) | 1.00 | 0.87 | 1.13 |
| Tao 2015 [46] | Participants on HD (Control group) | Normal walking (m/s) | 1.17 | 1.10 | 1.24 |
| Participants on HD (experimental group) | Normal walking (m/s) | 1.21 | 1.15 | 1.27 | |
| Tomayko 2015 [47] | Participants on HD receiving Nutrition (Whey) group | Gait Speed (m/s) | 0.84 | 0.68 | 1.00 |
| Participants on HD (Control group) | Gait Speed (m/s) | 0.86 | 0.71 | 1.01 | |
| Participants on HD receiving Nutrition (Soy) group | Gait Speed (m/s) | 0.86 | 0.73 | 0.99 | |
| 1.01 | 0.95 | 1.07 | |||
HD: hemodialysis, m: meters, m/s: meters per second; LVDD: left ventricular diastolic dysfunction; m/s: meters per second; T2DM: type II diabetes mellitus.
Table 3.
Effect of hemodialysis on fast walking speed.
| Study Name | Subgroup within Study | Outcome | Statistics for Each Study | 95% Confidence Interval | |
|---|---|---|---|---|---|
| Mean | Lower Limit | Upper Limit | |||
| Abe 2016 [22] | Participants on HD | Fast walking (m/s) | 1.52 | 1.46 | 1.58 |
| Blake 2004 [23] | Participants on HD | Fast walking (m/s) | 1.74 | 1.64 | 1.84 |
| Headley 2002 [29] | Participants on HD (HEP) | Fast walking (m/s) | 1.83 | 1.75 | 1.91 |
| Kutsuna 2010 [39] | Participants on HD | Fast walking (m/s) | 1.52 | 1.45 | 1.59 |
| Manfredini 2007 [42] | Participants on HD | Max. Treadmill Speed (m/s) | 0.92 | 0.77 | 1.07 |
| Painter 2000 [44] | Participants on HD | Fast walking (m/s) | 1.30 | 1.23 | 1.37 |
| Tao 2015 [46] | Participants on HD (control group) | Fast walking (m/s) | 1.60 | 1.50 | 1.70 |
| Participants on HD (experimental group) | Fast walking (m/s) | 1.17 | 1.10 | 1.24 | |
| Random effects | 1.45 | 1.28 | 1.62 | ||
HD: hemodialysis; HEP: home exercise program; Max: maximum; m/s: meters per second.
Table 4.
Effect of hemodialysis on timed get up and go test.
| Study Name | Subgroup within Study | Statistics for Each Study | 95% Confidence Limit | |
|---|---|---|---|---|
| Mean (Seconds) | Lower Limit | Upper Limit | ||
| Koh 2010 [38] | Participants on HD (home exercises | 5.70 | 4.65 | 6.75 |
| Participants on HD (intradialytic exercises) | 5.80 | 5.01 | 6.59 | |
| Participants on HD (usual care) | 6.30 | 5.08 | 7.52 | |
| Tomayko 2015 [47] | Participants on HD (nutrition (Whey) group) | 7.30 | 6.71 | 7.89 |
| Participants on HD (control group) | 7.70 | 7.24 | 8.16 | |
| Participants on HD (nutrition (Soy) group) | 7.60 | 6.98 | 8.22 | |
| Random effects | 6.82 | 6.13 | 7.52 | |
HD: hemodialysis.
Table 5.
Effect of hemodialysis on six minute walk test.
| Study name | Subgroup within Study | Statistics for Each Study | 95% Confidence Limits | |
|---|---|---|---|---|
| Mean | Lower Limit | Upper Limit | ||
| Bulckaen 2011 [24] | Participants on HD AWG | 436.00 | 345.19 | 526.81 |
| Participants on HD SWG | 439.00 | 381.72 | 496.28 | |
| Chang 2016 [25] | Participants on HD (control group) | 387.20 | 362.15 | 412.25 |
| Participants on HD (intervention group) | 389.90 | 374.46 | 405.34 | |
| Cheema 2007 [26] | Participants on HD (control group) | 406.42 | 358.25 | 454.59 |
| Participants on HD (experimental group) | 496.61 | 443.29 | 549.93 | |
| Cheema 2010 [27] | Participants on HD (experimental group) | 450.60 | 412.88 | 488.32 |
| Headley 2002 [29] | Participants on HD | 522.10 | 493.47 | 550.73 |
| Henrique 2010 [30] | Participants on HD | 509.00 | 460.86 | 557.14 |
| Koh 2010 [38] | Participants on HD (home exercises) | 444.00 | 377.47 | 510.53 |
| Participants on HD (intradialytic exercises) | 463.00 | 396.47 | 529.53 | |
| Participants on HD (usual care) | 431.00 | 352.60 | 509.40 | |
| Malagoni 2008 [41] | Participants on HD (control group) | 275.00 | 223.89 | 326.11 |
| Participants on HD (experimental group) | 308.00 | 250.92 | 365.08 | |
| Manfredini 2007 [42] | Participants on HD | 283.00 | 223.22 | 342.78 |
| Painter 2000 [44] | Participants on HD | 347.10 | 309.55 | 384.65 |
| Random effects | 411.56 | 377.02 | 446.10 | |
AWG: advised walking group; HD: hemodialysis; SWG: supervised walking group.
Table 6.
Effect of hemodialysis on walking time.
| Study Name | Subgroup within Study | Outcome | Statistics for Each Study | 95% Confidence Interval | |
|---|---|---|---|---|---|
| Mean Time in Seconds | Lower Limit | Upper Limit | |||
| Bulckaen 2011 [24] | Participants on HD (AWG) | Treadmill walk test | 242.00 | 106.11 | 377.89 |
| Participants on HD (SWG) | Treadmill walk test | 248.00 | 156.99 | 339.01 | |
| Jeong 2015 [32] | Patients with LVDD | ISWT (seconds) | 188.00 | 156.36 | 219.64 |
| Patients without LVDD | ISWT (seconds) | 261.40 | 225.80 | 297.00 | |
| Lane 2013 [40] | Participants on HD | SWT (in seconds) | 25.10 | 21.47 | 28.73 |
| Mercer 2002 [43] | Participants on HD + PD (control group) | 50 m walk test | 139.10 | 125.18 | 153.02 |
| Participants on HD + PD (experimental group) | 50 m walk test | 146.00 | 117.78 | 174.22 | |
| Tomayko 2015 [47] | Participants on HD Nutrition (Whey) group | Shuttle walk test | 216.00 | 194.73 | 237.27 |
| Participants on HD control group | Shuttle walk test | 222.00 | 204.79 | 239.21 | |
| Participants on HD Nutrition (Soy) group | Shuttle walk test | 268.00 | 248.20 | 287.80 | |
| Random | 193.55 | 116.36 | 270.73 | ||
AWG: advised walking group; HD: hemodialysis; ISWT: intermittent shuttle walk test; LVDD: left ventricular diastolic dysfunction; PD: peritoneal dialysis. SWG: supervised walking group.
Table 7.
Results of comparison of gait speed between participants on hemodialysis and age-matched participants with no kidney disease.
Table 7.
Results of comparison of gait speed between participants on hemodialysis and age-matched participants with no kidney disease.
| Study Name | Outcome | Statistics for Each Study | 95% Confidence Limit | p-Value | |
|---|---|---|---|---|---|
| Hedges’s g | Lower Limit | Upper Limit | |||
| Blake 2004 [23] | Normal walking (m/s) | 1.58 | 0.69 | 2.47 | 0.00 |
| Johansen 2003 [5] | Gait Speed (m/s) | 1.45 | 0.85 | 2.06 | 0.00 |
| Johansen 2001 [34] | Gait Speed (m/s) | 0.62 | 0.02 | 1.22 | 0.04 |
| Shin 2013 [45] | Normal walking (m/s) | 1.60 | 0.77 | 2.44 | 0.00 |
| Random effects | 1.26 | 0.76 | 1.76 | 0.00 | |
Table 8.
Gait parameters using GAITRite Mat.
| Study Name | Outcome | Hedges’s g | Std Err |
|---|---|---|---|
| Shin 2013 [45] | Cadence (steps/minute) | 1.03 | 0.39 |
| Double Support (%GC) | −1.03 | 0.39 | |
| Step length (cm) | 1.21 | 0.40 | |
| Step width (cm) | 1.18 | 0.40 | |
| Swing Phase (%GC) | 0.98 | 0.39 |
cm: centimeters; GC: gait cycle.
© 2017 by the authors. Licensee MDPI, Basel, Switzerland. This article is an open access article distributed under the terms and conditions of the Creative Commons Attribution (CC BY) license (http://creativecommons.org/licenses/by/4.0/).
Share and Cite
MDPI and ACS Style
Sawant, A.; Overend, T. The Impact of Hemodialysis on Spatio-Temporal Characteristics of Gait and Role of Exercise: A Systematic Review. Healthcare 2017, 5, 92. https://doi.org/10.3390/healthcare5040092
AMA Style
Sawant A, Overend T. The Impact of Hemodialysis on Spatio-Temporal Characteristics of Gait and Role of Exercise: A Systematic Review. Healthcare. 2017; 5(4):92. https://doi.org/10.3390/healthcare5040092
Chicago/Turabian StyleSawant, Anuradha, and Tom Overend. 2017. "The Impact of Hemodialysis on Spatio-Temporal Characteristics of Gait and Role of Exercise: A Systematic Review" Healthcare 5, no. 4: 92. https://doi.org/10.3390/healthcare5040092
Note that from the first issue of 2016, this journal uses article numbers instead of page numbers. See further details here.