Article

Electrochemical Detection with Preconcentration: Nitroenergetic Contaminants

1
Center for Bio/Molecular Science and Engineering, US Naval Research Laboratory, Washington, DC 20375, USA
2
Biomedical Engineering, Lawrence Technical University, Southfield, MI 48075, USA
3
US Naval Academy, Annapolis, MD 21402, USA
4
NOVA Research Incorporated, Alexandria, VA 22308, USA
*
Author to whom correspondence should be addressed.
Formerly at US Naval Research Laboratory. These authors contributed equally to this work.
Chemosensors 2014, 2(2), 131-144; https://doi.org/10.3390/chemosensors2020131
Submission received: 25 November 2013 / Revised: 23 May 2014 / Accepted: 28 May 2014 / Published: 10 June 2014

Abstract

:
This effort evaluated the potential of two prototype devices for enhanced electrochemical detection of 2,4,6-trinitrotoluene (TNT) and dinitrotoluene (DNT) following preconcentration using an organosilicate sorbent. The bench-scale prototype provides adsorption of the targets from aqueous solution followed by elution in a mixture of methanol and potassium chloride (KCl). Following elution, the eluant is diluted using an aqueous KCl solution to provide sufficient electrolyte for electrochemical analysis. Concentrations of methanol greater than 50% were detrimental to sensor performance and lifetime. Calibration of the electrochemical sensor was completed and results of electrochemical analysis were compared to those of HPLC analysis over a range of concentrations and in varied matrices. TNT detection was found to be consistent and detection limits were improved from 200 ppb to 3 ppb depending on the sample volume utilized. DNT detection showed higher variability and significantly greater false response rates. On the basis of these results, a second, more advanced, prototype was developed and utilized in limited field trials with the intention of moving the technology toward in situ applications.

1. Introduction

US Department of Defense (DoD) activities have resulted in contamination of the soil and water at a number of military installations. Ordnance manufacture, storage, and disposal as well as training activities have contributed to the presence of nitroenergetic contaminants at these sites. Congressional mandate requires compliance of the DoD with applicable environmental laws and regulations necessitating monitoring and remediation of a number of contaminated areas. These efforts are costly in both the short and long term making more effective and efficient analytical methods of particular interest to the community. Traditionally, monitoring of contaminated sites is accomplished through collection of samples that are subsequently returned to a laboratory for analysis. This requires careful handling of the sample to insure against erroneous results due to contamination or sample loss. Filtering, cooling, and acidification of samples can produce artifacts in the subsequent analysis. These handling considerations are in addition to the logistical considerations and costs associated with sampling and shipping of materials [1,2].
Methods developed specifically for field analysis typically rely on preconcentration of targets prior to analysis. As an example, the procedure outlined by the US Environmental Protection Agency for colorimetric detection of TNT and RDX relies on adsorption of target from two liters of sample solution onto membranes bearing poly(styrenedivinylbenzne) octadecyl particles [3,4]. Even given this limitation, in situ monitoring offers several advantages over traditional collect and ship methods. Sampling frequencies are not limited to monthly or quarterly collections. In fact, sampling frequency is limited only by the needs of the application and the time required for the measurements to occur. This allows for determination of the dynamics of a system and provides the potential for adjustments in response to changing parameters. Sample handling considerations of importance to traditional methods also become irrelevant for in situ systems. Portable methods for detection of nitroenergetic contaminants, unfortunately, often lack robustness, quantitative capabilities, or sensitivities necessary for field applications or are not amenable to automation [5,6,7,8]. Emerging approaches focused on optical based detection may address these shortfalls [9,10,11], but, currently, electrochemical sensors offer the benefits of small size, low power requirements, and low cost to a portable or fielded application. Electrochemical sensing also offers the potential for rapid sensing in a small footprint and the option for automation.
The application of electrochemical methods to the detection of nitroenergetics, such as 2,4,6-trinitrotoluene (TNT), has been described by several groups [2,12,13,14,15,16,17,18]. The focus of our effort has been on developing materials for target preconcentration prior to electrochemical detection in order to enhance target concentrations and eliminate interferents with a view to improving the performance of existing electrochemical sensors. Our previous publications detail the need for solid-phase extraction (SPE), development of the class of organosilicate sorbents and discussion of their place in the range of SPE materials available [19,20], as well as characterization of morphology and performance for several material variants [20,21,22,23]. These reports involved the development the of organosilicate sorbent utilized here providing semi-selective binding of nitroenergetic targets from a range of matrices [19,22], comparison of the material to commercially available sorbents designed for SPE of nitroenergetics [23], and, finally, description of the selection of system components allowing for integration of the sorbents [21]. The study reported here presents the results of characterization for an initial prototype preconcentration system utilized in-line with commercially available components for electrochemical detection. Calibration of the electrochemical sensor was completed, and the results of analysis by the full system were compared to those of HPLC analysis. In addition, results from limited field trials utilizing a more advanced prototype system are presented.

2. Experimental Section

2.1. Reagents

Solutions of 2,4,6-trinitrotoluene (TNT), 2,4-dinitrotoluene (DNT), 1,3,5-trinitro-1,3,5-triazacyclohexane (RDX), HMX, and nitroglycerine (NG) were prepared by dilution of 1 mg/mL reference standards in acetonitrile obtained from Cerilliant (Round Rock, TX). Bis(trimethoxysilylethyl)benzene (DEB) and 1,2-bis(trimethoxysilyl)ethane (BTE) were obtained from Gelest, Inc. (Tullytown, PA, USA). 3,5-Dinitrobenzoyl chloride ≥98%, dichloromethane (≥99.5%), and magnesium turnings (98%) were purchased from Sigma-Aldrich (St. Louis, MO, USA). Pluronic P123 (referred to here as P123) was a gift from BASF (Mount Olive, NJ, USA). Water was deionized to 18.2 MΩ cm using a Millipore Milli Q UV-Plus water purification system. Ground water was collected from an untreated well (213 m depth) previously used to service a household in Fulton, MD, USA.
Synthesis of the hierarchical organosilicate material applied as a solid-phase extraction sorbent and the performance characteristics of that material have been reported previously [12,21,22,23]. Synthetic and morphological details are included in the Supporting Information. Columns (100 mg) of the sorbent materials were prepared in Omnifit borosilicate column housings (10 × 50 mm, Diba Industries, Mahopak, NY, USA).

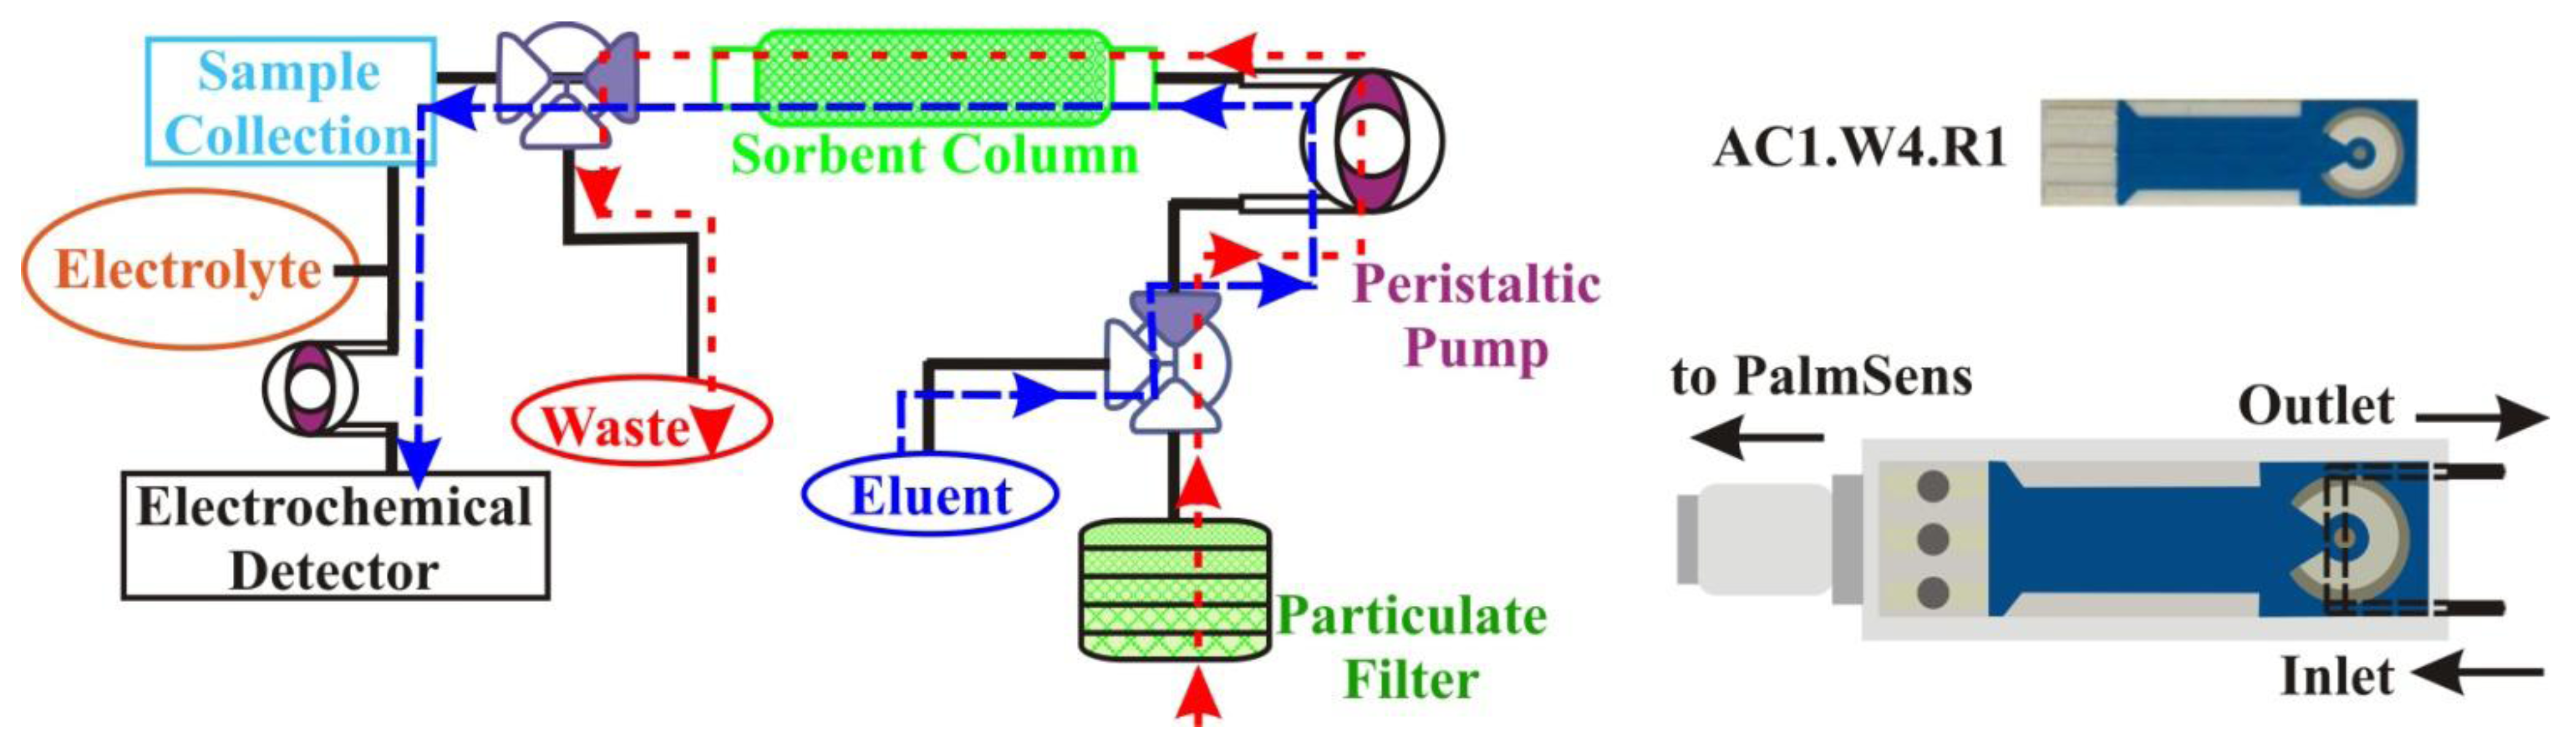
2.2. Prototype Sampling/Analysis Systems

Figure 1 presents a schematic of the system concept using the sorbents to preconcentrate targets from aqueous solution prior to detection by an electrochemical detector (photograph provided in Supporting Information, Figure S3). Samples are pulled through the filter to eliminate particulate on the basis of size exclusion. The first peristaltic pump is employed both for pulling the sample through the filters and for pushing it through the sorbent column. The use of a peristaltic pump prevents contact of the liquids with the pump machinery minimizing issues related to corrosion and clogging. Flow control and reagent selection is controlled by a three-way solenoid valve. When the pre-column valve is switched, eluent is pushed through the column by the pump. In the initial prototype system, a P625/66.143 pump with a 66:1 motor and 3.63 mm rollers (Instech Laboratories, Plymouth Meeting, PA, USA) was used. Silicone tubing (1.57 mm) provided flow rates up to 0.8 mL/min through the sorbent column using a 9 V battery or 9 V AC/DC converter to supply power. The operation voltage for the solenoid valves (5 V, Lee Products, Westbrook, CT, USA) was controlled using on/off switches. Desorbed targets were mixed with an electrolyte solution outside of the column, and a second peristaltic pump is used to direct the resulting solution to the electrochemical detector. This second pump utilized a 900:1 gear ratio and 3.63 mm rollers (P625/900.143, Instech Laboratories, Plymouth Meeting, PA, USA). The pump was combined with 0.38 mm silicone tubing to provide flow rates up to 0.08 mL/min using also using a 9 V power source. Sorbent columns were (100 mg, ±2 mg) were packed in 10 × 50 mm borosilicate glass column assemblies (Omnifit; Danbury, CT, USA) using 25 μm frits.
Figure 1. System Components. In this schematic of the prototype system, the red line indicates the flow of the sample solution through the system, and the blue line indicates the flow of eluent through the system [21]. Also shown are the EC sensor employed (AC1.W4.R1) and a schematic of the flow cell.
Chemosensors 02 00131 g001
The second prototype system was designed by SubChem Systems, Inc. (Narragansett, RI, USA) to operate with a 100 mg column of the sorbent material in an Omnifit column housing providing 0.05 MPa back pressure at a flow rate of 1 mL/min. The single-channel portable device included a weather proof case, miniature electro-fluidic components (pumps, valves, and connections) and related controller, and reagent and waste reservoirs (photos in Supporting Information, Figure S4). The components of this prototype were selected on the basis of independent evaluations conducted by SubChem and varied significantly from those used in the bench scale prototype (Experimental). The system function was designed to replicate that of the experiments described above. Sample solution (the software provides the potential for variable volume between 20 and 200 mL) was pushed through the sorbent column. The eluent solution comprising methanol with 0.05 M KCl (2 mL) was then passed through the sorbent bed. The eluent solution was diluted with 0.15 M KCl in water (2 mL) and flowed through the PalmSens flow cell where measurements were collected at five points within a 3 mL volume. The system used a GA series Spur Gear MicroPump with magnetic pump head providing dispensing capabilities with an accuracy of 1.5 µL and flow rates of up to 9 mL/min. A manifold based design was used to minimize fluidic paths and facilitate consistency across multiple devices. Lee Company LFYA 3-way solenoid valves were utilized for controlling the flow of the various solutions. PVC was used for the manifold material. The device utilizes the SubChem Systems firmware package ChemVIEW for instrument control through a sensor printed circuit board.

2.3. Electrochemical Measurements

The desorbed targets were passed through a flow cell (FC2, BVT Technologies, Strážek, Czech Republic) and analyzed using a PalmSens handheld potentiostat (PalmSens, Utrecht, The Netherlands). Sensors were selected from among those specifically designed to work with the PalmSens system (AC1 Series, BVT Technologies, Strážek, Czech Republic). These sensors had graphite working (WE), platinum auxiliary (AUX), and silver/silver chloride reference electrodes (AC1.W4.R1). Comparison between platinum and graphite working electrodes showed that the latter provided better signal-to-noise ratio and higher sensitivity to diminishing target concentrations (data not shown). Also, platinum working electrodes yielded overlap between peaks from rising dissolved oxygen and TNT/DNT reduction [14] making determination of target concentrations difficult. A schematic of the flow cell is provided in Figure 1. The detection chamber had a volume of roughly 25 µL. The volume of desorbed solution was 2 mL to which 2 mL of 0.15 M potassium chloride (electrolyte solution in water) was added (1 mL of the resulting mixture was utilized for HPLC analysis). The electrolyte and associated concentrations were selected on the basis of previous reports [15]. The slower flow rate of the pump combined with the small chamber volume ensured that multiple measurements could be made of each solution for verification of signal reproducibility. Ideally, electrochemical measurements would have been made under constant flow conditions; however, system calibration showed that detection sensitivity was reduced under flow when all other conditions were maintained. The testing scheme, as a result, required flow of the sample through the detection chamber for 10 s, cessation of the flow, and measurement of the EC response. This method replenished the sample volume between replicate analyses and improved detection sensitivity.
Square wave voltammetry (SWV) has been described as the preferred technique in previous studies and was applied here [15]. The potential was swept over a range of values (−0.1 V to −0.9 V) sufficient for detection of reduction peaks for both TNT and DNT, for the studies presented here, −0.62 ± 0.02 and −0.77 ± 0.02, respectively. Other measurement parameters are as follows: 50 mV amplitude, 10 Hz frequency, 5 mV step. The sensors were typically reusable for many EC scans. For the sake of accuracy and to reduce the carryover effects, sensors were replaced after each series of target concentrations. Care was taken to ensure that the flow cell did not contain large air bubbles as their presence had detrimental effects on sensitivity. The data was recorded and analyzed using the PSTrace EC signal acquisition software (PalmSens, Utrecht, The Netherlands). In order to confidently measure target concentrations, SWV scans were first performed with blank samples. These provided the baseline signal that was subtracted from the SWV of target samples. At least five scans were completed for each evaluated sample or standard. The average values are presented here.

2.4. HPLC

Analysis of the various volumes containing nitroenergetic targets was accomplished on a Shimadzu High Performance Liquid Chromatography (HPLC) system with dual-plunger parallel flow solvent delivery modules (LC-20AD) and an auto-sampler (SIL-20AC) coupled to a photodiode array detector (SPD-M20A). All samples were filtered using 0.2 µM polytetrafluoroethylene (PTFE) syringe filters prior to analysis. A modification of US EPA Method 8330 was employed. The stationary phase was a 250 × 4.6 mm Waters Symmetry C18 (5 μM) analytical column; an isocratic 50:50 methanol:water mobile phase was employed. A 100 μL sample injection was used with a flow rate of 0.9 mL/min. UV/vis detection of targets was accomplished at 254 nm with the exception of nitroglycerin which was detected at 214 nm. This method gives reliable detection at 8 ppb for the targets considered. Eight point target calibration curves were used with all experiments to verify method performance, and stock target concentrations were measured as a reference for each experiment. The variation in the calibration curves was ±5%.

3. Results and Discussion
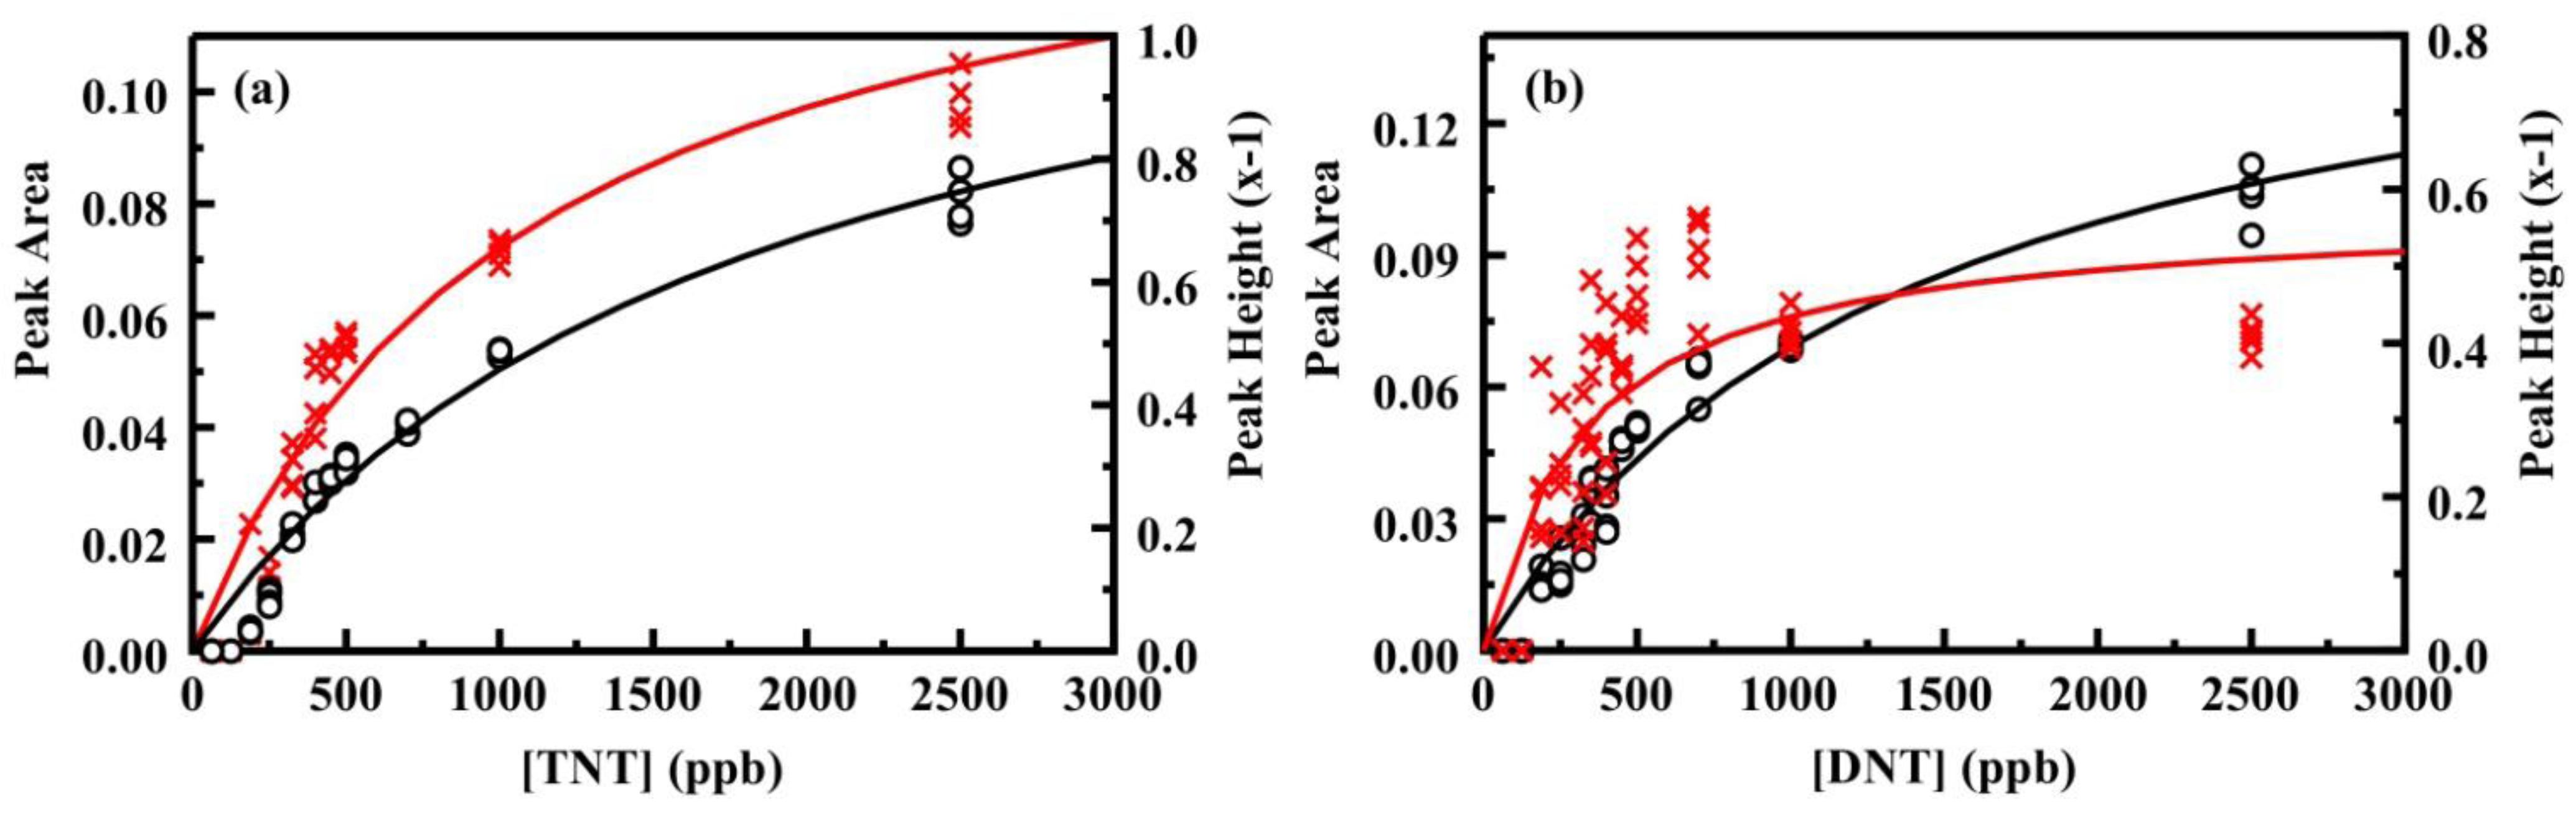
It was first necessary to evaluate the response of the PalmSens electrochemical sensor system to the targets of interest. Overall, TNT, DNT, RDX, HMX, and NG have been of interest to this effort; however, the electrochemical sensors and methods utilized here are applicable only to detection of TNT and DNT. Electrolytes for use in electrochemical detection of TNT and DNT have been described previously [13,15]. Potassium chloride was selected based on the previously published studies, and a concentration of 100 mM was utilized. While other electrolytes were evaluated early in these studies (sodium acetate and phosphate buffers, data not shown) [13], we found that the performance of the sensors when used with potassium chloride was equal to or better than other electrolytes with respect to sensitivity and sensor lifetime. Reduction in concentration of the electrolyte (75 or 50 mM) resulted in a higher level of noise in EC analysis of samples (data not shown). Variations in solvent content were also explored. Adsorption of the targets by the sorbents is intended to provide enhancement in the concentration of the targets and elimination of potential interferents. The addition of water with electrolyte following the concentration step results in dilution of the targets, so a minimal addition is preferred. We found that 75% methanol with 75 mM KCl could be utilized; however, the sensors degraded rapidly (one or two use cycles) and sensitivity was diminished (Supporting Information, Figure S1 and Table S1).

3.1. Calibration

Calibration curves for TNT and DNT were generated based on both peak height and peak area from the voltammograms (Figure 2). Each point in the figure represents the average of at least five SWV scans. Good agreement between peak height and area was obtained for TNT with similar reproducibility and sensitivity. The reliable limit of detection was found to be 200 ppb; at this concentration the signal was greater than three times the standard deviation in the measurements for both the peak height and area. In the case of DNT, peak height and area gave strongly differing results. Noise levels in the peak areas obtained were much higher than those of the peak height. Using a 3:1 signal to noise level as the threshold, the limit of detection based on peak area for DNT was 350 ppb. Peak height, on the other hand, achieved 3:1 signal to noise at only 250 ppb. In addition, when data for DNT peak area at high concentrations was included (1 ppm and greater), the data set was not monotonically increasing. The problem was likely a result of baseline variations noted for EC measurements completed in the presence of solvent. Due to these issues, peak height analysis was utilized for all results presented below. The data sets (Figure 2) were fitted using an equation of the form:
Chemosensors 02 00131 i001
describing the dependence of the peak height on target concentration. For TNT, a = 1.4 × 10⁻⁴ and b = 9.4 × 10⁻⁴; for DNT, a = 6.8 × 10⁻⁴ and b = 7.2 × 10⁻⁴. It should be noted that this expression is not a model of device behavior, but rather a calibration curve over the range of values of interest to this effort.
Figure 2. Calibration of the electrochemical sensor against (a) TNT (−0.62 V ±0.02) and (b) DNT (−0.77 ±0.02) in 100 mM potassium chloride with 50% methanol. The complete data set is provided in the Supporting Information, Tables S2 and S3.
Chemosensors 02 00131 g002
Targets prepared in deionized water (30 mL) at concentrations between 20 and 250 ppb were applied to a 100 mg sorbent column at approximately 0.8 mL/min. Though previous work [23] had utilized 20 mL target volumes, the volume was increase here to accommodate the need for dilution of the sample with electrolyte. Following target capture, the column was then rinsed with 3 mL of water prior to elution of the targets in 2 mL of methanol containing 0.05 M KCl. This eluant was diluted using 0.15 M KCl in water (1:1) to produce a final KCl concentration of 100 mM in 50% methanol. Analysis of the diluted eluent was accomplished using the EC flow cell as described (Experimental Section) and averaging a minimum of five SWV scans. Each target was analyzed using a minimum of three independent cycles of this process. HPLC analysis was used to confirm target concentrations in samples, effluent, rinses, and eluants for all cycles. Target samples with concentrations below 10 ppb were also analyzed. In this case, 300 mL of the target solution was applied to the column; other analysis steps were as described above. The calibration functions (Figure 2; Equation (1)) were applied to calculation of a concentration based on the peak height determined from EC analysis of the samples. Figure 3 compares this calculated value to the results of HPLC analysis. In the case of TNT, if samples at 250 ppb are excluded, the variability between HPLC determined values and EC determined values is 15% on average. If the points at 250 ppb are included this variation increases to 26%. The DNT data set has, on average, a 23% variation from the HPLC determined value.
Figure 3. Preconcentration from Milli-Q water. Points here represent the results for quantification of samples using the prototype system with analysis by HPLC (x-axis) and EC (y-axis): (a) TNT (−0.62 V ±0.02) and (b) DNT (−0.77 ± 0.02). EC results presented use the peak height analysis. The line indicates the expected results based on HPLC analysis of the spiked samples. Error bars indicate the standard deviation in the measurements, completed in triplicate; where not visible they are within the size of the symbol. The complete data set is provided in the Supporting Information, Table S4.
Chemosensors 02 00131 g003

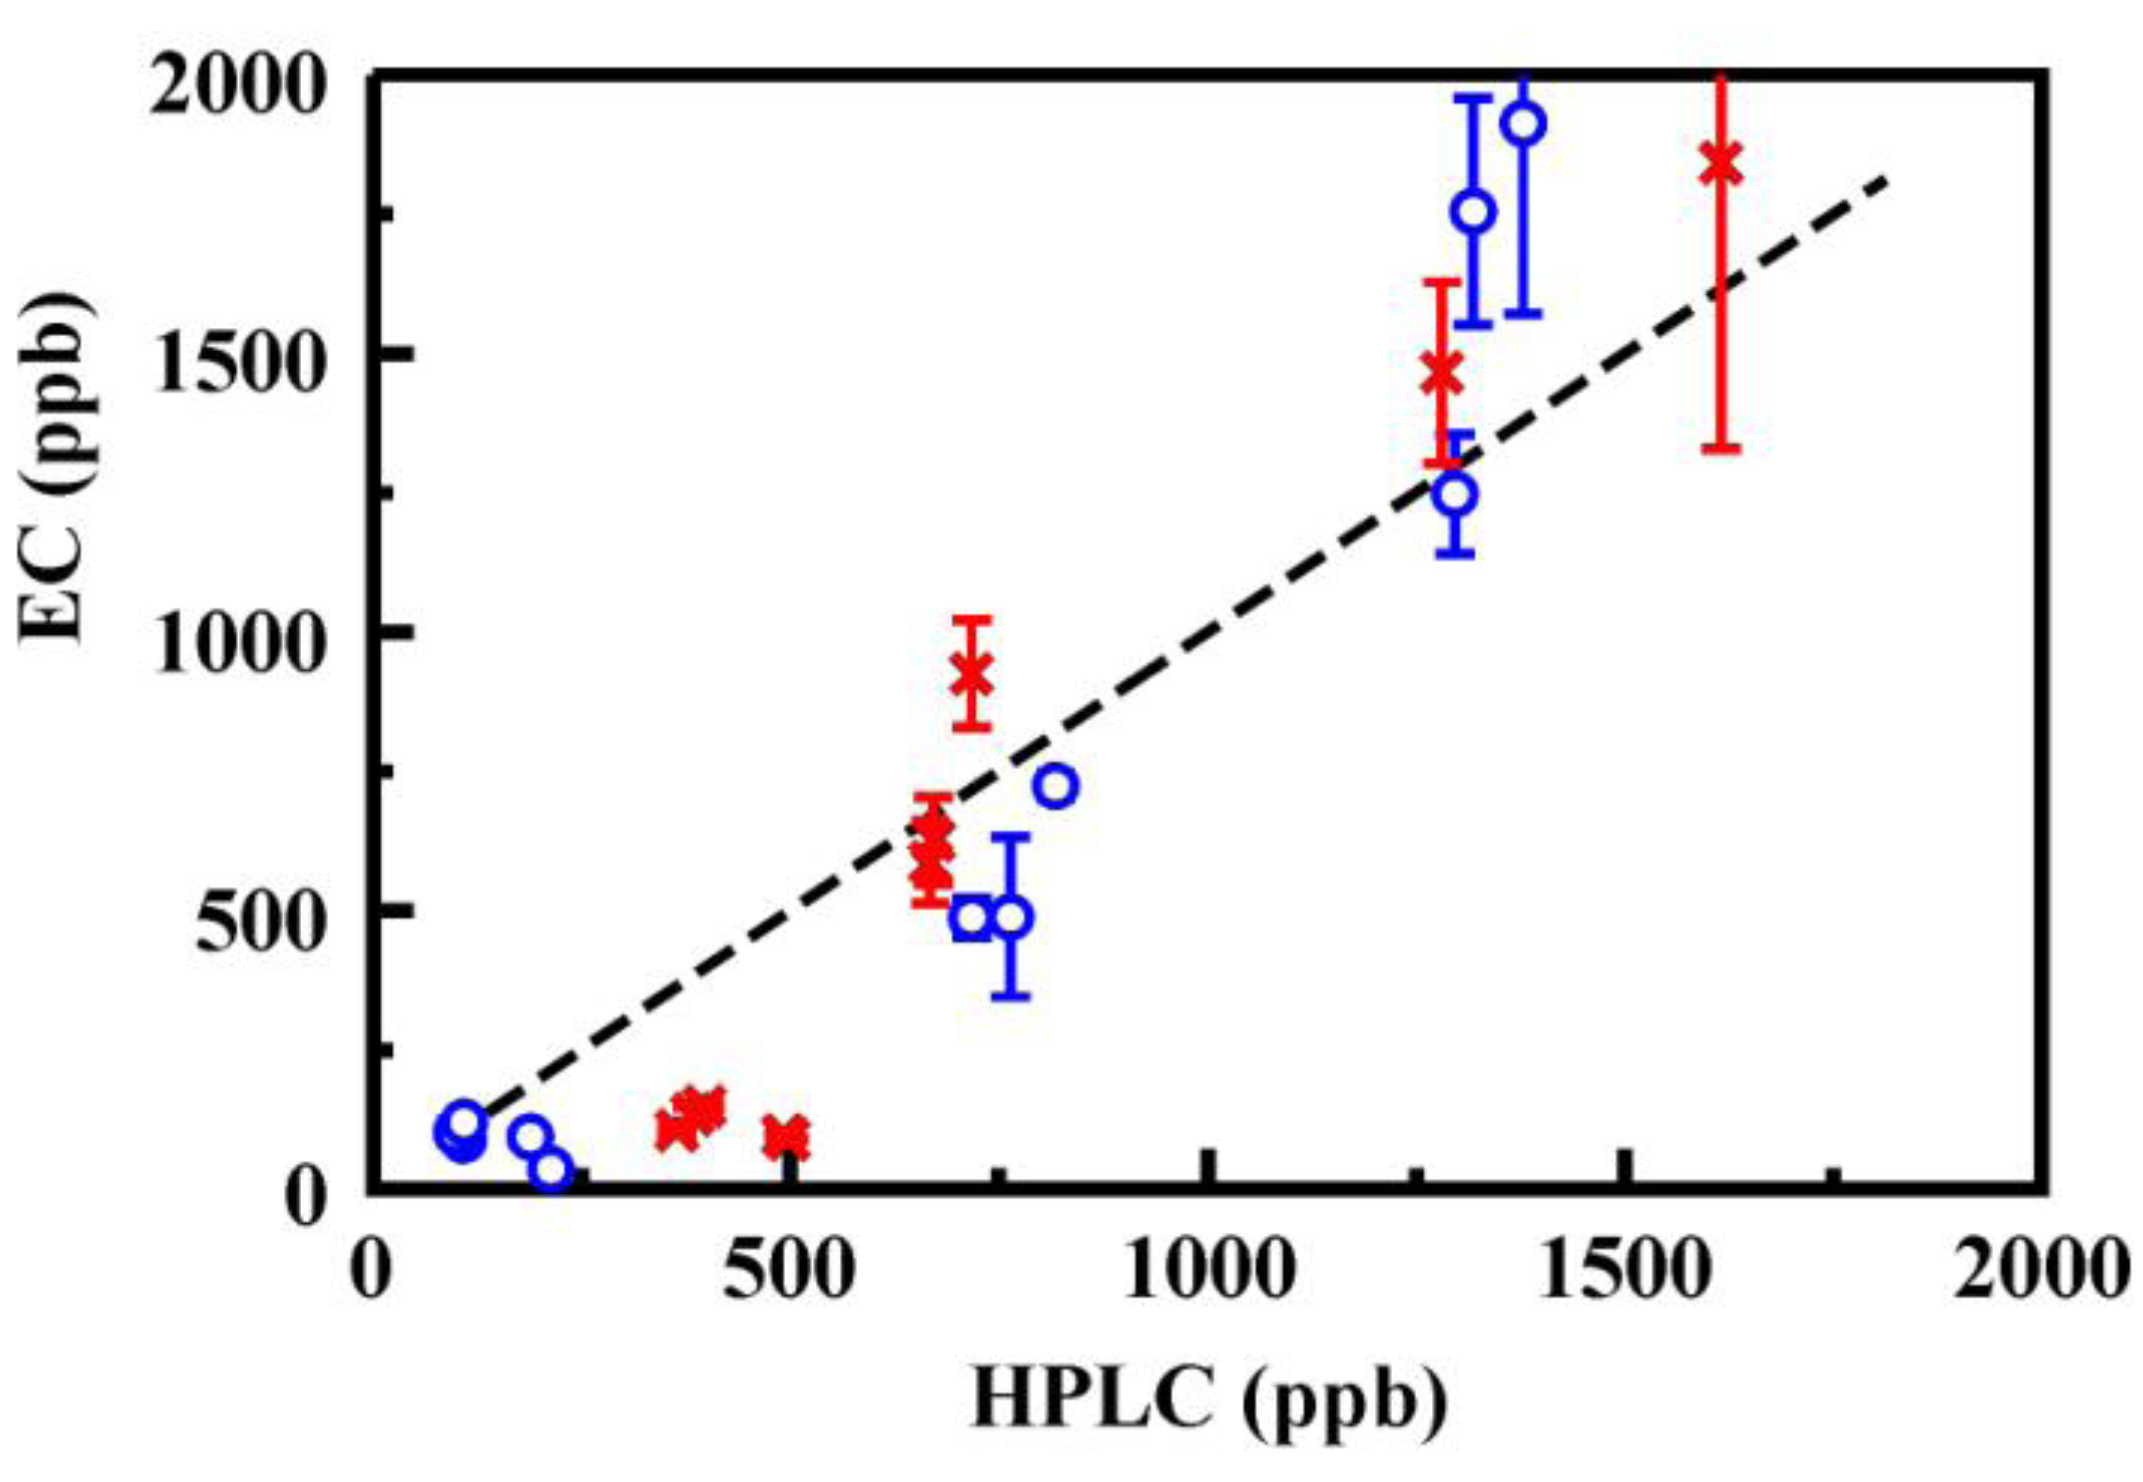
3.2. Ground Water Samples

As interferents are a significant concern for the application of electrochemical sensing to real-world samples, targets were spiked (3 to 250 ppb) into ground water samples obtained from an untreated well. We have previously demonstrated that ground water matrices have little impact on the performance of the sorbents [23]. Analysis was completed as described for the deionized water samples (Figure 4) with a 30 mL sample volume and 2 mL elution volume subsequently diluted using 0.15 M KCl in water (1:1). The calibration curve determined in Section 3.1 was utilized and reduction peak locations were unchanged. For TNT, the variation between HPLC and EC analysis remained 26%. For DNT, however, the variation increased to 40%. This increased variation is a result of the difficulties inherent in DNT analysis by the method utilized here, as well as the larger variations noted for the interactions of DNT with these sorbents [23]. The DNT peak occurs at a more negative potential than that of TNT (−0.77 V for DNT compared to −0.62 V for TNT). In this region of the voltammogram, the background current is beginning to level off or trend downward. Dissolved oxygen may contribute to these voltammogram features [2]. The variability results in difficulties in establishing the background to be subtracted from the total signal. The TNT peak occurs in a region of the voltammogram for which the background is linearly increasing, leading to reduced complexity. The higher voltage may also cause changes to the electrode resulting in greater run to run variation.
It was also of interest to determine the impact that compounds of similar structure would have on the results obtained. Compounds such as RDX, HMX, and nitroglycerine are retained and concentrated by the sorbent column nearly as effectively as DNT and TNT [23]. The presence of multiple contaminants in a sample was also shown to impact the amount of each target captured and the resulting final concentration in the eluant. This effect can be seen in samples containing both TNT and another target (Supporting Information, Table S6). While HPLC analysis of the eluant indicated the expected 7.5 times enhancement in TNT concentration, the other targets were found at consistently lower than expected concentrations. The affinity of the sorbents for TNT was shown to be greater than that for the other targets resulting in this observed performance [22,23]. When EC detected concentrations are compared to HPLC analysis of the eluent, a strong divergence is noted for both TNT and DNT (Supporting Information, Figure S2). This difference is again related to difficulties in voltammogram analysis due to baseline variations caused by the other sample constituents. The variation would be expected to become greater as the complexity of the mixture increased and if other active compounds were introduced.
Figure 4. Preconcentration from ground water. Points here represent the results for quantification of samples using the prototype system with analysis by HPLC (x-axis) and EC (y-axis): TNT (−0.62 V ± 0.02; blue) and DNT (−0.77 ± 0.02; red). The line indicates the expected results based on HPLC analysis of the spiked samples. Error bars indicate the standard deviation in the measurements, completed in triplicate; where not visible they are within the size of the symbol. The complete data set is provided in the Supporting Information, Table S5.
Chemosensors 02 00131 g004

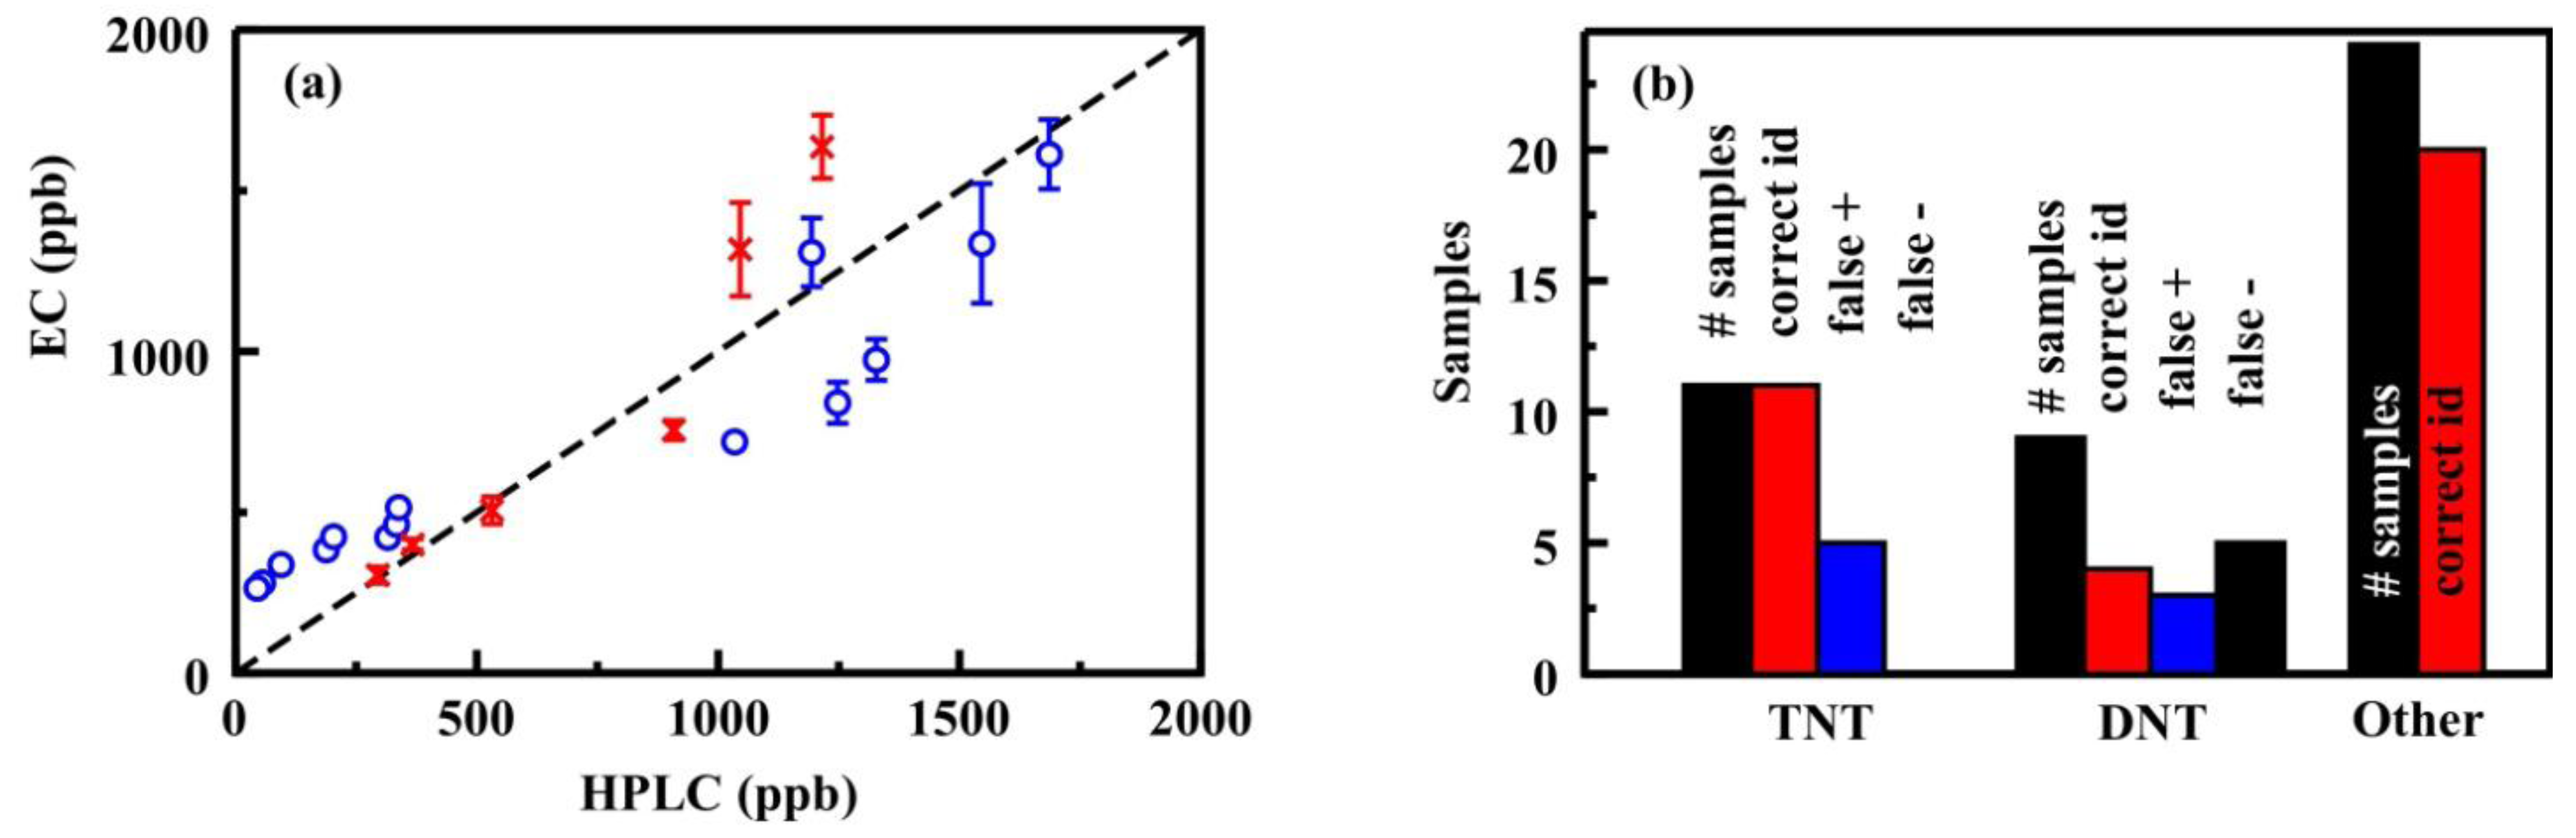
3.3. Blind Sample Analysis

A series of samples was prepared to evaluate the potential for this system in identifying the presence of targets. Identification was based on the peak reduction potential given the above calibration (TNT at −0.62 V ± 0.02 and DNT at −0.77 ± 0.02). This set was prepared so that the system operator had no knowledge of what targets were present or in what concentrations. The operator was not informed that some samples contained no target or that compounds other than TNT and DNT had been included in some of the samples. The fifteen blind samples were analyzed in triplicate as described above. Figure 5 summarizes the results (full results Supporting Information, Table S7). TNT was identified for all samples in which it was present. One false positive resulted from a sample of nitroglycerine. DNT was identified in four of nine samples. False positives for DNT resulted in several of the TNT samples. As mentioned above, the baseline for the region of the voltammogram in which the DNT peak is located can vary. It is possible to misinterpret these variations leading to false positive indications. For samples in which the targets were properly identified, variations from the HPLC indicated concentrations were similar to those of the ground water samples.
Figure 5. Blind sample analysis for TNT (−0.62 V ±0.02; blue) and DNT (−0.77 ± 0.02; red). (a) Points here represent the results for quantification of samples using the prototype system with analysis by HPLC (x-axis) and EC (y-axis). The line indicates the expected results based on HPLC analysis of the spiked samples. Error bars indicate the standard deviation in the measurements; where not visible they are within the size of the symbol. The complete data sets are provided in the Supporting Information, Table S7. (b) From the blind sample analysis, the bars shown here indicate the total number of samples containing either TNT or DNT and the associated number of correct target identifications. Additionally shown is the number of false positive and negative responses. The third category of samples includes those with no target and those with targets not expected to be detected.
Chemosensors 02 00131 g005

3.4. Advanced Prototype in Field Trials

An advanced prototype system for preconcentration of targets ahead of electrochemical detection was developed in collaboration with SubChem Systems, Inc. (Narragansett, RI, USA). The instrument was significantly different from the bench-scale prototype in that it used a manifold design with alternate pumps and valves; however, the fundamental function of the system was unchanged. Photographs of both prototypes are provided in the Supporting Information, Figures S3 and S4. Four sites were selected for evaluation of the instrument. Sites were over an area of 105 km2 and included stagnant and running surface water sources in Cherokee County, OK, USA. Site #1 was a pond located 4.8 km east of Hulbert, OK. The pond is utilized for livestock and contains small wildlife as well as significant algae. Site #2 was Ranger Creek located 8.0 km east of Hulbert. This site provided a slow moving creek near residences and a through roadway. Site #3 was Double Spring Creek inside the city limits of Hulbert. This creek was fast moving, shallow, and clear. The sampling site was near a low water crossing with limited use. Site #4 was located on Hulbert Landing at the insertion point for 14 Mile Creek, 5.3 km south of Hulbert. The site was experiencing flood level waters due to heavy rain at the time of the tests. Photographs of the sampling locations are provided in the Supporting Information, Figure S5.
The SubChem prototype did not provide sufficient pressure to achieve the expected flow rates in laboratory or field evaluations; sample flow rates were approximately 0.3 mL/min resulting in greatly extended sampling time requirements. In addition, it was necessary to flow 4 mL of the eluent through the system rather than the 2 mL used at the bench-scale. This need resulted from the lengths of tubing in the system. After adoption of this protocol, eluent was collected in two aliquots of 2 mL each. No target was detected in the first 2 mL of eluant for a given sample. Samples were otherwise processed as described above for evaluations of the initial prototype device, and preconcentration factors were unchanged. Given these limitations, the number of samples evaluated was reduced from the originally intended group. Three samples were evaluated for each of the sites: an as collected (unspiked) sample, a sample spiked with 50 ppb TNT, and a sample spiked with 50 ppb DNT. Aliquots of the collected and spiked samples were retained for HPLC analysis as was diluted eluent from each of the analyzed samples. HPLC analysis indicated that none of the as collected samples contained either TNT or DNT. Spiked control samples were verified to contain the expected concentrations of the target analytes. Table 1 provides the results of sample analysis. While the sample set is small, the variations between HPLC and EC analysis are similar to those noted for the ground water samples above, 16% and 31% for TNT and DNT, respectively.
Table 1. Analysis of field samples. 2,4,6-trinitrotoluene (TNT) and dinitrotoluene (DNT) reduction peaks at −0.62 V ± 0.02 and −0.77 ± 0.02, respectively. Samples were analyzed in triplicate; concentrations provided in parts per billion.
Site #Spike[HPLC]EC ID *[EC]St. Dev
Target[Target]
1N/A-
1TNT50243TNT280122
1DNT50153TNT/DNT26565
2N/A-
2TNT50259TNT329131
2DNT50270DNT25977
3N/A-
3TNT50253TNT298121
3DNT50225TNT/DNT30751
4N/A-
4TNT50244TNT27299
4DNT50272DNT32032
* TNT/DNT indicates difficulty in identification of the target. Concentrations provided based on DNT curve fits.

4. Conclusions

The organosilicate sorbent utilized in this study has been previously shown to provide semi-selective enhancement of TNT and DNT concentrations from a wide variety of matrices [21,23]. This study coupled the sorbent with electrochemical measurements in an in-line format as a necessary step toward achieving in situ monitoring for contaminants in natural waters. Overall, TNT detection using this method was encouraging. Discrimination of TNT from DNT and RDX was achieved with little difficulty in blind sample analysis. Nitroglycerine presence was interpreted as low TNT concentrations by an operator with no knowledge of sample composition. While the ground water matrix made electrochemical analysis of unprocessed samples impossible due to background fluctuations (data not shown), use of the in-line preconcentration sorbent provided elimination of the interferents as well as enhanced target concentrations. Depending on the volume of sample used for preconcentration, detection limits for the electrochemical sensor could be reduced by up to two orders of magnitude. Unfortunately, the approach was less successful for DNT. The peak for DNT reduction overlaps with a region of the baseline that is not stable. Variations in the baseline lead to greater error in analysis of DNT concentrations as well as a significant rate of false positives and negatives.
While bench-scale results indicated potential for application to the detection of TNT, the development of a second prototype incorporating components sufficient for a fielded application yielded less promising results. Due to the limitations of the pumps and the potential for backflow within the fluid lines, the system required constant attention and lengthy sampling periods. Alternate pumps as well as check-valves could be used to ameliorate these deficiencies. Unfortunately, while TNT detection is useful, it does not address the entirety of the need for this type of sensor. TNT presence would indicate the need for additional evaluation and monitoring, but it is one of the less stable compounds found at sites of ordnance contamination. RDX is of particular interest for in situ as well as long term monitoring of ground and surface water. Unfortunately, RDX does not lend itself to electrochemical detection using commercially available components. Custom modification to the electrodes could potentially produce a system for detection of this target [12]. Other methods, such as ion mobility spectrometry, may provide a more complete solution to nitroenergetic monitoring [24,25,26,27].

Acknowledgments

This research was sponsored by the US Department of Defense Strategic Environmental Research and Development Program (SERDP; ER-1604). The authors would like to thank Mr. W. Johnson, US Army Corps of Engineers (retired) for logistical assistance during field trials and Mr. M. Malanoski of Fulton, MD for providing the ground water samples utilized in these experiments. Thanks are also offered to Mr. S. Veitch and the team at SubChem Systems, Inc. (Narragansett, RI, USA). We have applied the SDC approach (“sequence-determines-credit”) for determining the order of authorship [28]. The views expressed here are those of the authors and do not represent those of the U.S. Navy, the U.S. Department of Defense, or the U.S. Government.

Author Contributions

Dr. Johnson was responsible for experimental design, oversight of prototype development, data analysis, field trials, and manuscript preparation. Dr. Nasir selected components for and assembled the initial prototype and completed characterization of the electrochemical sensor. Dr. Siefert collected and analyzed data for blind samples. Ms. Leska was responsible for HPLC analysis and provided logistical support for field efforts. Dr. Erickson provided support for prototype development and field trials. Mr. Charles collected and analyzed data for system characterization, interfaced with SubChem Systems, Inc., and provided logistical support for field efforts. Dr. Melde and Ms. Taft were responsible for materials synthesis and characterization.

Conflicts of Interest

The authors declare no conflict of interest.

References

  1. US Environmental Protection Agency. Nitroaromatics, Nitramines, and Nitrate Esters by High Performance Liquid Chromatography (HPLC); Method 8330B; US Environmental Protection Agency: Washington, DC, USA, 2006. [Google Scholar]
  2. Strategic Environmental Research and Development Program (SERDP); Olsen, K.; Wang, J. Detection and Measurement of Explosives in Groundwater Using in situ Electrochemical Sensors; Strategic Environmental Research and Development Program (SERDP): Alexandria, VA, USA, 2002. [Google Scholar]
  3. Black and Veatch Special Projects Corp.; US Environmental Protection Agency. Explosives in Water Field Screening Technologies UMDA and SUBASE Bangor; Black and Veatch Special Projects Corp., US Environmental Protection Agency: Tacoma, WA, USA, 1996. [Google Scholar]
  4. US Army Corps of Engineers; Jenkins, T.F.; Thorne, P.G.; Walsh, M.E. Field Screening Method for TNT and RDX in Groundwater; US Army Corps of Engineers: Hanover, NH, USA, 1994. [Google Scholar]
  5. Charles, P.T.; Adams, A.A.; Howell, P.B.; Trammell, S.A.; Deschamps, J.R.; Kusterbeck, A.W. Fluorescence-based Sensing of 2,4,6-Trinitrotoluene (TNT) using a multi-channeled poly(methyl methacrylate) (PMMA) Microimmunosensor. Sensors 2010, 10, 876–889. [Google Scholar] [CrossRef]
  6. Ciumasu, I.M.; Kramer, P.M.; Weber, C.M.; Kolb, G.; Tiemann, D.; Windisch, S.; Frese, I.; Kettrup, A.A. A new, versatile field immunosensor for environmental pollutants—Development and proof of principle with TNT, diuron, and atrazine. Biosens. Bioelectron. 2005, 21, 354–364. [Google Scholar] [CrossRef]
  7. Nagatomo, K.; Kawaguchi, T.; Miura, N.; Toko, K.; Matsumoto, K. Development of a sensitive surface plasmon resonance immunosensor for detection of 2,4-dinitrotoluene with a novel oligo (ethylene glycol)-based sensor surface. Talanta 2009, 79, 1142–1148. [Google Scholar] [CrossRef]
  8. Wang, J. Electrochemical sensing of explosives. Electroanal 2007, 19, 415–423. [Google Scholar] [CrossRef]
  9. Cennamo, N.; D’Agostino, G.; Galatus, R.; Bibbo, L.; Pesavento, M.; Zeni, L. Sensors based on surface plasmon resonance in a plastic optical fiber for the detection of trinitrotoluene. Sens. Actuators B Chem. 2013, 188, 221–226. [Google Scholar] [CrossRef]
  10. Choodum, A.; Kanatharana, P.; Wongniramaikul, W.; Daeid, N.N. Using the iPhone as a device for a rapid quantitative analysis of trinitrotoluene in soil. Talanta 2013, 115, 143–149. [Google Scholar] [CrossRef]
  11. Gopalakrishnan, D.; Dichtel, W.R. Direct Detection of RDX Vapor Using a Conjugated Polymer Network. J. Am. Chem. Soc. 2013, 135, 8357–8362. [Google Scholar] [CrossRef]
  12. Ly, S.Y.; Kim, D.H.; Kim, M.H. Square-wave cathodic stripping voltammetric analysis of RDX using mercury-film plated glassy carbon electrode. Talanta 2002, 58, 919–926. [Google Scholar] [CrossRef]
  13. Trammell, S.A.; Melde, B.J.; Zabetakis, D.; Deschamps, J.R.; Dinderman, M.A.; Johnson, B.J.; Kusterbeck, A.W. Electrochemical detection of TNT with in-line pre-concentration using imprinted diethylbenzene-bridged periodic mesoporous organosilicas. Sens. Actuators B 2011, 155, 737–744. [Google Scholar] [CrossRef]
  14. Wang, J.; Bhada, R.K.; Lu, J.M.; MacDonald, D. Remote electrochemical sensor for monitoring TNT in natural waters. Anal. Chim. Acta 1998, 361, 85–91. [Google Scholar] [CrossRef]
  15. Wang, J.; Lu, F.; MacDonald, D.; Lu, J.M.; Ozsoz, M.E.S.; Rogers, K.R. Screen-printed voltammetric sensor for TNT. Talanta 1998, 46, 1405–1412. [Google Scholar] [CrossRef]
  16. Hilmi, A.; Luong, J.H.T. Electrochemical detectors prepared by electroless deposition for microfabricated electrophoresis chips. Anal. Chem. 2000, 72, 4677–4682. [Google Scholar] [CrossRef]
  17. Hilmi, A.; Luong, J.H.T. In-line coupling capillary electrochromatography with amperometric detection for analysis of explosive compounds. Electrophoresis 2000, 21, 1395–1404. [Google Scholar] [CrossRef]
  18. Sekhar, P.K.; Brosha, E.L.; Mukundan, R.; Linker, K.L.; Brusseau, C.; Garzon, F.H. Trace detection and discrimination of explosives using electrochemical potentiometric gas sensors. J. Hazard. Mater. 2011, 190, 125–132. [Google Scholar] [CrossRef]
  19. Johnson, B.J.; Melde, B.J.; Charles, P.T.; Cardona, D.C.; Dinderman, M.A.; Malanoski, A.P.; Qadri, S.B. Imprinted Nanoporous Organosilicas for Selective Adsorption of Nitroenergetic Targets. Langmuir 2008, 24, 9024–9029. [Google Scholar] [CrossRef]
  20. Melde, B.J.; Johnson, B.J.; Dinderman, M.A.; Deschamps, J.R. Macroporous periodic mesoporous organosilicas with diethylbenzene bridging groups. Microporous Mesoporous Mater. 2010, 130, 180–188. [Google Scholar] [CrossRef]
  21. Johnson, B.J.; Leska, I.A.; Medina, A.; Dyson, N.F.; Nasir, M.; Melde, B.J.; Taft, J.R.; Charles, P.T. Toward in situ monitoring of water contamination by nitroenergetic compounds. Sensors 2012, 12, 14953–14967. [Google Scholar] [CrossRef]
  22. Johnson, B.J.; Melde, B.J.; Charles, P.T.; Dinderman, M.A.; Malanoski, A.P.; Leska, I.A.; Qadri, S.A. Macroporous silica for concentration of nitroenergetic targets. Talanta 2010, 81, 1454–1460. [Google Scholar] [CrossRef]
  23. Johnson, B.J.; Melde, B.J.; Leska, I.A.; Charles, P.T.; Hewitt, A.D. Solid-phase extraction using hierarchical organosilicates for enhanced detection of nitroenergetic targets. J. Environ. Monit. 2011, 13, 1404–1409. [Google Scholar] [CrossRef]
  24. Armenta, S.; Alcala, M.; Blanco, M. A review of recent, unconventional applications of ion mobility spectrometry (IMS). Anal. Chim. Acta 2011, 703, 114–123. [Google Scholar] [CrossRef]
  25. Buxton, T.L.; Harrington, P.D. Trace explosive detection in aqueous samples by solid-phase extraction ion mobility spectrometry (SPE-IMS). Appl. Spectrosc. 2003, 57, 223–232. [Google Scholar] [CrossRef]
  26. Fetterolf, D.D.; Clark, T.D. Detection of trace explosive evidence by ion mobility spectrometry. J. Forensic Sci. 1993, 38, 28–39. [Google Scholar]
  27. Garofolo, F.; Migliozzi, V.; Roio, B. Application of ion mobility spectrometry to the identification of trace levels of explosives in the presence of complex matrices. Rapid Commun. Mass Spectrom. 1994, 8, 527–532. [Google Scholar] [CrossRef]
  28. Tscharntke, T.; Hochberg, M.E.; Rand, T.A.; Resh, V.H.; Krauss, J. Author sequence and credit for contributions in multiauthored publications. PLoS Biol. 2007, 5, e18. [Google Scholar] [CrossRef]

