Article

Molecularly Imprinted Quartz Crystal Microbalance Sensor (QCM) for Bilirubin Detection

1
Department of Chemistry, Hacettepe University, 06800 Ankara, Turkey
2
Department of Chemical Technology, Abant İzzet Baysal University, 14900 Bolu, Turkey
*
Author to whom correspondence should be addressed.
Chemosensors 2016, 4(4), 21; https://doi.org/10.3390/chemosensors4040021
Submission received: 22 August 2016 / Revised: 24 October 2016 / Accepted: 31 October 2016 / Published: 18 November 2016

Abstract

:
This study aims the preparation of a QCM sensor for the detection of bilirubin in human plasma. Bilirubin-imprinted poly-(2-hydroxyethyl methacrylate-N-methacryloyl-l-tryptophan methyl ester) (PHEMATrp) nanofilm (MIP) on the gold surface of a QCM chip was synthesized by the molecular imprinting technique. Meanwhile, the non-imprinted PHEMATrp (NIP) nanofilm was synthesized by the same experimental technique to examine the imprinting effect. Characterization of MIP and NIP nanofilms on the QCM chip surface was achieved by atomic force microscopy (AFM), ellipsometry, Fourier transform infrared spectrophotometry-attenuated total reflectance (FTIR-ATR) and contact angle measurements (CA). The observations indicated that the nanofilm was almost in a monolayer. Thereinafter, the imprinted and the non-imprinted QCM chips were connected to the QCM system to investigate kinetic and affinity properties. In order to examine the selectivity of the MIP-PHEMATrp nanofilm, competitive adsorption of bilirubin with cholesterol and estradiol was performed. Limit of detection (LOD) and limit of quantitation (LOQ) values were calculated as 0.45 μg/mL and 0.9 μg/mL, respectively.

Graphical Abstract

1. Introduction

Bilirubin is a tetrapyrrolic yellow compound, formed as an end product of heme in blood and transported to hepatocytes via albumin (as a water-soluble complex) for further conjugation with glucuronic acid (mono/di), then excreted into the bile [1,2]. Unconjugated bilirubin (UCB) can behave as an antioxidant agent at low concentrations and provide a positive health effect on hyperbilirubinemia (in case of the increase of UCB in the blood) patients [3,4]. High concentrations of UCB accumulate in many tissues, especially in the brain, due to its lipophilic nature, so it cannot be excreted [5]. A high UCB concentration in the blood can cause hepatic or biliary tract dysfunction, and also permanent brain damage or death in the most severe cases [6]. A level of UCB in the plasma above 15 mg/dL (256 μM) can lead to neurological dysfunctions such as kernicterus or bilirubin encephalopathy [7,8,9]. UCB can be regarded as a diagnostic marker closely related to many significant functions or disorders of the liver [3]. In the case of dudogastroesophageal reflux, bile acids can be detected in the esophagus of patients and it was reported that there is a significant relation between the total bilirubin and bile acid levels. Therefore, these molecules can be assumed as markers for this disease. De Corso and co-workers have detected bile acids and bilirubin in the saliva of patients to uncover the relationship between their presence, symptoms and findings of laryngeal damage. They concluded that bile acid and total bilirubin assay in saliva could be regarded as simple and noninvasive markers [10]. Xantochromia is yellow discoloration due to the presence of bilirubin in the cerebrospinal fluid and is an indication of in vivo hemorrhage. Therefore, the detection of bilirubin in cerebrospinal fluid by a simple and efficient quantitation method between a period of 12 h and three weeks post-ictus has clinical significance [11].
The direct spectroscopic measurement and the diazo reaction are the most commonly used methods to detect the bilirubin level in serum plasma [12]. Unconjugated and conjugated bilirubin analysis has been carried out by HPLC-UV/VIS methods with RP-C18 columns [13]. Other methods have been also reported such as the fluorimetric method which used the yttrium (Y3+)-norfloxacin complex as a fluorescence (FL) probe [14], capillary electrophoresis which used a mixed anionic surfactant-protein buffer system with laser-induced fluorescence detection [14], and the electrochemical method based on electro-catalytic oxidation of bilirubin [15]. An amperometric biosensor for total bilirubin assessment in serum [16] and a piezoelectric sensor–based MIP technology [17] have also been reported for bilirubin analysis. Santosh et al. reported a non-enzymatic and fluorescence quenching–based method using human serum albumin–stabilized gold nanoclusters as a fluorescent probe for free serum bilirubin detection in blood serum samples. The bilirubin concentration change strongly affected the fluorescence quenching. The detection limit was 248 ± 12 nM under interference-free medium and the response was stable over the wide pH and temperature ranges. The detection limit in serum samples was 200 ± 19 nM [2].
QCM is a mass-sensitive technique based on the piezoelectric effect. Any mass deposited on the QCM resonator affects the oscillation frequency of the resonator. It is possible to investigate biomolecular/chemical interactions due to measuring the frequency shift of the resonator, which is proportional to the mass change on the surface of the resonator [18,19,20,21,22]. The QCM technique offers some advantages such as label-free monitoring in real time and determining the kinetic constants of biomolecules in addition to easy use, low cost, high sensitivity, portability and quick response time [23]. Recently, QCM has been well adopted for analytical applications considering the practical limitations of laboratory-based methods such as high cost, long processing times, instrumental complexity and difficulty of manipulation [24].
In the current study, a QCM sensor based on the molecular imprinting technique was developed for the detection of bilirubin in human serum and aqueous solution. Bilirubin-imprinted polymers with various bulk structures [8,9,25,26] were already prepared as molecular imprinting materials provided to design artificial receptors with a longer shelf-life and better stability as compared to natural biomolecules [27]. The recognition mechanism of biomolecules such as enzyme/substrate and antibody/antigen was transferred to the synthetic polymeric structure via the molecular imprinting approach [20]. Molecular cavities which are complementary in chemical functionality, shape and size to the analyte, called the template, are produced in/on the synthetic polymeric structure. These cavities formed in/on the polymeric structure have specific and highly selective against the template [28]. Due to stability (with respect to the highly cross-linked structure) in extreme environmental conditions, and cheap and easy synthesis, molecular-imprinted materials exhibit wide potential use in separation, sensors, catalysis, and drug delivery [29,30].

2. Materials and Methods

2.1. Materials

Bilirubin, hydroxyethyl methacrylate (HEMA) and ethylene glycol dimethacrylate (EGDMA) were purchased from Sigma Chemical Co. (St. Louis, MO, USA). QCM chips were purchased from Maxtek Inc. (New York, NY, USA). N-methacryloyl-l-tryptophan methylester (MATrp), was supplied from Nanoreg (Ankara, Turkey). The α,α′-Azobisisobutyronitrile (AIBN) was supplied from Fluka A.G. (Buchs, Switzerland). Water used in experiments was purified using a Barnstead (Dubuque, IA, USA) ROpure LP®reverse osmosis unit. All other chemicals were reagent grade and supplied from Merck A.G. (Darmstadt, Germany).

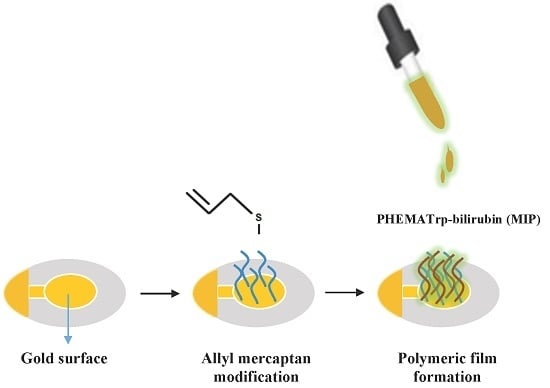
2.2. Preparation of the Bilirubin-Imprinted Nanofilm (MIP)

Gold surface of QCM sensor was cleaned with acidic piranha solution (1:3 30% H2O2/H2SO4), then immersed in deionized water (DI) and ethyl alcohol, respectively and dried in vacuum oven (200 mmHg, 40 °C) for 2 h. Then 5 µL of 3.0 mM allyl mercaptan solution was poured onto gold surface and incubated for 12 h in a sealed container. After modification, unreacted allyl mercaptan monomer was removed by ethyl alcohol solution (96%). So, a self-assembled monolayer of thiol groups was organized prior to the polymerization of bilirubin molecular-imprinted polymeric film.
Molecularly imprinted PHEMATrp nanofilm with bilirubin was formed via photopolymerization. Firstly, bilirubin was pre-complexed with the functional comonomer of MATrp. For that, 5.95 × 10⁻³ mmol (0.87 mg) bilirubin was dissolved in 250 µL aqueous solution of 0.1 M Na2CO3 and 0.035 mmol (40.47 mg) MATrp was added into this solution. Pre-polymer complex formation of (MATrp/bilirubin) was achieved by stirring magnetically at 150 rpm for 5 min at room temperature. All complexation process was performed in dark room and MATrp/bilirubin was kept in dark place until use.
In the next step, 356 µL of HEMA (2.94 mmol) monomer, 713 µL of phosphate buffer (pH: 7.0) and the initiator (5 mg AIBN) were mixed with the solution of MATrp/bilirubin for 5 min on a magnetic stirrer at 200 rpm and dissolved oxygen was removed passing nitrogen gas through the stock solution. In general, polymeric films were cross-linked using various crosslinking agents (glutaraldehyde, formaldehyde and methylene bisacrylamide) to enhance the mechanical properties and water stability. To date, successful imprinting of small molecules has been performed via molecular imprinting technology; however, imprinting of macromolecules is still facing a great challenge due to restricted mass transfer of the large molecules across the cross-linked polymer matrix. Variety of strategies such as surface imprinting, epitope imprinting and/or using nano-sized materials have been evaluated to overcome the mass transfer problems of macromolecules. Nano-sized materials with high surface-to-volume ratio have received great attention due to the elevation of binding capacity of molecules by facilitating template removal and improving accessibility of the generated recognition sites. The bilirubin-imprinted PHEMATrp films with significant strength and water stability have been synthesized without using any cross-linking agent [30]. Then 2.0 µL aliquots of the stock solution was poured onto the surface of allyl mercaptan functionalized QCM sensor. MAXTEK 5 MHZ Cr/Au polished quartz crystals chip was supplied from USA by INFICON. Polymerization was triggered using UV light at room temperature (100 W, 365 nm) and was continued for 20 min at room temperature under nitrogen atmosphere.
Degradation degree of removed template molecule, bilirubin was monitored by UV-VIS spectrophotometry method. At first, absorbance spectra of bilirubin solution were recorded (1 min). After then, the prepared bilirubin solution to make molecularly imprinted polymer was subjected to UV light for 20 min and absorbance spectra of desorbed bilirubin were recorded again (20 min). Unremarkable intensity change as seen in Figure 1 implies that there is no any detectable structural change of bilirubin molecules. So polymerization under UV light was decided to be good choice for making bilirubin-imprinted nanofilm.
At the end of the photopolymerization, the unreacted monomers were removed by washing QCM resonator with methanol solution. A solution containing 2 M NaOH, 1 M Na2CO3 and 25 mM EDTA was used as desorption agent for bilirubin [8]. The non-imprinted QCM (NIP-QCM) chip was also prepared through the same procedure without using bilirubin to test the efficiency of imprinting process.
The bilirubin imprinted and the non-imprinted QCM sensor surfaces were characterized by Fourier transform infrared spectroscopy-attenuated total reflectance (FTIR-ATR) (Thermo Fisher Scientific, Nicolet iS10, Waltham, MA, USA, ABD), contact angle measurements (KRÜSS DSA100, Hamburg, Germany), ellipsometer measurements (Nanofilm EP3, Gottingen, Germany) and atomic force microscopy (AFM) (Nanomagnetics Instruments, Oxford, UK).

2.3. Evaluation of the Sensor Response

RQCM (INFICON Acquires Maxtek Inc., New York, NY, USA) was used for kinetic studies with the bilirubin-imprinted QCM sensor in real time. QCM sensor crystals have an orientation of standard AT-cut and are 1 in (25.4 mm) in diameter gold-coated crystals.
Bilirubin-imprinted QCM sensor was installed in an INFICON crystal holder and equilibrated with carbonate buffer at pH 11 until reaching the constant oscillation frequency (fo). Bilirubin solutions (in carbonate buffer at pH: 11) in the concentration range between 1.71–85.51 µM were applied to the QCM system and frequency shifts (∆f) which is proportional to the deposited mass on the QCM resonator surface were monitored in real time until it became stable (about 20 min). The Sauerbrey equation is used to estimate a linear relation between the changes in the resonant frequency of a quartz crystal and the mass of a thin rigid film added to its surface [31] and widely used to relate the decrease in resonant frequency Δ f to the added mass Δ m for mass conversion in the quartz crystal microbalance applications because the frequency to mass conversion depends only on the geometrical and physical characteristics of the quartz crystal. Equation (1) stands for the Sauerbrey equation. Where f 0 is the resonant frequency, A is the active electrode area, ρ q is the density, μ q is the shear modulus.
Δ f = 2 f 0 2 ρ q μ q . Δ m A
Bilirubin desorption was performed with a solution containing 2 M NaOH, 1 M Na2CO3 and 25 mM EDTA. All equilibrium-adsorption-desorption steps were applied for each cycle of different of bilirubin concentration.

3. Result and Discussion

3.1. Characterization of the QCM Sensors

The surface of bilirubin-imprinted PHEMA film (Figure 3) was characterized by FTIR-ATR, contact angle, AFM and ellipsometry measurements. In the FTIR-ATR spectrum of PHEMA, the absorption band of the -OH stretching vibrations was observed at 3420 cm−1, the C-H stretching band of the alkyl group at 2954 cm−1, the C=O stretching band of the carbonyl group at 1718 cm−1 and the C=C stretching band at 1633 cm−1. In the FTIR-ATR spectrum of PHEMATrp, the aromatic N-H stretching band was observed at 1533 cm−1, the aromatic C-N stretching bands at 1454–1391 cm−1 and the C=O stretching band of the amino acid at 1657 cm−1, which demonstrated that the MATrp was incorporated into the polymeric structure (Figure S1). A schematic representation for the molecular formula of PHEMATrp polymeric film was shown in Figure 2.
The surface hydrophilicity of the QCM sensor surface was determined with the water contact angle instrument via the sessile drop method. Contact angle values were calculated using DSA2 software and are given in Table 1. The water contact angle values of unmodified (bare) QCM, MIP-QCM and NIP-QCM chips were calculated as 85.4° ± 0.13, 77.1° ± 0.1 and 75.3° ± 0.15, respectively (Figure S2). A significant decrease of the contact angle values (approximately 10°) of the MIP-QCM and NIP-QCM surfaces indicates that the hydrophilic character of the surface was further increased due to the incorporation of the hydrophilic monomer, HEMA.
The morphology of the QCM sensor surfaces was revealed by AFM in dynamic mode as shown in Figure 3. The AFM tips have an oscillation frequency of 300 kHz and an area of 2 µm × 2 µm. Each QCM sensor surfaces was scanned with the rate of 1 μm/s and the resolution of 256 × 256 pixels. The average surface roughness of MIP-QCM and NIP-QCM was determined as 36.82 nm and 28.82 nm, respectively. These roughness values confirm the film formation on the QCM chip surfaces. The thickness of MIP and NIP polymeric film on the QCM surface was determined as 81.9 ± 1.9 nm and 77.8 ± 3.7 nm, respectively (Figure S3). The difference between the thickness values (MIP: 77.1 ± 0.10 and NIP: 75.3 ± 0.15) indicated that the molecular imprinting process has been performed successfully and these values also show that polymeric film attachment onto the gold surface of the QCM resonator was achieved for each MIP and NIP QCM sensor.

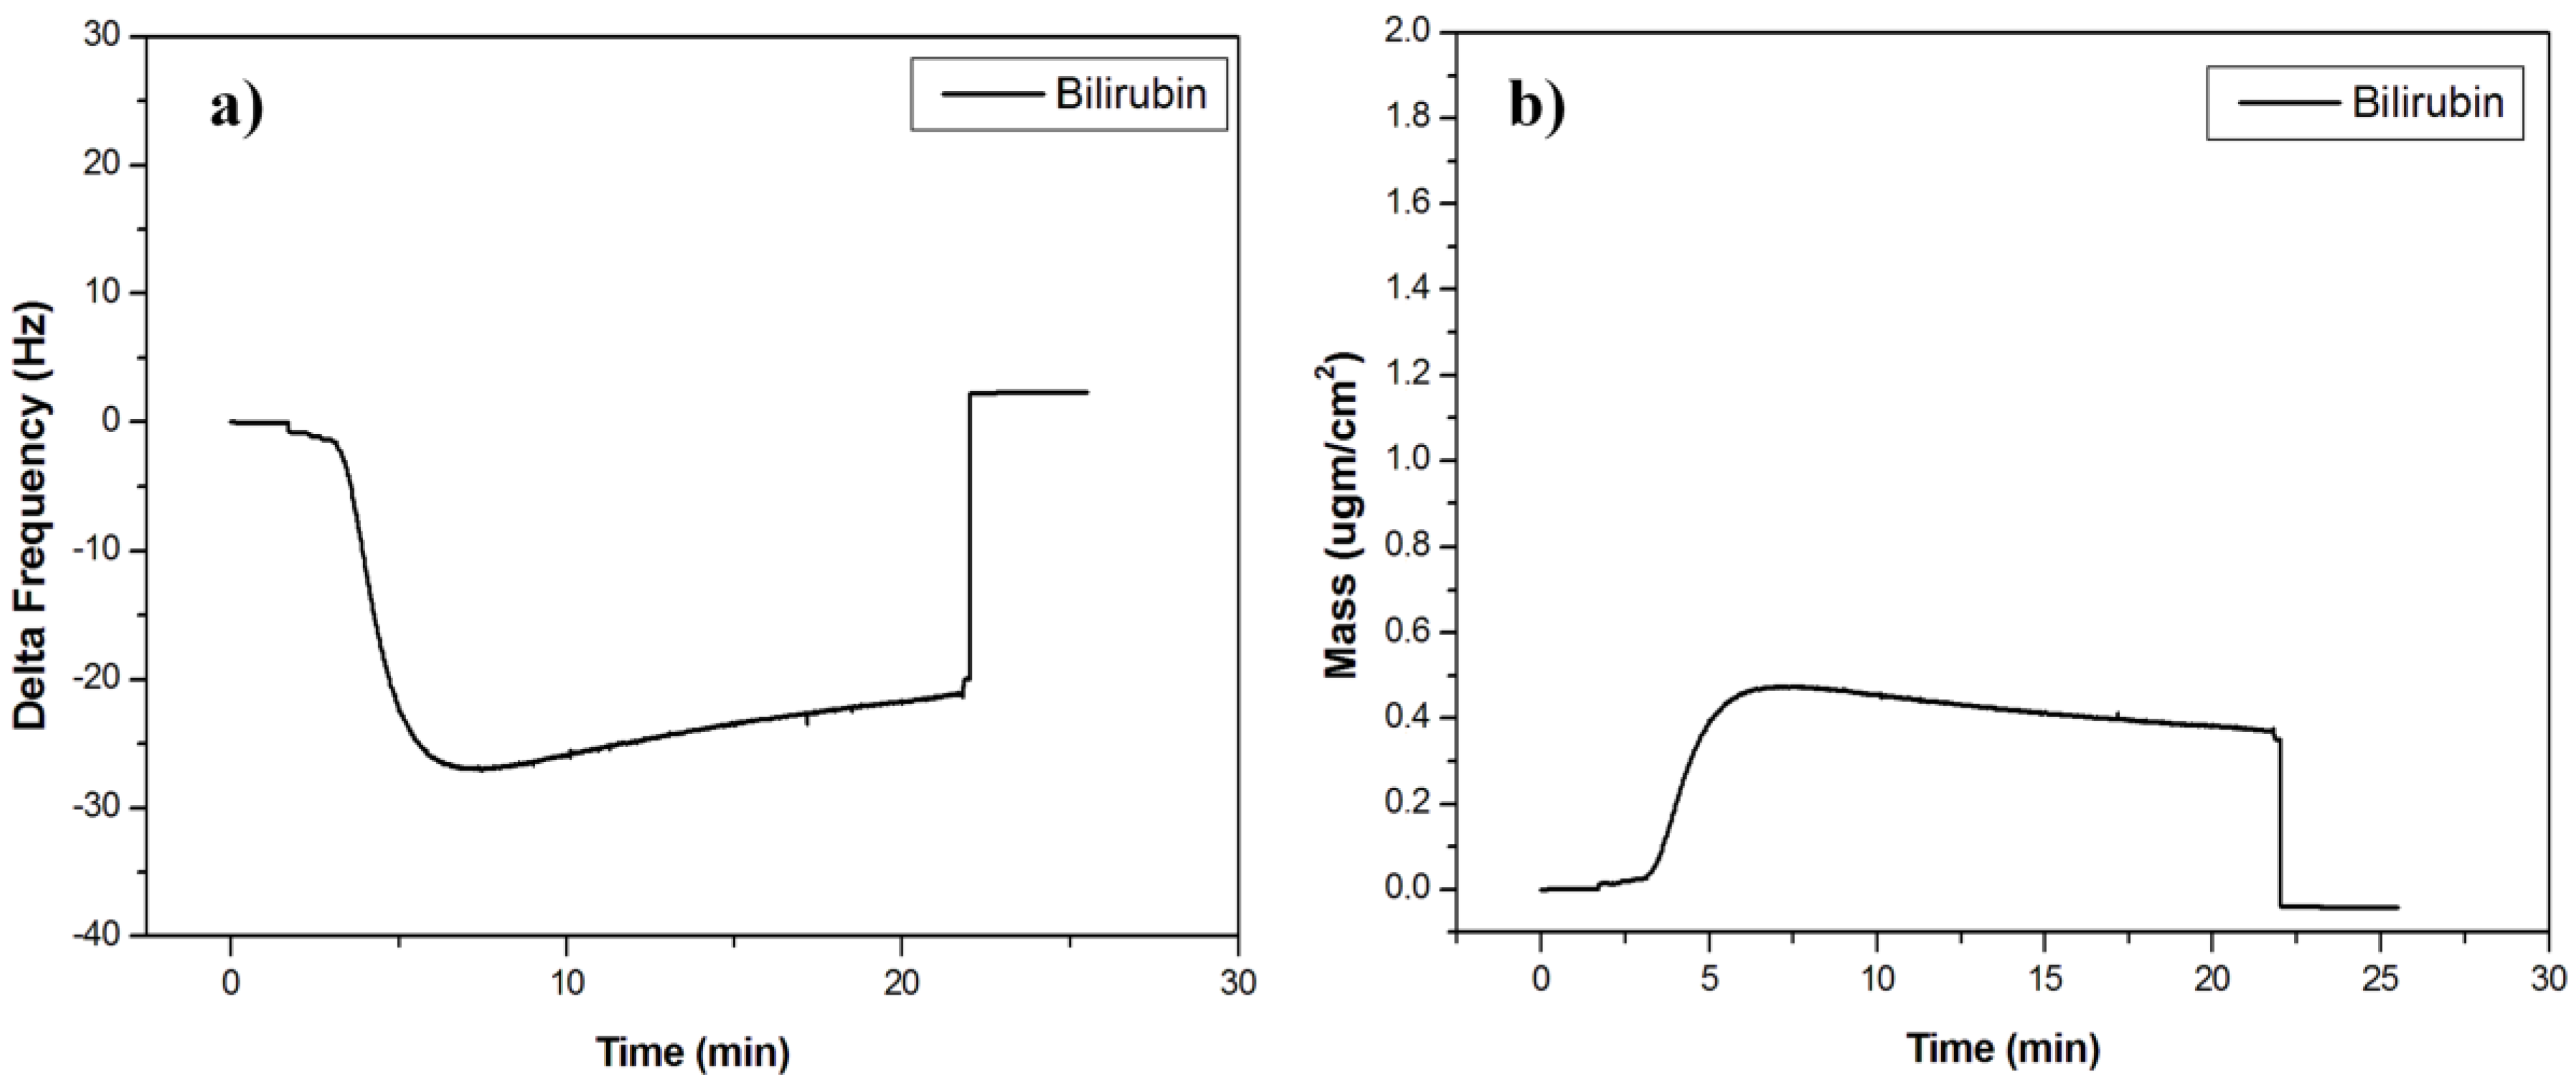
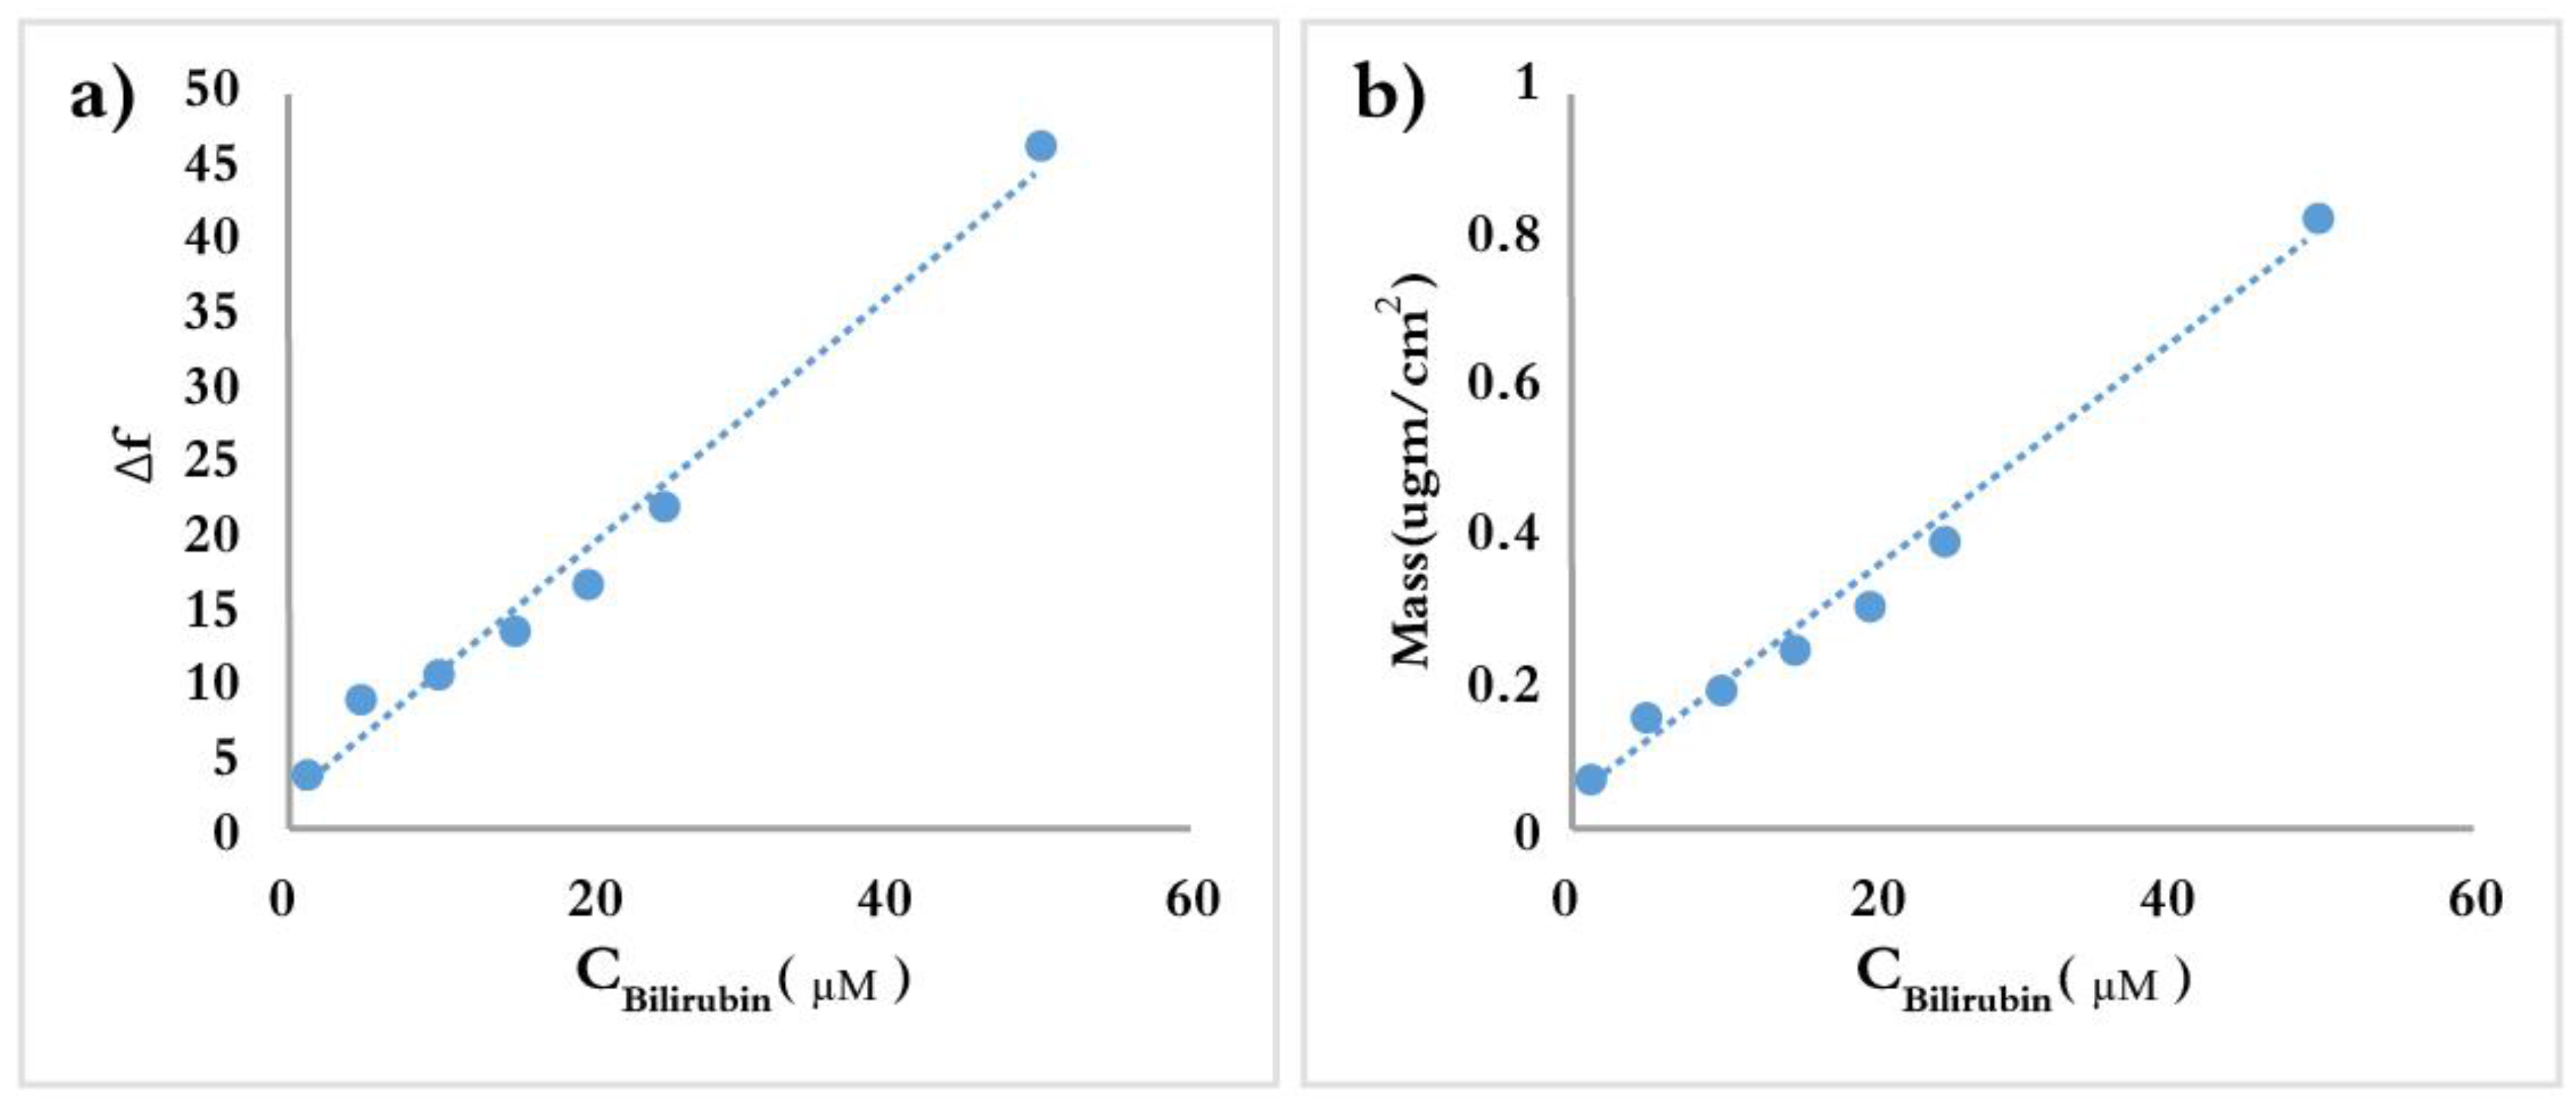
3.2. Bilirubin-Imprinted Sensor Response

Bilirubin solutions with a concentration range of 1.71–85.51 µM (1–50 µg/mL) were prepared to evaluate the relationship between the bilirubin concentration and QCM sensor response. The working concentration range was chosen by considering the plasma bilirubin levels of the hyperbilirubinemia patients. Real-time kinetic data were monitored using RQCM (Maxtek) software. The sensorgram, which shows the change of Δf versus time for a concentration of 25 µg/mL, is given in Figure 4a. The sensorgram, which shows the change of mass versus time (completed in about 25 min) at a concentration of 25 µg/mL, is given in Figure 4b.
As seen in Figure 5a,b, the value of mass, which is proportional to ∆f, is increased with the increasing bilirubin concentration. The bilirubin-imprinted QCM sensor showed a linearity for the concentration range of 1–50.0 μg/mL (1.71–85.8 µM) with the regression coefficient of R2 = 0.98. The data obtained from this concentration range were used to calculate LOD and LOQ values of the QCM sensor [27]. LOD and LOQ values were determined as 0.45 μg/mL and 0.9 μg/mL, respectively. A summary of various detection methods for bilirubin was summarized in Table 2. As can be seen from the table, the QCM sensor prepared in this study has comparable LOD values.

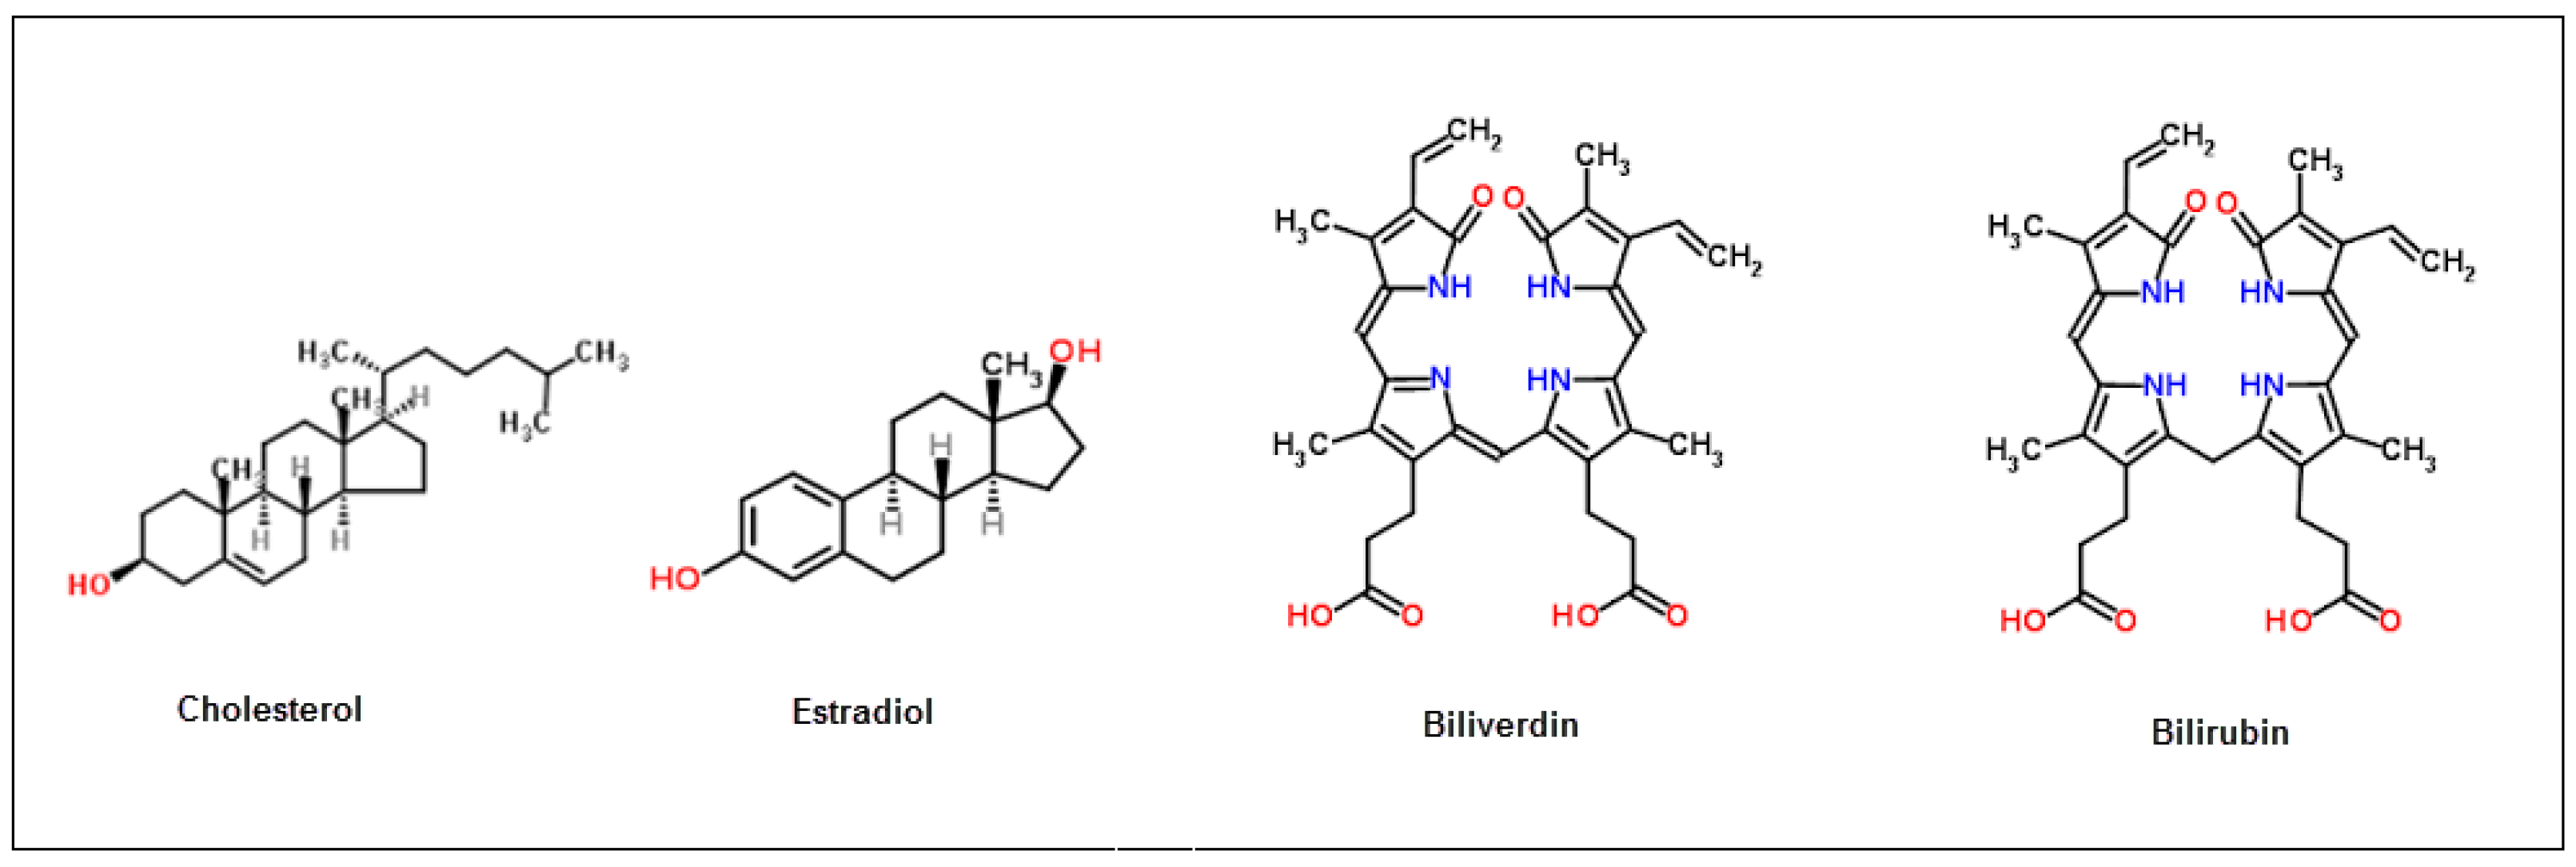
3.3. Selectivity of Bilirubin-Imprinted QCM Sensor

Cholesterol, estradiol and biliverdin, which are similar in size/shape and molecular weight to bilirubin, were used for selectivity studies (Scheme 1). The imprinting efficiency of the bilirubin-imprinted QCM sensor was proved by preparing a non-imprinted QCM sensor. Each solution of bilirubin, cholesterol, estradiol and biliverdin at a concentration of 25 µg/mL was applied to the bilirubin-imprinted and non-imprinted QCM sensors, respectively. All responses of the bilirubin-imprinted and the non-imprinted QCM sensors are summarized in Table 3. The selectivity constants (k) for the bilirubin-imprinted QCM sensor were 2.19, 3.15 and 5.92 for bilirubin against biliverdin, cholesterol and estradiol, respectively. The selectivity constants (k) for the non-imprinted QCM sensor were 0.52, 0.86 and 2.85 for bilirubin against biliverdin, cholesterol and estradiol, respectively. Imprinting efficiency constant (k’) values are also given in Table 3. The bilirubin-imprinted QCM sensor was 4.21, 3.66 and 2.07 times more selective for bilirubin with respect to biliverdin, cholesterol and estradiol, respectively. With respect to these responses, it can be concluded that the bilirubin-imprinted QCM sensors recognize bilirubin with good selectivity due to the imprinting technique (shape and chemical recognition memory).

3.4. Bilirubin Detection in Human Plasma and Urine

The bilirubin-imprinted sensor was used to detect total bilirubin in human blood plasma. Saturated ammonium sulphate solution was added into the plasma, which was pooled from a healthy donor (without fibrinogen) to precipitate plasma proteins. Then the plasma was centrifuged at 5000 rpm for 15 min. The plasma samples were applied to the QCM system for real-time detection of bilirubin. The bilirubin level in the blood serum was determined as 11.31 μM (6.60 µg/mL). The bilirubin level found in the body reflects the balance between production and excretion. Blood test results should always be interpreted using the reference range provided by the laboratory that performed the test, which is typically in the concentration range of 0.2–1.0 mg/dL (or 3.4–17.1 µmol/L) for adults, referring to healthy patients. According to the reference ranges, our result, which was 11.31 μM, falls within the average level.
To evaluate the effect of the other real interfering species commonly found in plasma and urine, the interference test, made by using plasma with unprecipitated plasma proteins and artificial urine simulating natural urine, was prepared according to the protocol named “AU-Siriraj” report by Somchai and Visith [45]. The unprecipitated plasma sample pooled from the healthy donor was diluted with the 10 mM PBS, pH: 7.4 buffer (1/10), and applied to the QCM sensor system. The bilirubin level was estimated as 8.48 μM (4.95 µg/mL). The estimated lower value belonging to the bilirubin molecule may be due to the competitive and steric hindrance effect of the other molecules such as proteins commonly found in plasma. Bilirubin-spiked artificial urine with a 3.4 μM (2.0 µg/mL) concentration was also applied to the sensor system. From the response given by the instrument, the bilirubin amount was estimated as 3.11 μM (1.83 µg/mL) and a possible reason can be the salt effect of ions such as Na+1 and K+1 found in the urine solution, which has contributed hydrophobic interactions.

3.5. Reusability and Reproducibility of the Imprinted Sensor

In order to show the reusability of the bilirubin-imprinted QCM sensor, three equilibration-adsorption-regeneration cycles were repeated using the same QCM chip with an aqueous solution of bilirubin (1 µg/mL concentration). The ∆f values obtained for the three cycles are shown in Figure 6. The responses of the QCM sensor were reproducible during the cycles.
Repeatability was determined by preparing three replicates of the same concentration of the bilirubin sample, and frequency shifting (Δf) was measured by the instrument. Precision results to ascertain the repeatability of the proposed method were reported as the percent relative standard deviation value, %RSD, which was 0.51. The precision result showed a good repeatability with a %RSD less than 2.
The fabrication of high quality and reproducible sensors to produce commercial products was critical and imperative for the sensing applications. Reproducibility of the QCM sensor was investigated by scaling up the process for the fabrication of QCM sensors with similar properties under the same fabrication conditions. Four batches of bilirubin-imprinted nanofilm-attached QCM sensors were prepared during different periods of time. Reproducibility studies for each different batch of bilirubin-imprinted QCM sensor responses was evaluated for the same bilirubin concentration (1 µg/mL) and responses were reported as Δf (Hz) values, as shown in Supplementary Figure S4.

4. Conclusions

In the present work, we have developed a specific non-enzymatic bilirubin detection method through a bilirubin-imprinted PHEMATrp polymeric film–attached QCM nanosensor for the potential diagnosis application in hyperbilirubinemia, a condition with an increased concentration of bilirubin in the blood which is a potential cause of permanent brain damage or even death in newborn babies. The QCM nanosensor was prepared by the modification of the QCM sensor’s gold surface with the bilirubin-imprinted PHEMATrp nanofilm. The bilirubin-imprinted PHEMATrp-based nanosensor has been successfully used for real-time bilirubin detection both from aqueous solutions and healthy blood serum samples by the QCM method. The detection and quantitation limit values were found as 0.45 μg/mL and 0.9 μg/mL, respectively, for the aqueous bilirubin solution.

Supplementary Materials

The following are available online at www.mdpi.com/2227-9040/4/4/21/s1.

Acknowledgments

This study was financially supported by the Hacettepe University Scientific Research Coordination Unit and was assigned project number 014 D04 601 001-547.

Author Contributions

Experiment details were conceived and designed by H.Y. and A.D.; all the experiments were performed thoroughly by Ç.Ç.; Data analysis was carried out by F.Y., H.Y., E.Ö. and A.D.; H.Y. contributed reagents/materials/analysis tools; all contributors wrote the paper. Authorship must be limited to those who have contributed substantially to the work reported.

Conflicts of Interest

All authors declare that there are no conflicts of interest and also there is no role of the funding sponsors in the design of the study; in the collection, analyses or interpretation of data; in the writing of the manuscript, or in the decision to publish the results.

Abbreviations

The following abbreviations are used in the manuscript:
QCMQuartz Crystal Microbalance
MIPMolecular imprinted polymer
NIPNon-imprinted polymer
CAContact angle measurements (CA)
LODLimit of detection
LOQLimit of quantitation
AFMAtomic Force Microscopy
UV-VISUltraviolet–Visible spectrophotometer

References

  1. Barañano, D.E.; Rao, M.; Ferris, C.D.; Snyder, S.H. Biliverdin reductase: A major physiologic cytoprotectant. Proc. Natl. Acad. Sci. USA 2002, 99, 16093–16098. [Google Scholar] [CrossRef] [PubMed]
  2. Santhosh, M.; Chinnadayyala, S.R.; Kakoti, A.; Goswami, P. Selective and sensitive detection of free bilirubin in blood serum using human serum albumin stabilized gold nanoclusters as fluorometric and colorimetric probe. Biosens. Bioelectron. 2014, 59, 370–376. [Google Scholar] [CrossRef] [PubMed]
  3. Fevery, J. Bilirubin in clinical practice: A review. Liver Int. 2008, 28, 592–605. [Google Scholar] [CrossRef] [PubMed]
  4. Gazzin, S.; Strazielle, N.; Tiribelli, C.; Ghersi-Egea, J.G. Transport and metabolism at blood-brain interfaces and in neural cells: Relevance to bilirubin-induced encephalopathy. Front Pharm. 2012, 3, 10–13. [Google Scholar] [CrossRef] [PubMed]
  5. Tiribelli, C.; Ostrow, J.D. The molecular basis of bilirubin encephalopathy and toxicity: Report of an EASL Single Topic Conference Trieste, Italy, 1–2 October 2004. J. Hepatol. 2005, 143, 156–166. [Google Scholar] [CrossRef] [PubMed]
  6. Cotler, S.J.; Taylor, S.L.; Gretch, D.R.; Bronner, M.P.; Rizk, R.; Perkins, J.D.; Carithers, R.L. Hyperbilirubinemia and cholestatic liver injury in hepatitis C-infected liver transplant recipients. Am. J. Gastroenterol. 2000, 95, 753–759. [Google Scholar] [CrossRef] [PubMed]
  7. Lauer, B.J.; Spector, N.D. Hyperbilirubinemia in the newborn. Pediatr. Rev. 2011, 32, 341–349. [Google Scholar] [CrossRef] [PubMed]
  8. Baydemir, G.; Bereli, N.; Andaç, M.; Say, R.; Galaev, I.Y.; Denizli, A. Supermacroporous poly(hydroxyethyl methacrylate) based cryogel with embedded bilirubin imprinted particles. React. Funct. Polym. 2009, 69, 36–42. [Google Scholar] [CrossRef]
  9. Perçin, I.; Baydemir, G.; Ergün, B.; Denizli, A. Macroporous PHEMA-based cryogel discs for bilirubin removal. Artif. Cells Nanomed. Biotechnol. 2013, 41, 172–177. [Google Scholar] [CrossRef] [PubMed]
  10. De Corso, E.; Baroni, S.; Agostino, S.; Cammarota, G.; Mascagna, G.; Mannocci, A.; Rigante, M.; Galli, J. Bile acids and total bilirubin detection in saliva of patients submitted to gastric surgery and in particular to subtotal billroth II resection. Ann. Surg. 2007, 245, 880–885. [Google Scholar] [CrossRef] [PubMed]
  11. Chalmers, A.H.; Kiley, M. Detection of xantochromia in cerebrospinal fluid. Clin. Chem. 1998, 44, 1740–1742. [Google Scholar] [PubMed]
  12. Randeberg, L.L.; Roll, E.B.; Nilsen, L.T.; Christensen, T.; Svaasand, L.O. In vivo spectroscopy of jaundiced newborn skin reveals more than a bilirubin index. Acta Paediatr. 2005, 94, 65–71. [Google Scholar] [CrossRef] [PubMed]
  13. Kamruzzaman, M.; Alam, A.; Lee, S.H.; Kim, Y.H.; Kim, G.; Oh, S.H. Spectrofluorimetric quantification of bilirubin using yttrium–norfloxacin complex as a fluorescence probe in serum samples. J. Lumin. 2012, 132, 3053–3057. [Google Scholar] [CrossRef]
  14. Wu, N.; Sweedler, J.V.; Lin, M. Enhanced separation and detection of serum bilirubin species by capillary electrophoresis using a mixed anionic surfactant—Protein buffer system with laser-induced fluorescence detection. J. Chromatogr. B Biomed. Sci. Appl. 1994, 654, 185–191. [Google Scholar] [CrossRef]
  15. Wang, C.; Wang, G.; Fang, B. Electrocatalytic oxidation of bilirubin at ferrocenecarboxamide modified MWCNT–gold nanocomposite electrodes. Microchim. Acta 2009, 164, 113–118. [Google Scholar] [CrossRef]
  16. Rahman, M.A.; Lee, K.S.; Park, D.S.; Won, M.S.; Shim, Y.B. An amperometric bilirubin biosensor based on a conductive poly-terthiophene–Mn (II) complex. Biosens. Bioelectron. 2008, 23, 857–864. [Google Scholar] [CrossRef] [PubMed]
  17. Wu, A.H.; Syu, M.J. Synthesis of bilirubin imprinted polymer thin film for the continuous detection of bilirubin in an MIP/QCM/FIA system. Biosens. Bioelectron. 2006, 21, 2345–2353. [Google Scholar] [CrossRef] [PubMed]
  18. Speight, R.E.; Cooper, M.A. A survey of the 2010 quartz crystal microbalance literature. J. Mol. Recognit. 2012, 25, 451–473. [Google Scholar] [CrossRef] [PubMed]
  19. Yilmaz, E.; Majidi, D.; Ozgur, E.; Denizli, A. Whole cell imprinting based Escherichia coli sensors: A study for SPR and QCM. Sens. Actuators B Chem. 2015, 209, 714–721. [Google Scholar] [CrossRef]
  20. Schirhagl, R.; Latif, U.; Podlipna, D.; Blumenstock, H.; Dickert, F.L. Natural and Biomimetic Materials for the Detection of Insulin. Anal. Chem. 2012, 84, 3908–3913. [Google Scholar] [CrossRef] [PubMed]
  21. Lieberzeit, P.A.; Glanznig, G.; Jenik, M.; Gazda-Miarecka, S.; Dickert, F.L.; Leidl, A. Soft lithography in Chemical Sensing-Analytes from Molecules to Cells. Sensors 2005, 5, 509–518. [Google Scholar] [CrossRef]
  22. Whitcombe, M.J.; Chianella, I.; Larcombe, I.; Piletsky, S.A.; Noble, J.; Porter, R.; Horgan, A. The rational development of molecularly imprinted poymer-based sensors for protein detection. Chem. Soc. Rev. 2011, 40, 1547–1571. [Google Scholar] [CrossRef] [PubMed]
  23. Sener, G.; Ozgur, E.; Yilmaz, E.; Uzun, L.; Say, R.; Denizli, A. Quartz crystal microbalance based nanosensor for lysozyme detection with lysozyme imprinted nanoparticles. Biosens. Bioelectron. 2010, 26, 815–821. [Google Scholar] [CrossRef] [PubMed]
  24. Cornelioa, V.E.; Pedrosoa, M.M.; Afonsoa, A.S.; Fernandesa, J.B.; Silvaa, M.F.G.F.; Fariaa, R.C.; Vieiraa, P.C. New approach for natural products screening by real-time monitoring of hemoglobin hydrolysis using quartz crystal microbalance. Anal. Chim. Acta 2015, 862, 86–93. [Google Scholar] [CrossRef] [PubMed]
  25. Baydemir, G.; Andaç, M.; Bereli, N.; Say, R.; Denizli, A. Selective removal of bilirubin from human plasma with bilirubin-imprinted particles. Ind. Eng. Chem. Res. 2007, 46, 2843–2852. [Google Scholar] [CrossRef]
  26. Baydemir, G.; Bereli, N.; Andaç, M.; Say, R.; Galaev, I.Y.; Denizli, A. Bilirubin recognition via molecularly imprinted supermacroporous cryogels. Colloids Surf. B Biointerfaces 2008, 68, 33–38. [Google Scholar] [CrossRef] [PubMed]
  27. Bueno, L.; El-Sharif, H.F.; Salles, M.O.; Boehm, R.D.; Narayan, R.J.; Paixão, T.R.L.C.; Reddy, S.M. MIP-based electrochemical protein profiling. Sens. Actuators B Chem. 2014, 204, 88–95. [Google Scholar] [CrossRef]
  28. Guo, H.; Yuan, D.; Fu, G. Enhanced surface imprinting of lysozyme over a new kind of magnetic chitosan submicrospheres. J. Colloids Interface Sci. 2015, 440, 53–59. [Google Scholar] [CrossRef] [PubMed]
  29. Li, Y.; Yang, H.H.; You, Q.H.; Zhuang, Z.X.; Wang, X.R. Protein Recognition via Surface Molecularly Imprinted Polymer Nanowires. Anal. Chem. 2006, 78, 317–320. [Google Scholar] [CrossRef] [PubMed]
  30. Lv, Y.; Tan, T.; Svec, F. Molecular imprinting of proteins in polymers attached to the surface of nanomaterials for selective recognition of biomacromolecules. Biotechnol. Adv. 2013, 31, 1172–1186. [Google Scholar] [CrossRef] [PubMed]
  31. Mecea, V.M. From Quartz Crystal Microbalance to Fundamental Principles of Mass Measurements. Anal. Lett. 2005, 38, 753–767. [Google Scholar] [CrossRef]
  32. Zelenka, J.; Lenicek, M.; Muchova, L.; Jirsa, M.; Kudla, M.; Balaz, P.; Zadinova, M.; Ostrow, J.D.; Wong, R.J.; Vitek, L. Highly sensitive method for quantitative determination of bilirubin in biological fluids and tissues. J. Chromatogr. B 2008, 867, 37–42. [Google Scholar] [CrossRef] [PubMed]
  33. Margon, A.; Terdoslavich, M.; Cocolo, A.; Decorti, G.; Passamonti, S.; Franko, M. Determination of bilirubin by thermal lens spectrometry and studies of its transport into hepatic cells. J. Phys. I Fr. 2005, 125, 717–720. [Google Scholar] [CrossRef]
  34. Batra, B.; Lata, S.; Rana, J.S.; Pundir, C.S. Construction of an amperometric bilirubin biosensor based on covalent immobilization of bilirubin oxidase onto zirconia coated silica nanoparticles/chitosan hybrid film. Biosens. Bioelectron. 2013, 44, 64–69. [Google Scholar] [CrossRef] [PubMed]
  35. Martelanc, M.; Žiberna, L.; Passamonti, S.; Franko, M. Direct determination of free bilirubin in serum at sub-nanomolar levels. Anal. Chim. Acta 2014, 809, 174–182. [Google Scholar] [CrossRef] [PubMed]
  36. Feng, Q.; Du, Y.; Zhang, C.; Zheng, Z.; Hu, F.; Wang, Z.; Wang, C. Synthesis of the multi-walled carbon nanotubes-COOH/graphene/gold nanoparticles nanocomposite for simple determination of Bilirubin in human blood serum. Sens. Actuators B Chem. 2013, 185, 337–344. [Google Scholar] [CrossRef]
  37. Yang, Y.; Long, Y.; Cao, Q.; Li, K.; Liu, F. Molecularly imprinted polymer using- cyclodextrin as functional monomer for the efficient recognition of bilirubin. Anal. Chim. Acta 2008, 606, 92–97. [Google Scholar] [CrossRef] [PubMed]
  38. Yang, Z.; Shang, X.; Zhang, C.; Zhu, J. Photoelectrochemical bilirubin biosensor based on Fe3O4/hydroxyapatite/molecularly imprinted polypyrrole nanoparticles. Sens. Actuators B Chem. 2014, 201, 167–217. [Google Scholar] [CrossRef]
  39. Moein, M.M.; Jabbar, D.; Colmsjö, A.; Abdel-Rehim, M. A needle extraction utilizing a molecularly imprinted-sol-gel xerogel for on-line microextraction of the lung cancer biomarker bilirubin from plasma and urine samples. J. Chromatogr. A 2014, 1366, 15–23. [Google Scholar] [CrossRef] [PubMed]
  40. Yang, Z.; Zhang, C. Molecularly imprinted hydroxyapatite thin film for bilirubin recognition. Biosens. Bioelectron. 2011, 29, 167–171. [Google Scholar] [CrossRef] [PubMed]
  41. Yang, Z.; Yan, J.; Zhang, C. Piezoelectric detection of bilirubin based on bilirubin-imprinted titania film electrode. Anal. Biochem. 2012, 421, 37–42. [Google Scholar] [CrossRef] [PubMed]
  42. Syu, M.J.; Chiu, T.C.; Lai, C.Y.; Chang, Y.S. Amperometric detection of bilirubin from a micro-sensing electrode with a synthetic bilirubin imprinted poly(MAA-co-EGDMA) film. Biosens. Bioelectron. 2006, 22, 550–557. [Google Scholar] [CrossRef] [PubMed]
  43. Syu, M.J.; Nian, Y.M. An allosteric model for the binding of bilirubin to the bilirubin imprinted poly(methacrylic acid-co-ethylene glycol dimethylacrylate). Anal. Chim. Acta 2005, 539, 97–106. [Google Scholar] [CrossRef]
  44. Syu, M.J.; Deng, J.H.; Nian, Y.M.; Chiu, T.C.; Wu, A.H. Binding specificity of a-bilirubin-imprinted poly(methacrylic acid-co-ethylene glycol dimethylacrylate) toward a-bilirubin. Biomaterials 2005, 26, 4684–4692. [Google Scholar] [CrossRef] [PubMed]
  45. Chutipongtanate, S.; Thongboonkerd, V. Systematic comparisons of artificial urine formulas for in vitro cellular study. Anal. Biochem. 2010, 402, 110–112. [Google Scholar] [CrossRef] [PubMed]
Figure 1. Absorbance spectra of bilirubin solution.
Chemosensors 04 00021 g001
Figure 2. Schematic representation of PHEMATrp polymeric film.
Chemosensors 04 00021 g002
Figure 3. Surface morphology, (a) unmodified (bare) QCM; and (b) MIP-QCM by AFM in dynamic mode.
Chemosensors 04 00021 g003
Figure 4. Real-time response of QCM sensor against aqueous solutions of bilirubin of 25 µg/mL and (a) the change of ∆f with time; (b) the change of mass with time.
Chemosensors 04 00021 g004
Figure 5. Linearity of QCM sensors for aqueous bilirubin solutions at a concentration range 1.71–85.51 µM, (a) ∆f versus CBilirubin; (b) mass versus CBilirubin.
Chemosensors 04 00021 g005
Scheme 1. Molecular structures of cholesterol, estradiol, biliverdin and bilirubin.
Chemosensors 04 00021 sch001
Figure 6. Reusability of bilirubin-imprinted QCM sensor response; concentration of bilirubin: 1 µg/mL; buffer; pH: 11 carbonate buffer.
Chemosensors 04 00021 g006
Table 1. The contact angle values.
SurfacesContact Angle Values °
Unmodified (bare) QCM85.4 ± 0.13
MIP-QCM77.1 ± 0.10
NIP-QCM75.3 ± 0.15
Table 2. Comparison of various bilirubin detection methods.
Target MoleculeMethodologyLODReferences
Unconjugated bilirubinHPLC-DAD10 nM[32]
BilirubinSpecific spectrofluorimetric4.8 nM[14]
BilirubinTLS detection in a batch mode2 nM[33]
BilirubinAmperometric biosensor100 pM[34]
Unconjugated bilirubinHPLC-TLS90 pM[35]
BilirubinCarbon nanotubes COOH/graphene/gold nanoparticles0.34 µM[36]
BilirubinUV-VIS spectrophotometer0.8 µM[37]
BilirubinPhotoelectrochemical imprinted biosensor0.007 μM[38]
BilirubinImprinted sol-gel xerogel1.6 nM[39]
BilirubinMolecularly imprinted film0.01 μM[40]
BilirubinPiezoelectric imprinted film0.05 μM[41]
BilirubinAmperometric0.644 A/mg/dL[42]
BilirubinMolecularly imprinted polymer-[43]
BilirubinMolecularly imprinted polymer-[44]
BilirubinImprinted PHEMATrp film-QCM0.8 μM-
BilirubinImprinted 4-vinylpyridine (4-Vpy)/DVB-QCM-[18]
Table 3. Selectivity coefficients for the bilirubin-imprinted QCM sensor.
MIPNIP
ΔmkΔmkk’
Bilirubin0.479-0.060--
Biliverdin0.2182.190.1150.524.21
Cholesterol0.1523.150.0690.863.66
Estradiol0.0815.920.0552.852.07

