Article

A Voltammetric Sensor Based on Chemically Reduced Graphene Oxide-Modified Screen-Printed Carbon Electrode for the Simultaneous Analysis of Uric Acid, Ascorbic Acid and Dopamine

School of Engineering, Ulster University, Jordanstown BT37 0QB, United Kingdom
*
Author to whom correspondence should be addressed.
Chemosensors 2016, 4(4), 25; https://doi.org/10.3390/chemosensors4040025
Submission received: 28 November 2016 / Revised: 14 December 2016 / Accepted: 17 December 2016 / Published: 20 December 2016

Abstract

:
A disposable screen-printed carbon electrode (SPCE) modified with chemically reduced graphene oxide (rGO) (rGO-SPCE) is described. The rGO-SPCE was characterized by UV-Vis and electrochemical impedance spectroscopy, and cyclic voltammetry. The electrode displays excellent electrocatalytic activity towards uric acid (UA), ascorbic acid (AA) and dopamine (DA). Three resolved voltammetric peaks (at 183 mV for UA, 273 mV for AA and 317 mV for DA, all vs. Ag/AgCl) were found. Differential pulse voltammetry was used to simultaneously detect UA, AA and DA in their ternary mixtures. The linear working range extends from 10 to 3000 μM for UA; 0.1 to 2.5 μM, and 5.0 to 2 × 10⁴ µM for AA; and 0.2 to 80.0 μM and 120.0 to 500 µM for DA, and the limits of detection (S/N = 3) are 0.1, 50.0, and 0.4 μM, respectively. The performance of the sensor was evaluated by analysing spiked human urine samples, and the recoveries were found to be well over 98.0% for the three compounds. These results indicate that the rGO-SPCE represents a sensitive analytical sensing tool for simultaneous analysis of UA, AA and DA.

1. Introduction

Uric acid (UA) is a principal end product of purine metabolism [1] and abnormal levels in urine and/or blood are symptomatic of diseases such as Lesch–Nyhan syndrome, gout and hyperuricemia, and renal and cardiovascular diseases [2]. Ascorbic acid (AA) is a water-soluble vitamin that has antioxidant properties and can be found in high concentrations in some plant foods [3]. AA is involved in many biological processes including improving immunity, cancer prevention, treating common cold, scurvy and mental illness, and free radical scavenging [4]. Dopamine (DA) is an essential neurotransmitter that forms part of the family of catecholamines. It plays vital roles in the normal functions of the renal, metabolic, hormonal, cardiovascular and central nervous systems [5,6]. High levels of DA in human bodily fluids have been found to be associated with several neurological disorders including Huntington’s disease, restless legs syndrome, schizophrenia, attention deficit hyperactivity disorder and Parkinson’s disease [7,8].
Several analytical methods such as high performance liquid chromatography, chemiluminescence, UV-Vis spectroscopy, capillary electrophoresis and electroanalytical methods [9,10,11] have been developed for the detection of these compounds. Owing to the electroactive nature of UA, AA and DA, and their coexistence in human bodily fluids such as urine, electrochemical method is considered most attractive for their simultaneous analysis because they are rapid, low-cost and sensitive. However, the main drawbacks associated with the use of traditional electrode materials for their simultaneous analysis are low reproducibility due to electrode fouling and poor selectivity arising from overlapping voltammetric peaks [12]. Electrodes modified with nanoparticles [13], ionic liquids [14], redox mediators [15], polymers and polymer composites [16], metal oxides [17], and carbon black, carbon nanotubes or fullerene [18] have been useful in solving these problems. However, there are still some drawbacks with regards to electrode complexity and inactivation, as well as stability of electrode modifiers/particles; thus, it is important to find suitable electrode materials that permit their selective determination.
In this study, reduced graphene oxide (rGO) was prepared through mild treatment of graphene oxide (GO) with sodium borohydride (NaBH4). The rGO dispersion then was casted onto the working area of an in-house fabricated screen-printed carbon electrode (SPCE) to form rGO-SPCE. The electrochemical behaviour of UA, AA and DA at rGO-SPCE was thoroughly investigated. The sensor was subsequently employed for the simultaneous analysis of the compounds in ternary mixtures in buffer. Details of the sensor fabrication, characterization and application to the analysis of the compounds are described and discussed.

2. Experimental

2.1. Apparatus and Reagents

Electrochemical experiments were conducted using VSP-300 Multichannel Potentiostat/Galvanostat/EIS (Bio-Logic Science Instruments, Seyssinet-Pariset, France) with a standard three-electrode configuration. Impedance measurements in K4[Fe(CN)6] was carried out at open circuit from frequency range of 200 kHz to 0.1 Hz. Under the optimized conditions, unless otherwise stated, DPVs were recorded with pulse amplitude of 50 mV, pulse time of 0.05 s, voltage step time of 0.5 s, voltage step of 5 mV and at 50 mV·s−1 scan rate. UV-Vis spectra were recorded using Jenway 6715 UV-Vis (Multi-cell changer) spectrophotometer (Bibby Scientific Ltd., Stone, UK). An Ag/AgCl (1.0 M KCl), SPCE or rGO-SPCE and a platinum wire were used as the reference, working and counter electrodes. Ascorbic acid and uric acid were purchased from Alfa Aesar, Heysham, UK. Graphene oxide (GO), dopamine hydrochloride, methanol, NaOH, NaBH4 and sodium carbonate (Na2CO3) were purchased from Sigma Aldrich, Irvine, UK. Urine samples were obtained from the authors and informed consent was obtained.

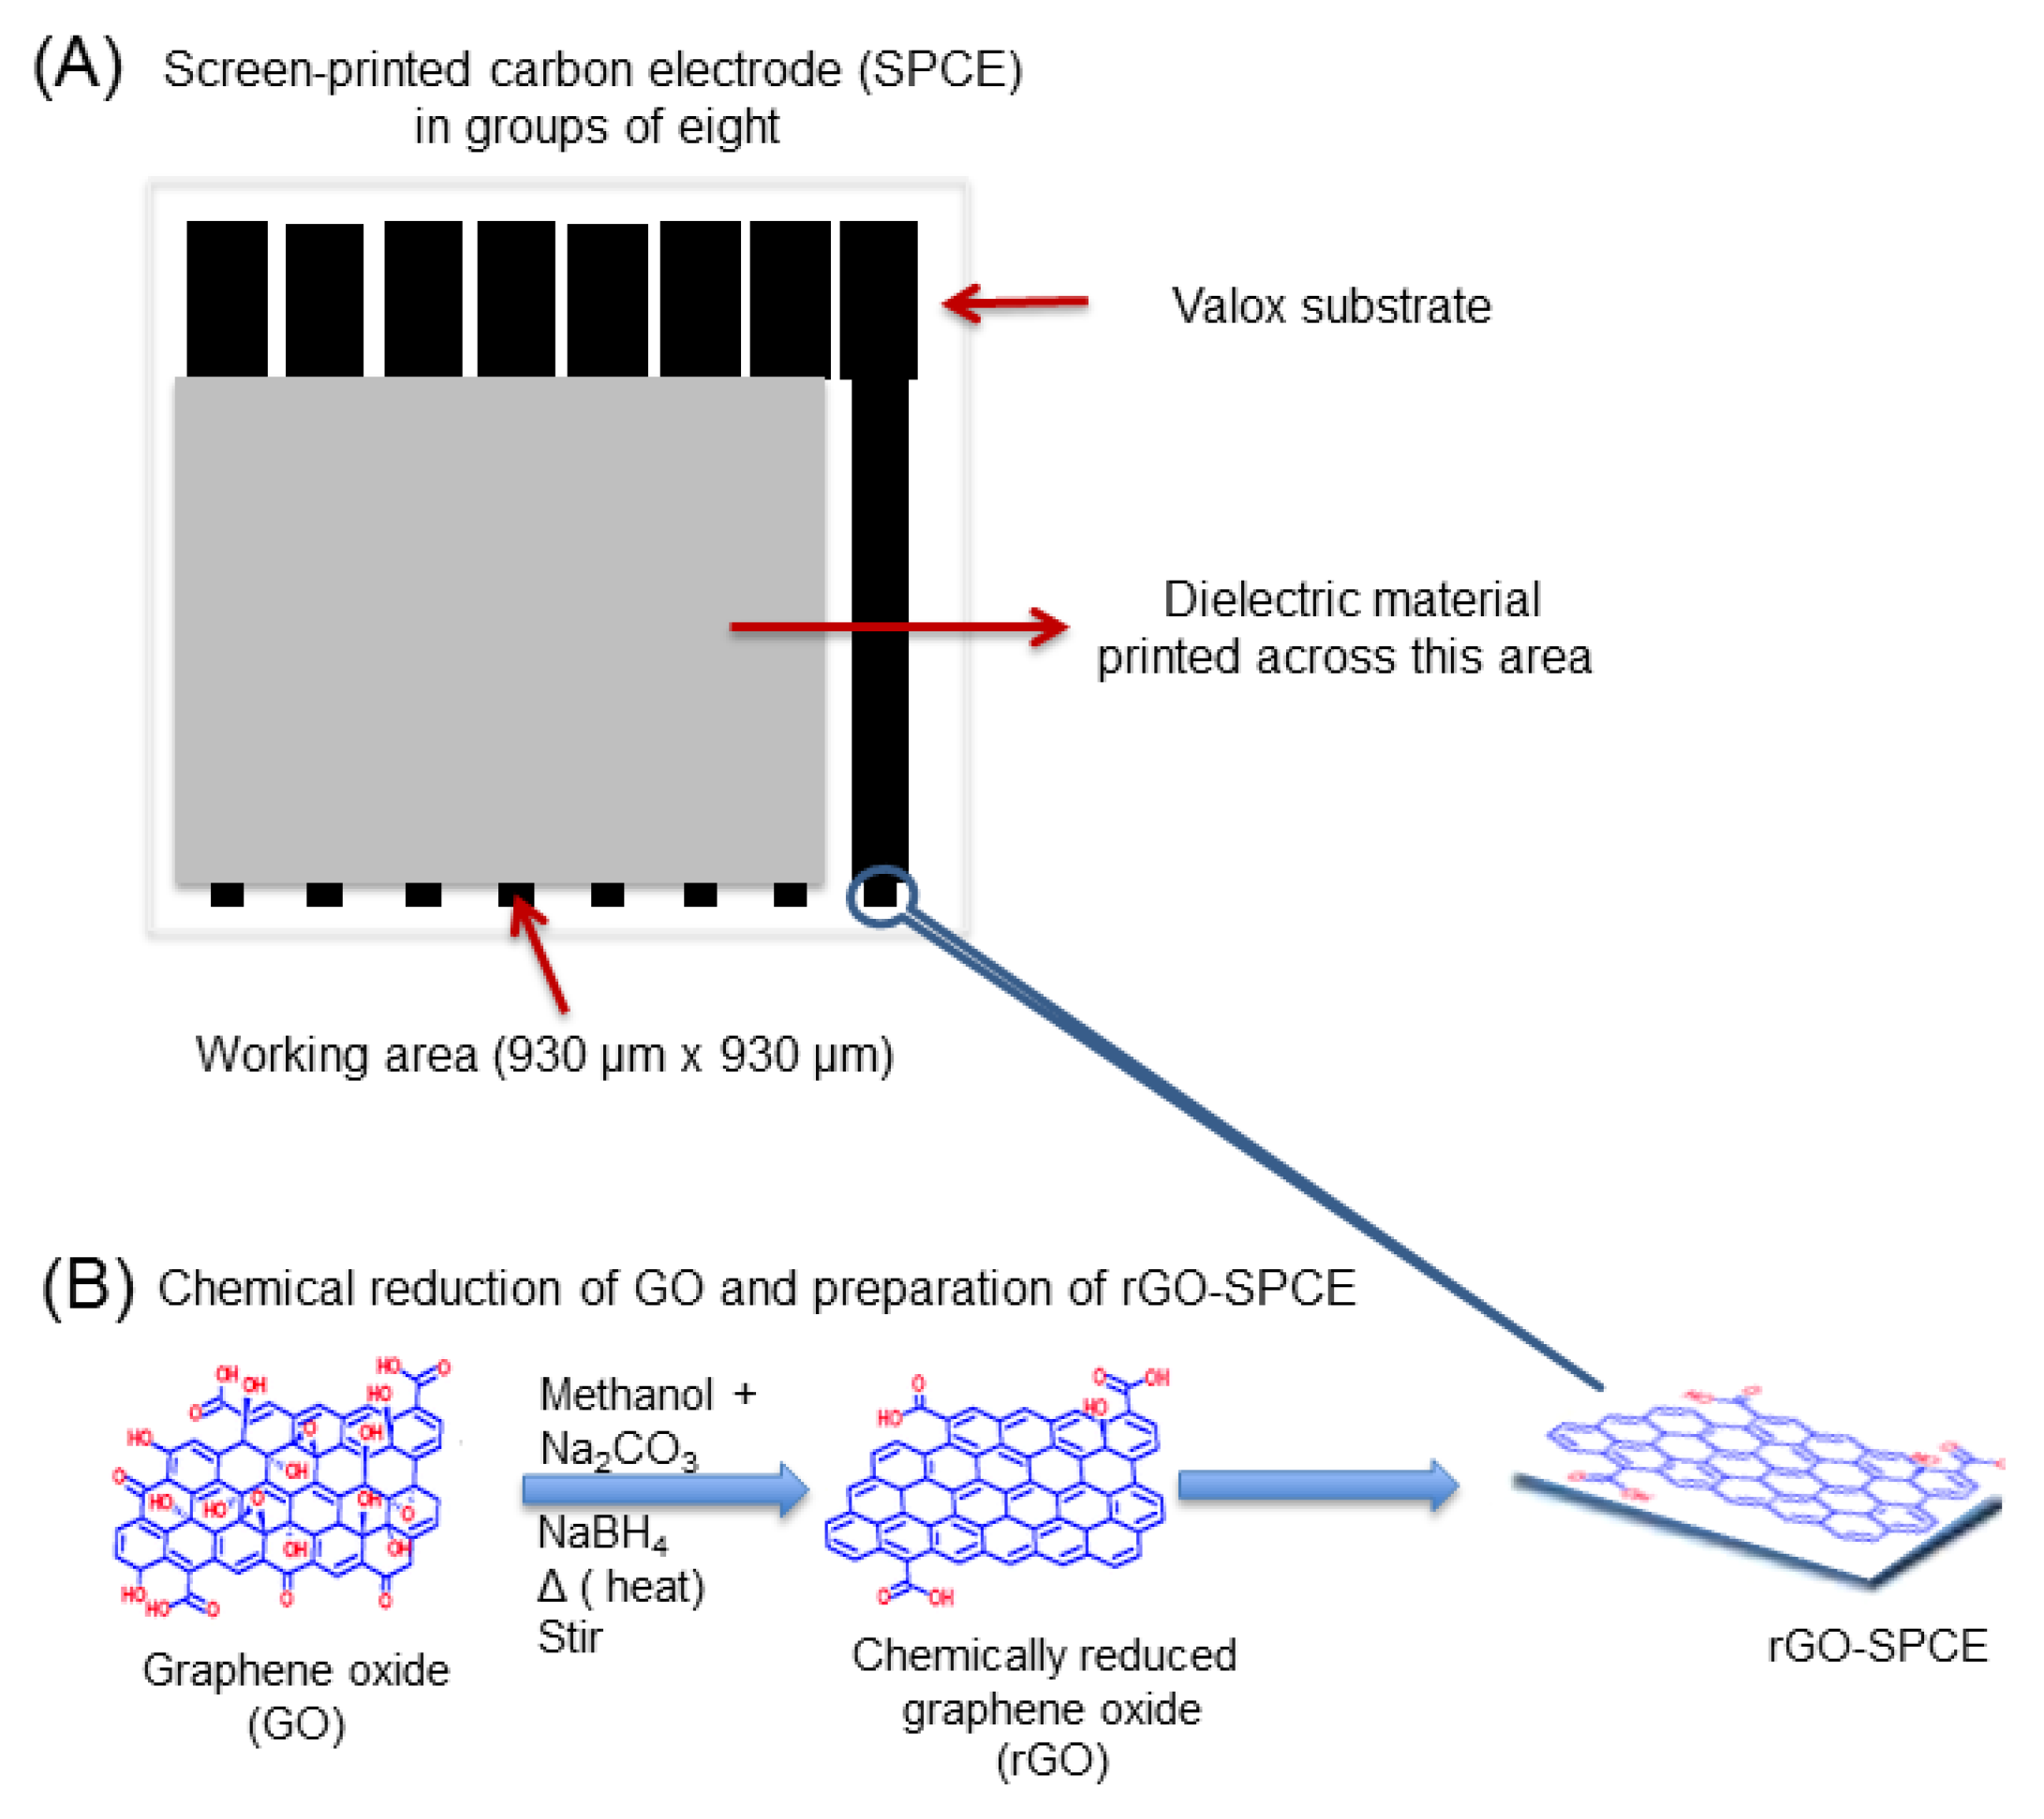
2.2. Preparation of rGO

The chemical reduction of GO was per the method reported by Chua and Pumera [19] with some modification. Briefly, to a dispersion of graphene oxide (6.0 mg) in methanol (2.5 mL) was added Na2CO3 (5.0 mM) to adjust the pH to ~8.5. Sodium borohydride (NaBH4, 28.4 mg) was then added into the resultant dispersion and stirred at 70 °C with refluxing for 5 hr. Upon completion, the mixture was repeatedly centrifuged (at 400 rpm, 15 min) and washed with methanol and water until a neutral pH of the filtrate was obtained. The filtrate (reduced graphene oxide, rGO) was then re-suspended in 2.0 mL of distilled water.

2.3. Fabrication of SPCE and rGO-SPCE

The fabrication of the unmodified SPCE transducer was prepared as previously described [20,21]. Briefly, the base unmodified SPCE transducer was printed onto a Valox substrate using DEK 240 Manual Screen Printing Machine, Stainless Steel Screen Mesh and graphite ink (GEM Product code: C205010697) and cured at 70 °C for 90 min. A polymeric dielectric material (GEM Product code: D2071120P1) was then screen-printed onto the cured SPCE to define the working area. Thereafter, 2.0 μL of rGO suspension in water was dropped onto the working area of the SPCE and allowed to air-dry in room temperature to form rGO-SPCE (Scheme 1). The rGO-SPCE was rinsed in distilled water to remove any unbound rGO and dried in N2.

3. Results and Discussion

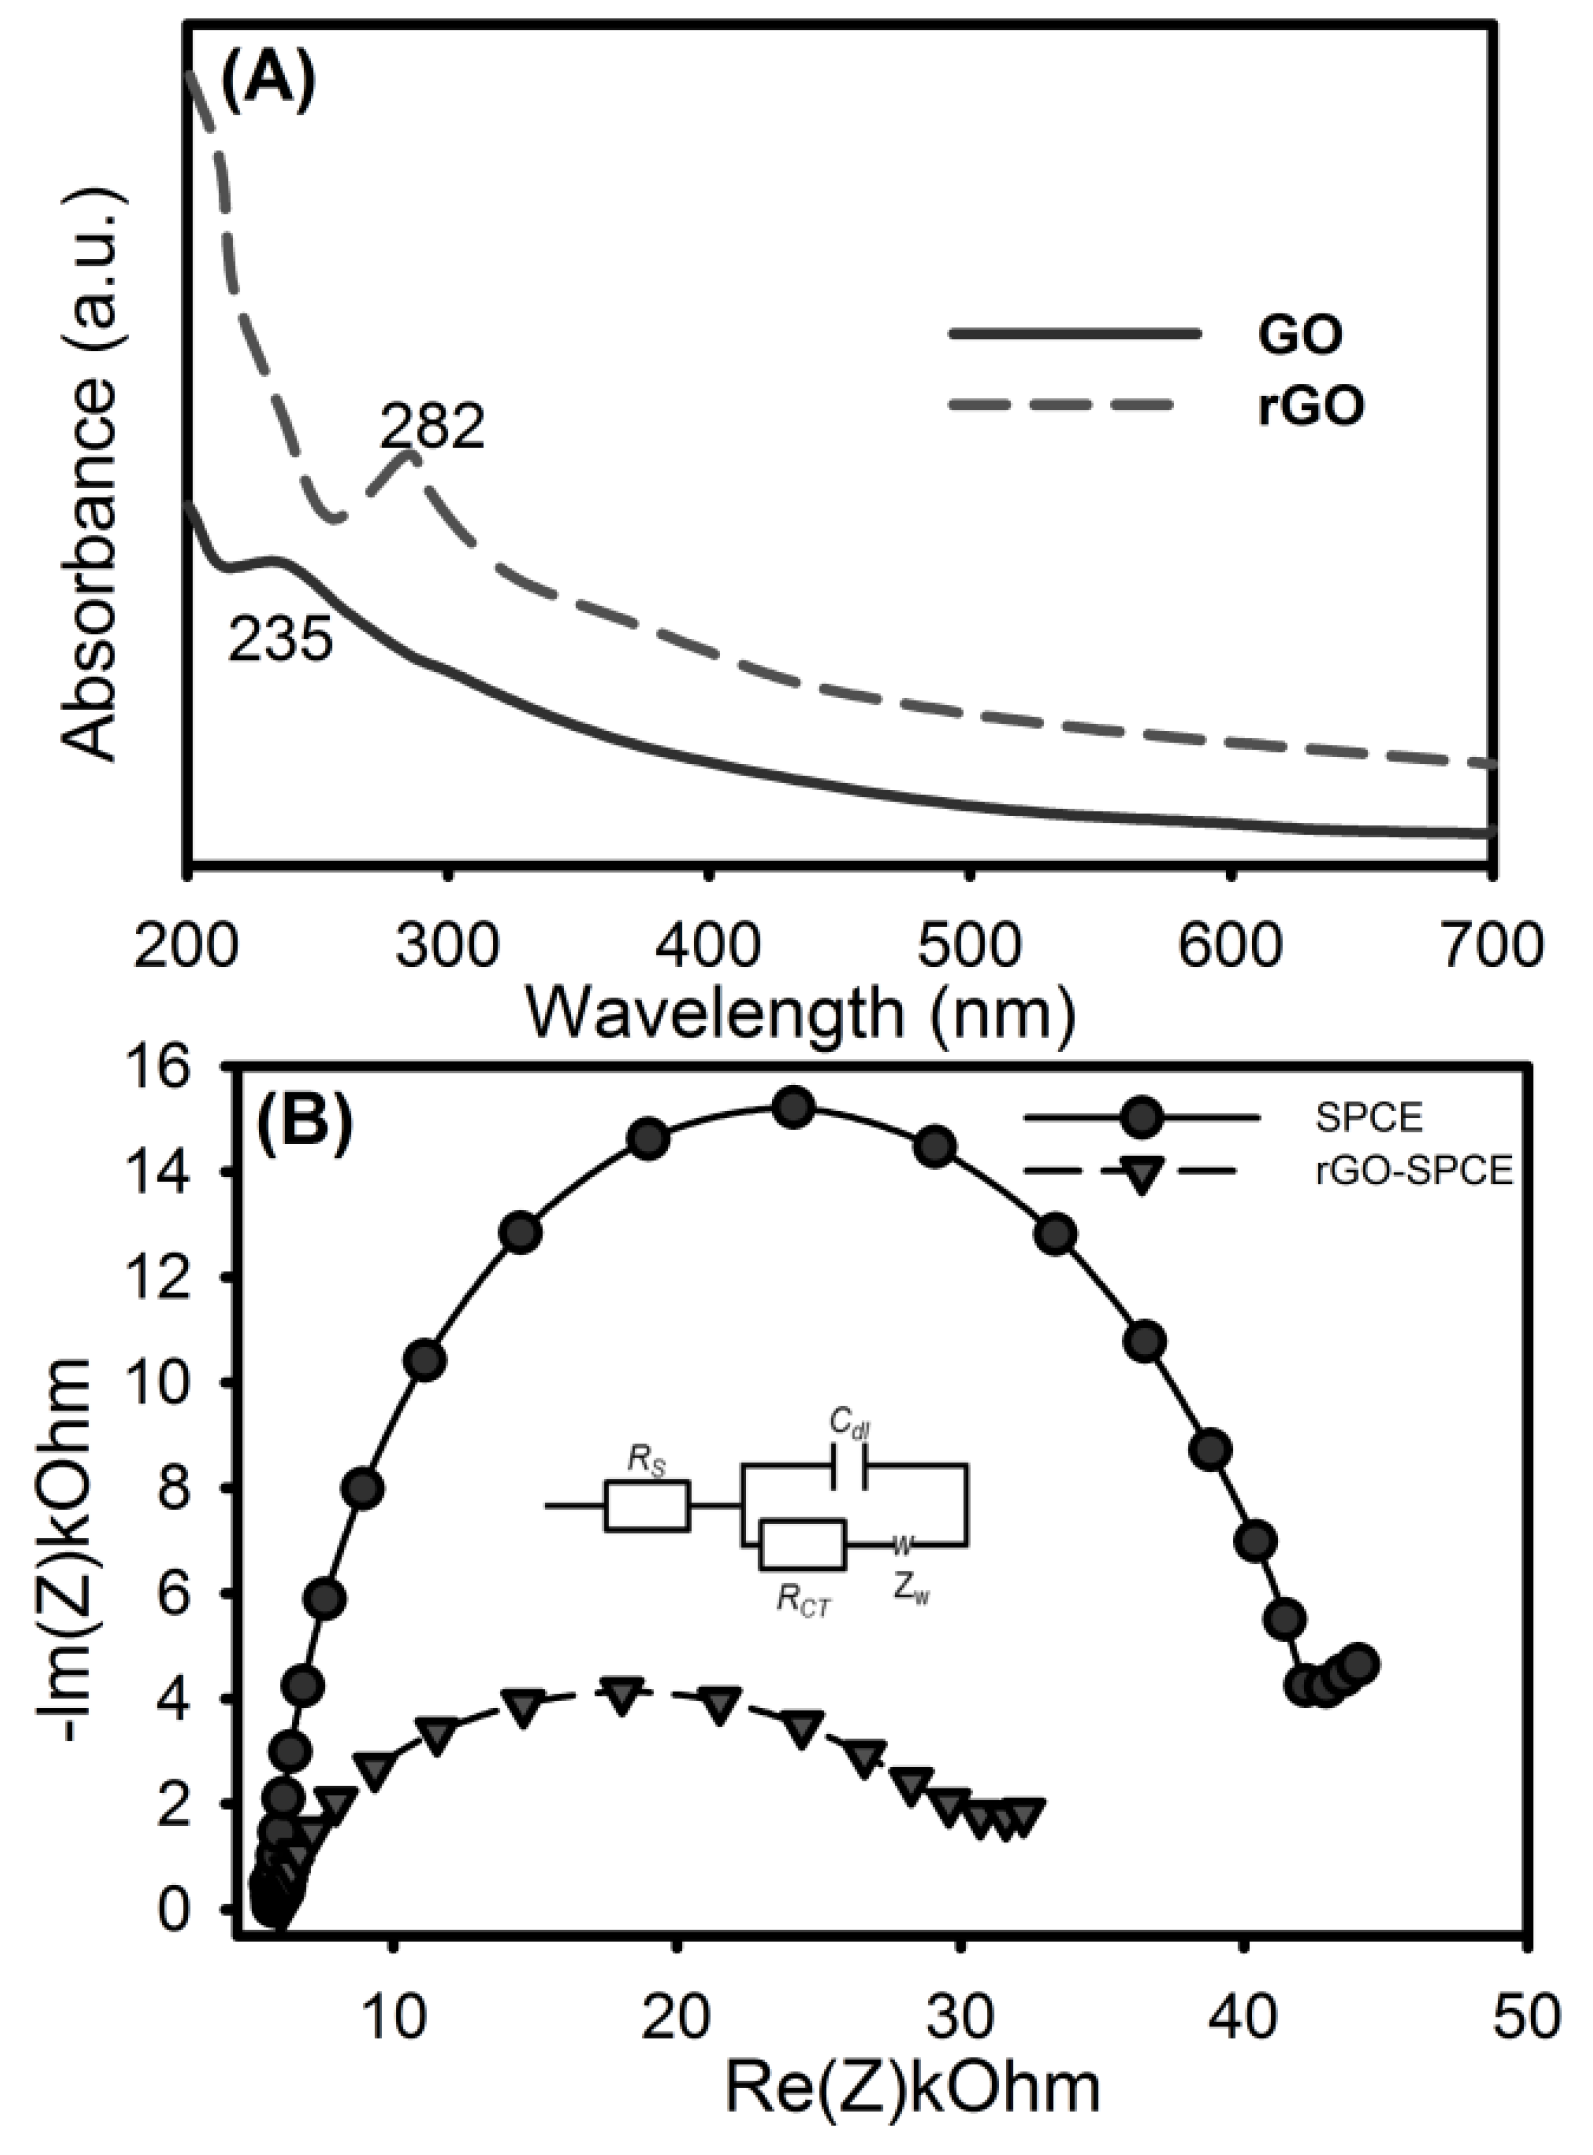
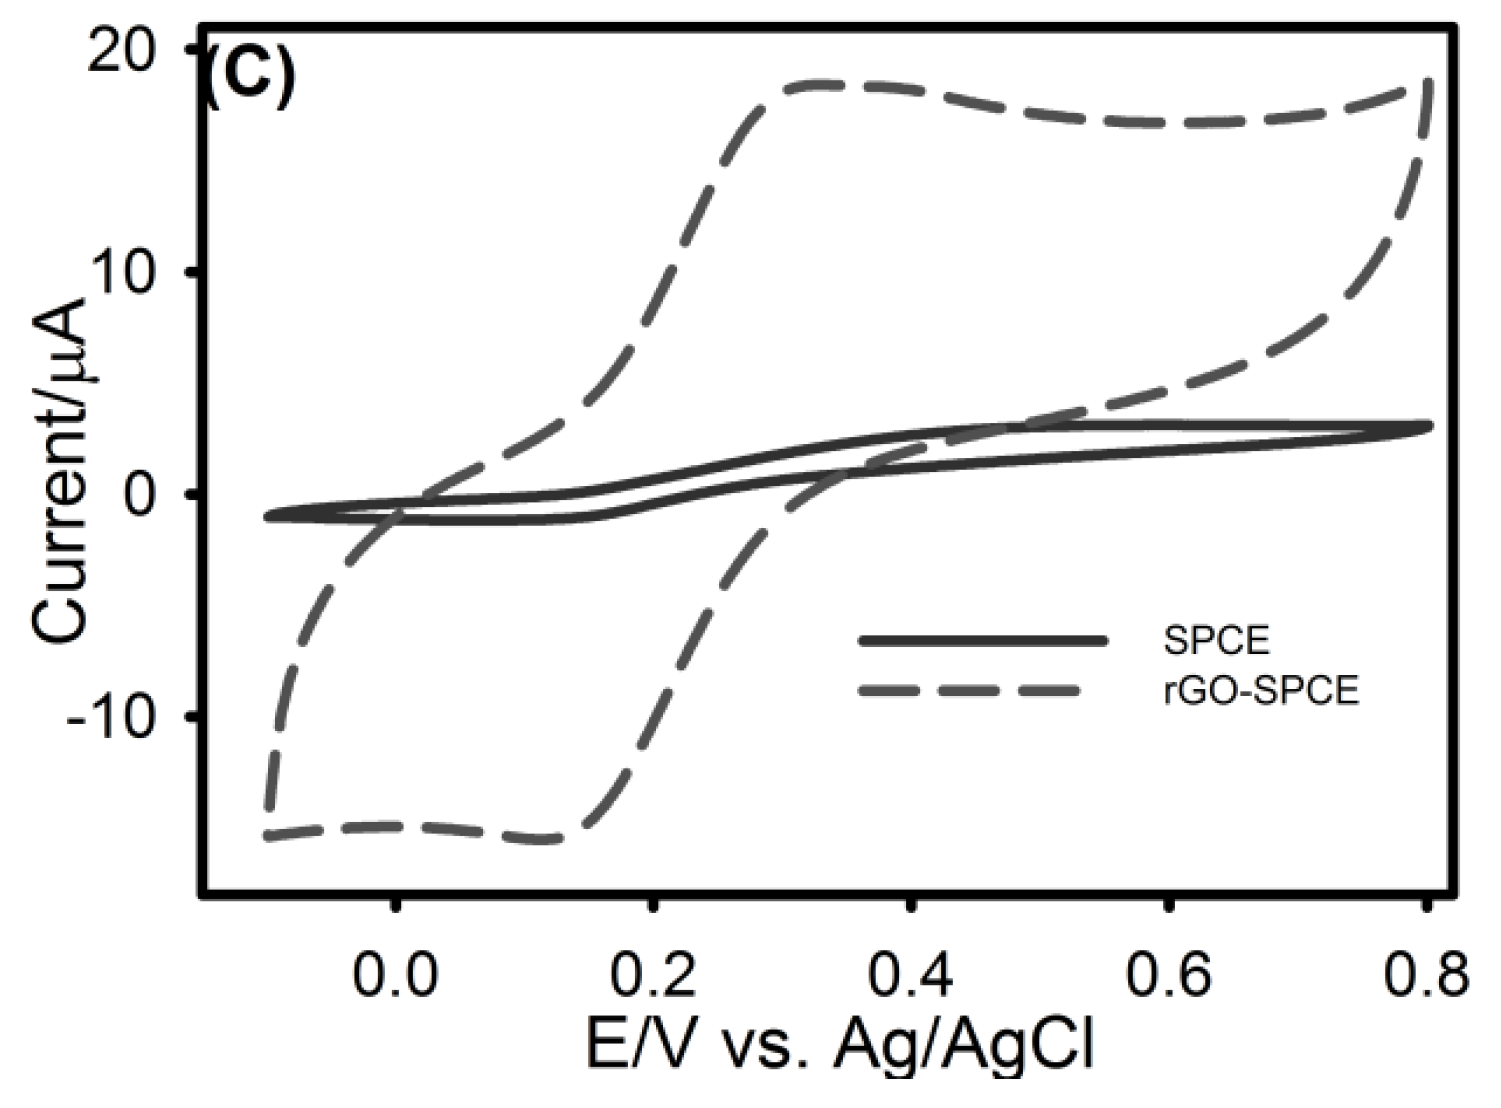
3.1. Characterization of rGO-SPCE

Both graphene oxide (GO) and reduced graphene oxide (rGO) possess unique set of electrical and optical properties that is different from pristine graphene because of the structural changes arising from the presence of oxygen functionalities within sp2 bonded carbon networks [17,22]. Analyses of GO and rGO were performed using UV-Vis spectroscopy (Figure 1A). The GO spectrum exhibits a characteristic absorption peak at 235 nm corresponding to the π→π* transition of the aromatic C=C bonds [22]. After chemical reduction with NaHB4, this peak shifts from 254 nm to 282 nm, and the intensity of absorption in the spectra region increased, indicating that the conjugated C=C bonds were restored by reduction [23]; thus, giving evidence that the GO has been reduced.
The electrochemical properties of SPCE and rGO-SPCE were examined using electrochemical impedance spectroscopy (EIS) and cyclic voltammetry. EIS is a versatile and sensitive technique for studying charge transfer processes occurring at electrode surfaces [24]. Figure 1B illustrates experimental Nyquist spectra recorded in K4[Fe(CN)6] solution using SPCE and rGO-SPCE including the equivalent Randles circuit used to extract the impedance circuit fitted data in Table 1. According to the Randles circuit, a semi-circle located at the higher frequency region, corresponds to the charge transfer resistance (RCT) of the electrode material. The SPCE showed RCT value of ~16 kΩ while rGO-SPCE had a reduced RCT value of ~5.0 kΩ. This shows that the charge transfer rate for [Fe(CN)6]3−/[Fe(CN)6]4− redox process increased upon employing rGO. From the obtained data (Table 1), it can be concluded that rGO-SPCE have higher electrocatalytic activity in comparison with the bare SPCE.
Cyclic voltammetry (CV) was also carried out as an independent method to verify the findings of the EIS. Figure 1C shows CVs of K4[Fe(CN)6] at SPCE and rGO-SPCE. In comparison to what occurred at SPCE, rGO-SPCE did not only exhibit well-defined redox peaks but also exhibited a characteristic increase of the anodic and cathodic peaks for [Fe(CN)6]3−/[Fe(CN)6]4− redox couple. Higher peak currents and a smaller peak-to-peak potential separation (ΔEp) at rGO-SPCE (Ipa = 18.5 μA, Ipc = 14.8 μA; ΔEp = ~140.0 mV) when compared with SPCE (Ipa = 2.9 μA, Ipc = 1.1 μA; ΔEp= ~500 mV) were observed. There were also slight shifts in both the anodic and cathodic peak potentials to less positive values, giving rise to a smaller peak-to-peak separation (ΔEp = 140.0 mV). This enhancement in electrocatalytic activity can be attributed to the electrocatalytic effect of rGO. Thus, the analysed CV data are in agreement with the results obtained from EIS and provides further evidence of the reduction of GO.

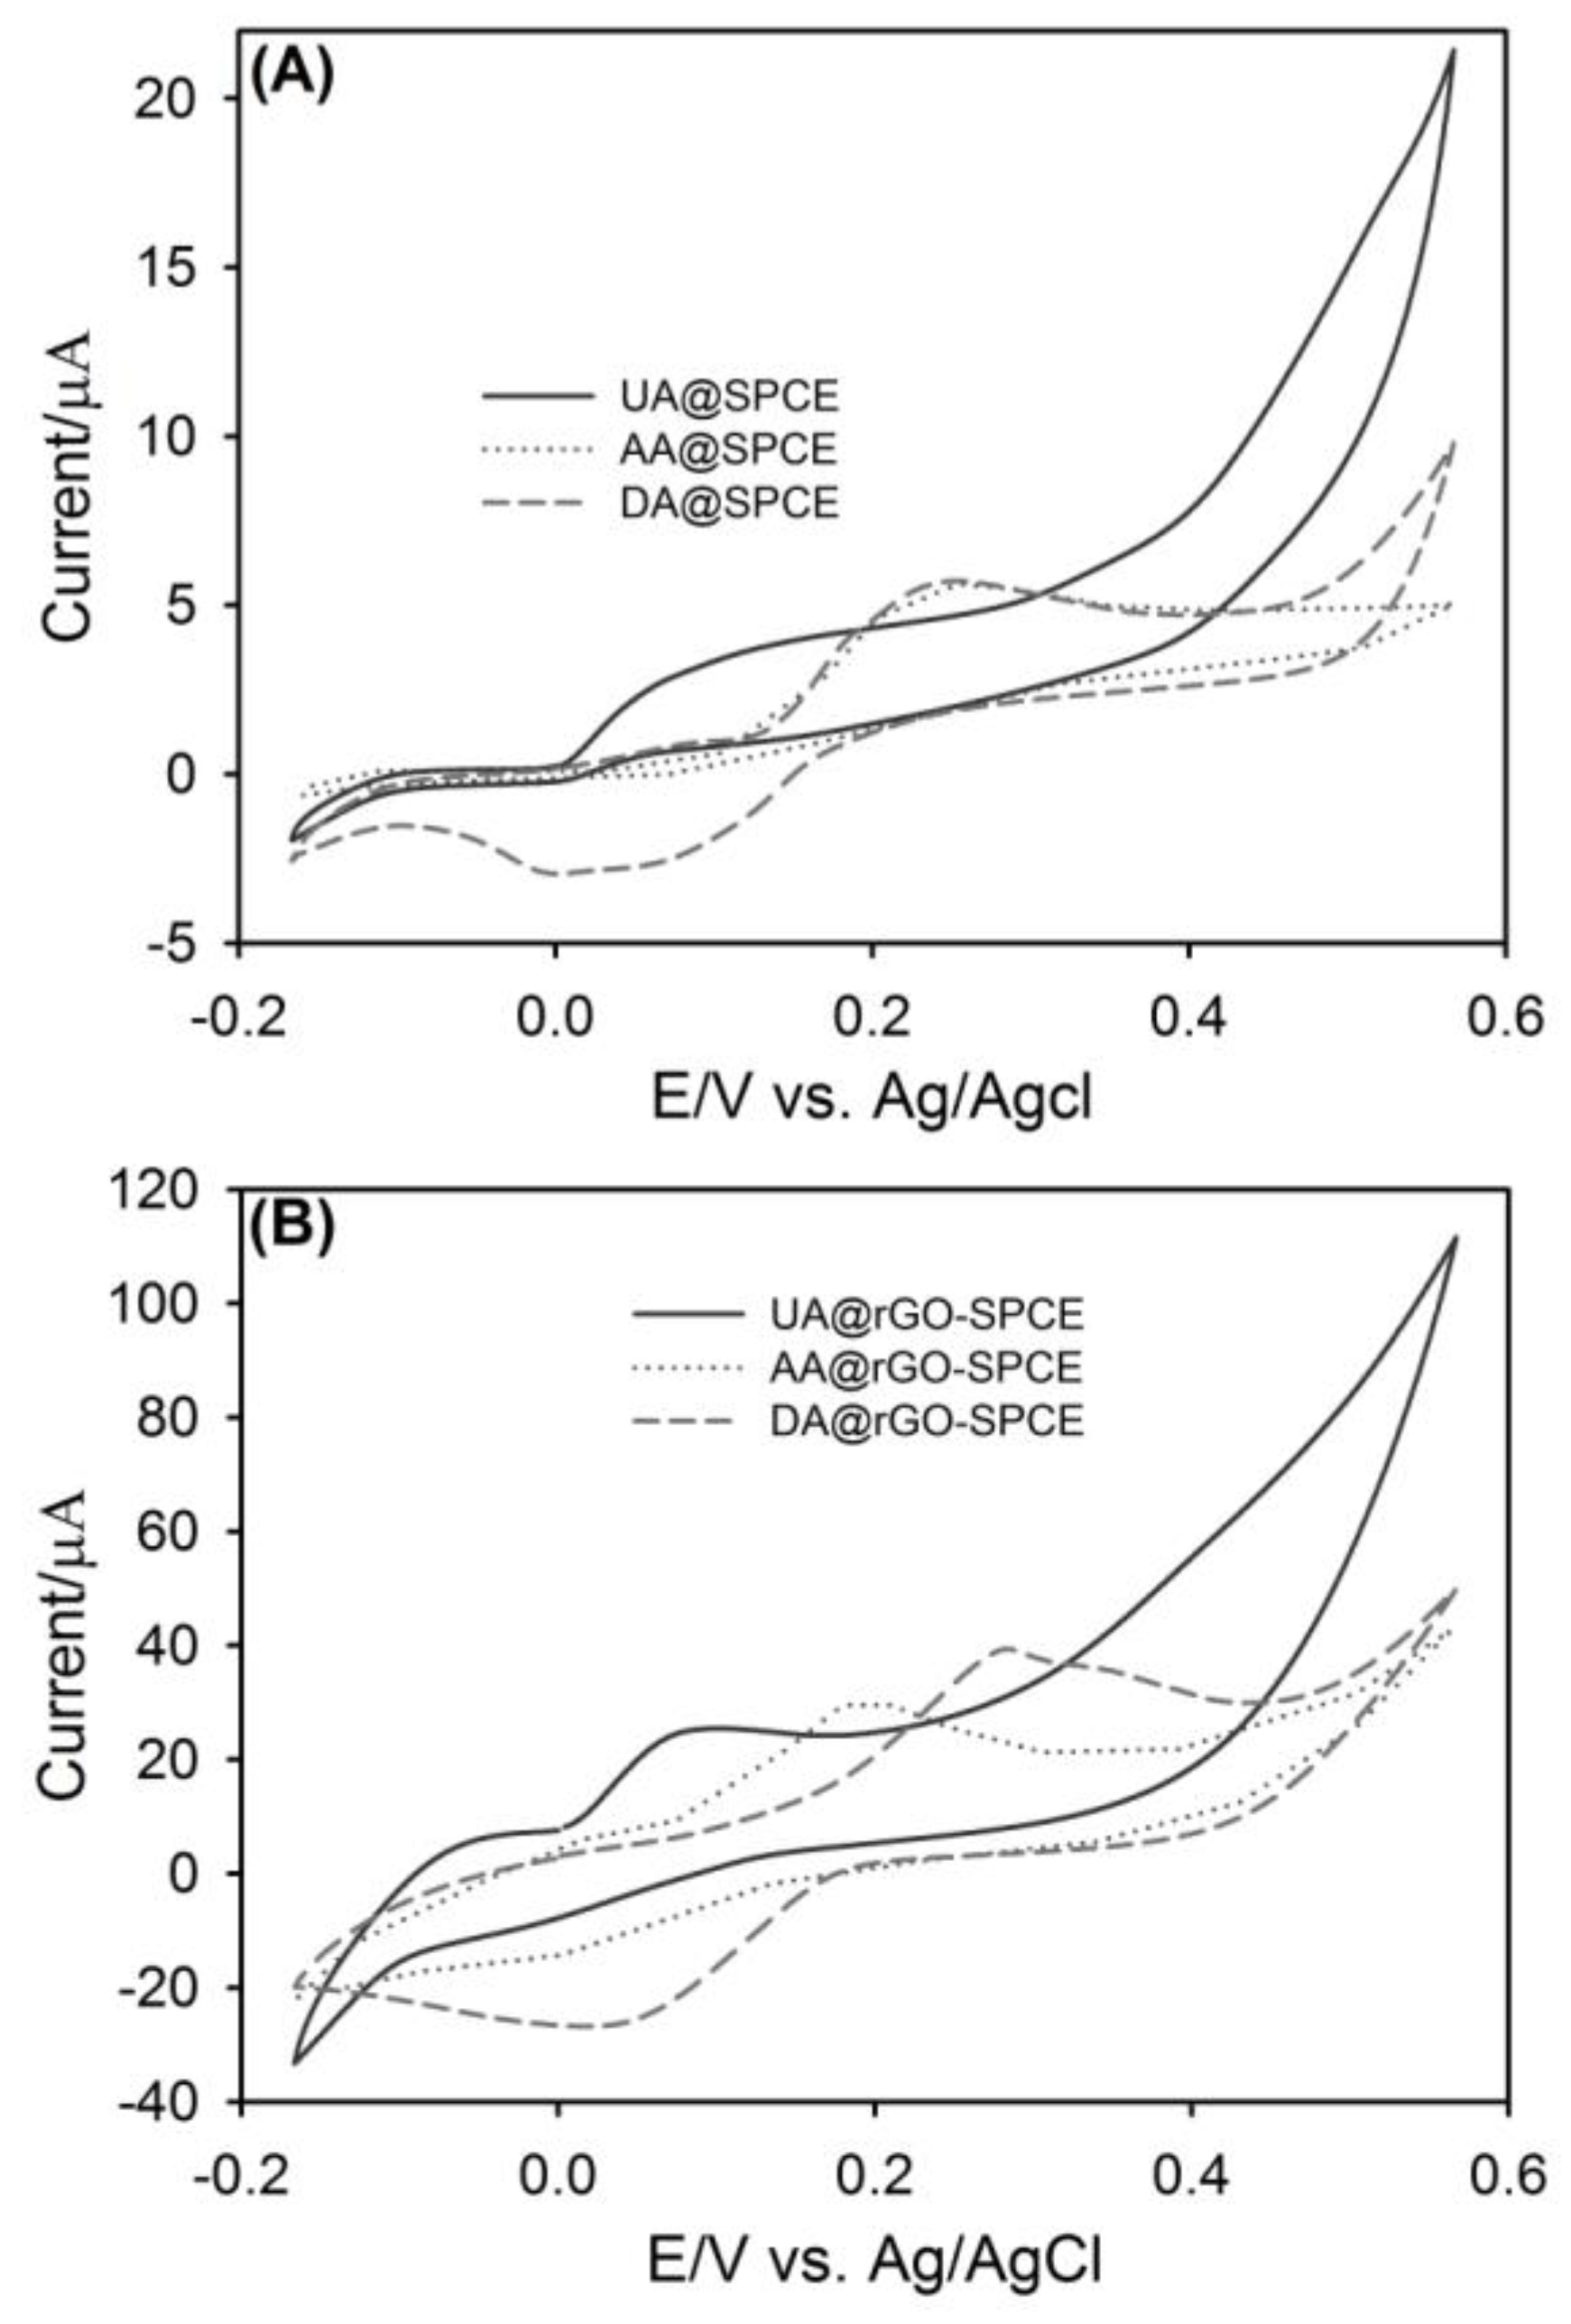
3.2. Cyclic Voltammetric Analysis of UA, AA and DA at SPCE and rGO-SPCE

Typical CVs recorded for a ternary mixture of UA, AA and DA at SPCE and rGO-SPCE in Britton–Robinson (BR) buffer (pH 7.0) are depicted in Figure 2. In Figure 2A, UA and AA exhibit broad irreversible oxidation peaks at 0.135 V and 0.295 V on SPCE, respectively, while DA has an anodic peak and a broadened cathodic peak at 0.295 V and 0.050 V (ΔEp = ~245 mV), respectively. This is an indication of a sluggish electron transfer process, which can be attributed to the conductivity of the SPCE material and/or electrode fouling caused by the deposition of the compounds including their redox products on the electrode. The oxidation peaks for AA and DA overlaps; thus, the oxidation peaks associated with the compounds could not be resolved. However, at rGO-SPCE, the oxidation peaks for UA, AA and DA are resolved at ~0.112 V, ~0.18 V and 0.287 V, respectively. The oxidation peak for DA (at ~0.287 V) formed a quasi-reversible couple at ~0.101 V. This anodic peak can be attributed to the oxidation of DA to o-dopaminequinone while the cathodic peak can be attributed to the reduction of the o-dopaminequinone back to DA as has been previously reported [25]. The smaller ΔEp value of 186 mV (when compared with 245 mV at SPCE) for DA suggests that the reversibility of DA at rGO-SPCE is remarkably improved; thus, enabling the simultaneous analysis of the three compounds.

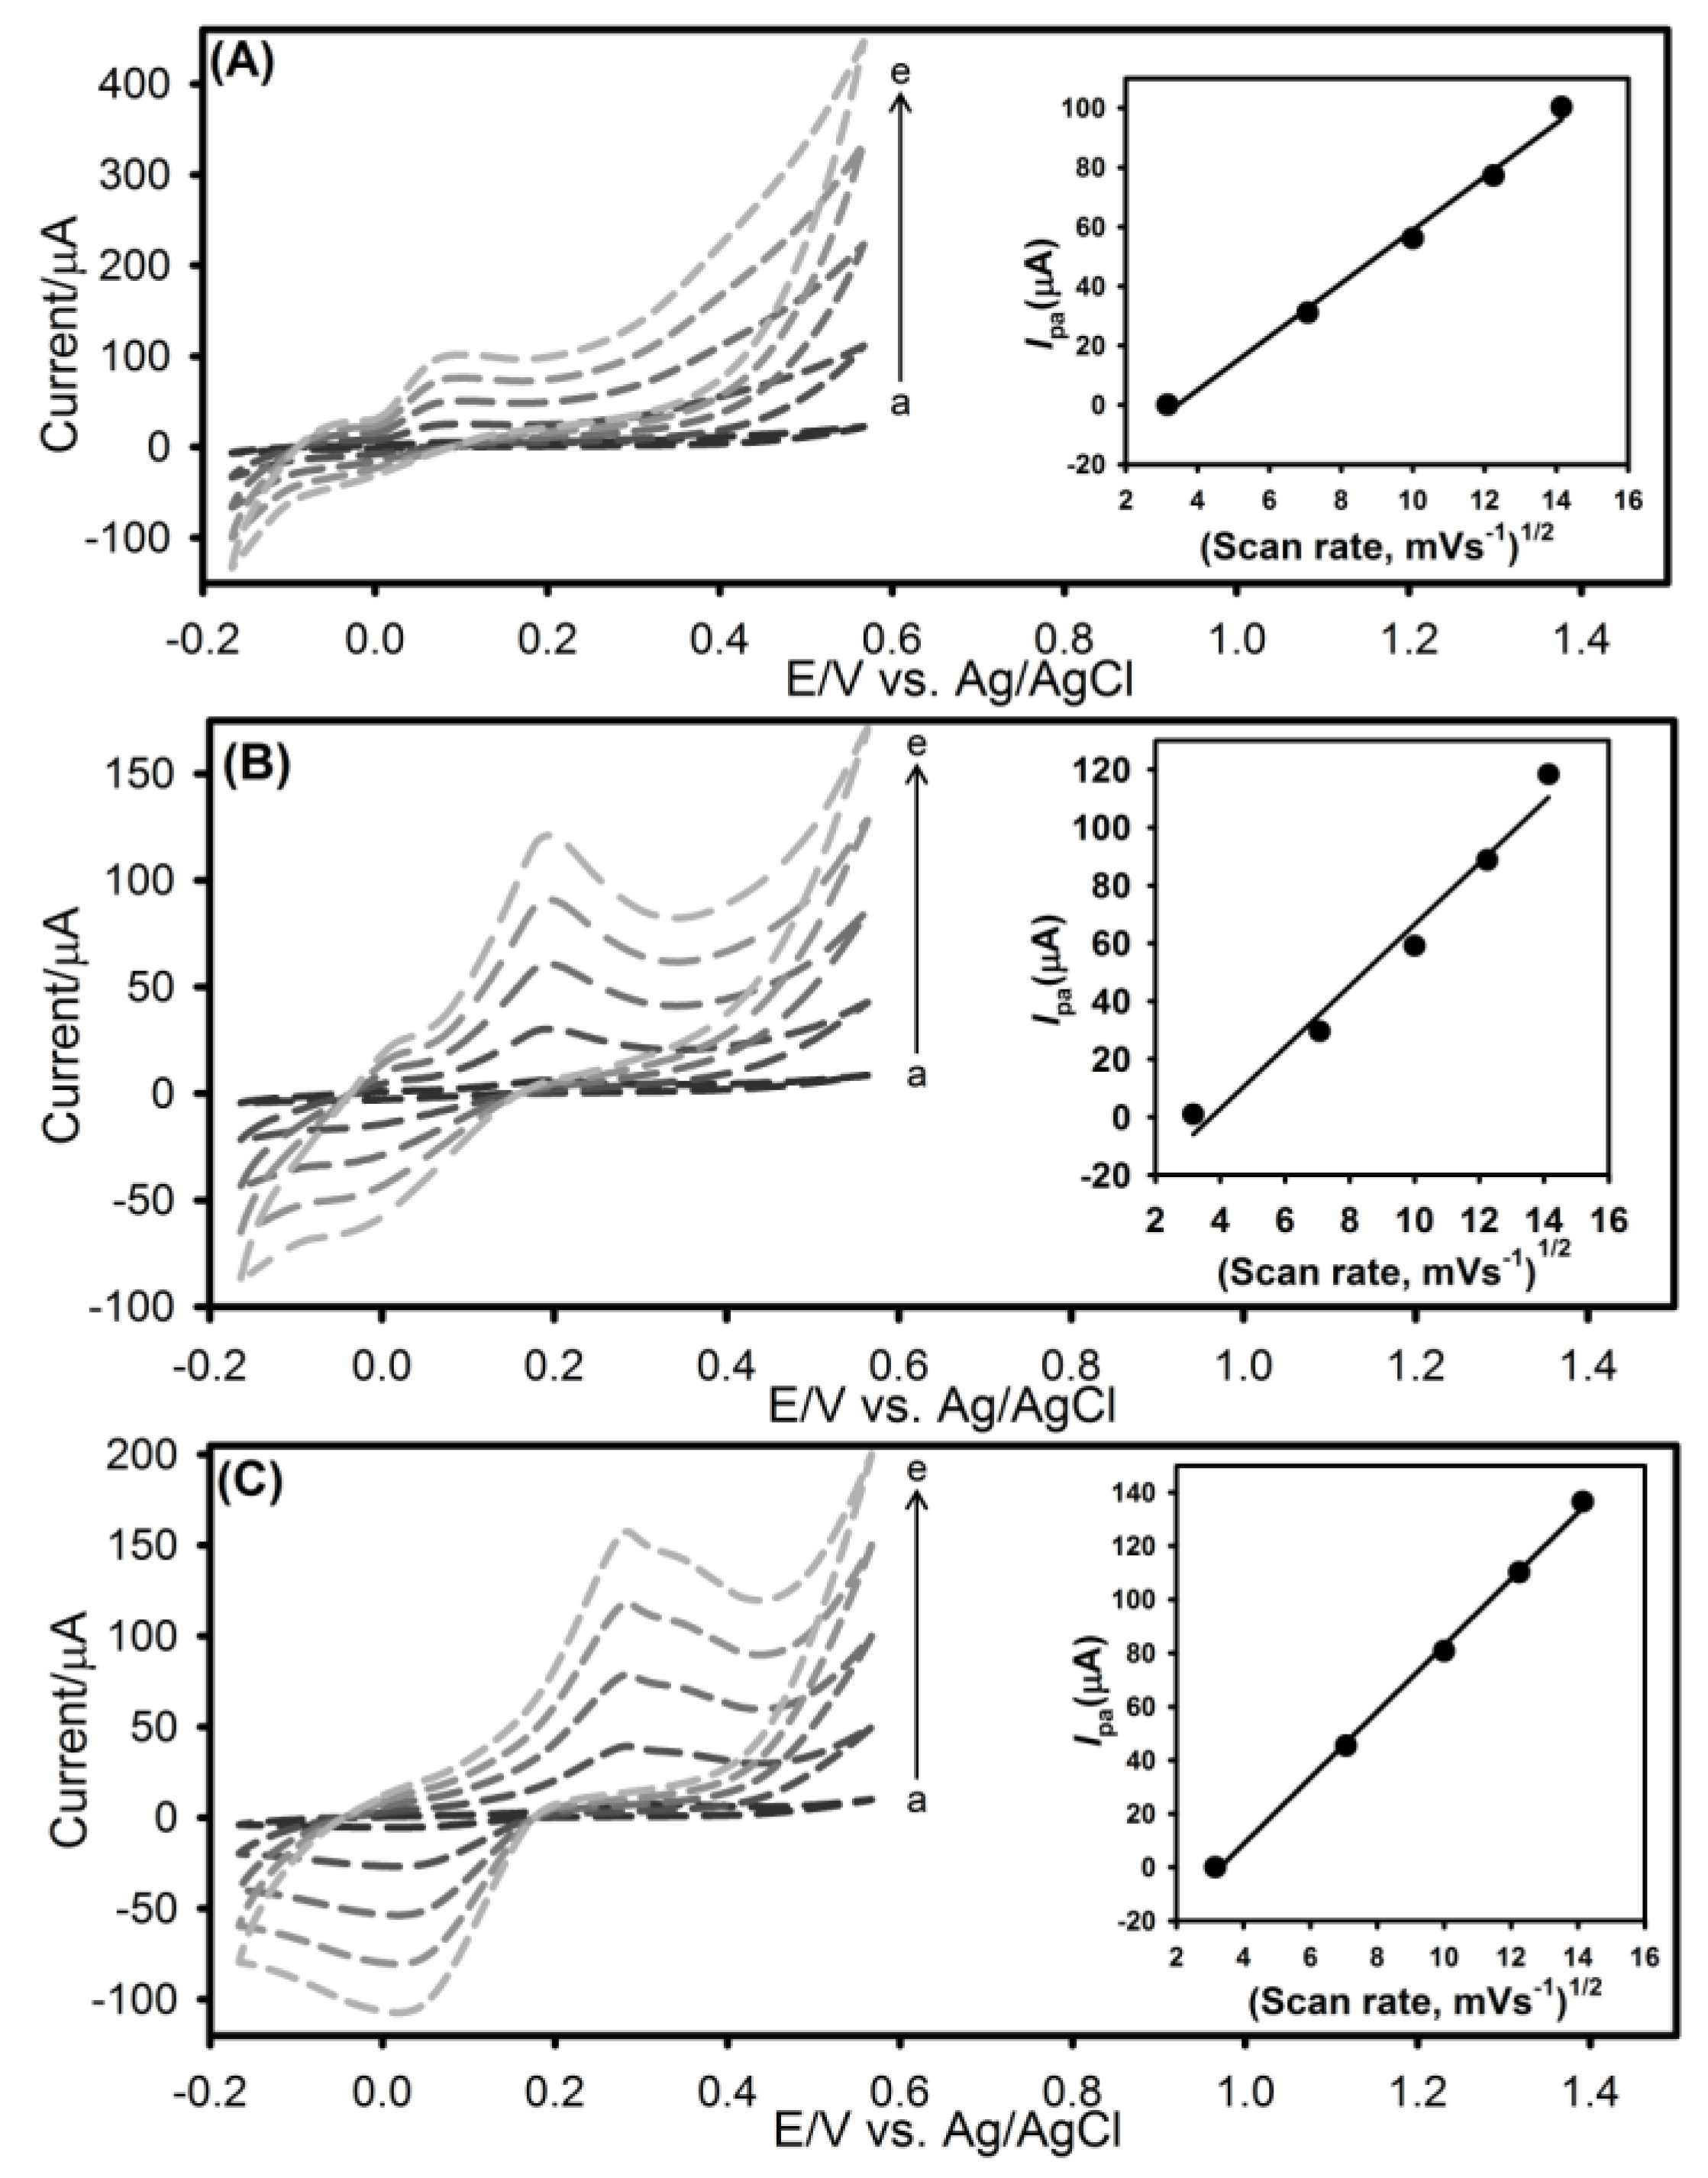
3.3. The Effect of Scan Rate on Voltammetric Behavior of UA, AA and DA at rGO-SPCE

The kinetics of the electrode reaction was further investigated by evaluating the effect of scan rate (v) on the anodic peak currents (Ipa). As shown in Figure 3, increasing scan rate increases the Ipa of UA, AA and DA linearly with slight positive shifts in the oxidation peak potentials (Epa), suggesting that adsorption of the compounds on rGO-SPCE does not occur. Plots of Ipa vs. square root of scan rate (√v) (shown as inserts in Figure 3) resulted in the following linear equations: UA, Ipa (μA) = 8.99 v1/2 (mV·s−1) − 30.89, R2 = 0.994; AA, Ipa (μA) = 10.59 v1/2 (mV·s−1) − 39.41, R2 = 0.977; and DA, Ipa (μA) = 12.38 v1/2 (mV·s−1) − 40.88, R2 = 0.999. These suggest a diffusion-controlled process.

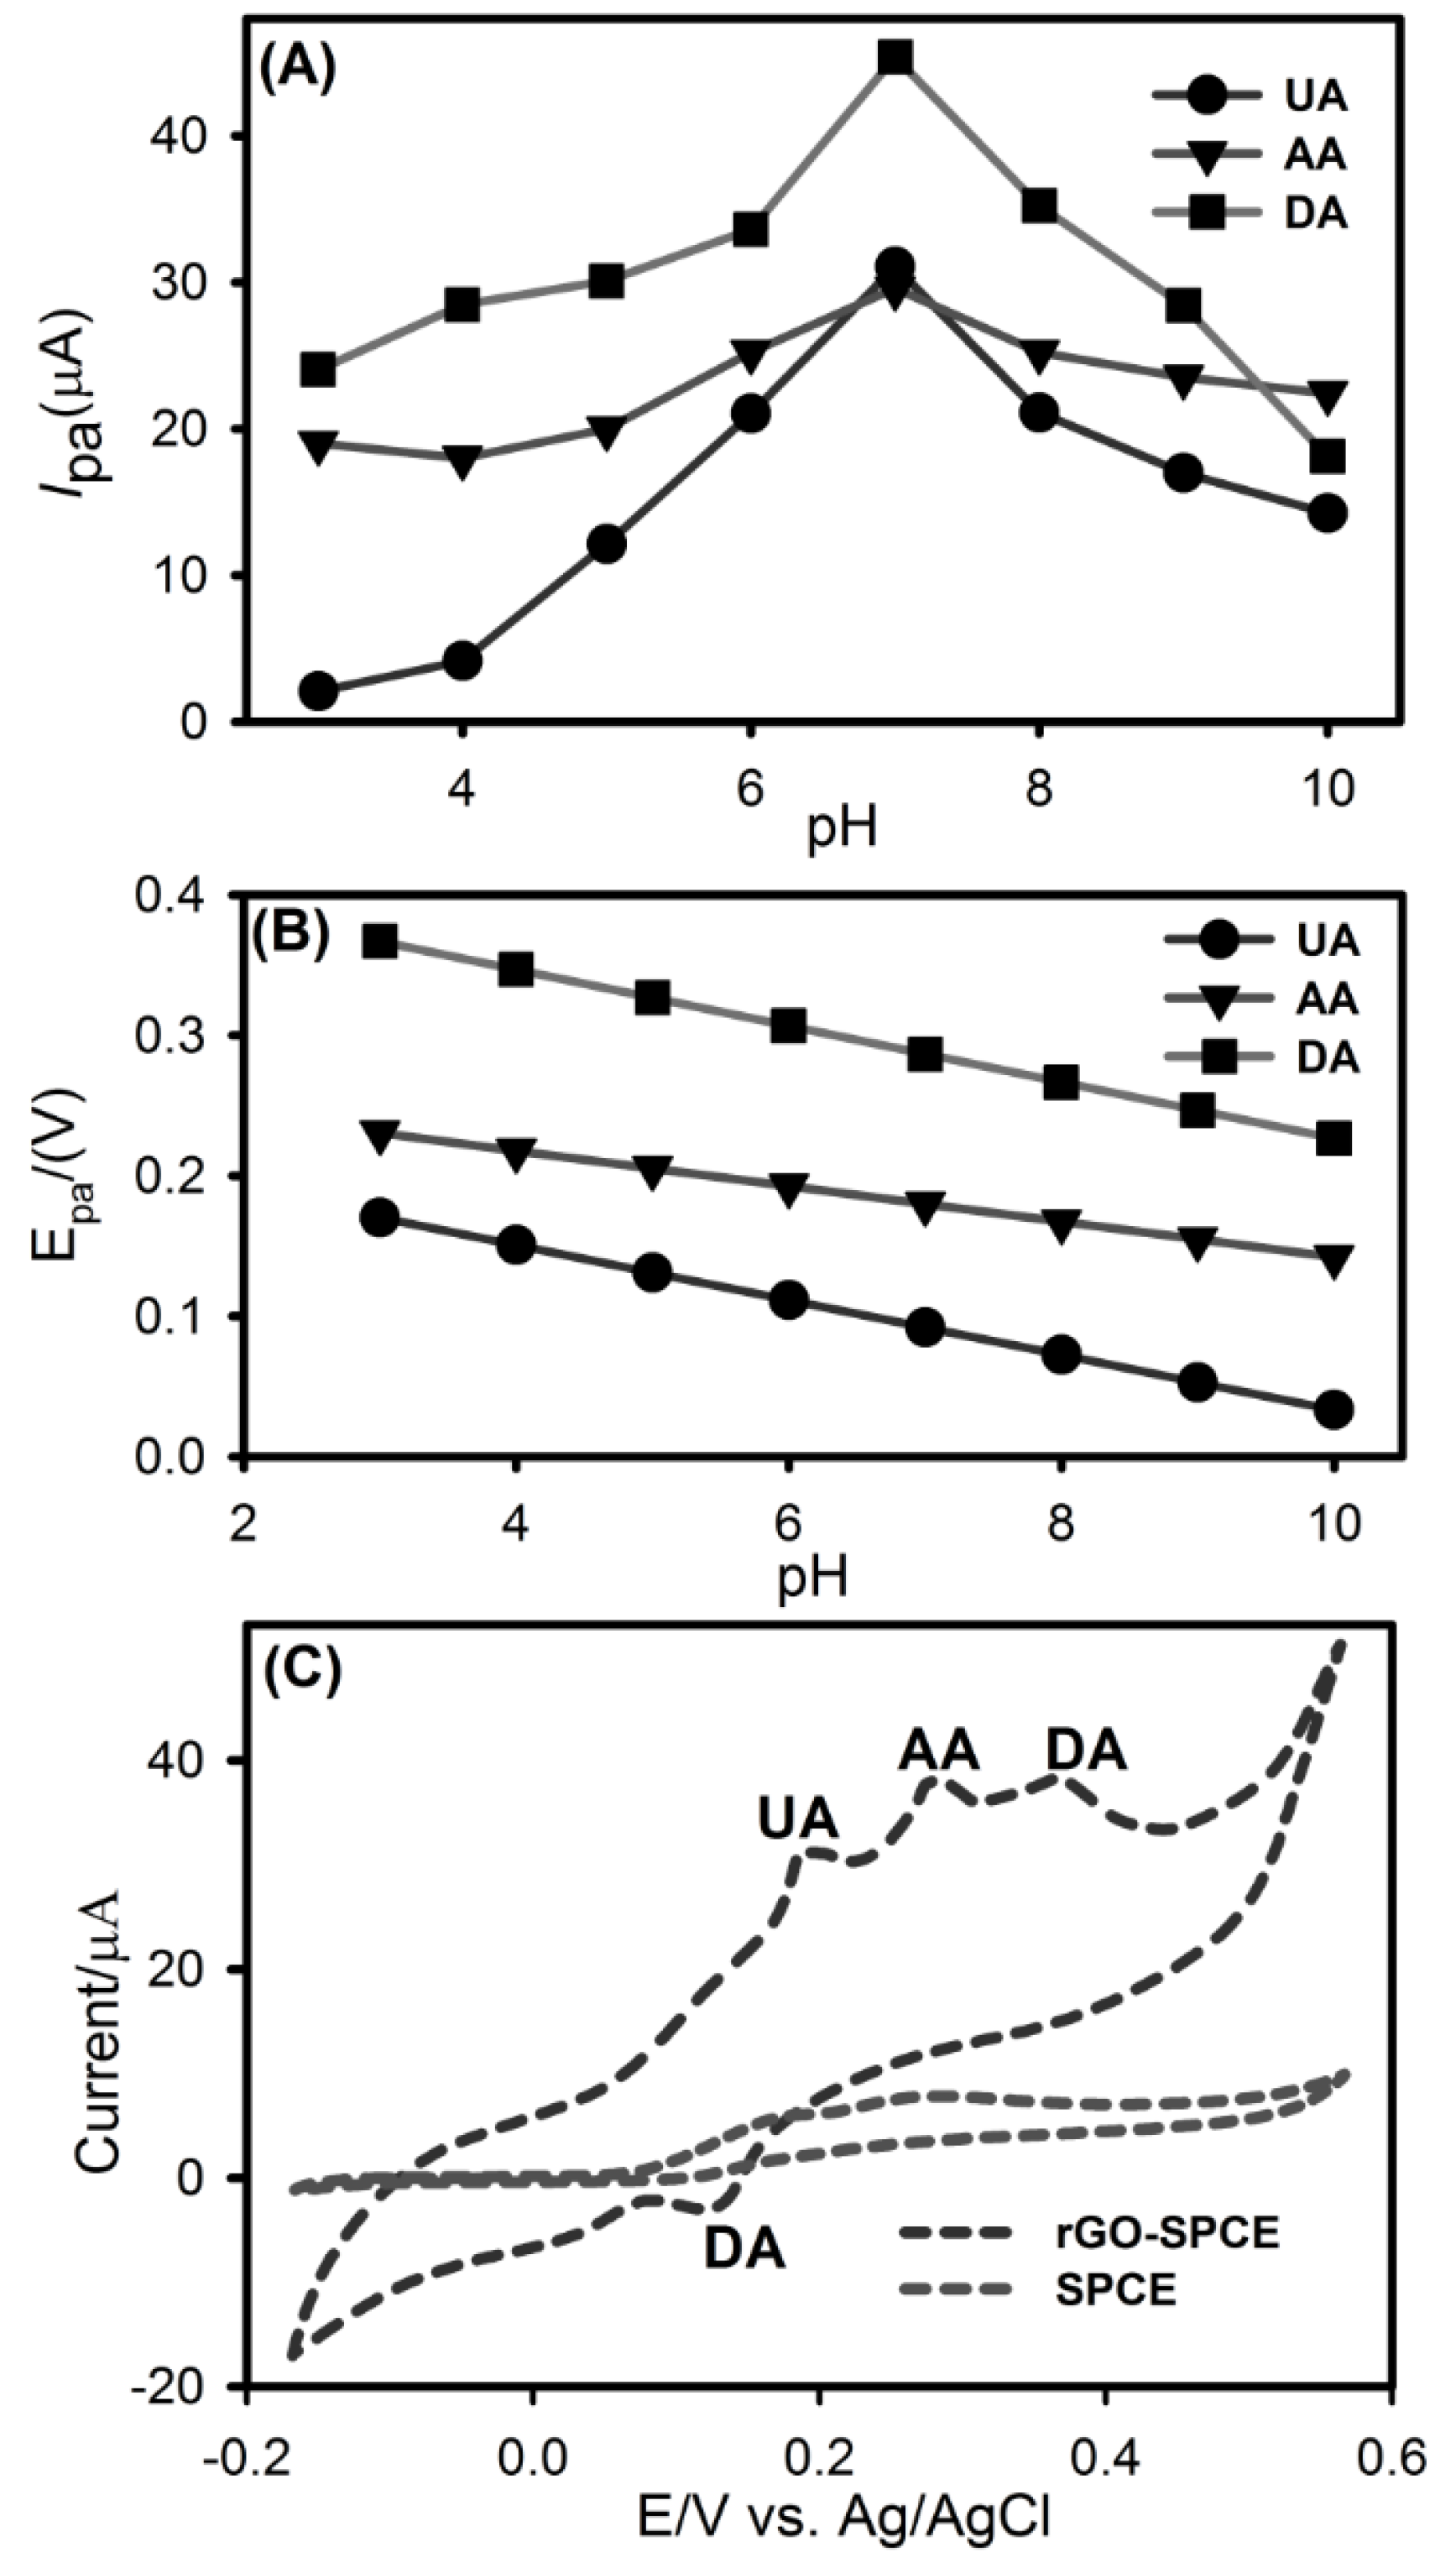
3.4. The Effect of pH on Voltammetric Behavior of UA, AA and DA at rGO-SPCE

The effect of pH on Ipa and Epa were also examined in the range of 3.0–10.0. As shown in Figure 4A, when the pH of the solution was increased, Ipa increased gradually and then decayed with the optimum pH being 7.0. Moreover, considering the fact that physiological pH is around 7.0 [26], BR buffer solution of pH 7.0 was used as the supporting electrolyte for the analyses of the compounds. Figure 4B illustrates the effect of pH on Epa, which followed the linear regression equations E p a ( V ) = 0.51 0.06   p H , R 2 = 0.9998 for UA, E p a ( V ) = 0.45 0.04   p H ,   R 2 = 0.9996 for AA, and E p a ( V ) = 0.72 0.06   p H ,   R 2 = 0.9995 for DA. The Epa shifted with every increase of the pH value of the supporting electrolyte for all the three compounds, suggesting that the reactions at rGO-SPCE were accompanied by proton transfers [27]. The slope values of 60.0 mV·pH−1 for both UA and DA suggest that their electrocatalytic reactions involved the transfer of equal number of protons and electrons [28]. However, the slope value of 40.0 mV·pH−1 for AA is similar to the value given by the Nernstian equation for reactions involving unequal electron and proton transfers [29]; thus, the overall reaction of AA at rGO-SPCE could be classified as an electrochemical process that is followed by a chemical reaction [30].

3.5. CV Analysis of Ternary Mixture of UA, AA and DA at SPCE and rGO-SPCE

The electrochemical behaviour of a ternary mixture of UA, AA and DA at SPCE and rGO-SPCE was evaluated by CV in order to further understand the electrochemical properties of the electrodes. At the SPCE, shown in Figure 4C, only two slightly overlapping anodic peaks were obtained at ~0.18 and ~0.287 V; thus, the Epa for UA, AA and DA were indistinguishable, indicating poor selectivity and sensitivity. In contrast, three well-resolved Epa were observed at 0.183 (for UA), 0.273 (for AA) and 0.317 V (for DA) on rGO-SPCE. The ∆Ep for UA–AA and AA–DA were 90 mV and 44 mV, respectively, which is large enough to allow for simultaneous analysis of the compounds in their ternary mixtures.

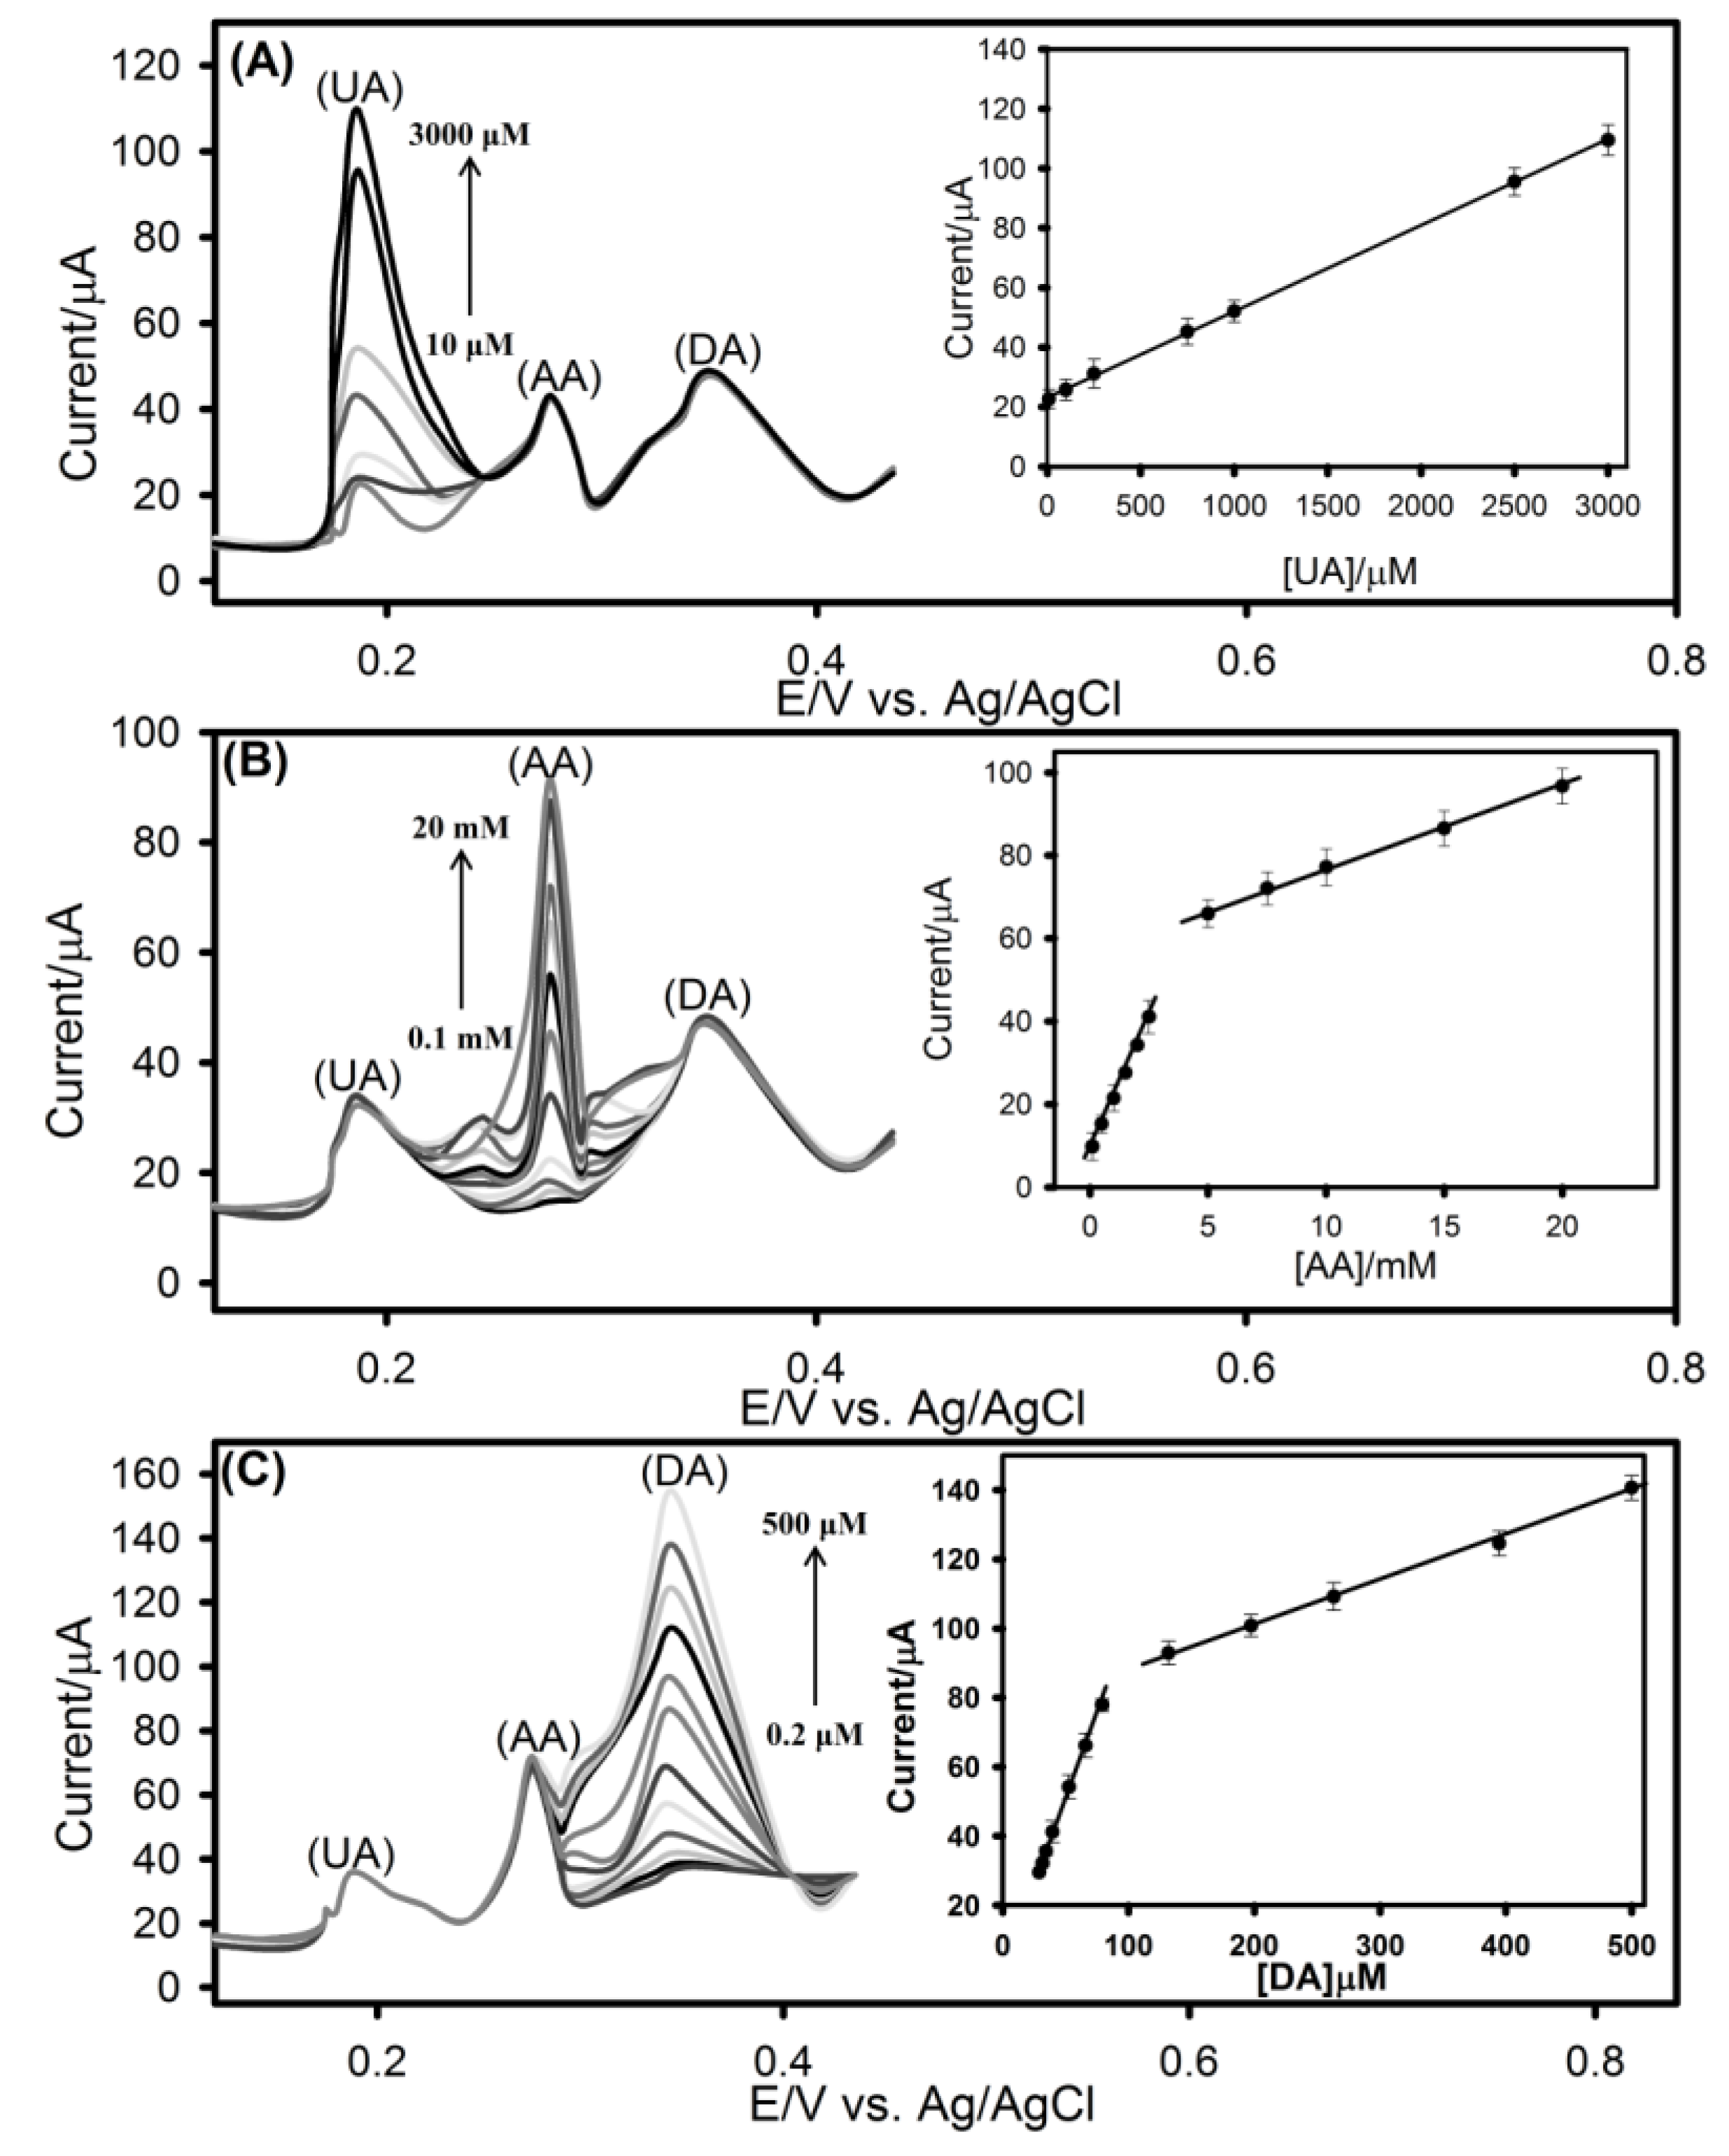
3.6. DPV Analysis of Ternary Mixtures of UA, AA and DA at rGO-SPCE

Differential pulse voltammetry (DPV), a widely utilized analytical method for the enhancement of electrode specificity and sensitivity [30], was carried out by varying the concentration of one of the compounds while the concentrations of the other two remained constant. As shown in Figure 5A–C, the Ipa for the three molecules increased linearly with increasing concentrations, suggesting a stable and efficient electrocatalytic activity at the rGO-SPCE. For UA detection, 2.5 mM AA and 50.0 μM DA are mixed in BR buffer (pH 7.0) and the corresponding linear regression equation is defined as I p a   ( μ A ) = 0.03   [ U A ] ( μ M ) + 23.09 ,   R 2 = 0.9998   ( [ U A ] = 10   μ M 3000   μ M ) . For AA detection, 250.0 μM UA and 50.0 μM DA are mixed in BR buffer (pH 7.0) and the corresponding linear regression equation is defined as I p a   ( μ A ) = 12.90   [ A A ] ( m M ) + 8.55 ,   R 2 = 0.9996   ( [ A A ] = 0.1   m M 2.5   m M ) ,   I p a   ( μ A ) = 2.02   [ A A ] ( m M ) + 56.51 ,   R ² = 0.9985   ( [ A A ] = 5.0   m M 20   m M ) .
For DA detection, 250.0 μM UA and 2.5 mM AA are mixed in BR buffer (pH 7.0) and the corresponding linear regression equation is defined as I p a   ( μ A ) = 0.97   [ D A ] ( μ M ) + 2.26 ,   R ² = 0.9984   ( [ D A ] = 0.20   μ M 80.00   μ M ) ,   I p a   ( μ A ) = 0.13   [ D A ] ( m M ) + 75.56 ,   R ² = 0.9975   ( [ D A ] = 120.0   μ M 500   μ M ) . The calculated limits of detection (S/N = 3) for UA, AA and DA were found to be 0.4 μM, 50.0 μM and 0.1 μM, respectively. These linear ranges and detection limits are better than some of the results obtained from the analysis of the compounds using similar modified electrodes (Table 2) and were deemed to be satisfactory for routine analysis of UA, AA and DA.

3.7. Reproducibility and Stability of rGO-SPCE, and Ternary Mixture Analysis

In order to evaluate the reproducibility of rGO-SPCE, a single rGO-SPCE was used (n = 6) to determine the concentrations of the compounds in a ternary mixture (250.0 μM UA, 2.5 mM AA, and 50.0 μM DA) by DPV. It was found that the relative standard deviations for the peak current intensities for UA, AA and DA were 1.05%, 1.51% and 1.25%, respectively. The stability of rGO-SPCE was also determined in a similar fashion after storage in room temperature for 21 days; the peak current intensities for UA, AA and DA decayed by less than 2.5%, suggesting that the electrodes were highly stable over the 21-day period. The rGO-SPCE was also used to analyse ternary mixtures of the compounds in urine using standard addition method. The analytical performance data are summarized in Table 3. The recoveries were in the range of 98.07% to 99.97% with a relative standard deviation (RSD, n = 3) of less than 1.5%. Clearly, the presence of common interferences in the urine samples did not interfere with the analysis of the compounds; thus, the sensor can be used for routine simultaneous quantification of the compounds in biological samples.

4. Conclusions

An in-house fabricated screen-printed carbon electrode, modified with chemically reduced graphene oxide, has been demonstrated as a useful analytical sensing tool for simultaneous analysis of uric acid, ascorbic acid and dopamine. The sensor showed stable responses for repeated measurements and good electrocatalytic capability that enabled the resolution of three voltammetric peaks associated with the compounds, thus enabling their simultaneous analyses. The sensor could be employed for routine simultaneous analysis of UA, AA and DA.

Acknowledgements

The authors would like to thank the Department of Employment and Learning Ireland (Grant No.: USI035) and the National Institutes of Health (Grant No.: 5R01ES003154-30) for the funding.

Author Contributions

Prosper Kanyong conceived, designed and performed the experiments, analyzed the data, and wrote the paper. Sean Rawlinson designed and printed the electrodes. James Davis provided reagents, materials and equipment, and supervised the project.

Conflicts of interest

The authors declare no conflict of interest.

References

  1. Ruggiero, C.; Cherubini, A.; Ble, A.; Bos, J.G.A.; Magio, M.; Dixit, D.V.; Lauretani, F.; Bandinelli, S.; Senin, U.; Ferrucci, L. Uric acid and inflammatory markers. Eur. Heart J. 2006, 27, 1174–1181. [Google Scholar] [CrossRef] [PubMed]
  2. Riches, P.L.; Wright, A.F.; Ralston, S.H. Recent insights into the pathogenesis of hyperuricemia and gout. Hum. Mol. Genet. 2009, 18, R177–R184. [Google Scholar] [CrossRef] [PubMed]
  3. Davey, M.W.; van Montagu, M.; Inze, D.; Sanmartin, M.; Kanellis, A.; Smirnoff, N.; Benzie, I.J.J.; Strain, J.J.; Favel, D.; Fletcher, J. Plant L-ascorbic acid: Chemistry, function, metabolism, bioavailability and effects of processing. J. Sci. Food Agric. 2005, 80, 825–860. [Google Scholar] [CrossRef]
  4. Englard, S.; Seifter, S. The biochemical functions of ascorbic acid. Annu. Rev. Nutr. 1986, 6, 365–406. [Google Scholar] [CrossRef] [PubMed]
  5. Kurian, M.A.; Gissen, P.; Smith, M.; Heales, S.J.; Clayton, P.T. The monoamine neurotransmitter disorders: An expanding range of neurological syndromes. Lancet Neurol. 2011, 10, 721–733. [Google Scholar] [CrossRef]
  6. Schultz, W. Multiple dopamine functions at different time courses. Annu. Rev. Neurosci. 2007, 30, 259–288. [Google Scholar] [CrossRef] [PubMed]
  7. Gowrishankar, R.; Hahn, M.K.; Blakely, R.D. Good riddance to dopamine: Roles for the dopamine transporter in synaptic function and dopamine-associated brain disorders. Neurochem. Int. 2014, 73, 42–48. [Google Scholar] [CrossRef] [PubMed]
  8. Camardese, G.; Giuda, D.; Nicola, M.; Cocciolillo, F.; Giordano, A.; Janiri, L.; Guglielmo, R. Imaging studies on dopamine transporter and depression: A review of literature and suggestions for future research. J. Psychiatr. Res. 2014, 51, 7–18. [Google Scholar] [CrossRef] [PubMed]
  9. Szantai, E.; Szilagyi, A.; Guttman, A.; Sasvari-Szekely, M.; Ronai, Z. Genotyping and hapotyping of the dopamine D4 receptor gene by capillary electrophoresis. J. Chromatogr. A 2004, 1053, 241–245. [Google Scholar] [CrossRef] [PubMed]
  10. Sajid, M.S.; Nazal, M.K.; Mansha, M.; Alsharaa, A.; Jillani, S.M.S.; Basheer, C. Chemically modified electrodes for electrochemical detection of dopamine in the presence of uric acid and ascorbic acid: A review. TrAc Trends Anal. Chem. 2016, 76, 15–29. [Google Scholar] [CrossRef]
  11. González, R.R.; Fernández, R.F.; Vidal, J.L.M.; Frenich, A.G.; Pérez, M.L.G. Development and validation of an ultra-high performance liquid chromatography–tandem mass-spectrometry (UHPLC–MS/MS) method for the simultaneous determination of neurotransmitters in rat brain samples. J. Neurosci. Methods 2011, 198, 187–194. [Google Scholar] [CrossRef] [PubMed]
  12. Gao, Z.Q.; Huang, H. Simultaneous determination of dopamine, uric acid and ascorbic acid at an ultrathin film modified gold electrode. Chem. Commun. 1998, 19, 2107–2108. [Google Scholar] [CrossRef]
  13. Welch, C.W.; Compton, R.G. The use of nanoparticles in electroanalysis: A review. Anal. Bioanal. Chem. 2006, 384, 601–619. [Google Scholar] [CrossRef] [PubMed]
  14. Safavi, A.; Maleki, N.; Moradlou, M.; Tajabadi, F. Simultaneous determination of dopamine, ascorbic acid and uric acid using carbon ionic liquid electrode. Anal. Biochem. 2006, 359, 224–229. [Google Scholar] [CrossRef] [PubMed]
  15. Ensafi, A.A.; Taei, M.; Khayamian, T. Simultaneous determination of ascorbic acid, dopamine and uric acid by differential pulse voltammetry using tiron modified glassy carbon electrode. Int. J. Electrochem. Sci. 2010, 5, 116–130. [Google Scholar]
  16. Kalimuthu, P.; John, S.A. Simultaneous determination of ascorbic acid, dopamine, uric acid and xanthine using a nanostructured polymer film modified electrode. Talanta 2010, 80, 1686–1691. [Google Scholar] [CrossRef] [PubMed]
  17. Shakkthivel, P.; Chen, S. Simultaneous determination of ascorbic acid and dopamine in the presence of uric acid on ruthenium oxide modified electrode. Biosens. Bioelectron. 2007, 22, 1680–1687. [Google Scholar] [CrossRef] [PubMed]
  18. Cinti, S.; Ardunini, F.; Carbone, M.; Sansone, L.; Cacciotti, I.; Moscone, D.; Palleschi, G. Screen-printed electrodes modified with carbon nanomaterials: A comparison among carbon black, carbon nanotubes and graphene. Electroanalysis 2015, 27, 2230–2238. [Google Scholar] [CrossRef]
  19. Chua, C.K.; Pumera, M. Reduction of graphene oxide with substituted borohydrides. J. Mater. Chem. A 2013, 1, 1892–1898. [Google Scholar] [CrossRef]
  20. Kanyong, P.; Rawlinson, S.; Davis, J. Gold nanoparticle modified screen-printed carbon arrays for the simultaneous electrochemical analysis of lead and copper in tap water. Microchim. Acta 2016, 183, 2361–2368. [Google Scholar] [CrossRef]
  21. Kanyong, P.; Rawlinson, S.; Davis, J. Fabrication and electrochemical characterization of polydopamine redox polymer modified screen-printed carbon electrode for the detection of guanine. Sens. Actuators B Chem. 2016, 233, 528–534. [Google Scholar] [CrossRef]
  22. Paredes, J.I.; Villar-Rodil, S.; Martinez-Alonso, A.; Tascon, J.M.D. Graphene oxide dispersions in organic solvents. Langmuir 2008, 24, 10560–10564. [Google Scholar] [CrossRef] [PubMed]
  23. Li, D.; Muller, M.B.; Gilje, S.; Kaner, R.B.; Wallace, G.G. Processable aqueous dispersions of graphene nanosheets. Nat. Nanotechnol. 2008, 3, 101–105. [Google Scholar] [CrossRef] [PubMed]
  24. Suni, I.I. Impedance methods for electrochemical sensors using nanomaterials. Trends Anal. Chem. 2008, 27, 604–611. [Google Scholar] [CrossRef]
  25. Ponnusamy, V.K.; Mani, V.; Chen, S.M.; Huang, W.T.; Jen, J.F. Rapid microwave assisted synthesis of graphene nanosheets/polyethylenimine/gold nanoparticle composite and its application to the selective electrochemical determination of dopamine. Talanta 2014, 120, 140–157. [Google Scholar] [CrossRef] [PubMed]
  26. Temocin, Z. Modification of glassy carbon electrode in basic medium by electrochemical treatment for simultaneous determination of dopamine, ascorbic acid and uric acid. Sens. Actuators B Chem. 2013, 176, 796–802. [Google Scholar] [CrossRef]
  27. Habibi, B.; Pournaghi-Azar, M.H. Simultaneous determination of ascorbic acid, dopamine and uric acid by use of a MWCNT modified carbon-ceramic electrode and differential pulse voltammetry. Electrochim. Acta 2010, 55, 5492–5498. [Google Scholar] [CrossRef]
  28. Komura, T.; Niu, G.Y.; Yamaguchi, T.; Asano, M.; Matsuda, A. Coupled electron-proton transport in electropolymerized methylene blue and the influences of its protonation level on the rate of electron exchange with nicotinamide adenine dinucleotide. Electroanalysis 2010, 16, 1791–1800. [Google Scholar] [CrossRef]
  29. Sheng, Z.H.; Zheng, X.Q.; Xu, J.Y.; Bao, W.J.; Wang, F.B.; Xia, X.H. Electrochemical sensor based on nitrogen doped graphene: Simultaneous determination of ascorbic acid, dopamine and uric acid. Biosens. Bioelectron. 2012, 34, 125–131. [Google Scholar] [CrossRef] [PubMed]
  30. Evans, D.H. Review of voltammetric methods for the study of electrode reactions. In Microelectrdodes: Theory and Applications; Montenegro, M.R.M., Quirós, A., Daschbach, J.L., Eds.; Springer: Rotterdam, The Netherlands, 1991; pp. 17–32. [Google Scholar]
  31. Yang, L.; Liu, D.; Huang, J.S.; You, T.Y. Simultaneous determination of dopamine, ascorbic acid and uric acid at electrochemically reduced graphene oxide modified electrode. Sens. Actuators B Chem. 2014, 193, 166–172. [Google Scholar] [CrossRef]
  32. Wang, Y.; Tong, L.L. Electrochemical sensor for simultaneous determination of uric acid, xanthine, and hypoxanthine based on poly (bromocresol purple) modified glassy carbon electrode. Sens. Actuators B Chem. 2010, 150, 43–49. [Google Scholar] [CrossRef]
  33. Lian, Q.; He, Z.; He, Q.; Luo, A.; Yan, K.; Zhang, D.; Lu, X.; Zhou, X. Simultaneous determination of ascorbic acid, dopamine and uric acid based on trptophan functionalized graphene. Anal. Chim. Acta 2014, 823, 32–39. [Google Scholar] [CrossRef] [PubMed]
  34. Zhang, F.Y.; Wang, Z.H.; Zhang, Y.Z.; Zheng, Z.X.; Wang, C.M.; Du, Y.L.; Ye, W.C. Simultaneous electrochemical determination of uric acid, xanthine and hypoxanthine based on poly(L-arginine)/graphene composite film modified electrode. Talanta 2012, 93, 20–325. [Google Scholar] [CrossRef] [PubMed]
  35. Kaur, B.; Panidyan, T.; Satpati, B.; Srivastava, R. Simultaneous and sensitive determination of ascorbic acid, dopamine, uric acid and tryptophan with silver nanoparticles-decorated reduced graphene oxide modified electrode. Colloid. Surface B 2013, 11, 97–106. [Google Scholar] [CrossRef] [PubMed]
  36. Wang, X.; Wu, M.; Tang, W.R.; Zhu, Y.; Wang, L.W.; Wang, Q.J.; He, P.G.; Fang, Y.Z. Simultaneous electrochemical determination of ascorbic acid, dopamine and uric acid suing a palladium nanoparticles/graphene/chitosan modified electrode. J. Electroanal. Chem. 2013, 695, 10–16. [Google Scholar] [CrossRef]
  37. Li, S.J.; Qian, C.; Wang, K.; Hua, B.Y.; Wang, F.B.; Sheng, Z.H.; Xia, X.H. Application of thermally reduced graphene oxide modified electrode in simultaneous determination of dihydroxybenzene isomers. Sens. Actuators B Chem. 2012, 174, 441–448. [Google Scholar] [CrossRef]
  38. Ping, J.F.; Wang, J.W.Y.X.; Ying, Y.B. Simultaneous determination of ascorbic acid, dopamine and uric acid using high-performance screen-printed graphene electrode. Biosens. Bioelectron. 2012, 34, 70–76. [Google Scholar] [CrossRef] [PubMed]
  39. Cui, R.J.; Wang, X.Y.; Zhang, G.H.; Wang, C. Simultaneous determination of dopamine, ascorbic acid and uric acid using helical carbon nanotubes modified electrode. Sens. Actuators B Chem. 2012, 161, 1139–1143. [Google Scholar] [CrossRef]
  40. Wang, C.F.; Xu, P.P.; Zhuo, K.L. Ionic liquid functionalized graphene-based electrochemical biosensor for simultaneous determination of dopamine and uric acid in the presence of ascorbic acid. Electroanalysis 2014, 26, 191–198. [Google Scholar] [CrossRef]
Scheme 1. (A) Screen-printing of carbon electrodes; and (B) chemical reduction of graphene oxide and modification of SPCE.
Chemosensors 04 00025 sch001
Figure 1. (A) UV-Vis spectra of GO and rGO suspensions in water. (B) Nyquist plots observed for impedance measurements at SPCE and rGO-SPCE in Britton–Robinson (BR) buffer (pH 7.0) containing 5.0 mM K4[Fe(CN)6] and 0.1 M KCl. Insert: Randles equivalent circuit used for data fitting, Rs, resistance of the electrolyte solution; RCT, electron-transfer resistance; Zw, Warburg impedance; Cdl, double layer capacitance. (C) Cyclic voltammograms of 5.0 mM K4[Fe(CN)6] in BR buffer (pH 7.0) containing 0.1 M KCl at SPCE and rGO-SPCE, 50.0 mV·s−1 scan rate.
Chemosensors 04 00025 g001aChemosensors 04 00025 g001b
Figure 2. Cyclic voltammograms of ternary mixtures of UA (0.5 mM), AA (5.0 mM) and DA (0.5 mM) in BR buffer (pH 7.0) at: (A) SPCE; and (B) rGO-SPCE. Scan rate, 50 mV·s−1.
Chemosensors 04 00025 g002
Figure 3. Cyclic voltammograms recorded at rGO-SPCE in BR buffer (pH 7.0) containing: (A) 0.5 mM UA; (B) 5.0 mM AA; and (C) 0.5 mM DA, at scan rates of: (a) 10; (b) 50; (c) 100; (d) 150; and (e) 200 mV·s−1. Inserts: Ipa vs. √v.
Chemosensors 04 00025 g003
Figure 4. Effect of pH on the: (A) Ipa; and (B) Epa of UA (0.5 mM), AA (5.0 mM) and DA (0.5 mM) at rGO-SPCE. (C) Cyclic voltammograms of ternary mixture of UA (0.5 mM), AA (5.0 mM) and DA (0.5 mM) at SPCE and rGO-SPCE. Supporting electrolyte was BR buffer (pH 7.0), 50 mV·s−1 scan rate.
Chemosensors 04 00025 g004
Figure 5. DPVs of UA, AA and DA at rGO-SPCE in BR buffer (pH 7.0), 50 mV·s−1 scan rate: (A) UA concentrations of 10.0, 100.0, 250.0, 750.0, 1000.0, 2500.0 and 3000.0 μM in the presence of 2.5 mM AA and 50.0 μM DA; (B) AA concentrations of 0.1, 0.5, 1.0, 1.5, 2.0, 2.5, 5, 7.5, 10.0, 15.0, and 20.0 mM in the presence of 250.0 μM UA and 50.0 μM DA; and (C) DA concentrations of 0.2, 20.0, 30.0, 40.0, 50.0, 70.0, 80.0, 120.0, 200.0, 250.0, 400.0 and 500.0 μM in the presence of 250.0 μM UA and 2.5 mM AA. Inserts: Ip vs. concentration.
Chemosensors 04 00025 g005
Table 1. Impedance circuit fitted parameters for SPCE and rGO-SPCE.
ParameterSPCErGO-SPCE
Rs (Ω)29982997
Cdl (μF)1.49867.071
RCT (Ω)160495004
Zw (Ω·s−½)21811983
Table 2. Comparison of the analytical performance characteristics of UA, AA and DA electrodes.
Electrode MaterialLimit of Detection (μM)Linear Range (μM)Reference
UAAADAUAAADA
ERGO-GCE0.5300.00.50.5–60.0500.0–2000.00.5–60.0[31]
GCE4.723.382.675.0–70.025,000.0–300,000.03.0–30.0[32]
Trp-GR1.2410.090.2910.0–1000.0200.0–3400.0,0.5–110.0[33]
3400.0–12,900.0
PdNPs-GR-CS-GCE0.1720.00.10.5.0–200.0100.0–400.00.50–15.0,[34]
20.00–200.00
AgNPs-rGO-GCE8.29.65.410.0–800.010.0–800.010.00–800.00[35]
MWCNT-GCE0.427.710.310.55–90.015.0–800.00.50–100.00[36]
Nitrogen doped GR0.0452.20.250.1–20.05.0–1300.00.50–170.00[29]
poly(Tyr)-MWCNTs-COOH-GCE0.32.00.021.0–350.050–1000.00.10–30.00[37]
Screen printed graphene electrode0.20.950.120.8–2500.04.0–4500.00.50–2000.00[38]
HCNTs-GCE1.50.920.86.7–65.07.5–180.02.50–105.00[39]
IL-GR-GCE0.3230.6791.0–600.01.00–400.00[40]
rGO-SPCE0.35500.110.0–3000.0100.0–2500.0,0.20–80.00,This study
5000.0–20000.0120.0–500.0
Table 3. Recovery of UA, AA and DA from ternary mixtures in urine.
SampleAmount Added (μM)Amount Recovered (μM)Mean Recovery (%)
UA---
Repeat 15047.9
Repeat 25049.4
Repeat 35049.8
Mean-49.03398.07
AA---
Repeat 1500497.3
Repeat 2500499.7
Repeat 3500499.5
Mean-499.83399.97
DA--
Repeat 15049.4
Repeat 25048.8
Repeat 35049.9
Mean-49.36798.73

