
Ultra-Sensitive Optical Resonator for Organic Solvents Detection Based on Whispering Gallery Modes

1
Applied-Science & Robotics Laboratory for Applied-Mechatronics (ARAtronics Laboratory), Mechatronics Engineering Department, German University in Cairo, New Cairo 11835, Egypt
2
Micro-Sensor Laboratory, Mechanical Engineering Department, Southern Methodist University, Dallas, TX 75275, USA
*
Author to whom correspondence should be addressed.
Chemosensors 2017, 5(2), 19; https://doi.org/10.3390/chemosensors5020019
Submission received: 23 March 2017
/
Revised: 13 May 2017
/
Accepted: 1 June 2017
/
Published: 5 June 2017
(This article belongs to the Special Issue Chemical Microsensors)
Abstract
:In this paper, a novel technique using an ultra-sensitive optical resonator based on whispering gallery modes (WGM) is proposed to detect the diffusion of organic solvents. The sensor configuration is a micro-cavity made of polymeric material. When the solvent starts to diffuse, the polymer of the cavity starts to swallow that solvent. A swollen elastomer is in fact a solution, except that its mechanical response is now elastic rather than viscous. As solvents fill the network, chains are extended. In turn, that leads to the change of the morphology and mechanical properties of the sensing element. These changes could be measured by tracking the WGM shifts. Several experiments were carried out to measure that swelling force. Ethanol and methanol are used in this paper as candidates to study their driving force of diffusion (concentration gradient) on the cavity. Additionally, this sensing design can be used for biological sensing application. Breath diagnosis can use this configuration in diabetes diagnosis since a solvent like acetone concentration in human breath leads to a quick, convenient, accurate, and painless breath diagnosis of diabetes. The optical resonator results are verified through two different analyses: theoretical and experimental modeling. These micro-optical cavities have been examined using preliminary experiments to fully investigate their response and to verify the numerical analysis. Results show that the proposed sensor yields sensitivity for the driving force of diffusion (concentration gradient) (9.405 × 10¹³ pm/N) with a measurement precision of ~3.6 fN.
1. Introduction
Diffusion in polymers is a new application to be studied in the optical sensors field. Usually the diffusion in polymers is used in the field of food packaging. Diffusion of organic solvents in polymers is done in three main steps. Firstly, adsorption onto the polymer surface. Secondly, diffusion through the polymer molecules. Finally, desorption of the diffusant to another phase. The reason why the diffusion through polymers occurs is the random motion of the individual molecules. The force that drives the transport process is the concentration of the substance difference between the first and the second phase. The main task of the diffusion is to equalize the concentration of the diffusant into the polymer membrane [1]. There are many factors that affect the diffusion into polymers depending on the nature of the polymer and the diffusant. Some of these factors are the molecular size, the state of the diffusant, the structure of the polymer, the solubility of the solvent within the polymer, the temperature that will lead to diffusant vapor pressure, and the surface energy [2].
Micro-optical cavities have been used as optical sensors with high sensitivities due to their high quality factor that can be exhibited, where and are the wavelength of the light (~1.3146 µm) and the resonance line-width respectively. They can also be used as sensing elements for different physical quantities such as pressure [3], vibration [4], temperature [5], and magnetic field [6]. Whispering gallery optical modes (WGM) are the main sensing phenomenon used in this paper. When the light is coupled to the cavity through the tapered section of the single-mode optical fiber, the WGM would be seen as sharp dips on the transmission spectrum. By tracking the WGM shifts (dλ), any minute perturbation in the environment surrounding the cavity can be determined. The optical resonance is the condition that we have to reach to start using these micro-cavities as sensors. For the first-order approximation, once the round trip of the light is equal to a multiple integer of the light wavelength, the optical resonance is satisfied. Equation 1 attempts to describe that phenomenon.
where no and R are the refractive index and radius of the micro-cavity, respectively, and l is a multiple integer indicating the circumferential mode number. Any infinitesimal change in the microsphere size or the index of refraction will lead to a change in the wavelength, as seen in the equation below.
2. Proposed Sensor Configuration, Fabrication, and Opto-Electronic Setup
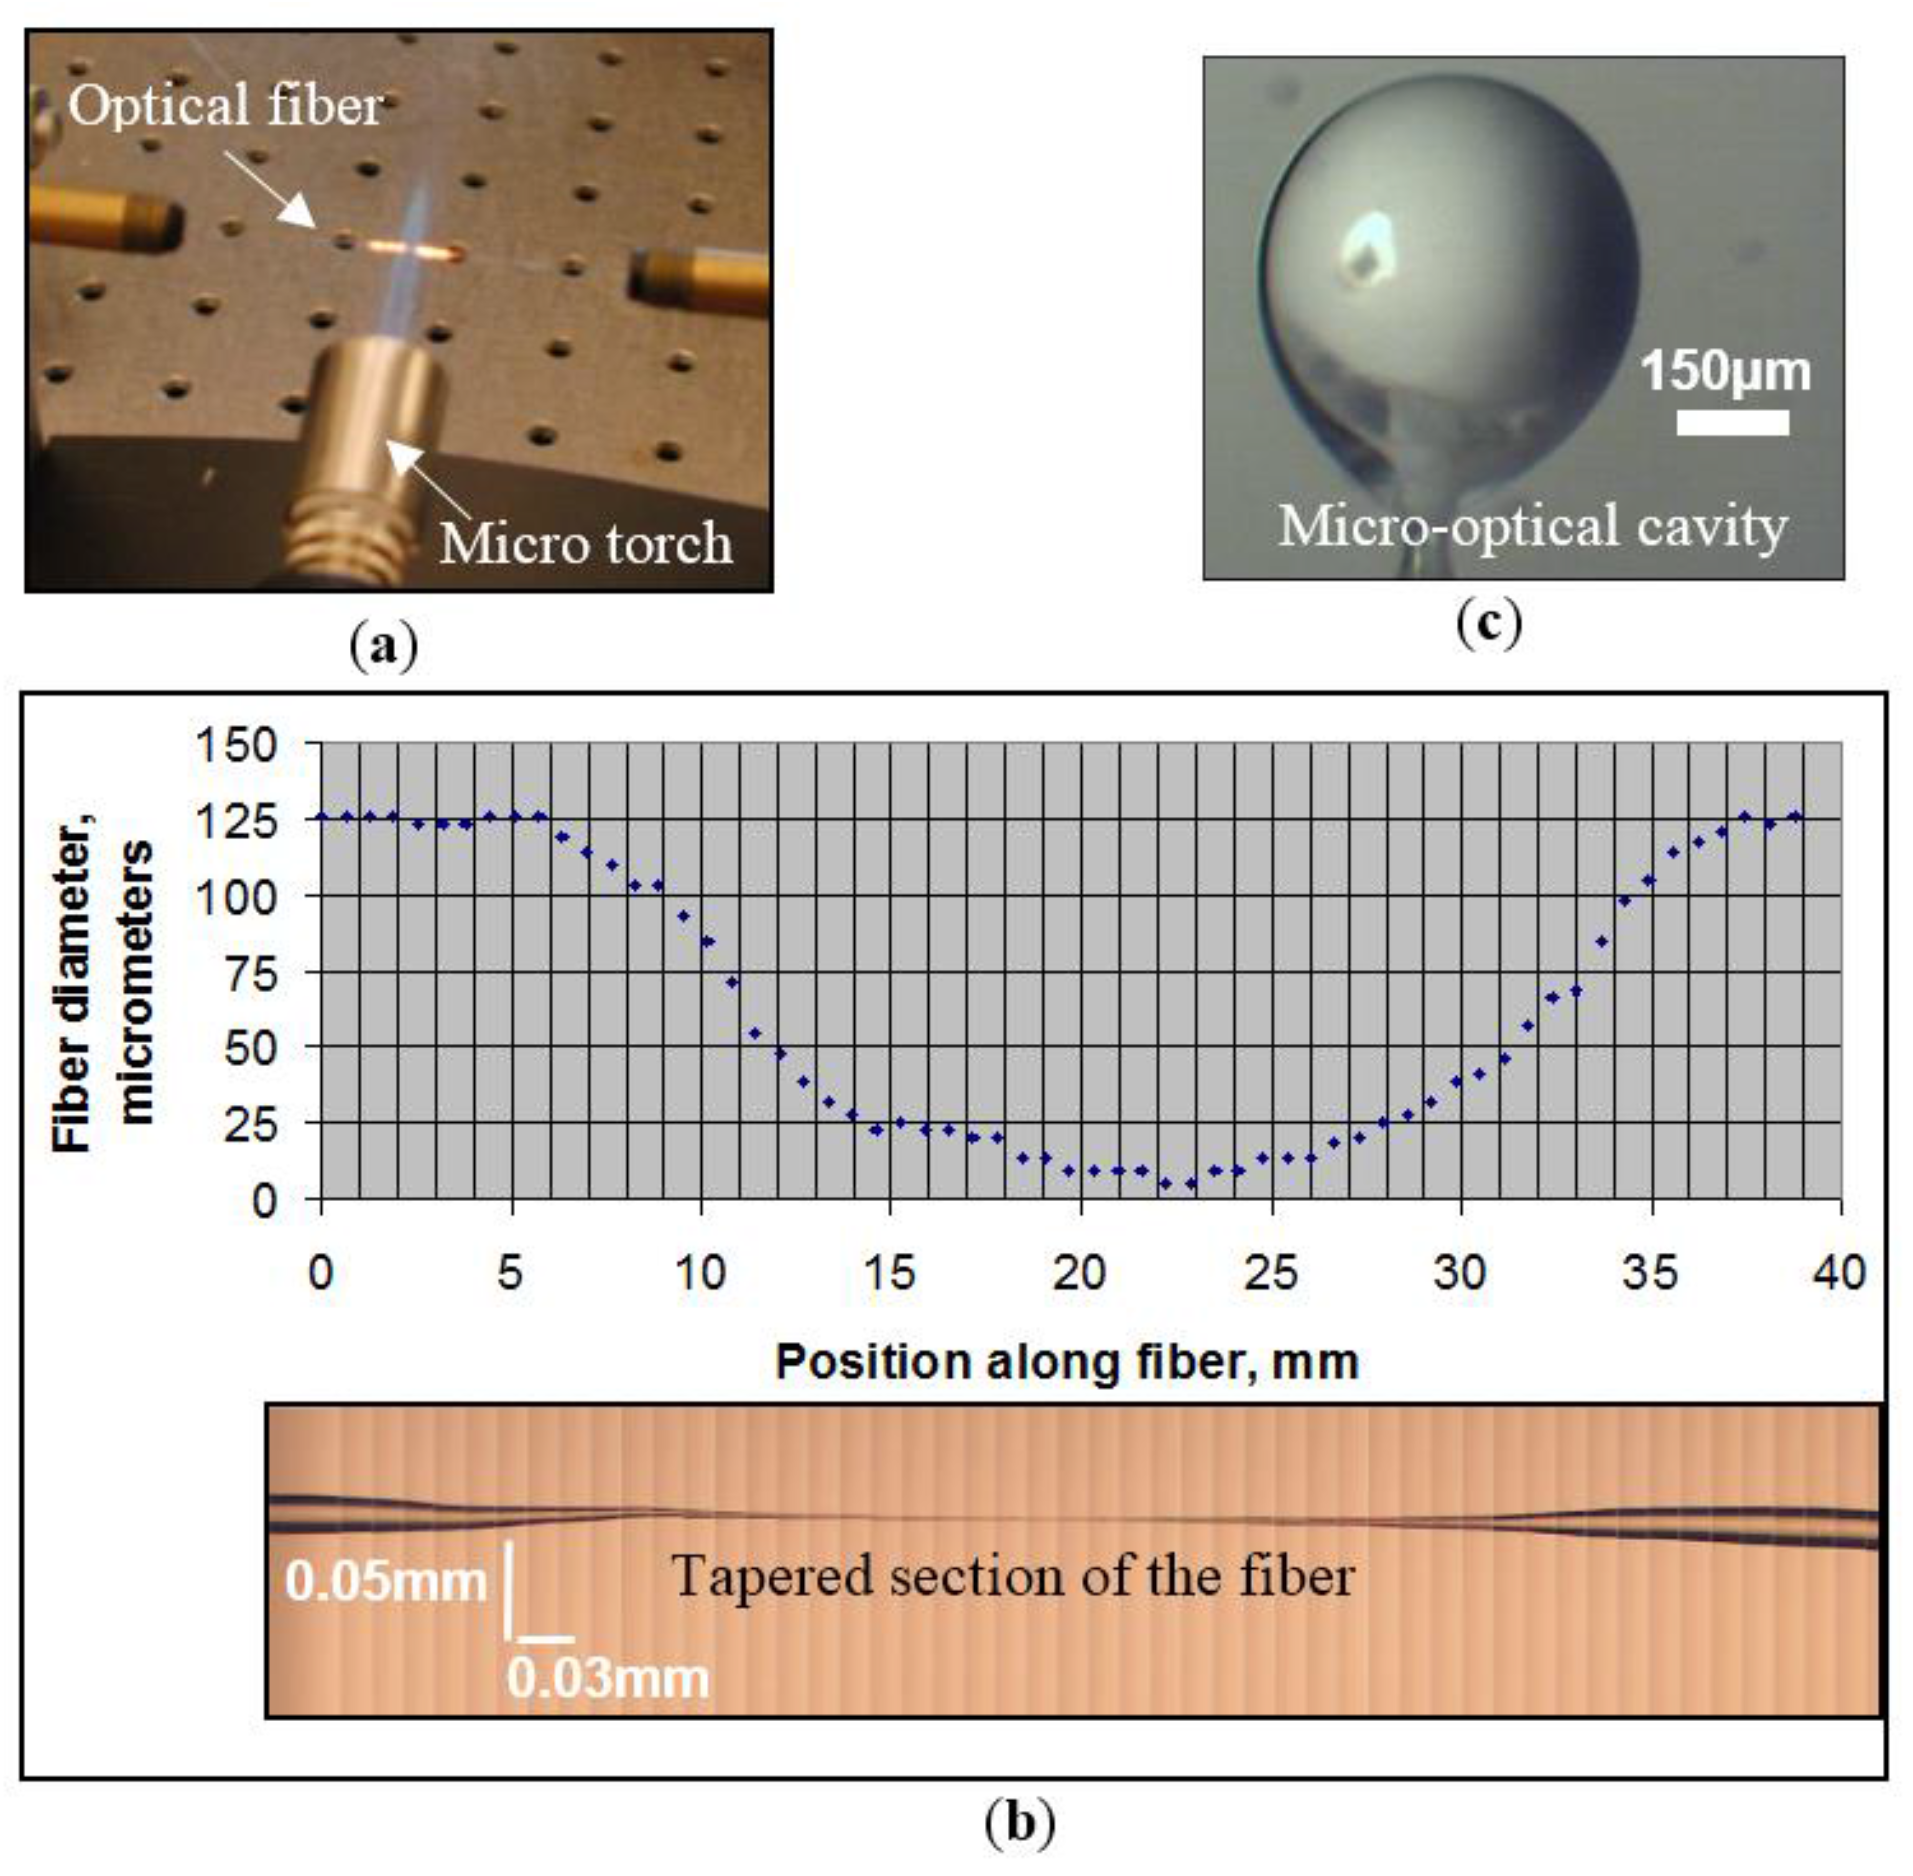
Studying the effect of the driving force of diffusion on these sensing elements using a high-quality factor resonator (with Q ≈ 107) is the main concern of this paper. We prepared the cavity for that function; the evanescent field outside the fiber needs to be extended in order to achieve efficient optical coupling between the micro-optical cavity and the fiber, as reported in [7]. This can be achieved by first removing the outermost protective buffer layer and then heating and stretching a portion of the fiber (with both the cladding and core) to create a tapered section with a minimum waist of 10 to 20 μm, as seen in Figure 1a,b, respectively. A micro-torch filled with butane is used in the present work to prepare a tapered section of the fiber.
The optical cavity is manufactured using a ~5 cm long piece of optical fiber which is first stripped of its plastic cladding using an optical stripper and then heated and stretched to provide a stem end (with a tip diameter of ~60 μm). The tip of this silica fiber is then dipped into a 60:1 polydimethylsiloxane (PDMS) polymer pool. Surface tension and the weight of the mixture allow for the formation of a cavity at the end of the stem, as shown in Figure 1c. The micro-cavity/stem assembly is placed in an oven at a temperature of ~100 °C for four hours to allow for proper curing of the polymer material. Figure 2 shows laser light coupled to the cavity using the tapered fiber.
Figure 3 shows a block diagram and a photograph of the opto-electronic setup for the proposed sensor design. The function generator supplies the tuning waveform to the laser controller, which thusly presents the same waveform in the electrical current to the laser to modulate its wavelength. The laser output is coupled directly into a single mode optical fiber which is cut up into two parts: one side is coupled to the sensor resonator (with 90% of the total intensity of the light) supplying the transmission spectra, and the second side is used as a reference signal (with ~10% of the total intensity). Every fiber is ended into a photograph diode as demonstrated. Both the transmission spectra and the reference signal are sampled utilizing a 16-bit analog-to-digital converter and processed by a host machine. The reference is utilized to normalize the transmission spectra. A software module, created in-house, investigates the normalized transmission spectra to monitor the WGM shifts.
The driving force of diffusion is acting on the outer surface of the sphere leading the vapor molecules to fill the gaps between the polymer molecules, in turn increasing the mass of the sphere, causing an increase in the sphere diameter and change in the optical cavity and its WGM. Figure 2 shows a tapered optical fiber used to couple the IR tunable laser where the WGM would be seen as sharp dips in the transmission spectrum (see Figure 2b).
3. Analysis and Mathematical Background
In 1855, Fick proposed a mathematical technique to represent the law of mass diffusion by adopting the mathematical equation of heat conduction derived earlier by Fourier 1822 [8]. The differential equation representing the one-dimensional diffusion is
where J is the flux or the rate of transfer per unit area of section, D is the diffusion coefficient, C is the concentration, and x is the direction of diffusion.
In polymeric and non-homogeneous systems, the diffusion coefficient depends on the concentration and varies from point to point. In most applications, diffusion is restricted to one direction, so a gradient of concentration is present and diffusion only occurs along the x-axis [9]. The differential equation representing the two-dimensional diffusion is given by
In our case where the diffusion is radial, the diffusion equation for a constant diffusion coefficient takes the form.
where R is the radius of the optical cavity and r is the distance from the center of the sphere and any point inside it as shown in Figure 4.
We can assume a function U where r is the only variable and C is constant referring to the concentration, then Equation (5) can be represented as
In this paper, we are dealing with the non-steady-state case with constant surface concentration and initial distribution f(r) this method is called “time lag method assuming a constant diffusion coefficient”. This means that U can be expressed as
where C0 is the concentration of the diffusant on the surface of the polymer.
If the initial concentration of the diffusant in the sphere is uniform, C1 and the surface concentration is maintained, C0 and the concentration at the center is given by the limit as , then the solution of the differential Equation becomes
Equation (8) can be represented in terms of the diffusant mass instead of the concentrations. The total amount of diffusing substance entering or leaving the sphere is given by
where Mt is the diffusant mass entering the sphere while time goes until it reaches M∞, which is the equilibrium or the saturation mass.
This equation can be accurately replaced for , as indicated by Reference [10].
and can be approximated with very little error for by
By substituting in Equations (10) and (11), we can estimate the diffusant mass entering the sphere at time t which acts at the external force acting on the optical sphere until the sphere reaches the equilibrium state, where the refractive and swelling forces are equal. Where the refractive force is a gradient force on the particles are (generally) attracted towards high intensity regions, which we refer to the effect on the interface between two different mediums. Because the resonator is made from polymeric material submersed in vapor medium, this kind of force will be generated.
Equations (10) and (11) are in terms of two main constants, which are the equilibrium mass M∞ and the diffusion constant D. To calculate M∞, Equation (12) can be used assuming that the surface concentration is approximately equal to the concentration of the organic solvent vapor in the atmosphere.
The diffusion coefficient can be approximately calculated with an error of about 0.001% [8] by observing the time of adsorption process experimentally for a system in which the diffusion coefficient is constant [11,12,13]. The value of this constant can be determined from Equation (13).
where t1/2 is the half time of an adsorption process and R is the sphere radius.
Micro-Cavity Sensing Analysis
In order to study the effect of the driving force of diffusion on the micro-optical cavity, the cavity is modeled as a spring with stiffness Ks and the driving force of diffusion is acting as an external force exerted on it. The diffusion external force is the weight of the diffusant mass entering the sphere. It can be expressed as
So, the equation governing the cavity deformation is given by
such that δ is the change in the cavity radius and g is the gravitational acceleration.
A numerical model was conducted to show results for the driving force of diffusion of two different solvents: ethyl alcohol (ethanol, C2H6O) and methyl alcohol (methanol, CH3OH). The numerical models were applied assuming that the solvents were at room temperature (fixed at 25 °C). Figure 5 shows the driving force of diffusion numerically of the ethanol solvent and the methanol solvent, respectively. The resulting refractive force operates in opposition to the swelling force. There is a maximum degree of swelling shown in Figure 5, at which point these two forces are at equilibrium. It is also clear that the maximum degree of swelling for the ethanol is higher than methanol.
A parametric study was carried out to show the effect of the micro-cavity stiffness Ks on the change of WGM shifts (dλ). The study shows that the lower stiffness for the cavity could experience more shifts in its WGM shifts. For the ethanol case, the cavities with Ks = 0.00049 N/m and 0.49 N/m can have WGM shifts when they reach the maximum degree of swelling up to 1000 pm and 1 pm, respectively. This means a three orders of magnitude enhancement of the sensing element just by selecting a proper stiffness or size of the cavity.
4. Experimental Work
The experimental work carried out to prove the mathematical and numerical concept for the effect of the swelling in the micro-optical cavity will be discussed in this section. Linear polymers are capable of dissolving in appropriate solvents to form homogenous polymer solutions. However, if crosslinks are introduced to tie the chains into an infinite network, the polymer can no longer dissolve. Instead, the solvent is absorbed into the polymer network, giving rise to the phenomenon of swelling. For the sensor proposed in this paper, the experiments were performed using a PDMS 60:1 cavity with 500 µm in diameter. Organic solvent filled the tube with a certain amount then started to put the cavity on the top of the solvent without touching it. Additionally, the experiments were conducted at the same conditions as the numerical model. The temperature was kept constant at 25 °C using a temperature control feedback circuit through a thermocouple assigned to the same plan of the sensing element inside the tube. The experiments are done by exposing the cavity directly to the driving force of diffusion that comes from the solvent. When the organic solvent is vaporized in the atmosphere of the tube, the solvent fills the network, chains are extended, and the cavity starts to adsorb a certain amount of the vapor, causing an increase in the PDMS cavity size. The adsorbed mass acts as the force that leads to a certain change in the cavity’s WGM. Detecting that change by tracking the WGM shifts could give an indication of the amount of the diffusing substance entering the microsphere. Ethanol and methanol are used in this paper as candidates to study their driving force of diffusion on the cavity. A schematic and photograph for the real experiments are shown in Figure 6.
5. Results and Discussion
Figure 7 shows the experimental change in WGM shifts due to the driving force of diffusion of ethanol and methanol. The experimental data shows that the sensing element is subjected to the driving force of diffusion at time ~1900 s when the sensing element gets inside the tube filled with solvent. The sensing element starts to experience an increase in its size with respect to the time because the diffusion of solvents fills the network chains of the polymers. After ~2500 s, the cavity reaches the maximum degree of swelling, at which point these two forces are at equilibrium. When the cavity starts to get outside the tube at ~3500 s, it returns to its original size when the experiment was started. From the experimental results in Figure 7 and by substituting in Equation (13), we can conclude that the diffusion coefficients for the ethanol and methanol solvents are 3.2667 × 10¹¹ and 3.7692 × 10¹¹, respectively. As shown in Figure 8, the experimental results agree reasonably well with the analytical results of the change in the WGM shifts for each solvent.
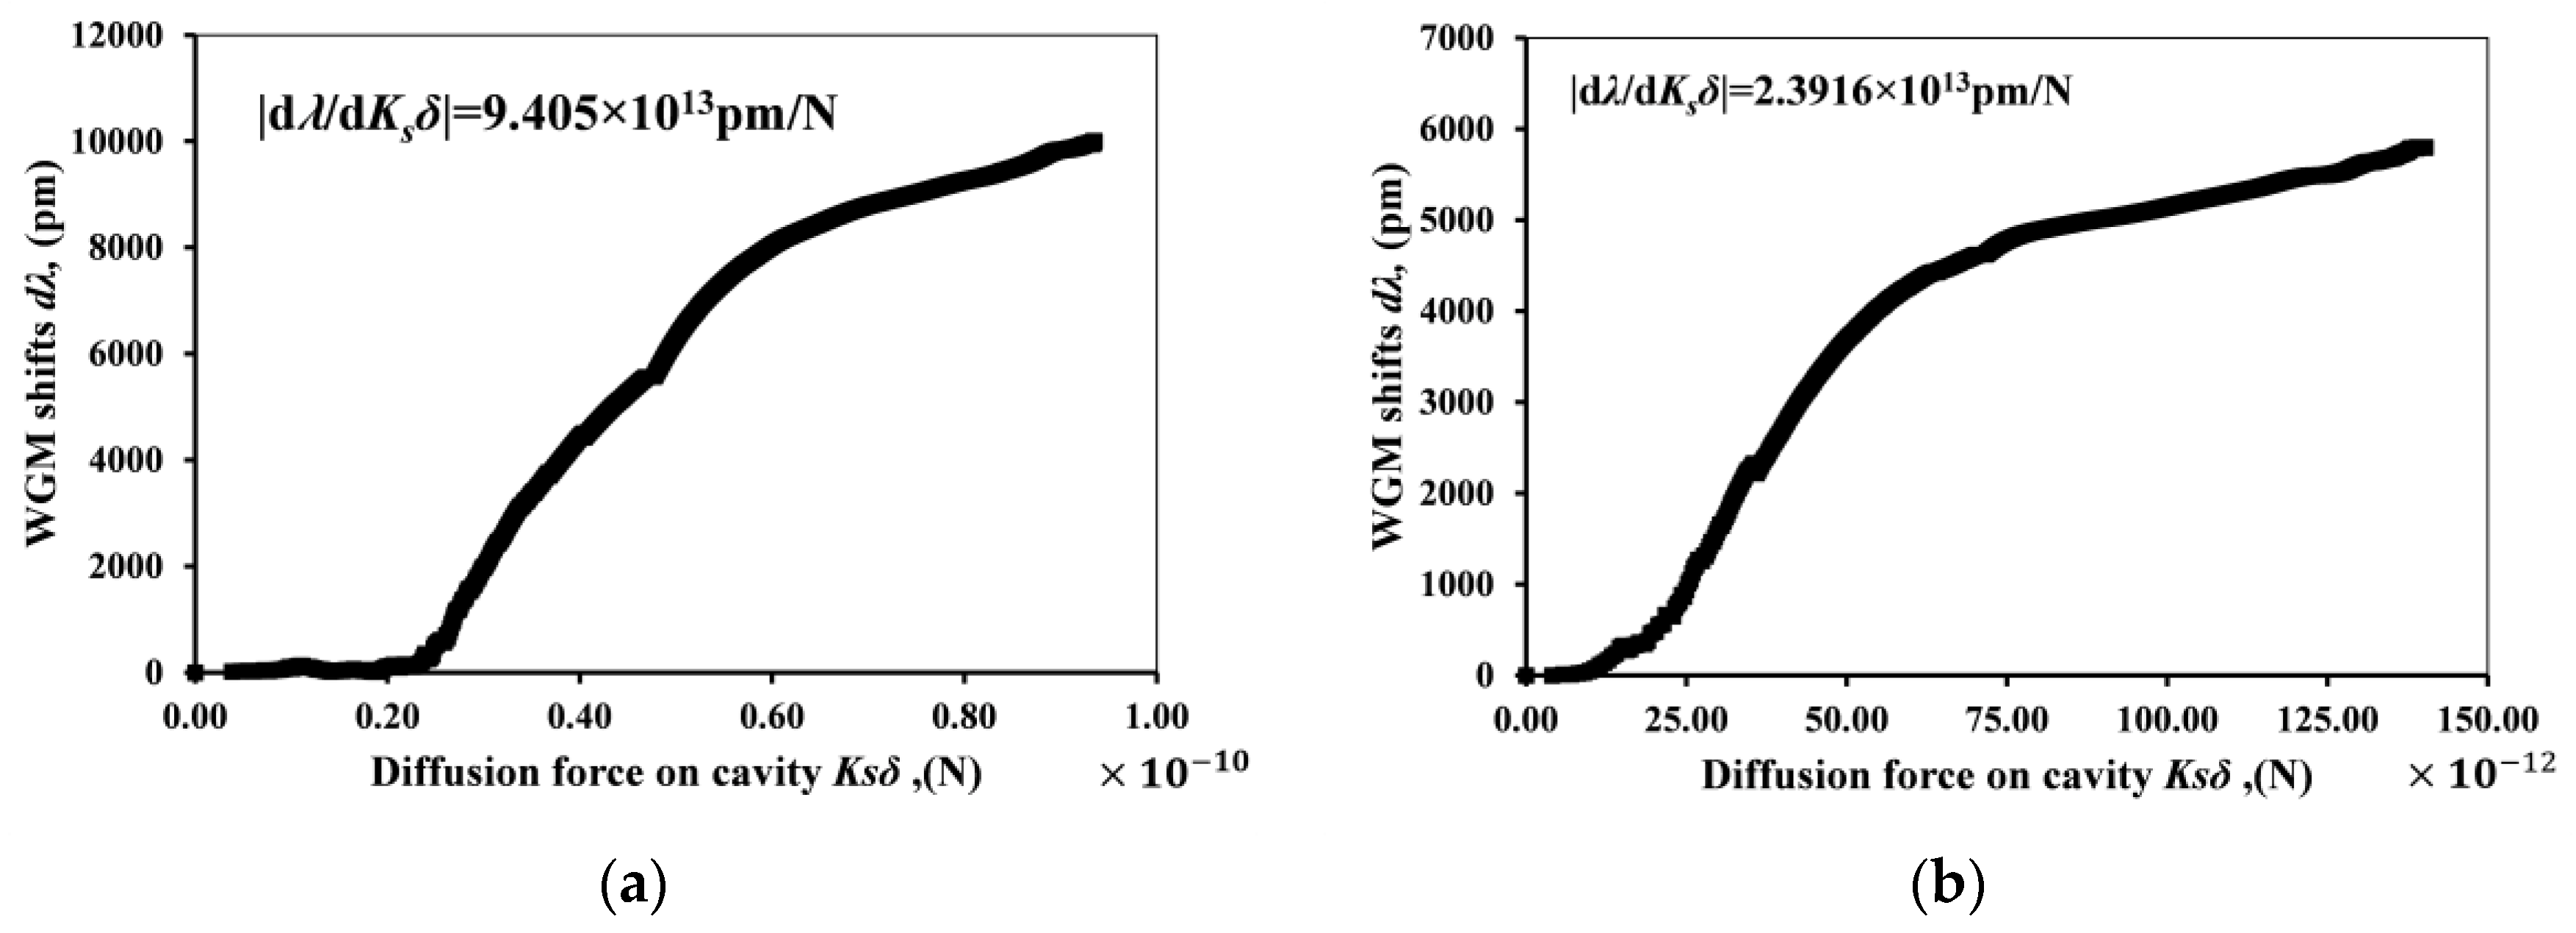
The corresponding sensitivity plot is presented in Figure 9. The best fit of the data using least squares method was used, and indicates a sensitivity of dλ/dKsδ = 9.405 × 10¹³ pm/N for ethanol and a sensitivity was dλ/dKsδ = 2.3916 × 10¹³ pm/N for methanol. The standard deviation of the data in the case of using ethanol was σλ = 0.34 pm, and in the case of using methanol it was σλ = 0.22 pm. The results indicate a swelling force resolution of (dKsδ/dλ) σλ ≈ 3.61 fN when using ethanol as an organic solvent and (dKsδ/dλ) σλ ≈ 9.19 fN for methanol.
6. Conclusions
The results show that polymeric micro-optical cavities can be used for high-resolution detection of the driving force of diffusion for organic solvents detection based on WGM. The sensor resolution was ~3.61 fN and ~9.19 fN for ethanol and methanol, respectively. The numerical and analytical results agree reasonably well with the experimental results. Recently, soft polymers have been used as materials for the fabrication of optical cavities. These results are also the first step towards the design and development of biological sensors that are based on this principle. Breath diagnosis can use this design in diabetes diagnosis since a solvent like acetone concentration in human breath leads to a quick, convenient, accurate, and painless breath diagnosis of diabetes. Future work will focus on the investigation of several new polymers and composite cavities geometries to improve the sensitivity for the bio-medical applications.
Author Contributions
Amir R. Ali and Catherine M. Elias contributed equally in carrying out the analytical studies, setting up experiments and collecting and analyzing data. In addition, both authors edited the paper.
Conflicts of Interest
The authors declare no conflicts of interest.
References
- George, S.C.; Thomas, S. Transport phenomena through polymeric systems. Transp. Phenom. Polym. Syst. 2001, 26, 985–1017. [Google Scholar] [CrossRef]
- Park, G.S. Transport principles—Solution, diffusion and permeation in polymer membranes. In Synthetic Membranes: Science, Engineering and Applications, 2nd ed.; Springer: Dordrecht, The Netherlands, 1986; pp. 57–107. [Google Scholar]
- Yan, Y.Z.; Zou, C.L.; Yan, S.B.; Sun, F.W.; Liu, J.; Xue, C.Y.; Zhang, Y.G.; Wang, L.; Zhang, W.D.; Xiong, J.J. Robust spot-packaged microsphere-taper coupling structure for in-line optical sensors. IEEE Photonics Technol. Lett. 2011, 23, 1736–1738. [Google Scholar] [CrossRef]
- Ali, A.R.; Ioppolo, T.; Ötügen, M.V. High-resolution electric field sensor based on whispering gallery modes of a beam-coupled dielectric resonator. In Proceedings of the 2012 International Conference on Engineering and Technology (ICET), Islamabad, Pakistan, 8–9 October 2012; pp. 1–6. [Google Scholar]
- Guan, G.; Arnold, S.; Otugen, V. Temperature measurements using a microoptical sensor based on whispering gallery modes. AIAA J. 2006, 44, 2385–2389. [Google Scholar] [CrossRef]
- Ioppolo, T.; Ötügen, M.V. Magnetorheological polydimethylsiloxane micro-optical resonator. Opt. Lett. 2010, 35, 2037–2039. [Google Scholar] [CrossRef] [PubMed]
- Ioppolo, T.; Ötügen, V.; Ayaz, U. Development of whispering gallery mode polymeric micro-optical electric field sensors. J. Vis. Exp. 2013, e50199. [Google Scholar] [CrossRef] [PubMed]
- Crank, J. The Mathematics of Diffusion; Oxford University Press: Oxford, UK, 1979. [Google Scholar]
- Suloff, E.C. Sorption behavior of an aliphatic series of aldehydes in the presence of poly (ethylene terephthalate) blends containing aldehyde scavenging agents. In Doctoral Dissertation; Virginia Polytechnic Institute and State University: Blacksburg, VA, USA, 2002. [Google Scholar]
- Karimi, M. Diffusion in Polymer Solids and Solutions; Markoš, J., Ed.; INTECH Open Access Publisher: Rijeka, Croatia, 2011. [Google Scholar]
- Atmani, F.M.; Maghri, I.; Elkouali, M.; Talbi, M.; Abdlhak Elbrouz, R. Ethanol diffusion in polyethylene vinyl acetate: Modelling and experimentation. Glob. J. Sci. Front. Res. 2014, 5, 13. [Google Scholar]
- Mansouri, S. Diffusion of nitric acid in polyethylene vinyl acetate: Modelisation and experimentation. Int. J. Adv. Sci. Tech. Res. 2014, 4, 450–458. [Google Scholar]
- Atmani, R.; Moubarak, F.; M’hammed El Kouali, M.T. Diffusion of heptane in polyethylene vinyl acetate: Modelisation and experimentation. IOSR J. Appl. Chem. (IOSR-JAC) 2014, 7, 82–86. [Google Scholar] [CrossRef]
Figure 1.
Photograph of: (a) heating and stretching process to taper the fiber with a micro-torch filled with butane; (b) tapered fiber; diameter vs. length; (c) typical micro-optical cavity used as a sensor.
Figure 1.
Photograph of: (a) heating and stretching process to taper the fiber with a micro-torch filled with butane; (b) tapered fiber; diameter vs. length; (c) typical micro-optical cavity used as a sensor.

Figure 2.
(a) Photograph of a typical coupling to the micro-cavity through the tapered section of the single mode optical fiber; (b) Whispering gallery optical modes (WGM) seen as sharp dips in the transmission spectrum.
Figure 2.
(a) Photograph of a typical coupling to the micro-cavity through the tapered section of the single mode optical fiber; (b) Whispering gallery optical modes (WGM) seen as sharp dips in the transmission spectrum.
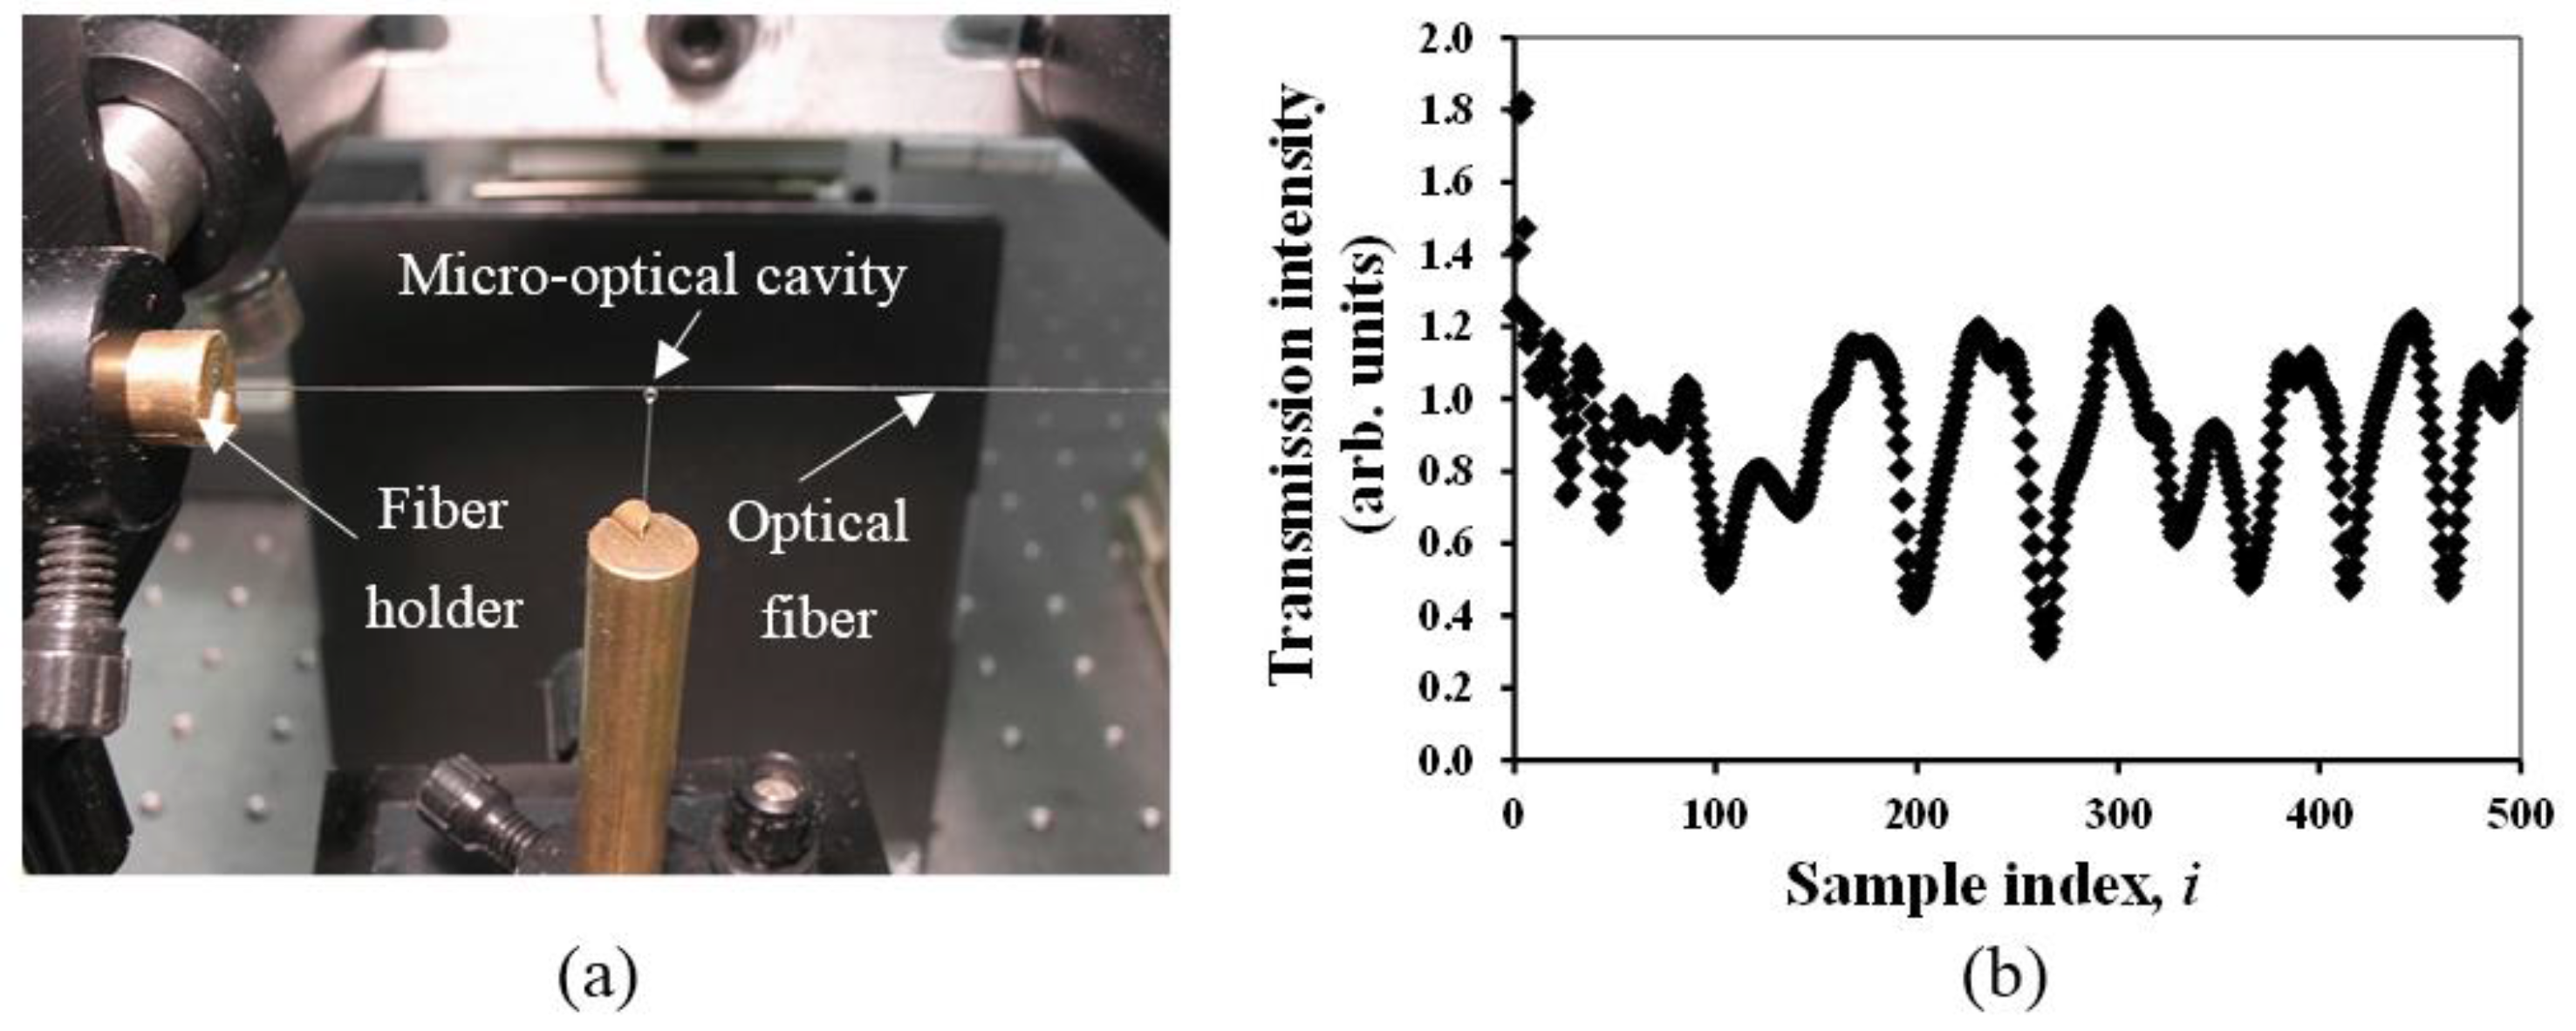
Figure 3.
Typical connection with the Data Acquisition Card (DAQ): (a) schematic; (b) photograph of the opto-electronic setup.
Figure 3.
Typical connection with the Data Acquisition Card (DAQ): (a) schematic; (b) photograph of the opto-electronic setup.
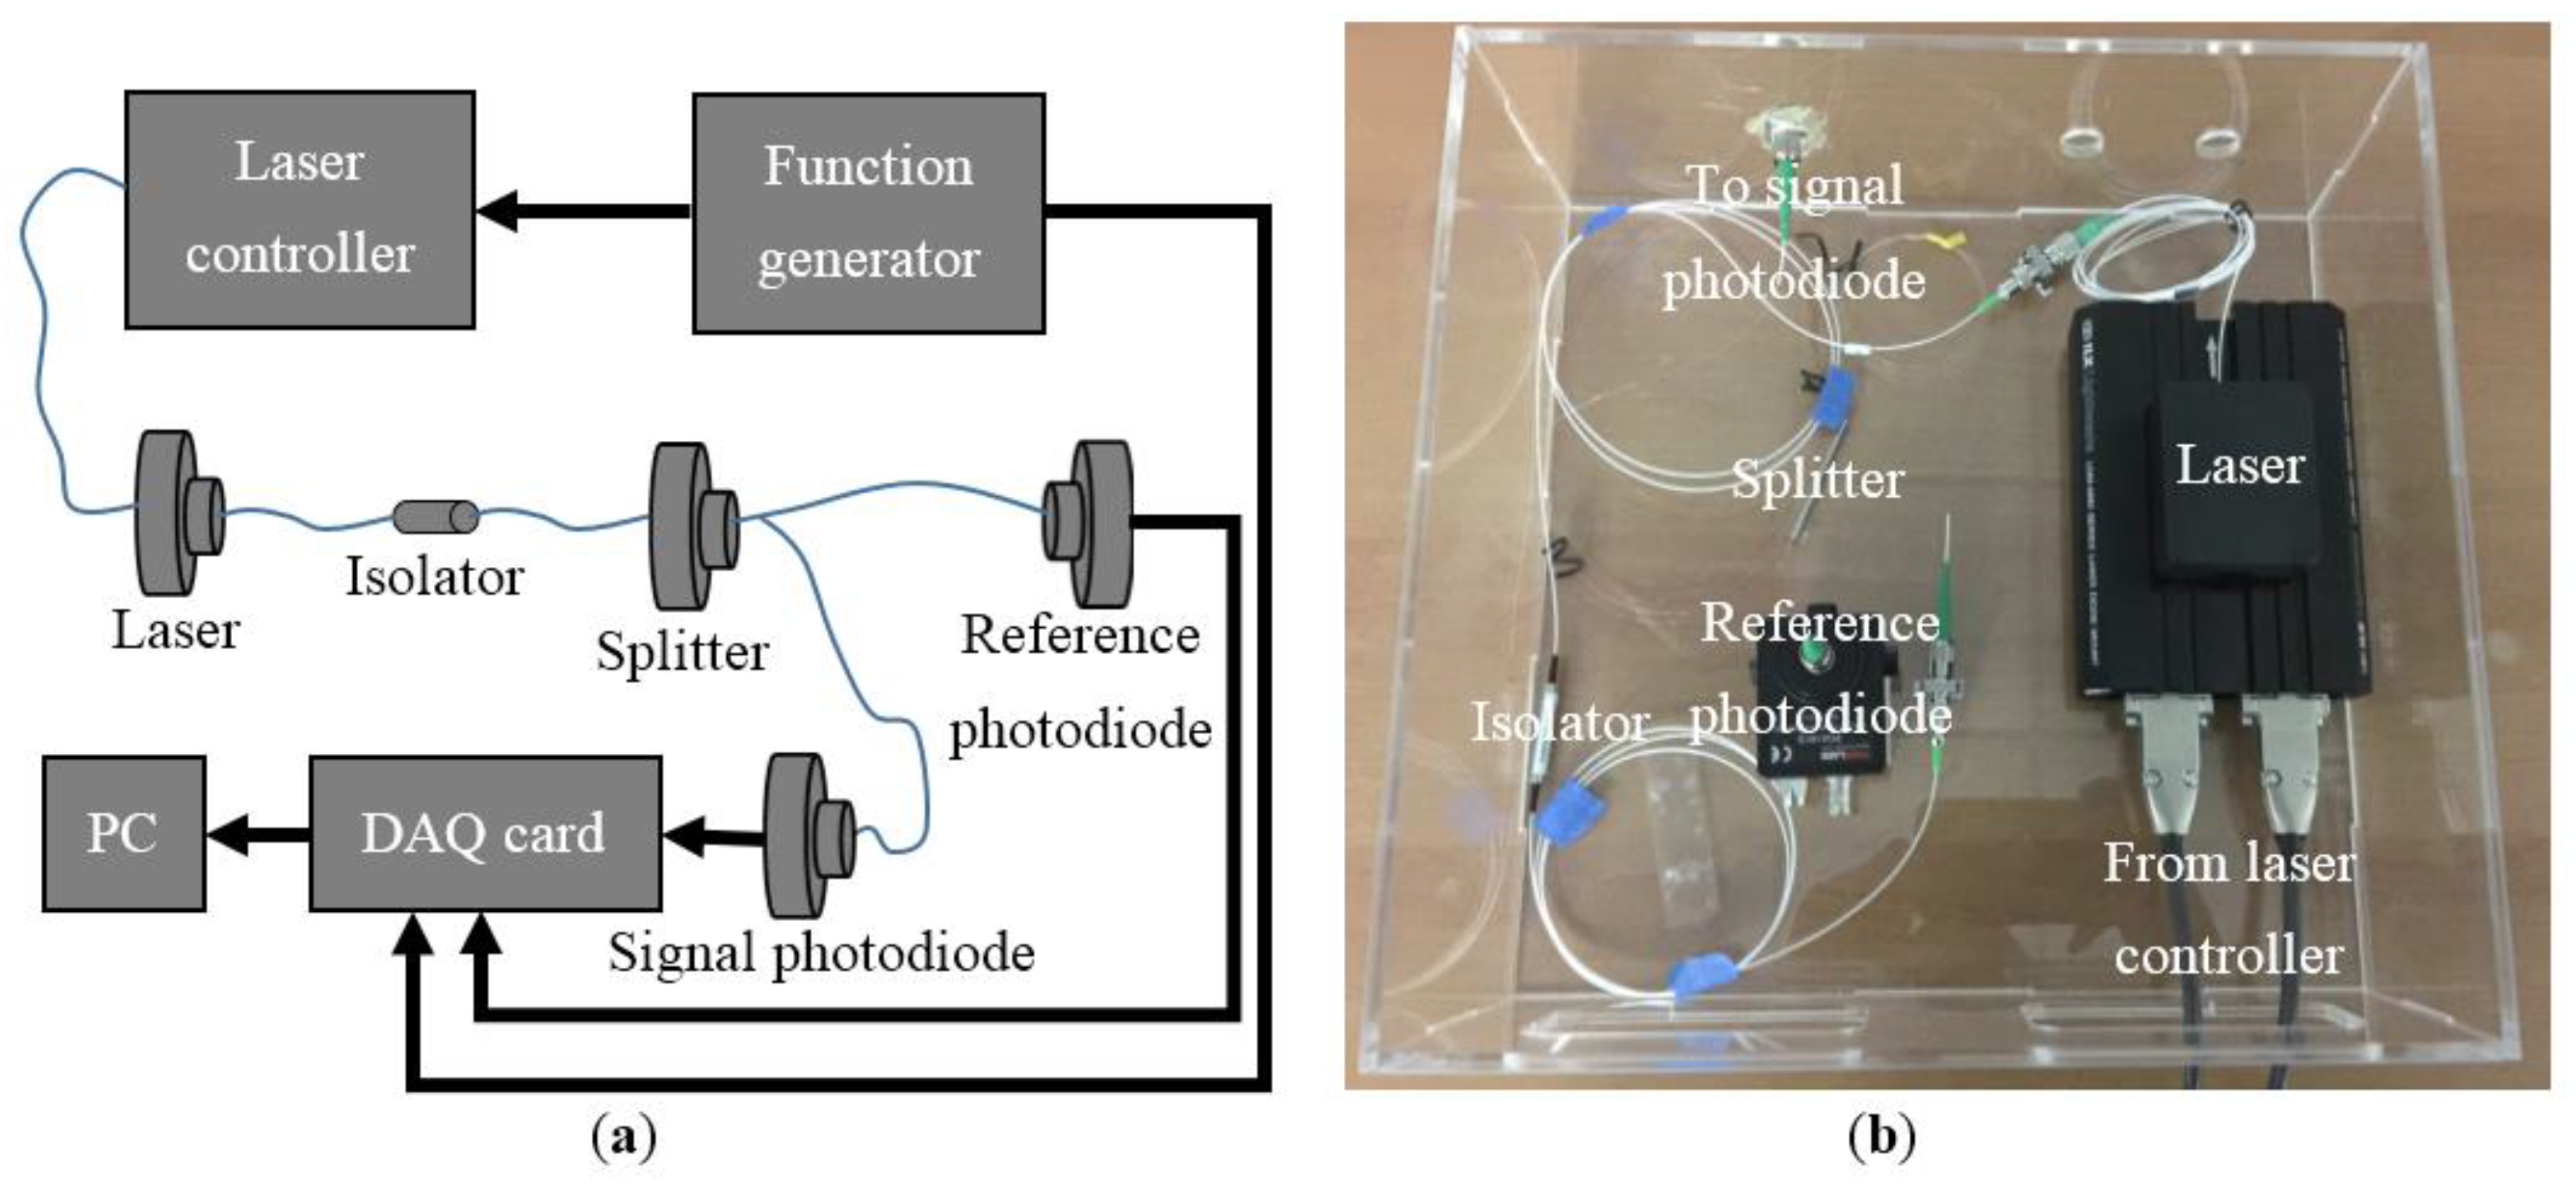
Figure 4.
Circular cross section of the cavity with radius R.
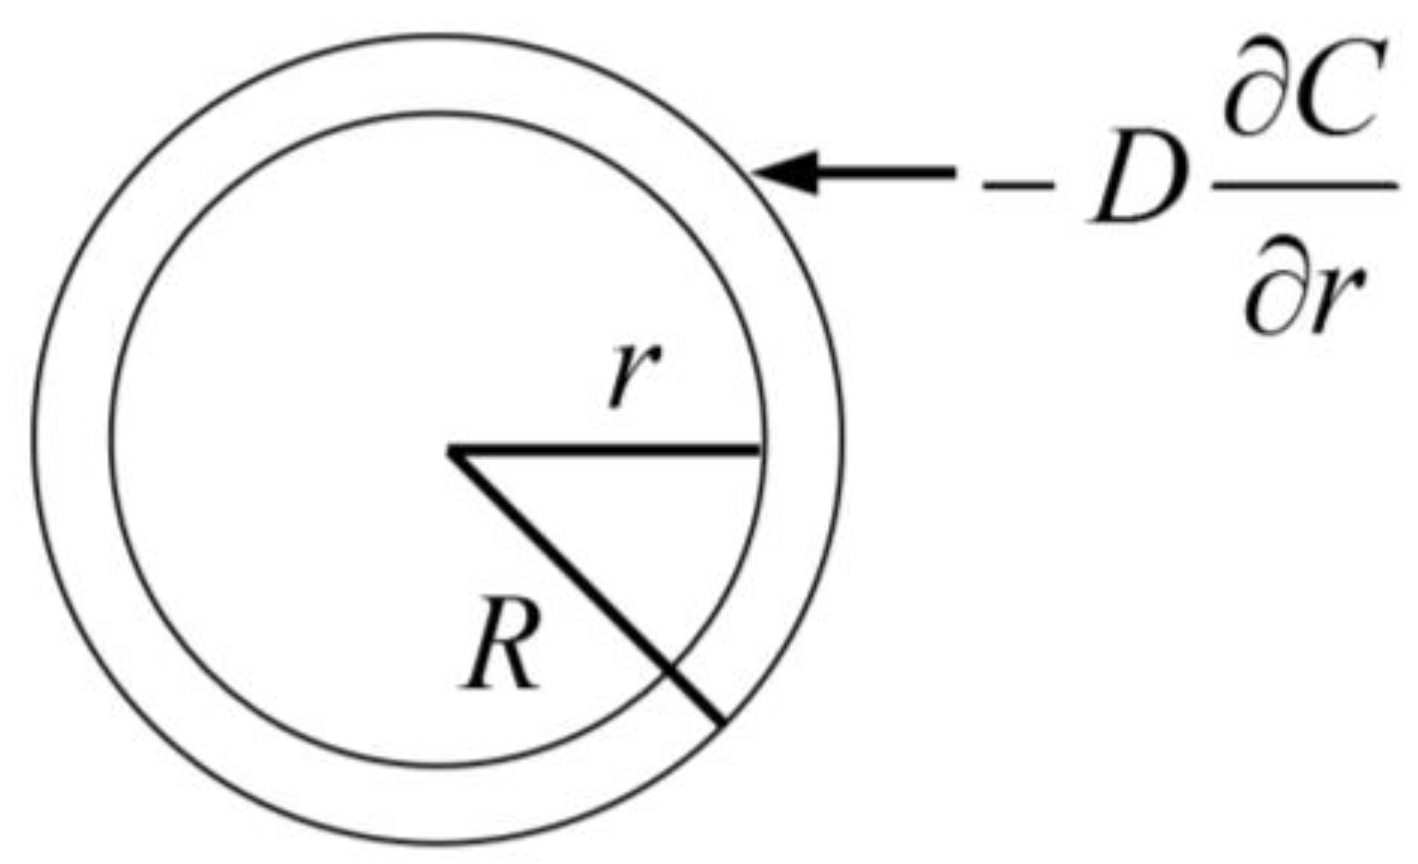
Figure 5.
Numerical analysis for driving force of diffusion action on cavity for: (a) ethanol; (b) methanol.
Figure 5.
Numerical analysis for driving force of diffusion action on cavity for: (a) ethanol; (b) methanol.
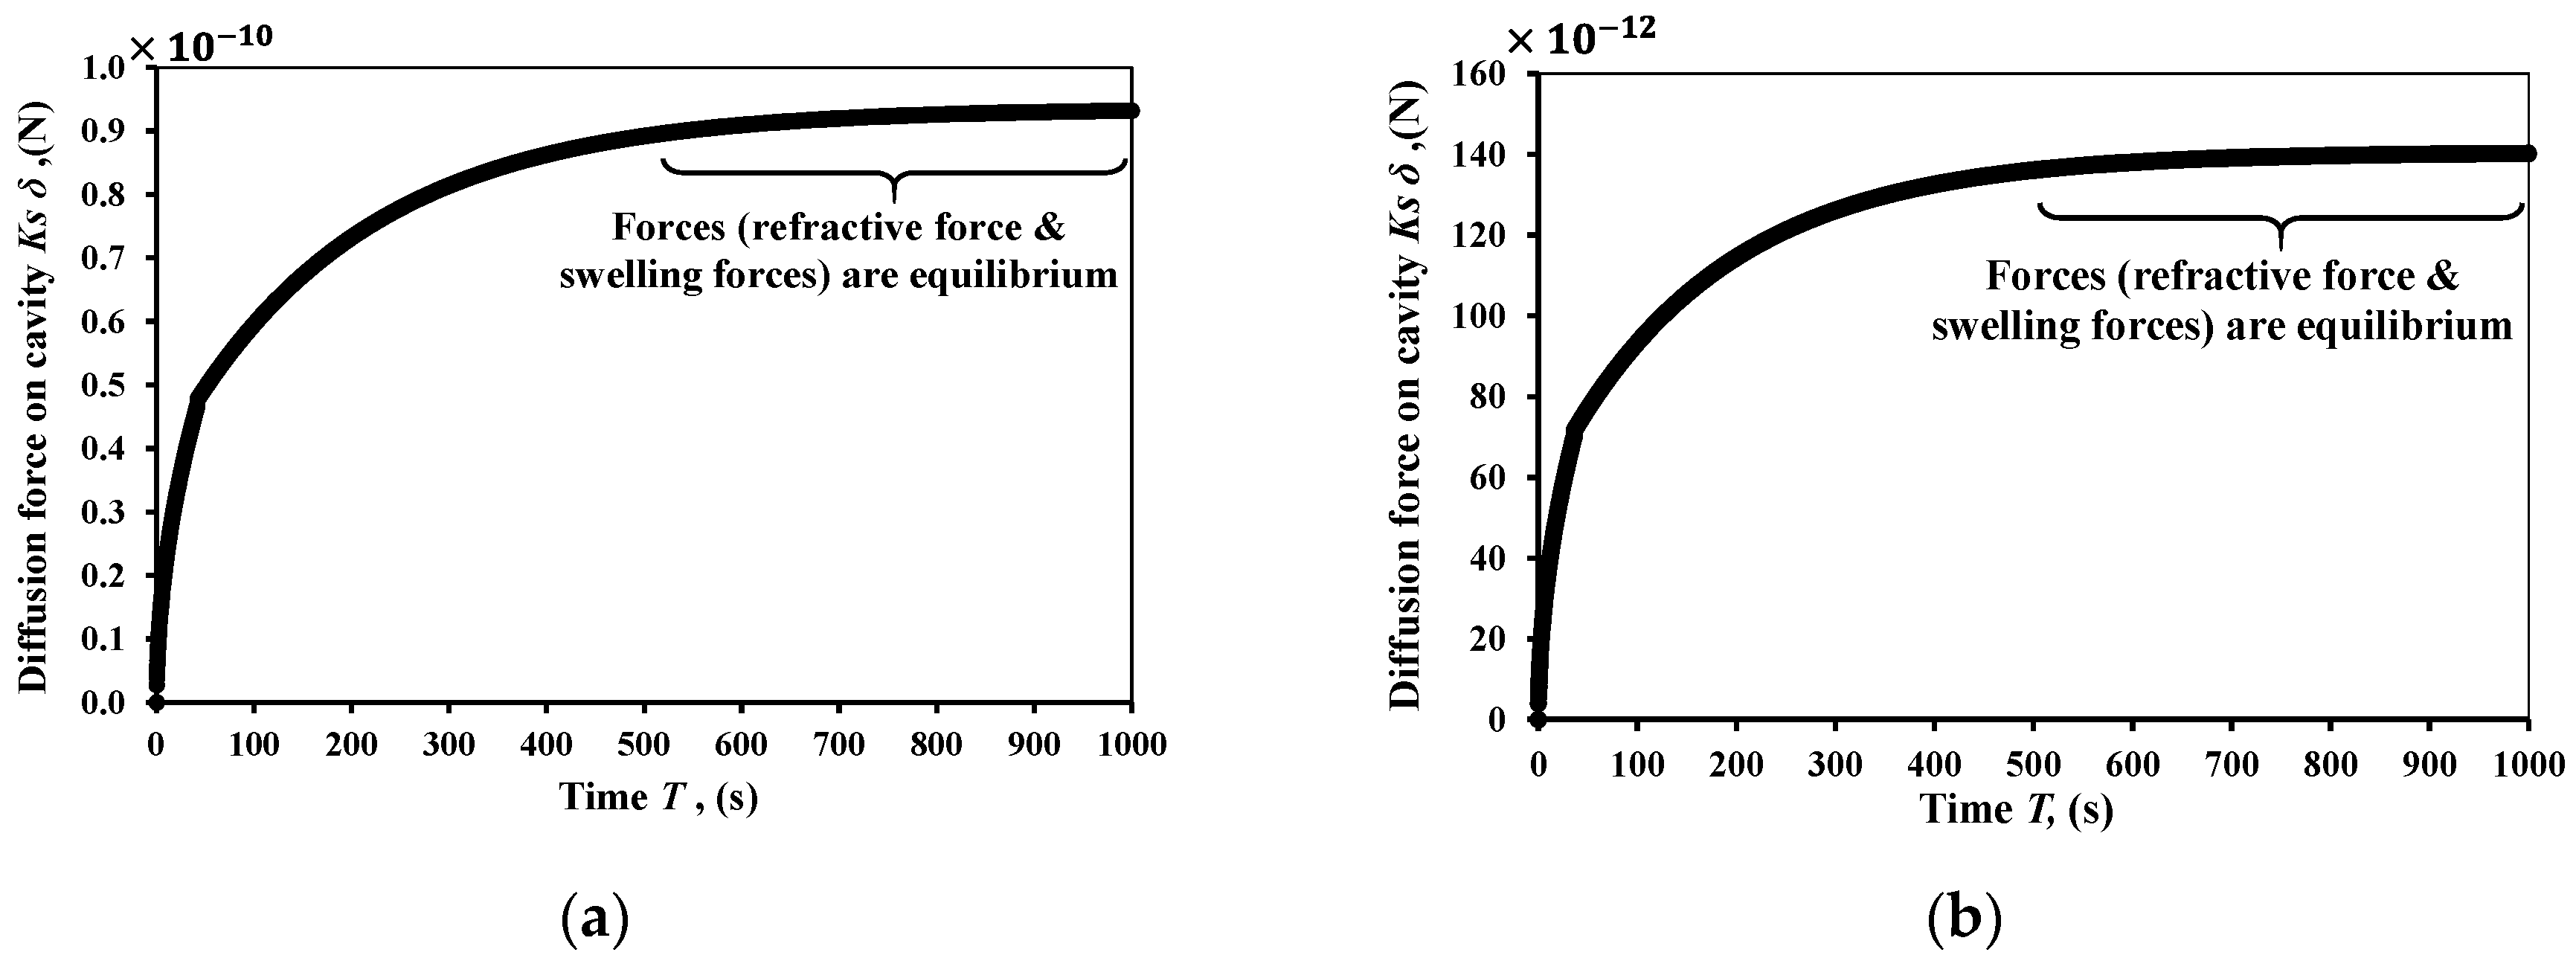
Figure 6.
Experimental setup for the PDMS cavity: (a) schematic and (b) photograph show the optical sensors coupled to the fiber inside the tube.
Figure 6.
Experimental setup for the PDMS cavity: (a) schematic and (b) photograph show the optical sensors coupled to the fiber inside the tube.
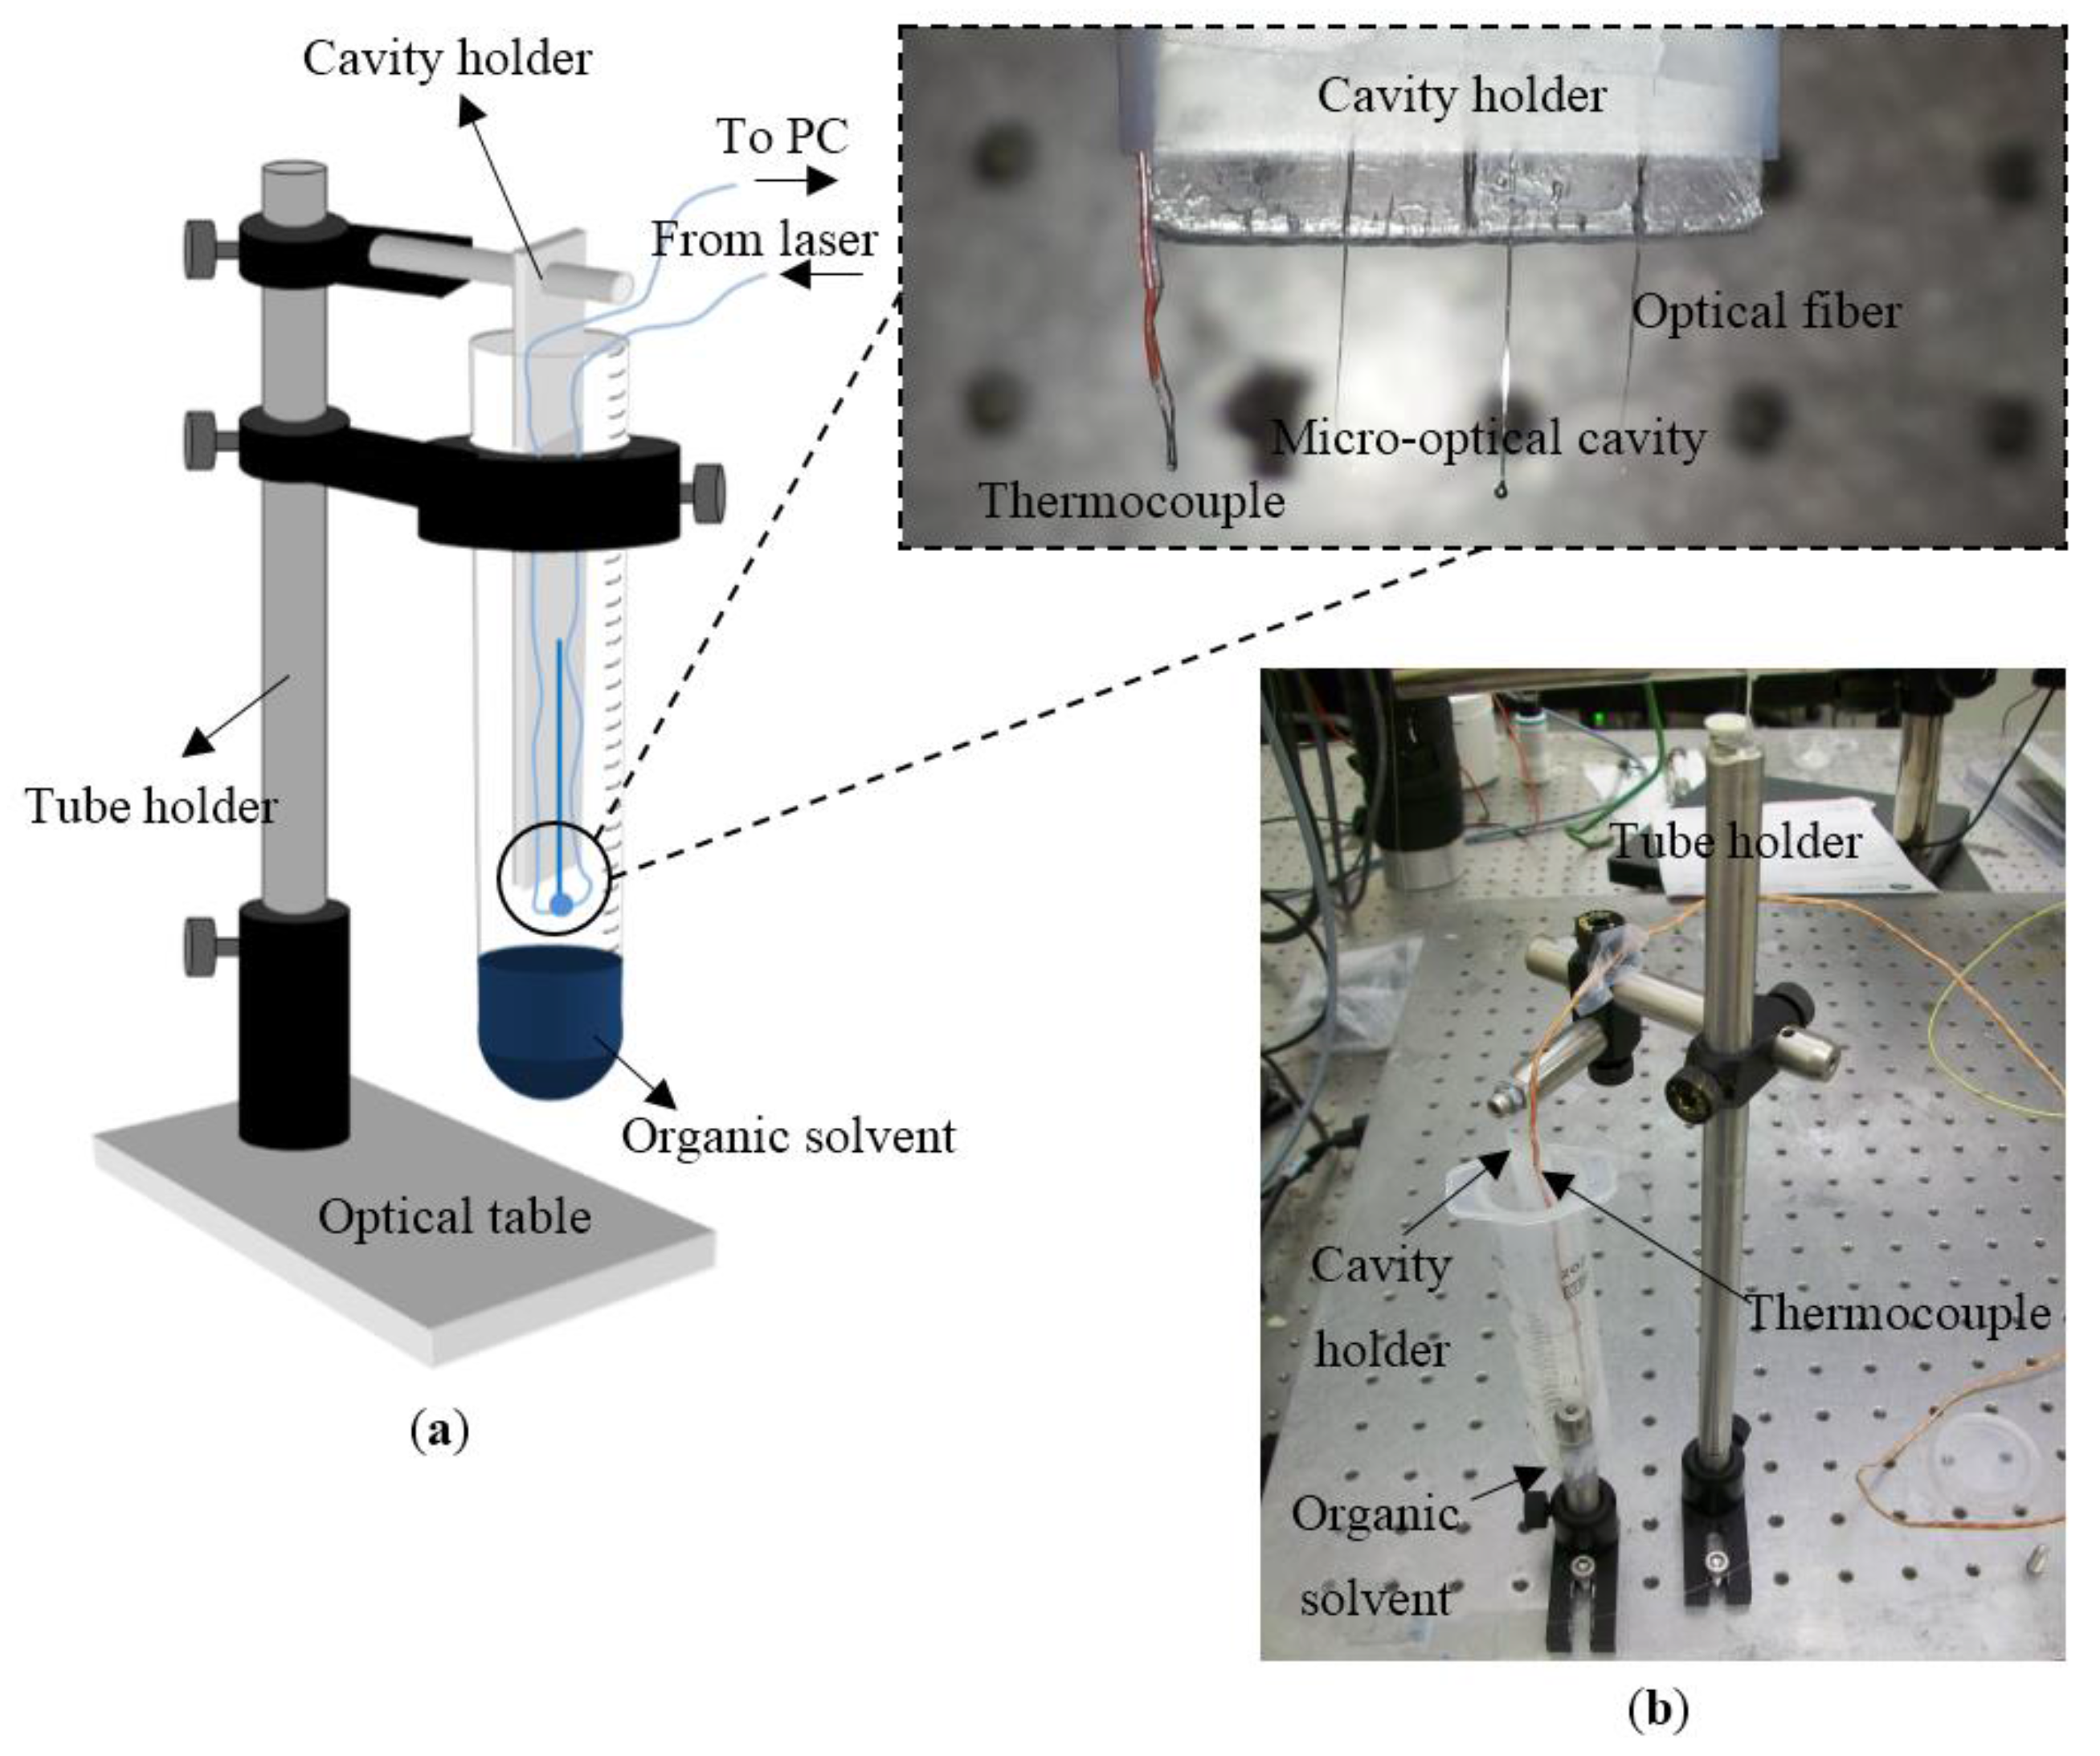
Figure 7.
WGM shifts for the cavity under the driving force of diffusion of the organic solvent.
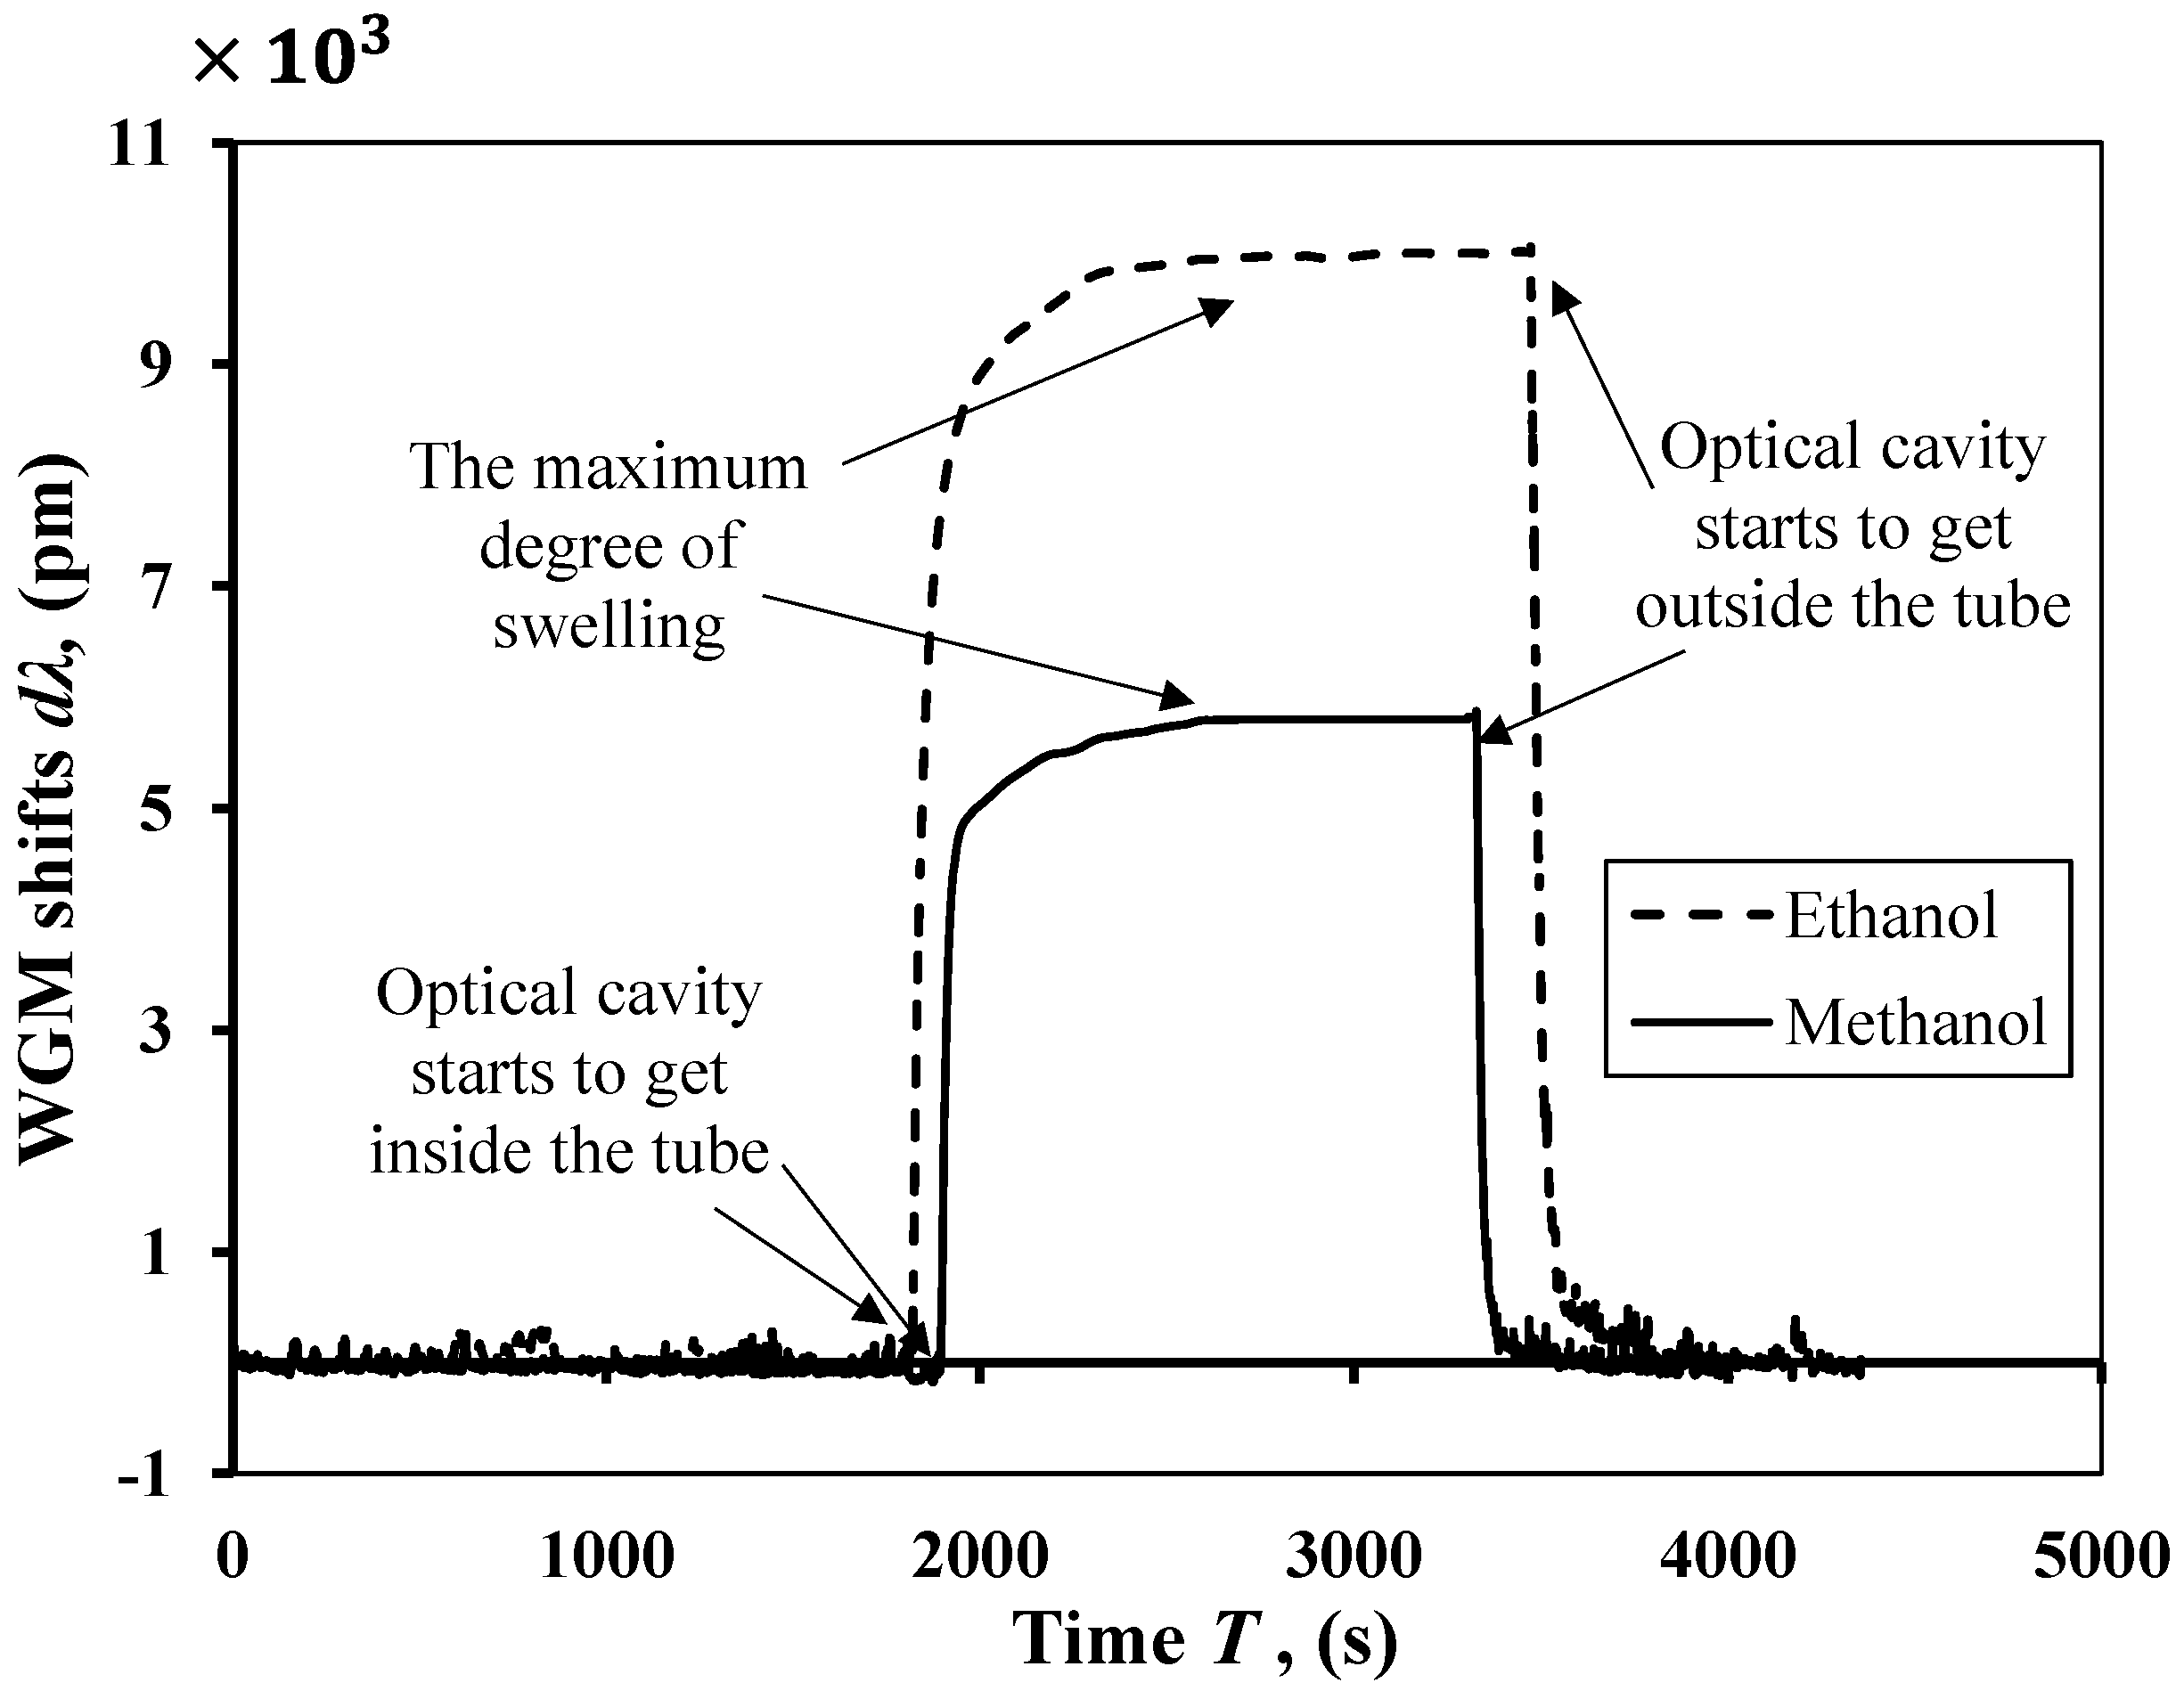
Figure 8.
Comparison of experimental results with analytical prediction for the cavity under the effect of driving force of diffusion for ethanol and methanol.
Figure 8.
Comparison of experimental results with analytical prediction for the cavity under the effect of driving force of diffusion for ethanol and methanol.
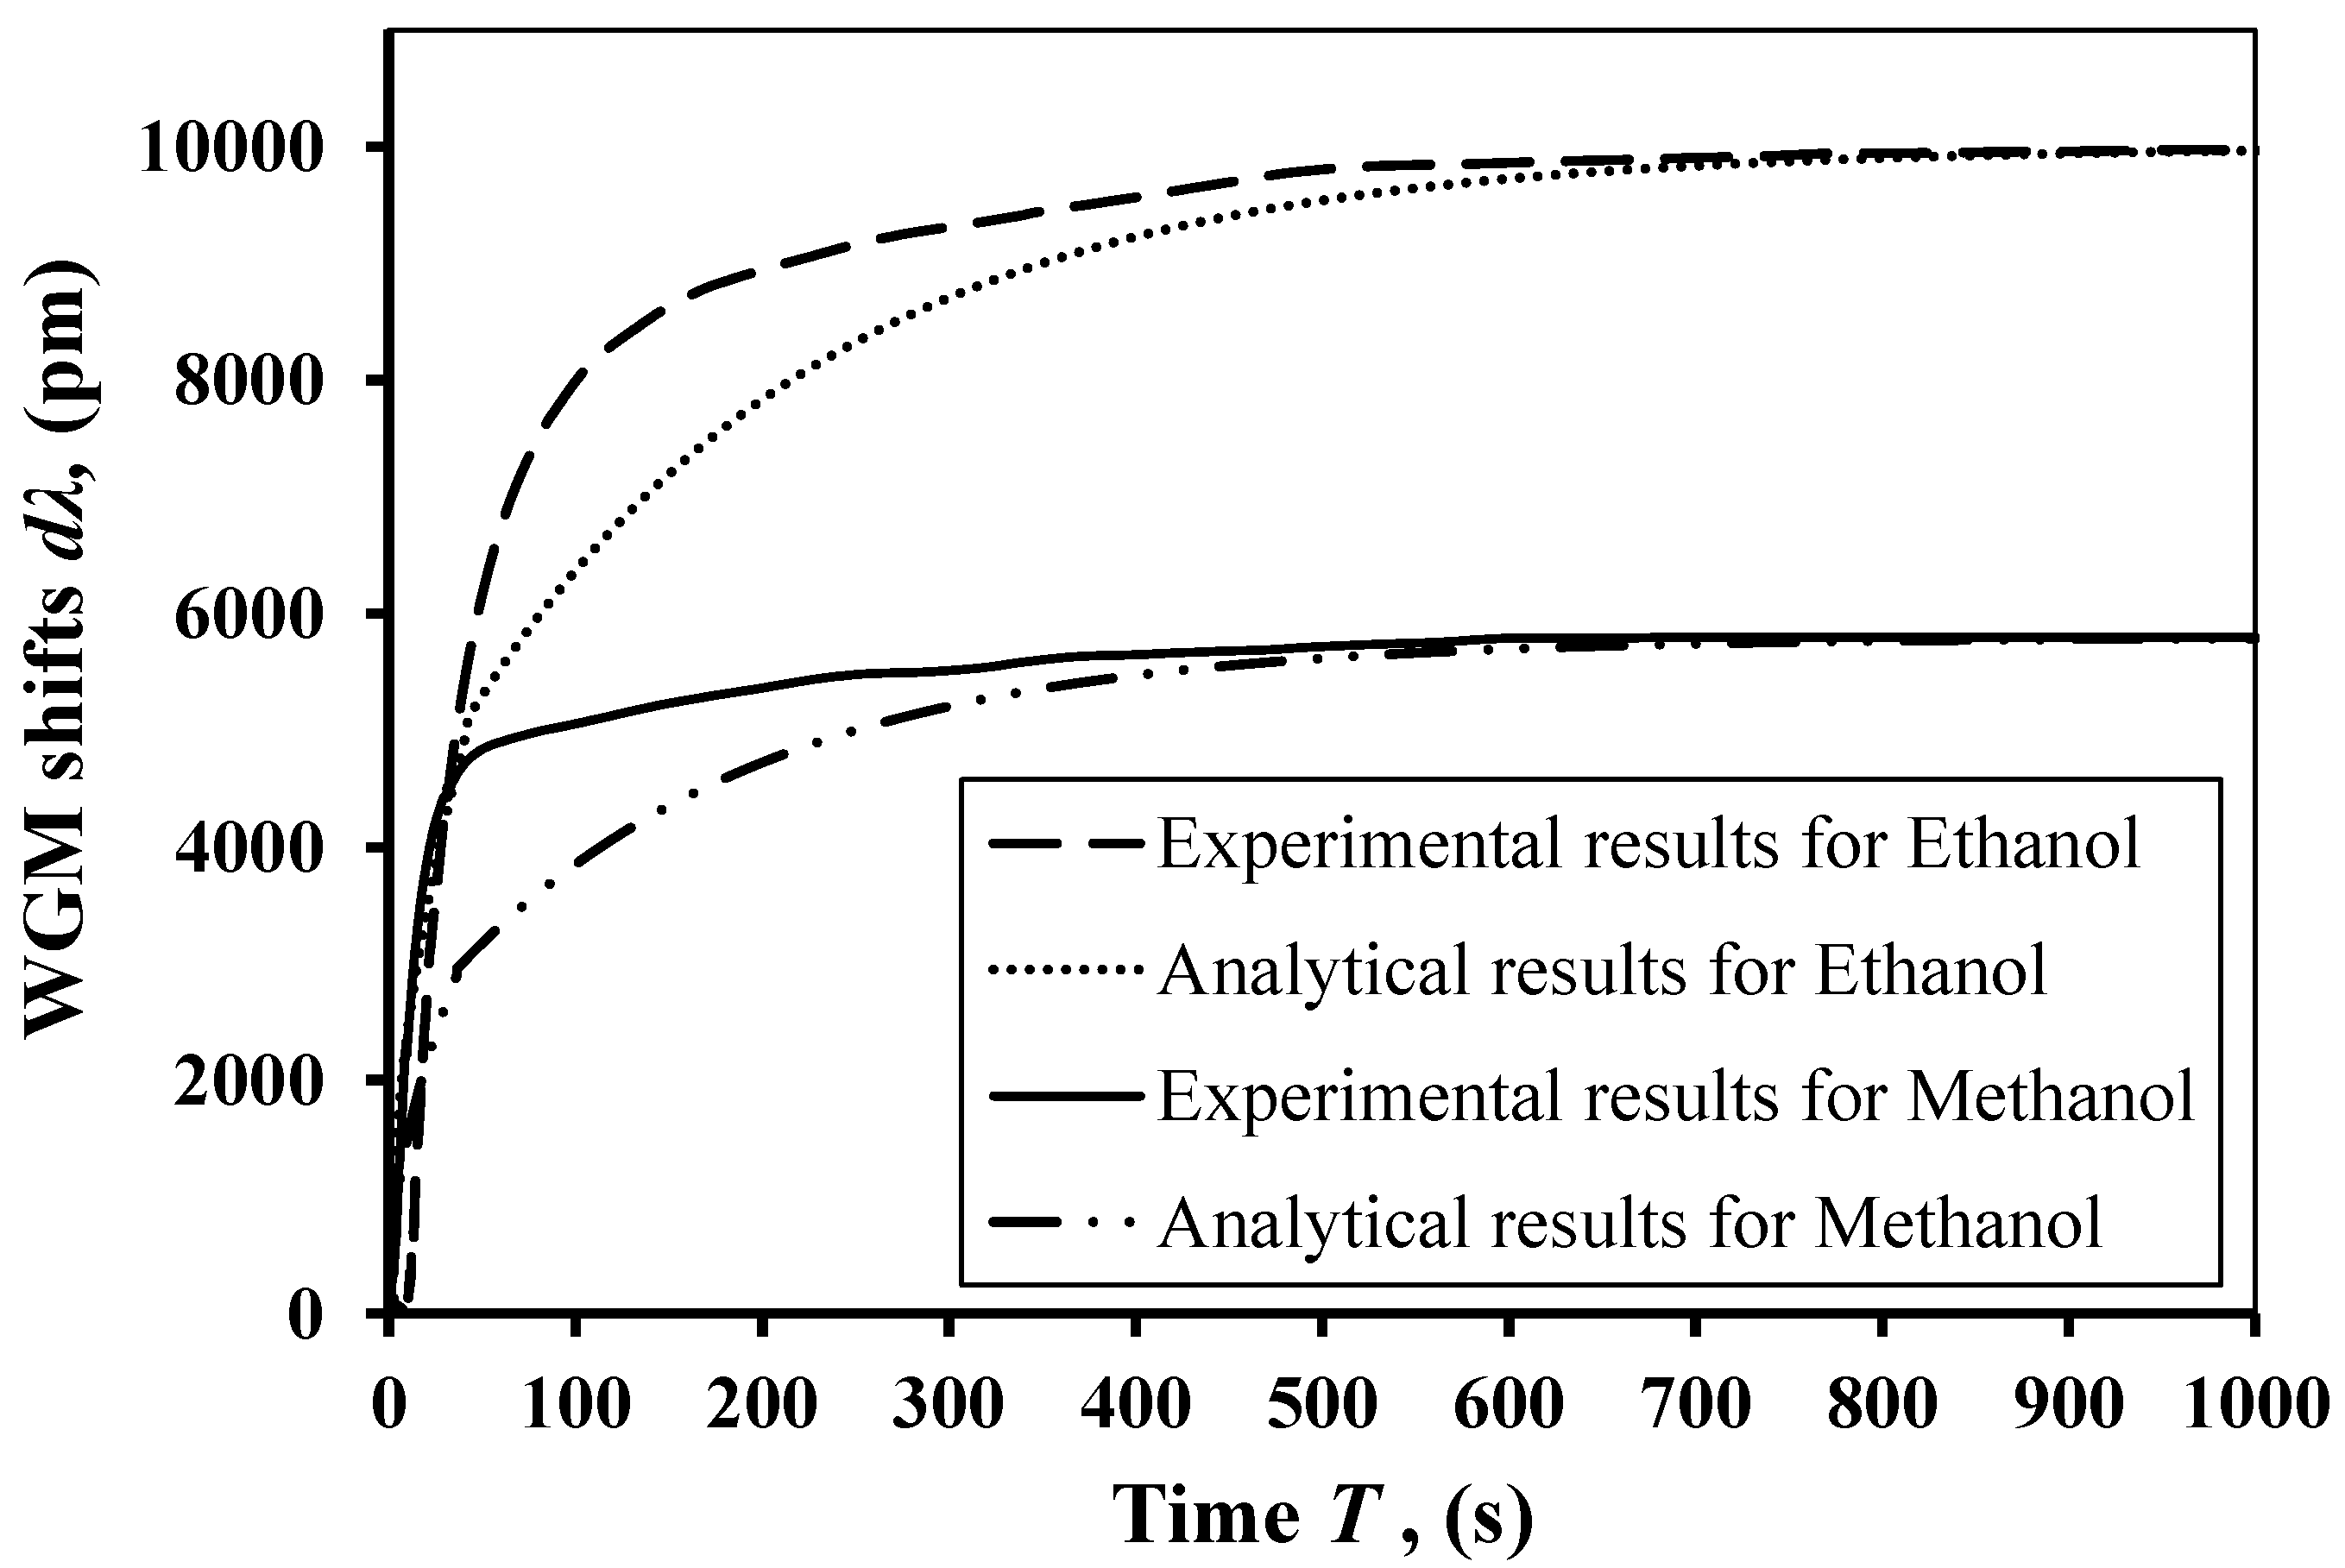
Figure 9.
Sensitivity curve for micro-optical cavity under the effect of: (a) ethanol; (b) methanol.
Figure 9.
Sensitivity curve for micro-optical cavity under the effect of: (a) ethanol; (b) methanol.

© 2017 by the authors. Licensee MDPI, Basel, Switzerland. This article is an open access article distributed under the terms and conditions of the Creative Commons Attribution (CC BY) license (http://creativecommons.org/licenses/by/4.0/).
Share and Cite
MDPI and ACS Style
Ali, A.R.; Elias, C.M. Ultra-Sensitive Optical Resonator for Organic Solvents Detection Based on Whispering Gallery Modes. Chemosensors 2017, 5, 19. https://doi.org/10.3390/chemosensors5020019
AMA Style
Ali AR, Elias CM. Ultra-Sensitive Optical Resonator for Organic Solvents Detection Based on Whispering Gallery Modes. Chemosensors. 2017; 5(2):19. https://doi.org/10.3390/chemosensors5020019
Chicago/Turabian StyleAli, Amir R., and Catherine M. Elias. 2017. "Ultra-Sensitive Optical Resonator for Organic Solvents Detection Based on Whispering Gallery Modes" Chemosensors 5, no. 2: 19. https://doi.org/10.3390/chemosensors5020019
Note that from the first issue of 2016, this journal uses article numbers instead of page numbers. See further details here.