Stand-Off Chemical Detection Using Photoacoustic Sensing Techniques—From Single Element to Phase Array

1
Computer Science and Electrical Engineering, University of Maryland Baltimore County, 1000 Hilltop Circle, Baltimore, MD 21227, USA
2
NeoPhotonics Corporation, 2911 Zanker Road, San Jose, CA 95134, USA
3
Brimrose Corporation, 19, Loveton Circle Sparks, MD 21152, USA
*
Author to whom correspondence should be addressed.
Chemosensors 2018, 6(1), 6; https://doi.org/10.3390/chemosensors6010006
Submission received: 19 November 2017
/
Revised: 18 January 2018
/
Accepted: 19 January 2018
/
Published: 23 January 2018
Abstract
:Technologies that can detect harmful chemicals, such as explosive devices, harmful gas leaks, airborne chemicals or/and biological agents, are heavily invested in by the government to prevent any possible catastrophic consequences. Some key features of such technology are, but not limited to, effective signal-to-noise ratio (SNR) of the detected signal and extended distance between the detector and target. In this work, we describe the development of photoacoustic sensing techniques from simple to more complex systems. These techniques include passive and active noise filters, parabolic sound reflectors, a lock-in amplifier, and beam-forming with an array of microphones; using these techniques, we increased detection distance from a few cm in an indoor setting to over 41 feet in an outdoor setting. We also establish a theoretical mathematical model that explains the underlying principle of how SNR can be improved with an increasing number of microphone elements in the phase array. We validate this model with computational simulations as well as experimental results.
1. Introduction
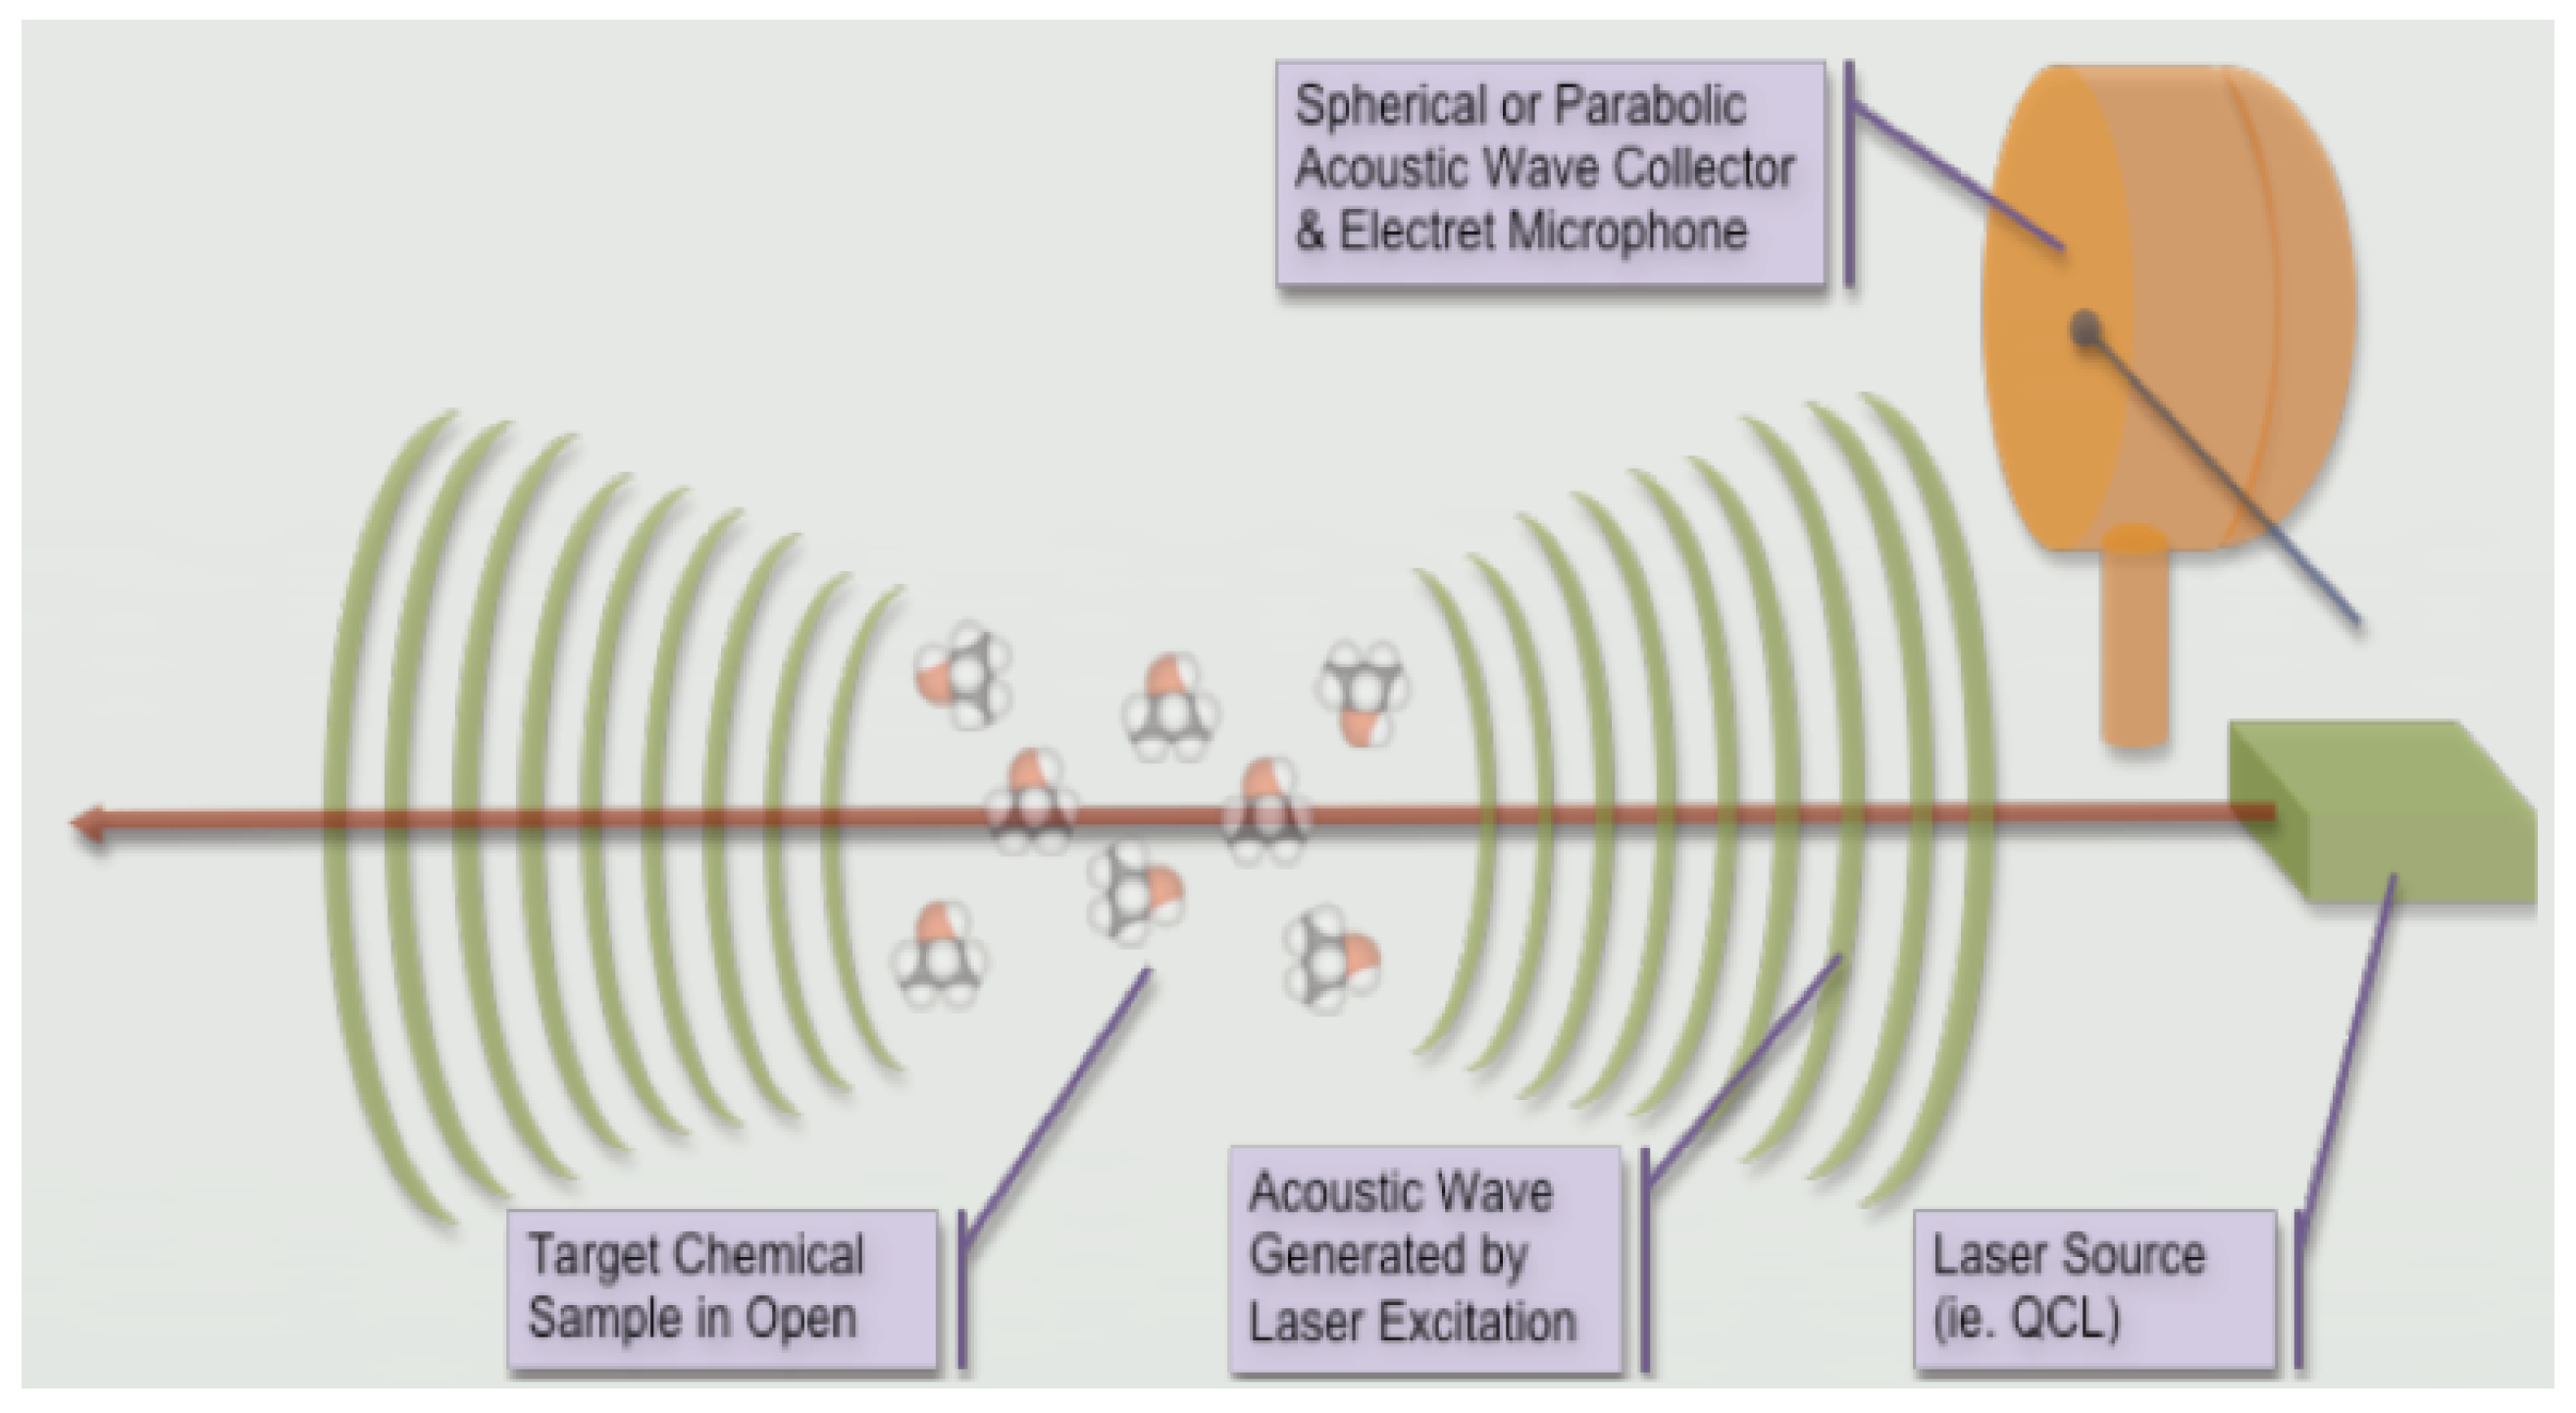
Photoacoustic (PA) spectroscopy has been widely used in various applications such as trace gas detection, medical diagnostics and environmental sensing [1,2]. Originally reported in 1880 by Alexander Graham Bell [3], it is a phenomenon where the acoustic wave signal is detected and studied. The acoustic wave signal is emitted by a substance on thermal expansion and pressure generation due to the absorption of electromagnetic energy from light. Advent of lasers substituted the light source with mid-IR lasers. For example, a carbon dioxide laser [4,5] or a tunable quantum cascade lasers (QCLs) [6,7,8] facilitated PA detection with higher signal sensitivity for harmful chemicals. PA sensing with gas phases was initially studied and reported by Kreuzer et al. [9]. The basic mechanism of PA sensing involves targeting a laser at the chemical to be detected. On absorption, pressurized wave sounds are generated and collected by the microphone(s) equipment from a safe distance. Figure 1 shows this mechanism in the form of a schematic diagram. The retrieved signal from the microphone is then processed for evaluation of chemical composition. Thus, PA sensing could safely probe concealed or improvised explosive devices, harmful gas leaks, airborne chemicals, and/or biological agents and prevent any catastrophic consequences or even terrorist activities [10,11].
In the field of optical spectroscopy, PA sensing is relatively low cost, has high sensitivity, and zero background performance. Hence, it has improved efficiency for standoff chemical detection. For example, Raman spectroscopy, a single-shot measurement [12], has relatively low photon generation efficiency due to its nonlinear nature and uses high power pulsed lasers in the UV or short-visible wavelength ranges, which raises eye-safety concerns. Another example would be thermal imaging techniques [13,14] that require expensive mid-IR cameras, exhibits lower sensitivity than near-IR detectors, and can easily saturate with rising ambient temperature thereby depreciating the desired accuracy and becoming difficult to use. Furthermore, PA sensing’s signal strength is inversely proportional to R, where R is radius with the target chemical as the center. This is because it measures acoustic wave amplitude. In the case of other energy-detecting techniques, it is inversely proportional to . These characteristics are also discussed in our methods section. Thus, PA sensing is highly sensitive and is comparatively the most robust and easy to implement technique for standoff chemical detection.
Most PA detection studies require in-cell acquisition of the gas phase molecules [15,16]. This is not feasible for detection of explosives or toxic gases where large standoff distance is required for safety. An example of remote PA sensing of gas was reported by Barringston et al. [17] as PADAR (photoacoustic detection and ranging), where a parabolic microphone is used to enhance signal sensitivity and hence, the system performance. Other than adding parabolic reflectors, enhancements to PA systems for improving signal accuracy include applying multiple laser beams [18], lock–in amplifiers, and using multiple microphones as an acoustic beam array alongside signal processing techniques. Among these, the beam-forming array is one of the standard methods for sound source localization and detection in several applications [19]. For example, it is commonly seen in phased array antennas for detecting radar with high directivity radio frequency beams [20]. However, in the domain of PA sensing specifically, for example, Yonak and Dowling et al. [21,22] report usage of multiple microphones followed by signal processing with the Matched Field Processing (MFP) technique [23]. Such techniques can suppress ambient noise levels, enhance the signal, improve the Signal-to-Noise Ratio (SNR), and also extend the outdoor chemical detection distance-range.
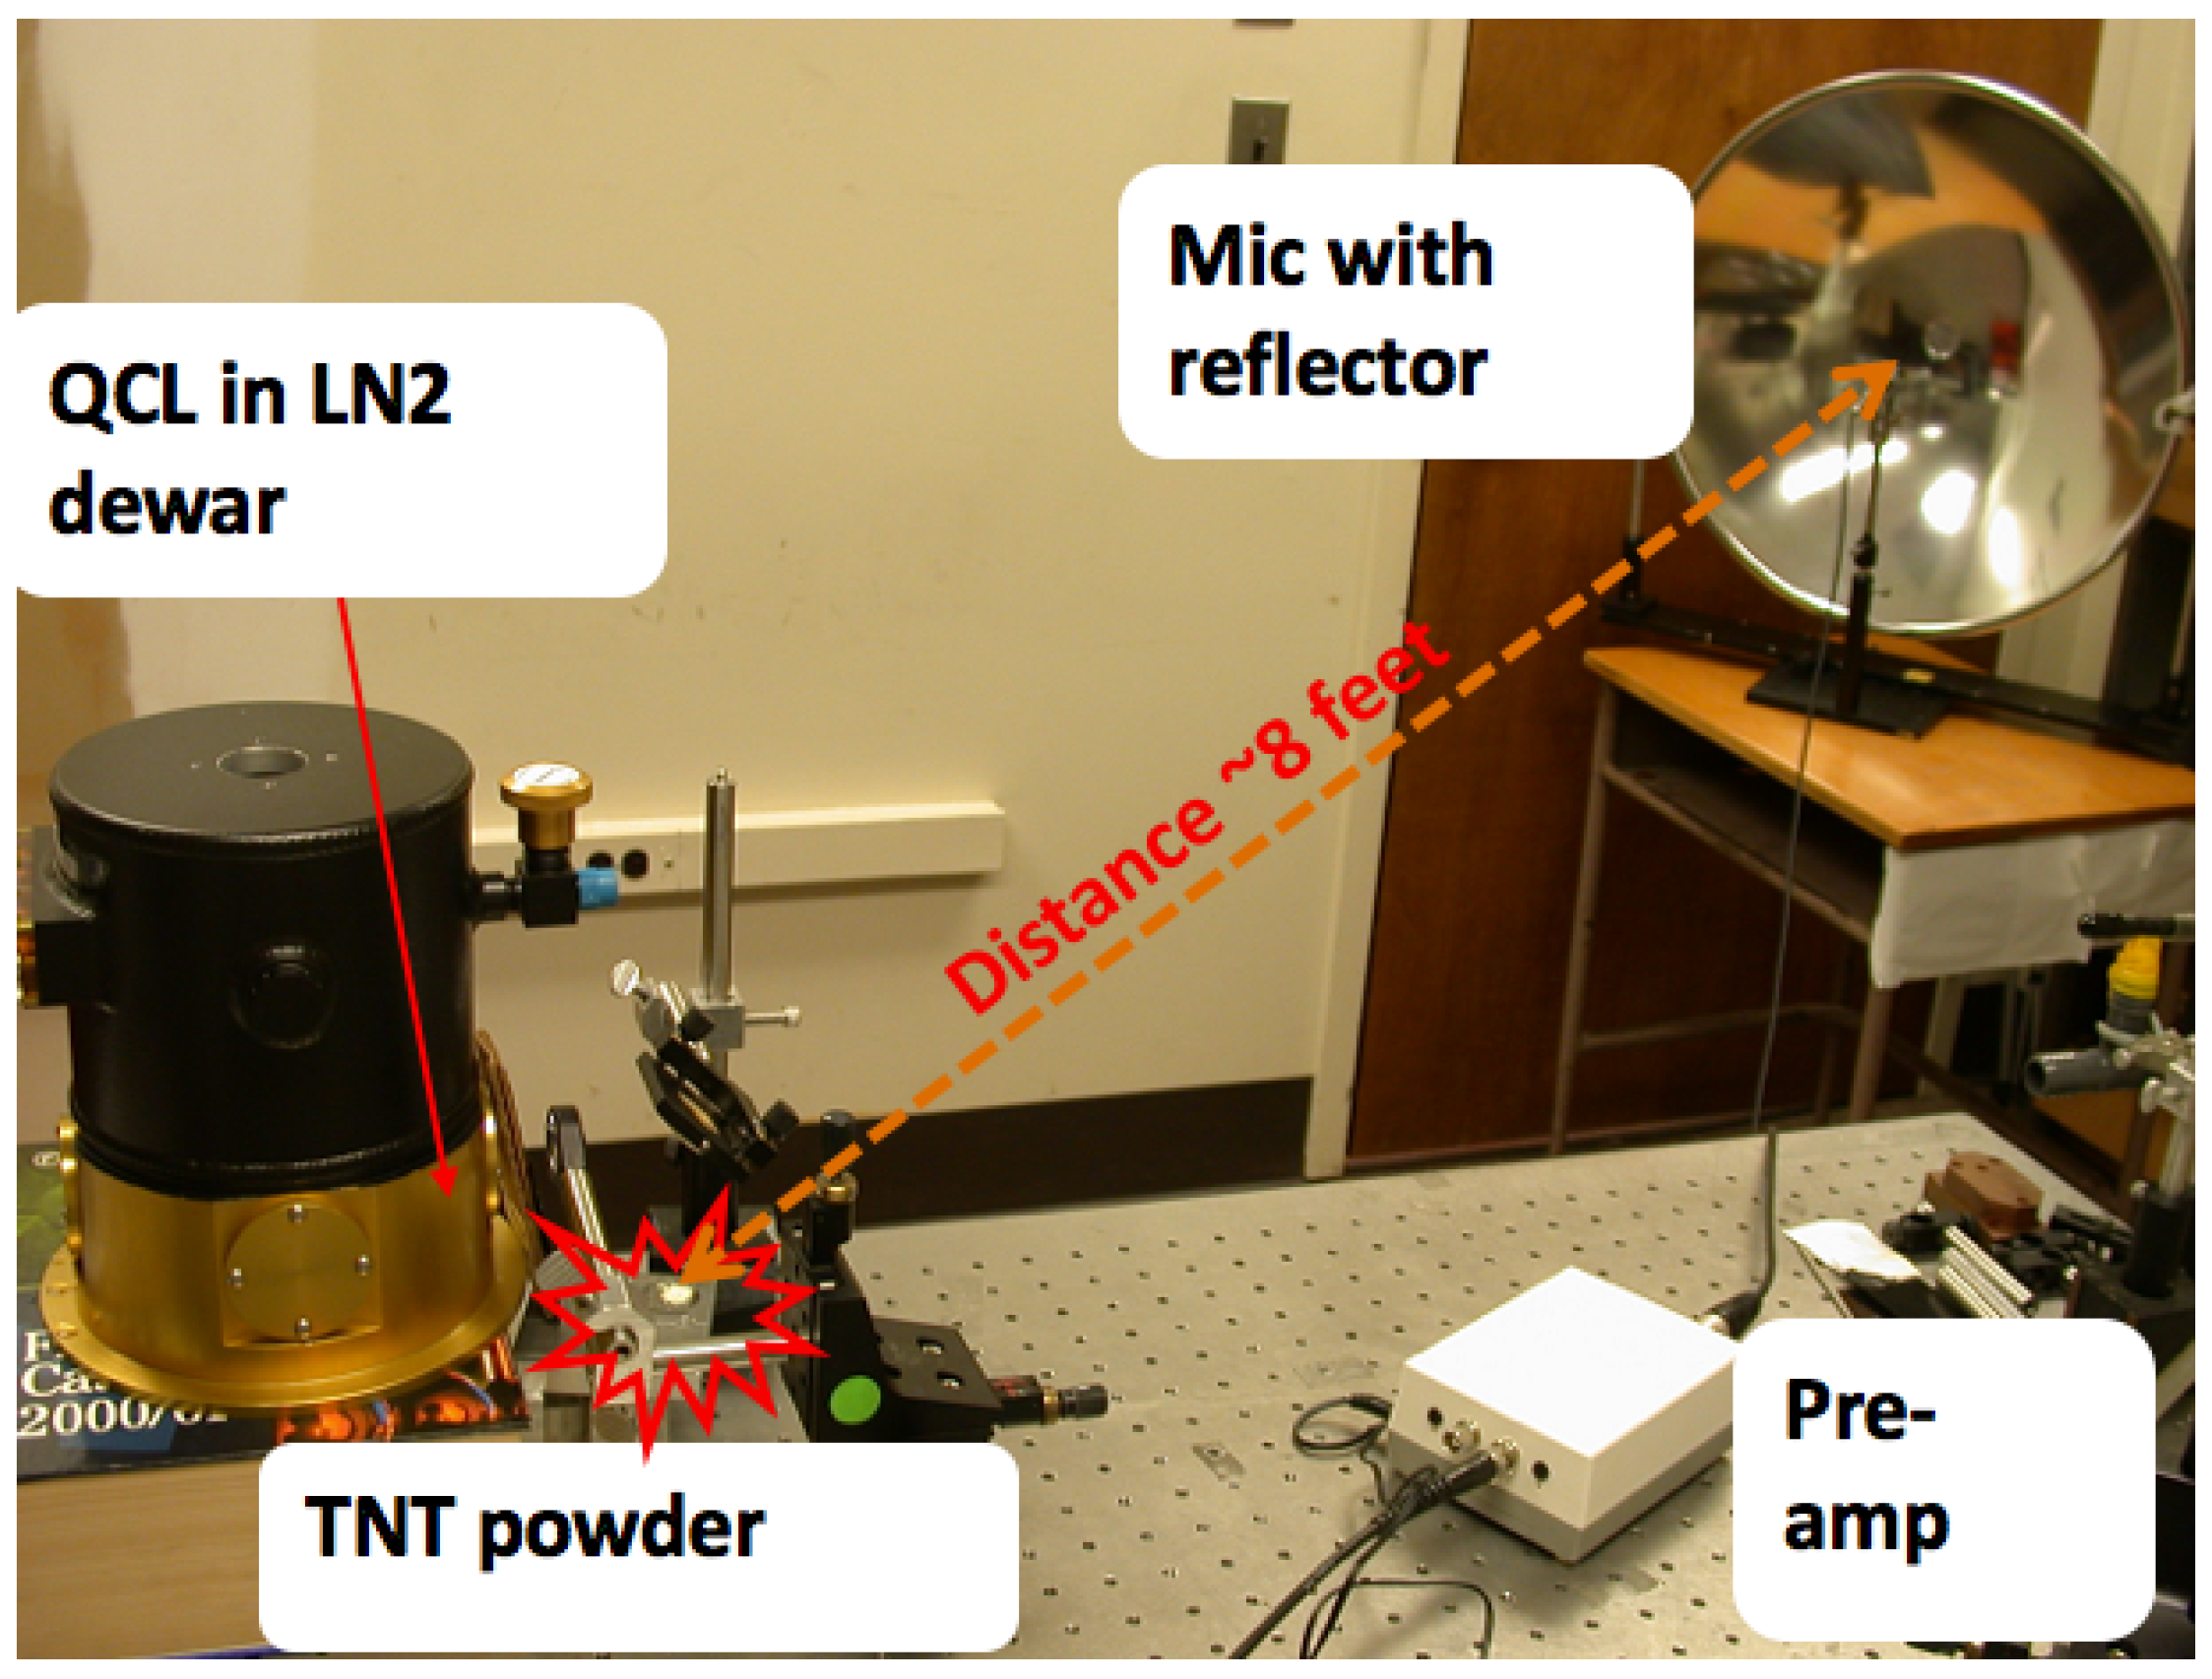
Here, we discuss our work that uses a combination of multiple techniques, briefly stated above, for achieving higher detection distance range in outdoor PA sensing. Furthermore, we discuss and analyze SNR dynamics with varying number of microphone elements in the acoustic beam for enhanced PA sensing. First, we propose our theoretical consideration for the same. Next, we review our previous relevant work so as to understand and demonstrate performance of the individual techniques. For example, we demonstrated PA standoff detection of TNT (trinitrotoluene), RDX (research department explosives) and nerve gas stimulant i.e., IPA (isapropanol) vapor. Figure 2 shows one such experiment where QCL was targeted at TNT and a microphone, with the parabolic sound reflector, detected the TNT with a strong SNR (above 10 dB) from a standoff detection distance of 8 feet [24,25,26,27]. Moreover, we improved our PA sensing systems’ performance by replacing a single microphone element with an acoustic beam array of multiple microphone elements. For example, we studied and implemented an acoustic beam array comprised of 4 microphones/4 reflectors system and 16-microphones/1 reflector [28,29,30]. Figure 3 shows the two microphone array systems. The first system is comprised of an array with 4 sets of microphone-reflector pairs as shown in Figure 3a and the second system comprise one reflector and an array of 16 microphones, as shown in Figure 3b. Figure 3c shows the detailed arrangement of the 16 microphone array. The second system showed better SNR performance for detection distances of a few feet [30]. However, since its phase canceling distance is shorter, for longer distance signal detection we need to rely on the first type of system. Finally, we take the individual technique performance information and combine them, i.e., reflector, array beam forming, and photoacoustic sensing, all 3 together, to achieve 41 feet outdoor photoacoustic chemical detection. In this study, we extend our work and also define theoretically how high directivity and better SNR can be achieved in a standoff PA sensing system by increasing the number of microphone elements (up to 14) in an acoustic beam array for enhanced PA sensing. We first explain our theoretical model and related considerations and then describe our experimental arrangement and data analysis results.
2. Materials and Methods
2.1. Theoretical Consideration
Considering an ideal PA sensing scenario for standoff detection, where a beam array of microphones detects acoustic waves generated by the target at which the laser is aimed, due to the photothermal effect, we assume:
= sound-pressure signal detected by a microphone as a function of t (time) and x (distance). Hence, we get:
where,
- p
- represents the amplitude
- k
- is the wave number i.e., analogous to w
- w
- is the angular frequency
- t
- represents the time instance for the signal
- x
- represents the distance between the microphone and the acoustic source.
= ambient noise received by a microphone
or
where,
= noise signal amplitude.
When forming a beam array, inputs from all the microphones are aligned periodically (i.e., in frequency and phase) and then are finally added together.
Hence, Equation (1) can be rewritten as , where, i represents the microphone element of the beam array that is receiving the signal and i varies from 1 to N where N is the total number of microphones in the array.
After realignment, the signal received from one microphone = , where represents the adjustment in the phase, is added to the signal for realignment such that for all . Hence,
Also, the ambient noise component received by the i-th microphone along the signal becomes:
As per Liu et al. [31], a linear equation describing time-varying, pulse-echo RF signals as:
where,
- = signal, and
- = signal-independent noise
- t = time instance
when t = acquisition time then,
where,
- T = sampling time interval,
- l describes the L-range samples recorded during T such that , and
- m is the M-sequential A-lines recorded in a frame such that .
Hence, we rewrite Equation (6) to:
Then, using Trees’ et al.’s general definition of SNR [32], Liu et al. [31] present their echo SNR as a ratio of signal energy to noise energy within the time interval of the acquisition frame, . This, hence, becomes:
For further in-depth details regarding this method, the reader is encouraged to refer to work by Liu et al. in [31]. Using this, we can write SNR for our acoustic beam array as:
where,
- N signifies the number of microphones in the acoustic beam array
- = Signal to Noise Ratio from an acoustic beam array with N microphone elements.
- = signal received by the acoustic beam array
- = noise signal received by the beam array
From Equation (9), we see that the numerator has the same entity as N times the magnitude whereas the denominator has various noise components that are added up together. Some of these noise components may also cancel out with each other on addition, given their orientation. Hence, clearly, the SNR will be high as N, the number of microphone elements in the detecting acoustic beam array, increases.
We take logarithmic decibel scale of Equation (9) for computing SNR to finally get:
2.2. Implementation and Measurement
Here, we briefly discuss our journey of increasing PA sensing detection distance from a few centimeters in an indoor lab setting to 41 feet for outdoor real-field application. We then discuss and analyze the acoustic beam array that improves the performance of our PA system thereby supporting the above mentioned theoretical consideration.
2.2.1. Preliminary Work Review
Our first PA experimental setup was based on the schematic design shown in Figure 1, discussed in the introduction section. QCL, driven by a pulse generator, is targeted at the chemical. The repetition rate was set to 1.5 kHz to suppress low frequency background noise while maintaining a suitable average power of 40 mW with a duty cycle of around 50%. The chemicals we used were TNT, IPA, and RDX and the laser was tuned as per the chemical’s signature spectrum. For example, Figure 4a shows the signature absorption spectrum of TNT (middle trace) and RDX (lower trace). Figure 4b shows the TNT absorption spectrum measured by the CO laser scan with a corresponding absorption peak at 10.65 m. Similarly, we use IPA vapor (0.13% volume) as a safer experimental substitute of the explosive, which has a strong absorption peak at around 7.9 m [26]. The emission wavelength of the laser is set accordingly. The generated acoustic waves are captured by the microphone (sensitivity: 7.9 mV/Pa, signal amplitude: 1 mV) placed 5 cm away from the IPA. Figure 5a shows this experiment in action. The measured PA wave pressure was (1 mV)/(7.9 mV/Pa) = 0.13 Pa, which is not detectable beyond 15 cm due to noise in the background. Figure 5b shows our next experiment where we added an analog band-pass noise filter, centered at 1.5 KHz, to the microphone’s output to enhance the signal and achieve detection from 30 cm. Later, we also added a 10 cm diameter sound reflector to the microphone, as seen in Figure 5c, to enhance sound collection efficacy. This increased the detection distance to 35 cm with a 10 dB Signal-to-Noise Ratio [24]. Next, Figure 5d shows that we replaced our microphone with a microphone that has higher sensitivity and larger sized parabolic sound reflector in the same experimental setup and we achieved a higher detection distance of 5.2 m. In our final indoor experiment, on adding a lock-in amplifier to our setup, we successfully reported detection from 41 feet (12.5 m). We also evaluated and characterized PA signal and found that it is linearly dependent on laser optical power, chemical vapor density and where R is the radius with the target chemical as the center. For further details, the reader is encouraged to see our work reported in [26]. Based on these findings, we were able to determine and setup the right parameters for extending our work to the outdoor experiment as described in the following section.
2.2.2. Outdoor Photoacoustic Sensing Implementation
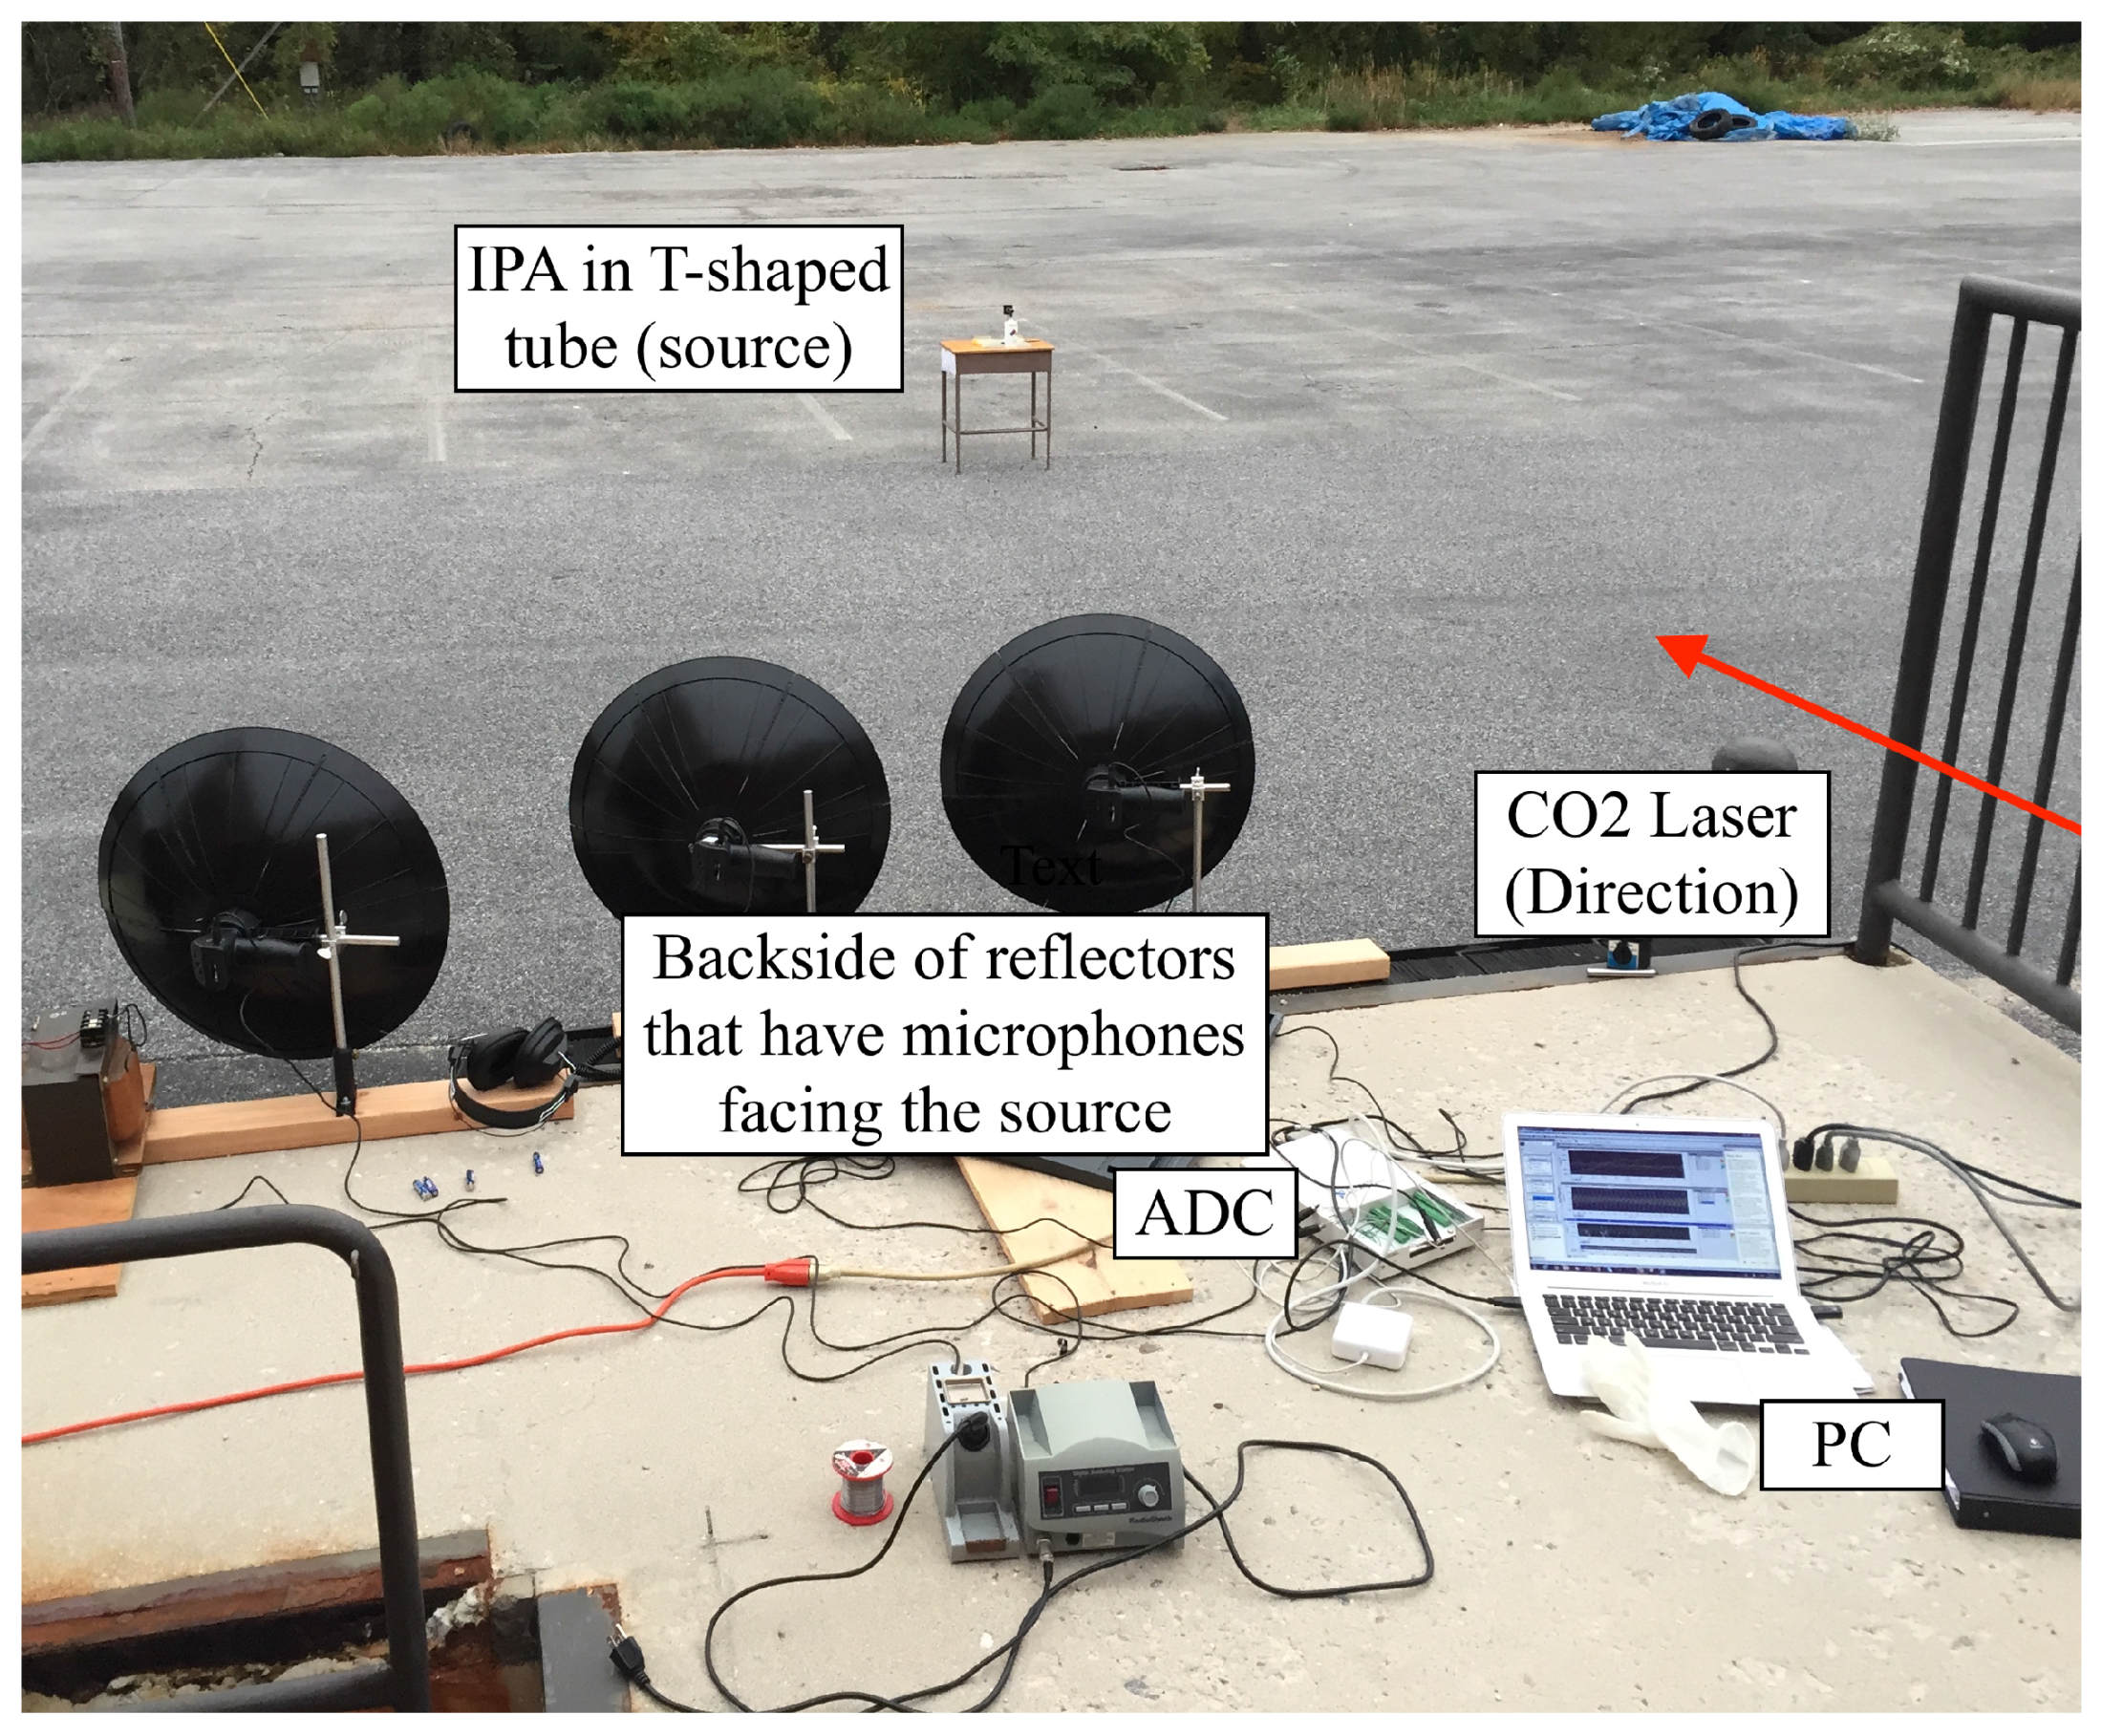
In our final experiment, we enhanced noise suppression and performed standoff signal detection in an outdoor PA sensing experiment from 41 feet by using an acoustic beam array [28]. A CO laser regulated by a pulse generator with repetition rate of 4–5 KHz, for maintaining a suitable average output power of 800 mW along suppressing lower-frequency outdoor-background noise is targeted at the vapors of the nerve gas stimulant (IPA) in the T-shaped tube that rests on top of a bottle containing the chemical in liquid form. Similar to our indoor experiment, Figure 6 shows that the acoustic wave signal is collected by the microphones, and then processed by a pre-amplifier for signal enhancement into a PC via the Analog-to-Digital Converter (ADC) for computational analysis. We used SignalExpress for digital filtering and phase alignment of all input signals measured from the 3 microphones to form an effective beam-array. Each microphone is positioned optimally depending on its solid angle and incurs different delay in the retrieved signal. Hence, for phase alignment, input waves were manually shifted (adding delay for the ith microphone in the beam-array) in SignalExpress during the training session for setting up the system. Once aligned, the configuration was saved and detection locations relative to the array are locked for the field experiments. One may note that this is an improvement to our earlier work in [26] as it involves acoustic beam-forming by using 3 microphones, each with a parabolic sound reflector, in an outdoor setting instead of one microphone-reflector element in an indoor setting. Acoustic beam-forming adds a slight computational load, but gives better performance if compared with a 1 microphone PA system. Outdoor settings have a higher noise complexity such as bird-chirping and different conditions such as varied temperature etc. Hence, compared to our earlier experiments, this is an enhanced PA system and performs with larger complex variables.
2.2.3. Acoustic Beam Array Characterization
To better understand the role of an acoustic beam array’s constituent microphone element(s) in PA sensing techniques towards enhanced signal standoff detection, we computed SNR while varying the number of comprising microphone elements (1 to 14) in the acoustic beam array. The acoustic source was regulated at 4 KHz. Figure 7 shows the experimental setup where the signal detected by the beam array of microphones via the pre-amplifier and ADC was finally analyzed on a PC for SNR computation. Using computational interface settings, a microphone could be disabled or reactivated as well as synchronized with other microphones present in the acoustic beam array by adding phase delay to improve directivity as described in Section 2.1. Figure 8 shows raw signals gathered from these microphones in time domain (top graph), processed signal after adding delay for phase alignment and improving directivity of the beam-array in time (middle graph) and frequency domain (bottom graph). Figure 9 shows just the frequency domain signal data after phase alignment using which, we computed the SNR. Given computational (hardware) limitations, we were able to process and vary the constituent microphones from 1 to 14.
3. Results and Discussion
PA sensing for the standoff detection of harmful chemicals in an open outdoor setting was successfully achieved from 41 feet. The outdoor experiment had a training and operation session. During the training session, the phase alignment of the input signal from all microphones was performed. After the training session is complete and the detection location is successfully targeted by the microphones, ambient noises have little effect on the system unless they are coming from the same direction as the laser’s target direction. The SNR may slowly oscillate to less than 10% primarily due to the pulse generator (HP 214B), as there is a drift in its center frequency after its modulation frequency is set. This shall be improved if a digital version is used. The ambient background noise decay follows a 1/f distribution and at our outdoor operating frequency, near 5 kHz, the environment is actually very quiet, thereby delivering long-term stability.
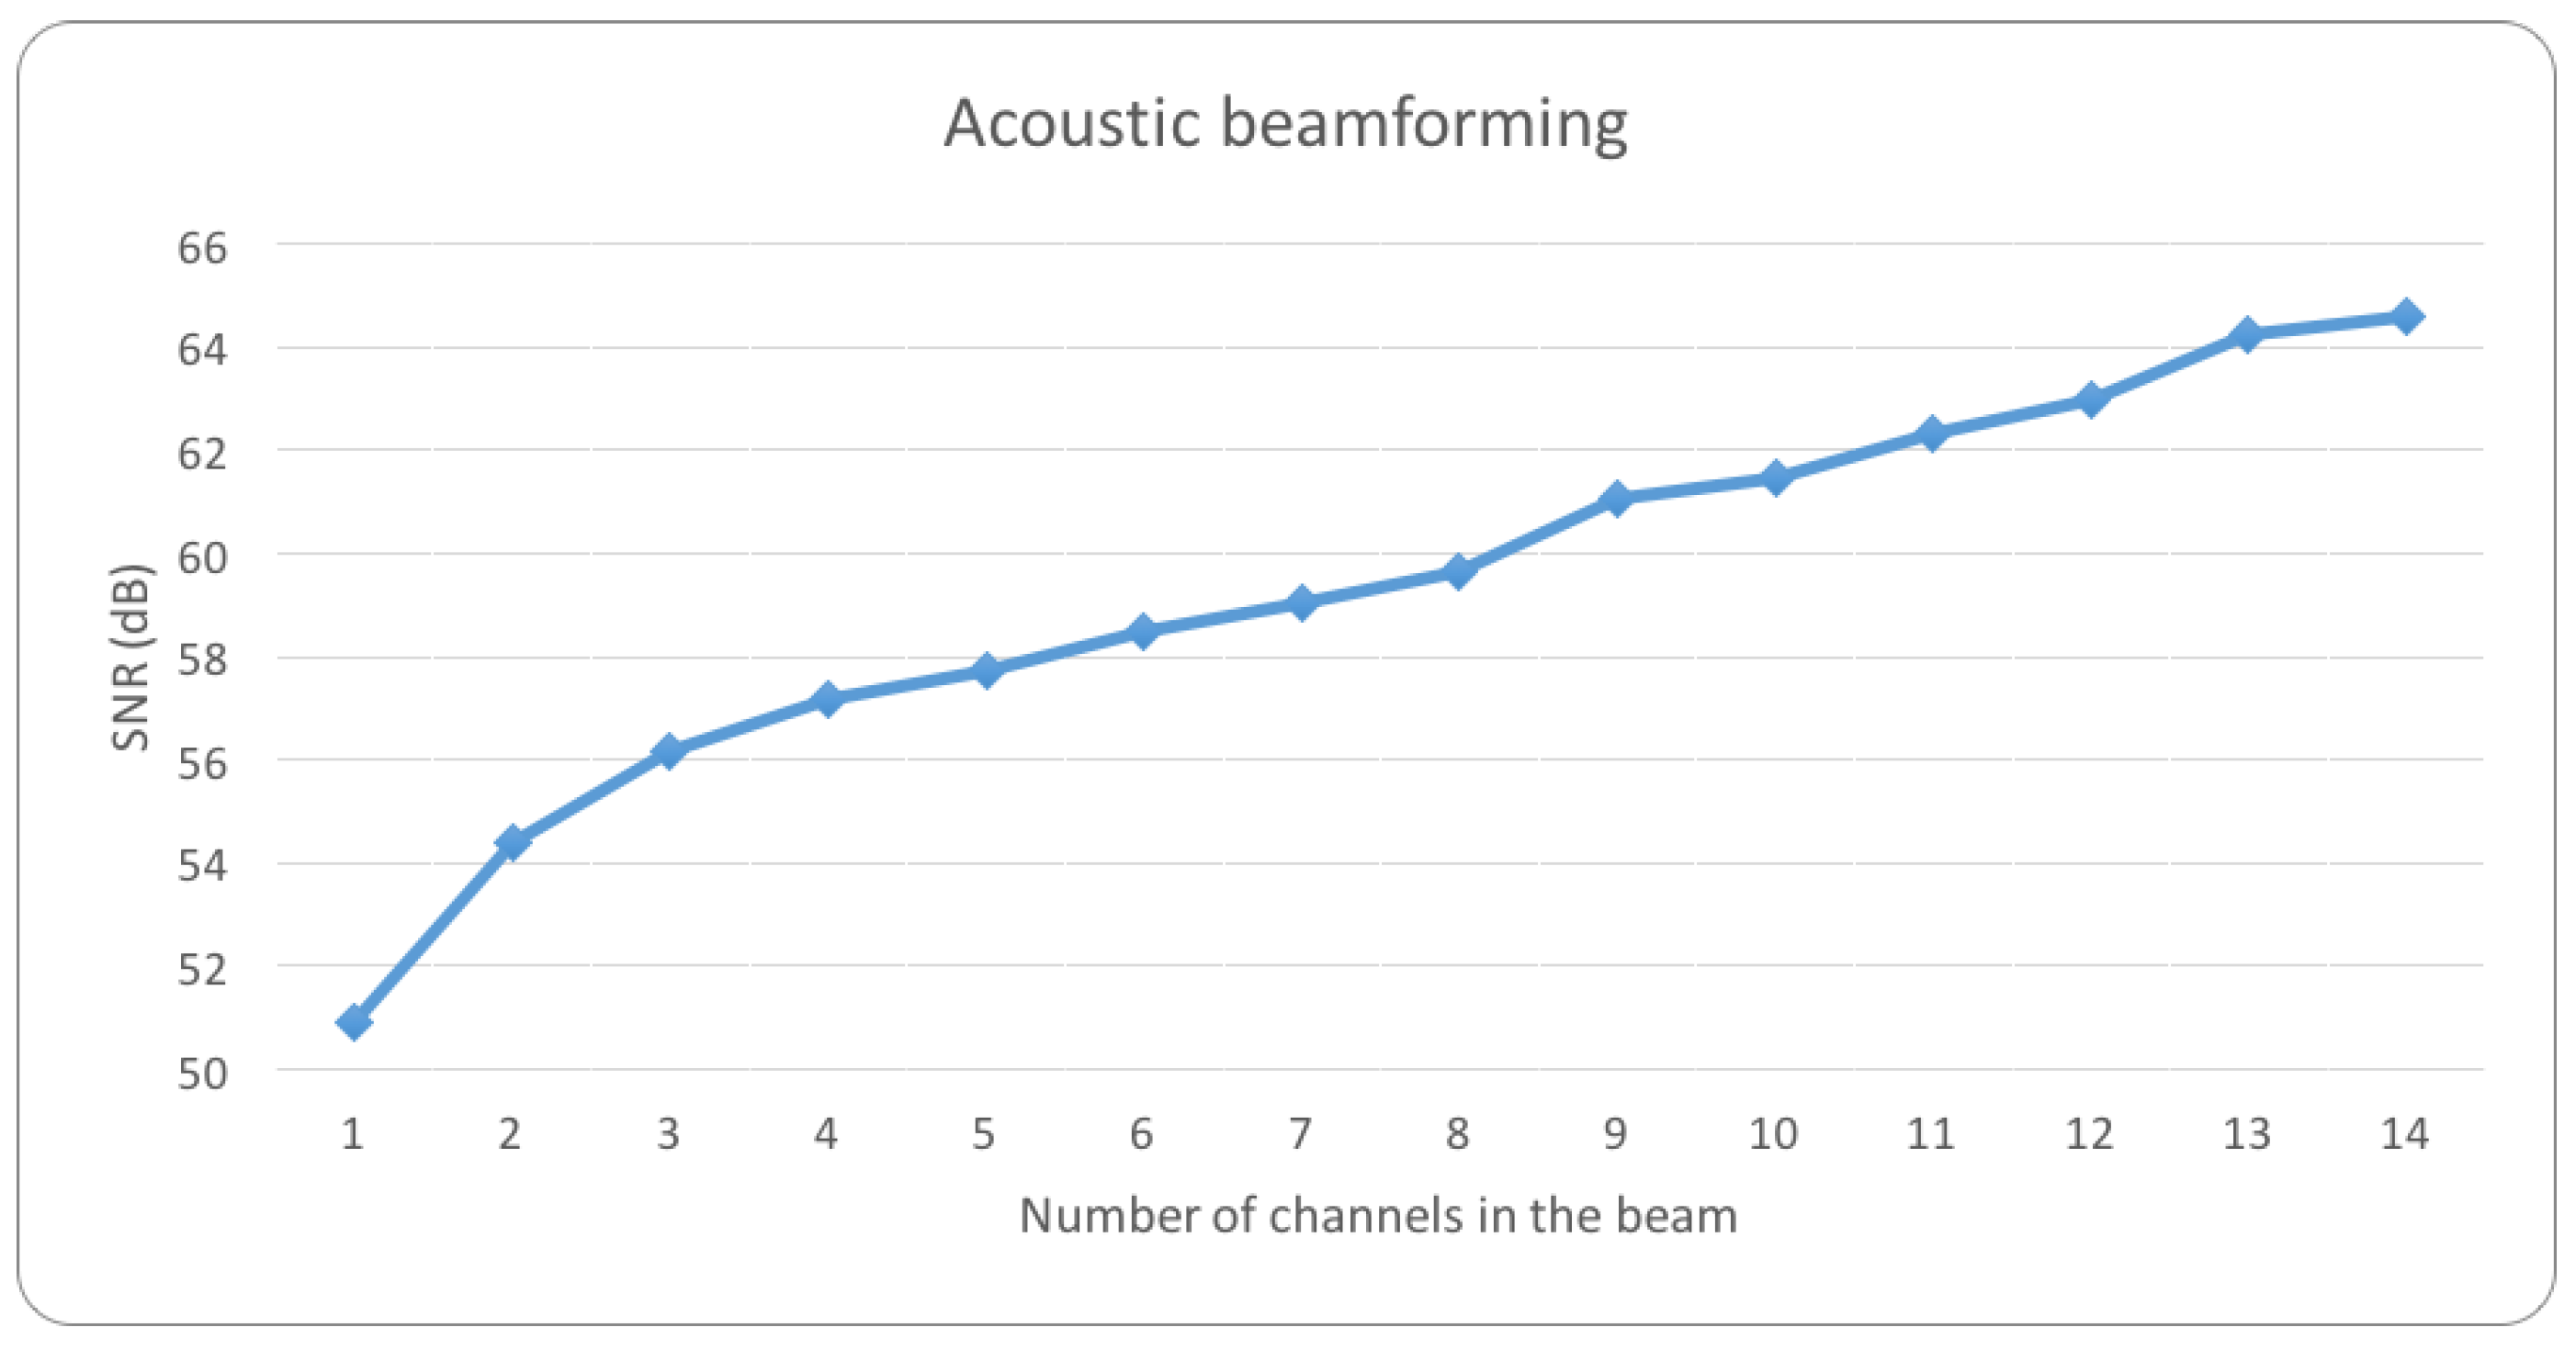
To further investigate our theoretical consideration that SNR improves with increasing number of microphone elements in the beam-array, we first simulated Equation (10) using MATLAB while varying the constituent microphone elements (). Noise was randomly generated from standard normal distribution for each case with a variance of 0.002, similar to our outdoor experimental setting. Our theoretically simulated MATLAB SNR result for microphones ranging from in the beam-array is shown in Figure 10. Our PA experimental setup is shown in Figure 7 (as described in the methods section earlier), yielded a similar result pattern that SNR increased with increasing number of microphone in the array, as shown in Figure 11, thereby confirming our theory.
When comparing theoretical with experimental results, we found that the SNR increases with an increased number of microphone elements for both theory and experiment in a similar pattern. For example, with just one microphone element, we obtain theoretical and experimental SNR as 51.06 dB and 50.92 dB respectively. On using seven elements we obtain 59.70 dB (MATLAB) and 59.06 dB (experimentally). With 14 microphone elements, we achieve an SNR of 62.54 dB (MATLAB) and 64.57 dB (experimentally). Hence, overall we see similar increase in SNR with an increasing number of array elements.
4. Conclusions
We reviewed and summarized how the performance of standoff photoacoustic (PA) chemical detection systems can be enhanced by using simple techniques such as noise filters, reflectors and acoustic beam forming. Then, we discussed how we used these techniques together for achieving a standoff detection distance of 41 feet in an outdoor setting along high signal sensitivity. Furthermore, we analyzed and proved how increasing the number of microphones in the acoustic beam array can increase SNR, and hence, improve PA sensing performance indoors as well as outdoors for safely detecting chemicals such as IPA, RDX, and TNT. To the best of our knowledge, this is the first work that demonstrates combination of reflector, array beam forming, and photoacoustic sensing to achieve outdoor chemical detection. We also showed the theoretical and experimental work that captures the SNR dynamics of an acoustic beam array in the realm of PA sensing. These developments make PA sensing-based standoff chemical detection systems lesser expensive, more portable, and easy to use for possible field measurement and other real world applications.
Acknowledgments
The research is supported by Army Research Lab. SBIR W911SR-14-C-0022 with Brimrose Technology Corp.
Author Contributions
Deepa Gupta, Xing Chen, and Fow-Sen Choa have contributed to the experimental work. Chen-Chia Wang and Sudhir Trivedi contributed the TNT spectrum obtained by tunable CO lasers scan.
Conflicts of Interest
The authors declare no conflict of interest. The founding sponsors had no role in the design of the study; in the collection, analyses, or interpretation of data; in the writing of the manuscript, and in the decision to publish the results.
Abbreviations
The following abbreviations are used in this manuscript:
| PA | Photoacoustic |
| QCL | Quantum Cascade Laser |
| SNR | Signal-to-Noise Ratio |
| MDPI | Multidisciplinary Digital Publishing Institute |
| DOAJ | Directory of open access journals |
| TLA | Three letter acronym |
| LD | linear dichroism |
References
- Pao, Y.-H. Optoacoustic Spectroscopy and Detection; Academic Press: New York, NY, USA, 1977. [Google Scholar]
- Rosencwaig, A. Photoacoustics and Photoacoustic Spectroscopy; Wiley: Hoboken, NJ, USA, 1980. [Google Scholar]
- Bell, A.G. Upon the Production of Sound by Radiant Energy; Gibson Brothers, Printers: Washington, DC, USA, 1881. [Google Scholar]
- Prasad, R.L.; Prasad, R.; Bhar, G.C.; Thakur, S.N. Photoacoustic spectra and modes of vibration of tnt and rdx at CO2 laser wavelengths. Mol. Biomol. Spectrosc. 2002, 58, 3093–3102. [Google Scholar] [CrossRef]
- Giubileo, G.; Puiu, A. Photoacoustic spectroscopy of standard explosives in the mir region. Accel. Spectrom. Detect. Assoc. Equip. 2010, 623, 771–777. [Google Scholar] [CrossRef]
- Frank, K.T.; Yury, B.; Anatoliy, A.K.; Gerard, W. Recent advances in trace gas detection using quantum and interband cascade lasers. Rev. Laser Eng. 2006, 34, 275–282. [Google Scholar]
- Wysocki, G.; Curl, R.F.; Tittel, F.K.; Maulini, R.; Bulliard, J.-M.; Faist, J. Widely tunable mode-hop free external cavity quantum cascade laser for high resolution spectroscopic applications. Appl. Phys. B 2005, 81, 769–777. [Google Scholar] [CrossRef]
- Bandyopadhyay, N.; Chen, M.; Sengupta, S.; Slivken, S.; Razeghi, M. Ultra-broadband quantum cascade laser, tunable over 760 cm−1, with balanced gain. Opt. Express 2015, 23, 21159–21164. [Google Scholar] [CrossRef] [PubMed]
- Kreuzer, L.B. Ultralow gas concentration infrared absorption spectroscopy. J. Appl. Phys. 1971, 42, 2934–2943. [Google Scholar] [CrossRef]
- Anderson, J.L.; Cantu, A.A.; Chow, A.W.; Fussell, P.S.; Nuzzo, R.G.; Parmeter, J.E.; Sayler, G.S.; Shreeve, J.M.; Slusher, R.E.; Story, M.; et al. Existing and Potential Standoff Explosives Detection Techniques; National Academies Press: Washington, DC, USA, 2004. [Google Scholar]
- Patel, C.K.N. Laser photoacoustic spectroscopy helps fight terrorism: High sensitivity detection of chemical warfare agent and explosives. Eur. Phys. J. Spec. Top. 2008, 153, 1–18. [Google Scholar] [CrossRef]
- Nagli, L.; Gaft, M. Raman scattering spectroscopy for explosives identification. In Proceedings of the Defense and Security Symposium, Orlando, FL, USA, 9–13 April 2008; p. 65520Z. [Google Scholar]
- Mukherjee, A.; Von der Porten, S.; Patel, C.K.N. Standoff detection of explosive substances at distances of up to 150 m. Appl. Opt. 2010, 49, 2072–2078. [Google Scholar] [CrossRef] [PubMed]
- Furstenberg, R.; Kendziora, C.A.; Stepnowski, J.; Stepnowski, S.V.; Rake, M.; Papantonakis, M.R.; Nguyen, V.; Hubler, G.K.; McGill, R.A. Stand-off detection of trace explosives via resonant infrared photothermal imaging. Appl. Phys. Lett. 2008, 93, 224103. [Google Scholar] [CrossRef]
- Elia, A.; Franco, C.D.; Spagnolo, V.; Lugarà, P.M.; Scamarcio, G. Quantum cascade laser-based photoacoustic sensor for trace detection of formaldehyde gas. Sensors 2009, 9, 2697–2705. [Google Scholar] [CrossRef] [PubMed]
- Holthoff, E.; Bender, J.; Pellegrino, P.; Fisher, A. Quantum cascade laser-based photoacoustic spectroscopy for trace vapor detection and molecular discrimination. Sensors 2010, 10, 1986–2002. [Google Scholar] [CrossRef] [PubMed]
- Brassington, D.J. Photo-acoustic detection and ranging—A new technique for the remote detection of gases. J. Phys. D Appl. Phys. 1982, 15, 219–228. [Google Scholar] [CrossRef]
- Olender, F.T.; Woody, B.A.; Newman, L.A. Photo-Acoustic Leak Detector with Multiple Beams. U.S. Patent 5,834,632, 10 November 1998. [Google Scholar]
- Michel, U. History of acoustic beamforming. In Proceedings of the 1st Berlin Beamforming Conference, BeBeC, Berlin, 21–22 November 2006. [Google Scholar]
- Fenn, A.J.; Temme, D.H.; Delaney, W.P.; Courtney, W.E. The development of phased-array radar technology. Linc. Lab. J. 2000, 12, 321–340. [Google Scholar]
- Yonak, S.H.; Dowling, D.R. Multiple Microphone Photoacoustic Leak Detection and Localization System and Method. U.S. Patent 6,227,036, 8 May 2001. [Google Scholar]
- Yönak, S.H.; Dowling, D.R. Parametric dependencies for photoacoustic leak localization. J. Acoust. Soc. Am. 2002, 112, 145–155. [Google Scholar] [CrossRef] [PubMed]
- Baggeroer, A.B.; Kuperman, W.A.; Schmidt, H. Matched field processing: Source localization in correlated noise as an optimum parameter estimation problem. J. Acoust. Soc. Am. 1988, 83, 571–587. [Google Scholar] [CrossRef]
- Chen, X.; Janssen, D.; Kostov, D.; Choa, F.-S. Standoff chemical detection using quantum cascade lasers and photoacoustic sensing techniques. In Proceedings of the Quantum Electronics and Laser Science Conference, Baltimore, MD, USA, 1–6 May 2011. [Google Scholar]
- Chen, X.; Guo, D.; Choa, F.-S.; Wang, C.-C.; Trivedi, S.; Snyder, A.P.; Ru, G.; Fan, J. Standoff photoacoustic detection of explosives using quantum cascade laser and an ultrasensitive microphone. Appl. Opt. 2013, 52, 2626–2632. [Google Scholar] [CrossRef] [PubMed]
- Chen, X.; Cheng, L.; Guo, D.; Kostov, Y.; Choa, F.-S. Quantum cascade laser based standoff photoacoustic chemical detection. Opt. Express 2011, 19, 20251–20257. [Google Scholar] [CrossRef] [PubMed]
- Chen, X.; Choa, F.-S.; Holthoff, E.; Pellegrino, P.; Fan, J. Standoff chemical detection with parts per million level calibrated detection sensitivity. In Proceedings of the SPIE Defense, Security, and Sensing, Baltimore, MD, USA, 29 April–3 May 2013; p. 871007. [Google Scholar]
- Choa, F.-S.; Wang, C.-C.; Khurgin, J.; Samuels, A.; Trivedi, S.; Gupta, D. Standoff photoacoustic detections with high-sensitivity microphones and acoustic arrays. In Proceedings of the SPIE Defense + Security, Baltimore, MD, USA, 17–21 April 2016; p. 98240M. [Google Scholar]
- Graninger, A.; Chen, X.; Choa, F.-S. Stand-off chemical detection using acoustic beam forming & photoacoustic sensing. In Proceedings of the 16th International Congress on Sound and Vibration, Kraków, Poland, 5–9 July 2009; pp. 5–9. [Google Scholar]
- Lay, J.; Chen, X.; Choa, F.-S. Performance comparison of microphone and reflector array structures for real-time and outdoor photoacoustic chemical sensing. In Proceedings of the SPIE Defense, Security, and Sensing, Baltimore, MD, USA, 29 April–3 May 2013; p. 871009. [Google Scholar]
- Liu, J.; Kim, K.-S.; Insana, M.F. Snr comparisons of beamforming strategies. IEEE Trans. Ultrason. Ferroelectr. Freq. Control 2007, 54, 1010–1017. [Google Scholar] [CrossRef] [PubMed]
- Trees, H.L.V. Detection, Estimation, and Modulation Theory; John Wiley & Sons: Hoboken, NJ, USA, 2004. [Google Scholar]
Figure 1.
Schematic view of the standoff photoacoustic sensing setup.

Figure 2.
Photoacoustic detection of TNT by using a microphone with a parabolic sound reflector. The Quantum Cascade Laser was focused on the TNT sample while the microphone with sound reflector was pointing towards the sample to gather the acoustic signal. By using the reflector, we were able to increase detection distance from 2 feet to 8 feet.

Figure 3.
Two types of acoustic beam array that replace a single microphone element for improving PA sensing system: (a) An array of 4 microphones-reflector pairs; (b) One reflector with 16 microphones; (c) The front view of the 16 microphone array shown in (b).
Figure 3.
Two types of acoustic beam array that replace a single microphone element for improving PA sensing system: (a) An array of 4 microphones-reflector pairs; (b) One reflector with 16 microphones; (c) The front view of the 16 microphone array shown in (b).
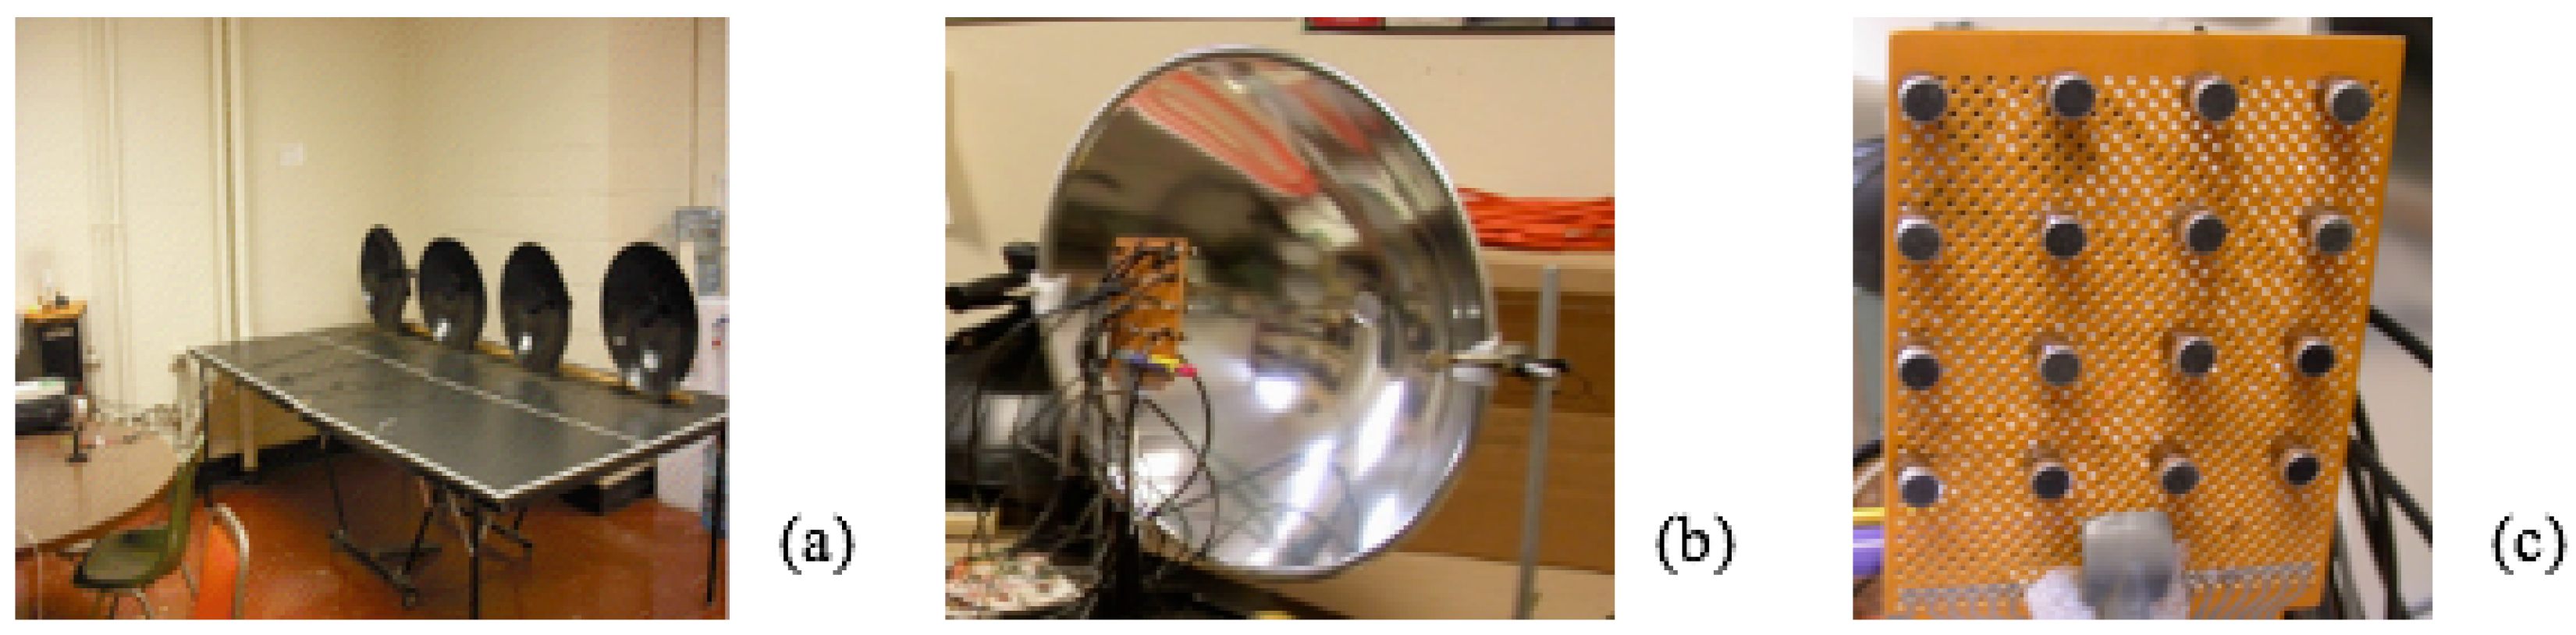
Figure 4.
(a) Absorption spectrum in mid-IR region; top plot: mid-IR absorption spectrum in atmospheric window; middle plot: absorption spectrum of TNT in the mid-IR region; lower plot: absorption spectrum of RDX in the mid-IR region; (b) CO laser scan for TNT absorption spectrum with a peak at 10.65 m.
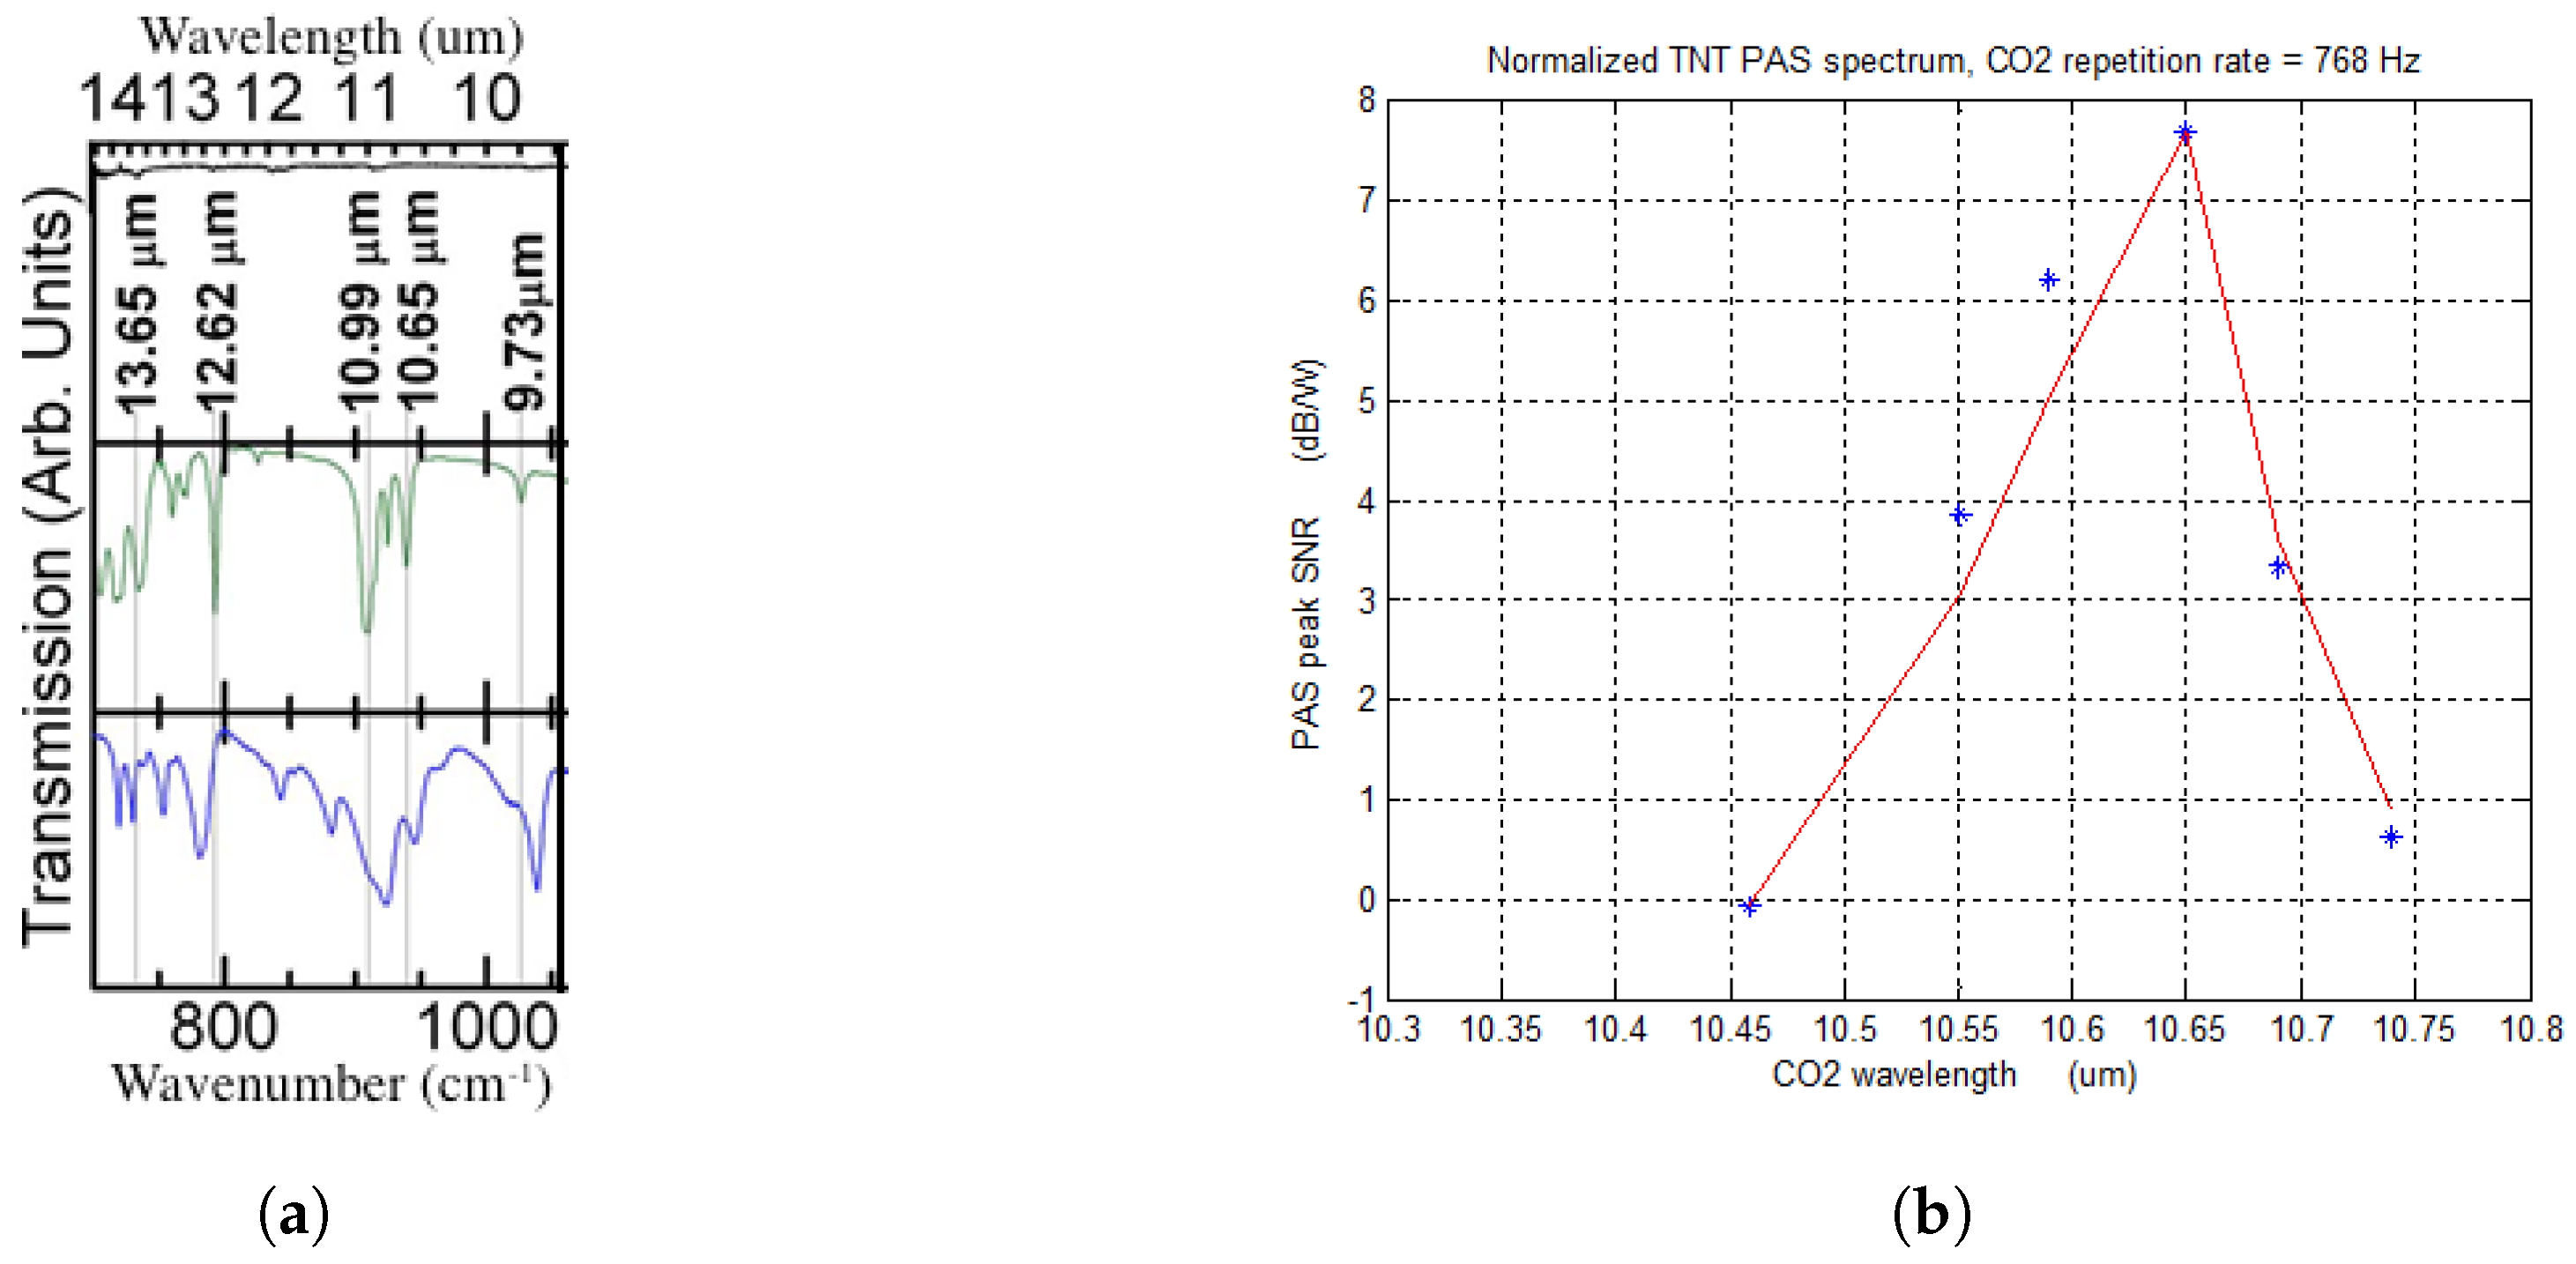
Figure 5.
Summary of PA sensing experiments for increasing detection distance in an indoor lab setting. Quantum Cascade Laser cooled by liquid nitrogen (visible in a green colored containment) is targeted at the IPA vapors. Microphone (connected to oscilloscope) captures the generated acoustic wave signal: (a) Microphone is 5 to 15 cm distant from IPA; (b) Detection distance increases to 30 cm by adding a filter (c) Detection distance increases to 35 cm by adding filter and reflector (d) Detection distance increases to 5.2 m by using a more sensitive microphone with a parabolic reflector.

Figure 6.
Outdoor setup of PA sensing of nerve gas stimulant—Isopropanol (IPA) with 41 feet as the standoff detection distance.
Figure 6.
Outdoor setup of PA sensing of nerve gas stimulant—Isopropanol (IPA) with 41 feet as the standoff detection distance.
Figure 7.
PA sensing using an array (4 × 8) of microphones (left) connected to PC (right) for computational analysis via pre-amplifier and ADC (middle). The acoustic source (not visible here) was regulated at 4 KHz.
Figure 7.
PA sensing using an array (4 × 8) of microphones (left) connected to PC (right) for computational analysis via pre-amplifier and ADC (middle). The acoustic source (not visible here) was regulated at 4 KHz.
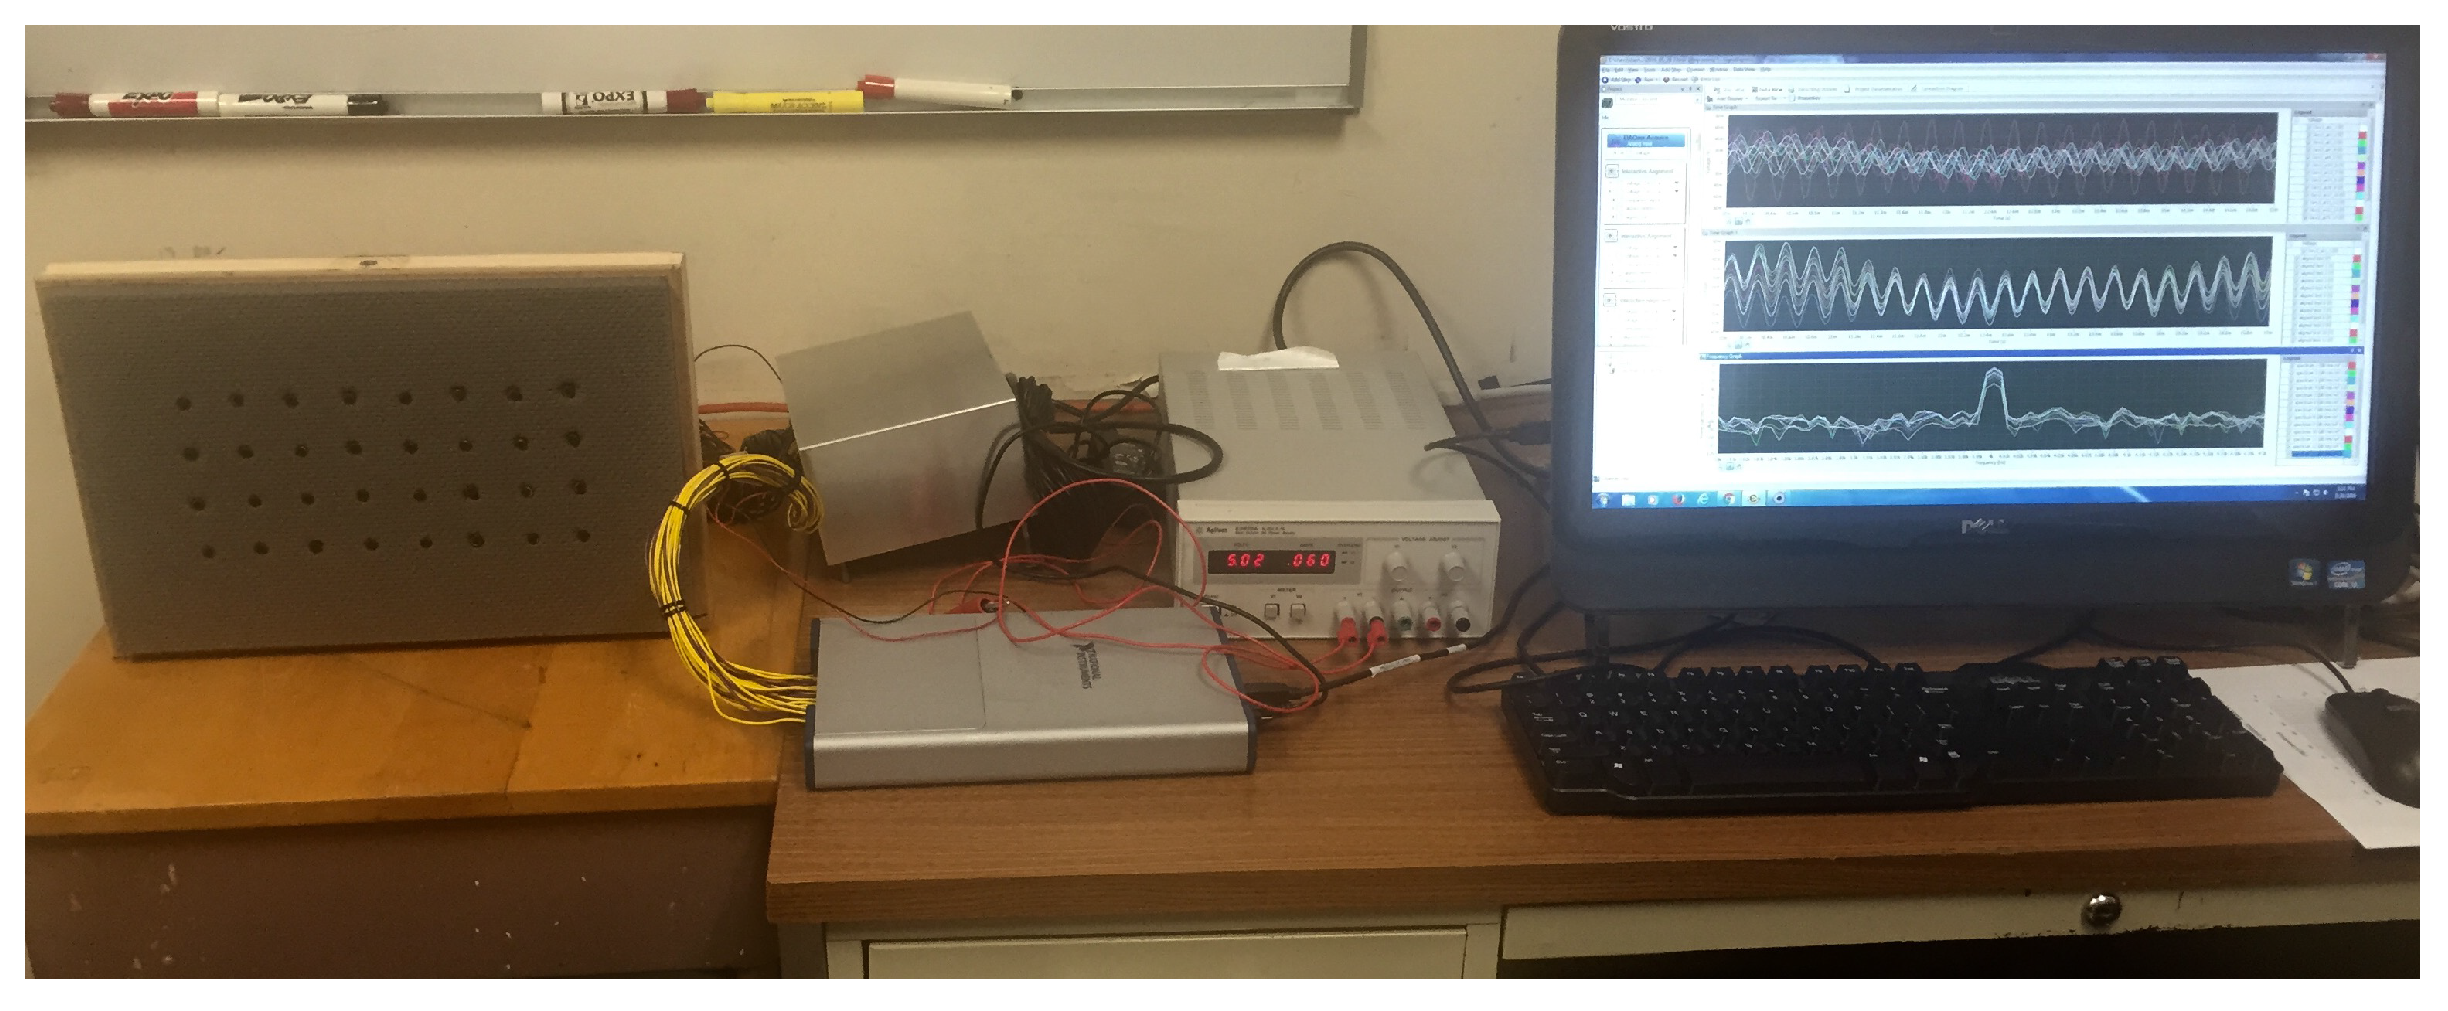
Figure 8.
A screen-shot of the computational analysis of microphones in acoustic beam array. Top graph: Voltage-Time plot of raw input from all 14 microphones; Middle graph: Voltage-Time signal from 14 microphones after synchronization based on phase and frequency; Bottom graph: Power-Frequency plot of added and aligned input signals in frequency domain.
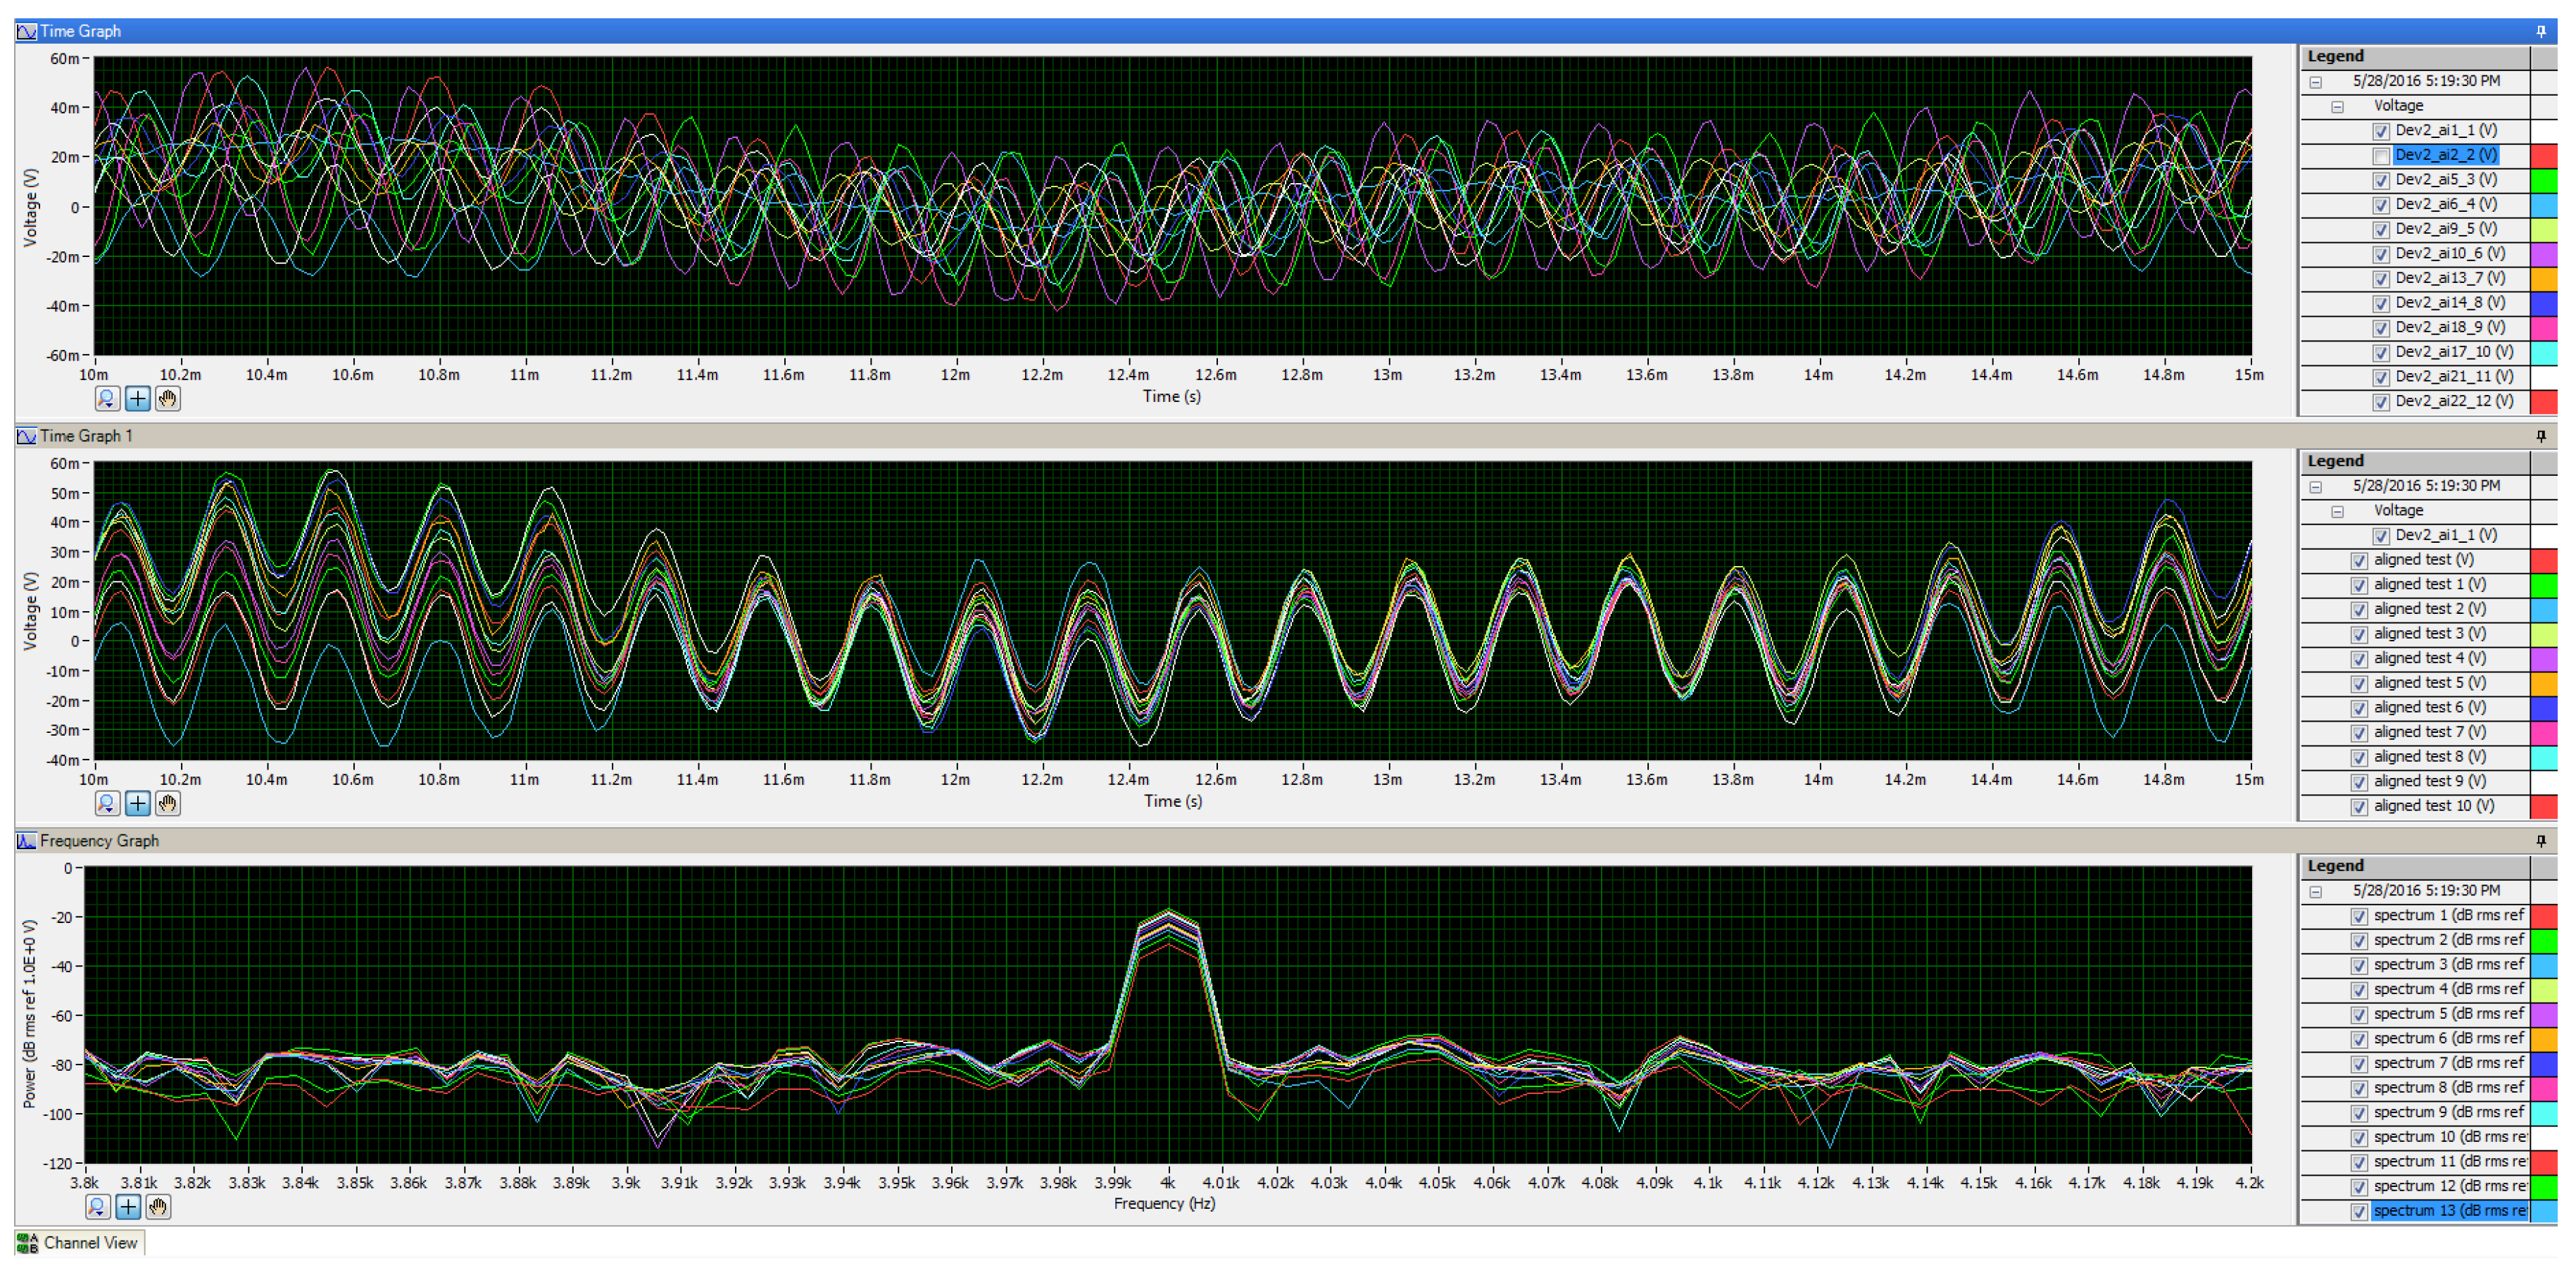
Figure 9.
Added synchronized input signals from microphone in frequency domain (zoomed in view of the bottom graph in Figure 8).
Figure 9.
Added synchronized input signals from microphone in frequency domain (zoomed in view of the bottom graph in Figure 8).
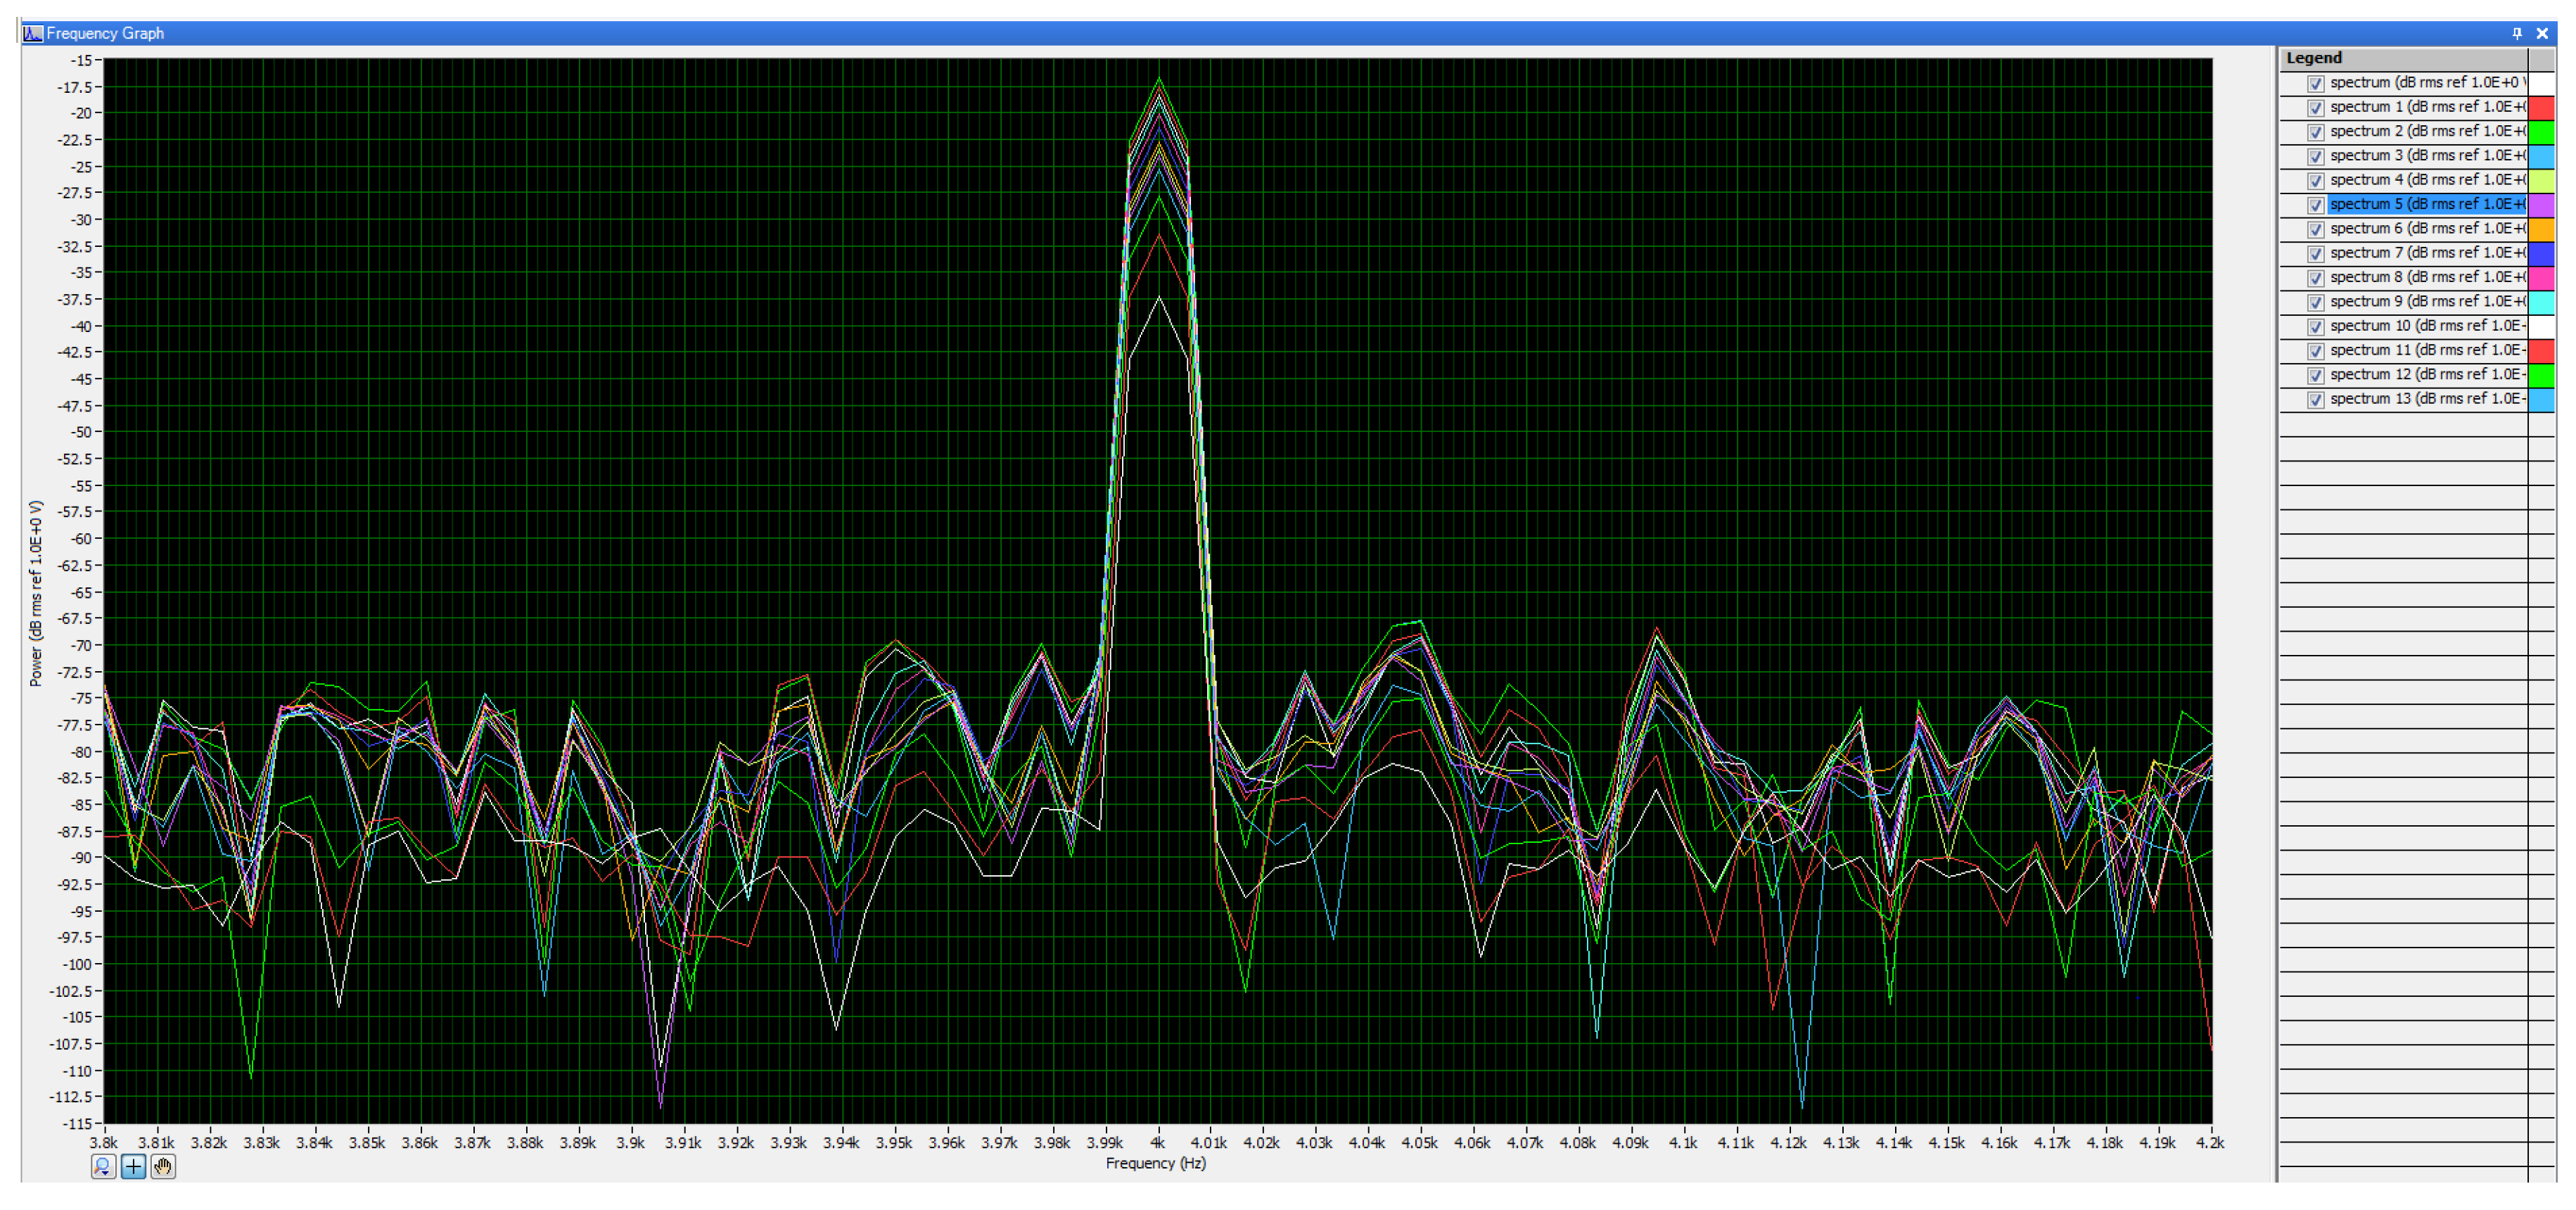
Figure 10.
MATLAB simulation of SNR in Equation (10) of a PA sensing acoustic beam array with microphone elements varied from 1 to 14.
Figure 10.
MATLAB simulation of SNR in Equation (10) of a PA sensing acoustic beam array with microphone elements varied from 1 to 14.
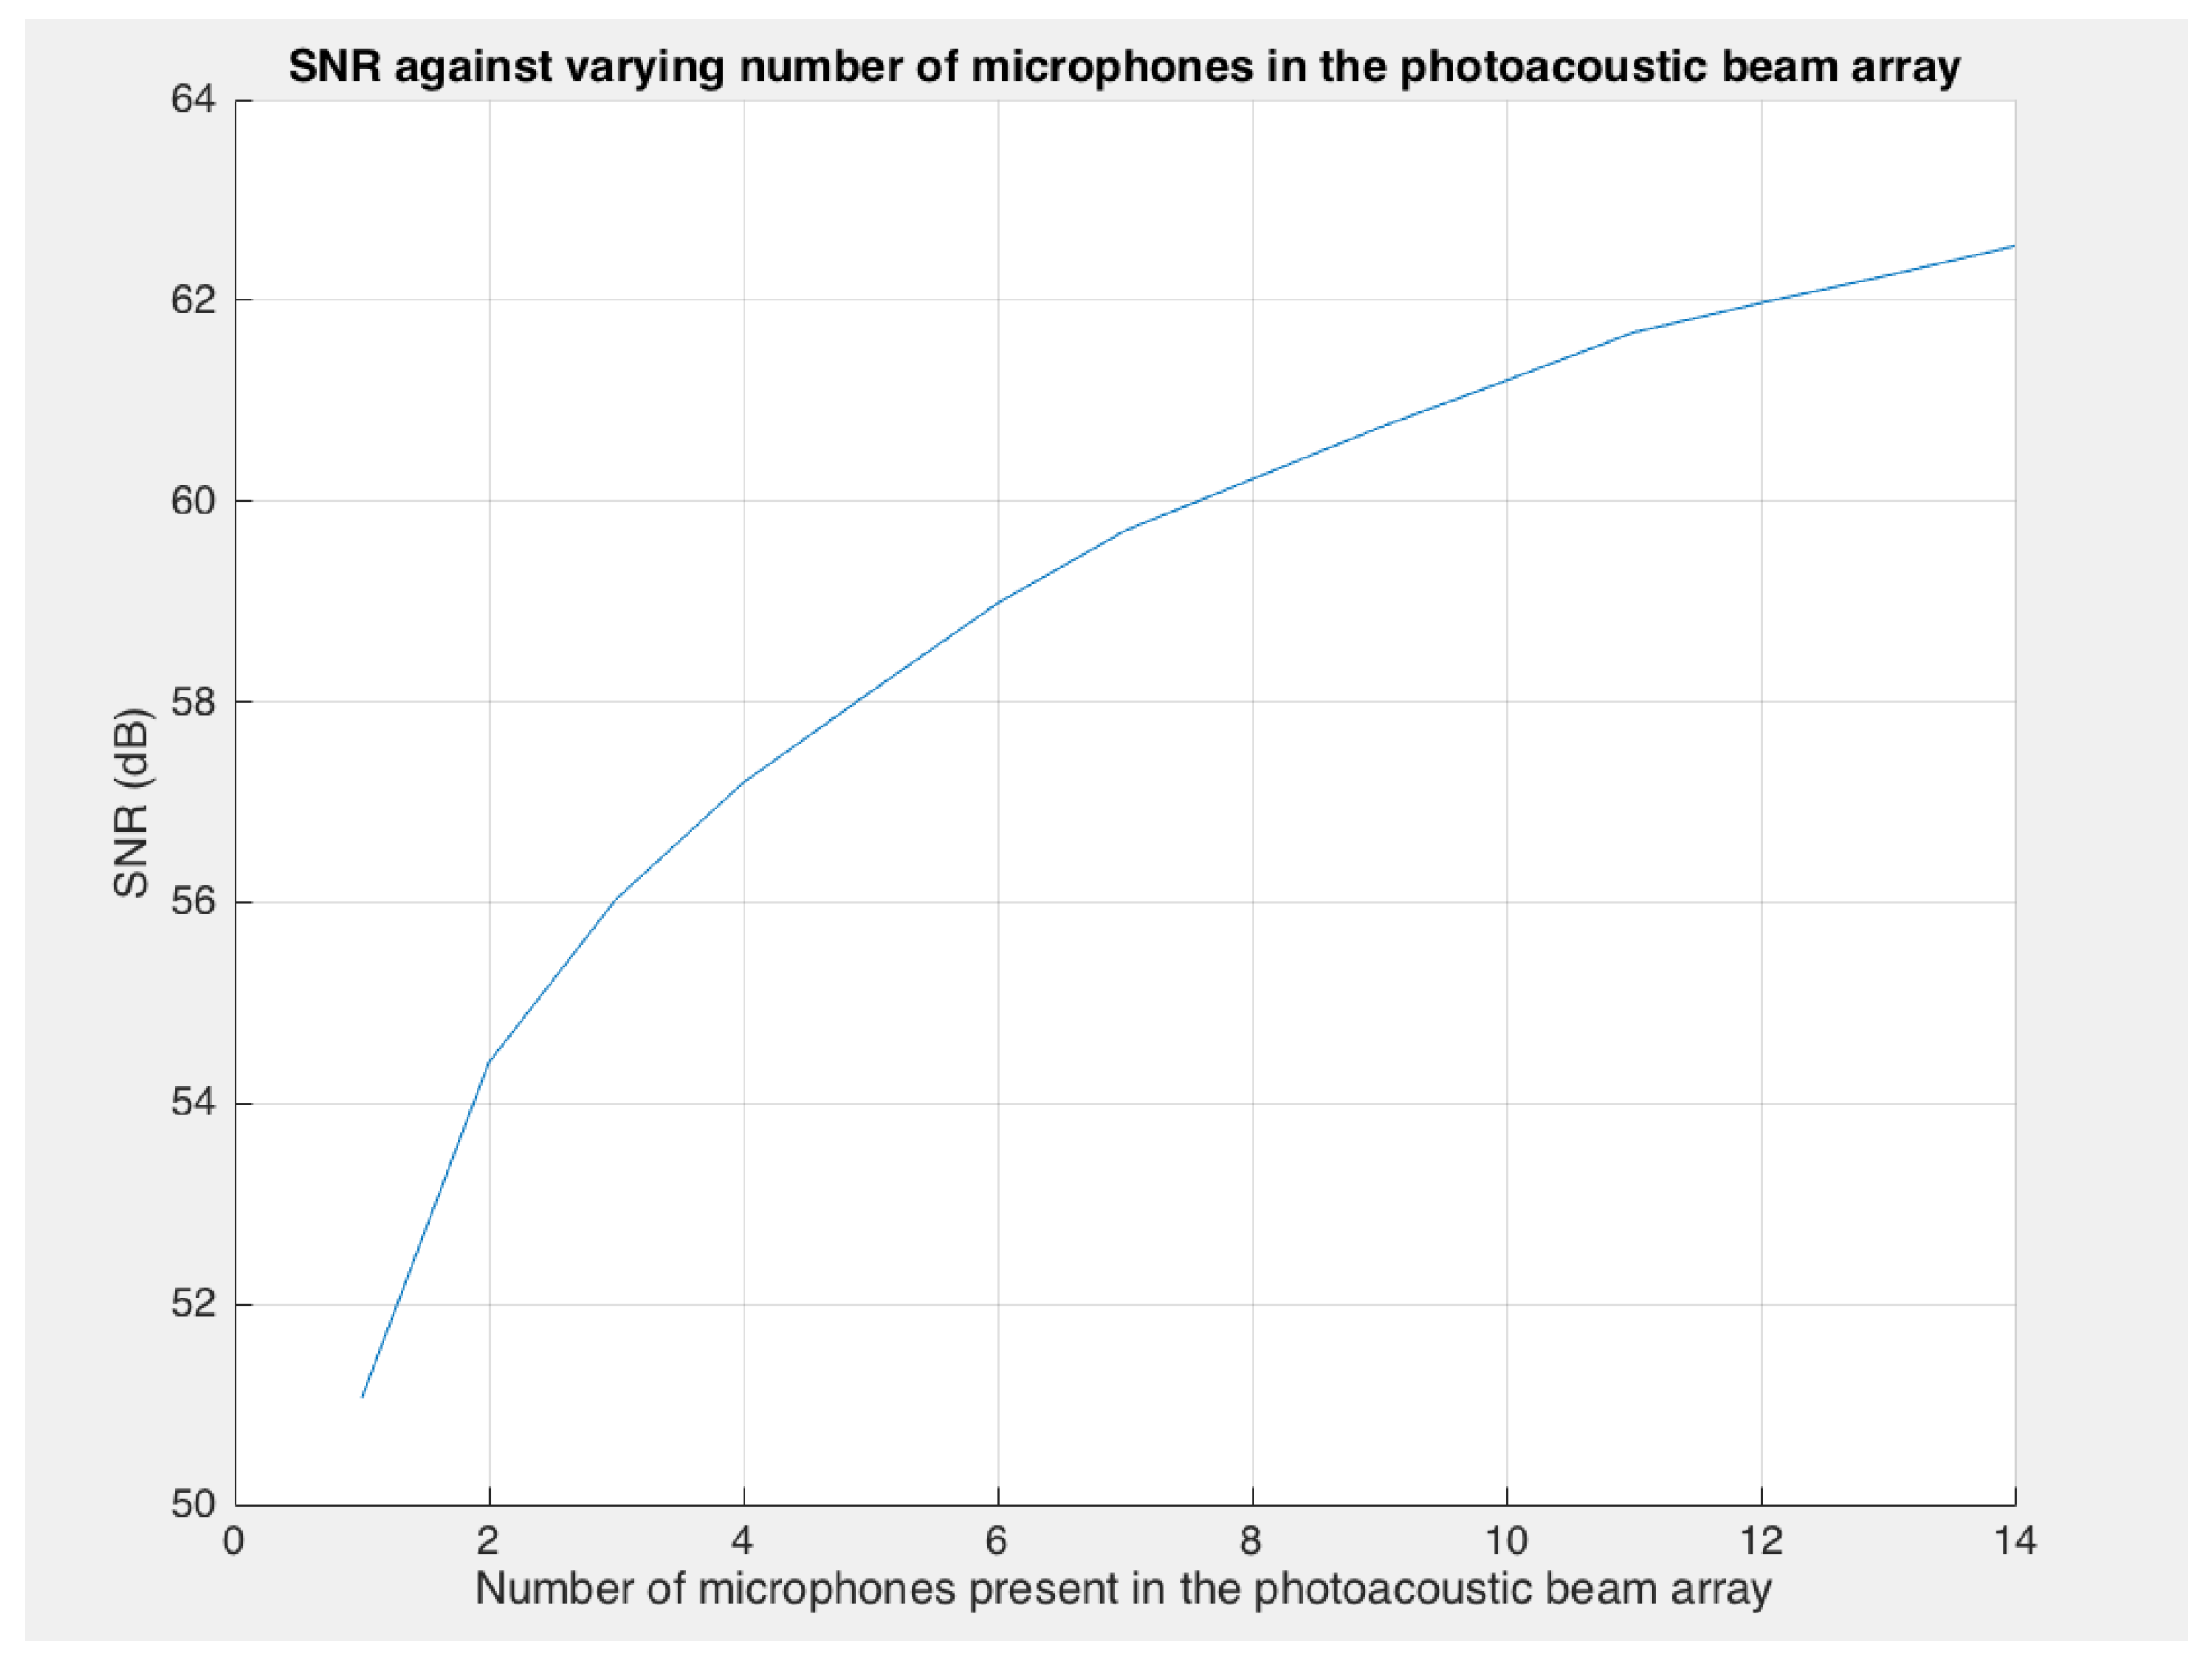
Figure 11.
Computed SNR from experimental PA sensing while varying microphone elements in the acoustic beam array.
Figure 11.
Computed SNR from experimental PA sensing while varying microphone elements in the acoustic beam array.

© 2018 by the authors. Licensee MDPI, Basel, Switzerland. This article is an open access article distributed under the terms and conditions of the Creative Commons Attribution (CC BY) license (http://creativecommons.org/licenses/by/4.0/).
Share and Cite
MDPI and ACS Style
Gupta, D.; Chen, X.; Wang, C.-C.; Trivedi, S.; Choa, F.-S. Stand-Off Chemical Detection Using Photoacoustic Sensing Techniques—From Single Element to Phase Array. Chemosensors 2018, 6, 6. https://doi.org/10.3390/chemosensors6010006
AMA Style
Gupta D, Chen X, Wang C-C, Trivedi S, Choa F-S. Stand-Off Chemical Detection Using Photoacoustic Sensing Techniques—From Single Element to Phase Array. Chemosensors. 2018; 6(1):6. https://doi.org/10.3390/chemosensors6010006
Chicago/Turabian StyleGupta, Deepa, Xing Chen, Chen-Chia Wang, Sudhir Trivedi, and Fow-Sen Choa. 2018. "Stand-Off Chemical Detection Using Photoacoustic Sensing Techniques—From Single Element to Phase Array" Chemosensors 6, no. 1: 6. https://doi.org/10.3390/chemosensors6010006
Note that from the first issue of 2016, this journal uses article numbers instead of page numbers. See further details here.