Modelling and Development of Electrical Aptasensors: A Short Review


1
Department of Mathematics and Physics “E. De Giorgi”, University of Salento, Via Arnesano, I-73100 Lecce, Italy
2
Department of Innovation Engineering, University of Salento, Via Arnesano, I-73100 Lecce, Italy
*
Author to whom correspondence should be addressed.
Chemosensors 2018, 6(2), 20; https://doi.org/10.3390/chemosensors6020020
Submission received: 14 March 2018
/
Revised: 14 April 2018
/
Accepted: 25 April 2018
/
Published: 27 April 2018
(This article belongs to the Special Issue Aptamer Technologies)
Abstract
:Aptamers are strands of DNA or RNA molecules, chemically synthetized and able to bind a wide range of targets, from small molecules to live cells, and even tissues, with high affinity and specificity. Due to their efficient targeting ability, they have many different kinds of applications. Particularly attractive is their use in biotechnology and disease therapy, in substitution of antibodies. They represent a promising way for early diagnosis (aptasensors), but also for delivering imaging agents and drugs and for inhibiting specific proteins (therapeutic aptamers). Starting by briefly reviewing the most recent literature concerning advances in biomedical applications of aptamers and aptasensors, the focus is on the issues of a theoretical/computational framework (proteotronics) for modelling the electrical properties of biomolecules. Some recent results of proteotronics concerning the electrical, topological and affinity properties of aptamers are reviewed.
1. Introduction
Nucleic acids are of great importance in encoding, transmitting and expressing genetic information [1]. Specific sequences of nucleic acids, referred to as aptamers, possess very high binding affinity to their targets, representing an interesting class positioned between small and biological molecules. An in vitro process, termed Systematic Evolution of Ligands by Exponential Enrichment (SELEX), is commonly used to select and synthesize, with high reproducibility, purity and in large quantity, the required aptamers. Moreover, this technique seems able to generate aptamers for virtually each possible target [2], overcoming the needs for cell lines or animals [1]. To date, numerous high-affinity aptamers have been selected for a broad range of target molecules, including metal ions, peptides, drugs, proteins and even whole cells or viruses [1,3,4]. Finally, aptamers are very stable and can recover their active conformation after denaturation at high temperature [1].
Due to their high affinity, specificity and stability, along with the benefits of a chemical synthesis, aptamers have attracted attention in various applications from chemical biology to medicine, becoming a true alternative to standard compounds [5,6,7,8]. Nevertheless, it has to be pointed out that acceptance and use of aptamers in industry and by (bio)pharmaceutical companies still remain rare [5].
The aim of this short review is to provide a summary of the recent achievements in the selection, development criteria and application of aptamers, focusing on their electrical properties. Particular attention is paid to describing the advances in the modelling of the aptamer-protein interaction, within the framework of a complex network approach named proteotronics.
2. Aptamer Selection
2.1. SELEX and Cell-SELEX
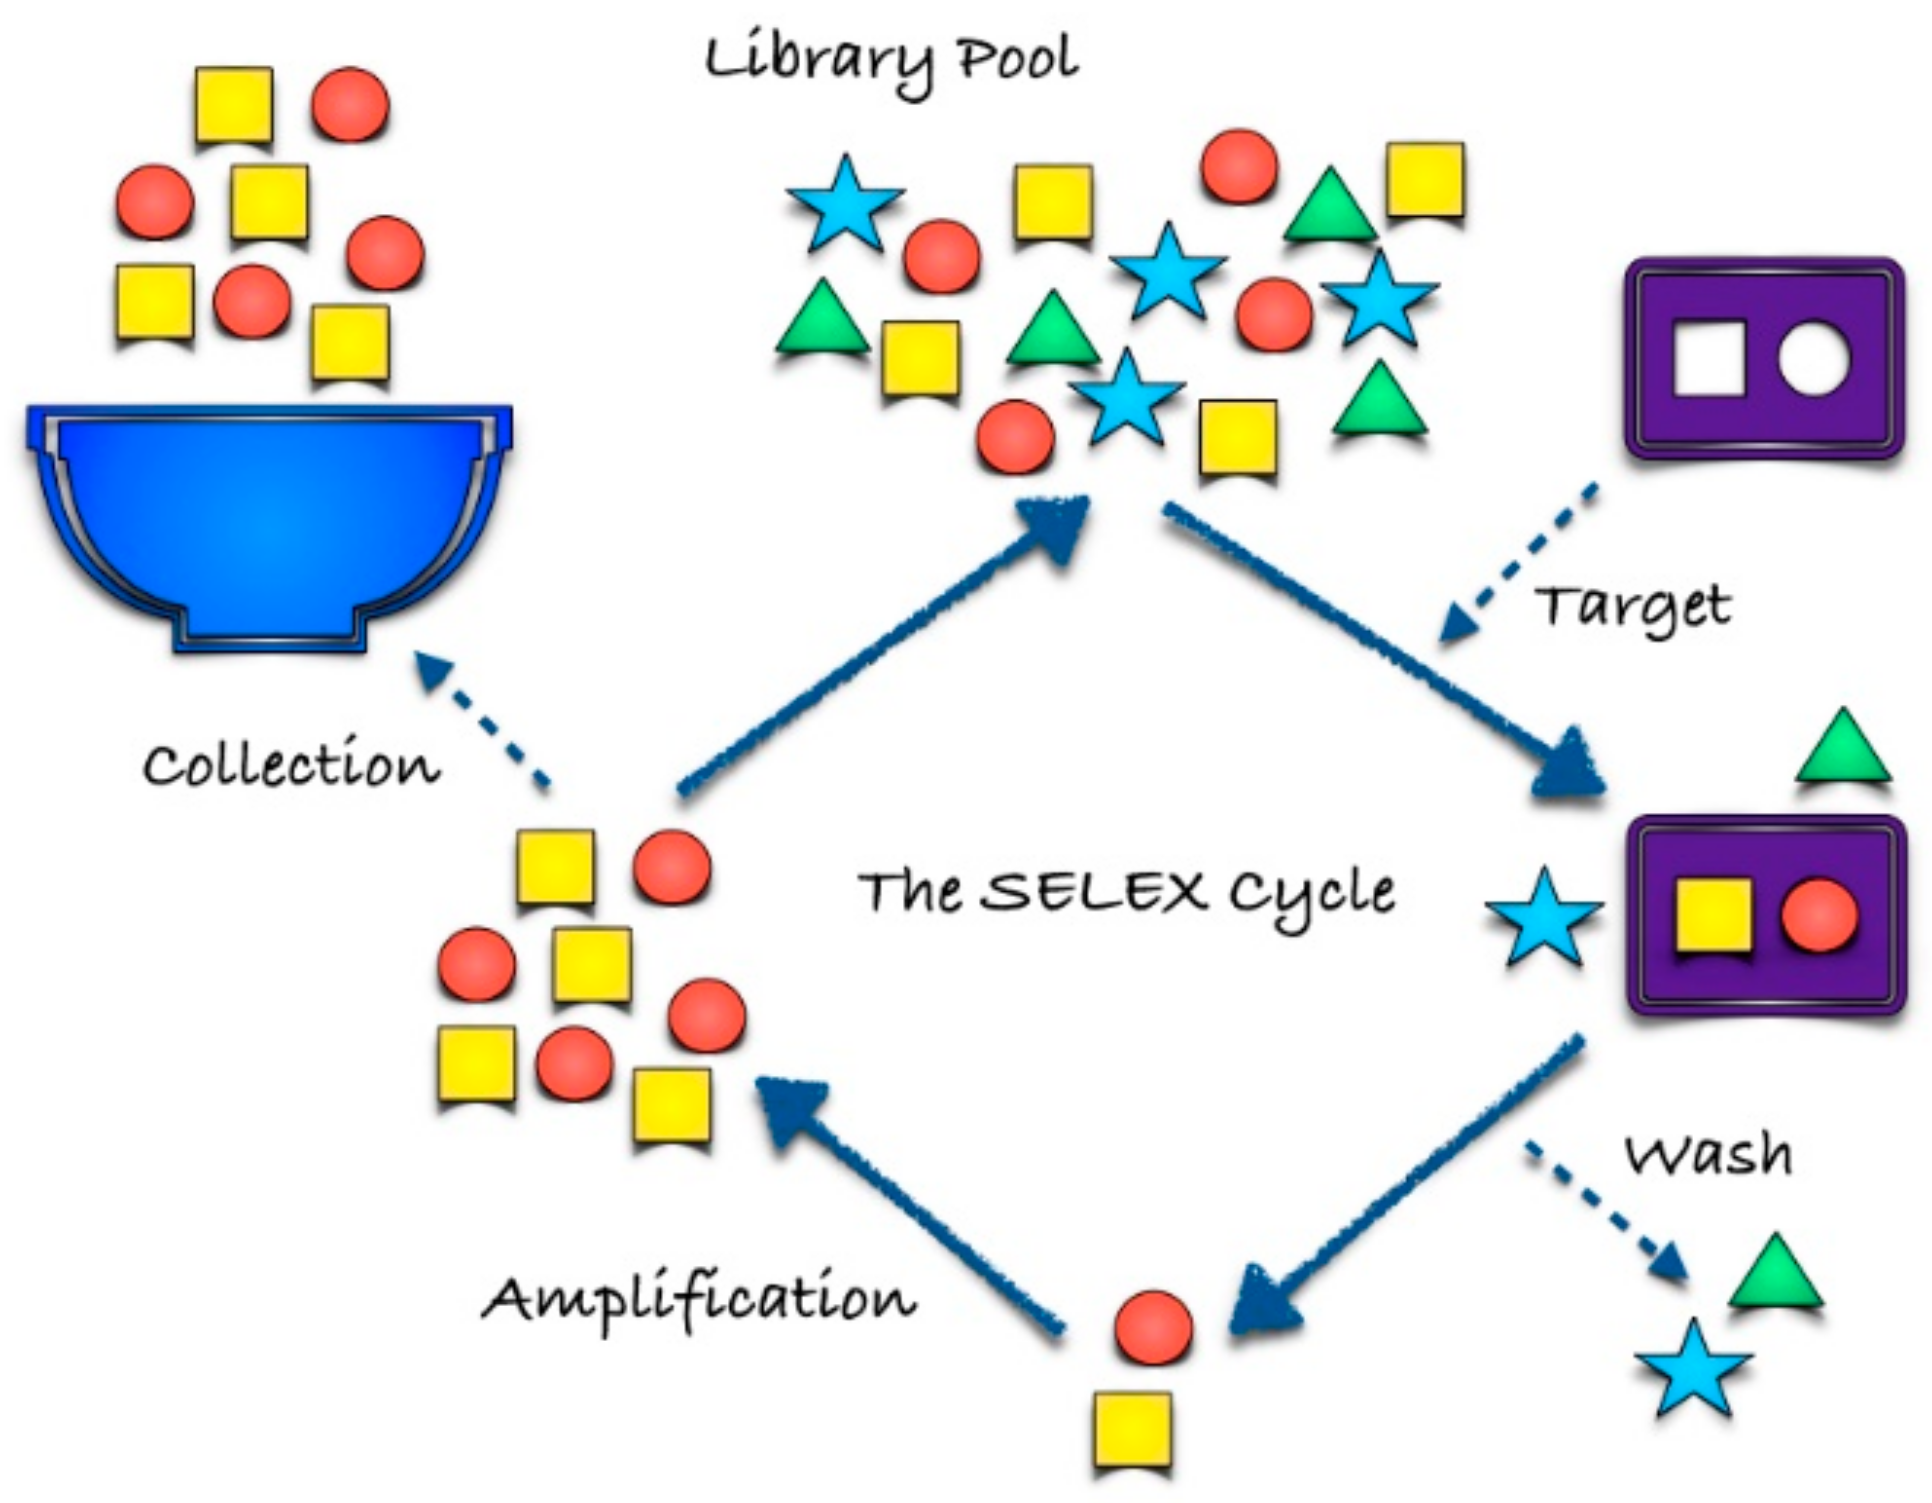
SELEX (Figure 1) is a well-established technology for the in vitro production of aptamers based on an iterative process of selection and amplification (see [9,10] and the references therein). The process starts with a chemically-synthesized random oligonucleotides library, which contains from 1013 to 1016 motifs of different sequences. The selection consists of five steps: (1) binding, i.e., incubation of the library with the target; (2) partition, i.e., isolation of target-bound sequences from the unbound ones; (3) elution from a complex via chromatography; (4) amplification and the generation of a new pool of nucleic acids by Polymerase Chain Reaction (PCR), for DNA libraries, or real time-PCR, for RNA libraries; (5) conditioning, in which in vitro transcription and purification of relevant ssDNA are included [10]. The optimization and development of the SELEX methodology has made the range of targets wider, including small molecules, proteins, viruses and bacteria [10].
Long selection time and high costs are the principal drawbacks of this technique; therefore, several strategies designed for a shortening of the selection period, while maintaining the aptamer affinity to targets are under investigation [1,7].
Finally, SELEX is typically performed by using a highly purified target molecule so that it has limited results in the production of aptamers useful for cancer detection. This is because these aptamers are not able to bind whole (cancer) cells, or, more specifically, target proteins on the cell surface [11]. To overcome these limitations, cell-SELEX was developed, which uses living cells as targets. It ensures the selection of aptamers able to bind the bioactive forms of target proteins on the cell surface, thus making the developed aptamers highly suitable for biological applications [11]. Moreover, there is no need to know the quantity or types of proteins on the cell surface, which simplifies the selection process, also reducing costs [1,12].
2.2. Aptamer vs. Antibody in Cancer Therapy
The understanding of biomolecular recognition mechanisms is fundamental to achieve significant advances in designing new tools for diagnosis and therapeutic applications. Among these applications, cancer disease has greatly attracted the interest of researchers over the last 30 years, although current treatments still remain unsatisfactory [13].
One of the most successful strategies in cancer treatments is based on monoclonal antibodies [14]; as a matter of fact, they are able to modulate the action of the immune system, promoting adaptive immune response. They present high sensitivity and robustness, linked to high selectivity and affinity in the antibody-antigen binding reaction [15]. More than 30 therapeutic antibodies are currently in clinical practice, and hundreds more are undergoing clinical trials [16]. Although monoclonal antibodies present many advantages with respect to traditional treatments, their high cost, mostly associated with large cultures of mammalian cells and extensive purification steps, prevents an extensive use [16].
Aptamers have been proposed as a powerful and satisfactory alternative to antibody-based treatments, giving new impulse in therapeutic, diagnostic and basic research. Advantages, limitations and prospects for successful cancer therapeutics by using aptamers instead of antibodies are shown and discussed in many recent reviews; see, for example, [16,17,18]. In a nutshell, the key points in using aptamers are: (i) they are synthetically produced, therefore chemical modifications can be easily and accurately introduced to fulfil different diagnostic and therapeutic purposes; (ii) they show good thermo-stability and long-term stability; (iii) with respect to the analogue monoclonal antibodies, they show reduced side effects and low production costs; (iv) they are relatively small with respect to monoclonal antibodies; therefore, they are expected to show greater penetration into tumor tissues [8].
In the recent literature, many papers deal with the aptamer ability at specifically recognizing cancer cells. In particular, early detection techniques are in rapid development with specific applications to several diseases, from leukemia [19] and breast tumor [20,21] to colorectal tumor [22].
The employment of aptamers in drug delivery, gene therapy and cancer imaging to develop personalized diagnosis and therapy is a sparkling field of investigation. Currently, the use of aptamers in medical applications is a reality: an aptamer specifically recognizing human vascular endothelial growth factor has been approved for the treatment of Age-related Macular Degeneration (AMD) in the U.S. and the EU, and others are under clinical trials for applications in coagulation, oncology and inflammation [17].
3. Aptamers in Electrical Nanobiosensors
The identification of a disease-specific marker at an early stage significantly affects the costs and time associated with drug development, as well as the clinical success rate [23]. To this aim, nanotechnology combined with biotechnology is giving excellent results in engineering extremely sensitive devices in this area [23,24].
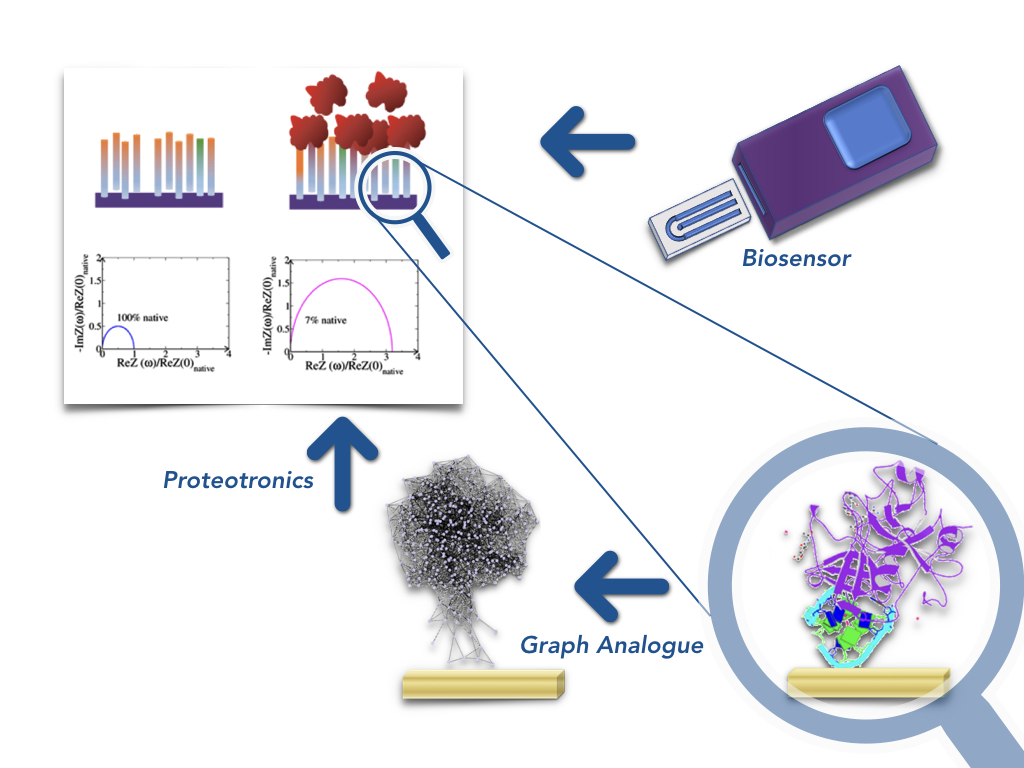
Biosensors (Figure 2) are devices able to detect the presence of a specific target, by using a sensing biological element. Detection is the result of the interaction between the sensing element and the target molecule that produces a change of a measurable physical signal, such as impedance, conductance, light, heat, etc. The key element of a biosensor is, therefore, the sensing element, which is required to have high affinity to the target. Over the years, protein receptors and antibodies have been extensively used to this aim; recently, aptamers have been applied to the detection of protein biomarkers, just like immunosensors, monitoring binding-specific changes in functionalized electrodes. Aptamer-based biosensors (aptasensors) appear to be particularly promising concerning the possibility of a rapid and efficient detection under real live conditions [25], require low power, are easy to use and represent an effective solution in many applications, mainly for point-of-care disease detection [23].
The electrochemical aptasensors are classified into three broad classes, depending on the assay format and the method of detection: amperometric, potentiometric and impedimetric (see [25] and the references therein). The first electrochemical aptasensor was an amperometric device for the detection of thrombin. It used two different aptamers, immobilized on gold electrodes in a sandwich-like configuration [26]. At present, new immobilization techniques are available, as reviewed in [27].
Concerning the detection technique, Electrochemical Impedance Spectroscopy (EIS) is a sensitive and non-destructive technique, widely used to characterize the electrical properties of electrode-aptamer interfaces. The changes in dielectric properties, charge distribution and conductivity are represented by the impedance spectrum (Nyquist plot), the semi-circular part of which corresponds to an electron transfer limiting process. The diameter of the semicircle describes the interface properties of the electrode, i.e., the electron-transfer resistance [28]. A Field Effect Transistor (FET) biosensor also gives excellent results in the detection of several kinds of targets, including light. In this kind of device, detection is transduced in a change of conductivity, which can be enhanced by using nanostructured materials and or graphene [29].
Although electrical aptasensors offer advantages such as simplicity, low cost, good sensitivity and selectivity, at present, their use in clinical laboratories remains limited [29]. A comprehensive review about the recent progress and challenges in designing electrochemical aptasensors, their effectiveness in protein disease biomarkers or contaminants detection in food and the environment is reported in [30,31,32,33].
In Table 1, some characteristics of a few recent works dealing with the detection of various diseases, by means of electrical biosensors, are reported. They present different types of innovation in the choice of material and detection technique and show outstanding results in sensitivity, selectivity and detection time. These features make them attractive candidates for the development of simple and robust biosensors, well suited for high-throughput sensing in the biomedical field. In conclusion, the challenges, applications and perspectives of aptasensors are exponentially growing, and this requires the simultaneous development of a theoretical framework able to guide and interpret the experimental outcomes.
4. Modelling the Electrical Properties of Aptamers
The modelling of charge transport in biomolecules is a very intriguing topic, which has received, in recent years, continuous attention [43]. The classical theory of charge transport in ordered matter needs to be improved for systems like biomolecules that have no crystalline structure, although showing a high degree of organization. In particular, in such systems intrinsically reduced in size, a mean field approach is not significant, and new concepts have been developed to take into account the role of the specific 3D structure. Specifically, the description in terms of Bloch waves (Extended States (ES)), which substantially do not account for the space organization of the material, is partially or totally substituted by introducing short range waves (Localized States (LS)). The transition between two LS happens with the energy cost by means of tunneling or hopping mechanisms. In such a way, at low bias and temperature, the dominant transport mechanism is performed by ES, while, increasing bias and/or temperature, the tunneling/hopping mechanism becomes dominant. Following a backward path, in the early 1990s, this kind of local description was overcome by a new proposal, which introduced the concept of electron transfer by multiple pathways, a quite effective although simplified view of electronic transport, which, as a consequence, gave value to the quite macroscopic aspects like protein motifs and internal interaction [44].
4.1. Complex Networks for Bioelectronics
In line with these studies, proteotronics was introduced in [45] as a complex network approach to describe the single macromolecule as a set of interacting building blocks, which communicate at a distance (the interaction radius, RC).
Information percolates inside the network and produces the macroscopic response as an emergent property, which reflects the original biomolecule structure. This is a manifestation of the structure and function paradigm, i.e., when, as in many sensing proteins, the activation produces a change of structure (conformational change), also the function changes, and in turn, this produces detectable changes in the measurable physical quantities (for example, impedance). These mechanisms are the same seen in biosensors that detect the presence of a specific target by measuring the change of a (electrical, in the present case) response as a consequence of the topological change of the biological sample used as the sensing part (see Figure 1).
Proteotronics is able to simulate the electrical response of a biomolecule by using an electrical network. The biomolecules can be proteins, as well as fragments of DNA/RNA in their 3D structures. Nowadays, resolving these structures is still a hard task; some free databases are available that collect data mainly on proteins [46], but little is known about aptamers. This is because they constitute a relatively young field of investigation, but it is also due to their extreme flexibility in the target-free state.
Therefore, many in silico methods to predict the structure of proteins and aptamers are flourishing. For the current state of art, they have to be meant as useful complements to traditional X-ray and NMR methods since their predictive capability is not complete. However, the strong activity in this field gives reason to hope for increasingly efficient results [47,48,49].
Proteotronics uses these data as inputs to generate a biomolecule-analogue graph. The scheme of the method is the same for both proteins and aptamers: the analysis is performed at the level of a single amino acid or nucleobase, the elementary brick, which is identified with the Cα or C1 carbon atom. Although different choices are possible to identify the centroids of the brick [50], differences appear small at this level of refinement. Then, collecting the coordinates of each brick and assigning a cut-off distance, RC, a graph G(N,L), with node set N and link set L, is set up: all the Euclidean distances between couples of elementary bricks are calculated, creating a distance matrix. From the distance matrix, the graph description of the network is represented through its adjacency matrix A of size N × N, the elements ai,j (i≠j) = 1/0 if a link exists or not, and ai,i = 0, i.e., no self-loops exist. A is a symmetric matrix, i.e., the network is undirected. A link between two nodes exists only if their distance is smaller than RC.
4.2. Resistance to Evaluate Binding Affinity
The topological graph becomes an interaction network by assuming that the links are the physical routes by which the bricks communicate. Specifically, in the common applications to electrical biosensors, two different kinds of electrical measurements are performed: (a) at fixed bias intensity with varying frequency, i.e., a standard Electrochemical Impedance Spectroscopy (EIS) measurement, which is represented by impedance spectra [52,53]; (b) at fixed frequency and varying bias intensity, such as FET-biosensors, which is represented by current (resistance)-voltage plots [54]. In both cases, these measurements, specifically the variation of impedance or current, are used to detect, with high specificity and selectivity, the presence of a specific target. The intensity of variation is also related to the target concentration. In general, the threshold of detection is quite low and sometimes very low [53].
The network follows the same fate of the biomolecule it describes: it changes its structure. Sometimes, this means that only the link number changes, corresponding to the biomolecule reassembling: this happens, for example, for an optical receptor that has light as a target [54,55]. In other cases, the target is a material object, and so, the network changes substantially, since, after the sensing action, it represents not a single biomolecule, but the whole complex [50,56].
In the present review, we describe the results obtained by mimicking the action of an elementary RC (Resistance and Capacitance in parallel) impedance, Zij, which is in agreement with most of the EIS experimental outcomes. In these experiments, the capture of the target is detected by an impedance variation, which is macroscopically described by using an analogue electrical circuit, known as a Randles cell, whose elements reproduce the observed measure. To obtain information about the microscopic electrical features, we proceed by analyzing the experimental results and focusing the investigation on the impedance terms, which effectively change during the measure [45]. This allows us to postulate the following expression for the elementary impedance:
with fij a form factor, ω the frequency of the applied bias, ε0 the dielectric constant in a vacuum and εij and ρij the resistivity and dielectric constants of the couple of ij nodes.
Concerning the values of resistivity and dielectric constant, they have been calculated as in [56] and describe the mean resistivity/dielectric constant of the couple of bricks, which can be made of amino acids only, nucleobases only or an amino acid and a nucleobase (in the binding region). Once, formally, the network is connected to the bias, the set of corresponding linear equations can be resolved, and the total impedance is calculated. In Table 2, we resume some of the biomolecules whose electrical properties have been analyzed by using proteotronics, and more information can be found in [44].
The procedure is applied to the case of the TBA aptamer, whose 3D structure is known in the native state (the aptamer is target-free) and also complexed with thrombin. In particular, the complex state has been resolved in the presence of two different cations, Na+ and K+, both of them enforcing the stability of the aptamer structure, but with different results concerning the affinity, i.e., the stability of the complex is enhanced by potassium cations [60].
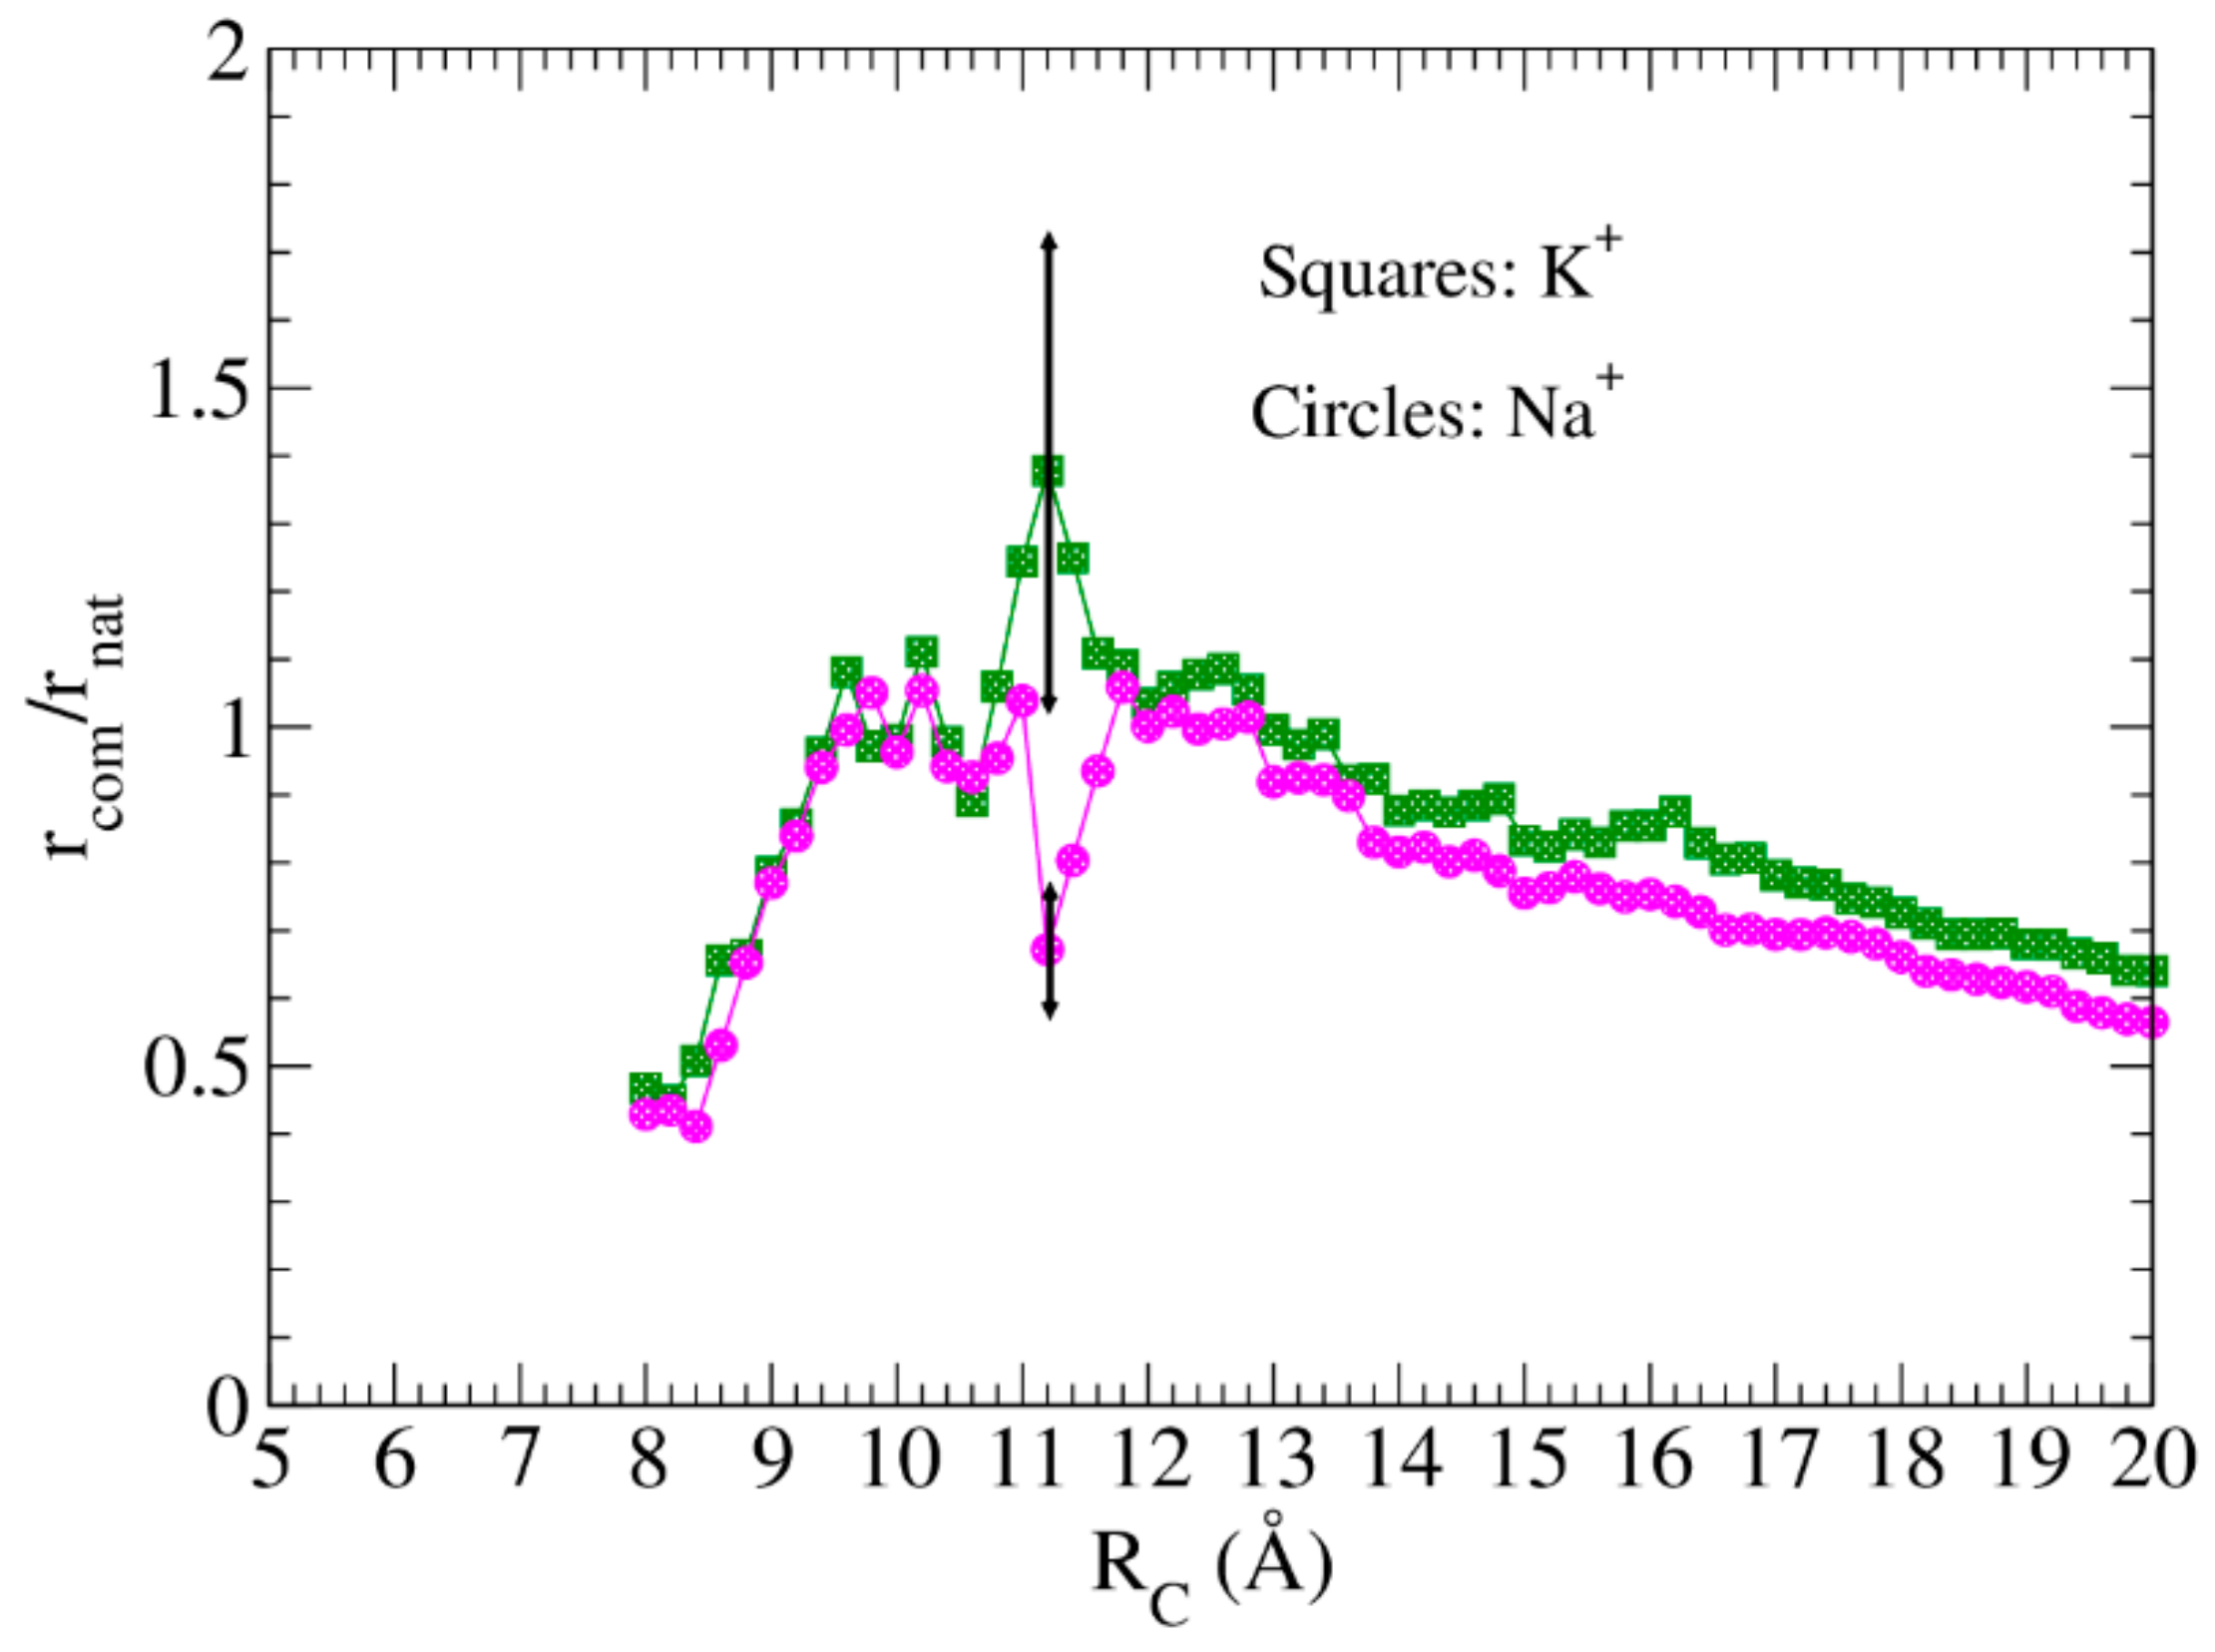
The resistance spectrum can be calculated for each structure, solving the impedance network. Figure 4 shows the ratios of the resistance of the complex to the native aptamer, rcomp/rnat, at increasing values of RC. Calculations were performed using: (i) for the TBA-protein complexes, the structures given in [60]; (ii) for the native aptamer, a set of 12 different models of the structures given in [61]. Each point in Figure 4 is obtained by averaging over the 12 structures of the native state; only the largest errors are reported. In the whole spectrum, the responses of the two complexes are different, markedly between 8 Å and 12 Å. In this region, the expected and measured responses (rcomp/rnat > 1) are in agreement (experiments were performed in the presence of potassium) [56,62].
Finally, the resistance measurement is proposed to estimate the binding affinity of the aptamer to its target [51,56]. The effectiveness of this kind of test has been confirmed in a different analysis performed on a set of five different anti-angiopoietin aptamers [57,63].
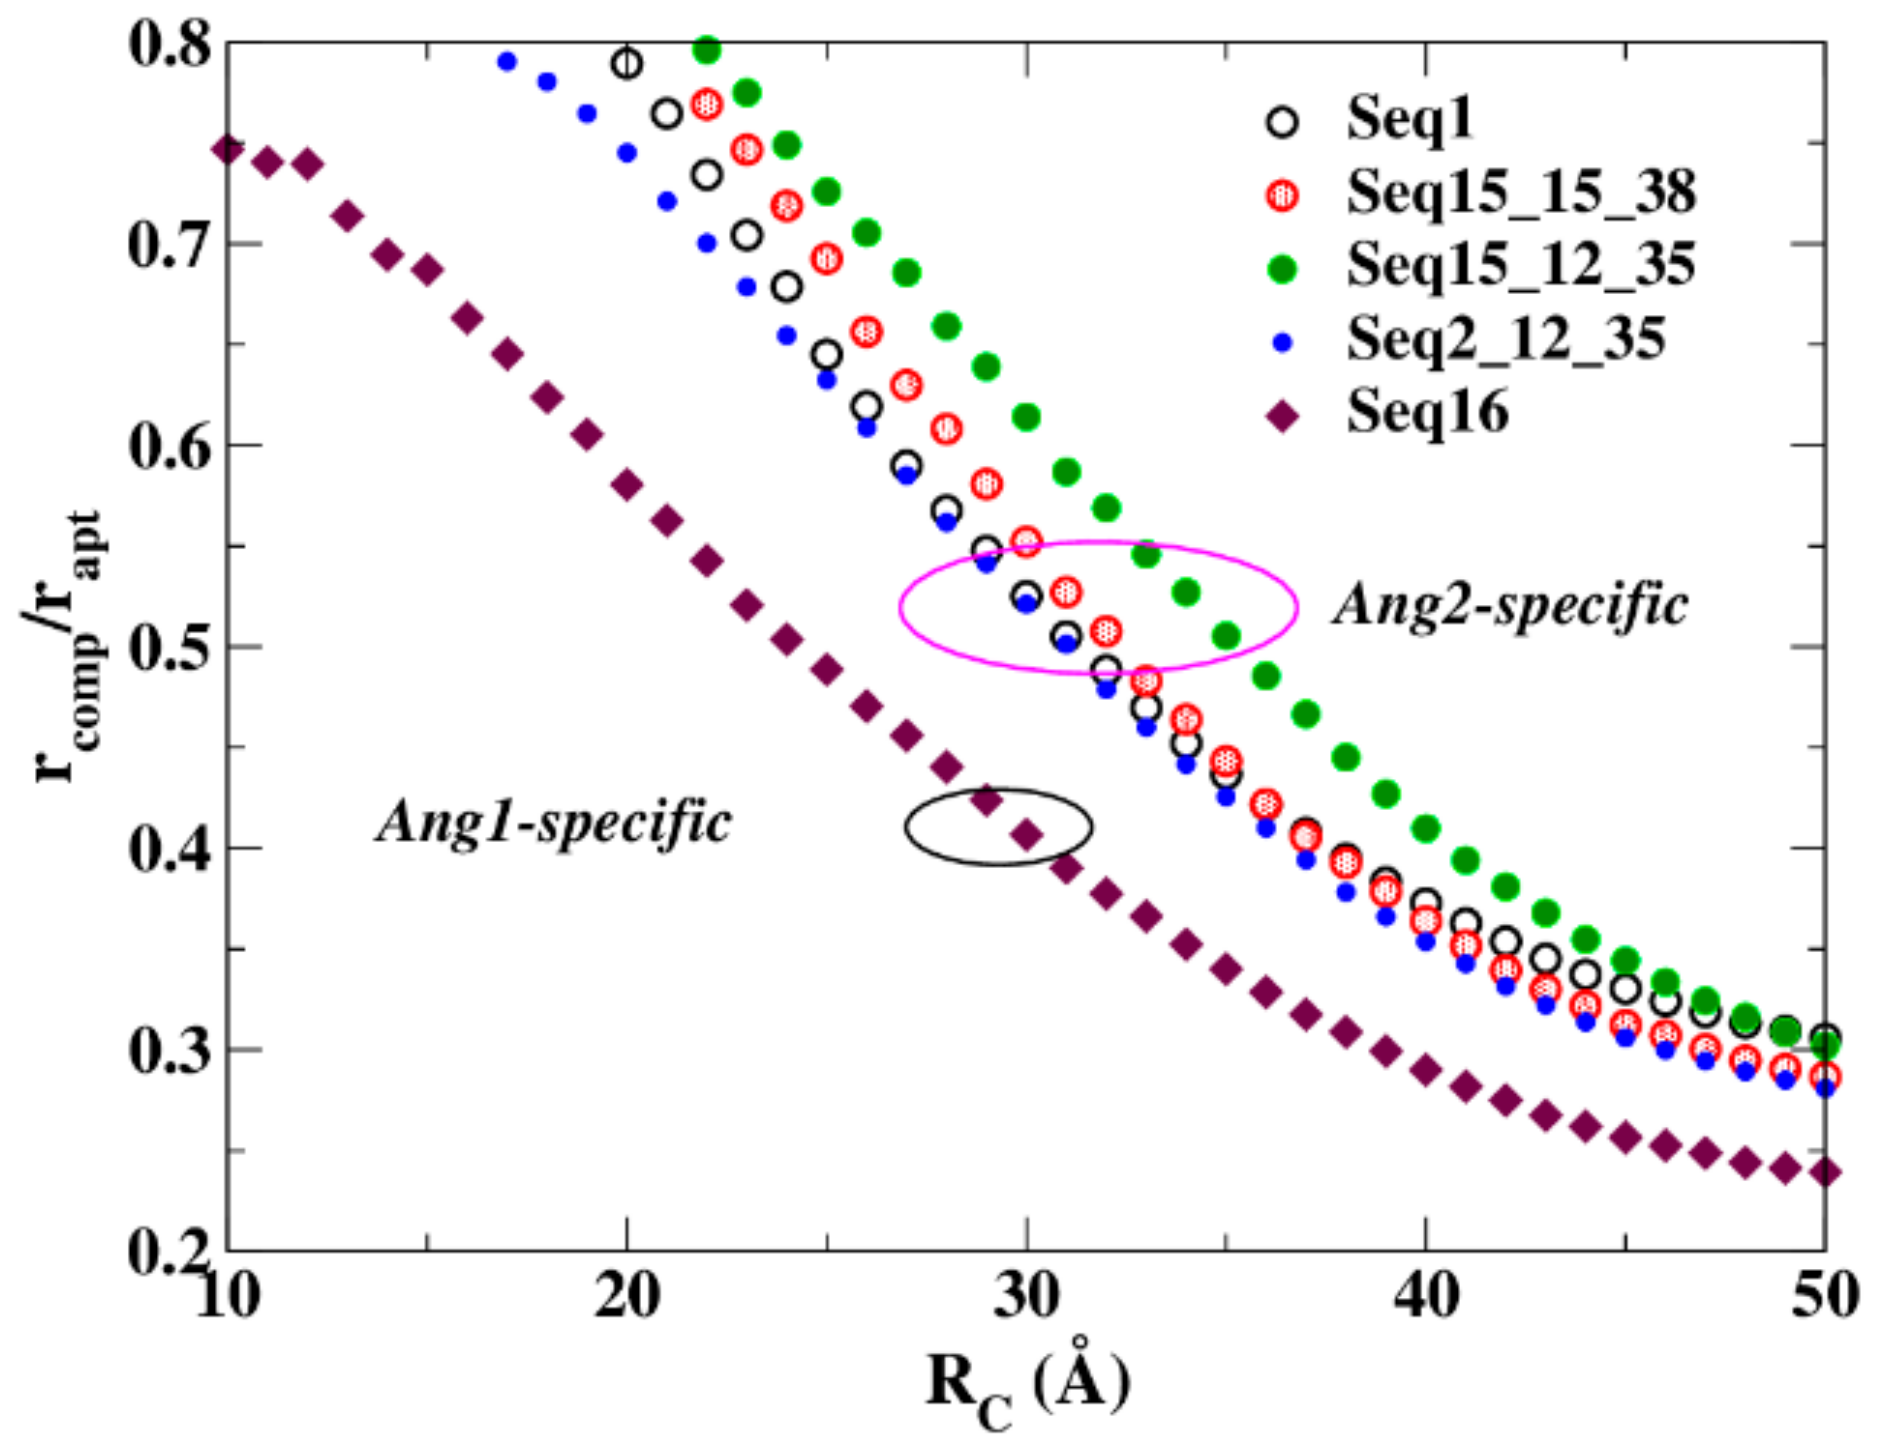
In this case, their structures were produced in silico by a cascade procedure able to furnish a number of possible configurations for the aptamer alone, as well as complexed with the protein. The main features of these configurations were analyzed by using the previously outlined strategy. In particular, and in good agreement with the experiments, the resistances calculated for these aptamers are in line with the affinity performances observed in the experiments. The ratio rcomp/rapt of the resistance of the complex to the resistance of the aptamer, at increasing values of RC, is reported in Figure 5. The behavior of the four Angiopoietin-2 (Ang2)-specific aptamers is quite different from that of the Angiopoietin-1 (Ang1)-specific aptamer. The maximal sensitivity of this measure is obtained at low RC values: increasing RC, the Ang2 specific aptamers converge toward a similar value. This is not surprising because the number of network links enlarges as RC increases, giving the networks a similar, uniform shape [45], except for Seq16, the Ang1-specific aptamer.
This scheme is quite general and can be used for different kinds of interactions (chemical, physical, mechanical, etc.). Till now, the modelling of several ligands, receptors and the complexes ligand-receptor have been developed [45]. The gained experience in this field allows us to understand that, in describing the ligand-receptor docking, beyond the primary role played by the conformational change, a non-subordinate part has to be attributed to the change of the interaction itself [53,56]. As a matter of fact, from the physical point of view, biomolecules are open systems in continuous interaction with the environment. Therefore, also the description of their electrical properties necessarily depends on the assigned external conditions (the solute kind or solute concentration, temperature and, finally, the binding to a different molecule). When these conditions change, we can expect a variation of the information exchange, promoting or depressing the macroscopic response.
At the level of a single biomolecule, the resistance spectra shown in Figure 4 and Figure 5 can be interpreted as activation spectra, i.e., they measure to what extent the presence of the target changes the aptamer response. At the level of a sample, the increasing concentration of target molecules changes the intensity of the response (in the case of TBA, the resistance becomes increasingly larger [56]). This is an effect of two different phenomena: (i) increasing the number of targets, the number of complexed biomolecules increases, and in turn, the response becomes greater; (ii) increasing the number of targets produces a variation of the environment, which in the network description, is expressed by a change of the value of RC, for both aptamer and complex. Specifically, we postulate that, for an assigned concentration of the target, the fraction of aptamer-protein complex is a function, g, of the interaction radius:
with , R0 is the value of RC corresponding to the absence of target and a,b are fitting parameters [56]. The value of RC changes with the target concentration.
Finally, the expected resistance response of the sample is given by:
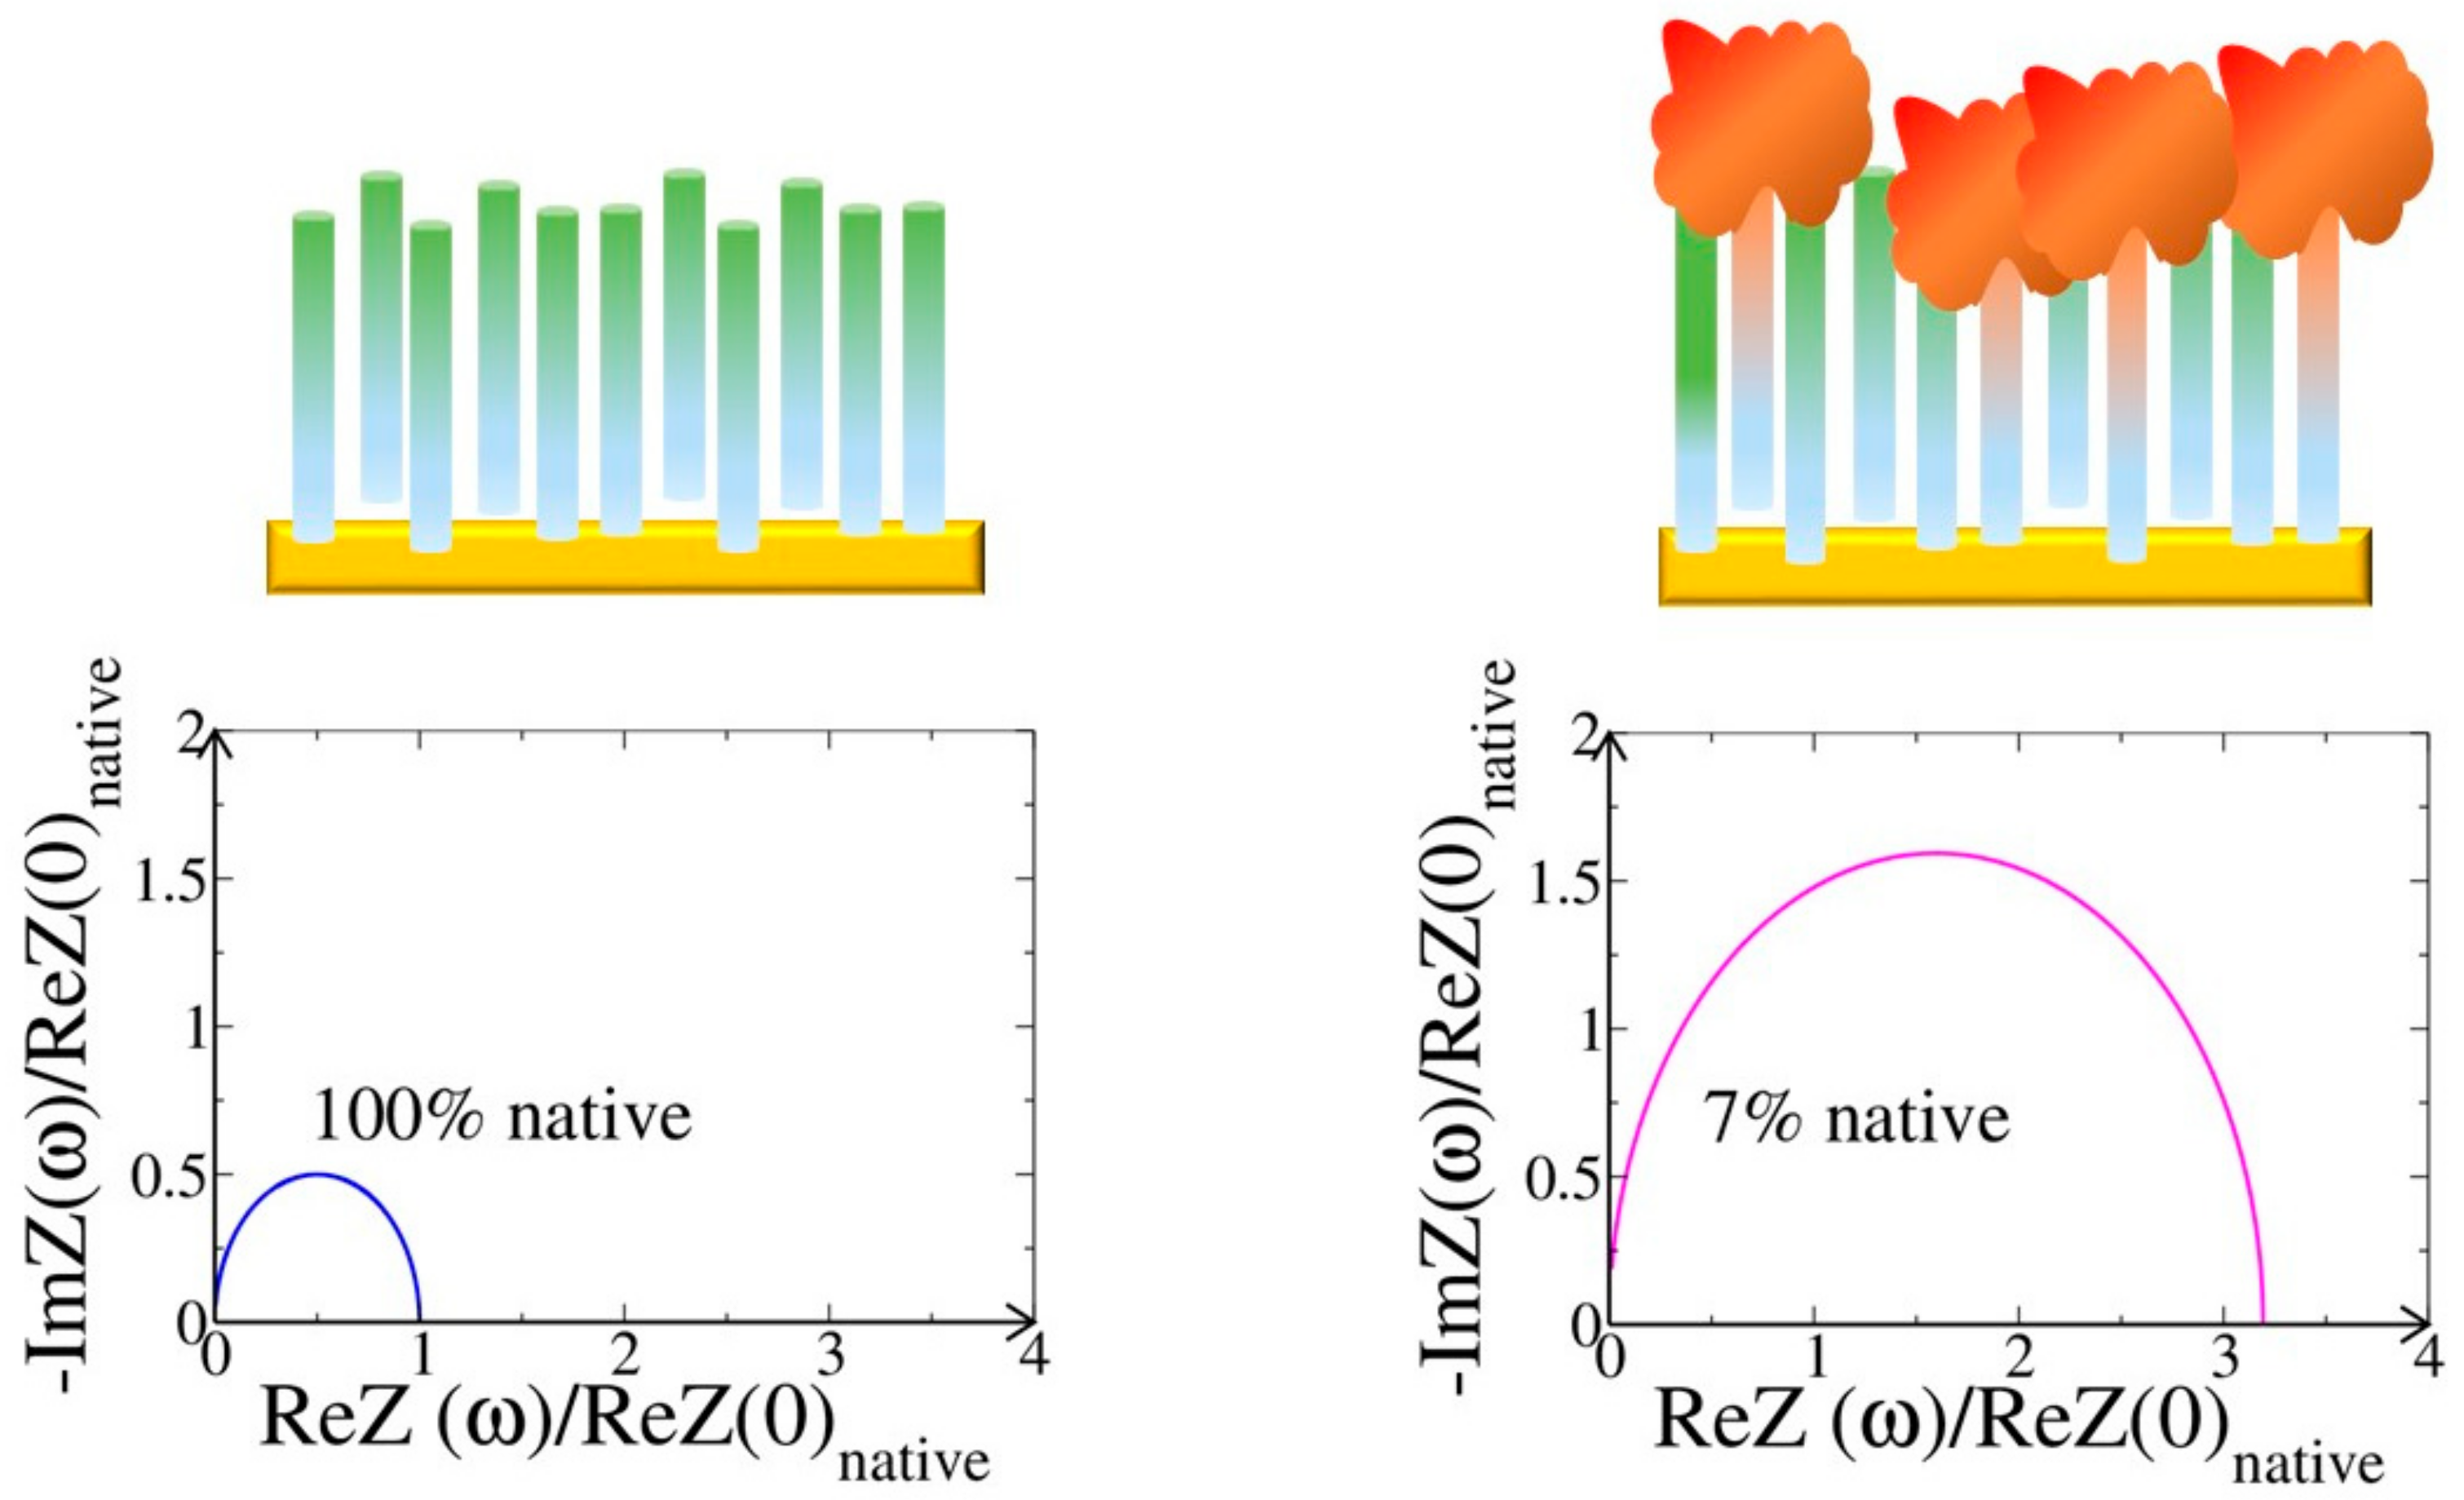
and depends on the target concentration, i.e., on RC. The spectrum of the total impedance of the alone and complexed aptamers is then calculated and drawn in a standard Nyquist plot. In particular, in Figure 6, we report the Nyquist plot calculated by assuming g = 0 (corresponding to the absence of thrombin) and g = 0.93, which corresponds to a thrombin concentration of 1 µM [62]. In general, the shape of the calculated Nyquist plot and its variation depends on the specificity of the ligand and on its concentration [45].
4.3. Hierarchy and Assortativity as a Measure of Binding Affinity
Assortativity defines networks in which highly-/lowly-connected nodes are also bound to highly-/lowly-connected nodes. High assortativity limits information circulation in the network. In other terms, high assortativity characterizes a closed system, i.e., a system that is not able to exchange information with the environment. Instead, low assortativity describes an open system, i.e., a system that efficaciously exchanges information with the outside [51].
Hierarchy ranks node connectivity: high hierarchy means that few nodes (hubs) rule the link distribution in the network. In general, this is identified as a mark of the network’s weakness [64,65], as when removing a small number of hubs, the network becomes unstable. On the contrary, a flat structure (low hierarchy) is more stable, but also flexible and adaptable in handling changes (resilience).
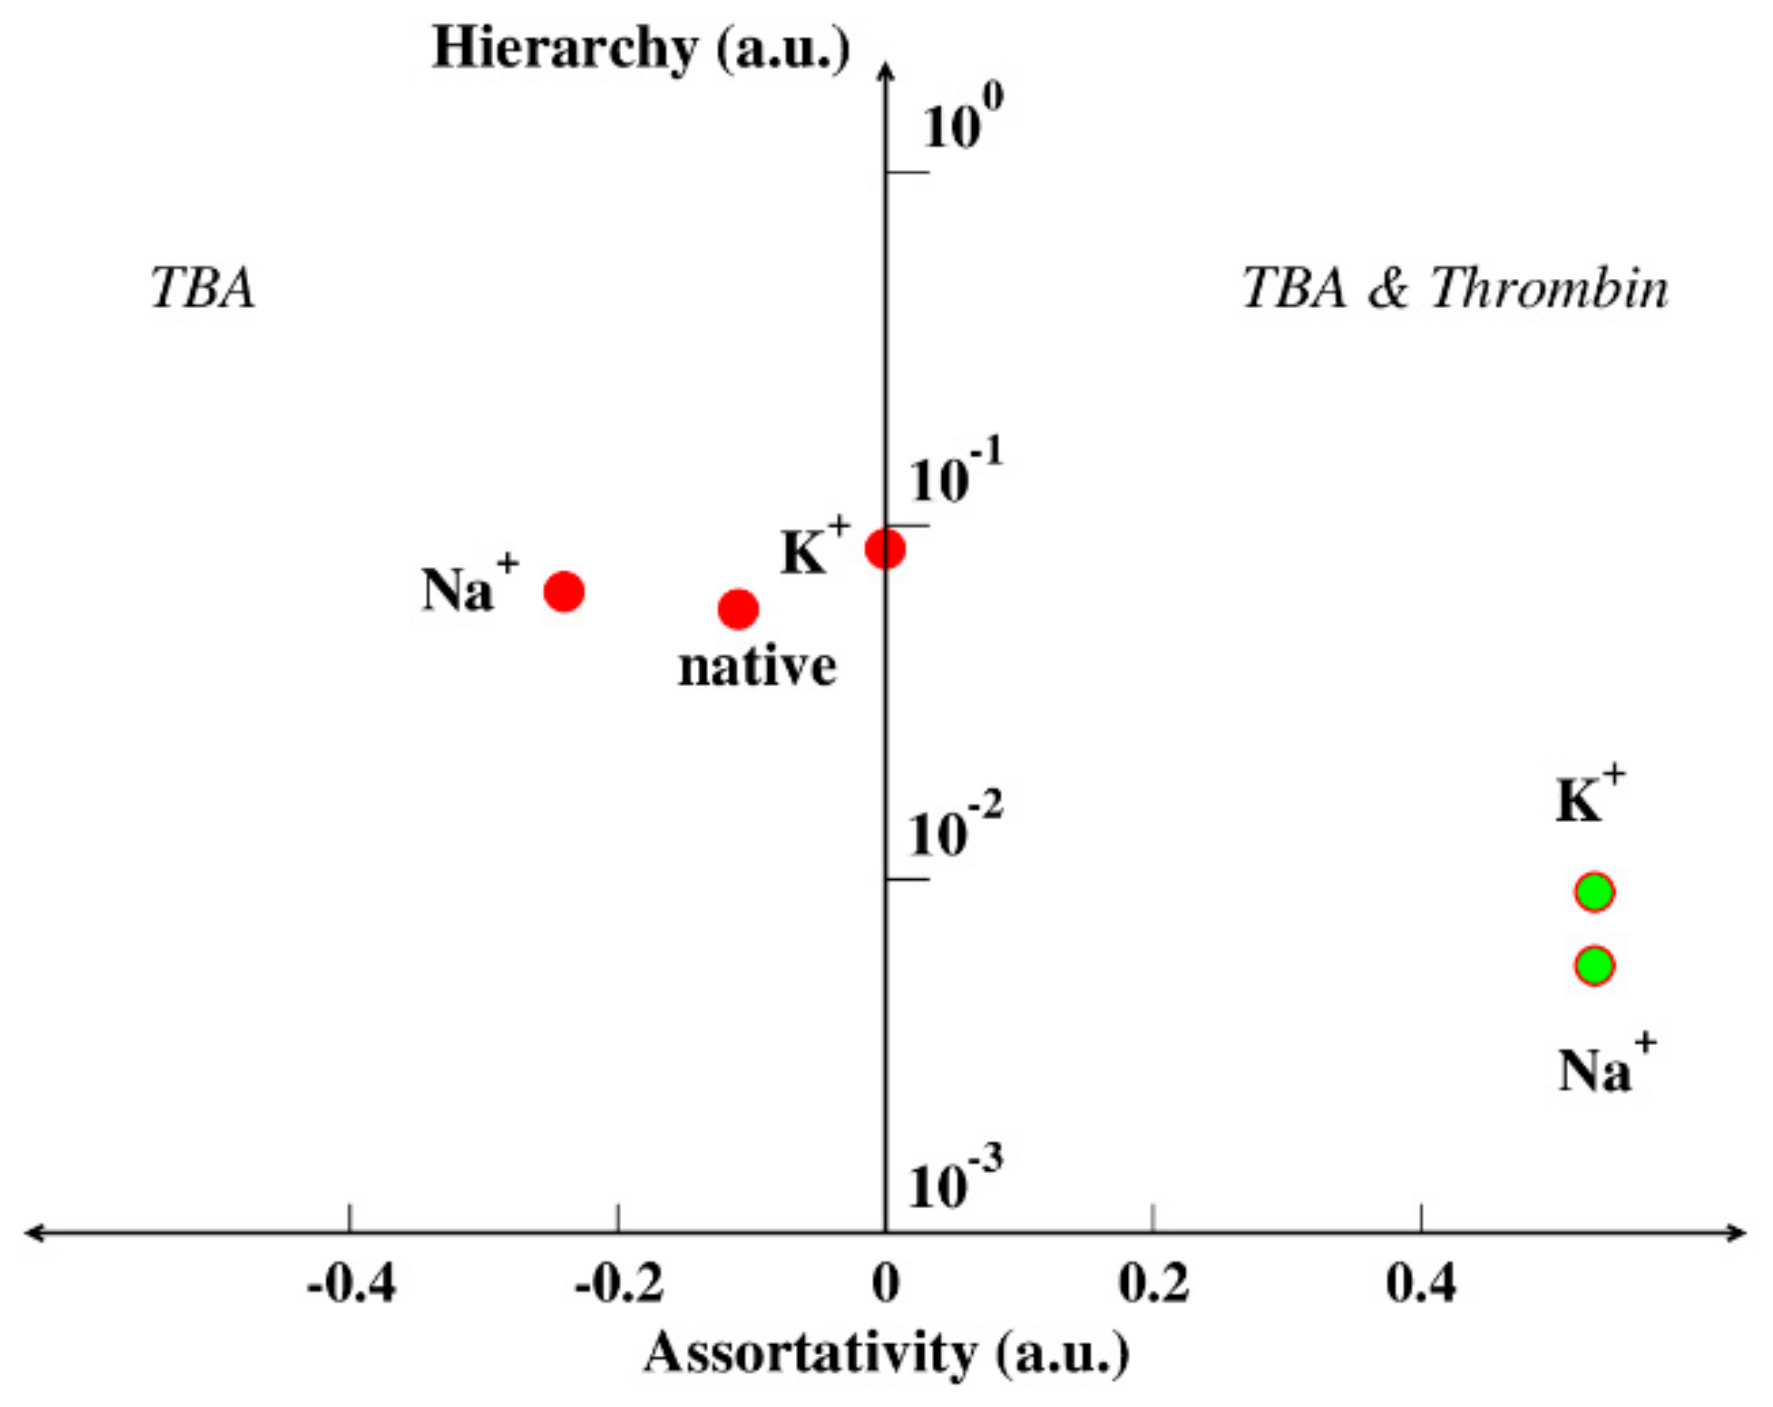
By using these two paradigms, we can try to find a new perspective for interpreting the binding affinity of aptamers and, specifically, of TBA. We observed that the network analogue of the aptamer changes its assortativity from negative to positive by adding thrombin. This means that the network describing the aptamer complexed with the protein is less prone to external influences, i.e., it is more stable than the network describing the aptamer alone. Furthermore, when the free aptamer is in the presence of potassium, it has higher hierarchy and assortativity than in the presence of sodium. In other words, the aptamer in the presence of sodium is more stable than the aptamer in the presence of potassium, i.e., it has a reduced necessity to bind the protein to enforce its stability (low binding affinity). These results are summarized in Figure 7, which gives a sketch of the TBA hierarchy and assortativity scheme: on the left, negative assortativity, we find only the target-free structures, on the right, positive assortativity, we find only the complex structures [51]. The target-free structures have a higher hierarchy with respect to the complex, i.e., they are less stable.
5. Conclusions
The interest in developing biosensors is an active research area in analytical chemistry and physics, as highlighted by the amount of published papers in this field. Biosensors for the early detection of various diseases have aroused a great deal of interest, so that they play a crucial role in clinical tests, as largely discussed in the literature.
Aptamers are greatly attractive for their peculiarity to be employed in both diagnosis and therapy. This is extremely important for increasing the survival rate of cancer patients, as well as to improve the therapeutic efficiency of treatments, allowing the development of targeted therapies. Electrochemical biosensors have been proven to offer advantages such as simplicity and cost-effectiveness. Furthermore, they exhibit good sensitivity and selectivity, under optimized conditions. In many cases, a very low concentration of biological samples is sufficient for producing significant responses.
Here, we highlighted some recent achievements in selection, development criteria and applications of aptamers, focusing on the impact of electrochemical biosensors, especially for disease-related analysis.
As regards the modelling of the electrical properties of aptamers, the proteotronics approach has been described. It is a theoretical/computational model, able to mimic the electronic responses given by biomolecules solicited in vitro by static and dynamic bias. We presented cases dealing with the analysis of the affinity performance of the complex constituted by the aptamer and its specific ligand. Independently of the specific results, the emphasis has been placed on the principles of proteotronics that can be generalized to evaluate binding affinity in other aptamer-ligand complexes.
As a final remark, electrical biosensors are widely studied in research laboratories, but some critical aspects, such as toxicity and pharmacokinetics, remain to be deeply investigated, before entering clinical practices.
Author Contributions
R.C. and E.A. conceived of and designed the review and wrote the paper. M.L. contributed by creating the figures.
Funding
This research was supported in part by the Italian Ministry of Education, University and Research (MIUR), with the grant Project FFABR 2017.
Conflicts of Interest
The authors declare no conflict of interest.
References
- Wu, X.; Chen, J.; Wu, M.; Zhao, J.X. Aptamers Active Targeting Ligands for Cancer Diagnosis and Therapy. Theranostics 2015, 5, 322–344. [Google Scholar] [CrossRef] [PubMed]
- Strehlitz, B. Selex and its recent optimizations. In Aptamers in Bioanalysis; Mascini, M., Ed.; John Wiley & Sons, Inc.: Hoboken, NJ, USA, 2003; p. 33. [Google Scholar]
- Yang, J.; Palla, M.; Bosco, F.G.; Rindzevicius, T.; Alstrøm, T.S.; Schmidt, M.S.; Boisen, A.; Ju, J.; Lin, Q. Surface-enhanced raman spectroscopy based quantitative bioassay on aptamer-functionalized nanopillars using large-area raman mapping. ACS Nano 2013, 7, 5350–5359. [Google Scholar]
- Noonan, P.S.; Roberts, R.H.; Schwartz, D.K. Liquid crystal reorientation induced by aptamer conformational changes. J. Am. Chem. Soc. 2013, 135, 5183–5189. [Google Scholar] [CrossRef] [PubMed]
- Famulok, M.; Mayer, G. Aptamers and SELEX in Chemistry & Biology. Chem. Biol. 2014, 21, 1054–1058. [Google Scholar]
- Chen, T.; Shukoor, M.I.; Chen, Y.; Yuan, Q.; Zhu, Z.; Zhao, Z.; Gulbakan, B.; Tan, W. Aptamer-conjugated nanomaterials for bioanalysis and biotechnology applications. Nanoscale 2011, 3, 546–556. [Google Scholar] [CrossRef] [PubMed]
- Tan, W.; Donovan, M.J.; Jiang, J. Aptamers from cell-based selection for bioanalytical applications. Chem. Rev. 2013, 113, 2842–2862. [Google Scholar] [CrossRef] [PubMed]
- Sun, H.; Zu, Y. A Highlight of Recent Advances in Aptamer Technology and Its Application. Molecules 2015, 20, 11959–11980. [Google Scholar] [CrossRef] [PubMed]
- Tuerk, C.; Gold, L. Systematic evolution of ligands by exponential enrichment, RNA ligands to bacteriophage T4 DNA polymerase. Science 1990, 10, 505–510. [Google Scholar] [CrossRef]
- Gopinath, S.C.B. Methods developed for SELEX. Anal. Bioanal. Chem. 2007, 387, 171–182. [Google Scholar] [CrossRef] [PubMed]
- Shangguan, D.; Bing, T.; Zhang, N. Cell-SELEX, Aptamer Selection Against Whole Cells. In Aptamers Selected by Cell-SELEX for Theranostics; Tan, W., Fang, X., Eds.; Springer-Verlag: Berlin/Heidelberg, Germany, 2015. [Google Scholar] [CrossRef]
- Lyu, Y.; Chen, G.; Shangguan, D.; Zhang, L.; Wan, S.; Wu, Y.; Zhang, H.; Duan, L.; Liu, C.; You, M.; et al. Generating Cell Targeting Aptamers for Nanotheranostics Using Cell-SELEX. Theranostics 2016, 6, 1440–1452. [Google Scholar] [CrossRef] [PubMed]
- Ravalli, A.; Voccia, D.; Palchetti, I.; Marrazza, G. Electrochemical, electrochemiluminescence, and photoelectrochemical aptamer-based nanostructured sensors for biomarker analysis. Biosensors 2016, 6, 39. [Google Scholar] [CrossRef] [PubMed]
- Scott, A.M.; Wolchok, J.D.; Old, L.J. Antibody therapy of cancer. Nat. Rev. Cancer 2012, 12, 278–287. [Google Scholar] [CrossRef] [PubMed]
- Liu, J.K. The history of monoclonal antibody development—Progress, remaining challenges and future innovations. Ann. Med. Surg. 2014, 3, 113–116. [Google Scholar] [CrossRef] [PubMed]
- Lee, J.W.; Kim, H.J.; Heo, K. Therapeutic aptamers: Developmental potential as anticancer drugs. BMB Rep. 2015, 48, 234–237. [Google Scholar] [CrossRef] [PubMed]
- Lao, Y.H.; Phua, K.K.L.; Leong, K.W. Aptamer Nanomedicine for Cancer Therapeutics, Barriers and Potential for Translation. ACS Nano 2015, 9, 2235–2254. [Google Scholar] [CrossRef] [PubMed]
- Peer, D.; Karp, J.M.; Hong, S.; Farokhzad, O.C.; Margalit, R.; Langer, R. Nanocarriers as an emerging platform for cancer therapy. Nat. Nanotechnol. 2007, 2, 751–760. [Google Scholar] [CrossRef] [PubMed]
- Shangguan, D.; Li, Y. Aptamers evolved from live cells as effective molecular probes for cancer study. Proc. Natl. Acad. Sci. USA 2006, 103, 11838–11843. [Google Scholar] [CrossRef] [PubMed]
- Do Carmo, F.S.; Rocha Pinto, S.; Camões Orlando, M.M.; de Souza Albernaz, M.; de Souza Junqueira, M.; Soares Bernardes, E.; Cerecetto, H.; Moglioni, A.; Kozempel, J.; Szwed, M.; et al. Nano-Aptamer for Breast Cancer Imaging, Initial Considerations. J. Diagn. Imaging Ther. 2015, 2, 41–49. [Google Scholar] [CrossRef]
- Do Carmo, F.S.; Ricci-Junior, E.; Cerqueira-Coutinho, C.; de Souza Albernaz, M.; Bernardes, E.S.; Missailidis, S.; Santos-Oliveira, R. Anti-MUC1 nano-aptamers for triple-negative breast cancer imaging by single-photon emission computed tomography in inducted animals: Initial considerations. Int. J. Nanomed. 2017, 12, 53–60. [Google Scholar] [CrossRef] [PubMed]
- Chen, C.; Zhou, S.; Cai, Y.; Tang, F. Nucleic acid aptamer application in diagnosis and therapy of colorectal cancer based on cell-SELEX technology. Precis. Oncol. 2017, 1, 37. [Google Scholar] [CrossRef]
- Lee, J.-O.; So, H.-M.; Jeon, E.-K.; Chang, H.; Won, K.; Kim, Y.H. Aptamers as molecular recognition elements for electrical nanobiosensors. Anal. Bioanal. Chem. 2008, 390, 1023–1032. [Google Scholar] [CrossRef] [PubMed]
- Daniels, J.S.; Pourmand, N. Label-Free Impedance Biosensors, Opportunities and Challenges. Electroanalysis 2007, 19, 1239–1257. [Google Scholar] [CrossRef] [PubMed]
- Radi, A.-E. Electrochemical Aptamer-Based Biosensors, Recent Advances and Perspectives. Int. J. Electrochem. 2011, 2011, 863196. [Google Scholar] [CrossRef]
- Ikebukuro, K.; Kiyohara, C.; Sode, K. Electrochemical detection of protein using a double aptamer sandwich. Anal. Lett. 2004, 37, 2901–2909. [Google Scholar] [CrossRef]
- Putzbach, W.; Ronkainen, N.J. Immobilization techniques in the fabrication of nanomaterial-based electrochemical biosensors: A review. Sensors 2013, 13, 4811–4840. [Google Scholar] [CrossRef] [PubMed]
- Huang, Y.; Xu, J.; Liu, J.; Wang, X.; Chen, B. Disease-Related Detection with Electrochemical, Biosensors, A Review. Sensors 2017, 17, 2375. [Google Scholar] [CrossRef] [PubMed]
- Kaisti, M. Detection principles of biological and chemical FET sensors. Biosens. Bioelectron. 2017, 98, 437–448. [Google Scholar] [CrossRef] [PubMed]
- Meirinho, S.G.; Dias, L.G.; Peres, A.M.; Rodrigues, L.R. Voltammetric aptasensors for protein disease biomarkers detection: A. review. Biotechnol. Adv. 2016, 34, 941–953. [Google Scholar] [CrossRef] [PubMed] [Green Version]
- Abi, A.; Mohammadpour, Z.; Zuo, X.; Safavi, A. Nucleic Acid-Based Electrochemical Nanobiosensors. Biosens. Bioelectron. 2018, 102, 479–489. [Google Scholar] [CrossRef] [PubMed]
- Rapini, R.; Marrazza, G. Electrochemical aptasensors for contaminants detection in food and environment: Recent advances. Bioelectrochemistry 2017, 118, 47–61. [Google Scholar] [CrossRef] [PubMed]
- Zhang, X.; Song, C.; Yang, K.; Hong, W.; Lu, Y.; Yu, P.; Mao, L. Photo-Induced Regeneration of an Aptamer-based Electrochemical Sensor for Sensitively Detecting Adenosine Triphosphate. Anal. Chem. 2018, in press. [Google Scholar]
- Tang, Y.; Liu, P.; Xu, J.; Li, L.; Yang, L.; Liu, X.; Zhou, Y. Electrochemical aptasensor based on a novel flower-like TiO2 nanocomposite for the detection of tetracycline. Sens. Actuators B Chem. 2018, 258, 906–912. [Google Scholar] [CrossRef]
- Yu, Z.; Lai, R.Y. A reagentless and reusable electrochemical aptamer-based sensor for rapid detection of ampicillin in complex samples. Talanta 2018, 176, 619–624. [Google Scholar] [CrossRef] [PubMed]
- Chekin, F.; Bagga, K.; Subramanian, P.; Jijie, R.; Singh, S.K.; Kurungot, S.; Szunerits, S. Nucleic aptamer modified porous reduced graphene oxide/MoS2 based electrodes for viral detection: Application to human papillomavirus (HPV). Sens. Actuators B Chem. 2018, 262, 991–1000. [Google Scholar] [CrossRef]
- Figueroa-Miranda, G.; Feng, L.; Shiu, S.C.C.; Dirkzwager, R.M.; Cheung, Y.W.; Tanner, J.A.; Mayer, D. Aptamer-based electrochemical biosensor for highly sensitive and selective malaria detection with adjustable dynamic response range and reusability. Sens. Actuators B Chem. 2018, 255, 235–243. [Google Scholar] [CrossRef]
- Khosravi, F.; Loeian, S.M.; Panchapakesan, B. Ultrasensitive Label-Free Sensing of IL-6 Based on PASE Functionalized Carbon Nanotube Micro-Arrays with RNA-Aptamers as Molecular Recognition Elements. Biosensors 2017, 7, 17. [Google Scholar] [CrossRef] [PubMed]
- Pulikkathodi, A.K.; Sarangadharan, I.; Hsu, C.P.; Chen, Y.H.; Hung, L.Y.; Lee, G.Y.; Wang, Y.L. Enumeration of circulating tumor cells and investigation of cellular responses using aptamer-immobilized AlGaN/GaN high electron mobility transistor sensor array. Sens. Actuators B Chem. 2018, 257, 96–104. [Google Scholar] [CrossRef]
- Meirinho, S.G.; Dias, L.G.; Peres, A.M.; Rodrigues, L.R. Electrochemical aptasensor for human osteopontin detection using a DNA aptamer selected by SELEX. Anal. Chim. Acta 2017, 987, 25–37. [Google Scholar] [CrossRef] [PubMed]
- Majd, S.M.; Salimi, A. Ultrasensitive flexible FET-type aptasensor for CA 125 cancer marker detection based on carboxylated multiwalled carbon nanotubes immobilized onto reduced graphene oxide film. Anal. Chim. Acta 2018, 1000, 273–282. [Google Scholar] [CrossRef] [PubMed]
- Chen, X.; Guo, Z.; Tang, Y.; Shen, Y.; Miao, P. A highly sensitive gold nanoparticle-based electrochemical aptasensor for theophylline detection. Anal. Chim. Acta 2018, 999, 54–59. [Google Scholar] [CrossRef] [PubMed]
- Gutierrez, R.; Porath, D.; Cuniberti, G.; Baranowski, S. Charge Transport in Disordered Solids with Applications in Electronics; Wiley: New York, NY, USA, 2006. [Google Scholar]
- Regan, J.J.; Risser, S.M.; Beratan, D.N.; Onuchic, J.N. Protein electron transport: Single versus multiple pathways. J. Phys. Chem. 1993, 97, 13083–13088. [Google Scholar] [CrossRef]
- Alfinito, E.; Pousset, J.; Reggiani, L. Proteotronics: Development of Protein-Based Electronics; CRC Press: Boca Raton, FL, USA, 2015. [Google Scholar]
- Berman, H.M.; Bhat, T.N.; Bourne, P.E.; Feng, Z.; Gilliland, G.; Weissig, H.; Westbrook, J. The Protein Data Bank and the challenge of structural genomics. Nat. Struct. Mol. Biol. 2000, 7, 957–959. [Google Scholar] [CrossRef] [PubMed]
- Gilson, M.K.; Zhou, H.X. Calculation of protein-ligand binding affinities. Annu. Rev. Biophys. Biomol. Struct. 2007, 36, 21–42. [Google Scholar] [CrossRef] [PubMed]
- Rother, K.; Rother, M.; Boniecki, M.; Puton, T.; Bujnicki, J.M. RNA and protein 3D structure modeling: Similarities and differences. J. Mol. Model. 2011, 17, 2325–2336. [Google Scholar] [CrossRef] [PubMed]
- Rabal, O.; Pastor, F.; Villanueva, H.; Soldevilla, M.S.; Hervas-Stubbs, S.; Oyarzabal, J. In Silico Aptamer Docking Studies, From a Retrospective Validation to a Prospective Case Study—TIM3 Aptamers Binding. Mol. Ther. Nucleic Acids 2016, 5, e376. [Google Scholar] [CrossRef] [PubMed]
- Poblete, S.; Bottaro, S.; Bussi, G. A nucleobase-centered coarse-grained representation for structure prediction of RNA motifs. Nucleic Acids Res. 2017, 46, 1674–1683. [Google Scholar] [CrossRef] [PubMed]
- Cataldo, R.; Alfinito, E.; Reggiani, L. Hierarchy and Assortativity as New Tools for Binding-Affinity Investigation, the Case of the TBA Aptamer-Ligand Complex. IEEE Trans. Nanobiosci. 2018, 16, 896–904. [Google Scholar] [CrossRef] [PubMed]
- Alfinito, E.; Reggiani, L. Role of topology in electrical properties of bacterio-rhodopsin and rat olfactory receptor I7. Phys. Rev. E 2010, 81, 032902. [Google Scholar] [CrossRef] [PubMed]
- Alfinito, E.; Millithaler, J.F.; Reggiani, L.; Zine, N.; Jaffrezic-Renault, N. Human olfactory receptor 17–40 as an active part of a nanobiosensor: A microscopic investigation of its electrical properties. RSC Adv. 2011, 1, 123–127. [Google Scholar] [CrossRef]
- Alfinito, E.; Millithaler, J.F.; Reggiani, L. Charge transport in purple membrane monolayers: A sequential tunneling approach. Phys. Rev. E 2011, 83, 042902. [Google Scholar] [CrossRef] [PubMed]
- Alfinito, E.; Reggiani, L. Modeling current-voltage characteristics of proteorhodopsin and bacteriorhodopsin: Towards an optoelectronics based on proteins. IEEE Trans. Nanobiosci. 2016, 15, 775–780. [Google Scholar] [CrossRef] [PubMed]
- Alfinito, E.; Reggiani, L.; Cataldo, R.; De Nunzio, G.; Giotta, L.; Guascito, M.R. Modeling the microscopic electrical properties of thrombin binding aptamer (TBA) for label-free biosensors. Nanotechnology 2017, 28, 065502. [Google Scholar] [CrossRef] [PubMed]
- Cataldo, R.; Ciriaco, F.; Alfinito, E. A new strategy to evaluate aptamer binding affinity. arXiv, 2017; arXiv:1704.00341. [Google Scholar]
- Alfinito, E.; Pousset, J.; Reggiani, L.; Lee, K. Photoreceptors for a light biotransducer: A comparative study of the electrical responses of two (type-1) opsins. Nanotechnology 2013, 24, 395501. [Google Scholar] [CrossRef] [PubMed]
- Alfinito, E.; Pennetta, C.; Reggiani, L. A network model to correlate conformational change and the impedance spectrum of single proteins. Nanotechnology 2008, 19, 065202. [Google Scholar] [CrossRef] [PubMed]
- Russo Krauss, I.; Merlino, A.; Randazzo, A.; Novellino, E.; Mazzarella, L.; Sica, F. High-resolution structures of two complexes between thrombin and thrombin-binding aptamer shed light on the role of cations in the aptamer inhibitory activity. Nucleic Acids Res. 2012, 40, 8119–8128. [Google Scholar] [CrossRef] [PubMed]
- Schultze, P.; Macaya, R.F.; Feigon, J. Three-dimensional solution structure of the thrombin-binding DNA aptamer d (GGTTGGTGTGGTTGG). J. Mol. Boil. 1994, 235, 1532–1547. [Google Scholar] [CrossRef] [PubMed]
- Cai, H.; Lee, T.M.H.; Hsing, I.M. Label-free protein recognition using an aptamer-based impedance measurement assay. Sens. Actuators B Chem. 2006, 114, 433–437. [Google Scholar] [CrossRef]
- Hu, W.P.; Kumar, J.V.; Huang, C.J.; Chen, W.Y. Computational selection of RNA aptamer against angiopoietin-2 and experimental evaluation. BioMed Res. Int. 2015. [Google Scholar] [CrossRef] [PubMed]
- Perry, C.; Pyatt, R. Network theory’s contribution to the development of marketing research. In Proceedings of the 1995 World Marketing Congress; Springer: Cham, Switzerland, 2015; pp. 188–196. [Google Scholar]
- Azevedo, H.; Moreira-Filho, C.A. Topological robustness analysis of protein interaction networks reveals key targets for overcoming chemotherapy resistance in glioma. Sci. Rep. 2015, 19, 16830. [Google Scholar] [CrossRef] [PubMed]
Figure 1.
Schematic view of the SELEX procedure.

Figure 2.
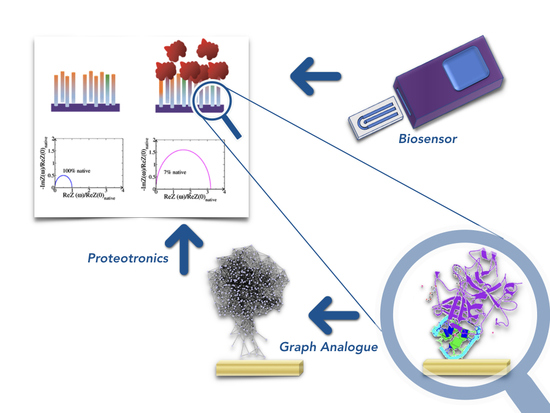
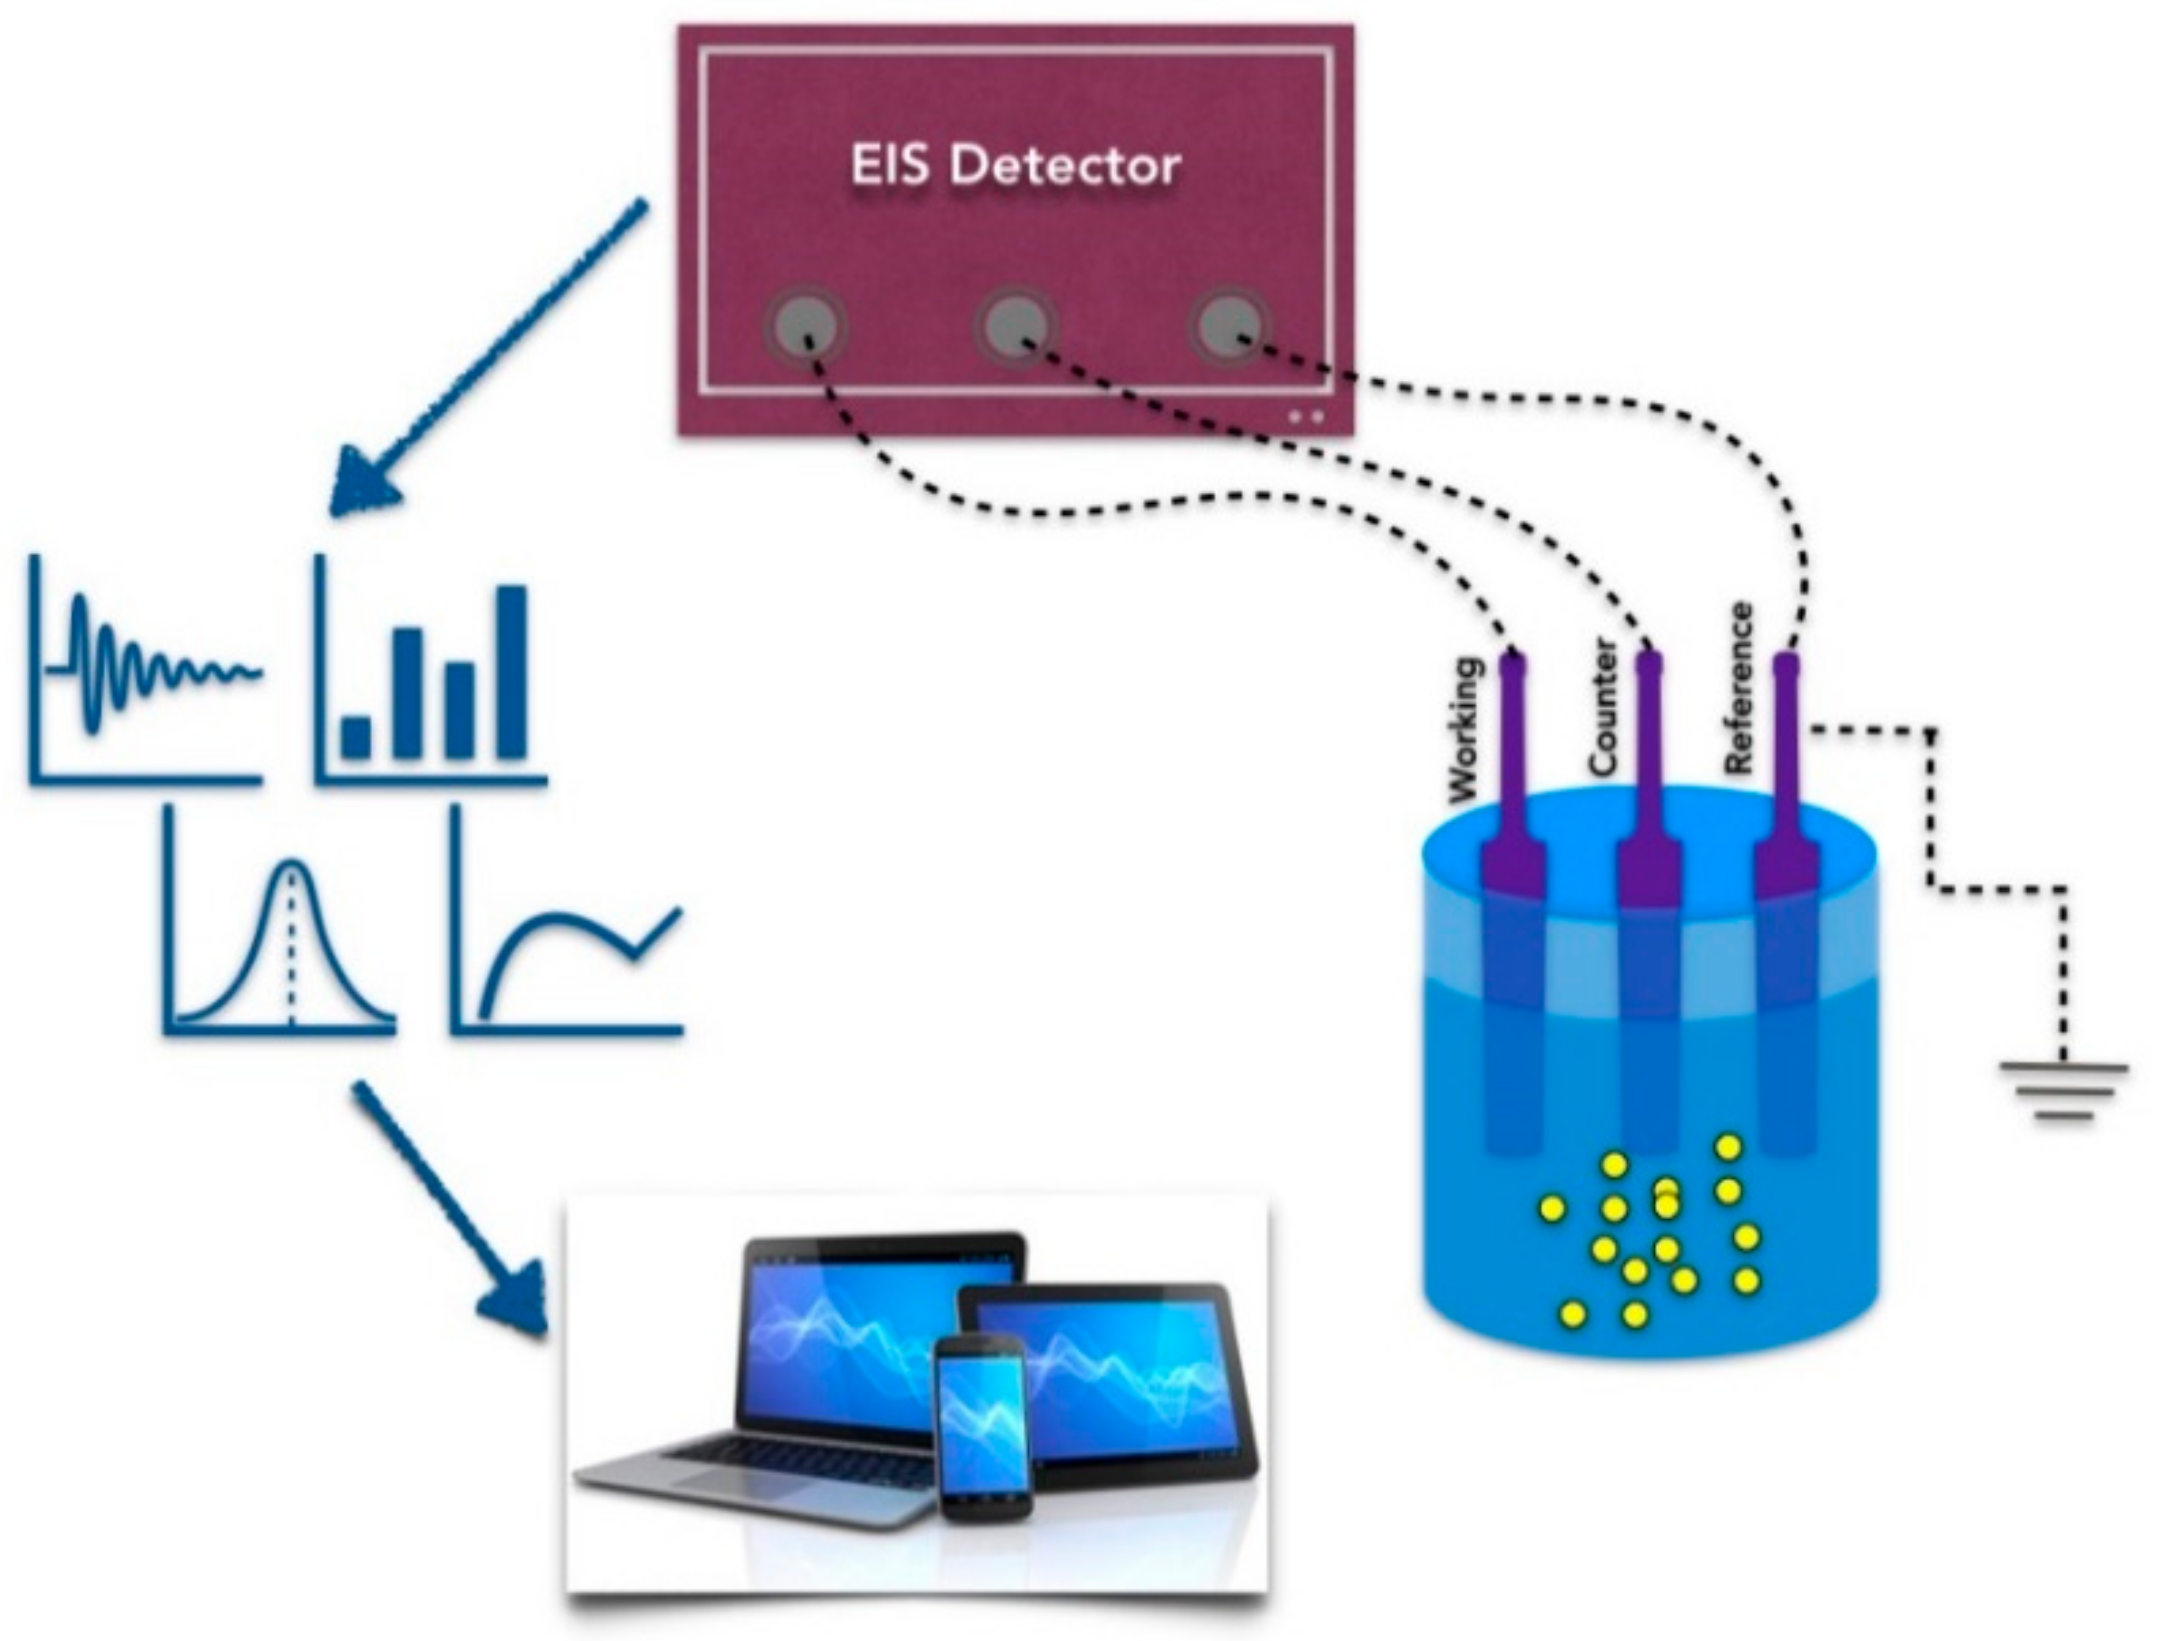
Schematic view of a biosensor. EIS, Electrochemical Impedance Spectroscopy.

Figure 3.
(a) The 3D structure of the TBA in the native state (Entry 148D_1 [46]) on the left, and the corresponding graph at RC = 10 Å on the right; (b) the 3D structure of the TBA-thrombin complex (Entry 4DII [46]) on the left, and the corresponding graph at RC = 10 Å on the right.

Figure 4.
Resistance variation spectra of TBA in the presence of sodium and potassium. The resistance of the TBA-protein complex is larger than that of the TBA alone in a range of RC values close to 11 Å. In the whole range of RC values, the resistance ratio of the complex obtained in the presence of potassium is larger than those obtained in the presence of sodium.

Figure 5.
The resistance variation spectra of five different anti-angiopoietin aptamers. Circles identify the Ang-2-specific aptamers; diamonds identify the Ang-1-specific aptamer.
Figure 5.
The resistance variation spectra of five different anti-angiopoietin aptamers. Circles identify the Ang-2-specific aptamers; diamonds identify the Ang-1-specific aptamer.

Figure 6.
A sketch of an EIS measurement. On the top, an electrode functionalized with aptamers, before and after the injection of the receptor. On the bottom, the corresponding Nyquist plots calculated for a sample of aptamers in the native state and with 93% of the TBA-thrombin complex and 7% of TBA in the native state [56].

Figure 7.
Hierarchy-assortativity plot of the aptamer TBA. On the left, the aptamer alone, in the native state or in the configuration it assumes when bound to the receptor, in the presence of two different cations. On the right, the couple TBA-thrombin, in the presence of both cations.
Figure 7.
Hierarchy-assortativity plot of the aptamer TBA. On the left, the aptamer alone, in the native state or in the configuration it assumes when bound to the receptor, in the presence of two different cations. On the right, the couple TBA-thrombin, in the presence of both cations.


Table 1.
Analytical characteristics of electrochemical aptasensors and the scientific innovation of the work. Alternating Current Voltammetry (ACV); Cyclic Voltammetry (CV); Electric Field (EF); Electrochemical Impedance Spectroscopy (EIS); Field Effect Transistor (FET); Square Wave Voltammetry (SWV).
| Target | Experimental Technique | Innovation | LOD | Reference |
|---|---|---|---|---|
| ATP | EIS/switch | UV regeneration | 1 nM | [33] |
| Tetracycline | EIS | MoS2-TiO2@Au arrays | 10 pM | [34] |
| Ampicillin | ACV SWV | Fast response; reusability for at least 3 times | 1 μM (ACV) 30 μM (SWV) | [35] |
| Papilloma virus | CV | Glassy carbon electrodes | 1.75 pM | [36] |
| Malaria biomarker | EIS | Adjustable detection range, reusability | 0.84 pM | [37] |
| Interleukin-6 cancer marker | FET | Nanotube arrays | 10 pg/mL | [38] |
| Cancer cells | FET | Whole cell detection | 1 cell/mL | [39] |
| Human osteopontin | SWV CV | SWV vs. CV | 1.4 nM (SWV) 4.2 nM (ACV) | [40] |
| CA125-cancer marker | FET | Multiwalled carbon nanotubes | 5 × 10⁻¹⁰ U/mL | [41] |
| Theophylline | EIS | Gold nanoparticle | 0.7 μM | [42] |
Table 2.
List of the principal proteotronics case studies.
| Biomolecule | Target/Inhibitor | Experimental Technique | References |
|---|---|---|---|
| Anti-thrombin aptamer (TBA) | Thrombin | SPR | [51,56] |
| Bacteriorhodopsin | Light | Conductive atomic force spectroscopy | [52,54,55] |
| Bovine rhodopsin | Light | EIS | [55] |
| OR I7 | Octanal, heptanal | EIS | [52] |
| OR 17-40 | Helional | EIS, SPR | [53] |
| Anti-Ang2 aptamer | Ang2 | EIS | [57] |
| Proteorhodopsin | Light | UV-spectroscopy | [58] |
| AChE | Several toxins | Potentiometric | [59] |
© 2018 by the authors. Licensee MDPI, Basel, Switzerland. This article is an open access article distributed under the terms and conditions of the Creative Commons Attribution (CC BY) license (http://creativecommons.org/licenses/by/4.0/).
Share and Cite
MDPI and ACS Style
Cataldo, R.; Leuzzi, M.; Alfinito, E. Modelling and Development of Electrical Aptasensors: A Short Review. Chemosensors 2018, 6, 20. https://doi.org/10.3390/chemosensors6020020
AMA Style
Cataldo R, Leuzzi M, Alfinito E. Modelling and Development of Electrical Aptasensors: A Short Review. Chemosensors. 2018; 6(2):20. https://doi.org/10.3390/chemosensors6020020
Chicago/Turabian StyleCataldo, Rosella, Maria Leuzzi, and Eleonora Alfinito. 2018. "Modelling and Development of Electrical Aptasensors: A Short Review" Chemosensors 6, no. 2: 20. https://doi.org/10.3390/chemosensors6020020
Note that from the first issue of 2016, this journal uses article numbers instead of page numbers. See further details here.