Performance Comparison of Systemic Inflammatory Response Syndrome with Logistic Regression Models to Predict Sepsis in Neonates

Department of Instrumentation and Control Engineering, Dr. B. R. Ambedkar National Institute of Technology, Jalandhar, Punjab 144011, India
*
Author to whom correspondence should be addressed.
Children 2017, 4(12), 111; https://doi.org/10.3390/children4120111
Submission received: 2 November 2017
/
Revised: 25 November 2017
/
Accepted: 14 December 2017
/
Published: 19 December 2017
Abstract
:In 2005, an international pediatric sepsis consensus conference defined systemic inflammatory response syndrome (SIRS) for children <18 years of age, but excluded premature infants. In 2012, Hofer et al. investigated the predictive power of SIRS for term neonates. In this paper, we examined the accuracy of SIRS in predicting sepsis in neonates, irrespective of their gestational age (i.e., pre-term, term, and post-term). We also created two prediction models, named Model A and Model B, using binary logistic regression. Both models performed better than SIRS. We also developed an android application so that physicians can easily use Model A and Model B in real-world scenarios. The sensitivity, specificity, positive likelihood ratio (PLR) and negative likelihood ratio (NLR) in cases of SIRS were 16.15%, 95.53%, 3.61, and 0.88, respectively, whereas they were 29.17%, 97.82%, 13.36, and 0.72, respectively, in the case of Model A, and 31.25%, 97.30%, 11.56, and 0.71, respectively, in the case of Model B. All models were significant with p < 0.001.
1. Introduction
Sepsis is the major cause of deaths in neonates, and most of these deaths occur in countries that lack resources [1,2]. Due to non-specific clinical signs, diagnosis of bacterial sepsis remains a difficult task for neonatologists [3]. Blood culture remains the gold standard for identifying sepsis. Although, its accuracy is not 100%, a positive blood culture may be due to presence of contaminants in blood [4]. In addition, a negative blood culture result may be due to a low volume of blood [5,6]. Despite this, whenever there is a suspicion of sepsis, blood is drawn for blood culture, and the neonate is started on antibiotics. For each neonate with blood culture-proven sepsis, approximately 12 additional newborns receive antibiotics, resulting in bacterial resistance and excessive hospital costs [7,8,9,10].
The definition of sepsis has been revised three times—in 1992 [11], 2001 [12], and in 2016 [13]—but none of these definitions defines sepsis in the case of neonates. In 2005, a consensus definition of sepsis was determined for all children less than 18 years of age, and pediatric systemic inflammatory response syndrome (SIRS) was defined; however, preterm neonates (<37 weeks of gestation) were excluded from this definition [14]. In 2012, Nora Hofer et al. [15] did a study to check the performance of the SIRS definition given in 2005, but did not include preterm neonates.
In this paper, we tested the capability of SIRS to predict sepsis in neonates irrespective of their gestational age (i.e., pre-term, term, or post-term), using the cut-off values given in [14]. We also made two prediction models, named Model A and Model B, using logistic regression. Model A consisted of the same parameters as those of SIRS. Model B included birth weight as an additional independent variable (in addition to the Model A parameters). Our decision to add birth weight was based on a conclusion derived from statistical analysis (refer to the Results section), in addition to statements given in [16] (“The risk of late-onset sepsis increases with decreasing birth weight and gestational age.”) and [17] (“Early onset sepsis is an important cause of illness and death among infants with very low birth weights (less than 1500 g)”). To use these models in real-world scenarios, we made an android application that does all of the complex calculations, and can be easily used by physicians.
2. Materials and Methods
2.1. Study Design
This is a retrospective study, which uses the data from the Medical Information Mart for Intensive care (MIMIC) III dataset [18,19]. MIMIC III is an open-access research database that contains more than 58,000 hospital admissions for 38,645 adults and 7875 neonates. The data was collected from the intensive care units at Beth Israel Deaconess Medical center (BIDMC) between June 2001 and October 2012. All data were de-identified in accordance with Health Insurance Portability and Accountability Act (HIPAA); therefore, patient consent was waived by the Institutional review boards of Massachusetts Institute of Technology (MIT) and BIDMC.
Inclusion criteria were the presence of blood culture report and age ≤30 days at the time of the first phlebotomy for blood culture. Neonates with missing or incomplete data necessary for the calculation of scores were excluded from the study.
2.2. Definitions
We defined sepsis as the positive blood and/or Cerebrospinal Fluid (CSF) culture [20,21]. The time of suspicion of sepsis was defined as the initial time of the earliest culture draw. We defined a time window of 12 h starting from the suspicion of sepsis, and all the required parameters were taken in this time window.
2.3. SIRS
Table 1 shows the cut-off values of SIRS parameters mentioned in the pediatric consensus definition of SIRS [14]. It can be seen that cut-off values vary with age. According to this definition, at least two of the following four criteria must be met, and one of which must be abnormal temperature or abnormal leukocyte count, although some literature shows that white blood cell (WBC) count and temperature shows less sensitivity in the diagnosis of neonatal sepsis [22,23].
2.4. Statistical Analysis
All the data was extracted from the MIMIC III dataset using Postgre SQL 9.6 queries (Global Development Group, Berkeley, CA, USA). We used IBM SPSS Statistics version 24 (SPSS Inc., Chicago, IL, USA) and Microsoft Excel 2016 (Microsoft, Inc., Redmond, WA, USA) for the statistical analysis. Sensitivity, specificity, positive predictive value (PPV), negative predictive value (NPV), positive likelihood ratio (PLR), and negative likelihood ratio (NLR) were calculated for each model. Fisher’s Exact Test and Pearson’s Chi-Square Test were used as a goodness-of-fit tests. We used p < 0.001 to determine statistical significance.
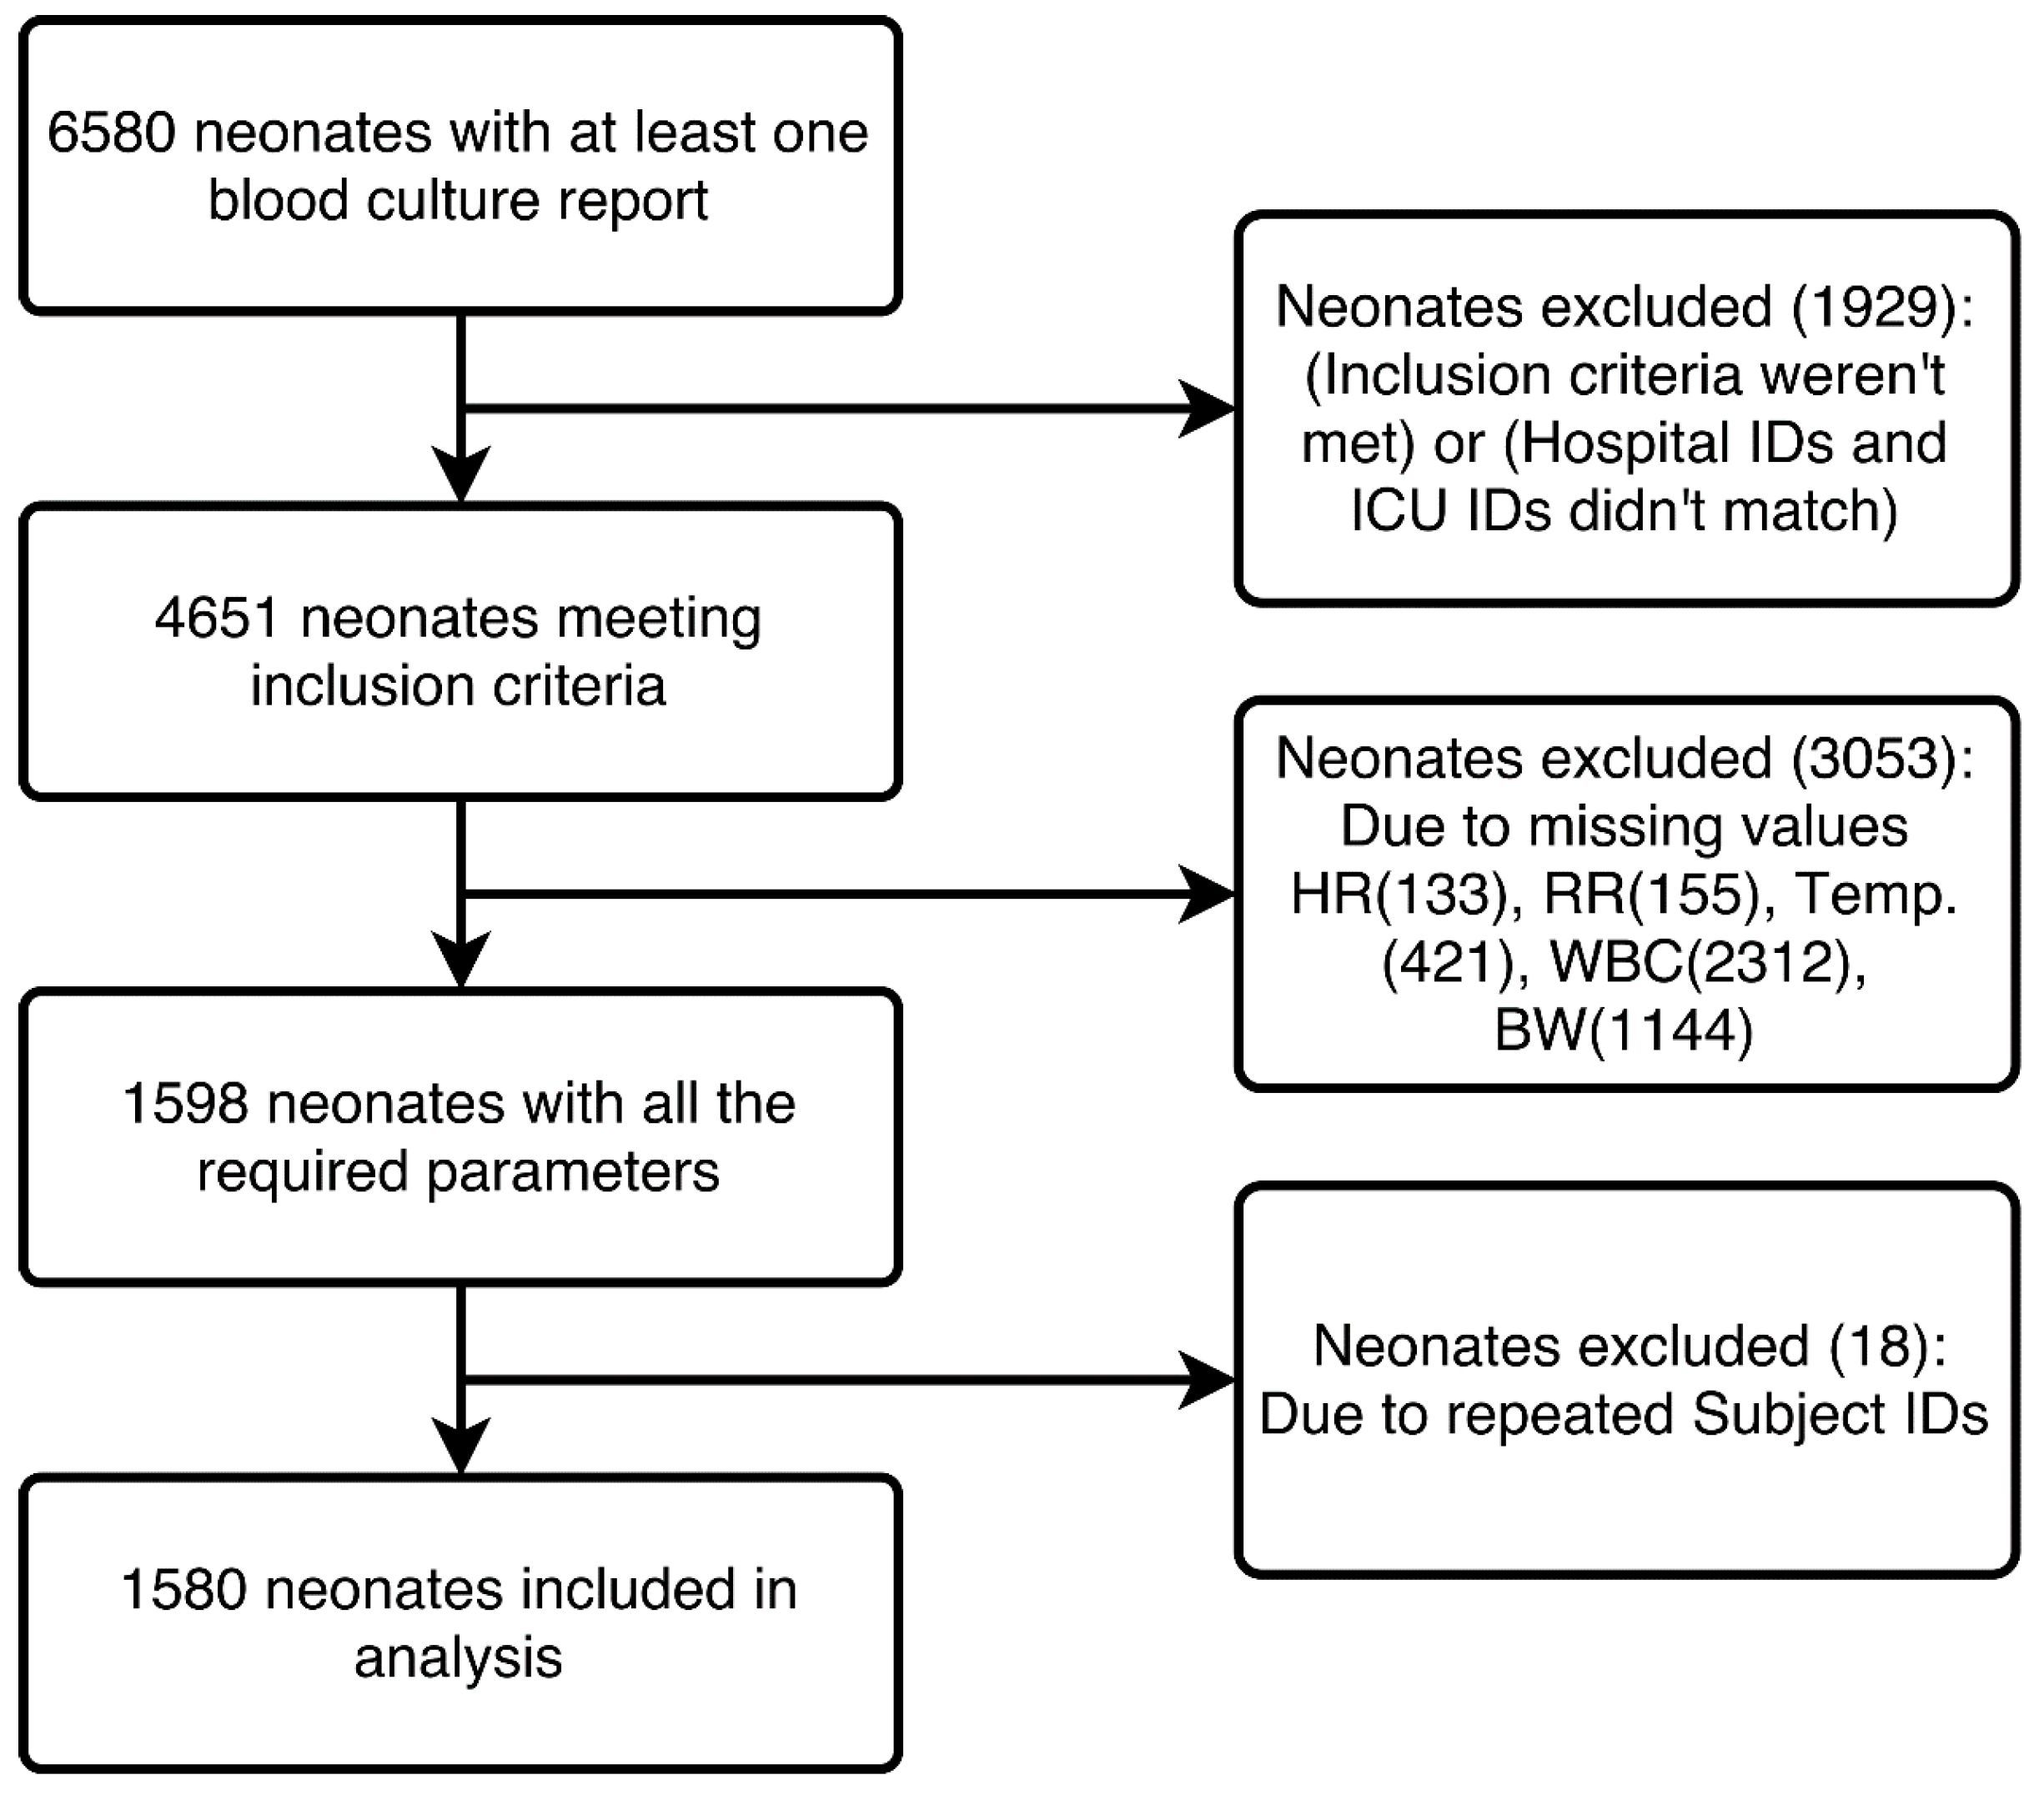
Among the 4651 neonates that met the inclusion criteria, 3053 neonates were excluded because of incomplete data, and 18 were excluded because of duplicate entries. Thus, 1580 neonates with 204 cases of sepsis (12.91% disease prevalence) were studied. Figure 1 shows the complete extraction process from the MIMIC III database.
We extracted a total of 9 parameters within the time window of 12 h (as mentioned above), including blood culture reports, CSF culture, temperature (Temp.), heart rate (HR), respiration rate (RR), WBC count, birth weight, age at the time of admission, and gestational age. All the parameters were extracted using PostgreSQL queries except gestational age, which was extracted manually from text notes available in the MIMIC III dataset. Minimum and maximum values of these parameters (wherever applicable) were calculated. Table 2 shows the baseline characteristics of 1580 neonates.
3. Results
To select the independent variables for Model A, we used binary logistic regression using backward logistic regression (LR) and discriminant analysis, using the stepwise method in SPSS. Both methods resulted in the exclusion of Respiratory Rate (Maximum), as well as Temperature (Maximum). The remaining parameters, as shown in Table 3 (excluding birth weight), were used to build Model A. Table 3 also shows the predictive power of independent variables in decreasing order, using a structure matrix.
For Model B, we used the Omnibus tests of the model coefficients to examine the significance of birth weight as an additional parameter. Table 4 shows the Chi-Square values with p < 0.001 in Model B, with Model A used as a baseline model and birth weight being added as an additional parameter. This table shows that Model B provides a better fit for the prediction of neonatal sepsis.
Thus, two models were created using binary logistic regression. Model A consisted of five variables (heart rate, respiratory rate, temperature, leukocyte count, and age at the time of first culture draw) that were then also used to validate SIRS. The main difference between SIRS and Model A is that SIRS is calculated using a simple decision rule that uses the cut-off values mentioned in Table 1. Whereas Model A was developed using logistic regression; it predicts the outcome as a probability, rather than as a binary decision. To predict the probability of sepsis, predictor variables are entered, and the probability is calculated using the steps shown in Section: Mobile Application of this paper.
In Model B, we included birth weight as a fifth parameter. For Model A and Model B, the data were randomly divided into two parts, i.e., 70/30, for training and validation purposes. These two models were trained and validated, and were compared with the SIRS. Table 5 shows the comparison of these two models with SIRS. Table 5 illustrates that Model A performed better than SIRS, despite using the same parameters. Moreover, Model B showed better sensitivity than Model A. Both of these models were compared at a 0.5 cut-off value.
Table 6 shows the goodness-of-fit test results for the three prediction models using the Pearson Chi-Square and Fisher’s Exact Test (whichever is applicable). All the models were statistically significant with p < 0.001.
Table 7 shows the performance of Model A and Model B at different cut-off values of probability. This table helps the reader to gain a better understanding of what to expect from each of these two models with respect to sensitivity and specificity. As expected, the value for sensitivity decreases as we move from a lower cut-off value to a higher cut off value. At a cut-off value of 0.7, the sensitivity and specificity of Model A and Model B are approximately equal to SIRS. Hence, the usefulness of both Model A and Model B vanishes.
Mobile Application
To use Model A and Model B in place of SIRS, it is necessary to make its implementation simpler in the real world. To this end, we created an android application that can predict sepsis in neonates using all three models; namely, SIRS, Model A and Model B.
Figure 2 shows screenshots of the mobile application that we developed using the App Inventor platform [24]. App Inventor is an open-source visual programming environment that is maintained by MIT. In the bottom of Figure 2, we can see that there is a contradiction between the outcomes of the three models. As per the SIRS criteria, the neonate is free from sepsis, whereas the other two models show a high probability of sepsis. In this particular scenario, Model A and Model B correctly predicted the outcome (the data shown is of a sepsis-positive neonate).
Figure 3 shows the algorithm for the mobile application. SIRS was calculated according to the cut-off values given in Table 1; while for Model A and Model B, the logistic regression coefficients were calculated using IBM SPSS, and were stored in the Android application. The steps shown below were used for the prediction of outcomes in Model A and Model B.
- Step 1:where β0, β1, ...., βn are the logistic regression coefficients and X1, X2, ..., Xn are the independent predictor variables.
- Step 2:where L is the Logit calculated in step 1.
The probability calculated in step 2 is displayed as the output of Model A and Model B.
4. Discussion
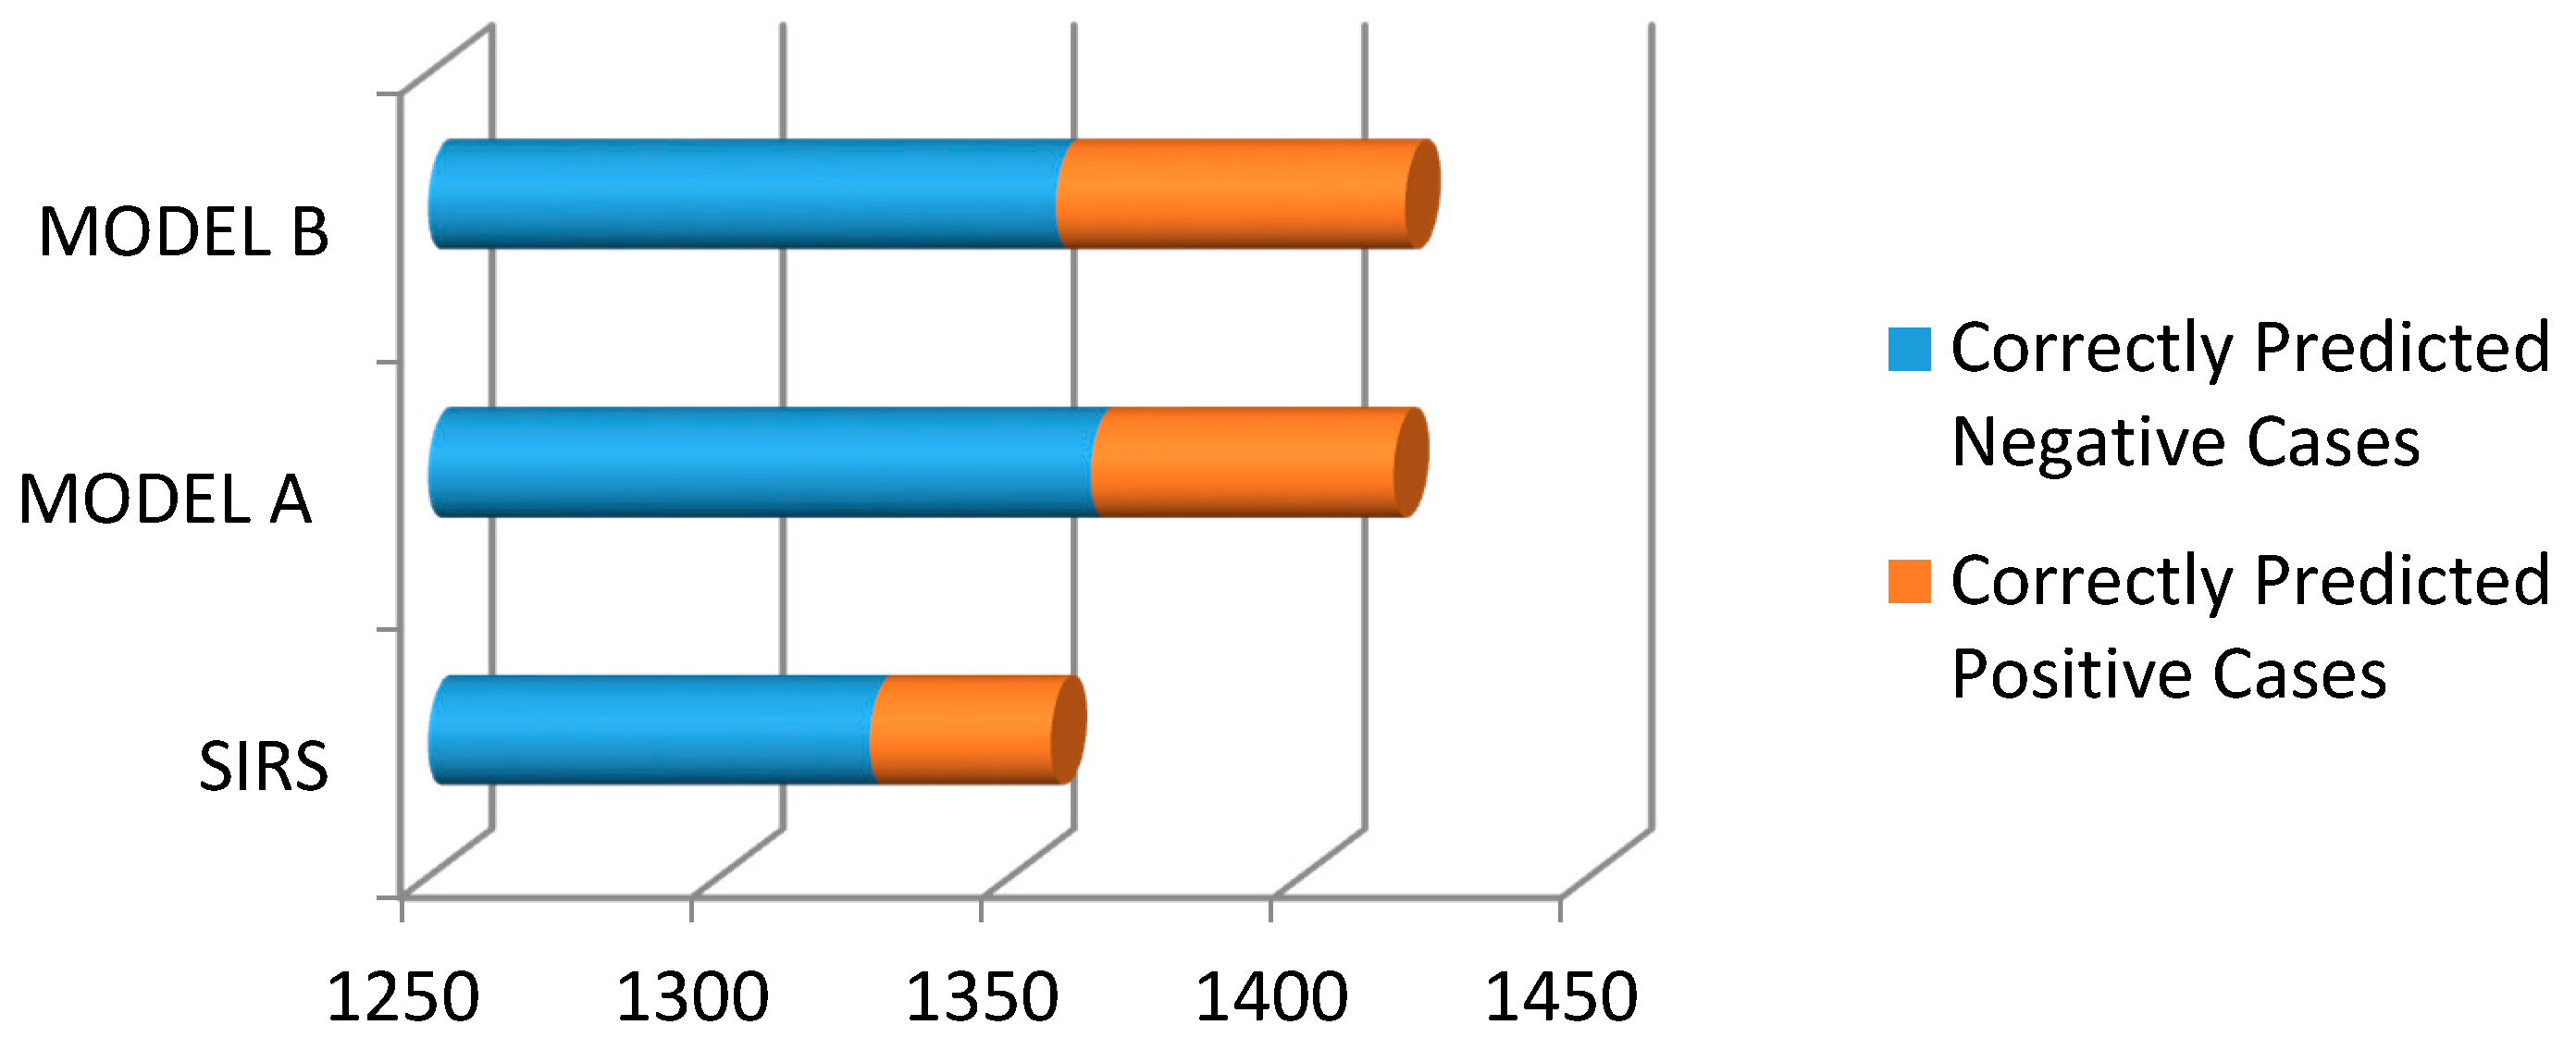
To date, the performance of the SIRS definition given by the pediatric sepsis consensus conference has not been tested in preterm neonates [25]. In this study, we tested SIRS accuracy in neonates irrespective of their gestational age, and compared it with the two prediction models (developed by us) using binary logistic regression. Both LR models performed better than SIRS. Figure 4 shows the performance of all three models in terms of correctly predicted positive and negative cases. For comparison, the cut-off values of Model A and Model B were taken as 0.5.
The calculations required to predict the probability of Model A and Model B are time-consuming and complex. We overcame this limitation by developing an android application; it does all the calculations and makes it easier for physicians to use complex prediction models.
Our study has several limitations. The values of the prediction variables have to be identified (maximum and minimum of the parameters) and entered manually in the mobile application. In future work, we will try to develop a system that can automatically enter non-invasive parameters values. Further improvements of models may be possible through the use of sophisticated machine-learning techniques, such as artificial neural networks (ANN).
These models can assist physicians in making the decision to start antibiotics in cases of sepsis-positive neonates and to stop antibiotics in sepsis-negative neonates before the blood culture report is available. This study also provides the hope of improving the performance of existing Clinical Decision Rules (CDRs) or scoring systems.
5. Conclusions
To confirm the results, both models should be evaluated prospectively and externally (using datasets from other sources) for predicting sepsis in neonates within 12 h of the first draw of blood culture. The sensitivity of SIRS in predicting sepsis in neonates (irrespective of their gestational age) was quite low. LR models outperformed SIRS in predicting neonatal sepsis, despite using the same parameters. Further improvements of these models could help the decision-making processes of physicians. We speculate that the same approach may improve the performance of other clinical decision rules and scoring systems.
Author Contributions
Jyoti Thakur extracted and analyzed the data; Jyoti Thakur, Sharvan Kumar Pahuja and Roop Pahuja wrote the paper; Jyoti Thakur, Sharvan Kumar Pahuja and Roop Pahuja developed the android application. All authors have read and approved the final manuscript.
Conflicts of Interest
The authors declare no conflict of interest.
References
- Lawn, J.E.; Wilczynska-Ketende, K.; Cousens, S.N. Estimating the Causes of 4 Million Neonatal Deaths in the Year 2000. Int. J. Epidemiol. 2006, 35, 706–718. [Google Scholar] [CrossRef] [PubMed]
- Liu, L.; Johnson, H.L.; Cousens, S.; Perin, J.; Scott, S.; Lawn, J.E.; Rudan, I.; Campbell, H.; Cibulskis, R.; Li, M.; et al. Global, Regional, and National Causes of Child Mortality: An Updated Systematic Analysis for 2010 with Time Trends since 2000. Lancet 2012, 379, 2151–2161. [Google Scholar] [CrossRef]
- Kurlat, I.; Stoll, B.J.; McGowan, J.E., Jr. Time to Positivity for Detection of Bacteremia in Neonates. J. Clin. Microbiol. 1989, 27, 1068–1071. [Google Scholar] [PubMed]
- Squire, E.; Favara, B.; Todd, J. Diagnosis of Neonatal Bacterial Infection: Hematologic and Pathologic Findings in Fatal and Nonfatal Cases. Pediatrics 1979, 64, 60–64. [Google Scholar] [CrossRef] [PubMed]
- Neal, P.R.; Kleiman, M.B.; Reynolds, J.K.; Allen, S.D.; Lemons, J.A.; Yu, P.L. Volume of Blood Submitted for Culture from Neonates. J. Clin. Microbiol. 1986, 24, 353–356. [Google Scholar] [PubMed]
- Schelonka, R.L.; Chai, M.K.; Yoder, B.A.; Hensley, D.; Brockett, R.M.; Ascher, D.P. Volume of Blood Required to Detect Common Neonatal Pathogens. J. Pediatr. 1996, 129, 275–278. [Google Scholar] [CrossRef]
- Gerdes, J.S.; Polin, R.A. Sepsis Screen in Neonates with Evaluation of Plasma Fibronectin. Pediatr. Infect. Dis. J. 1987, 6, 443–446. [Google Scholar] [CrossRef] [PubMed]
- Hammerschlag, M.R.; Klein, J.O.; Herschel, M.; Chen, F.C.J.; Fermin, R. Patterns of Use of Antibiotics in Two Newborn Nurseries. N. Engl. J. Med. 1977, 296, 1268–1269. [Google Scholar] [CrossRef] [PubMed]
- Maramba-lazarte, C.C.; Bunyi, M.A.C.; Gallardo, E.E.; Lim, J.G.; Lobo, J.J.; Aguilar, C.Y.; Maramba-lazarte, C.C. Etiology of Neonatal Sepsis in Five Urban Hospitals in the Philippines. PIDSP J. 2011, 12, 75–85. [Google Scholar]
- Huskins, W.C.; Goldmann, D.A.; Hamer, D.H. Impact of Enhanced Infection Control at Two Neonatal Intensive Care Units in the Philippines. Clin. Infect. Dis. 2013, 48, 13–21. [Google Scholar]
- Bone, R.C.; Balk, R.A.; Cerra, F.B.; Dellinger, R.P.; Fein, A.M.; Knaus, W.A.; Schein, R.M.; Sibbald, W.J. Definitions for Sepsis and Organ Failure and Guidelines for the Use of Innovative Therapies in Sepsis. The ACCP/SCCM Consensus Conference Committee. American College of Chest Physicians/Society of Critical Care Medicine. Chest 1992, 101, 1644–1655. [Google Scholar] [CrossRef] [PubMed]
- Levy, M.M.; Fink, M.P.; Marshall, J.C.; Abraham, E.; Angus, D.; Cook, D.; Cohen, J.; Opal, S.M.; Vincent, J.-L.; Ramsay, G.; et al. 2001 SCCM/ESICM/ACCP/ATS/SIS International Sepsis Definitions Conference. Intensive Care Med. 2003, 29, 530–538. [Google Scholar] [CrossRef] [PubMed]
- Seymour, C.W.; Liu, V.X.; Iwashyna, T.J.; Brunkhorst, F.M.; Rea, T.D.; Scherag, A.; Rubenfeld, G.; Kahn, J.M.; Shankar-Hari, M.; Singer, M.; et al. Assessment of Clinical Criteria for Sepsis For the Third International Consensus Definitions for Sepsis and Septic Shock (Sepsis-3). JAMA 2016, 315, 762. [Google Scholar] [CrossRef] [PubMed]
- Goldstein, B.; Giroir, B.; Randolph, A.; International Consensus Conference on Pediatric Sepsis. International Pediatric Sepsis Consensus Conference: Definitions for Sepsis and Organ Dysfunction in Pediatrics. Pediatr. Crit. Care Med. 2005, 6, 2–8. [Google Scholar] [CrossRef] [PubMed]
- Hofer, N.; Zacharias, E.; Müller, W.; Resch, B. Performance of the Definitions of the Systemic Inflammatory Response Syndrome and Sepsis in Neonates. J. Perinat. Med. 2012, 40, 587–590. [Google Scholar] [CrossRef] [PubMed]
- Stoll, B.J.; Hansen, N.; Fanaroff, A.A.; Wright, L.L.; Carlo, W.A.; Ehrenkranz, R.A.; Lemons, J.A.; Donovan, E.F.; Stark, A.R.; Tyson, J.E.; et al. Late-Onset Sepsis in Very Low Birth Weight Neonates: The Experience of the NICHD Neonatal Research Network. Pediatrics 2002, 110, 285–291. [Google Scholar] [CrossRef] [PubMed]
- Stoll, B.J.; Hansen, N.; Fanaroff, A.A.; Wright, L.L.; Carlo, W.A.; Ehrenkranz, R.A.; Lemons, J.A.; Donovan, E.F.; Stark, A.R.; Tyson, J.E.; et al. Changes in Pathogens Causing Early-Onset Sepsis in Very-Low-Birth-Weight Infants. N. Engl. J. Med. 2002, 347, 240–247. [Google Scholar] [CrossRef] [PubMed]
- Johnson, A.E.W.; Pollard, T.J.; Shen, L.; Lehman, L.H.; Feng, M.; Ghassemi, M.; Moody, B.; Szolovits, P.; Anthony Celi, L.; Mark, R.G. MIMIC-III, a Freely Accessible Critical Care Database. Sci. Data 2016, 3, 160035. [Google Scholar] [CrossRef] [PubMed]
- Pollard, T.J.; Johnson, A.E.W. The MIMIC III Clinical Database. Version 1.4. Available online: https://physionet.org/physiobank/database/mimic3cdb/ (accessed on 25 April 2017).
- Thompson, P.J.; Greenough, A.; Gamsu, H.R.; Nicolaides, K.H.; Philpott-Howard, J. Congenital Bacterial Sepsis in Very Preterm Infants. J. Med. Microbiol. 1992, 36, 117–120. [Google Scholar] [CrossRef] [PubMed]
- DaSilva, O.; Hammerberg, O. Diagnostic Value of Leukocyte Indices in Late Neonatal Sepsis. Pediatr. Infect. Dis. J. 1994, 13, 409–411. [Google Scholar] [PubMed]
- Fowlie, P.W.; Schmidt, B. Diagnostic Tests for Bacterial Infection from Birth to 90 Days-a Systematic Review. Arch. Dis. Child. Fetal Neonatal Ed. 1998, 78, F92–F98. [Google Scholar] [CrossRef] [PubMed]
- Modi, N.; Dore, C.J.; Saraswatula, A.; Richards, M.; Bamford, K.B.; Coello, R.; Holmes, A. A Case Definition for National and International Neonatal Bloodstream Infection Surveillance. Arch. Dis. Child. Fetal Neonatal Ed. 2008, 94, F8–F12. [Google Scholar] [CrossRef] [PubMed]
- MIT App Inventor. Massachusetts Institute of Technology: Cambridge, MA, USA. Available online: http://appinventor.mit.edu/explore/ (accessed on 20 August 2017).
- Wynn, J.L.; Wong, H.R.; Shanley, T.P.; Bizzarro, M.J.; Saiman, L.; Polin, R.A. Time for a Neonatal-Specific Consensus Definition for Sepsis. Pediatr. Crit. Care Med. 2014, 15, 523–528. [Google Scholar] [CrossRef] [PubMed]
Figure 1.
Study dataset generation from the Medical Information Mart for Intensive Care III (MIMIC III) database.
Figure 1.
Study dataset generation from the Medical Information Mart for Intensive Care III (MIMIC III) database.

Figure 2.
Screenshot of mobile application.
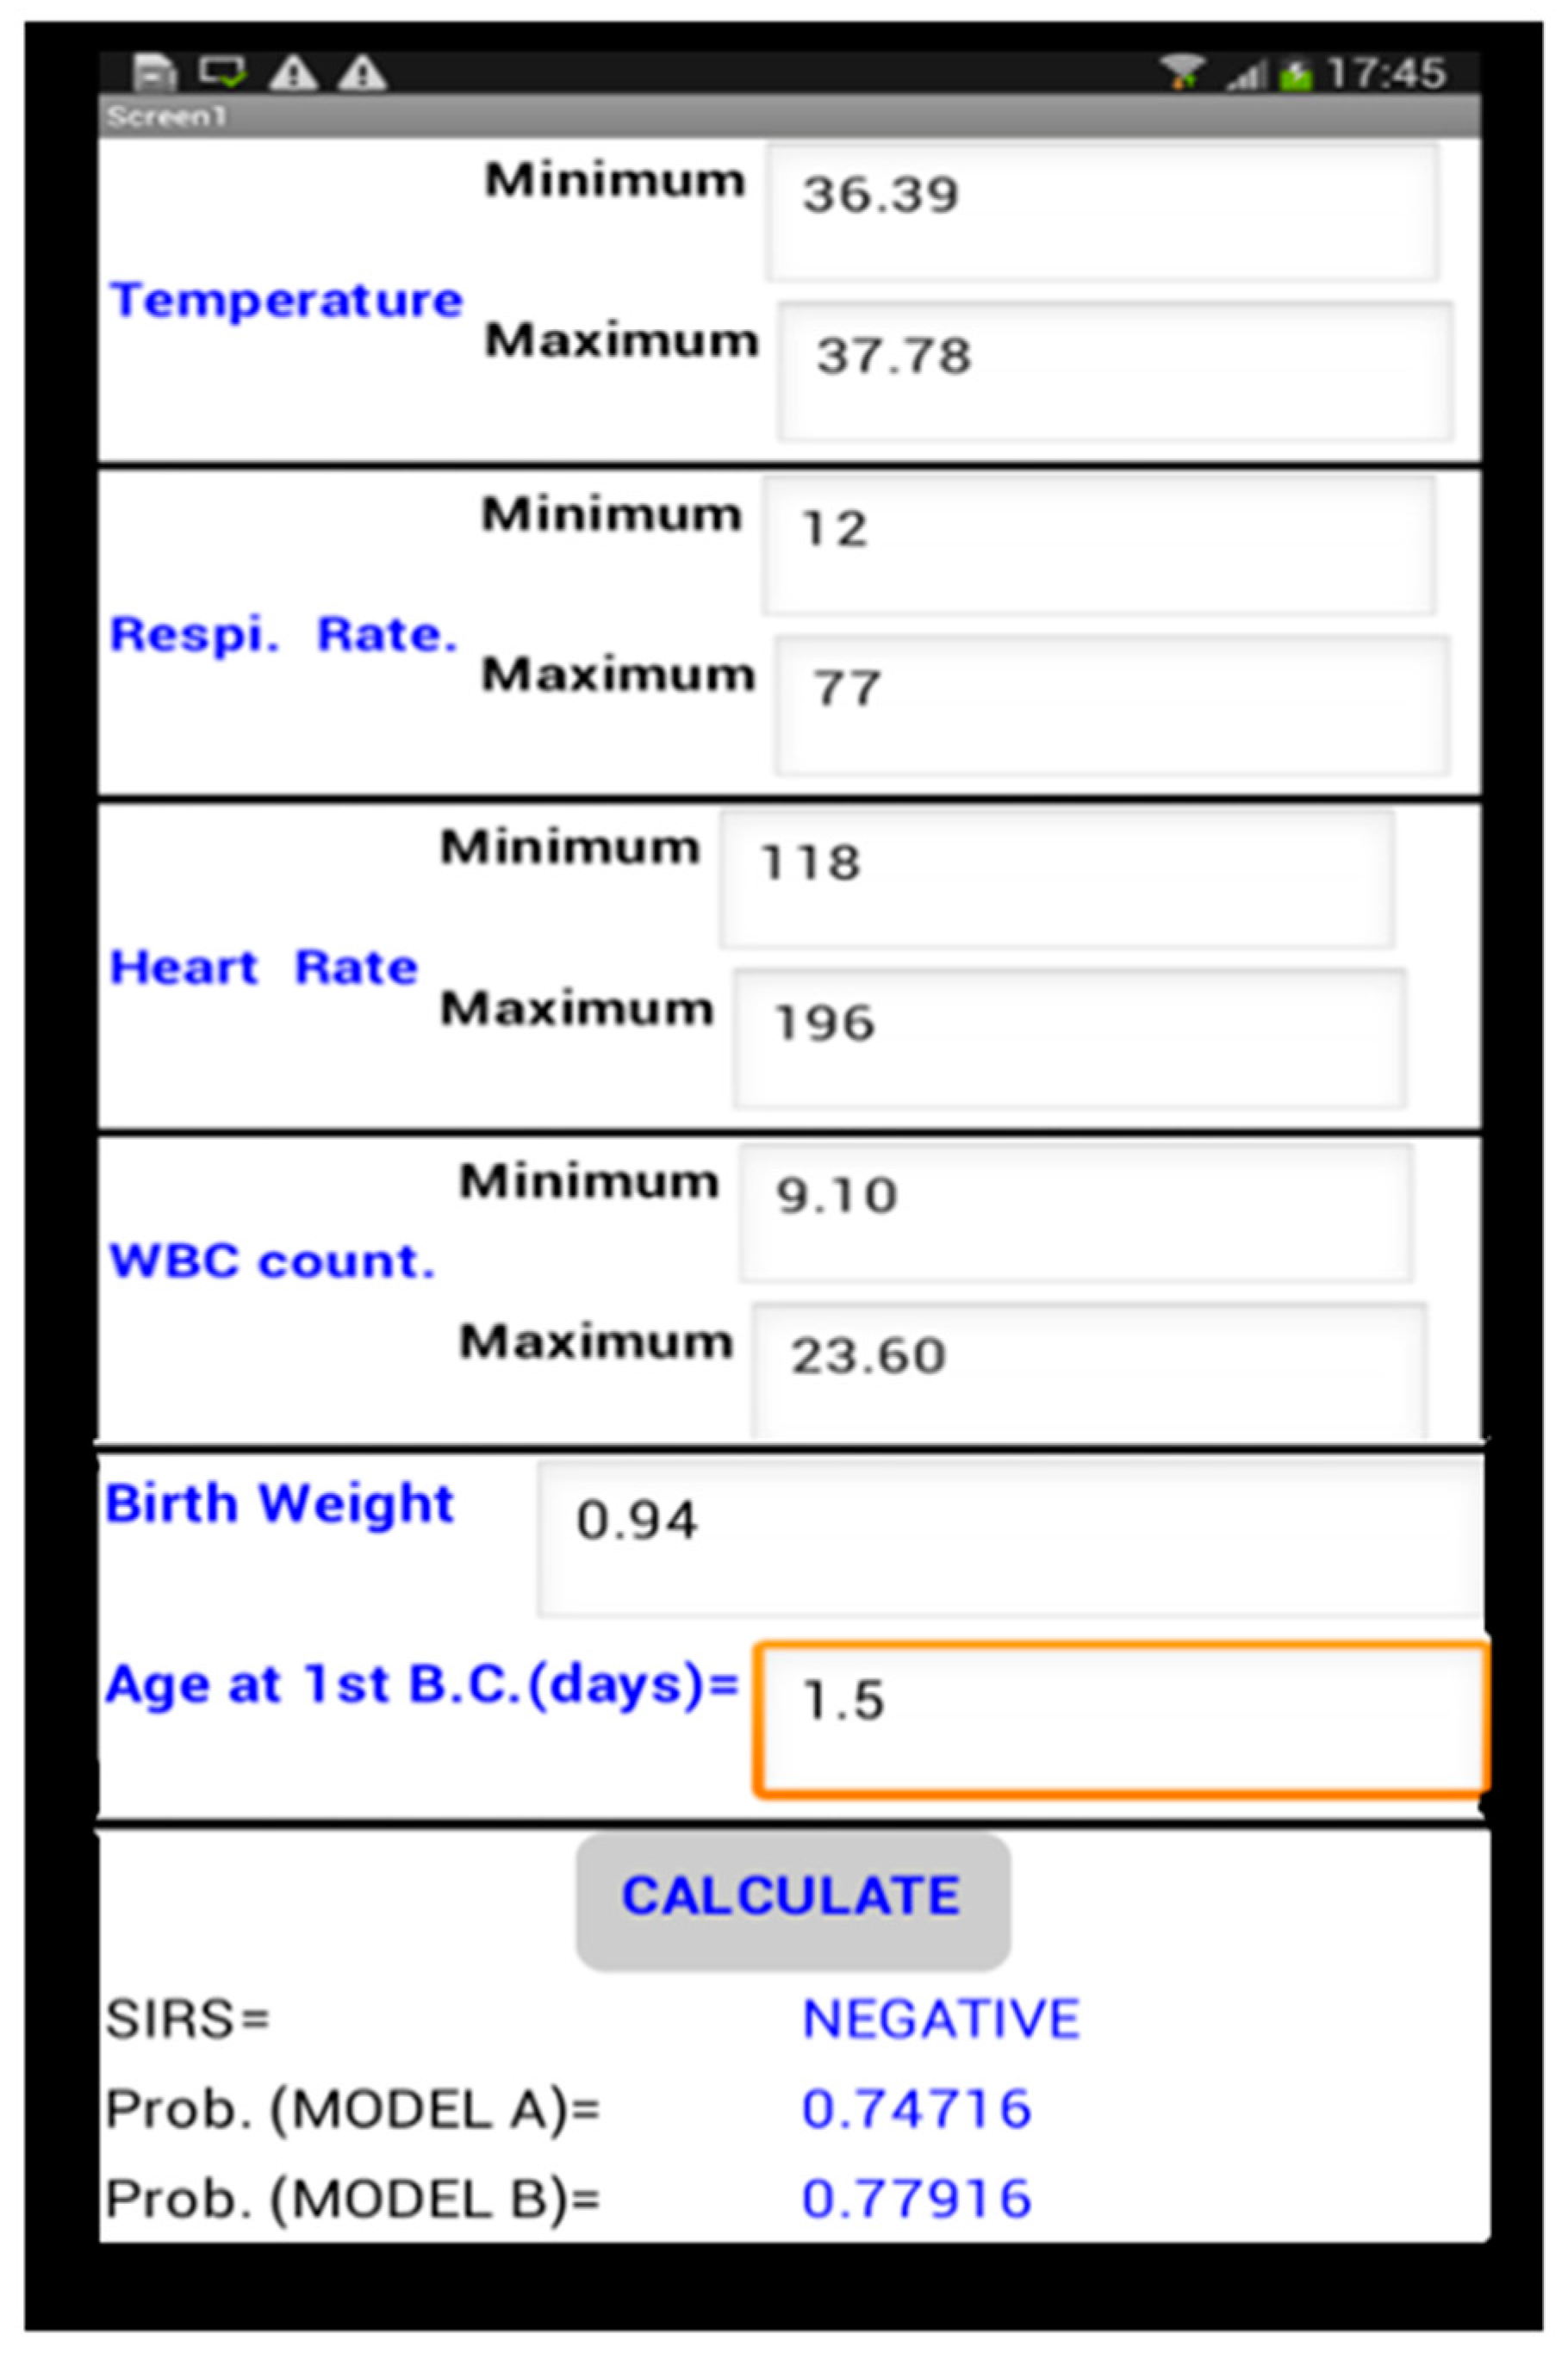
Figure 3.
Flow chart showing the operation of the mobile application.
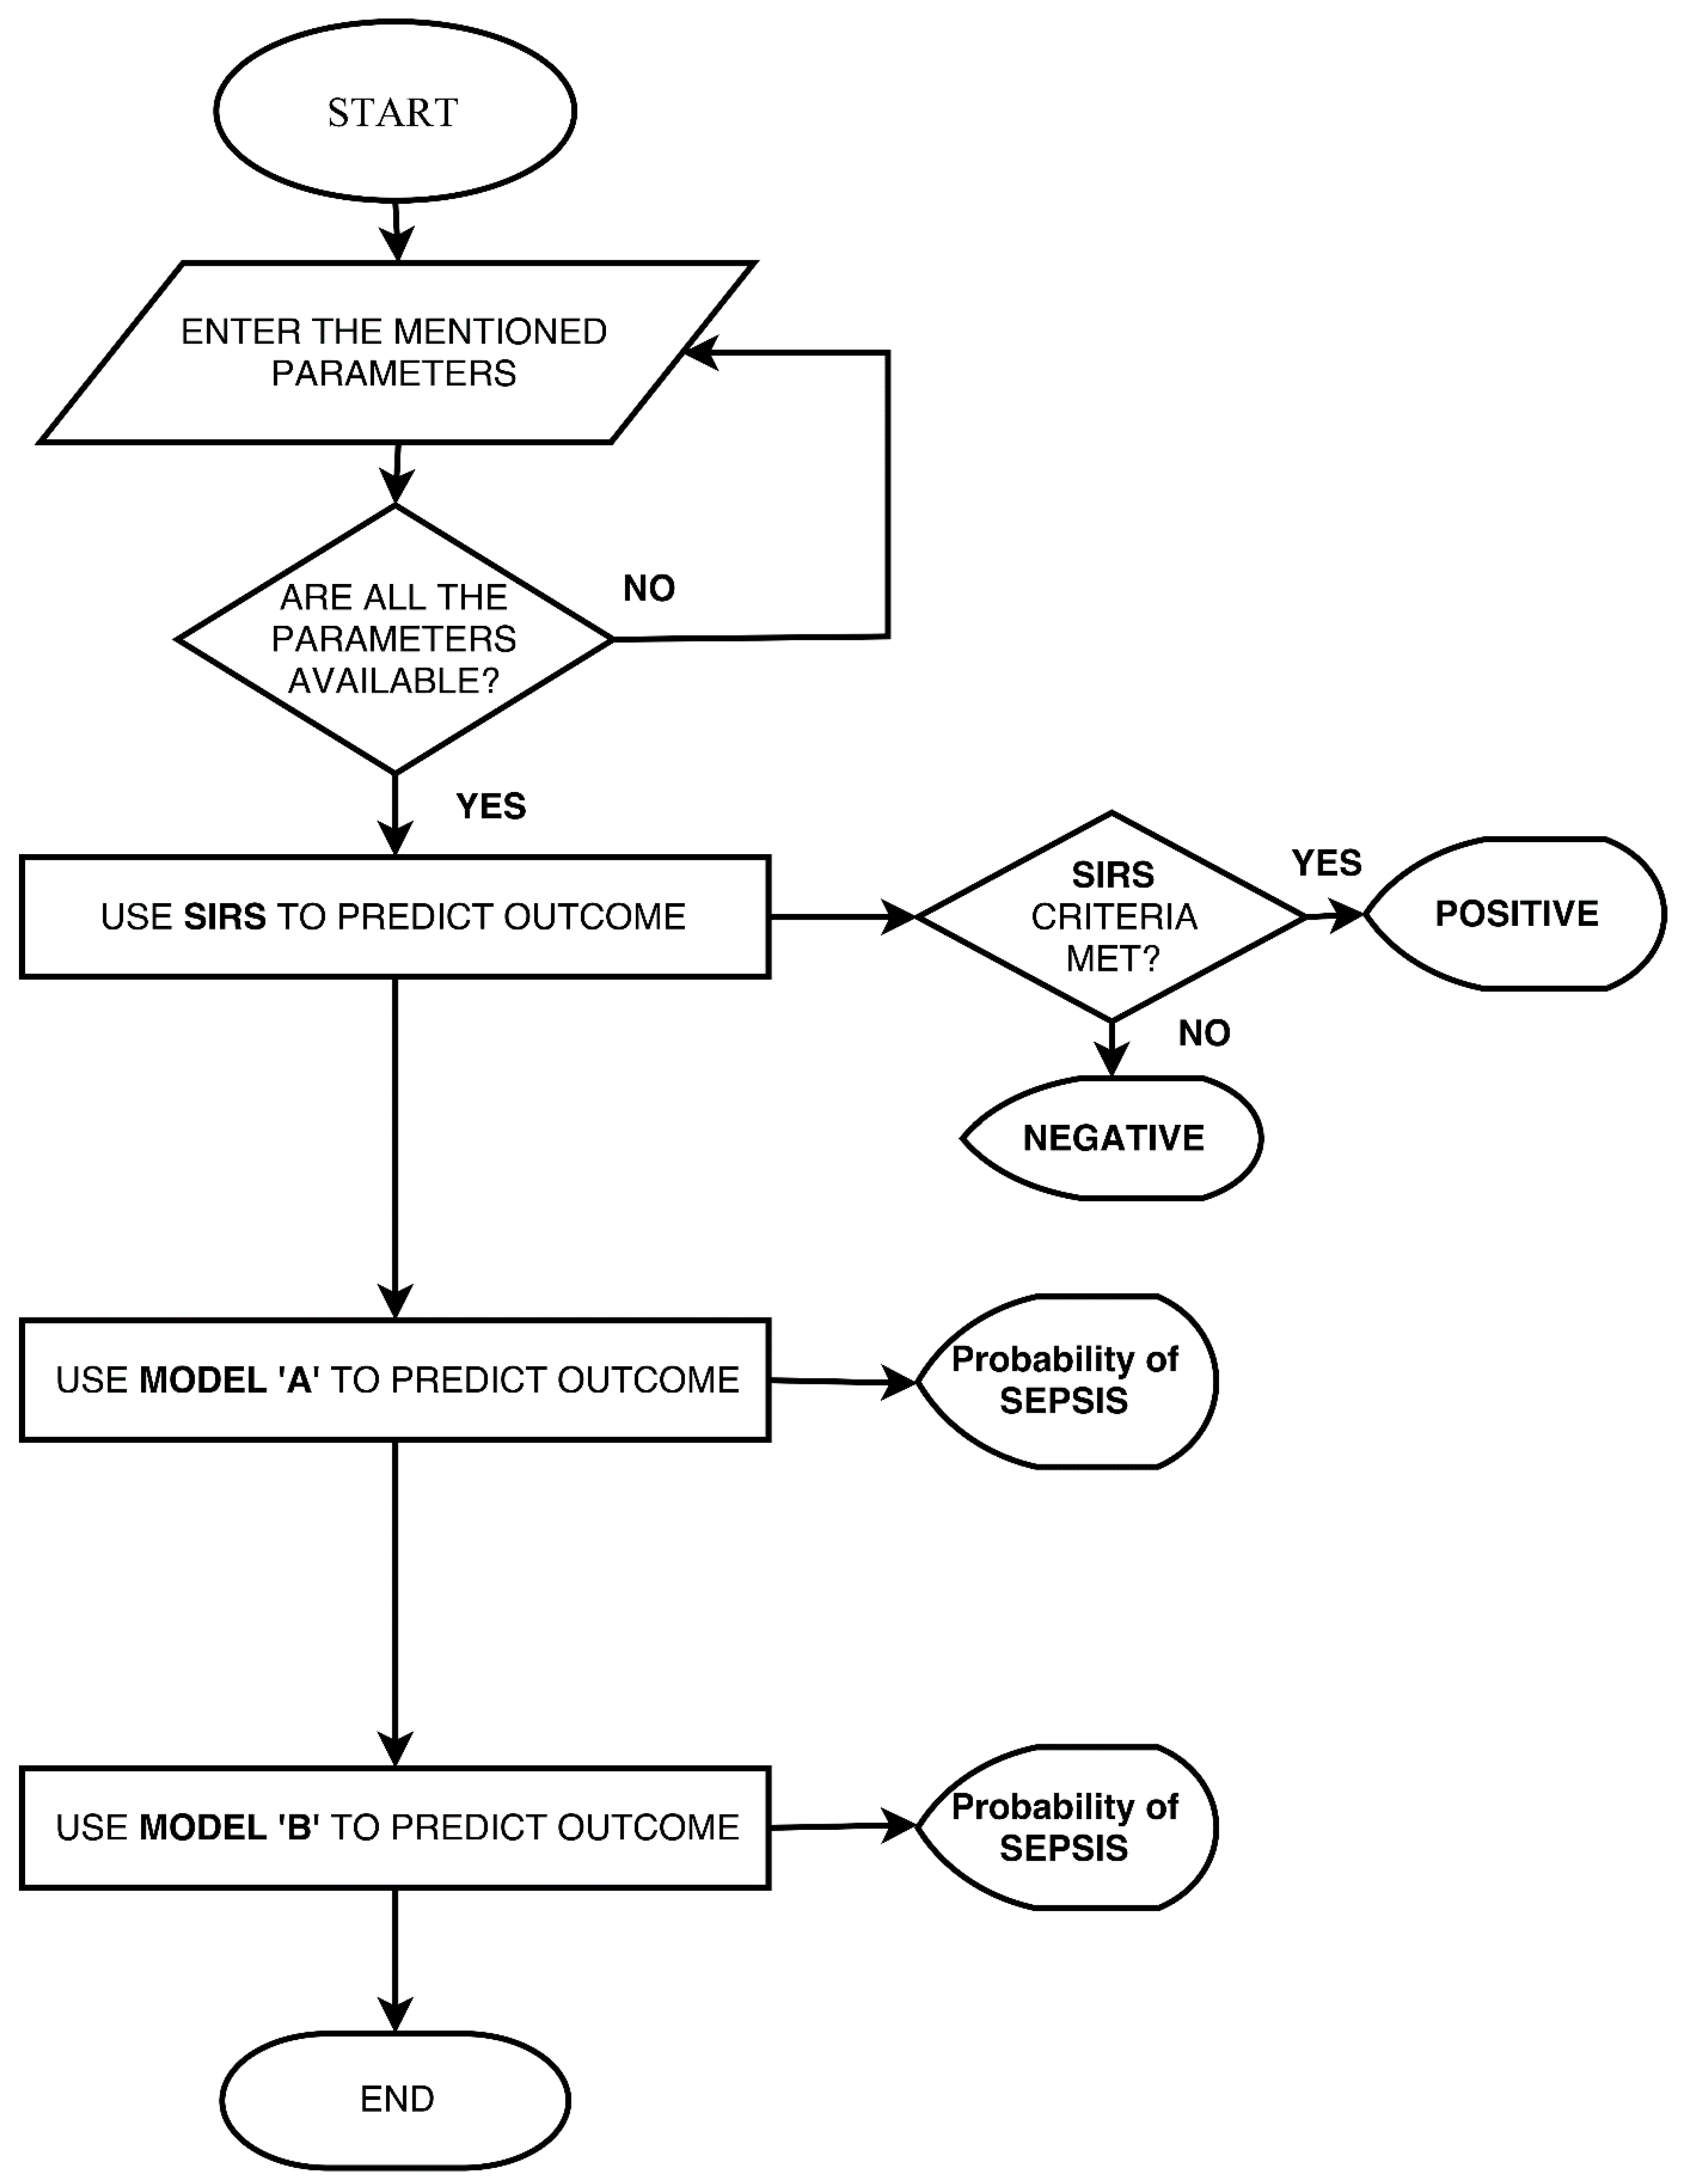
Figure 4.
Bar chart showing the correct predictions made by the three models.


Table 1.
Systemic inflammatory response syndrome (SIRS) cut-off values for neonates according to the International Pediatric Sepsis Consensus conference.
Table 1.
Systemic inflammatory response syndrome (SIRS) cut-off values for neonates according to the International Pediatric Sepsis Consensus conference.
| Neonatal Variables | Cut-off Values According to Age | |
|---|---|---|
| Age 0 Days to 1 Week | Age 1 Week to 1 Month | |
| Heart Rate (Beats/min) | >180 or <100 | >180 or <100 |
| Respiratory Rate (Breaths/min) | >50 | >40 |
| Leukocyte Count (×103/mm3) | >34 | >19.5 or <5 |
| Temperature (°C) | >38.5 or <36 | >38.5 or <36 |
Table 2.
Baseline characteristics of neonates (N = 1580).
| Sex (Male/Female) | (915/665) | |
| Mean | Range | |
| Birth Weight (kg) | 2.18 | (0.36–5.4) |
| Gestational Age (weeks) | 32.99 | (18–43) |
| Features | Present In | |
| N | % | |
| Blood Culture (BC) | (204/1376) † | (12.91/87.08) † |
| Cerebrospinal fluid (CSF) culture | (10/1570) † | (0.63/99.36) † |
| BC and/or CSF culture | (204/1376) † | (12.91/87.08) † |
| Mortality | 28 | 1.77 |
| Abnormal Heart Rate * | 291 | 18.41 |
| Abnormal Respiratory Rate * | 1456 | 92.15 |
| Abnormal Leukocyte count * | 26 | 1.64 |
| Abnormal Temperature * | 74 | 4.68 |
† Represents Positive/Negative; * As per International pediatrics sepsis consensus conference definition of SIRS 2005.
Table 3.
Structure matrix showing the predictive power of independent variables.
| Sr. No. | Name of the Parameter | Function 1 |
|---|---|---|
| 1 | Birth Weight | 0.633 |
| 2 | Heart Rate (Maximum) | −0.625 |
| 3 | Respiratory Rate (Minimum) | 0.495 |
| 4 | Temperature (Minimum) | 0.403 |
| 5 | WBC (Maximum) | −0.285 |
| 6 | WBC (Minimum) | 0.256 |
| 7 | Age at first Blood culture draw | −0.135 |
| 8 | Heart Rate (Minimum) | −0.100 |
WBC: white blood cell.
Table 4.
Omnibus tests of model coefficients.
| Chi-Square | df | Sig. | ||
|---|---|---|---|---|
| Step 1 | Step | 26.961 | 1 | 0.000 |
| Block | 26.961 | 1 | 0.000 | |
| Model | 252.869 | 8 | 0.000 |
Table 5.
Performance parameters of SIRS, Model A and Model B.
| Sensitivity | Specificity | PPV | NPV | PLR | NLR | |
|---|---|---|---|---|---|---|
| SIRS | 16.15 | 95.53 | 33.33 | 89.17 | 3.61 | 0.88 |
| 95% CI | (11.24–22.13) | (94.31–96.56) | (25.03–42.82) | (88.55–89.77) | (2.41–5.41) | (0.82–0.93) |
| Model A † | 29.17 | 97.82 | 66.67 | 90.22 | 13.36 | 0.72 |
| 95% CI | (21.90–37.32) | (96.68–98.64) | (54.97–76.62) | (89.25–91.11) | (8.16–21.89) | (0.65–0.80) |
| Model A * | 20.83 | 99.30 | 76.92 | 91.76 | 29.58 | 0.80 |
| 95% CI | (10.47–34.99) | (97.96–99.85) | (48.72–92.12) | (90.59–92.79) | (8.43–103.80) | (0.69–0.92) |
| Model B † | 31.25 | 97.30 | 63.38 | 90.43 | 11.56 | 0.71 |
| 95% CI | (23.79–39.50) | (96.06–98.23) | (52.46–73.08) | (89.43–91.35) | (7.37–18.13) | (0.63–0.79) |
| Model B * | 31.25 | 99.06 | 78.95 | 92.75 | 33.28 | 0.69 |
| 95% CI | (18.66–46.25) | (97.61–99.74) | (56.46–91.56) | (91.35–93.93) | (11.51–96.24) | (0.57–0.84) |
† Training Set; * Testing Set; PPV: Positive Predictive Value; NPV: Negative Predictive Value; PLR: Positive Likelihood ratio; NLR: Negative Likelihood ratio; CI: Confidence Interval.
Table 6.
Goodness-of-fit test results using Pearson Chi-Square Test and Fisher’s Exact Test.
| Value | df | Significance | |
|---|---|---|---|
| SIRS ‡ | 41.530 | 1 | <0.001 |
| Model A †,‡ | 169.774 | 1 | <0.001 |
| Model B †,‡ | 169.912 | 1 | <0.001 |
| Model A *,¥ | - | - | <0.001 |
| Model B *,¥ | - | - | <0.001 |
† Training Set; * Testing Set; ‡ Pearson Chi-Square; ¥ Fisher’s Exact Test.
Table 7.
Sensitivity and specificity of Model A and Model B at different cut-off values.
| Cut-Off | Prediction Performance (%) | ||||
|---|---|---|---|---|---|
| Training Set | Testing Set | ||||
| Sn | Sp | Sn | Sp | ||
| Model A | 0.1 | 81.94 (74.67–87.85) | 72.45 (69.51–75.26) | 75.00 (60.40–86.36) | 78.17 (73.94–82.00) |
| 0.2 | 67.36 (59.06–74.93) | 89.60 (87.50–91.46) | 68.75 (53.75–81.34) | 92.02 (89.03–94.41) | |
| 0.3 | 44.44 (36.17–52.95) | 93.66 (91.93–95.12) | 33.33 (20.40–48.41) | 95.07 (92.56–96.92) | |
| 0.4 | 34.72 (26.99–43.10) | 95.95 (94.50–97.10) | 25.00 (13.64–39.60) | 98.83 (97.28–99.62) | |
| 0.5 | 29.17 (21.90–37.32) | 97.82 (96.68–98.64) | 20.83 (10.47–34.99) | 99.30 (97.96–99.85) | |
| 0.6 | 22.22 (15.72–29.90) | 98.75 (97.83–99.35) | 16.67 (7.48–30.22) | 99.30 (97.96–99.85) | |
| 0.7 | 16.67 (10.98–23.78) | 98.96 (98.10–99.50) | 4.17 (0.51–14.25) | 99.53 (98.31–99.94) | |
| Model B | 0.1 | 82.64 (75.45–88.44) | 74.95 (72.08–77.66) | 77.08 (62.69–87.97) | 79.58 (75.43–83.31) |
| 0.2 | 68.75 (60.50–76.21) | 88.67 (86.50–90.60) | 66.67 (51.59–79.60) | 91.08 (87.96–93.61) | |
| 0.3 | 56.25 (47.74–64.49) | 93.45 (91.70–94.93) | 50.00 (35.23–64.77) | 94.37 (91.73–96.36) | |
| 0 4 | 41.67 (33.52–50.17) | 95.43 (93.91–96.66) | 41.67 (27.61–56.79) | 97.65 (95.73–98.87) | |
| 0.5 | 31.25 (23.79–39.50) | 97.30 (96.06–98.23) | 31.25 (18.66–46.25) | 99.06 (97.61–99.74) | |
| 0.6 | 24.31 (17.55–32.15) | 98.44 (97.44–99.12) | 18.75 (8.95–32.63) | 99.30 (97.96–99.85) | |
| 0.7 | 16.67 (10.98–23.78) | 98.96 (98.10–99.50) | 14.58 (6.07–27.76) | 99.53 (98.31–99.94) | |
Values in parenthesis indicate 95% confidence interval. Sn: sensitivity; Sp: specificity.
© 2017 by the authors. Licensee MDPI, Basel, Switzerland. This article is an open access article distributed under the terms and conditions of the Creative Commons Attribution (CC BY) license (http://creativecommons.org/licenses/by/4.0/).
Share and Cite
MDPI and ACS Style
Thakur, J.; Pahuja, S.K.; Pahuja, R. Performance Comparison of Systemic Inflammatory Response Syndrome with Logistic Regression Models to Predict Sepsis in Neonates. Children 2017, 4, 111. https://doi.org/10.3390/children4120111
AMA Style
Thakur J, Pahuja SK, Pahuja R. Performance Comparison of Systemic Inflammatory Response Syndrome with Logistic Regression Models to Predict Sepsis in Neonates. Children. 2017; 4(12):111. https://doi.org/10.3390/children4120111
Chicago/Turabian StyleThakur, Jyoti, Sharvan Kumar Pahuja, and Roop Pahuja. 2017. "Performance Comparison of Systemic Inflammatory Response Syndrome with Logistic Regression Models to Predict Sepsis in Neonates" Children 4, no. 12: 111. https://doi.org/10.3390/children4120111
Note that from the first issue of 2016, this journal uses article numbers instead of page numbers. See further details here.