1. Introduction
Pay-As-You-Drive (PAYD) automobile insurance is a new concept in contracts where the premium depends on the distance traveled by policyholders during the year and their driving patterns. Those who use the car infrequently and drive more safely pay less for their coverage, as their exposure to the risk of accidents is not as high. As such, PAYD represents a step towards a more personalized concept of automobile insurance. More generally, the concept is also referred to as usage-based insurance (UBI), with driving patterns, in addition to mileage, being taken into consideration by a digital recording, better known as telematics or on-board sensor technology.
PAYD insurance contracts are widely offered to young drivers around the world. Typically, the company offers a premium discount depending on the distance traveled over the year and the policyholder’s driving patterns (percentage of urban and nighttime driving and speed limit violations), as registered by a global positioning system (GPS). This clearly implies the need to know the impact of distance traveled and driving patterns on the risk of accidents before implementing the PAYD price structure.
In this paper, the average distance traveled per day is used as a measure of a policyholder’s driving intensity, and we show that it is a key factor in explaining the risk of being involved in an accident. Specifically, we estimate how long it takes before a
PAYD policyholder is involved in their first accident at fault during the coverage period in relation to their vehicle usage and driving patterns. To do so, we employ survival analysis methods, specifically the Weibull regression model [
1].
In traditional pricing models, such as the Poisson model, one needs to fix a common time interval, usually one year, for all insured drivers. Instead, here we consider distance driven as the exposure variable. So, with our model approach we can compare people with quite different driving habits, because unlike in the “crash rate” approach, the drivers do not need to have a standard distance driven per day or per year, or a standard time of exposure. We look at distance driven to the first accident and analyze this variable with a survival model until an event takes place. Here the event is the first accident. In addition, our method allows correcting for censoring, which means drivers who have not had an accident before the observation period ends.
We present an empirical application with real data from a major Spanish insurance company. Our results show gender differences in vehicle usage, with male drivers being more exposed to the risk of accidents than female drivers (as men are less respectful of speed limits, drive more kilometers per day and also drive more during the night). Additionally, gender has a significant effect in explaining the time to the first crash, with men being involved in their first crash sooner than women. However, if driving intensity (measured by the number of kilometers traveled per day) is introduced in the model, then gender no longer has a significant effect. This suggests that gender differences in relation to the risk of accidents are, to a large extent, attributable to the fact that men present a higher driving intensity than women and, as such, are more exposed to the risk of accidents. We present estimations of the time to the first accident for different types of drivers and also estimate the probability of the first crash occurring during the first year of coverage for each driver type.
The rest of this paper is organized as follows. In
Section 2, we present a bibliographic review of
PAYD insurance in which we describe the most relevant contributions and results. In
Section 3, the methodology used to estimate the time to the first accident is presented. In
Section 4, we present the results of the empirical application and, finally, in
Section 5, we conclude.
2. Background
The study conducted by Vickrey [
2] was one of the first to criticize the lump-sum pricing system of auto insurance and to promote the implementation of distance-based insurance pricing. Pay-at-the-pump (PATP) and the so-called “insured tires” pricing systems were some of the earliest proposals for distance-based pricing systems. In the first case, the driver paid for his coverage as he bought fuel for his vehicle, while in the second, the insurance company, identified in some way with the tire itself, would cover the accident caused by the vehicle using those tires [
2]. However, under such systems, drivers with a bad claims history paid the same for their insurance as those not involved in any accident [
3,
4]. Moreover, vehicle usage was measured in terms of fuel consumption or tire wear instead of the real distance covered by the vehicle, which, it is argued, was unreasonable.
The easiest way to measure the distance driven by a vehicle is by using an odometer auditing system; however, this is open to fraudulent practices. Today’s technology, though, makes it possible to measure the use of the car more objectively by employing a GPS system, on the basis of which sophisticated
PAYD pricing systems can be proposed (having first obtained, of course, the permission of the driver to install the GPS equipment). In this case, the price can then be fixed in relation not only to the number of kilometers driven, but also to such factors as vehicle speed, the time of day the vehicle is driven and the main locations in which it is driven. This is the
PAYD pricing option that most insurance companies offer today. Speed is normally considered in terms of violation of the limits; time is normally established in terms of day/nighttime driving (with nights being more expensive); and location distinguishes between urban and non-urban driving (with the former being more expensive). All these factors have been shown to account for the risk of accidents [
5,
6,
7,
8,
9,
10,
11].
Many authors (including [
12,
13]) have discussed the advantages of commercializing
PAYD policies from the perspectives of both the insurance company and the driver. For example, [
14] argue that
PAYD helps the insurance industry to target risk classes more effectively. Additionally, [
15] report that the driving patterns and accident rates of young drivers with a
PAYD contract are heterogeneous, so they should not be included in homogeneous risk groups. Meanwhile, the advantages for customers are clear: they pay a lower premium if they drive fewer kilometers or drive more safely. In this regard, it has been shown that
PAYD policies bring about changes in driving patterns among those who want to obtain a better premium under this pricing system. More specifically,
PAYD has a positive effect on mileage reduction (as observed by [
16]) and also on speed reduction (see [
12]).
In short,
PAYD is a new concept in automobile insurance that has potential advantages for customers, insurance companies and the whole of society. Today, insurance companies that strive to be more customer-oriented should be able to offer personalized products, and
PAYD insurance is a good example of this [
17].
In the section that follows we describe how survival analysis methods can be used to study the effect of driving patterns on the risk of accidents and obtain an estimation of the distance traveled until the first accident. This outcome might serve to orientate the insurer in establishing the discounts to be offered to drivers under a PAYD pricing system.
3. Methodology
We are interested in predicting the time that elapses between the day when the
PAYD policy is underwritten and the day when the first claim at fault is filed by young drivers as a function of their driving patterns. To do so, we use a Weibull regression model (see [
1]).
Let
Ti be the time elapsed until the first accident at fault occurs for individual
i = 1, …,
n, where
n is the total number of individuals. A linear model can then be assumed for the logarithmic transformation of
Ti,
Yi = ln
Ti, namely
where β is a
p-dimensional column vector of unknown regression parameters (usually including an intercept term),
Xi is a
p-dimensional column vector of explanatory covariates, σ is an unknown scale parameter, and
wi is an error term that is assumed to have an extreme value distribution and so it has a density function equal to
. The model can then be estimated by maximum likelihood, where the log-likelihood function is given by
where
F(·) and
S(·) are the cumulative distribution function and survival function of the error term
w, respectively,
is the set of uncensored observations,
is the set of right-censored observations,
is the set of left-censored observations and
is the set of interval-censored observations. Additionally,
and
, where
zi is the lower end of the censoring interval. In practice, the Weibull regression model, which assumes that
is a Weibull density, can be easily estimated with SAS by using the LIFEREG procedure (see [
18]). This is a flexible distribution that is used for many applications including product life and strength/reliability testing.
4. Empirical Application
Here we analyze a sample of 8198 young drivers that underwrote a PAYD policy in 2009 with a leading Spanish insurance company. On signing the agreement, their driving patterns began to be recorded using a GPS system. The follow-up period was concluded on 31 December 2011. All the drivers were under the age of 30 at the time of underwriting the policy. When this sample was collected, the market for PAYD insurance was rather new and immature. This is possibly the reason why telematics was sold to younger drivers. In 2016, the market share is still small in a country that has about 23 million motor insurance policies. In fact, the demand for telematics remains quite low and insurers do not seem to compete in this particular area.
The information on driving patterns includes the total number of kilometers traveled, the respective percentages of urban and nighttime driving and the percentage of distance traveled in excess of the speed limit. This information refers to different time periods during each year, identified by the corresponding beginning/end dates. In each time period, the number of kilometers traveled by each driver is recorded, as are the number of claims at fault. Thus, information on the number of days elapsed to the first accident is interval-censored (time interval windows are, on average, equal to 151 days). For some individuals, this information is right-censored. This occurs when the driver reaches the end of the follow-up period (31 December 2011) or decides not to renew the
PAYD policy prior to this date, without having been involved in an accident.
Table 1 shows the variable descriptions.
For each driver we know the gender (binary variable Male), age (Age), age of the vehicle (Age vehicle) and driving experience (Experience). These variables are recorded when their driving patterns first begin to be recorded. Note that the reported characteristics correspond to the main driver; however, if there is an occasional driver with different characteristics, then that creates a measurement error. This is a limitation of our data availability, especially when different family members share the same car.
The driving intensity is measured by the average number of kilometers traveled per day (Km/day). Urban measures the percentage of the total kilometers traveled in urban areas. Similarly, Night measures the percentage of total kilometers traveled during the night (between midnight and 6 a.m.). Finally, Speed measures the percentage of distance traveled above the mandatory limits.
4.1. Dataset
Our sample comprises 45.32% women and 54.68% men. In
Table 2 the means and standard deviations of
Age,
Age Vehicle,
Experience,
Km/day,
Urban,
Night and
Speed are presented for all drivers, as well as for men and women separately.
The mean age for all drivers is 23.67 years (standard deviation 3.06), with the mean ages for men and women being very similar. The mean age of vehicles owned by women is lower than that of the vehicles owned by men (5.66 vs. 6.55 years, respectively). Additionally, women have, on average, 3.35 years of driving experience while men have 3.82 years.
The average number of kilometers traveled per day is higher for men than for women (34.02
vs. 28.10, respectively). The average percentage of urban driving is around 27.5% when considering all drivers, and there is very little difference between men and women in this regard. On average, more men exceed the speed limit than women (9.08%
vs. 7.09%, respectively). Finally, men present a higher percentage of nighttime driving, on average, than women (8.41%
vs. 6.08%, respectively). We conducted a Kruskal-Wallis test to determine whether the above differences between men and women are statistically significant or not (note that the normality hypothesis for the variables in
Table 2 is rejected when using the Kolmogorov-Smirnov test). The results of these tests indicate that the differences between men and women are statistically significant for
Age vehicle,
Experience,
Km/day,
Urban,
Night and
Speed (
p-values < 0.01). In the case of
Age, the differences are not statistically significant (
p-value = 0.4724). Therefore, we conclude that men, in general, present riskier driving patterns than women.
4.2. Results
4.2.1. Weibull Regression Model for the Time to the First Accident at Fault
In order to analyze the time to the first accident at fault, alternative Weibull regression models were estimated using interval-censored data. All the results shown in this section were obtained using the LIFEREG procedure in SAS (see [
17]).
Table 3 shows the corresponding parameter estimates for two alternative models, Model 1 and Model 2. All the significant parameters come up with the expected sign. In Model 1,
Male,
Urban, Urban2,
Speed,
Speed2,
Night,
Experience and
Vehicle Age are used as explanatory variables. We conclude that
gender has a significant effect in explaining the time to the first accident at fault: men have the first accident sooner than women. Urban driving, nighttime driving and speed violations have a significant effect in reducing the time to the first accident at fault. In the case of
Urban and
Speed, a quadratic significant effect is also observed. We include these quadratic terms to allow for a more flexible form of marginal effects on the survival to the first accident, for quantitative regressors that have a wide range. Initially we included quadratic effects for all variables except the variable that measures gender. Only the ones shown are significant.
We conclude that driving experience has a significant effect in increasing the time to the first crash, while vehicle age has the opposite effect: the older the vehicle, the sooner the accident will occur. A plausible explanation would be that older vehicles are in poorer shape, and hence more likely to have a car-related accident, but since vehicle age could also be a proxy for income, we could then say that low-income groups would be expected to suffer an accident earlier than high-income groups.
Alternatively to Model 1, in Model 2, the same explanatory variables are considered in addition to driving intensity, Km/day. The parameter of Male is no longer significant, while Km/day has a clearly significant effect in explaining the time to the first crash: the higher the driving intensity, the sooner the accident will occur. This result seems to indicate that the gender differences in the risk of accidents are, to a large extent, attributable to the fact that men drive more kilometers per day than women and thus are more exposed to the risk of accidents. The rest of the explanatory variables present the same effect as in Model 1. For model comparison, both the Akaike Information Criterion (AIC) and the Bayesian Information Criterion (BIC) can be used. The smaller value for both criteria is shown for Model 2, thus we conclude that this second model outperforms Model 1.
We next analyze the impact of driving patterns and driving intensity on the risk of accidents for both genders in more detail. To do so, two separate Weibull regression models were estimated for men and women. The results are shown in
Table 4. For men, urban driving and speed violations have a significant effect, and also a significant quadratic effect, in reducing the time to the first accident. In contrast, driving at night does not result in men suffering their first accident at fault sooner, as
Night has no significant effect (and, therefore, it is not included in the model). Additionally, we again conclude that the greater the driving intensity, the sooner the first crash will occur. Finally, vehicle age also has a significant effect in reducing the time to the first crash. In the case of women, urban and nighttime driving have a significant effect in reducing the time to the first accident, and a significant quadratic effect is found in the case of
Urban. Speed violations do not result in women suffering their first accident sooner, as the
Speed parameter is not significant (and, therefore,
Speed is not included in the final model). All the other variables present the same effect as that observed for men. Goodness-of-fit measures shown at the bottom of
Table 4 indicate that the model fit is better for women than for men.
4.2.2. Risk of a First Accident at Fault during the First Year of Coverage
In this section we show the survival curves and the probability of being involved in an accident during the first year of coverage for different driver types. In
Table 5, four risk groups are defined in terms of total kilometers traveled per year, total kilometers traveled at night during the year, percentage of urban driving and percentage of kilometers traveled above the speed limits.
Just as an illustration, we have analyzed an example of a group that is little exposed to the risk of accidents, or at least less than average. This group is labelled “Low risk” (comprising those individuals that do not drive more than 5000 km/year and no more than 100 km/year during the night, and who present a percentage of urban driving no higher than 5% and a percentage of kilometers traveled above the speed limit no higher than 0.3%). The drivers in this group are likely to be the ones most interested in underwriting a
PAYD insurance policy, as they would receive a discount because their risk of accidents is lower than average. The rest of the drivers are more exposed to the risk of accidents and so are included in one of the three other groups—“Medium risk”, “High risk” or “No discount”—depending on their driving pattern (see the threshold values in
Table 5 for each group). We believe that the “Medium risk” and “High risk” groups might also derive some benefit from underwriting a
PAYD insurance policy, while drivers in the “No discount” group are so highly exposed to the risk of accidents that they would probably not receive any discount in the premium. These risk groups have been proposed in light of the price discounts offered by many insurance companies around the world, frequently addressing
PAYD insurance policies to customers who do not drive more than 10,000 km/year.
Table 6 shows the percentage of drivers in each risk group. This information is also shown for men and women separately. Around 80% of the drivers are included in the “No discount” group and 19% in the “High risk” group. We also observe that the percentage of men in the “No discount” group is markedly higher (85.66%) than the percentage corresponding to women (73.62%). Therefore, here we again conclude that men are more exposed to the risk of accidents than women.
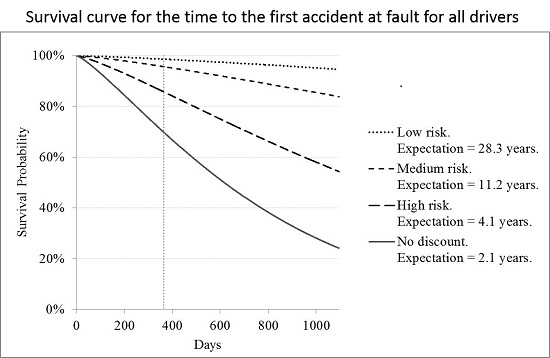
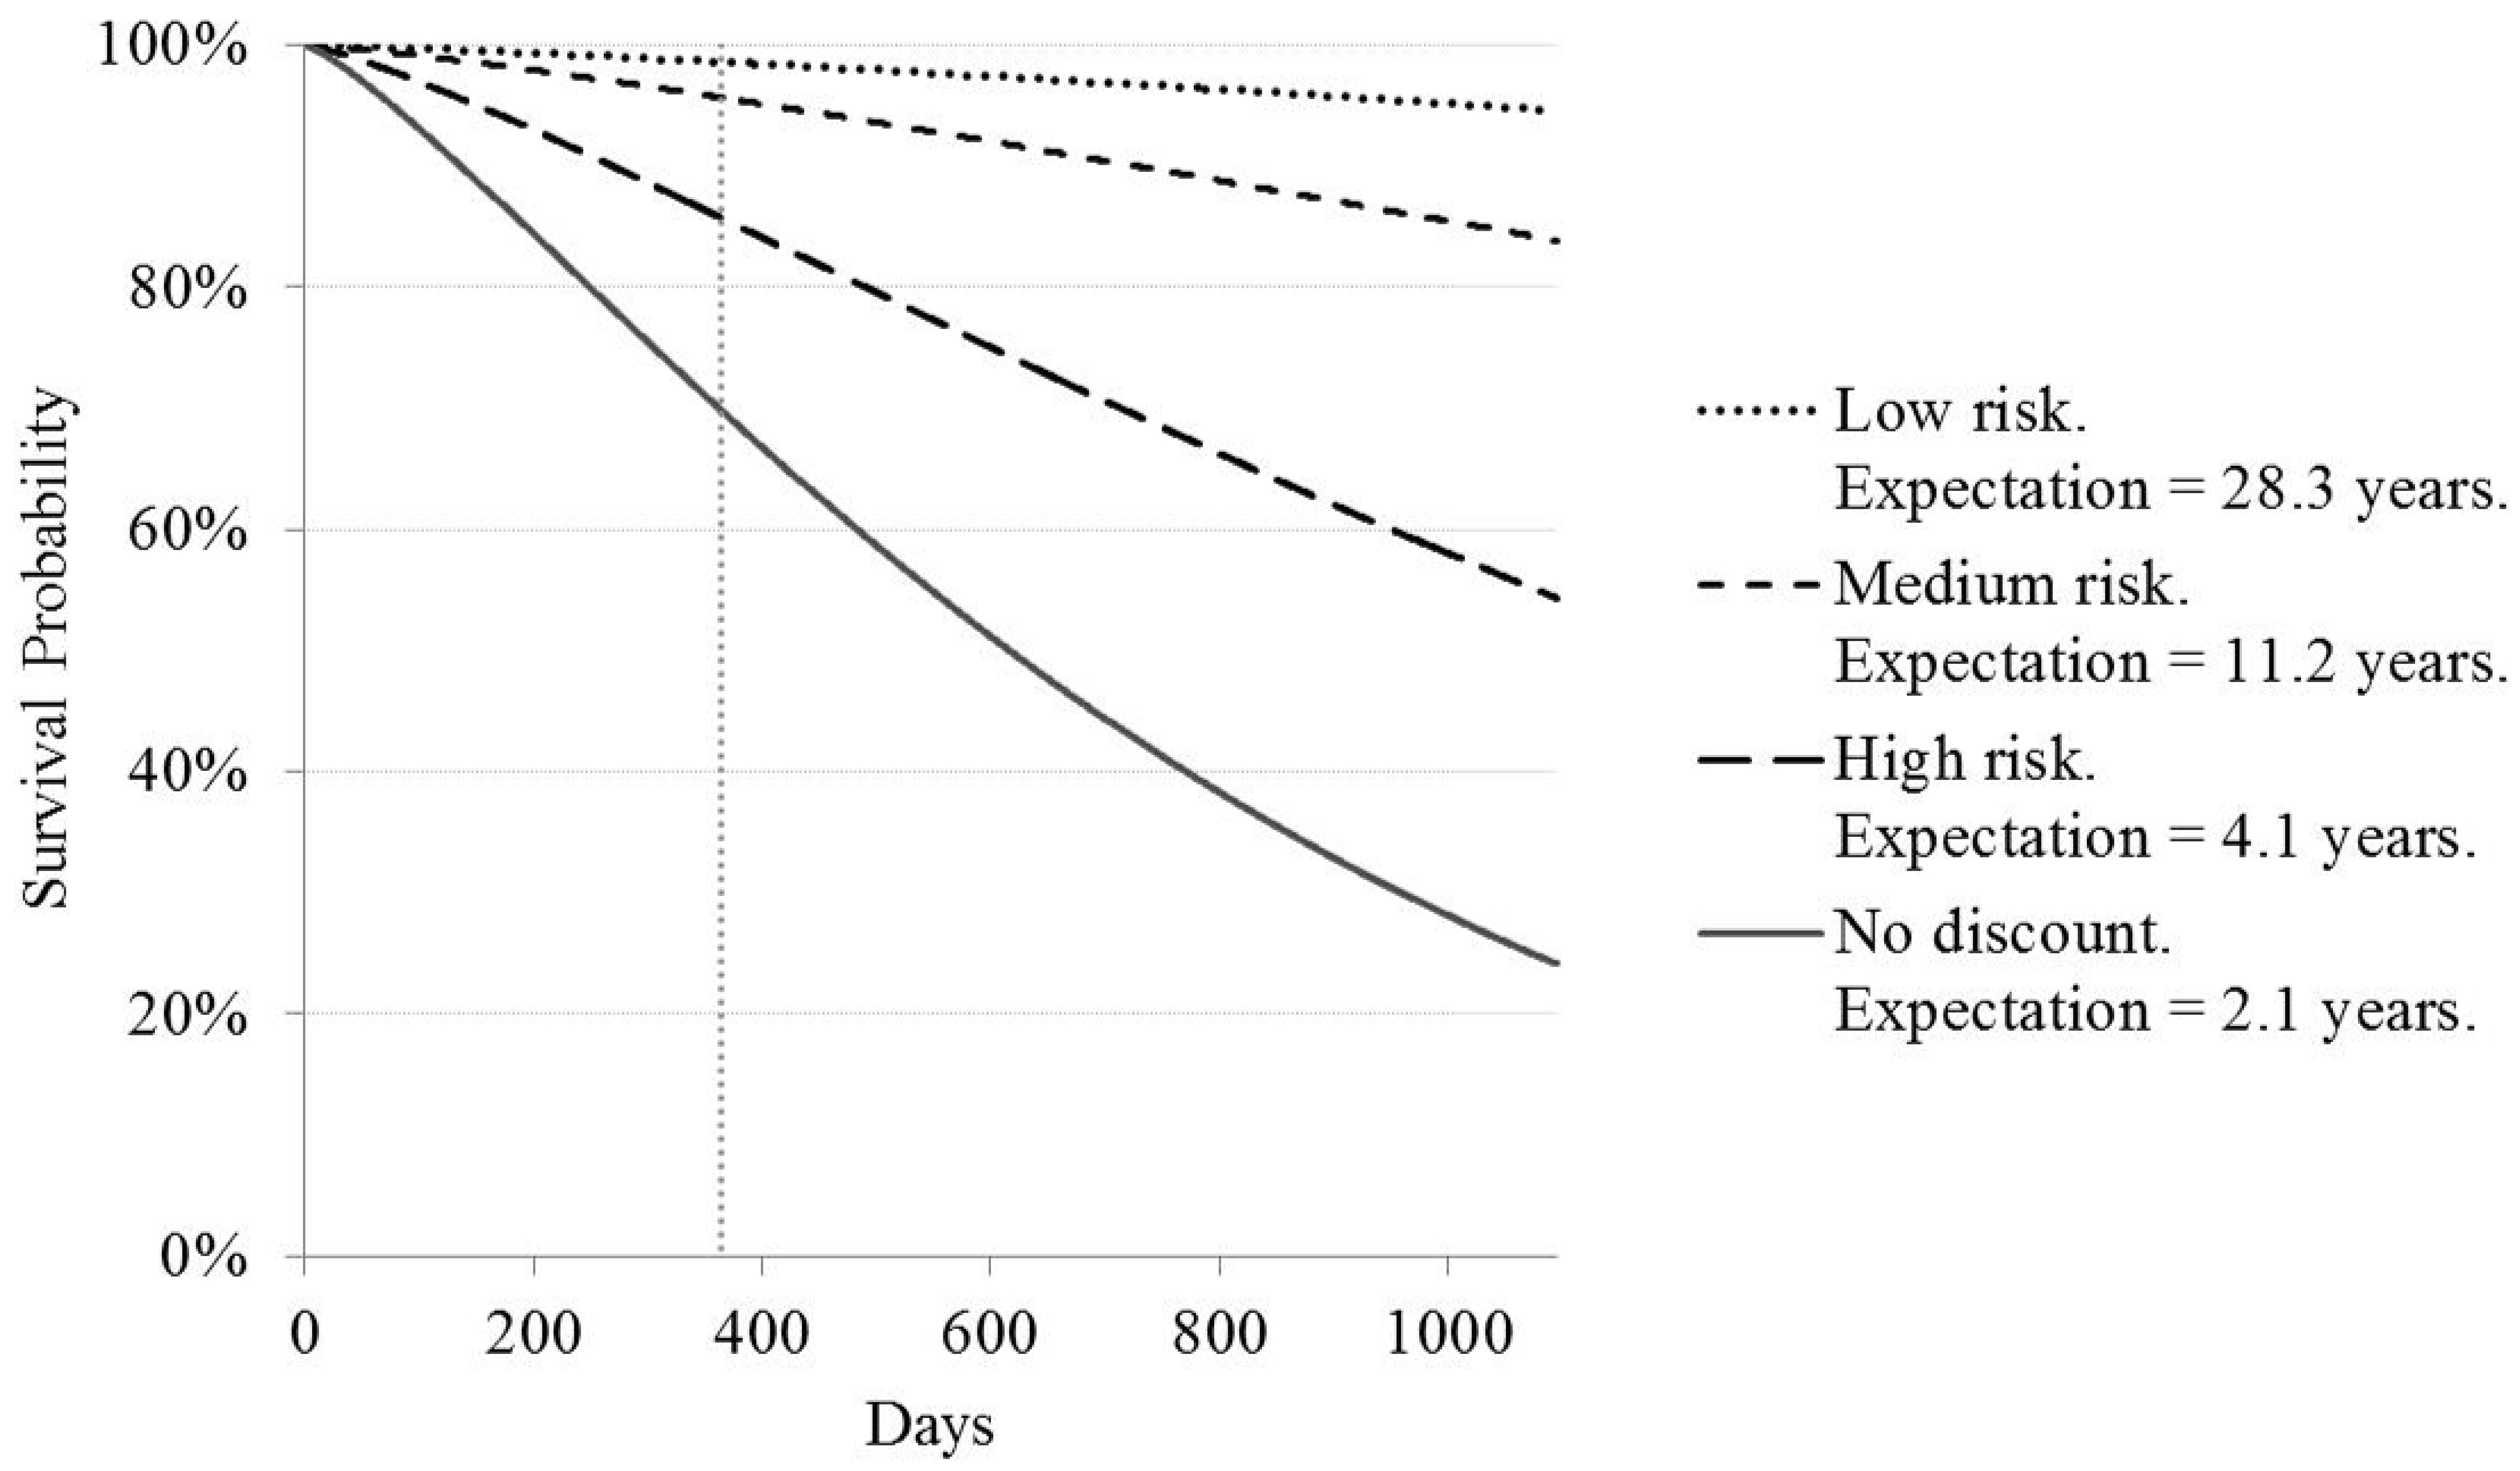
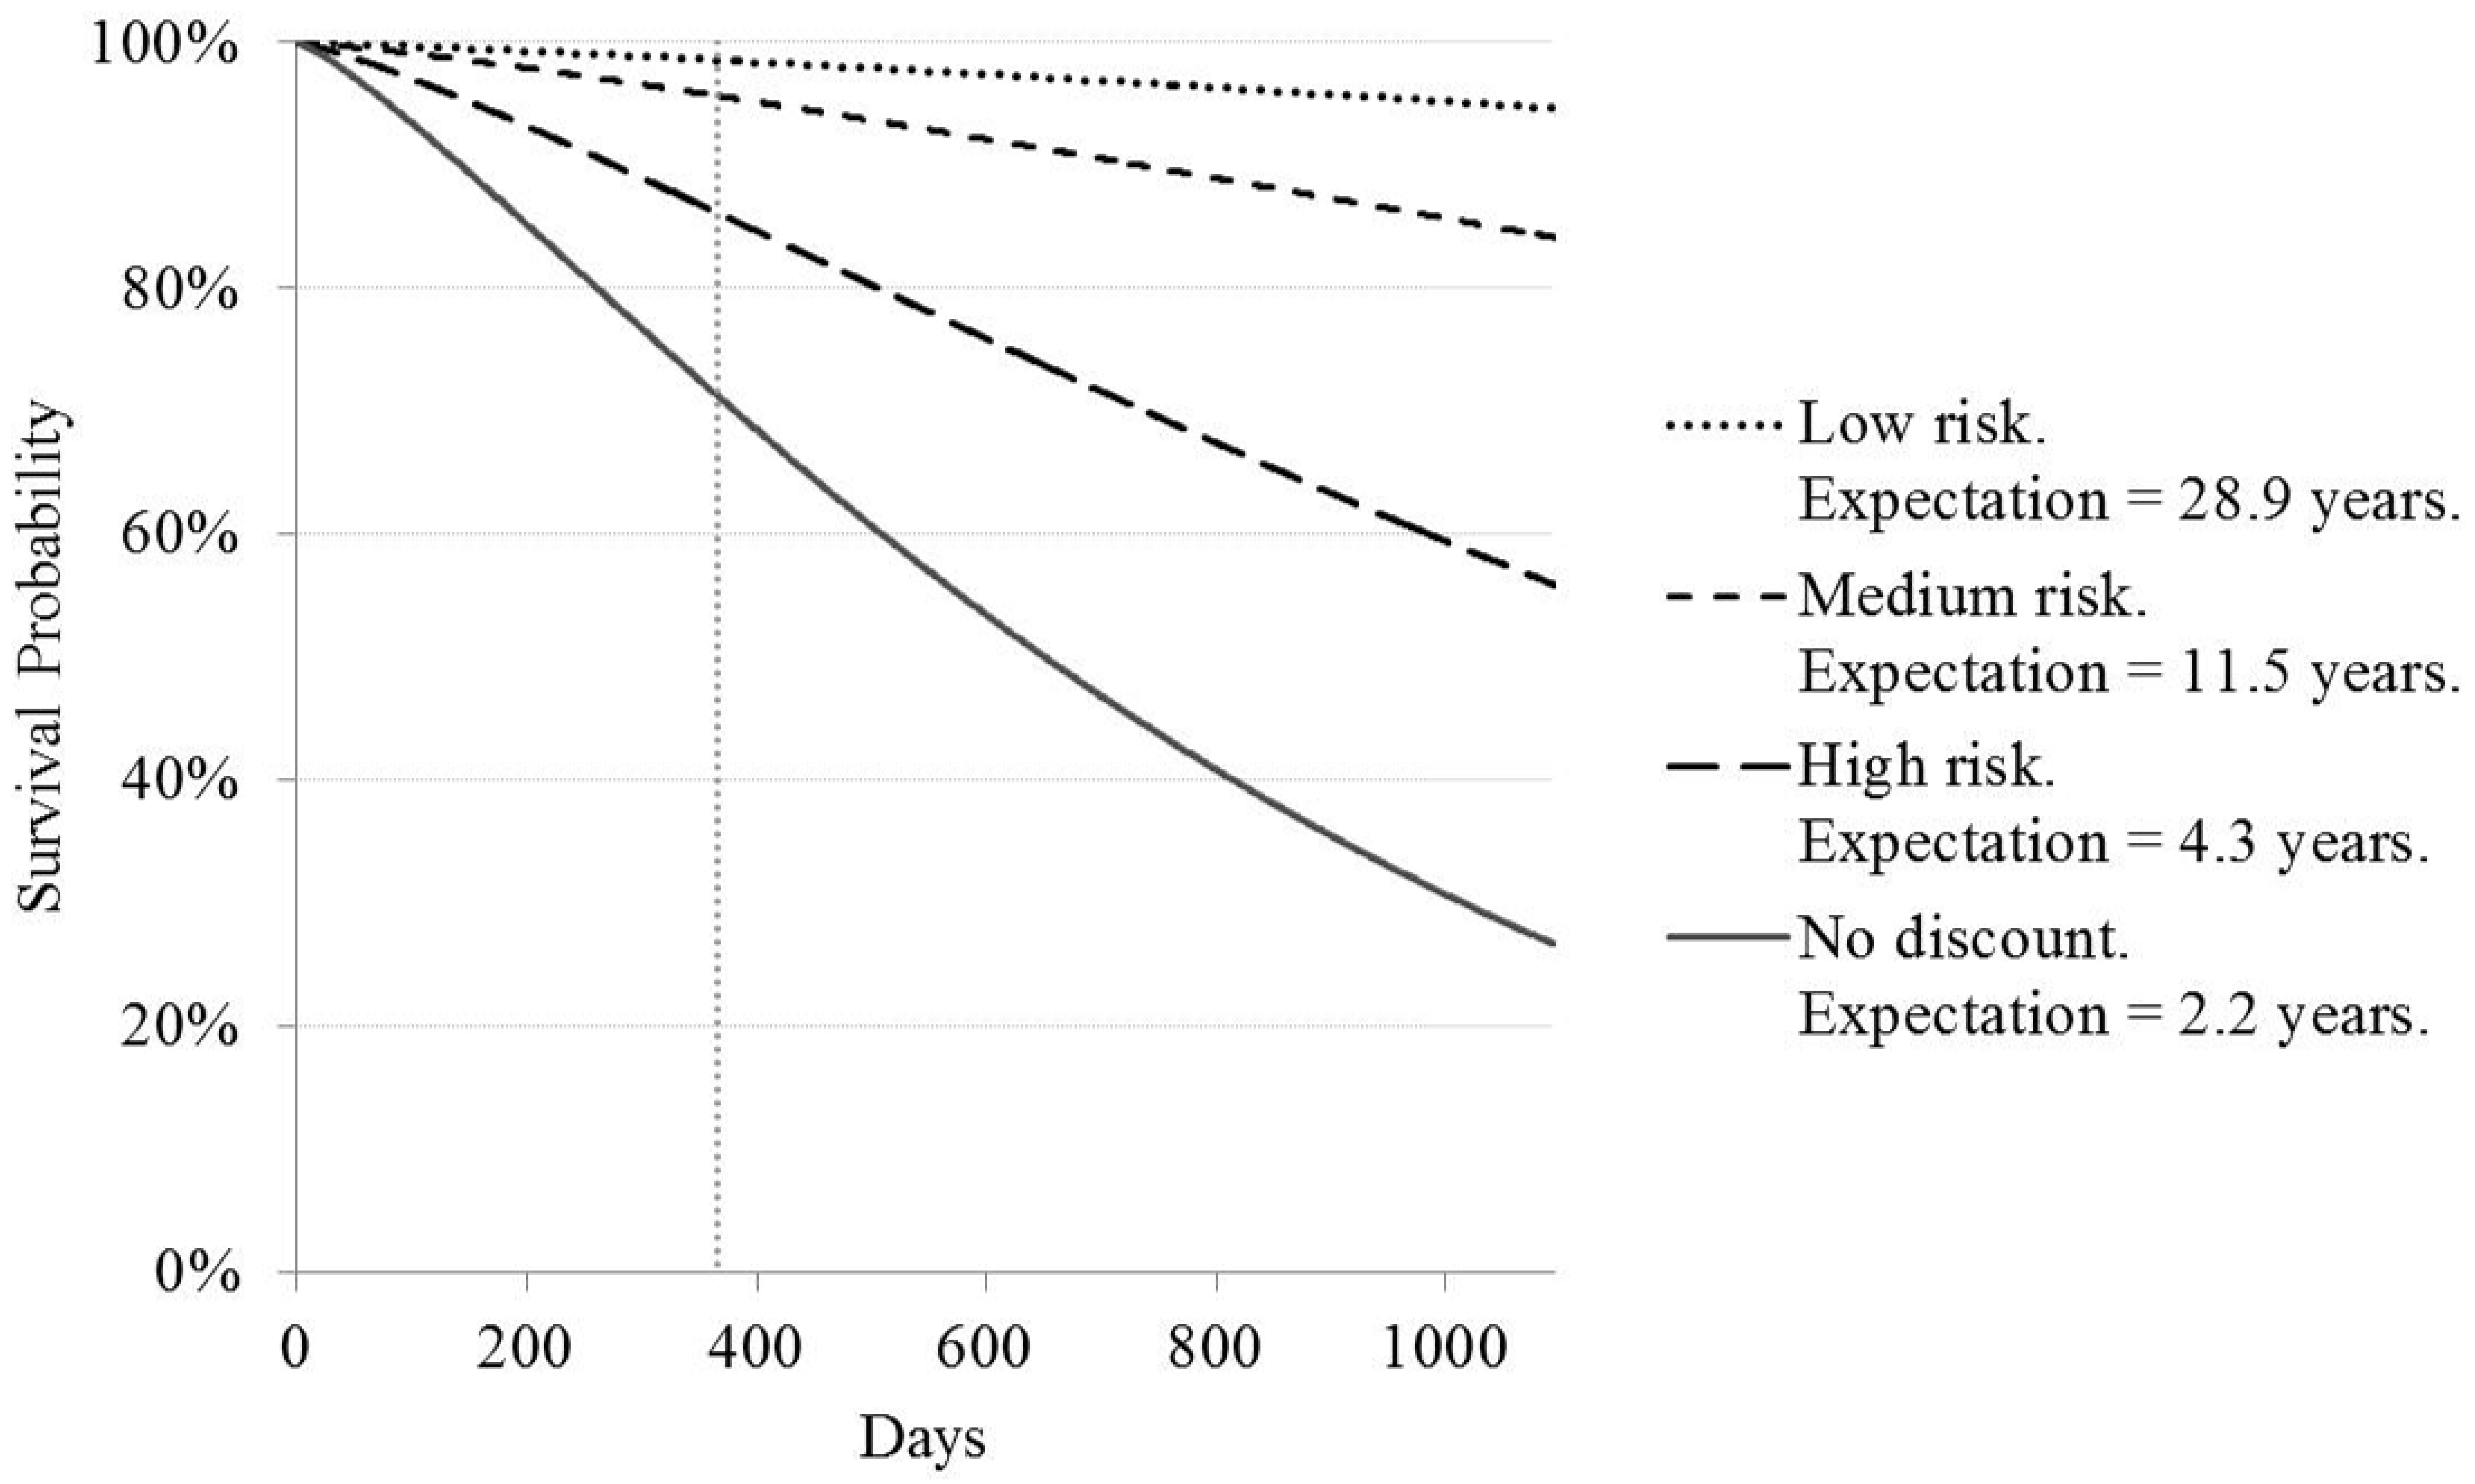
Figure 1,
Figure 2 and
Figure 3 show the survival curves for the time to the first accident at fault for all drivers, for men, and for women, respectively, depending on the risk group. Estimates of the expected number of years until the first crash occurs are also shown. These estimates are obtained by fixing the levels of kilometers driven per year, nighttime kilometers driven, percentage of urban driving and percentage of distance traveled above the speed limits at their maximum values for each risk group (according to the intervals shown in
Table 5). All the other variables are fixed according to the mean values in the sample.
When considering all drivers, the expected number of years until the first crash occurs is around 28 years for the “Low risk” group and 11 years for the “Medium risk” group. In contrast, drivers in the “High risk” and “No discount” groups are expected to have their first accident much sooner, after four and two years, respectively. In
Figure 2 and
Figure 3 we see that the corresponding expectations of the number of years until the first accident occurs in each risk group are, in general, quite similar for men and women (albeit they are expected to occur slightly sooner in the case of female drivers).
In
Figure 1,
Figure 2 and
Figure 3, a vertical line is used to indicate the end of the first year of coverage, thus allowing us to compare the probability of drivers in each risk group being involved in an accident in the first year. These probabilities are shown in
Table 7 for all drivers, for men and for women separately. It can be seen that the probability of being involved in an accident during the first year is quite high in the “High risk” group (around 14%) and very high in the “No discount” group (around 30%). It can also be seen that men and women present similar probability values, especially those in the low, medium and high risk groups. Women in the “No discount” group present a slightly lower probability of being involved in an accident in the first year than men in this same risk group (25.49%
vs. 28.65%).
5. Conclusions
Our findings allow us to conclude that the lower risk of accidents traditionally observed in female drivers is, to a large extent, attributable to the fact that women have a lower driving intensity (drive fewer kilometers per year) and, in general, have less risky driving patterns than men. Indeed, when we compare the risk of accidents for a man and a woman in the same risk group (where both have a similar vehicle usage and present similar driving patterns), then the risk of accidents is very similar.
This is a particularly relevant conclusion, given that today many insurance companies are no longer allowed to charge different rates to men and women for their insurance policies due to existing regulations. For instance, European directive 2004/113/EC of 13 December 2004, known as the Gender Directive, does not allow men and women to pay a different price if all their other characteristics are equal [
19]. Our results show that once we have information about a policyholder’s driving pattern and vehicle usage, then knowing whether the driver is a man or a woman becomes irrelevant. In other words, driving patterns and vehicle usage can substitute gender as a rating variable in the context of
PAYD insurance.
As pointed out by the reviewers, the sample that is analyzed here possibly suffers some selection bias. Even if the PAYD insurance product was available to all customers, it was given as a choice and, finally, it was only purchased by young drivers under the age of 30 years. This is the reason why we did not use age and we do not want to conclude that age is a traditional risk factor that can be replaced by mileage per day. However, we do find that driving experience plays an important role in the risk of accidents. We have it on our agenda to investigate further on this issue. So, once telematics penetrates the market and older drivers also purchase PAYD insurance, we plan to enlarge the sample. We should then investigate whether “age” is a significant factor before the mileage is controlled, and whether the significance disappears after the mileage is controlled.


