
The Impact of Risk Management in Credit Rating Agencies
by
A. Seetharaman
1,*, 
Vikas Kumar Sahu
1,
A. S. Saravanan
2,
John Rudolph Raj
3 and
Indu Niranjan
1 1
SP Jain School of Global Management, 10, Hyderabad Road, Singapore 119579, Singapore
2
School of Communication, Taylors University, 57500 Petaling Jaya, Malaysia
3
Faculty of Management, Multimedia University, 63000 Cyberjaya, Malaysia
*
Author to whom correspondence should be addressed.
Risks 2017, 5(4), 52; https://doi.org/10.3390/risks5040052
Submission received: 19 February 2017
/
Revised: 8 May 2017
/
Accepted: 2 August 2017
/
Published: 21 September 2017
Abstract
:An empirical study was conducted to determine the impact of different types of risk on the performance management of credit rating agencies (CRAs). The different types of risks were classified as operational, market, business, financial, and credit. All these five variables were analysed to ascertain their impact on the performance of CRAs. In addition, apart from identifying the significant variables, the study focused on setting out a structured framework for future research. The five independent variables were tested statistically using structural equation modelling (SEM). The results indicated that market risk, financial risk, and credit risk have a significant impact on the performance of CRAs, whereas operational risk and business risk, though important, do not have a significant influence. This finding has a significant implication for the examination and inter-firm evaluation of CRAs.
1. Introduction
Since 1909, when John Moody first began to provide ratings for a handful of railroad companies, management has been concerned with firms’ credit ratings (Sylla 2002). A significant number of corporations with public debt now have ratings, as do many firms without public debt. Some firms have explicitly targeted a rating, while others have expressed their commitment to maintaining a certain threshold—for example, investment grade (Kisgen 2006). To achieve or maintain their targeted ratings, some companies have changed their capital structures directly by issuing equity or buying back debt; others have attempted to strengthen their balance sheets through actions such as asset sales or dividend cuts (Kisgen 2007).
Many believe that the financial crisis in the United States in 2008 and the recent European Union crisis were avoidable and were caused by widespread failures in financial regulation. Thus, policymakers and regulators worldwide are now confronting the formidable challenge of restoring confidence in markets and formulating long-term responses to the crisis. CRAs played a significant role in the financial crisis—even with so much information, they could not predict the fall of big financial institutions (Voorhees 2012). Investors primarily focused on the ratings that CRAs assigned to exotic financial instruments, such as asset-backed securities, collateralized debt obligations, credit default swaps, and structured investment vehicles, which shocked the financial market. Corporate bonds and securities with the highest ratings of AAA/Aaa defaulted or lost value at an alarming rate; the result was a loss of investor confidence in the value of the AAA/Aaa rating. The financial media questioned these CRAs’ competency and expertise regarding their rating mechanism used in assessing and evaluating various financial institutions’ instruments and their economic viability in the financial markets (White 2010).
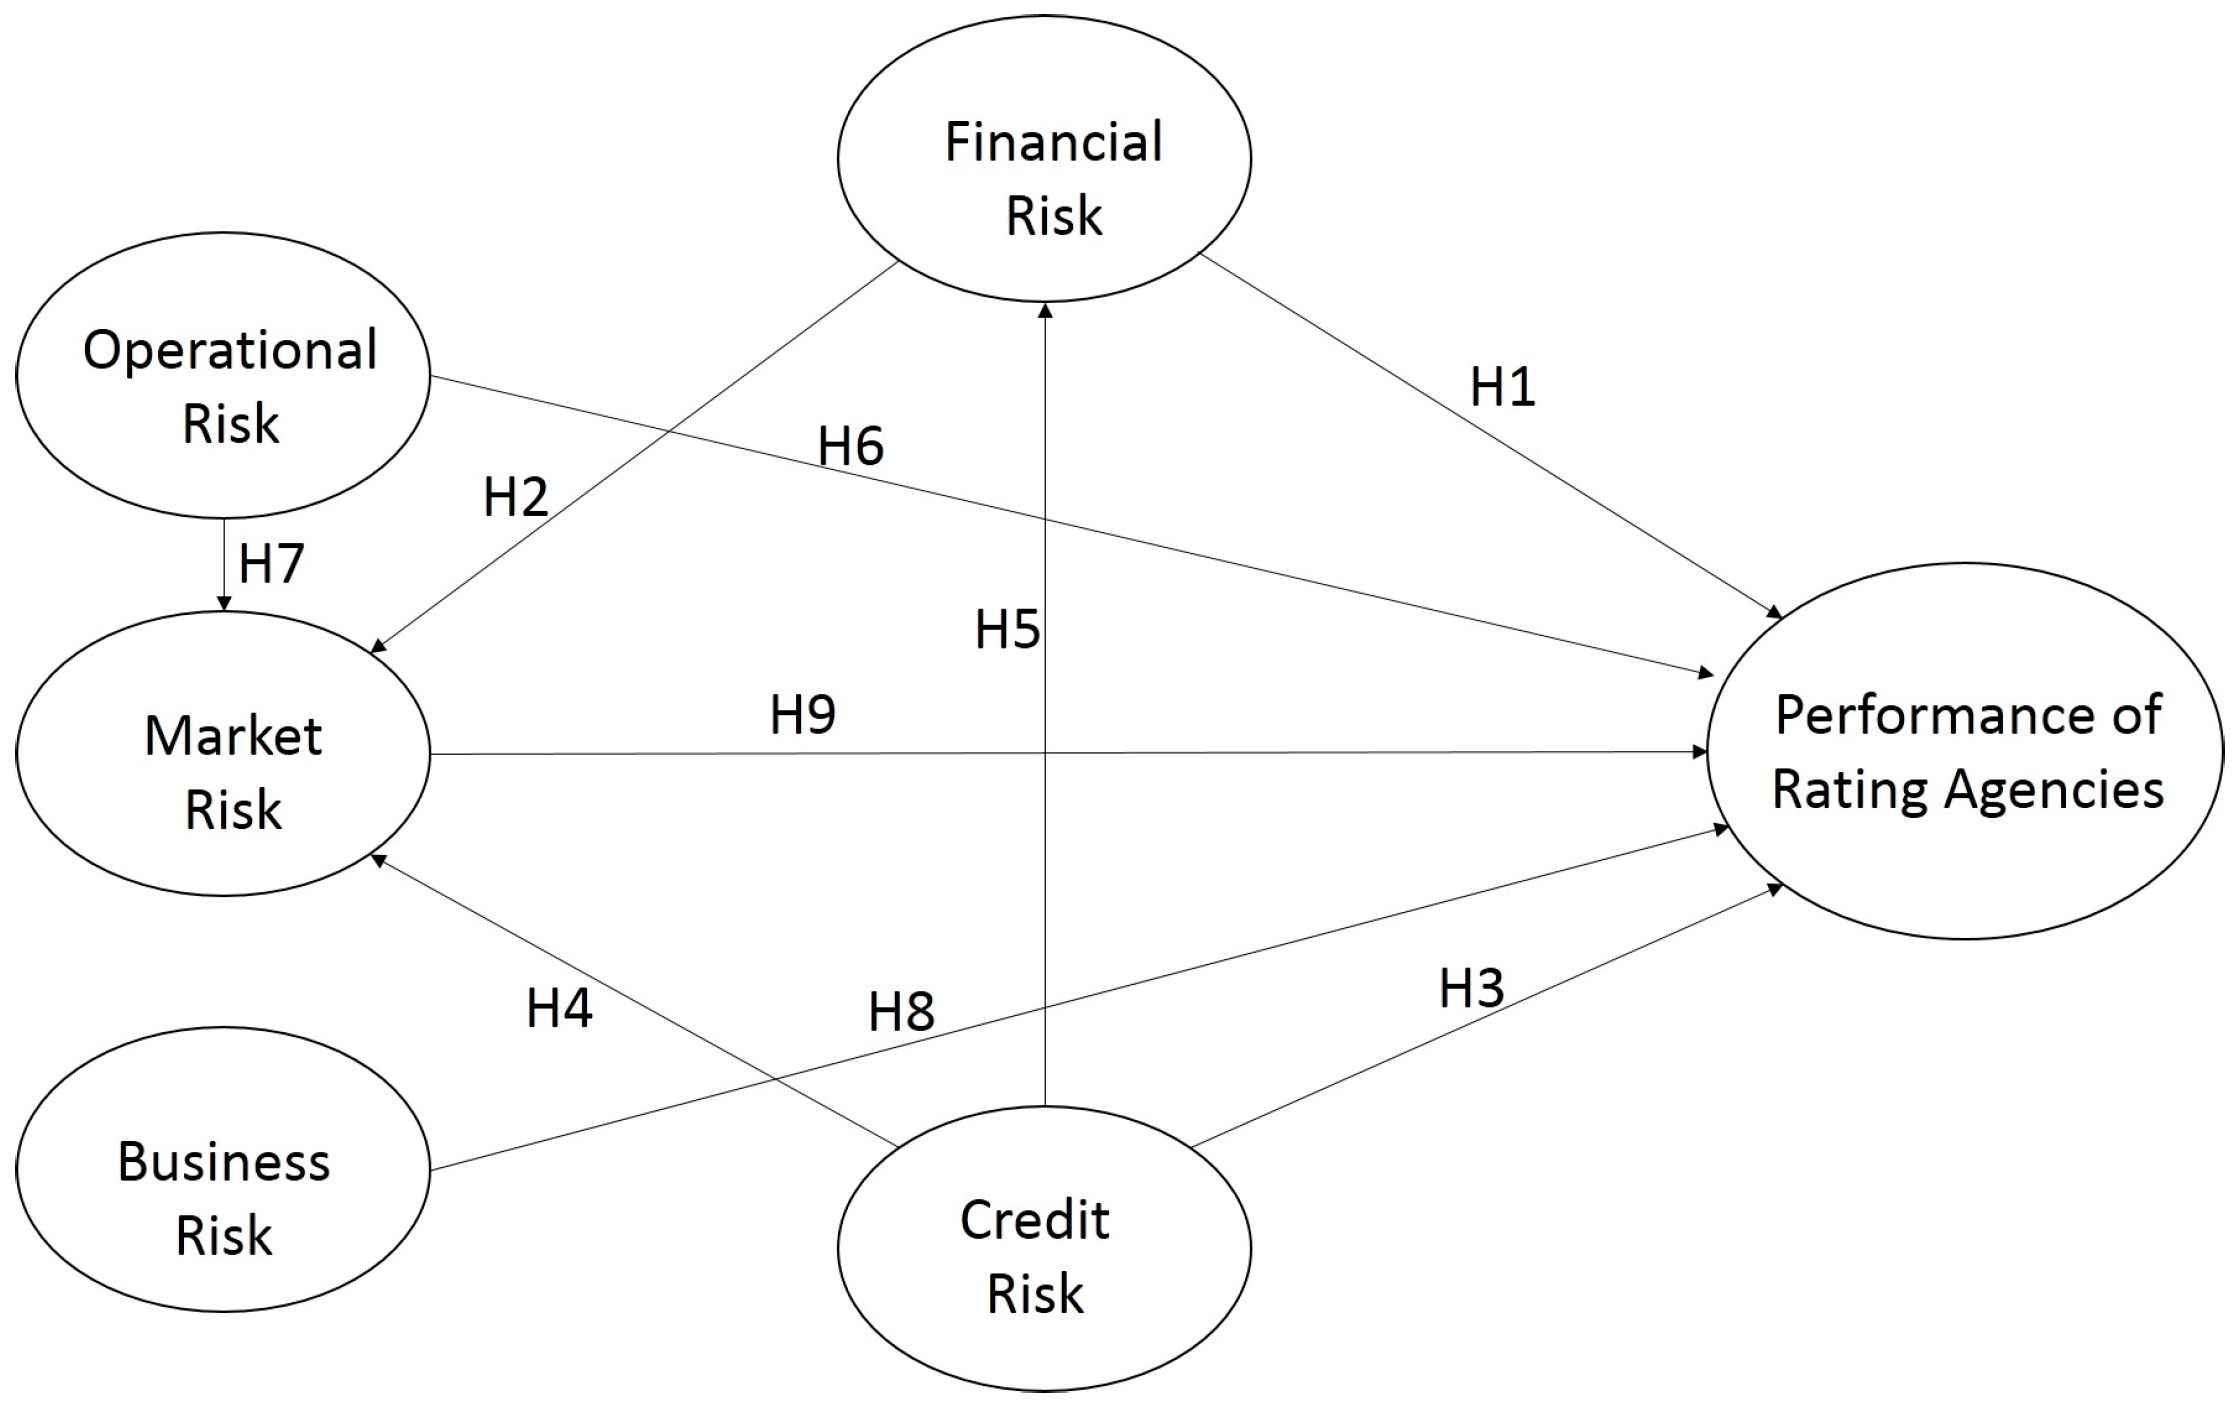
The structure of this article includes a detailed analysis of the literature review, which is summarized in a tabular format in Table 1, with a clear emphasis on the research trajectory that this article will follow, indicating the research gap identified in the literature review. The research model is depicted in Figure 1, with the five independent variables that are the focus of this study and their impact on the performance management of CRAs. This model will then be captured in the design and formulation of nine hypotheses, followed by a summary of the demographic characteristics of the respondents. The empirical findings generated with the use of partial least squares SEM will further reinforce and provide statistical reasoning and mathematical robustness to the research model.
2. Literature Review
In the fallout from the financial crisis of 2008–2009, which plagued the United States’ economy, a debate arose regarding the culpability of CRAs in creating or contributing to the crisis. Several years later, their performance and reliability are still being called into question. Our research emphasis and focus are intended to strengthen the integrity and improve the transparency of credit ratings. As part of our research, we will explore the possible options for CRAs’ rating performance by evaluating various independent variables. The independent variables mainly represent the type of risk involved in the rating and measure how the ratings help CRAs to develop and grow.
Doumpos and Zopounidis (2011) concluded that there was the potential for an outranking, multi-criteria, decision-aiding approach for credit rating that would further enhance the quality of credit rating. They thoroughly examined the usage of the accounting ratio as a variable to support this analytical approach. In similar research Khalil, Martel, and Jutras (Khalil et al. 2007) claimed that credit risk was a default function of the reimbursement capacity of the borrower (risk of default) and the risk type was mainly categorised into the risk of default and the credit risk.
Chan, Faff, Hill, and Scheule (Chan et al. 2011) used the core empirical predictions of the Boot model to confirm that the prediction of certain credit rating events is likely to be more informative than others, and that CreditWatch procedures are an important driver of such differences and provide an information advantage to investors.
Kisgen (2009) suggests that once a firm is downgraded, a firm is more likely to reduce leverage, in order to attain a previous rating target. These effects are shown to be significant at the investment grade cutoff, and also important for firms which see downgrades in their commercial paper ratings, both of which are consistent with the significance of regulations. Rating upgrades usually do not affect the subsequent capital structure activity, suggesting that firms target minimum rating levels and lowered leverage after downgrades but respond little to upgrades. Kisgen’s (2006) analysis found that credit ratings directly affect the capital structure decisions made by managers, and that firms that are close to a rating change issue approximately 1.0% less net debt relative to net equity annually as a percentage of their total assets than firms that are not near a rating change.
Adams, Rutledge, and Raynes (Adams et al. 2011) revealed that, when the correlation between the transaction and the insurer is low, the default risk to the insured bonds is lower than either the transaction or the insurer on a standalone basis. In addition, a transaction that factors in the correlation of default between the insurer and the transaction could achieve a similarly low risk of default without the additional capital, or a higher rating, from the insurer.
Mählmann (2009) examined the impact of optional Fitch ratings on the aggregate firm-level borrowing cost using a procedure that explicitly accounts for self-selection in estimating borrowing cost relations. The study also revealed the role of the expected cost of debt savings in the derived demand for optional ratings. The evidence indicated that soliciting a third Fitch rating has a negative effect on the borrowing cost and is consistent with switchers using optional ratings to minimize their borrowing costs. Further, it indicates that non-switchers do not always weigh the costs and benefits of third ratings optimally.
Salawu (2007) claimed that there are considerable factors involved in deciding on the appropriate amount of equity and debt, and the factors influencing banks’ capital structure. Credit rating, volatility of earnings and cash flow, bankruptcy or near-bankruptcy, financial distress, transaction costs, fees for issuing debt, and financial flexibility are the important factors in choosing the appropriate amount of debt. An important factor that affects banks’ choices between short- and long-term debts is matching the maturity of the debt with the life of the asset. The ownership structure and management control, growth and opportunity, profitability, issuing cost, and tax economics associated with debt are the major factors influencing the bank’s capital structure.
Kisgen (2007) examined whether companies devote considerable attention to credit ratings in designing their financial policy. At the time when companies’ fundamentals are near to prompting a rating change, corporations make financing choices between decisions to issue equity rather than debt (or to reduce debt rather than equity) that appear to be designed to avoid downgrades and to achieve upgrades. In cases in which firms are downgraded below their target ratings, they make decisions aimed at restoring those ratings.
Lui, Markov, and Tamayo (Lui et al. 2007) analysed the determinants and the informativeness of financial analysts’ risk ratings using the cross-sectional variation in risk ratings, taking into account variables that are commonly viewed as measures of risk, such as idiosyncratic risk, size, book-to-market, and leverage. Earnings-based measures of risk, such as earnings quality and accounting losses, also contribute to explaining the cross-sectional variation in risk ratings. Risk ratings can be used to predict future return volatility after controlling for other predictors of future volatility.
Dichev and Piotroski’s (2001) research claimed that the long-run stock returns following bond rating changes give no reliable abnormal returns following upgrades, whereas there are substantial abnormal negative returns following downgrades. The poor returns of downgraded firms are more pronounced for small and low-credit-quality firms.
Adelson (2007) conducted a study on the inconsistency within each agency’s rating definitions. Standard & Poor’s (S&P) rating definitions emphasize the probability of default as the key criterion. Moody’s places more emphasis on expected loss in its long-term ratings, but emphasisesthe probability of default in its short-term ratings. Livingston, Wei, and Zhou (Livingston et al. 2010) extended their research on the relative impact of Moody’s and S&P’s ratings on bond yields. The yields on split rated bonds with superior Moody’s ratings are about 8 basis points lower than the yields on split rated bonds with superior S&P ratings. Moody’s is more likely to give a conservative (or inferior) rating than S&P when these two differ. Bond investors appear to differentiate between these two ratings and assign greater weight to the ratings from the more conservative agency.
Blume, Lim, and Mackinlay (Blume et al. 1998) conducted research on the credit quality of U.S. corporate debt, which plummeted in the recent past. The decline in the level of actual bond ratings could be due to the use of more stringent rating standards in assigning ratings. In addition, it was found that accounting ratios and market-based risk measures are more informative for larger companies than smaller companies for assigning ratings.
Baestaens’s (1999) model aimed to present some practical issues in modelling the default risk of a single commercial credit counterparty from the perspective of a large retail bank. The best rating methodology is very much dependent on the segment to which it should be applied, the nature of the data (qualitative versus quantitative), the classification performance (both within sample and out-of-sample), the grade stability, and the absence of ‘black-box syndrome’ or the ease of communication towards the end-user.
Voorhees (2012) placed more emphasis on credit rating agencies and their contribution to the crisis by giving their highest ratings to poorly understood new financial instruments. The research pointed out that CRAs lacked significant accountability and oversight, and suffered from an intense conflict of interest. In the U.S., the Credit Rating Agency Reform Act and the Dodd–Frank Act now address inappropriate CRA practices, and the SEC can now fine non-compliant CRAs. Hull and White (2012) argued that the AAA ratings assigned to ABSs are not totally unreasonable, but that the AAA ratings assigned to tranches of Mezz ABS CDOs cannot be justified. An important point is that the BBB tranche of an ABS cannot be considered similar to a BBB bond for purposes of determining the risks in ABS CDO tranches.
The study by Evans, Simpsonz, Mahate, and Evans (Evans et al. 2004) showed that Japanese banks have significantly higher tier one capital ratios than European banks, as well as a higher risk rating. The net changes in equity for Japanese banks are small compared with the strongly positive net changes in equity for European banks, reflecting the greater profitability of European banks and the losses experienced by Japanese banks. The change in assets for European banks is substantially stronger, perhaps reflecting a continuation of solid lending by European banks and a slowdown in lending by Japanese banks.
O’Kane and Sen (2005) explained the credit risk spread and how to determine compensation for assuming credit risk. They examined the main credit spreads for fixed-rate bonds, floating-rate notes, and the credit default swap. He and Xiong (2012) claimed that the deterioration in debt market liquidity leads to greater risk in the liquidity premium of corporate bonds and increased credit risk, and emphasized the role of short-term debt in exacerbating rollover risk and the effects of debt market liquidity on a firm’s credit risk through its debt rollover. Schoppa (2001) revealed that both functional and non-functional parameters should be considered for credit ratings.
Haan and Amtenbrink’s (2011) research gave an insight into the overreliance of investors on credit ratings and suggested that investors should not rely on credit ratings in capital requirements. White gave an overview in his article of how to reduce the regulation of the rating agencies to reform the prudential regulation of financial institutions and bond creditworthiness information from a wider range of sources instead from CRAs. Hoti and McAleer (2004) examined the country credit rating using qualitative and quantitative information and the impact of economic, financial, and political risk on associated composite risk ratings.
Weber, Scholz, and Michalik (Weber et al. 2010) claimed that there was a correlation between companies’ environment and their financial performance. Their research provided sustainability criteria that can predict the financial performance of a debtor and improve the predictive validity of the credit rating process. The sustainability of the firm demonstrates creditworthiness as part of its financial performance.
Hull and White (2012) concluded that risk measures (CRA) are not value measures, ratings (S&P and Fitch) create the illusion of a free lunch, and the securitization that was observed is consistent with structures exploiting the criteria used by the rating agencies, whereas Brookfield and Ormrod (2000) claimed that official recognition of the rating of bonds/securities has no market-based role. In addition, Angilella and Mazzu (2015) reiterated that a multiple-criteria decision aid is appropriate in situations in which there is a lack or absence of analytic quantitative techniques for constructing judgemental credit assessment models. In their book, Zopounidis and Doumpos (2017) emphasized the importance of taking a multiple-criteria decision-making approach to streamline the discussions from different experts, formulate creative solutions, and identify the preferred alternatives.
Based on the literature survey, a comparative summary of the performance management of CRAs is tabulated in Table 1 below:
It is clear from the literature review that many studies have been performed to provide an understanding of the CRAs and their rating performance. However, there is a research gap that indicates the need to address the following questions: under which circumstances do credit ratings fail to calculate risk, how did investors overlook the risk pertaining to credit quality and the creditworthiness of ratings and their performance, which measures assisted CRAs to grow, and which factors contributed more to the financial crisis? Against this backdrop the research model, with its attendant nine Hypotheses (H1–H9) below (Figure 1), will be used to evaluate the impact of various risks on the performance management of rating agencies.
The performance management of CRAs is a conceptual way of analysing their behaviour in a given way in which certain risk factors affect the rating provided by rating agencies. This provides so-called certified bonds and securities with quality and creditworthiness in the market to attract investors. In the current scenario, the rating agencies cannot be separated from corporate bonds and securities, causing investors to look after the ratings of individual corporate bonds and securities, like providing a measure to the investor. However, in today’s scenario, in which investors are more thoughtful, carefully choosing their investment options and considering the failure of rating agencies to calculate the risk related to rated bonds and securities, rating agencies need to be prepared for the next level of rating standards by revisiting their existing way of analysing corporate bonds and securities. As part of this research, we will study the rating agencies’ performance towards the next level of rating measures. Zelmmer (2007) suggested that, to achieve this objective, it necessitates a more concerted effort in the study of market and investors’ behavioural intentions, whereas the study performed by Khalil et al. (2007) indicated that the various measures of risk would improve the quality of credit ratings. Voorhees (2012) explained how credit rating agencies contributed to the crisis by giving their highest ratings to poorly understood new financial instruments, lacking significant accountability and oversight, and suffering from intense conflicts of interest. Similarly, the risk measures proposed in this research can be applied to measure the performance of rating agencies. The latent variables that directly or indirectly affect the performance of rating agencies are operational risk (OR), business risk (BR), market risk (MR), financial risk (FR), and credit risk (CR).
Financial risk was considered as one of the measures of credit rating by rating agencies. Financial risk’s key parameters consist of accounting (liquidity, current ratio, debt equity ratio, average turnover, net profits), governance (financial projects and debt servicing capabilities), risk tolerance (the provision of security for proposed assistance and the quality of collateral security), cash flow adequacy (income growth and net cash accruals), and capital structure and adequacy, which directly or indirectly affect the ratings provided by CRAs that might eventually influence the overall performance of rating agencies.
Partnoy (2010) stated that liquidity risk is also becoming a more important part of investment decision making and that rating agencies do not cover liquidity risk as a measure to rate bonds and securities. As a result, the market for information about liquidity risk does not suffer from the same regulatory license distortions as the market for credit. He and Xiong (2012) explained that the deterioration in debt market liquidity led to greater risk in the liquidity premium in corporate bonds, credit risk, and the role of short-term debt in exacerbating rollover risk.
However, it of interest to note that extant literature, thus far, does not discuss in detail the relationship between the financial risk and the performance management of rating agencies, and how financial risk and rating agencies’ performance would help to build investor confidence in the rating of corporate bonds. Our research focuses on how rating agencies would perceive financial risk and its impact on the performance of rating agencies.
3. Hypothesis Formulation
Hypothesis 1 (H1).
There is a significant impact of financial risk on the performance of rating agencies.
Hypothesis 2 (H2).
There is a significant correlation between financial risk and market risk.
Credit risk is the risk arising from the uncertainty of an obligator’s ability to perform its contractual obligations. The corporate world is exposed to credit risk from diverse financial instruments, such as trade finance products and acceptances, foreign exchange, financial futures, swaps, bonds, options, commitments, and guarantees. Credit risk does not always occur alone, but it might always exert an impact on market risk. An increase in interest rates might damage the creditworthiness of a corporation, affecting its credit risk ability. Further, a fall in the value of a bond would have an impact on the market risk for the corporation, and therefore might affect its financial risk. As such, corporations should consider assessing credit risk and make sure that it is part of their financial risks. Firms should additionally have a risk avoidance model to identify, measure, evaluate, monitor, report, and control or mitigate credit risk on a timely basis (Monetary Authority of Singapore 2013).
Baestaens (1999) opined that the rating methodology is dependent on the industry segment, nature of the data, classification performance both within sample and out-of-sample, grade stability, and ease of communication towards the end-user. O’Kane and Sen (2005) suggested that corporations should determine the compensation for assuming the credit risk embedded within the security and the return of credit assets relative to some benchmark of higher credit quality and define, describe, and analyse the main credit spreads for fixed-rate bonds, floating-rate notes, and credit default swaps. For our research the three indicators analysed are deterioration in the credit quality of the counterparty, credit litigation and receivables collection, and the creditworthiness of the firm.
Hypothesis 3 (H3).
There is a significant impact of credit risk on the performance of rating agencies.
Hypothesis 4 (H4).
There is a significant correlation between credit risk and market risk.
Hypothesis 5 (H5).
There is a significant interrelation between credit risk and financial risk.
Corporate policy changes and restructuring, changes in the regulation of financial markets, globalization, and deregulation exert a large impact on the magnitude and nature of corporations’ operational risk. The emphasis on operational risk within firms has increased, leading regulators, auditors, and rating agencies to expand their focus. Operational risk, by far, had not received the same amount of attention as credit and market risk until recently. De Fontnouvelle, DeJesus-Rueff, Jordan, and Rosengren (De Fontnouvelle et al. 2003) suggested that operational risk has been impeded by the lack of internal or external data on operational losses. Operational losses are an important source of risk, and the capital charge for operational risk often exceeds the charge for market risk. Our study focuses on two advanced indicators—outsourcing policy and outsourcing risk.
Hypothesis 6 (H6).
There is a significant impact of operational risk on the performance of rating agencies.
Hypothesis 7 (H7).
There is a significant correlation between operational risk and market risk.
Business risk is a circumstance that might have a negative impact on the operation or profitability of a corporation. This could be the result of internal factors or external factors. Whenever the demand for the offering decreases, which could be due to a loss of business to competitors or a change in the general economic conditions, the amount of risk involved to investors will increase significantly. Ferri and Liu (2002) explained that the corporate growth potential, its capital requirements, the degree of competition in the market and industry, the productive diversification, and the ownership structure are included as business risks. Our research focuses on the integration of two specific indicators, the business continuity plan for the corporation and the downside of a country’s business environment, including the legal environment, levels of corruption, and socioeconomic variables such as income disparity.
Hypothesis 8 (H8).
There is a significant impact of business risk on the performance of rating agencies.
Market risk refers to the risk to an institution resulting from movements in market prices, in particular changes in interest rates, foreign exchange rates, credit spreads, and equity and commodity prices. Market risk often arises from other forms of financial risk, such as credit and market liquidity risks. The downgrading of the credit standing of an issuer could lead to a drop in the market value of the securities issued by that issuer. Likewise, a major sale of a relatively illiquid security by another holder of the same security could depress the price of the security. Yoshino (2003) explained that market risk is implied by the prices of different options traded in the stock market. Carson, Elyasiani, and Mansur (Carson et al. 2008) concluded that the market risk for diversified firms is smaller than that for non-diversified firms for both product and geographic diversification. In this research we analyse risk correlations and implied volatilities, the nature of the industry, the complexity of the corporate business activities, future potential internal organizational changes or external changes in market conditions, regulatory requirements, and market best practices and their trends.
Hypothesis 9 (H9).
There is significant impact of market risk on the performance of rating agencies.
4. Data Collection
A pilot survey was conducted in personal interviews with 30 respondents to obtain holistic feedback about the survey respondents’ expectations of the performance management of CRAs. The survey included both qualitative and quantitative questions for the latent constructs. Based on the feedback, the final survey questionnaire was formulated. For each latent construct, three questions (indicators) were formulated capturing the indicators that could be used in evaluating the risk and performance of rating agencies. All the reflective indicators were measured on a 5-point Likert scale for data analysis using scales from ‘strongly agree’ to ‘strongly disagree’. The second part of the survey captured the demographic details of the respondents.
The data were collected through an online survey and personal interviews. A total of 304 respondents completed the survey; 16 incomplete or otherwise unusable responses were discarded from the complete data set, leaving 288 complete and usable responses. Finally, 200 good survey responses were chosen, taking into consideration those involved in making the financial decisions in the company. A summary of the demographic characteristics of the respondents is displayed in Table 2 below.
The responses were compared based on the demographic variables of the respondents, including the number of employees in the organization, registered location of the company, annual turnover, area of employment, role in the industry, and those involved in making financial decisions to evaluate the response bias. Of the 288 respondents, 62.5% were involved in financial decision making and 79.8% were working in either upper management or middle management. In addition, 35.7% of the respondents were from finance and insurance and the remaining 64.3% were from other service sectors, like information and data services, health care, hotels, education, telecommunications, and so on. The respondents were from across the globe—33% were from the USA, 55.20% from the Asia-Pacific region, 7.6% from EMEA (Europe, the Middle East, and Africa), and the remaining 4.2% from countries including Australia, Canada, and Malaysia.
5. Results
We used the partial least squares (PLS) technique to validate the measurements and to test the hypotheses using the SmartPLS 2.0M3 software (Ringle et al. 2005). The PLS technique employs a component-based approach to model estimation and is best suited to testing complex structural models. The PLS technique was selected because it avoids problems of inadmissible solutions and factor indeterminacy (Fornell and Bookstein 1982; Lohmöller 1989; Wold 1989). The PLS technique also does not impose any normality requirements on the data. In addition, the PLS technique can be used to estimate both reflective and formative constructs (Chin 1998). We followed a two-step approach first to assess the quality of our measures using the measurement model and then to test the hypotheses using the structural model (Joreskog and Sorbom 1993).
The SmartPLS 2.0 M3 software was used for path modelling with latent variables. The tool was used to measure the validity and reliability of the constructs. SmartPLS uses the PLS technique to examine theory and measures simultaneously (Hulland 1999).
We evaluated the reliability of the research measurements using Cronbach’s alpha and composite reliability scores. Constructs are considered to be adequate when the Cronbach’s alpha scores are above the minimum recommended value of 0.6 (Hair et al. 2010; Malhotra 2010; Robinson et al. 1991) and the composite reliability scores are above the recommended cut-off of 0.7 (Gefen et al. 2000; Nunnally 1978). Composite reliability is considered to be a more rigorous estimate of reliability (Chin and Gopal 1995). As shown in Table 3, the composite reliability scores exceed 0.8 and the Cronbach’s alpha values exceed 0.69. Thus, the model can be considered as reliable.
To test the convergent validity, each item’s loading on its underlying construct should be above 0.70 (Chin et al. 2003). The average variance extracted (AVE) for each construct should also be above the minimum recommended value of 0.50 (Bagozzi and Yi 1988; Dillon and Goldstein 1984; Fornell and Larcker 1981). As observed in Table 3, the AVE values are above 0.6.
Furthermore, as shown in Table 4, the item-to-construct correlation vs. correlations with other constructs shows that the indicators are only part of the highlighted constructs and are not part of the other constructs.
The discriminant validity was investigated to indicate the extent to which the measures in the model are different from other measures in the same model. In the PLS context, the criterion for discriminant validity is that a construct should share more variance with its measures than it shares with other constructs in the given model (Hulland 1999). The discriminant validity was examined by testing the correlations between the measures of potentially overlapping constructs and must be different from unity (Anderson and Gerbing 1988). In addition, as shown in Table 5, the correlation between any two constructs should be greater than 0.7. The highest correlation between any two constructs should have a minimum recommended value of 0.60. Next, as shown in Table 6, the square root of the AVE of each construct is larger than all the cross-correlations between the construct and other constructs (Chin 1998; Fornell and Larcker 1981). These tests suggest that the discriminant validity of the measurement model is satisfactory.
Next the hypotheses were tested by examining the structural model using the SmartPLS software. The structural model includes the estimation of the path coefficients, which indicates the strength of the relationships between the independent and dependent variables. A bootstrapping resampling procedure (Davison and Hinkley 1997; Efron and Tibshirani 1993) of 200 samples was followed to determine the significance level of the paths defined within the structural model (Chatelin et al. 2002; Chin and Gopal 1995). Bootstrapping results in a larger sample, which is claimed to model the unknown population (Henderson 2005). The corresponding t-values show the level of significance using the magnitude of the standardized parameter estimates between the constructs. The 5% significance level (p < 0.05) was used as the statistical decision criterion (Cowles and Davis 1982; Fisher 1925).
The results of the structural model are summarized in Table 6.
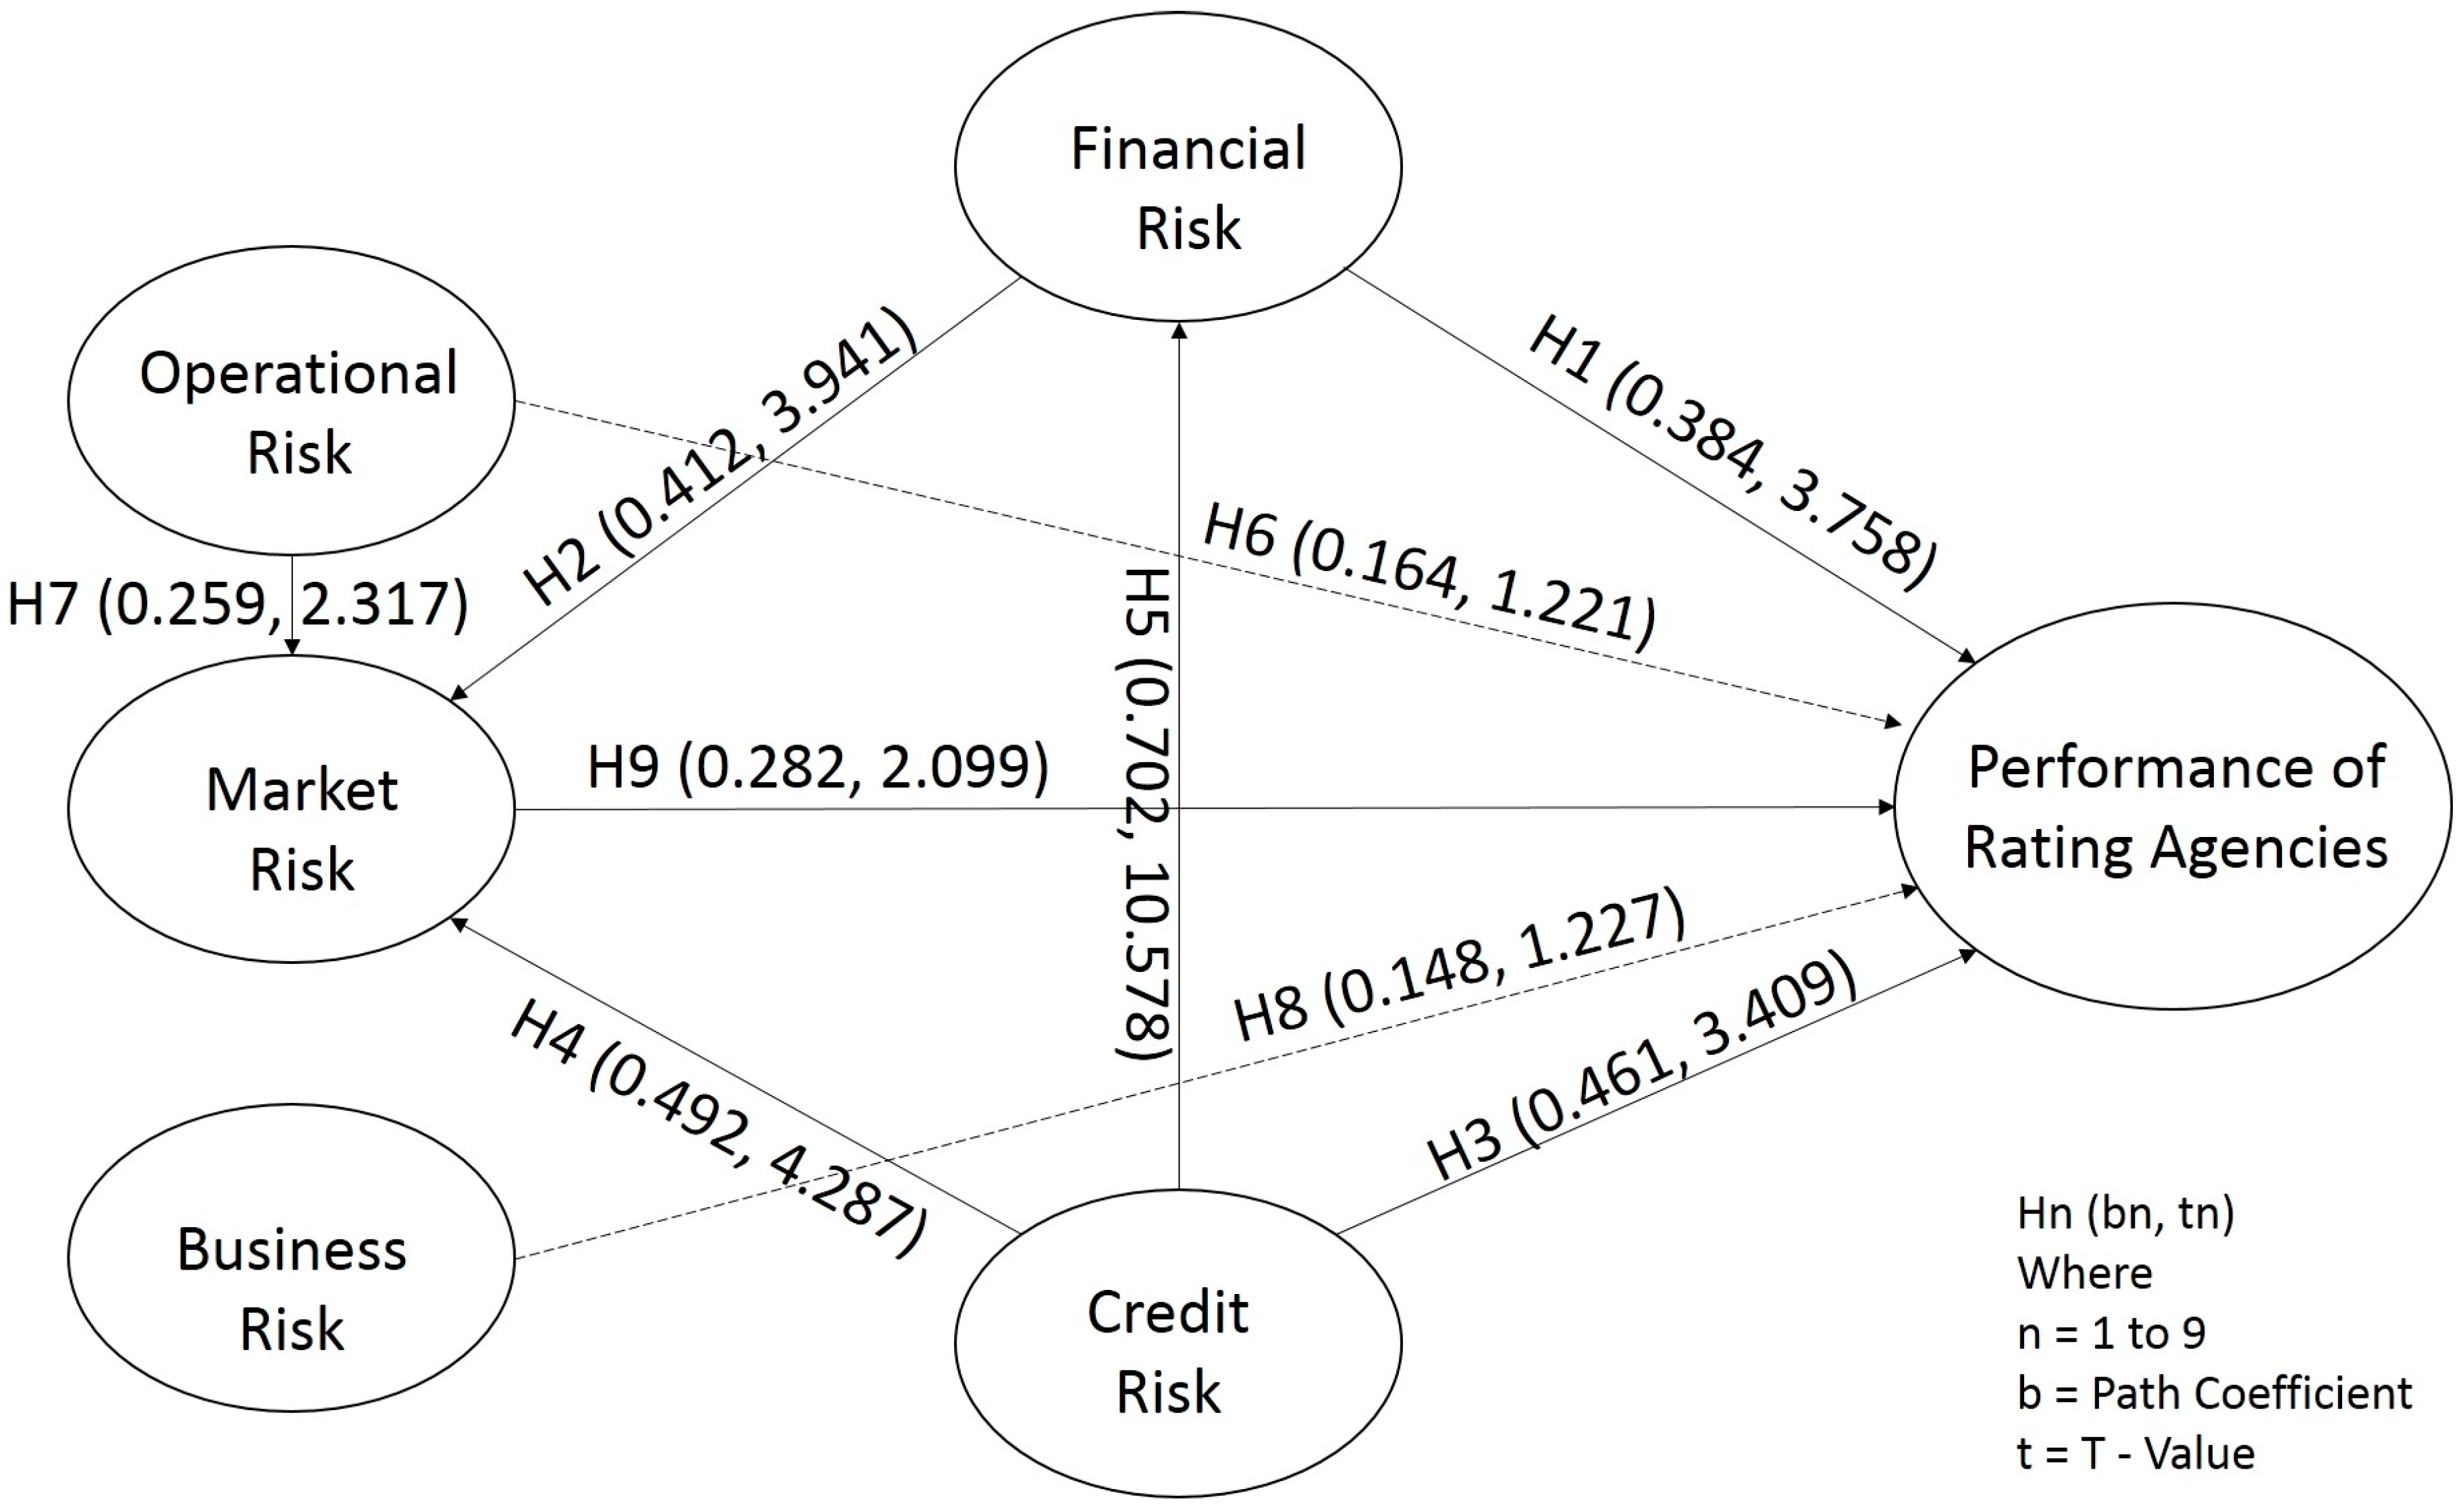
As observed above, the paths from the impact of financial risk on the performance of rating agencies (b = 0.384, p < 0.01) and the integration of financial risk with market risk (b = 0.412, p < 0.01) are significant, supporting Hypotheses (H1) and (H2), respectively. The impact of operational risk on the performance of rating agencies (b = 0.164, p > 0.1) and the impact of business risk on the performance of rating agencies (b = 0.148, p > 0.1) have insignificant paths over the performance of rating agencies, failing to support Hypotheses (H6) and (H8), respectively.
Hypotheses (H3)–(H5) are supported, because the impact of credit risk on the performance of rating agencies (b = 0.461, p < 0.01), the correlation between credit risk and market risk (b = 0.492, p < 0.01), and the interrelation between credit risk and financial risk (b = 0.702, p < 0.01) have significant positive coefficients. The results show that the correlation between operational risk and market risk (b = 0.259, p < 0.05) is significant and supports Hypothesis (H7). The above results also point out that the impact of market risk on the performance of rating agencies (b = 0.282, p < 0.05) has significant positive coefficients.
We conducted a goodness-of-fit (GoF) measure to assess our PLS path modelling (Amato et al. 2004). GoF is suggested as a global fit measure for PLS path modelling (Chatelin et al. 2002). GoF (0 < GoF < 1) is defined as the geometric mean of the average communality and average R2 (for endogenous constructs).
Following the guidelines of (Wetzels et al. 2009), we had calculated the GoF value to validate our PLS model. The GoF value for our model is 0.622 (the geometric mean of average communality is 0.610 and the average of R2 is 0.634). The GoF value for the model exceeds the minimum cut-off value of 0.36 for large effect sizes of R2. The GoF value provides adequate support to validate the PLS model (Wetzels et al. 2009). The baseline values for validating the PLS model globally are GoFsmall = 0.1, GoFmedium = 0.25, and GoFlarge = 0.36 (Akter et al. 2011).
The study centred on the performance of rating agencies and its impact on corporations while measuring various risks related to bond ratings. It focused on the factors that would be critical in designing a model for the performance management of rating agencies. As part of the research, five new factors and the ways in which they would affect the performance of rating agencies were identified. Rating agencies, including financial institutions and other financial intermediaries, can leverage the research while evaluating corporate bond ratings. They should use the research to frame the model for the performance of rating agencies and to attain a competitive edge over their competitors. Industry players should focus on introducing a correlation model for analysing the interrelation between various risks, like credit risk, which might further influence market risk and vice versa. A Nationally Recognized Statistical Rating Organization (NRSRO) and the U.S. Securities and Exchange Commission (SEC) should also consider tightening the rules and regulations for rating agencies apart from providing a license for new players in the rating market to break the ‘natural oligopoly’ of the Big Three. This research can be used to frame a model for other ratings, like a country’s sovereign rating, state ratings, financial institution ratings, and individual ratings.
The study concluded that market risk is internally correlated with credit risk, financial risk, and operational risk and has an impact on the performance management of CRAs. The impact of market risk on the performance of rating agencies is comparatively less than that of credit and financial risk but has greater importance while analysing the performance of ratings. Though market risk carries less significance than financial and credit risk, it has great importance, because it is strongly correlated with financial, credit, and operational risks.
This study further concluded that credit risk and financial risk are interrelated and significantly correlated, forming an important measure in analysing the performance of rating agencies. On the other hand, operational risk and business risk do not have a significant impact on the performance of rating agencies.
Author Contributions
The authors contribute equally to this paper.
Conflicts of Interest
The authors declare no conflicts of interest.
References
- Adams, Thomas, Ann Rutledge, and Sylvain Raynes. 2011. Joint obligation ratings in consumer ABS. Journal of Structured Finance 17: 50–54. [Google Scholar]
- Adelson, Mark H. 2007. Bond rating confusion. Journal of Structured Finance 12: 41–48. [Google Scholar] [CrossRef]
- Akter, Shahriar, John D’Ambra, and Pradeep Ray. 2011. Trustworthiness in health information services: An assessment of a hierarchical model with mediating and moderating effects using partial least squares (PLS). Journal of the American Society for Information Science and Technology 62: 100–16. [Google Scholar] [CrossRef]
- Altman, Edward I., and Herbert A. Rijken. 2004. How rating agencies achieve rating stability. Journal of Banking & Finance 28: 2679–714. [Google Scholar]
- Amato, Silvano, Vincenzo Esposito Vinzi, and Michel Tenenhaus. A global goodness-of-fit index for PLS structural equation modelling. In Proceedings of the XLII SIS Scientific Meeting, Paris, France; Volume 1, pp. 739–42.
- Anderson, James C., and David W. Gerbing. 1988. Structural equation modeling in practice: A review and recommended two-step approach. Psychological Bulletin 103: 411–23. [Google Scholar] [CrossRef]
- Angilella, Silvia, and Sebastiano Mazzu. 2015. The financing of innovative SMEs: A multicriteria credit rating model. European Journal of Operational Research 244: 540–54. [Google Scholar] [CrossRef]
- Baestaens, Dirk-Emma. 1999. Credit risk modelling strategies: The road to serfdom? International Journal of Intelligent Systems in Accounting 8: 225–35. [Google Scholar]
- Bagozzi, Richard P., and Youjae Yi. 1988. On the evaluation of structural equation models. Journal of the Academy of Marketing Science 16: 74–94. [Google Scholar] [CrossRef]
- Blume, Marshall E., Felix Lim, and Craig A. Mackinlay. 1998. The declining credit quality of U.S. corporate debt: Myth or reality? Journal of Finance 53: 1389–413. [Google Scholar] [CrossRef]
- Brookfield, David, and Phillip Ormrod. 2000. Credit agency regulation and the impact of credit ratings in the international bond market. European Journal of Finance 6: 311–31. [Google Scholar] [CrossRef]
- Carson, James M., Elyas Elyasiani, and Iqbal Mansur. 2008. Market risk, interest rate risk, and interdependencies in insurer stock returns: A system-GARCH model. Journal of Risk and Insurance 75: 873–91. [Google Scholar] [CrossRef]
- Chan, Howard, Robert Faff, Paula Hill, and Harald Scheule. 2011. Are watch procedures a critical informational event in the credit ratings process? An empirical investigation. Journal of Financial Research 34: 617–40. [Google Scholar] [CrossRef]
- Chatelin, Yves Marie, Vincenzo Esposito Vinzi, and Michel Tenenhaus. 2002. State-of-Art on PLS Modeling Through the Available Software. Jouy-en-Josas: HEC Business School. [Google Scholar]
- Chin, Wynne W. 1998. The partial least squares approach to structural equation modeling. MIS Quarterly 22: 7–16. [Google Scholar]
- Chin, Wynne W., and Abhijit Gopal. 1995. Adoption intention in GSS: Relative importance of beliefs. ACM SigMIS Database 26: 42–64. [Google Scholar] [CrossRef]
- Chin, Wynne W., Barbara L. Marcolin, and Peter R. Newst. 2003. A partial least squares latent variable modeling approach for measuring interaction effects: Results from a Monte Carlo simulation study and voice mail emotion/adoption study. Information Systems Research 14: 189–217. [Google Scholar] [CrossRef]
- Cowles, Michael, and Caroline Davis. 1982. On the origins of the.05 level of statistical significance. American Psychologist 37: 553–58. [Google Scholar] [CrossRef]
- Davison, Anthony Christopher, and David Victor Hinkley. 1997. Bootstrap Methods and Their Application. Cambridge: Cambridge University Press. [Google Scholar]
- De Fontnouvelle, Patrick, Virginia DeJesus-Rueff, John Jordan, and Eric Rosengren. 2003. Using Loss Data to Quantify Operational Risk. Working Paper, 03-5. Boston: Federal Reserve Bank of Boston. [Google Scholar]
- Dichev, Ilia D., and Joseph D. Piotroski. 2001. The long-run stock returns following bond ratings changes. Journal of Finance 56: 173–203. [Google Scholar] [CrossRef]
- Dillon, William R., and Matthew Goldstein. 1984. Multivariate Analysis: Methods and Applications. New York: Wiley. [Google Scholar]
- Doumpos, Michael, and Constantin Zopounidis. 2011. A multicriteria outranking modeling approach for credit rating. Decision Sciences Journal 42: 721–42. [Google Scholar] [CrossRef]
- Efron, Bradley, and Robert J. Tibshirani. 1993. An Introduction to the Bootstrap. New York: Chapman Hall. [Google Scholar]
- Evans, J., John Simpson, A. A. Mahate, and Robert Evans. 2004. Impact of operating and balance sheet performance of Japanese international banks on bank safety levels and risk ratings. Applied Financial Economics 14: 599–610. [Google Scholar] [CrossRef]
- Ferri, Giovanni, and Li-Gang Liu. 2002. Do global credit rating agencies think globally? Journal of Banking and Finance 25: 115–48. [Google Scholar] [CrossRef]
- Fisher, Ronald Aylmer. 1925. Statistical Methods for Research Workers. Edinburgh: Oliver and Boyd. [Google Scholar]
- Fornell, Claes, and Fred L. Bookstein. 1982. Two structural equation models: LISREL and PLS applied to consumer exit-voice theory. Journal of Marketing Research 19: 440–52. [Google Scholar] [CrossRef]
- Fornell, Claes, and David F. Larcker. 1981. Evaluating structural equation models with unobservable variables and measurement errors. Journal of Marketing Research 18: 39–50. [Google Scholar] [CrossRef]
- Gefen, David, Detmar Straub, and Marie-Claude Boudreau. 2000. Structural equation modelling techniques and regression: Guidelines for research practice. Communications of the Association for Information Systems 7: 1–78. [Google Scholar]
- Haan, Jakob de, and Fabian Amtenbrink. 2011. 278 Rating Agencies. Working Paper No. 278. Amsterdam: De Nederlandsche Bank. [Google Scholar]
- Hair, Joseph F., William C. Black, Barry J. Babin, and R. E. Anderson. 2010. Multivariate Data Analysis. A Global Perspective. Upper Saddle River: Pearson. [Google Scholar]
- He, Zhiguo, and Wei Xiong. 2012. Rollover risk and credit risk. Journal of Finance 67: 391–430. [Google Scholar] [CrossRef]
- Henderson, A. Ralph. 2005. The bootstrap: A technique for data-driven statistics. Using computer-intensive analyses to explore experimental data. Clinica Chimica Acta 359: 1–26. [Google Scholar] [CrossRef] [PubMed]
- Hoti, Suhejla, and Michael McAleer. 2004. An empirical assessment of country risk ratings and associated models. Journal of Economics Surveys 18: 539–88. [Google Scholar] [CrossRef]
- Hull, John, and Alan White. 2012. Ratings arbitrage and structured products. Journal of Derivatives 20: 80–86. [Google Scholar]
- Hulland, John. 1999. Use of partial least squares (PLS). Strategic management research: A review of four recent studies. Strategic Management Journal 20: 195–204. [Google Scholar] [CrossRef]
- Joreskog, K., and D. Sorbom. 1993. LISREL VIII Scientific Software. Chicago: Scientific Software International, Inc. [Google Scholar]
- Khalil, Jamal, Jean-Marc Martel, and Pierre Jutras. 2007. A Multicriteria System for Credit Risk Rating; Centre de Recherche Sur L’aideà L’évaluationet à la Decision Dans Les Organisations (CRAEDO). Available online: https://ideas.repec.org/p/fth/lavadm/1999-14.html (accessed on 8 September 2017).
- Kisgen, Darren J. 2006. Credit ratings and capital structure. Journal of Finance 61: 1035–72. [Google Scholar] [CrossRef]
- Kisgen, Darren J. 2007. The influence of credit ratings on corporate capital structure decisions. Journal of Applied Corporate Finance 19: 65–73. [Google Scholar] [CrossRef]
- Kisgen, Darren J. 2009. Do firms target credit ratings or leverage levels? Journal of Financial and Quantitative Analysis 44: 1323–44. [Google Scholar] [CrossRef]
- Kräussl, Roman. 2005. Do credit rating agencies add to the dynamics of emerging market crises? Journal of Financial Stability 1: 355–85. [Google Scholar] [CrossRef]
- Livingston, Miles, Jie Wei, and Lei Zhou. 2010. Moody’s and S&P ratings: Are they equivalent? Conservative ratings and split rated bond yields. Journal of Money, Credit and Banking 42: 1267–93. [Google Scholar]
- Lohmöller, Jan-Bernd. 1989. Latent Variable Path Modelingwith Partial Least Squares. Heidelberg: Physica-Verlag. [Google Scholar]
- Lui, Daphne, Stanimir Markov, and Ane Tamayo. 2007. What makes a stock risky? Evidence from sell-side analysts’ risk ratings. Journal of Accounting Research 45: 629–65. [Google Scholar] [CrossRef]
- Mählmann, Thomas. 2009. Multiple credit ratings cost of debt and self-selection. Journal of Business Finance & Accounting 36: 1228–51. [Google Scholar]
- Malhotra, Naresh K. 2010. Marketing Research: An Applied Orientation. Boston: Pearson. [Google Scholar]
- Mathis, Jerome, James McAndrews, and Jean-Charles Rochet. 2009. Rating the raters: Are reputation concerns powerful enough to discipline rating agencies? Journal of monetary economics 56: 657–74. [Google Scholar] [CrossRef]
- Monetary Authority of Singapore. 2013. Guidelines on Risk Management Practices, Credit Risk. Singapore: Monetary Authority of Singapore, December 13. [Google Scholar]
- Nunnally, Jum C. 1978. Psychometric Theory. New York: McGraw-Hill. [Google Scholar]
- O’Kane, Dominic, and Saurav Sen. 2005. Credit spreads explained. Journal of Credit Risk 1: 61–78. [Google Scholar] [CrossRef]
- Opp, Christian C., Marcus M. Opp, and Milton Harris. 2013. Rating agencies in the face of regulation. Journal of Financial Economics 108: 46–61. [Google Scholar] [CrossRef]
- Partnoy, M. 2010. Infectious Greed: How Deceit and Risk Corrupted the Financial Markets. London: Profile Books Limited. [Google Scholar]
- Ringle, C. M., S. Wende, and A. Will. 2005. Smart PLS 2.0 (M3) beta, Hamburg. Available online: http://www.smartpls.de (accessed on 8 September 2017).
- Robinson, John P., Phillip R. Shaver, and Lawrence S. Wrightsman. 1991. Criteria for Scale Selection and Evaluation. Measures of Personality Social Psychology Attitudes. San Diego: Academic Press. [Google Scholar]
- Salawu, Rafiu Oyesola. 2007. The determinants of the capital structure of financial firms in Nigeria: The financial manager’s perspectives. Global Journal of Business Research 1: 60–69. [Google Scholar]
- Schoppa, Leonard J. 2001. Japan the reluctant reformer. Foreign Affairs 80: 76–90. [Google Scholar] [CrossRef]
- Sy, Amadou N. R. 2004. Rating the rating agencies: Anticipating currency crises or debt crises? Journal of Banking & Finance 28: 2845–67. [Google Scholar]
- Sylla, Richard. 2002. An historical primer on the business of credit rating. In Ratings, Rating Agencies and the Global Financial System. New York: Springer, pp. 19–40. [Google Scholar]
- Voorhees, Ryan. 2012. Rating the raters: Restoring confidence and accountability in credit rating agencies. Journal of International Law 44: 875. [Google Scholar]
- Weber, Olaf, Roland W. Scholz, and Georg Michalik. 2010. Incorporating sustainability criteria into credit risk management. Business Strategy and the Environment 19: 39–50. [Google Scholar] [CrossRef]
- Wetzels, Martin, Gaby Odekerken-Schröder, and Claudia van Oppen. 2009. Using PLS path modeling for assessing hierarchical construct models: Guidelines and empirical illustration. MIS Quarterly 33: 177–95. [Google Scholar]
- White, Lawrence J. 2010. Credit rating agencies and the financial crisis: Less regulation of CRAs is a better response. Journal of International Banking Law and Regulation 25: 170–79. [Google Scholar]
- Wold, Herman. 1989. Introduction to the second generation of multivariate analysis. In Theoretical Empiricism. Edited by Herman Wold. New York: Paragon House, pp. vii–xl. [Google Scholar]
- Yoshino, Joe Akira. 2003. Market risk and volatility in the Brazilian stock market. Journal of Applied Economics 6: 385–403. [Google Scholar]
- Zelmmer, Mark. 2007. Reforming the Credit-Rating Process. Bank of Canada Financial System Review 2007: 51–70. [Google Scholar]
- Zopounidis, Constantin, and Michael Doumpos. 2017. Multiple Criteria Decision Making Approach—Applications in Management and Engineering. Berlin and Heidelberg: Springer International Publishing. [Google Scholar]
Figure 1.
The Research Model.

Figure 2.
Results of the partial least squares (PLS) Structural Model Analysis (SmartPLS Snapshot).
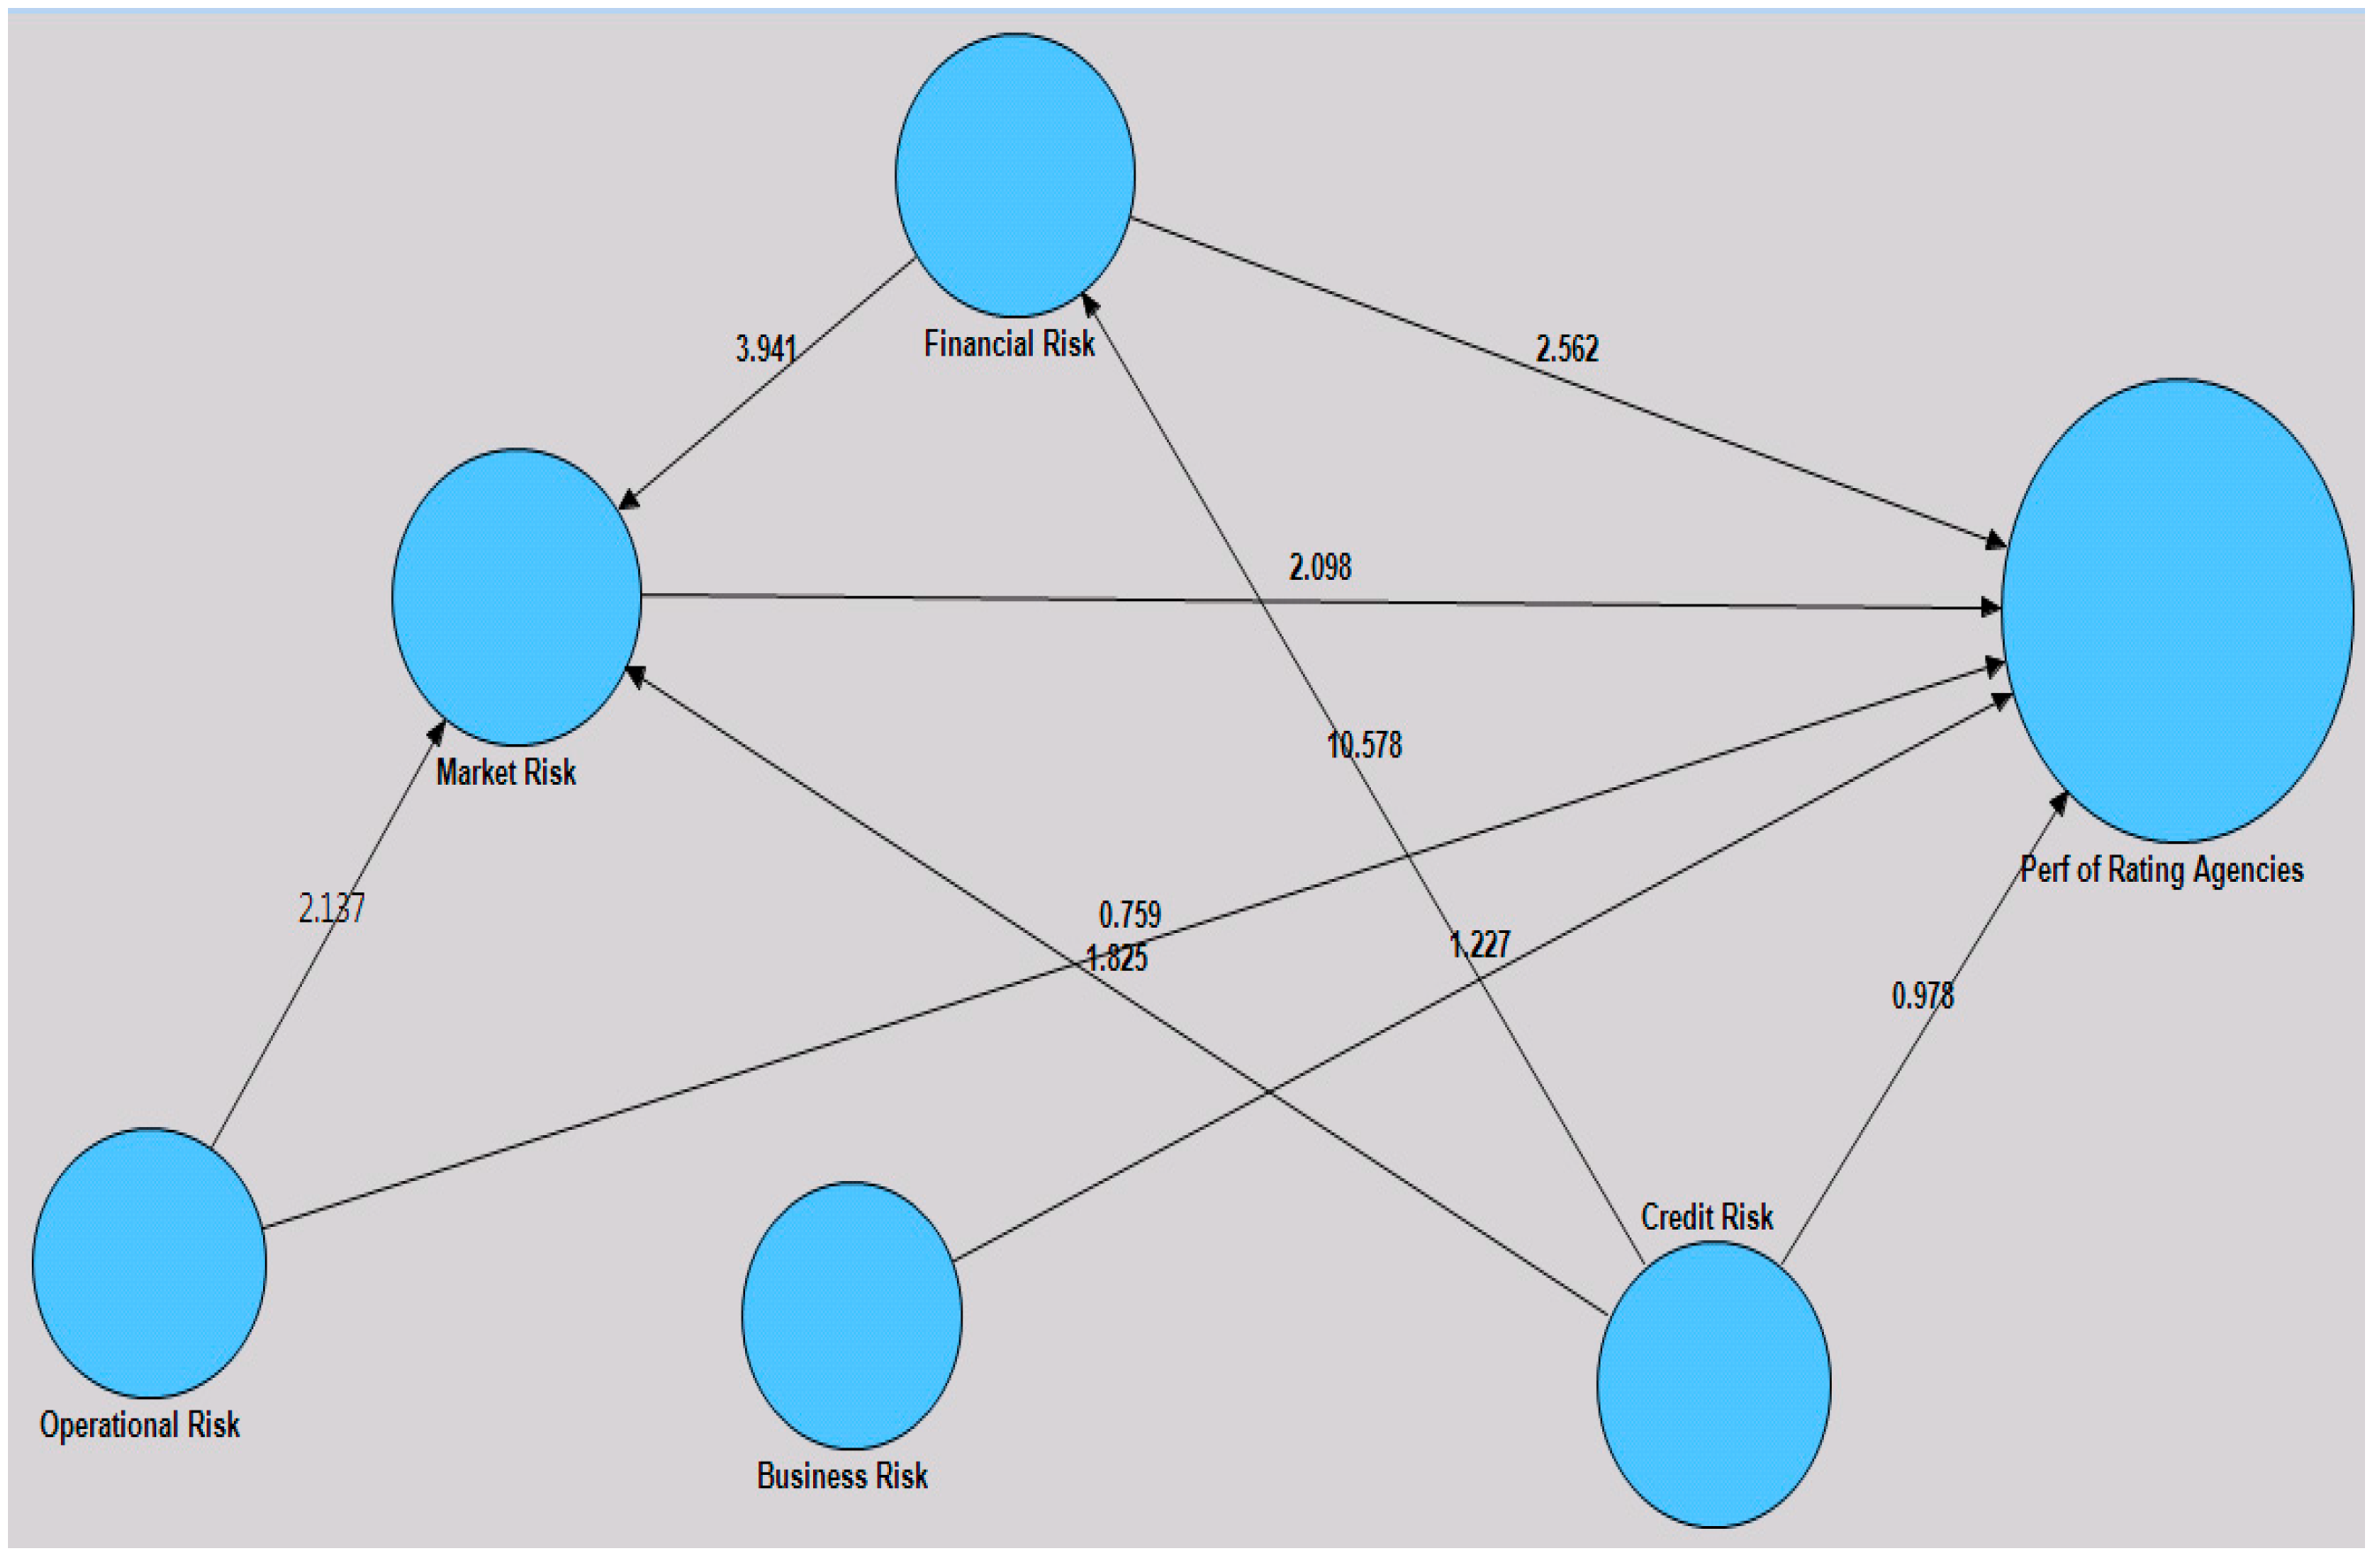
Figure 3.
Results of the PLS Structural Model Analysis.

Table 1.
Comparison of Empirical Studies on the Performance Management of Credit Rating Agencies.
| Details of the Literature in Chronological Order | Inference on the Performance of Ratings Provided by Rating Agencies | Importance of Rating Parameters to Rating Agencies’ Performance | Detailed Discussion of the Features of Each Parameter | Impact of Various Risk Measurements on Ratings by Rating Agencies |
|---|---|---|---|---|
| Rating the rating agencies: Anticipating currency crises or debt crises? (Sy 2004) | Ratings do not predict currency crises and are instead downgraded ex post. Lagged ratings and rating changes, including negative outlooks and credit watches, are useful in anticipating sovereign distress. | Crisis, default, distress, early warning systems, the probability of default, and ratings are important measures. | Yes—the discussion emphasized rating the rating agencies. | Not analysed |
| How rating agencies achieve rating stability (Altman and Rijken 2004) | Rating agencies are focused on the long term and place less weight on short-term indicators of credit quality. Rating migrations are triggered when the difference between the actual agency rating and the model-predicted rating exceeds a certain threshold level. | Rating agencies, through-the-cycle rating methodology, migration policy, credit-scoring models, and default risk are the most important parameters. | Yes—the discussion emphasized the rating stability of the rating agencies. | Not analysed |
| Do credit rating agencies add to the dynamics of emerging market crises? (Kräussl 2005) | Sovereign rating changes anticipated by market participants have a smaller impact on financial markets in emerging economies. | Credit ratings, event study, financial crises, and sovereign risk are the most important indicators. | Yes—the discussion emphasized rating agencies’ performance and its impact. | Not analysed |
| Rating the raters: Are reputation concerns powerful enough to discipline rating agencies? (Mathis et al. 2009) | Rating complex products becomes a major source of income for the CRA: too lax with a positive probability and inflates ratings with probability one when its reputation is good enough. | Credit rating agencies, conflicts of interest, and reputation are the most important measures. | Yes—the discussion emphasized rating agencies’ performance. | Not analysed |
| Rating agencies in the face of regulation (Opp et al. 2013) | Introducing rating-contingent regulation that favours highly rated securities may increase or decrease rating in-formativeness, but unambiguously increases the volume of highly rated securities. | Financial regulation, rating agencies, certification, and the Dodd–Frank Act are the most important keywords. | Yes—the discussion explains the importance of regulation of rating to improve the performance of rating agencies. | Not analysed |
| This article | Empirical studies conducted on credit ratings in the context of rating corporations and their subsequent impact on the performance of CRAs. | Our research focuses on the performance management of rating agencies and its impact on corporations by considering risk measurement as a factor to analyse. | Future development under each parameter discussed in detail that would help in designing the framework for the performance management of rating agencies. | Five risk measurement factors are identified and inference is drawn from an extensive survey using structural equation modelling (SEM). |
Table 2.
Demographic Characteristics of the Respondents.
| Demographic Characteristics of the Respondents | ||
|---|---|---|
| Survey Participants (n = 200) | ||
| Involved in Financial Decisions | Number | Percentage |
| Yes | 145 | 72.50% |
| No | 55 | 27.50% |
| Role in Industry/Occupation | ||
| Upper Management | 62 | 31.00% |
| Middle Management | 97 | 48.50% |
| Lower Management | 14 | 7.00% |
| Consultant | 15 | 7.50% |
| Researcher | 4 | 2.00% |
| Other | 8 | 4.00% |
| Total Number of Employees in the Organization | ||
| 100 or fewer | 26 | 13.00% |
| 100–500 | 38 | 19.00% |
| 500–10,000 | 82 | 41.00% |
| 10,000–50,000 | 28 | 14.00% |
| 50,000 or more | 26 | 13.00% |
| Region where the Business is Registered | ||
| America | 67 | 33.50% |
| EMEA | 15 | 7.50% |
| Asia Pacific | 110 | 55.00% |
| Other | 8 | 4.00% |
| Annual Turnover of the Organization | ||
| Less than USD 25 Million | 35 | 17.50% |
| USD 25 Million–USD 50 Million | 33 | 16.50% |
| USD 50 Million–USD 1 Billion | 91 | 45.50% |
| More than USD 1 Billion | 28 | 14.00% |
| Do Not Know | 13 | 6.50% |
| Primary Area of Employment | ||
| Education and Broadcasting | 20 | 10.00% |
| Finance, Insurance, and Rating Agencies | 72 | 36.00% |
| Health Care | 15 | 7.50% |
| Hotel and Food Services | 6 | 3.00% |
| Information—Services and Data | 25 | 12.50% |
| Telecommunications | 7 | 3.50% |
| Other | 55 | 27.50% |
Table 3.
Reliability Validation for the Latent Constructs.
| Overview | AVE | Composite Reliability | Cronbach’s Alpha | R Square | LV Index Values |
|---|---|---|---|---|---|
| Perf. of Rating Agencies | 0.610 | 0.862 | 0.787 | 0.634 | 3.689 |
| Financial Risk | 0.638 | 0.841 | 0.717 | 0.493 | 3.582 |
| Credit Risk | 0.643 | 0.844 | 0.722 | 3.528 | |
| Operational Risk | 0.808 | 0.894 | 0.763 | 3.500 | |
| Business Risk | 0.651 | 0.848 | 0.733 | 3.749 | |
| Market Risk | 0.664 | 0.855 | 0.746 | 0.588 | 3.664 |
Table 4.
Item-to-Construct Correlation vs. Correlations with Other Constructs.
| Construct | Item | Item Description | PRA | FR | CR | OR | BR | MR |
|---|---|---|---|---|---|---|---|---|
| Performance of Rating Agencies (PRA) | RAG1 | Q1: Nature of Business | 0.826 | 0.604 | 0.555 | 0.501 | 0.562 | 0.634 |
| RAG2 | Q2: Technology Upgrade | 0.757 | 0.476 | 0.436 | 0.533 | 0.574 | 0.550 | |
| RAG3 | Q3: Goodwill and its Value | 0.767 | 0.592 | 0.509 | 0.397 | 0.442 | 0.559 | |
| RAG4 | Q4: Market Capitalization | 0.772 | 0.552 | 0.502 | 0.474 | 0.476 | 0.512 | |
| Financial Risk (FR) | FRK1 | Q5: Short-Term Debt | 0.491 | 0.793 | 0.620 | 0.483 | 0.494 | 0.517 |
| FRK2 | Q6: Non-performing Assets | 0.590 | 0.798 | 0.573 | 0.430 | 0.460 | 0.540 | |
| FRK3 | Q7: Future Development and R&D | 0.623 | 0.806 | 0.494 | 0.542 | 0.590 | 0.644 | |
| Credit Risk (CR) | CRK1 | Q8: Relevant Dimensions of Credit Risk | 0.533 | 0.583 | 0.809 | 0.521 | 0.469 | 0.545 |
| CRK2 | Q9: Credit Quality of the Counterparty | 0.531 | 0.579 | 0.809 | 0.445 | 0.446 | 0.544 | |
| CRK3 | Q10: Creditworthiness of the Corporation | 0.477 | 0.522 | 0.786 | 0.486 | 0.428 | 0.464 | |
| Operational Risk (OR) | ORK1 | Q11: Strategic and Operational Decisions | 0.568 | 0.595 | 0.551 | 0.913 | 0.613 | 0.617 |
| ORK2 | Q12: Cost and Operational Efficiency | 0.525 | 0.491 | 0.533 | 0.884 | 0.553 | 0.512 | |
| Business Risk (BR) | BRK1 | Q13: Business Continuity Plan | 0.540 | 0.539 | 0.495 | 0.607 | 0.805 | 0.566 |
| BRK2 | Q14: Country’s Business Environment | 0.569 | 0.511 | 0.450 | 0.485 | 0.811 | 0.618 | |
| BRK3 | Q15: Greater Importance to Business Risk | 0.477 | 0.512 | 0.404 | 0.479 | 0.805 | 0.561 | |
| Market Risk (MR) | MRK1 | Q16: Risk Correlations and Implied Volatilities | 0.652 | 0.584 | 0.520 | 0.514 | 0.600 | 0.846 |
| MRK2 | Q17: Complexity of the Corporate Business | 0.595 | 0.542 | 0.484 | 0.553 | 0.588 | 0.827 | |
| MRK3 | Q18: Internal or External Factors in the Market | 0.517 | 0.615 | 0.583 | 0.476 | 0.579 | 0.770 |
Note: The highlighted boldface numbers are the item loadings on the constructs.
Table 5.
Reliability and Inter-Construct Correlations for the Reflective Scales.
| Construct | PRA | FR | CR | OR | BR | MR |
|---|---|---|---|---|---|---|
| PRA | 0.781 | |||||
| FR | 0.713 | 0.799 | ||||
| CR | 0.642 | 0.702 | 0.802 | |||
| OR | 0.609 | 0.608 | 0.603 | 0.899 | ||
| BR | 0.659 | 0.646 | 0.559 | 0.650 | 0.807 | |
| MR | 0.724 | 0.711 | 0.648 | 0.632 | 0.723 | 0.815 |
Note: boldface numbers mean the correlation between any two constructs should be greater than 0.7.
Table 6.
Summary of the Hypothesis Tests.
| Hyp. No. | Hypothesis | Path Coefficient (b) | Mean (M) | Standard Deviation (SD) | Standard Error (SE) | T-Value (t) | Significance (One-Tailed) | Supported? |
|---|---|---|---|---|---|---|---|---|
| H1 | FR->PRA | 0.384 | 0.390 | 0.102 | 0.102 | 3.758 | p < 0.01 | Yes |
| H2 | FR->MR | 0.412 | 0.410 | 0.105 | 0.105 | 3.941 | p < 0.01 | Yes |
| H3 | CR->PRA | 0.461 | 0.450 | 0.135 | 0.135 | 3.409 | p < 0.01 | Yes |
| H4 | CR->MR | 0.492 | 0.476 | 0.115 | 0.115 | 4.287 | p < 0.01 | Yes |
| H5 | CR->FR | 0.702 | 0.705 | 0.066 | 0.066 | 10.578 | p < 0.01 | Yes |
| H6 | OR->PRA | 0.164 | 0.168 | 0.135 | 0.135 | 1.221 | NS | No |
| H7 | OR->MR | 0.259 | 0.279 | 0.121 | 0.121 | 2.137 | p < 0.05 | Yes |
| H8 | BR->PRA | 0.148 | 0.161 | 0.120 | 0.120 | 1.227 | NS | No |
| H9 | MR->PRA | 0.282 | 0.265 | 0.134 | 0.134 | 2.099 | p < 0.05 | Yes |
| Significance Value | p < 0.1 | 1.650 | ||||||
| p < 0.05 | 1.968 | |||||||
| p < 0.01 | 2.592 |
© 2017 by the authors. Licensee MDPI, Basel, Switzerland. This article is an open access article distributed under the terms and conditions of the Creative Commons Attribution (CC BY) license (http://creativecommons.org/licenses/by/4.0/).
Share and Cite
MDPI and ACS Style
Seetharaman, A.; Kumar Sahu, V.; Saravanan, A.S.; Rudolph Raj, J.; Niranjan, I. The Impact of Risk Management in Credit Rating Agencies. Risks 2017, 5, 52. https://doi.org/10.3390/risks5040052
AMA Style
Seetharaman A, Kumar Sahu V, Saravanan AS, Rudolph Raj J, Niranjan I. The Impact of Risk Management in Credit Rating Agencies. Risks. 2017; 5(4):52. https://doi.org/10.3390/risks5040052
Chicago/Turabian StyleSeetharaman, A., Vikas Kumar Sahu, A. S. Saravanan, John Rudolph Raj, and Indu Niranjan. 2017. "The Impact of Risk Management in Credit Rating Agencies" Risks 5, no. 4: 52. https://doi.org/10.3390/risks5040052
Note that from the first issue of 2016, this journal uses article numbers instead of page numbers. See further details here.