
Interactive Graph Layout of a Million Nodes

1
Department of Computer Science, Virginia Tech, Blacksburg, VA 24060, USA
2
Department of Computer and Information Science, University of Massachusetts Dartmouth, Dartmouth, MA 02747, USA
3
The Boeing Company, 3455 Airframe Dr, North Charleston, SC 29418, USA
*
Author to whom correspondence should be addressed.
Informatics 2016, 3(4), 23; https://doi.org/10.3390/informatics3040023
Submission received: 30 August 2016
/
Revised: 12 December 2016
/
Accepted: 14 December 2016
/
Published: 20 December 2016
(This article belongs to the Special Issue Information Visualization for Massive Data)
Abstract
:Sensemaking of large graphs, specifically those with millions of nodes, is a crucial task in many fields. Automatic graph layout algorithms, augmented with real-time human-in-the-loop interaction, can potentially support sensemaking of large graphs. However, designing interactive algorithms to achieve this is challenging. In this paper, we tackle the scalability problem of interactive layout of large graphs, and contribute a new GPU-based force-directed layout algorithm that exploits graph topology. This algorithm can interactively layout graphs with millions of nodes, and support real-time interaction to explore alternative graph layouts. Users can directly manipulate the layout of vertices in a force-directed fashion. The complexity of traditional repulsive force computation is reduced by approximating calculations based on the hierarchical structure of multi-level clustered graphs. We evaluate the algorithm performance, and demonstrate human-in-the-loop layout in two sensemaking case studies. Moreover, we summarize lessons learned for designing interactive large graph layout algorithms on the GPU.
1. Introduction
Graphs are commonly used to depict complex relations among objects. Graph drawing offers solutions to geometrically represent graphs, with the intention of improving their readability. This supports applications and analysis in various domains, such as social network analysis (e.g., [1,2]), cyber security (e.g., [3]), and intelligence analysis (e.g., [4,5]).
However, with the increasing size and complexity of graph data, the performance of drawing large graphs, especially those with millions of nodes, is still a significant challenge. Furthermore, user interaction with the graph layout becomes increasingly more critical to support sensemaking tasks (e.g., [2,6]) in the presence of large graph data. Many graph drawing algorithms have been proposed in the last few decades. However, many of them ( [7,8]) focus on relatively small graphs (e.g., graphs with hundreds of nodes) or certain types of graphs (e.g., trees or planar graphs). Existing large graph layout algorithms emphasize static graph layout results either based on their structures [9] or semantic meanings [10]. They focus on generating static and visually pleasing results, but their layouts are constrained by their predefined aims. Thus, these algorithms are limited in their support for interactive sensemaking tasks with large graphs.
In this paper, we argue that enabling direct manipulation and real-time interaction are essential to support knowledge discovery and sensemaking activities with large graphs. Static graph layouts may not meet the need to reveal multiple perspectives of a graph. If there is not a clear definition of the best graph layout, users will need to explore the graph and interact with the layout to find meaningful information. In some cases, users interactive feedback can alter graph layout properties, such as modifying edge weights [11] or expanding subgraphs [2], leading to the need for incremental layouts that dynamically respond to users’ sensemaking activities. We highlight human interactions on a large graph layout, which support user exploration of unexpected knowledge from large graphs.
Thus, we are not overly concerned about the initial layout time, which could be preprocessed. Rather, we are focusing on the interactive update process that occurs when users are interacting with the large graph after it has already been initially displayed. We therefore stress that the performance of the interactive graph layout computation should be optimized for single iteration speed, rather than total batch completion speed, for the purpose of handling real-time feedback and human intervention that can interrupt or interplay with layout computation.
To this end, we focus on optimizing a force-direct algorithm based on the spring-electrical model [12]. This model depicts the graph drawing problem as a physical system, where the spring-like attractive forces are generated by each edge, and each charged node repels others via electrical force. Since it iteratively calculates the position of each node, this algorithm has the inherent ability to dynamically incorporate user interactions into the ongoing automatic layout process. During the iterations of the algorithm, users can flexibly select, drag, and pin nodes to modify the layout results. However, this algorithm does not scale well with respect to the size of graphs, and it suffers from poor performance even on moderate-sized graphs.
Similar to the N-body problem, the bottleneck of this algorithm lies in the repulsive force calculation [13]. Many solutions have been proposed to replace computing the exact repulsive forces between all pairs of nodes with some approximated calculations. A common heuristic is that if two nodes are far away from each other, the repulsive force between them can be ignored or approximated. Thus, a spatial indexing structure needs to be built and updated to describe the spatial relationships among nodes in each iteration. For example, Godiyal et al. [14] proposed a method combining CPU and GPU to construct a balance k-d tree, while Burtscher et al. [15] gave a GPU based octree implementation. However, building and traversing hierarchical structures can be computationally expensive for large graphs.
In this paper, we contribute a new algorithmic solution to speed up repulsive force calculation, which can enable human-in-the-loop layout updates of large graphs. As shown in Figure 1, users can interact with a very large graph layout using our method. To achieve this, we calculate approximate repulsive forces based on the graph structure, rather than on the spatial distribution of nodes. The benefit of our algorithm, compared to previous accelerated methods, is that we avoid building, traversing, and updating a spatial indexing structure. To further improve performance, we design a novel parallel force-directed graph layout algorithm that utilizes the massive computational power of GPUs to achieve real-time frame-rates that support human interaction. Moreover, our algorithm can be integrated into the multi-level graph layout paradigm, which relieves the local minimum problem, to generate visually pleasing results.
As a proof of concept, we demonstrate our algorithm with a few simple types of human interaction, such as dragging nodes, without loss of generality. Our method can be utilized in visual analytics systems to support many different kinds of dynamic interactions with large graph layouts.
2. Related Work
In this section, we review large graph layout algorithms, and focus on force-directed algorithms and GPU based methods.
2.1. Large Graph Layout
Hachul et al. [9] survey existing solutions to large graph layout considering two aspects: aesthetics and performance. They suggest that certain force-directed layout algorithms can generate pleasing layouts for most tested graphs. Several recent papers, including [14,16,17], present advanced large graph layout techniques based on force-directed algorithms (e.g., [12,18,19,20]).
Another strategy to layout large graphs is based on linear algebra, rather than physical simulation, such as [21,22]. However, these algorithms are designed to work on a few specific types of graphs. In addition, linear algebra based methods cannot be easily integrated with human interactions.
Beyond these, a variety of other large graph drawing algorithms have been investigated. For example, Muelder et al. [23] present a treemap based approach; Wong et al. [24] use a space-filling fractal curve to layout graph nodes; and Khoury et al. [25] propose a layout algorithm that simplifies matrix computations based on linear-algebraic properties. However, these works focus on generating static visual representations of large graphs, so it is difficult to interactively change their layouts for analytical purposes (e.g., pin some interesting nodes and drag certain parts of the graph).
2.2. Force-Directed Algorithms
Force-directed algorithms are commonly used to support visual analysis of graphs, because they are conceptually simple and able to produce aesthetically pleasing layouts. These algorithms are also called energy-based methods, since they seek to minimize the net force on all vertices. Many practical algorithms have been proposed (see [26] for details).
The spring-electrical model [12] is a popular force-directed layout algorithm, which generates graph layouts based on two types of forces: attractive force and repulsive force. This algorithm cannot handle large graphs well. The complexity of calculating repulsive force is , where N denotes number of nodes in the graph. For a graph with a million nodes, each iteration of repulsive force calculation requires tera-scale computations. This is beyond the processing power of a typical consumer desktop CPU. To improve performance, a natural approach is to compute approximated forces with some heuristic methods, instead of striving for the optimal solution. Fruchterman et al. [12] propose a grid-variant algorithm that accelerates repulsive force computation by splitting nodes into grids. Based on the Barnes-Hut Tree [27], a tree structure is used to speed up repulsive force calculation by grouping distant nodes as a super node ([17,28]). Moreover, [14,29] propose the Fast Multiple Method (FMM [13]) to accelerate repulsive force computation.
In addition to the performance issue, another problem with the spring-electrical model is local minimum configurations of a large graph layout, particularly when randomizing the initial layout. A multi-level approach can overcome this limitation ([17,30,31]). A sequence of successive smaller graphs are generated by graph coarsening and partitioning techniques to simplify the topology. Global optimal layout is obtained from a small graph, which is then used as a starting layout for the next level, until the finest graph layout has been achieved. Bartel et al. [32] summarize the multi-level layout paradigm in three phases: coarsening, placement, and single level layout. They conclude that there is no clear winning combination, since different coarsening, placement and layout algorithms have different attributes.
2.3. Graph Layout on the GPU
GPUs were designed for video games and graphics. The remarkable advances in performance and programmability make GPUs popular for general purpose computation [33]. GPUs have been shown to produce rapid speed-ups in even straightforward implementations of the repulsive force calculations in force-directed graph layout [34,35]. Godiyal et al. [14] present a parallel FMM algorithm on the GPU, and use a k-d tree structure for describing nodes’ spatial distribution. Yunis et al. [29] extend a parallel FMM algorithm to multiple GPUs. Moreover, Tikhonova et al. [36] propose a scalable parallel force-directed layout algorithm in distributed computing environments. Frishman et al. [16] apply the multi-level method to GPU based graph layout algorithms.
In this paper, we aim at applying the spring-electrical model based force-directed layout algorithm to large graphs, wherein users can interact with graph layouts to perceive and explore meaningful information. To our knowledge, existing acceleration techniques cannot achieve interactive performance on very large graphs (specifically those with millions of nodes) to support real-time exploratory interactions. Furthermore, existing work focuses on evaluating performance based on total convergence time, whereas we are more interested in individual iteration time so as to support human interaction during the algorithm run. We contribute a GPU based approximated force-directed layout algorithm, which achieves real-time human interactions on large graphs.
3. Algorithm Outline
In this section, we address the challenges of the spring-electrical model for large graph layout from two key perspectives: performance and result quality. We propose a new approximation algorithm for repulsive force, which intertwines with the multi-level approach.
3.1. Approximation of The Repulsive Force
Both Barnes-Hut Tree [27] and FMM [13] methods calculate approximated repulsive force based on node distribution, and a spatial indexing structure is built and updated in each iteration. To avoid these stages, we propose to use graph topology to approximately calculate repulsive forces. If two nodes belong to two different graph clusters, they are “far away” from each other, and we use their inter-cluster repulsive force for approximation. In total, repulsive forces have two components: internal-electric-force and external-electric-force. The internal-electric-force refers to the repulsive force between pairs of nodes within the same cluster, and the external-electric-force is the inter-cluster repulsive force. The internal-electric-force is used to obtain the local structure of a graph, while the external-electric-force is used for capturing the overview of a graph.
Given an undirected graph , we first use a multi-level coarsening or clustering algorithm to generate serially successive coarser graphs (), where each (super)node in the next upper level represents a cluster of nodes in its lower level. Figure 2 shows a two-level graph, and the original graph is coarsened based on its topology structure. In the picture, the left graph is a lower level graph, and the right graph is a upper level graph. To compute the repulsive forces on all nodes, we begin at the coarsest graph and work our way down. Each node’s total repulsive force in level i with graph is computed as the sum of the external-electric-forces inherited from graph plus the sum of the internal-electric-forces within its parent cluster.
Thus, we calculate the internal-electric-forces at each level of the graph and pass the total repulsive forces down to the next level as external-electric-forces until we reach the finest level of the graph . This strategy accumulates the approximated total repulsive forces for each node in a logarithmic hierarchical fashion. Finally, we add the attractive force to the approximated repulsive force of the finest level graph and update each node’s position.
Therefore, the complexity of computing the repulsive forces is the complexity of computing internal-electric-forces for a single cluster times the total number of clusters processed. Assuming that the total number of nodes is N, a graph is evenly partitioned into clusters with P nodes. We have number of clusters in the finest level graph , which equals the number of nodes in the next upper level graph . Graph , then has clusters. In summary, the total number of clusters is . The complexity of internal-electric-forces is for a single cluster. So the total repulsive force complexity is . Adding the attractive force, the total complexity is , where E is the number of edges in the graph, and .
However, a graph cannot always be evenly partitioned based on its topology, such as in cases involving scale-free networks where the node degree distribution follows a power law. Different sizes of graph clusters are generated when we apply graph partition algorithms to these kinds of graphs. As a result, the value of P varies for different clusters. We may constrain the size of P to generate graph clusters with the same size. However, we cannot generate the graph structure well if we evenly partition it. In our work, the value of P is depended on the graph type, and we have no constrained value of P. Thus, the actual performance is highly impacted by graph type, and we discuss these details in Section 5.2.
3.2. Multi-Level Approach
Beyond the expensive force computation, another challenge of force-directed layout algorithms is the potential sub-optimal result for large graphs. Various multi-level approaches have been proposed to address this challenge. Bartel et al. [32] present a survey of graph clustering algorithms based on graph topology (e.g., edge collapse, independent set merger, solar merger, etc.). Frishman et al. [16] propose a spectral based graph partitioning algorithm, and Muelder et al. [23] discuss a modularity based hierarchy cluster algorithm. We propose our above approximated repulsive force computation algorithm to weave into the multi-level paradigm for big graph layout.
In this paper, we adopt the solar merger algorithm to build multi-level graphs. The solar merger is introduced by Hachul et al. [37] in their fast multiple multi-level method (), where each sub-graph is simulated as a solar system. Each node of a sub-graph is classified as sun, planet or moon. The solar system collapses a sub-graph into the sun node of the next level graph. Since a sun node is always the center of a sub-graph, it can represent all nodes within its sub-group for repulsive force computation.
In the placement stage, we keep the positions of all parent nodes and initialize their child nodes along a circle, the center of which is their parent node. This design is based on the solar system where child nodes are either planet nodes or moon nodes. After this, we apply our approximated force-directed layout method by traversing graphs from the top level to the bottom. In summary, the three steps of our multi-level graph layout algorithm are as follows:
- Coarsening: We use the solar merger [37] to generate a sequence of graphs , , …, , where the maximum number of nodes in the coarsest is 50. Note that this hierarchical structure is strictly preprocessed, and does not need to be updated over time.
- Placement: To initialize the layout for the next level graph, we keep the sun node’s position and assign its child nodes along a circle around it.
- Layout: We use our approximated force-directed layout algorithm to update graph layout of each level. We parallelize our algorithm to achieve real-time interactions for graphs with millions of nodes.
The multi-level scheme is used for obtaining high quality results, and reducing the number of iterations. However, the performance of a single iteration for force computation is crucial for human interaction with large graph layout. The GPU based approximated force-directed algorithm is the key to satisfy the demand of interactivity. In other words, any graph layout algorithm can be applied to obtain the initial pre-processed graph layout, and then our interactive GPU graph layout algorithm is deployed for dynamically updating graph layout on the fly. In summary, we generate a sequence of coarsened graphs in the CPU, and then apply the node placement and layout algorithms on the GPU to speed up performance.
4. GPU Implementation
This section describes how the GPU is utilized to accelerate the approximated force-directed layout algorithm. We begin our discussion with a GPU friendly data structure for the multi-level graphs, and then we discuss our GPU parallel force-directed algorithm design.
4.1. Data Storage
There are two common types of data structures used to represent a graph: adjacency matrix and adjacency list. Compared with the adjacency list, the adjacency matrix suffers scalability issues for large graphs. Thus, we use a modified adjacency list, which is similar to the compressed sparse row (CSR) format used by [14]. We extend the modified adjacency list to organize multi-level graphs.
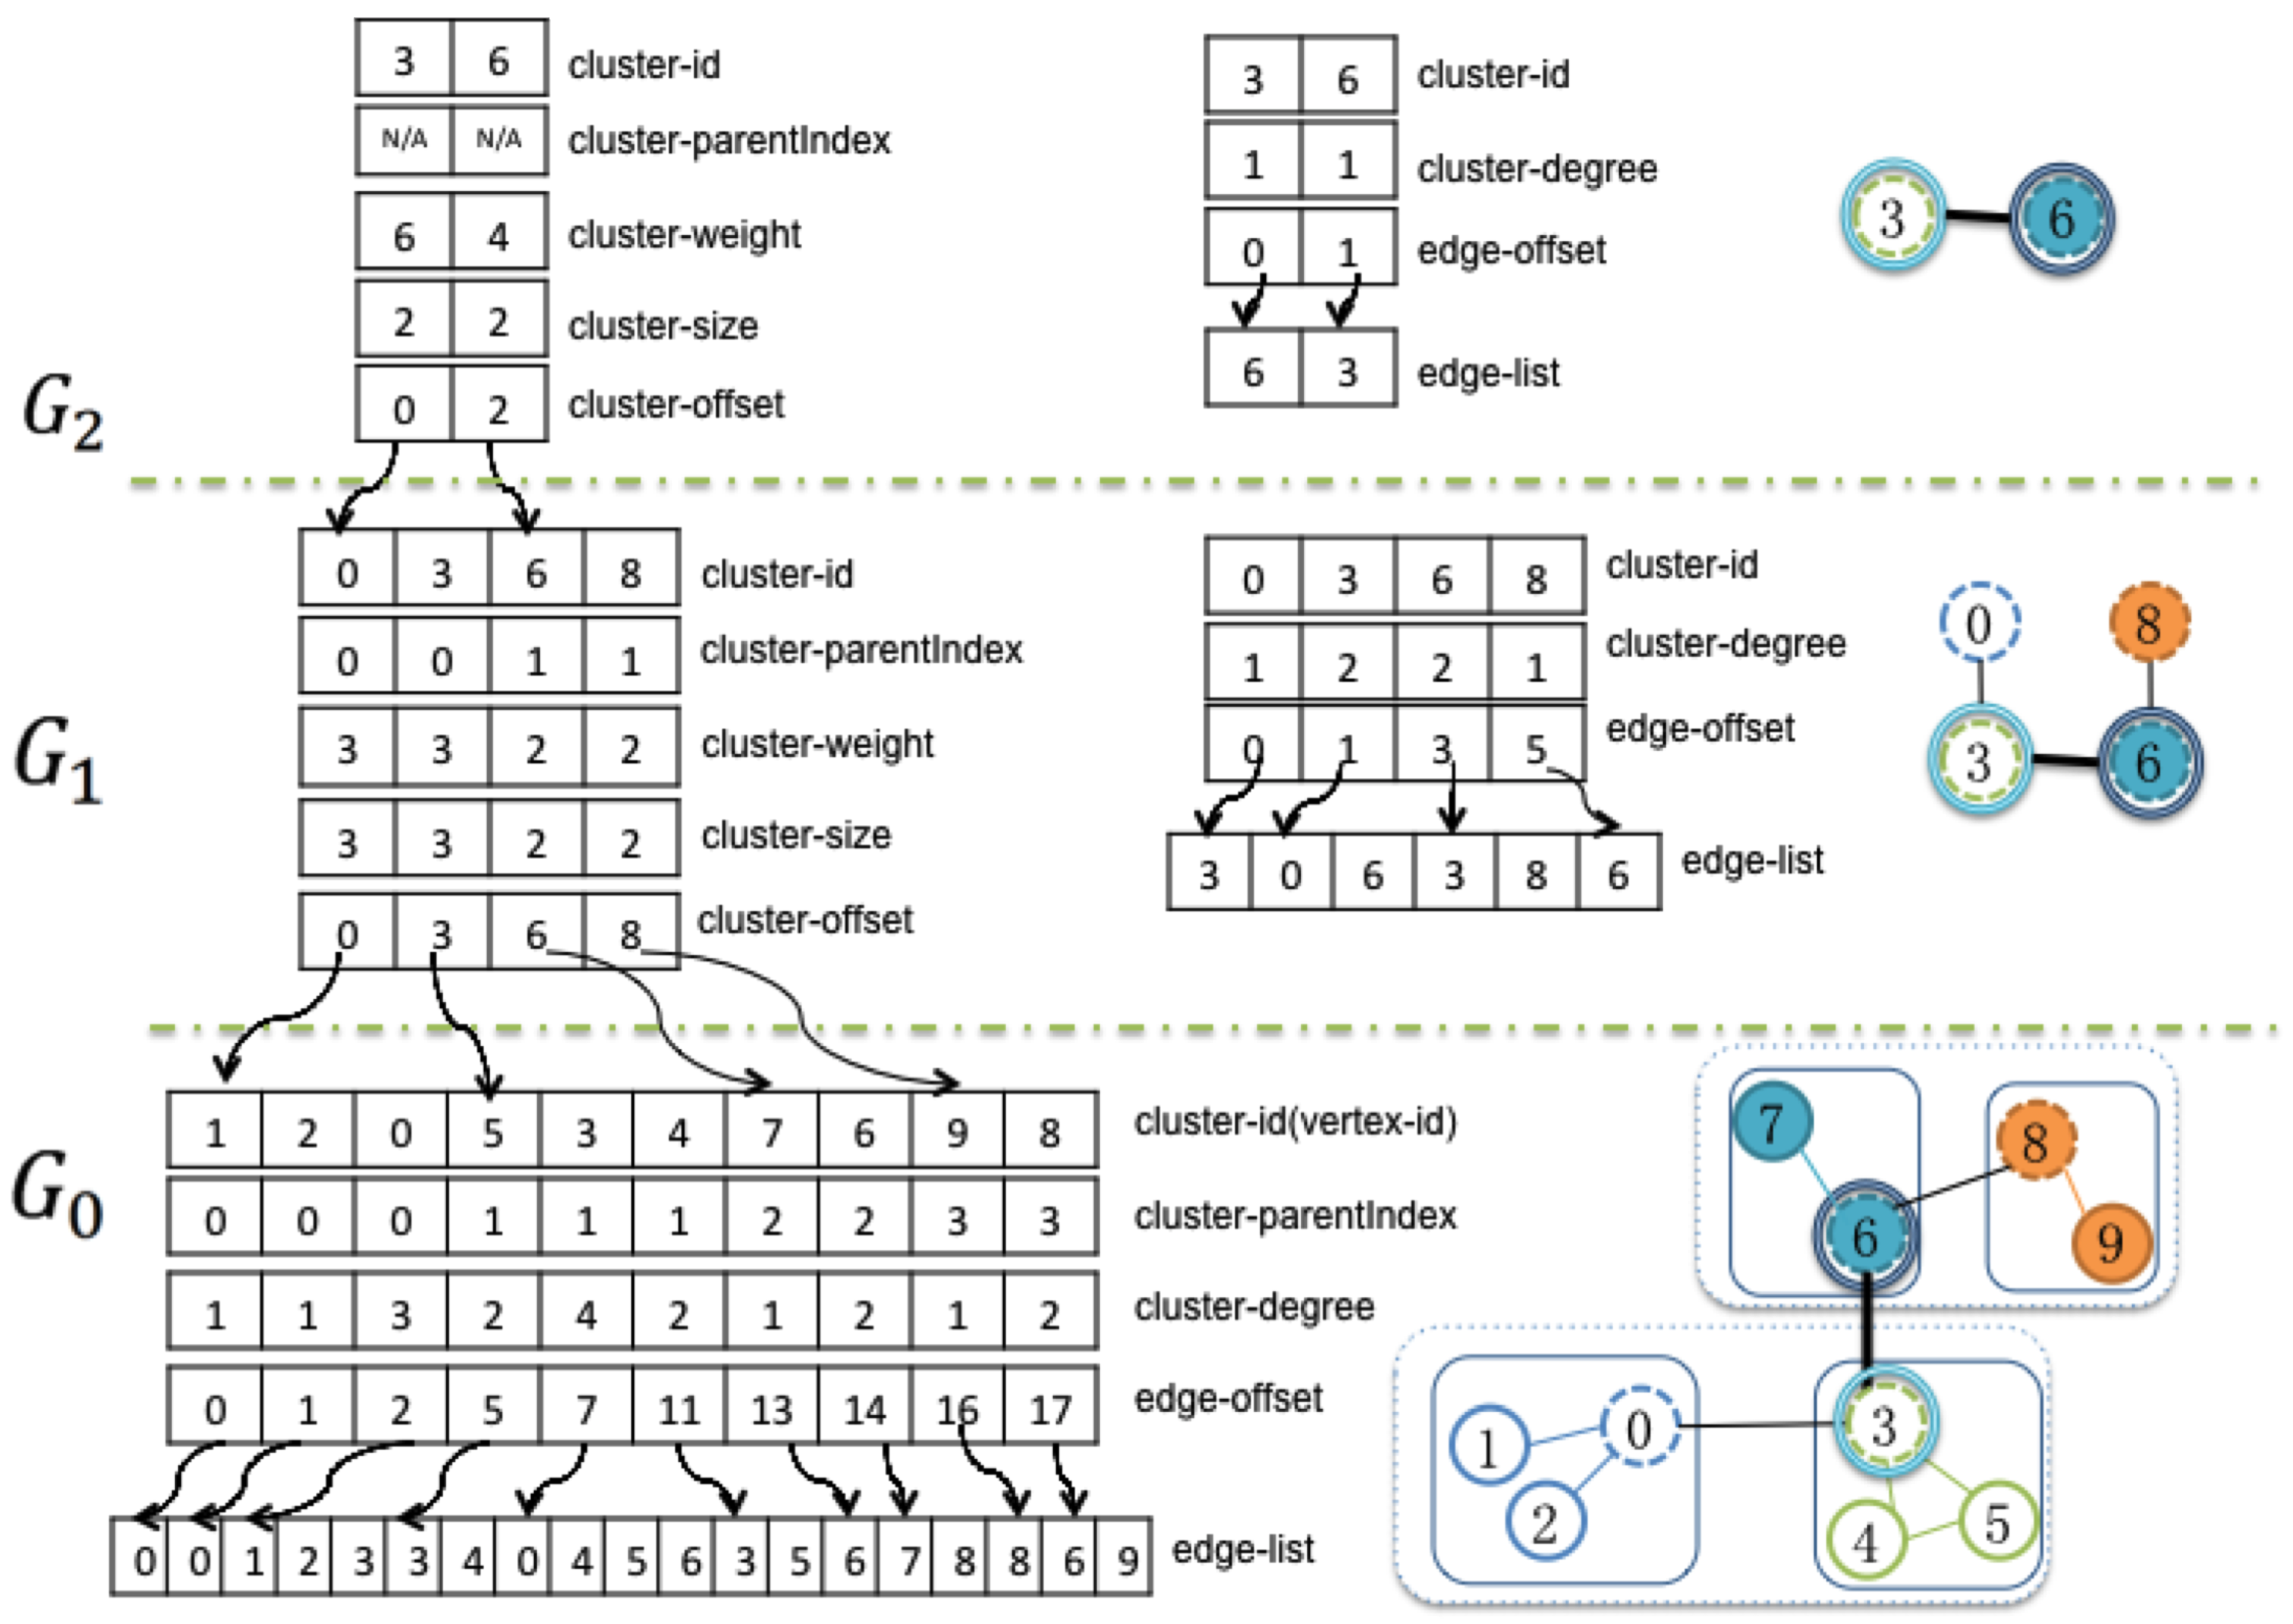
Figure 3 shows the GPU data structure for a three-level graph. Except for the finest level graph, there are two groups of data arrays used to describe graph clustering and edge connections at each level. The first group includes cluster-id, cluster-parentIndex, cluster-weight, cluster-size, cluster-offset, which are used to describe the organization of the clusters of graph nodes:
- cluster-id stores the nodes of the current level graph, which are the sun nodes from the lower level graph.
- cluster-parentIndex provides the indexes of the sun nodes for the next level graph.
- cluster-weight is the number of nodes in the finest level graph that are descendent members of current cluster.
- cluster-size is the number of nodes collapsed into this node from its next lower level graph.
- cluster-offset is the actual index of the nodes in the sub-graph.
The second group of arrays represents the edge connections of each level graph, including cluster-degree, edge-offset and edge-list:
- cluster-degree is the number of edges that other clusters connect to the current cluster.
- edge-offset stores the beginning index of the adjacency edge list.
- edge-list is the adjacency edge list of the current level graph.
In addition to these data arrays, holds the positions of all the nodes in the graph; , and respectively store the attractive forces, repulsive forces and node displacements of each layout iteration. Thus the total memory usage is linear with the total number of nodes and edges. Memory usage is constrained by the original graph, not the value of P.
4.2. GPU Kernels
Our parallel algorithm includes three GPU kernels, shown in Figure 4. Each thread in the attractive forces kernel and updated position kernel is responsible for one node of the selected level graph, which calculates its attractive force and updates its position based on its total force.
Algorithm 1 shows the attractive force computation, where its inputs are data arrays with edge information. The kernel of approximated repulsive forces is complex. It calculates the approximated repulsive force based on the data arrays with graph clustering information. Algorithm 2 shows the details: the while loop in Line 3 describes the top-down graph traversal to compute approximate repulsive force. In each level graph, there are two parts: computing the internal-electric-forces and passing the repulsive forces to the lower level graph as external-electric-forces. The first part includes Lines 3–31, with Lines 7–15 describing the special case of the top level graph layout. The second part in Lines 33–44 is concerned with bestowing the repulsive forces from one level graph to a lower level.
| Algorithm 1: Attractive Force Kernel |
 |
4.3. Workload Imbalance
Based on our parallel algorithm design, the thread workload imbalance problem occurs when the sizes of graph clusters vary significantly. Threads handling smaller graph clusters have less work to do compared to threads handling larger graph clusters. To solve this problem, we can evenly partition a graph into sub graphs. In this case, the workload is evenly distributed among threads (e.g., [16]). However, we may lose some graph topology knowledge when clustering the graph this way, which causes the force-directed layout to converge poorly.
To deal with the workload imbalance problem, Chen et al. [38] propose a dynamic load balancing method to effectively exploit the GPU concurrency. Hong et al. [39] present a warp-centric method that considers the detailed GPU architecture (a basic group of threads that share instructions on the GPU is called a warp) to achieve performance gains. However, both of them introduce extra work for thread assignment.
In next section, we show the performance of the imbalance workload problem. We propose using a threshold of the maximum cluster size for generating graph clusters, to avoid outliers. We plan to consider other solutions to the workload imbalance problem to improve performance in future work.
5. Results and Discussion
We tested our algorithm on a desktop computer running Windows 7 Enterprise, which was equipped with an Intel i7 processor and an NVIDIA GeForce GTX 680 graphics card programmed with CUDA 7.5. We choose [37], a classic force-directed layout algorithm widely used for large graph layout ([9,16,36]), as a baseline to evaluate the performance and visual results of our algorithm.
| Algorithm 2: Approximated Repulsive Forces |
 |
In total, we picked five different graphs as five test cases for our algorithm, including one artificial graph generated by ourselves and other well-known graphs. Table 1 shows the summary of these five graphs.
5.1. Visual Assessment
Making a fair, reasonable and comprehensive evaluation of visual representations of a graph is difficult because the assessment could be highly subjective (e.g., when considering the aesthetics aspect). Most previous large graph layout algorithms attempt to generate visually pleasing graph layouts but ignore the capability for human interactions to adjust layout results. Alternatively, we emphasize the importance of enabling interactive capabilities to improve visually pleasing layouts. This can potentially help to generate more meaningful layouts for a large graph, especially from a human perception and sensemaking insight perspective.
5.2. Performance Analysis
Termination conditions of iterative force computation impact the quality and performance of graph layouts. Previous works (e.g., [14,16]) focus on generating static pleasing layouts of large graphs, and they select a fixed number of iterations to halt the force computation. However, simply using a fixed number of iterations as a termination condition cannot guarantee that the computed layouts always satisfy user requirements, especially considering the fact that different users may focus on different aspects to evaluate graph layouts. For example, Endert et al. [41] argue for “human is the loop” sensemaking, in which analytical algorithms such as graph layouts are fundamentally centered around human sensemaking interactions to support exploratory knowledge discovery. Thus, it is important to support user interaction with graph layouts when sensemaking on large graphs.
The support for dynamic interaction with large graph layouts is a key design goal in this paper. Thus, the average computation time for one iteration, rather than the total amount of time for computing a converged layout, is used as a meaningful measurement to evaluate the performance of our algorithm. This one-iteration oriented computation time is calculated by averaging the time of all iterations needed in our algorithm to achieve the finest level graph. We run both our algorithm and (implemented by ODGF [40]) at least 20 times to collect enough (statistically meaningful) data for comparison. In addition, we consider rendering time because it directly impacts the interactiveness of the actual visual layouts presented to users.
The graph layout computation follows the multi-level graph structure. It starts from the top level graph, then expands the repulsive forces into its children level. When users drag a node, the algorithm updates each nodes positions from the top level graph to the finest level graph. If a dragged node belongs to a top level graph, its changed layout expands to its lower level graphs. If the dragged node only belongs to the finest level graph, the changed layout does not need to be expanded.
Table 2 summarizes the measured performance metrics of each tested graph. Based on the first two rows, it is clear that the CPU version of our algorithm, on average, runs at least 7 times faster than . For graphs with millions of nodes, the performance of our algorithm remains relatively stable, compared to that of . The worst performance of our algorithm (GPU Version) is much smaller than 100 ms [42], which verifies that the performance of our algorithm can support real-time user interactions for graphs with millions of nodes.
By comparing columns 4 and 5, we find that the performance of our algorithm (GPU version) for mesh-like graphs (grid-mesh) is better than that for the small-world graphs (web-Stanford). The reason for this is that we can get evenly partitioned graph clusters based on the solar merger for mesh-like graphs. However, the node degree of small world graphs is unevenly distributed, following the power law distribution. Therefore, the sizes of sub-graphs follow the power law distribution when applying graph clustering algorithms (e.g., Figure 8 shows the sub-graph distribution of web-Stanford). As a result, the GPU threads for internal-electric-force computation suffer the workload imbalance problem.
To address this problem, a graph coarsening or partition algorithm that can evenly partition a graph is a better choice (e.g., the spectral graph partition algorithm [16]). However, evenly partitioned graphs may not generate the optimal graph topology structure as well. For example, the spectral graph partition algorithm [16] can evenly divide a graph into sub groups based on a graph’s spectrum. However, this algorithm loses the graph’s topology, which may cause difficulties for the force-directed layout algorithm to converge into a global minimal configuration. To balance the trade-offs between performance and quality of layouts, following the discussion in Section 4.3, we use a threshold of maximum cluster size P to avoid generating giant clusters, which alleviates the workload imbalance problem. Another possible solution is to use the stochastic force-directed layout algorithm discussed in [43]. For giant clusters, the size of which are larger than the threshold, we can randomly pick neighbor nodes from the cluster for the internal-electric-force computation. In fact, workload imbalance is a classical problem for GPU programming, such as GPU based ray tracing [44] and GPU based graph traversal [45]. We will investigate the thread scheduling and job management methods from these previous works to improve performance in future work.
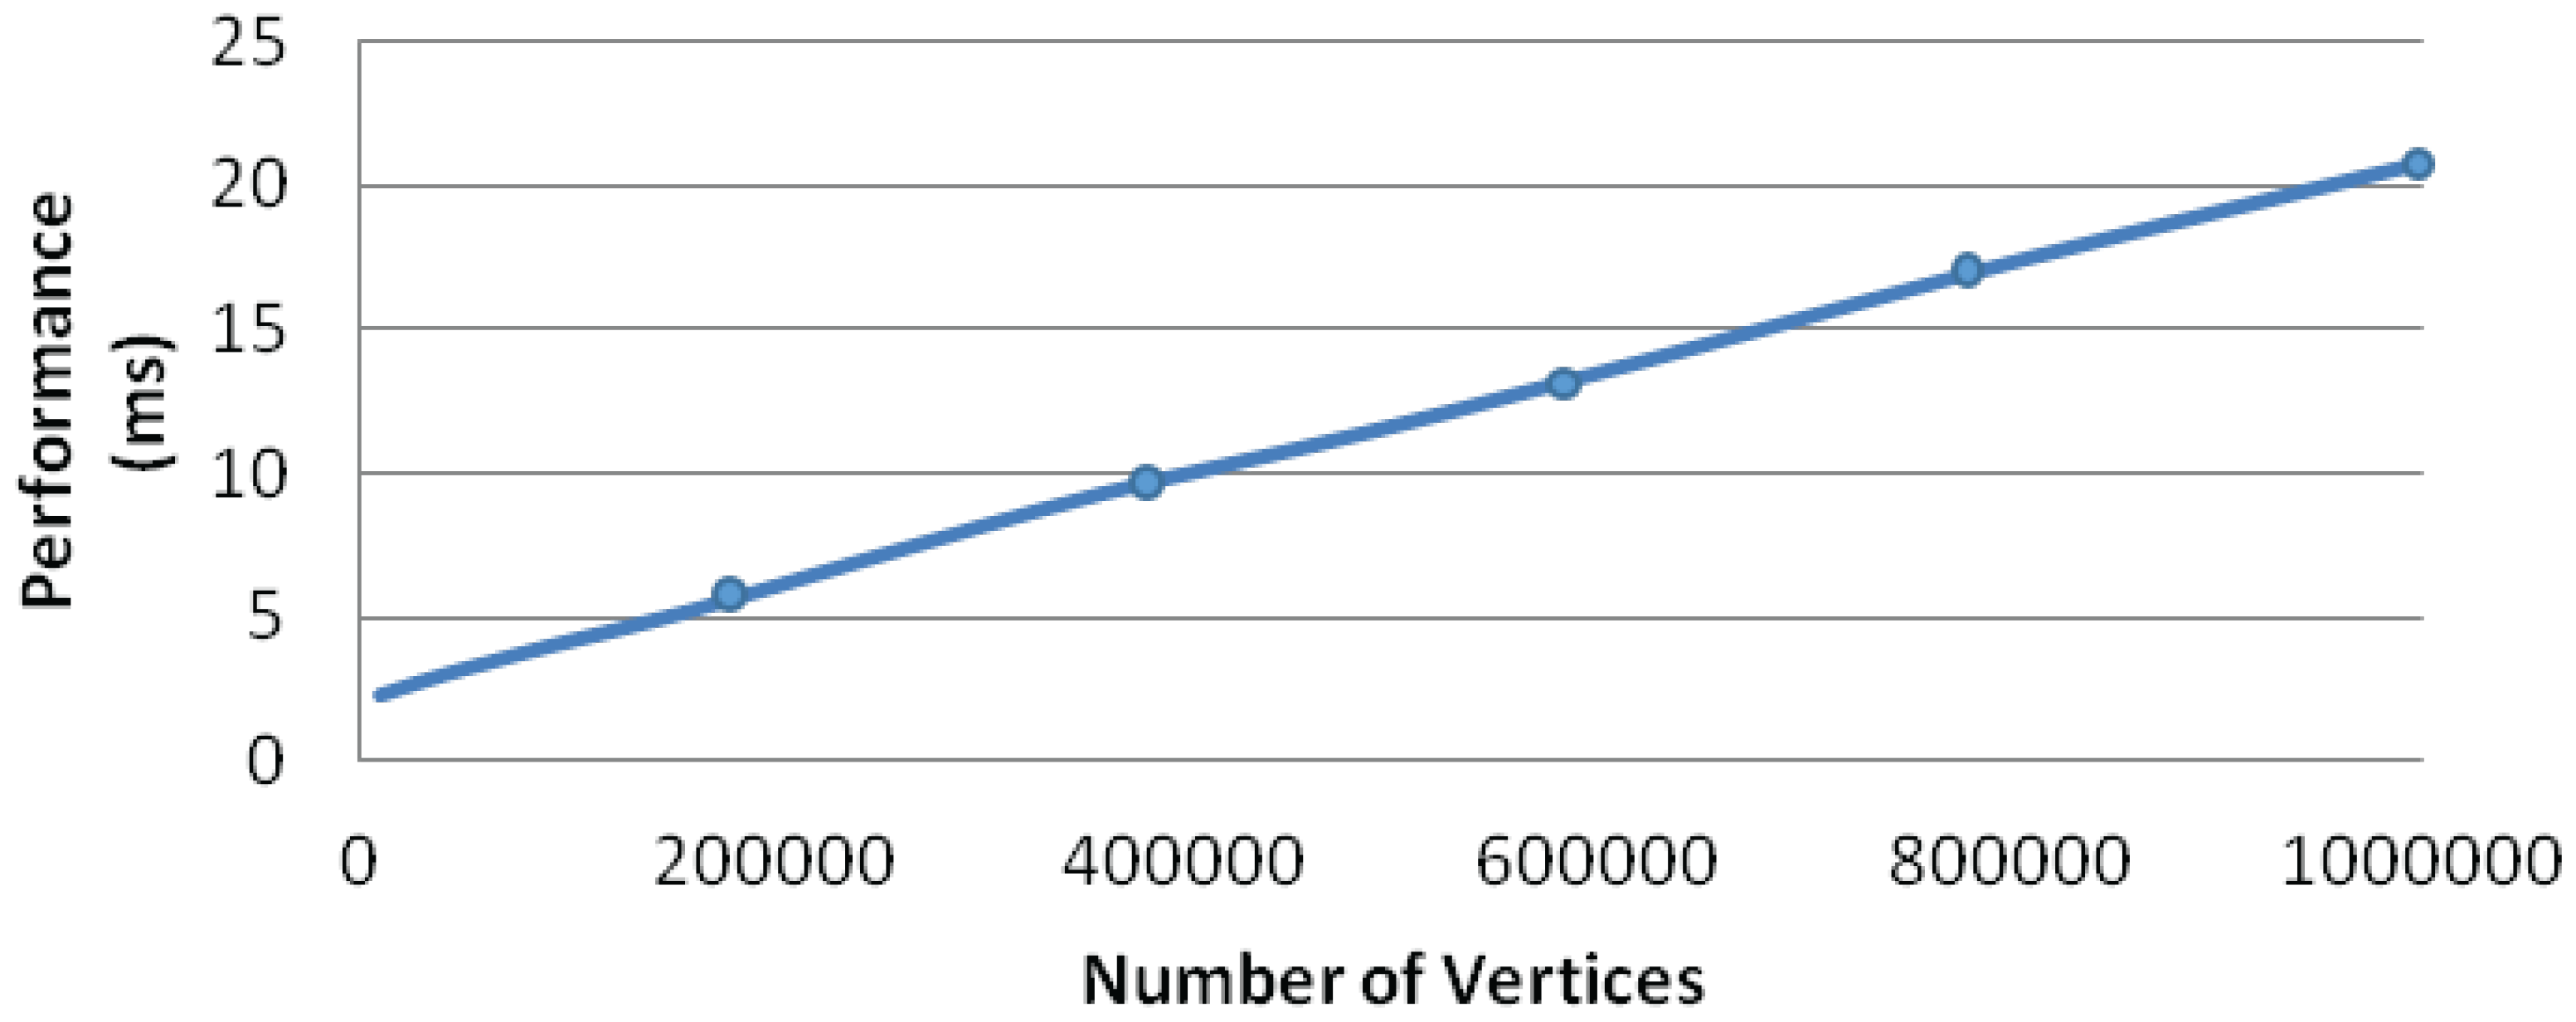
We have tested the scalability of our algorithm for mesh-like graphs. We generate successive grid-meshes, which can be evenly partitioned by the solar merger. Thus, the repulsive force computation of mesh-like graphs avoids the workload imbalance problem. Figure 9 shows the performance of our algorithm (GPU version) for these grid-meshes. It is clear that our algorithm can scale to mesh graphs with millions of nodes while also guaranteeing real-time user interactions.
It is difficult to compare our GPU version with other GPU implementations. Godiyal et al. [14] provide the total time to generate appealing graph layouts without giving the number of iterations. Besides the GPU based force computation, their algorithm spends extra time on tree structure building (CPU) and CPU-GPU data movement. Frishman et al. [16] report that their algorithm is 2–4 times faster than , and their GPU implementation can achieve times 5.5 faster than their CPU version. However, their algorithm takes more time for each iteration computation. Even though our algorithm needs a greater number of iterations to achieve similar results (200 iterations per level compared with Frishman’s 50 iterations per level), we can achieve real-time frame-rate for interactive large graph layouts.
We use the OpenGL VBOs (Vertex Buffer Objects) to efficiently render graphs. This avoids data movement between the CPU and the GPU. The last row of Table 2 shows the rendering performance. To visualize a million nodes takes about 5 milliseconds. Based on our GPU implementation, we can directly map the GPU memory to OpenGL VBOs without any CPU-GPU memory communication. This implementation keeps all graph data in the GPU memory, which fully utilizes the GPU resources for efficient computing and rendering.
5.3. Discussion
The evaluation of graph layout algorithms is challenging. Force-directed algorithms based on stress models [20] use the stress error functions to quantify layout quality and terminate the computation [46]. These algorithms need to store pairwise node distances, so they do not scale well for graphs with millions of nodes. Our method (spring-electric model) is based on adjacency lists, which can be applied to big graphs. However, termination conditions (e.g., the energy threshold and local minimum) of spring-electric model still need further investigation. Our work attempts to enable users to interrupt the computation and modify the layout results, so we focus on a single iteration of force calculation in the performance analysis.
One limitation of our algorithm is that it only considers the scalability of the repulsive force computation. For dense graphs, the number of edges may be linear with squared number of nodes. In this case, computing attractive forces is a bottleneck. Compared with less dense graphs, our algorithm may not handle this well.
6. Usage Scenarios
In this section, we present two case studies to demonstrate how users can interact with a large graph for sensemaking tasks using our system. We first demonstrate that a user can explore a large graph structure based on the multi-level paradigm. Then we show that a user can interact with the graph layout to gain new insights.
6.1. Visual Exploration of Web Networks
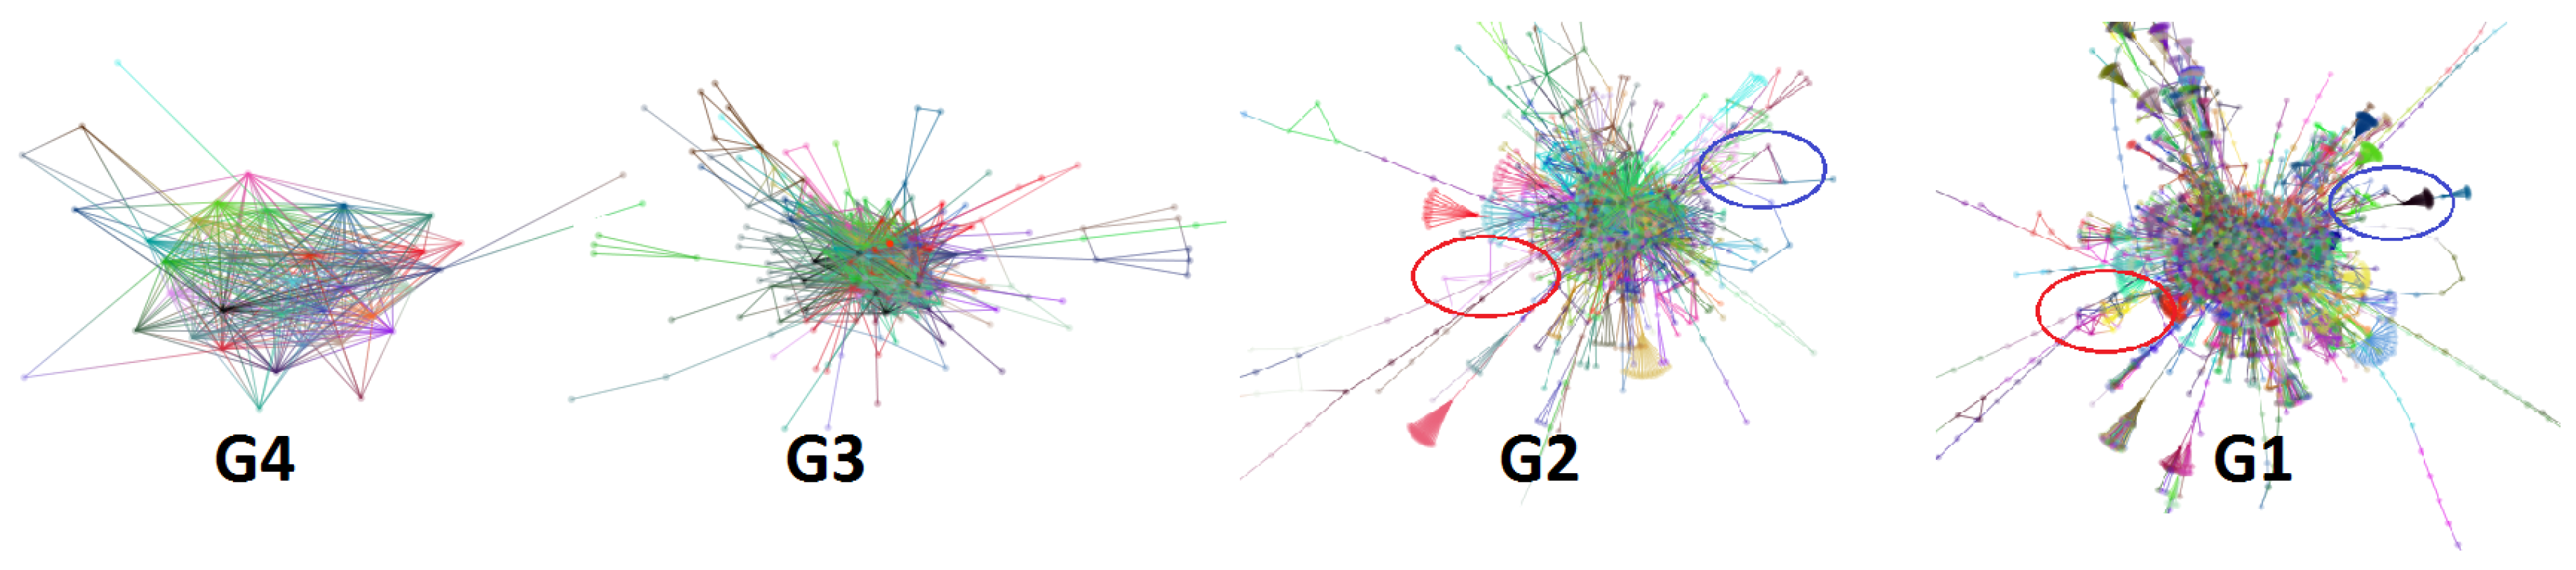
Suppose that Elijah is a network analyst and he attempts to analyze the structure of the web-Stanford graph. He first processes this graph using the solar merger to generate four abstracted levels, which leads to a total of five level graphs. He explores these graphs in a top-down order. When he is satisfied with the layout of one level graph, after making some tweaks to the layout, he then expands and explores the next level layout. Figure 10 shows the four levels of graph layout resulting from this process.
By comparing the levels of graph layout, Elijah notices that two specific sub-graphs show different evolutions. These two sub-graphs are circled in red and blue in Figure 10 and Figure 1. At first, the basic structures of these two sub-graphs are in the shape of a triangle. After Elijah moves to the next level graph, the sub-graph circled in red changes to a clique-like structure, while the sub-graph circled in blue changes to a tree-like structure. In the finest level graph, the former becomes a compact cluster but the latter still remains tree-like. The difference in structure evolutions of the two sub-graphs catches Elijah’s attention, especially the first sub-graph. He wants to better understand why the structure of the first sub-graph changes more, so he decides to zoom in to see more details for further exploration.
Figure 1A shows the detailed layout result. This sub-graph consists of multiple small clusters that overlap each other. Elijah finds a hub node and drags it a little bit to see what happens. It turns out that several small clusters dynamically follow the dragged one, as shown in Figure 1B. After this, he quickly realizes that this sub-graph can actually be separated into two clusters.
In summary, with our proposed technique, users can inspect the evolution of large graph layouts by exploring different level layouts. With the capability of dragging nodes and modifying the layout in real time, our algorithm enables users to flexibly reorganize the layout and even assist in improving large graph layouts. This approach combines human cognition with computational power (e.g., GPU graph layout algorithms) to solve difficult problems in sensemaking of large graphs.
6.2. Visual Exploration of Co-Authorship Networks
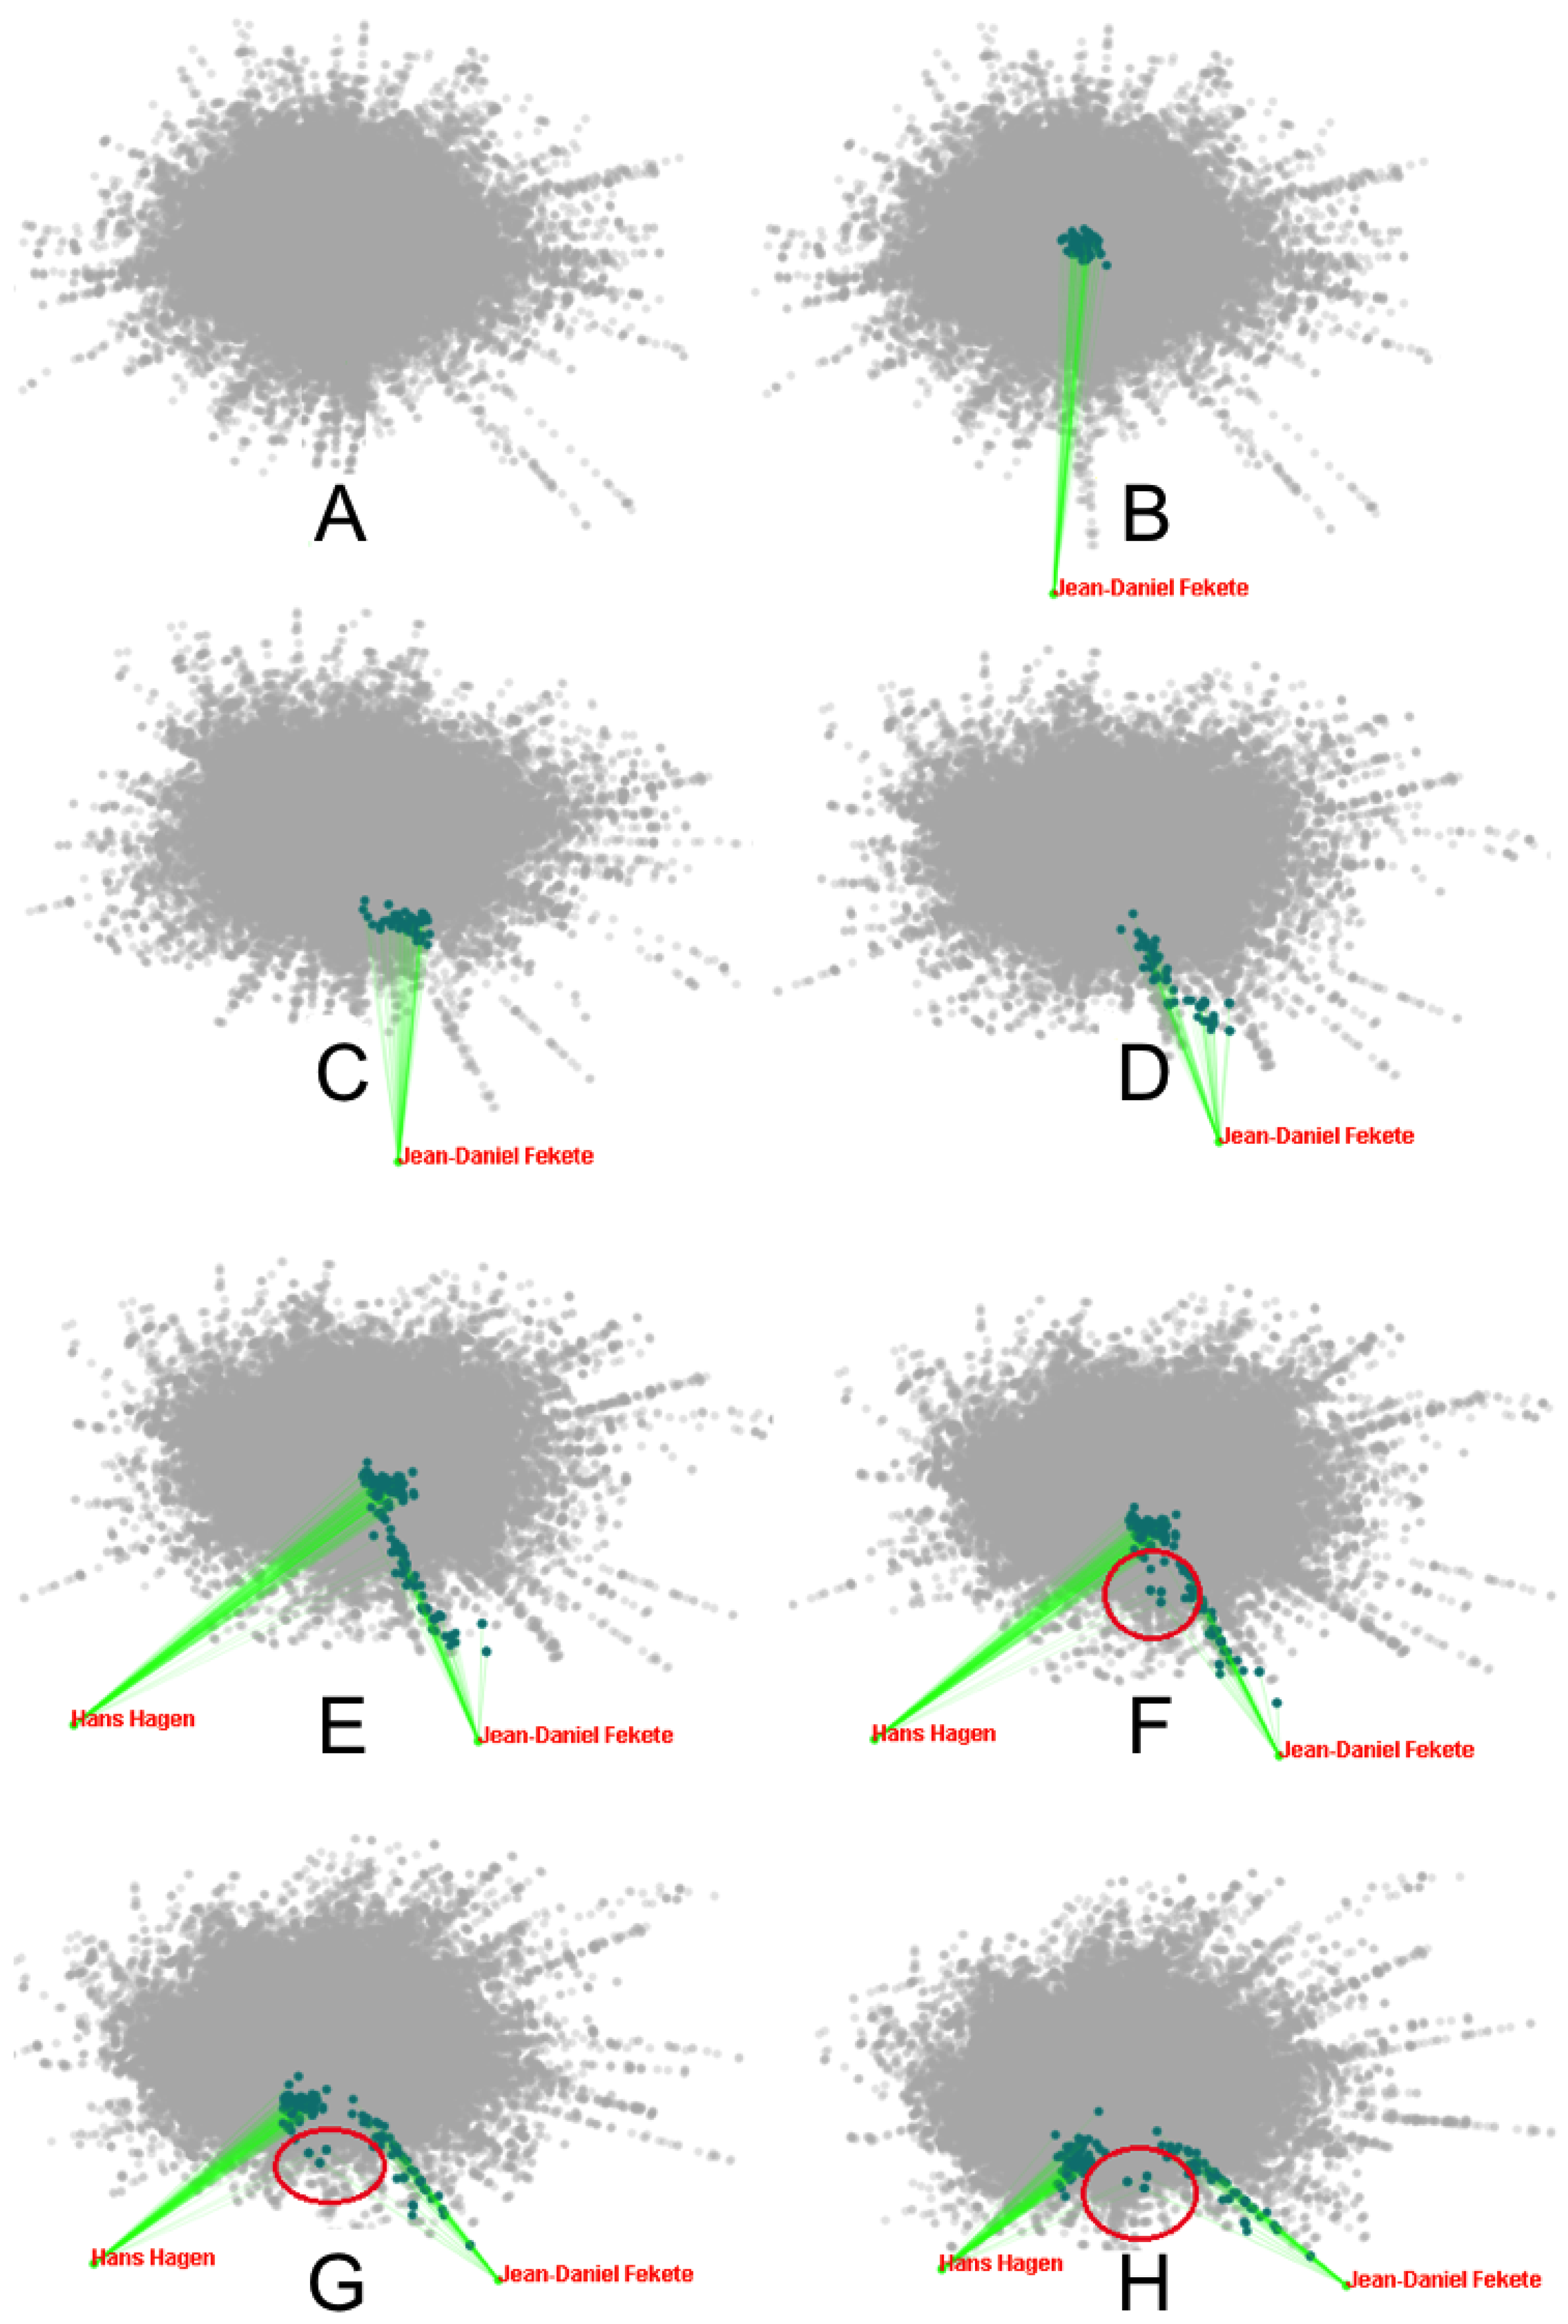
In this case study, we present a scenario of an analyst making sense of a co-authorship network. Suppose Grace is a social network analyst. She is interested in how research scientists collaborate with each other. Thus, she downloads publications from DBLP [47], parses them and generates a co-authorship network (515,103 nodes and 1,856,690 edges). At first, she obtains a graph layout based on as shown in Figure 11A. The visualization is a dense and intermingled network. The core of the network contains most of the nodes and edges, which has a nontrivial structure. Unfortunately, the research communities cannot be visually separated using . Thus, she switches to using our algorithm to interact with the graph layout.
First, Grace identifies research communities by their central actors (hub node of a subgraph). She is interested in a research community with Jean-Daniel Fekete (JDF) as a central actor. To separate the JDF community from the core network, she drags this central actor away from the core in Figure 11B. The nodes belonging to this community move towards the central actor. By observing the nodes’ movement, shown in Figure 11 (C and D), she easily identifies that the nodes are separated into two groups. One group of nodes moves slowly and blends into the core network, while the other group of nodes moves faster and they are separated well from the core. She examines the details of each node, and finds that the first group consists primarily of senior researchers, while the other consists of junior researchers.
Grace hypothesizes that some of the senior researchers may belong to multiple research communities. If they were tied to other large communities, this would explain why their nodes were being held back from moving toward JDF. To verify this, she drags Hans Hagen (HH) away from the network core, as in Figure 11E. Then she observes node movement, and finds that three senior researchers collaborate with both JDF and HH, as circled in Figure 11 (F, G and H). Evidently, JDF collaborates with many junior researchers, while HH emphasizes senior researchers.
Compared with other approaches, Grace gains more useful insights about the large graph by interacting with the graph layout using our algorithm. She easily separates research communities from a large nontrivial network while analyzing its structure. She also finds researchers connecting multiple communities.
7. Lessons Learned
In this paper, we seek to enable human-in-the-loop layout of large graphs. Based on this key design consideration, we contribute a topology based method to accelerate a force-directed graph layout algorithm that can support real-time exploration of large graphs. We parallelize this method by using the powerful resources of the GPU. We summarize two major lessons learned about designing accelerated algorithms to interactively layout large graphs as follows.
Taking advantage of parallelization. Performance is a key concern for designing algorithms to handle big data such as large graphs. Parallelization is one option to accelerate algorithms. The GPU has been praised for its significant performance improvement and programmability for general purpose computation. Thus, researchers can rethink existing algorithms to utilize the GPU for parallelization.
We design parallel algorithms by considering two important aspects: data structures and independent instructions. We use modified adjacency lists to organize multi-level graphs, and separate our force-directed algorithm into different kernels to reduce its dependency.
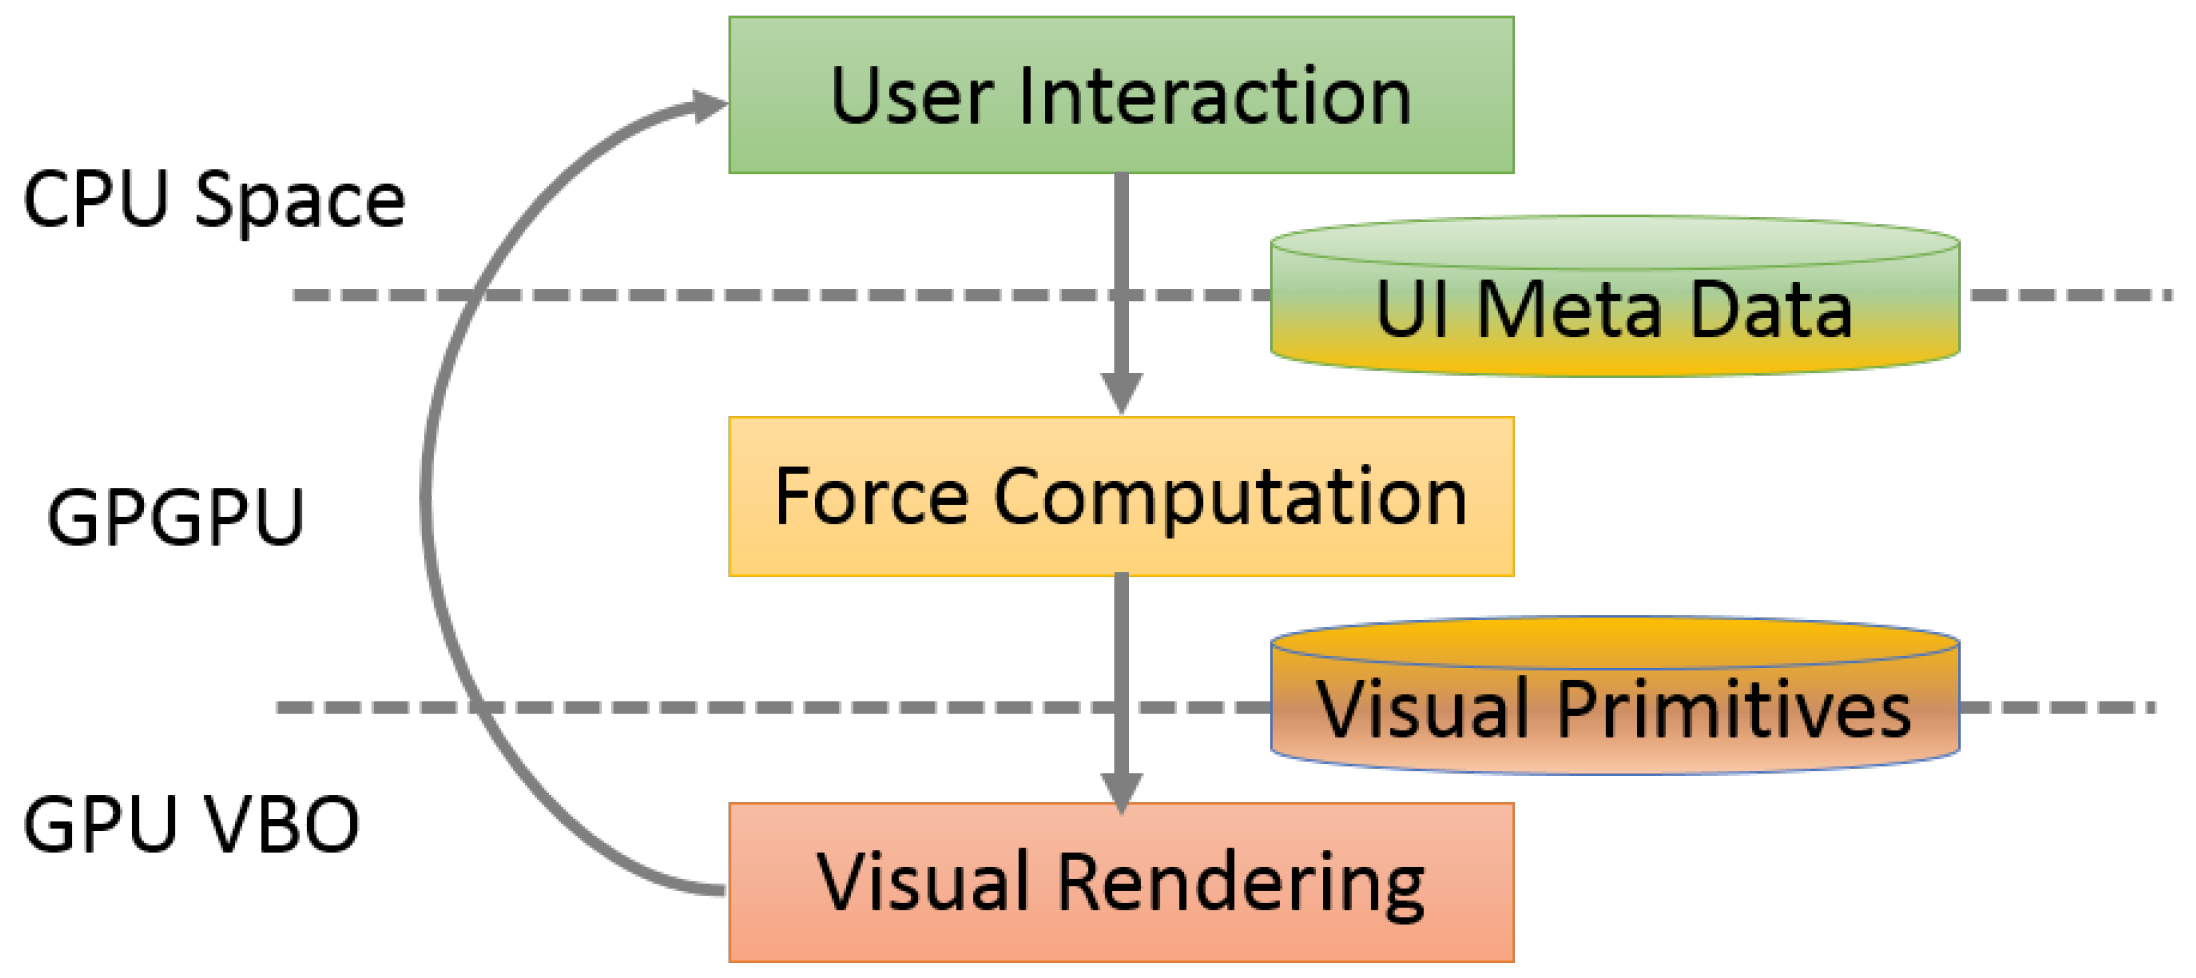
Light computation per iteration. Figure 12 illustrates the flow chart of our interactive large graph layout system, where force computation is a potential bottleneck. Previous graph layout algorithms cannot support dynamic real-time human-in-the-loop interaction because of their heavy computation per iteration. To support sensemaking of large graphs, we emphasize light computation per iteration. Our topology based method requires less computation, since we save in the calculation of approximated forces. The rapid iteration enables humans to be involved in the graph layout process along with the automatic computation, which can lead to customized layouts that make more sense for individual users and tasks.
As is shown in Figure 12, with our approach, humans are involved in the iterative graph layout process. For example, they can modify and halt the computation iterations in advance to reduce the total time to layout large graphs. Previous algorithms use a fixed number of iterations for layout generation to guarantee a converged result, which may waste some iterations and increase the total run time. Striving for the best solution to halt layout computation may introduce more memory and computation requirements that may increase total time to layout a large graph. In such cases, light computation per iteration is a good design choice to obtain better and meaningful layout results in a short time by involving human interaction.
However, light computation per iteration may need more iterations to get a converged graph layout in some cases, so it cannot always guarantee a decrease in total run time. Thus, the design of large graph layout algorithms often involves a trade-off between the total run time and the per-iteration run time performance. In this work, we favor per-iteration run time via light computation, to enable interactive layout.
8. Conclusions
To enable human interaction with large graph layout, we contribute a fast force-directed layout algorithm and a detailed GPU implementation. Our contribution contains two key novelties. First, we calculate the approximated repulsive force based on the topology of the graph, instead of the spatial distribution of its nodes, which avoids building, traversing, and updating a spatial indexing data structure. We use a multi-level clustering approach, carefully coordinated with a top-down approximate force computation. Second, we parallelize the algorithm in a GPU implementation, which includes the design of the GPU kernels and the GPU data structure memory layout that support our top-down approximation method. Taken together, our contributions enable light-weight computation per algorithm iteration, which increases the interactive frame-rate of the layout.
We evaluated our method, which generates visually pleasing graph layouts for five benchmark graphs, and provides fast iteration performance that supports real-time user interactions on large graphs. The results indicate that our algorithm enables real-time interaction with graphs of over a million nodes. We present two case studies to demonstrate that our algorithm can support users in exploring large graphs and dynamically refining layouts. Finally, we summarize lessons learned from this work for designing algorithms that enable real-time human interaction with large graphs. We hope that these lessons will further inform future algorithm design, to enable a broad variety of user interactions in support of sensemaking tasks on very large graphs.
Acknowledgments
This research was partially supported by NSF grant IIS-1447416.
Author Contributions
All authors contributed equally to this work. P.M. and Y.C. conceived the paper idea; P.M. implemented the system; P.M., M.S., M.M. and C.N. contributed the paper writing.
Conflicts of Interest
The authors declare no conflict of interest.
References
- Heer, J.; Boyd, D. Vizster: Visualizing online social networks. In Proceedings of the IEEE Symposium on Information Visualization, Minneapolis, MN, USA, 23–25 October 2005; pp. 32–39.
- Henry, N.; Fekete, J.D.; McGuffin, M.J. NodeTrix: A hybrid visualization of social networks. IEEE Trans. Vis. Comput. Graph. 2007, 13, 1302–1309. [Google Scholar] [CrossRef] [PubMed]
- Zhang, H.; Sun, M.; Yao, D.D.; North, C. Visualizing Traffic Causality for Analyzing Network Anomalies. In Proceedings of the ACM International Workshop on Security and Privacy Analytics, San Antonio, TX, USA, 2–4 March 2015; pp. 37–42.
- Sun, M.; Mi, P.; North, C.; Ramakrishnan, N. BiSet: Semantic Edge Bundling with Biclusters for Sensemaking. IEEE Trans. Vis. Comput. Graph. 2016, 22, 310–319. [Google Scholar] [CrossRef] [PubMed]
- Fiaux, F.; Sun, M.; Bradel, L.; North, C.; Ramakrishnan, N. Bixplorer: Visual analytics with biclusters. J. Comput. 2013, 8, 90–94. [Google Scholar] [CrossRef]
- Sun, M.; Bradel, L.; North, C.L.; Ramakrishnan, N. The role of interactive biclusters in sensemaking. In Proceedings of the ACM Conference on Human Factors in Computing Systems, Toronto, ON, Canada, 26 April–1 May 2014; pp. 1559–1562.
- Kaufmann, M.; Wagner, D. Drawing Graphs: Methods and Models; Springer: London, UK, 2001. [Google Scholar]
- Battista, G.D.; Eades, P.; Tamassia, R.; Tollis, I.G. Graph Drawing: Algorithms for the Visualization of Graphs; Prentice Hall PTR: Upper Saddle River, NJ, USA, 1998. [Google Scholar]
- Hachul, S.; Jünger, M. An Experimental Comparison of Fast Algorithms for Drawing General Large Graphs; Springer: Berlin/Heidelberg, Germany, 2006; pp. 235–250. [Google Scholar]
- Shneiderman, B.; Aris, A. Network visualization by semantic substrates. IEEE Trans. Vis. Comput. Graph. 2006, 12, 733–740. [Google Scholar] [CrossRef] [PubMed]
- Endert, A.; Fiaux, P.; North, C. Semantic interaction for visual text analytics. In Proceedings of the ACM Conference on Human Factors in Computing Systems, Austin, TX, USA, 5–10 May 2012; pp. 473–482.
- Fruchterman, T.M.; Reingold, E.M. Graph drawing by force-directed placement. Softw. Pract. Exp. 1991, 21, 1129–1164. [Google Scholar] [CrossRef]
- Greengard, L.; Rokhlin, V. A fast algorithm for particle simulations. J. Comput. Phys. 1987, 73, 325–348. [Google Scholar] [CrossRef]
- Godiyal, A.; Hoberock, J.; Garland, M.; Hart, J.C. Rapid Multipole Graph Drawing on the GPU; Springer: Berlin/Heidelberg, Germany, 2009; pp. 90–101. [Google Scholar]
- Burtscher, M.; Pingali, K. An Efficient CUDA Implementation of the Tree-Based Barnes Hut N-Body Algorithm, GPU Computing Gems Emerald Edition ed; Morgan Kaufmann: Burlington, MA, USA, 2011; pp. 13–75. [Google Scholar]
- Frishman, Y.; Tal, A. Multi-level graph layout on the GPU. IEEE Trans. Vis. Comput. Graph. 2007, 13, 1310–1319. [Google Scholar] [CrossRef] [PubMed]
- Hu, Y. Algorithms for visualizing large networks. Comb. Sci. Comput. 2011, 5, 180–186. [Google Scholar]
- Davidson, R.; Harel, D. Drawing graphs nicely using simulated annealing. ACM Trans. Graph. 1996, 15, 301–331. [Google Scholar] [CrossRef]
- Eades, P. A heuristics for graph drawing. Congr. Numer. 1984, 42, 146–160. [Google Scholar]
- Kamada, T.; Kawai, S. An algorithm for drawing general undirected graphs. Inf. Process. Lett. 1989, 31, 7–15. [Google Scholar] [CrossRef]
- Harel, D.; Koren, Y. Graph Drawing by High-Dimensional Embedding; Springer: Irvine, CA, USA, 2002; pp. 207–219. [Google Scholar]
- Koren, Y.; Carmel, L.; Harel, D. ACE: A fast multiscale eigenvectors computation for drawing huge graphs. In Proceedings of the IEEE Symposium on Information Visualization, Boston, MA, USA, 28–29 October 2002; pp. 137–144.
- Muelder, C.; Ma, K.L. A treemap based method for rapid layout of large graphs. In Proceedings of the PacificVIS, Kyoto, Japan, 5–7 March 2008; pp. 231–238.
- Wong, P.C.; Foote, H.; Mackey, P.; Chin, G.; Huang, Z.; Thomas, J. A space-filling visualization technique for multivariate small-world graphs. IEEE Trans. Vis. Comput. Graph. 2012, 18, 797–809. [Google Scholar] [CrossRef] [PubMed]
- Khoury, M.; Hu, Y.; Krishnan, S.; Scheidegger, C. Drawing Large Graphs by Low Rank Stress Majorization. Comput. Graph. Forum 2012, 31, 975–984. [Google Scholar] [CrossRef]
- Kobourov, S.G. Spring embedders and force directed graph drawing algorithm. arXiv, 2012; arXiv:1201.3011. [Google Scholar]
- Barnes, J.; Hut, P. A hierarchical O (N log N) force-calculation algorithm. Nature 1986, 324, 446–449. [Google Scholar] [CrossRef]
- Quigley, A.; Eades, P. FADE: Graph Drawing, Clustering, and Visual Abstraction; Springer: Berlin/Heidelberg, Germany, 2011; pp. 197–210. [Google Scholar]
- Yunis, E.; Yokota, R.; Ahmadia, A. Scalable force directed graph layout algorithms using fast multipole methods. In Proceedings of the 2012 11th International Symposium on Parallel and Distributed Computing, Munich, Germany, 25–29 June 2012; pp. 180–187.
- Gajer, P.; Kobourov, S.G. GRIP: Graph Drawing with Intelligent Placement; Springer: Berlin/Heidelberg, Germany, 2002; pp. 222–228. [Google Scholar]
- Walshaw, C. A Multilevel Algorithm for Force-Directed Graph Drawing; Springer: Berlin/Heidelberg, Germany, 2001; pp. 171–182. [Google Scholar]
- Bartel, G.; Gutwenger, C.; Klein, K. An Experimental Evaluation of Multilevel Layout Methods; Springer: Berlin/Heidelberg, Germany, 2011; pp. 80–91. [Google Scholar]
- Mi, P.; Sun, M.; Masiane, M.; Cao, Y.; North, C. AVIST: A GPU-Centric Design for Visual Exploration of Large Multidimensional Datasets. Informatics 2016, 3, 18. [Google Scholar] [CrossRef]
- Auber, D.; Chriricota, Y. Improved efficiency of spring embedders: Taking advantage of GPU programming. In Proceedings of the Visualization, Imaging, and Image Processing, Palma de Mallorca, Spain, 29–31 August 2007; pp. 169–175.
- Jezowicz, T.; Kudelka, M.; Platos, J.; Snasel, V. Visualization of large graphs using GPU computing. In Proceedings of the Intelligent Networking and Collaborative Systems, Xi’an, China, 9–11 September 2013; pp. 662–667.
- Tikhonova, A.; Ma, K.L. A scalable parallel force-directed graph layout algorithm. In Proceedings of the 8th Eurographics Conference on Parallel Graphics and Visualization, Crete, Greece, 14–15 April 2008; pp. 25–32.
- Hachul, S.; Jünger, M. Drawing Large Graphs with a Potential-Field-Based Multilevel Algorithm, Graph Drawing; Springer: Berlin/Heidelberg, Germany, 2005; pp. 285–295. [Google Scholar]
- Chen, L.; Villa, O.; Krishnamoorthy, S.; Gao, G. Dynamic load balancing on single-and multi-GPU systems. In Proceedings of the Parallel & Distributed Processing, Atlanta, GA, USA, 19–23 April 2010; pp. 1–12.
- Hong, S.; Kim, S.K.; Oguntebi, T.; Olukotun, K. Accelerating CUDA Graph Algorithms at Maximum Warp. ACM SIGPLAN Not. 2011, 46, 267–276. [Google Scholar] [CrossRef]
- Chimani, M.; Gutwenger, C.; Jünger, M.; Klau, G.W.; Klein, K.; Mutzel, P. The open graph drawing framework (OGDF). In Handbook of Graph Drawing and Visualization; Chapman and Hall/CRC: Boca Raton, FL, USA, 2011; pp. 543–569. [Google Scholar]
- Endert, A.; Hossain, M.S.; Ramakrishnan, N.; North, C.; Fiaux, P.; Andrews, C. The human is the loop: New directions for visual analytics. J. Intell. Inf. Syst. 2014, 43, 411–435. [Google Scholar] [CrossRef]
- Liu, Z.; Heer, J. The effects of interactive latency on exploratory visual analysis. IEEE Trans. Vis. Comput. Graph. 2014, 20, 2122–2131. [Google Scholar] [CrossRef] [PubMed]
- Chalmers, M. A linear iteration time layout algorithm for visualizing high-dimensional data. In Proceedings of the 7th Conference on Visualization, San Francisco, CA, USA, 28–29 October 1996; pp. 127–131.
- Aila, T.; Laine, S. Understanding the Efficiency of Ray Traversal on GPUs. In Proceedings of the Conference on High Performance Graphics, New Orleans, LA, USA, 1–3 August 2009; pp. 145–149.
- Merrill, D.; Garland, M.; Grimshaw, A. High-Performance and Scalable GPU Graph Traversal. ACM Trans. Parallel Comput. 2009, 1, 1–30. [Google Scholar] [CrossRef]
- Ingram, S.; Munzner, T.; Olano, M. Glimmer: Multilevel MDS on the GPU. IEEE Trans. Vis. Comput. Graph. 2009, 15, 249–261. [Google Scholar] [CrossRef] [PubMed]
- The Computer Science Bibliography Website. Available online: http://dblp.uni-trier.de/ (accessed on 30 November 2016).
Figure 1.
Interacting with a very large graph layout using our GPU algorithm. is graph layout of web-Stanford data (graph nodes colored by cluster membership). The red and blue circles are highlighted sub-graphs. (A) shows the detailed layout when the user zooms into the red circle. (B) shows that one cluster separates into two clusters when the user drags a hub node. In Section 6.1, more details are provided.
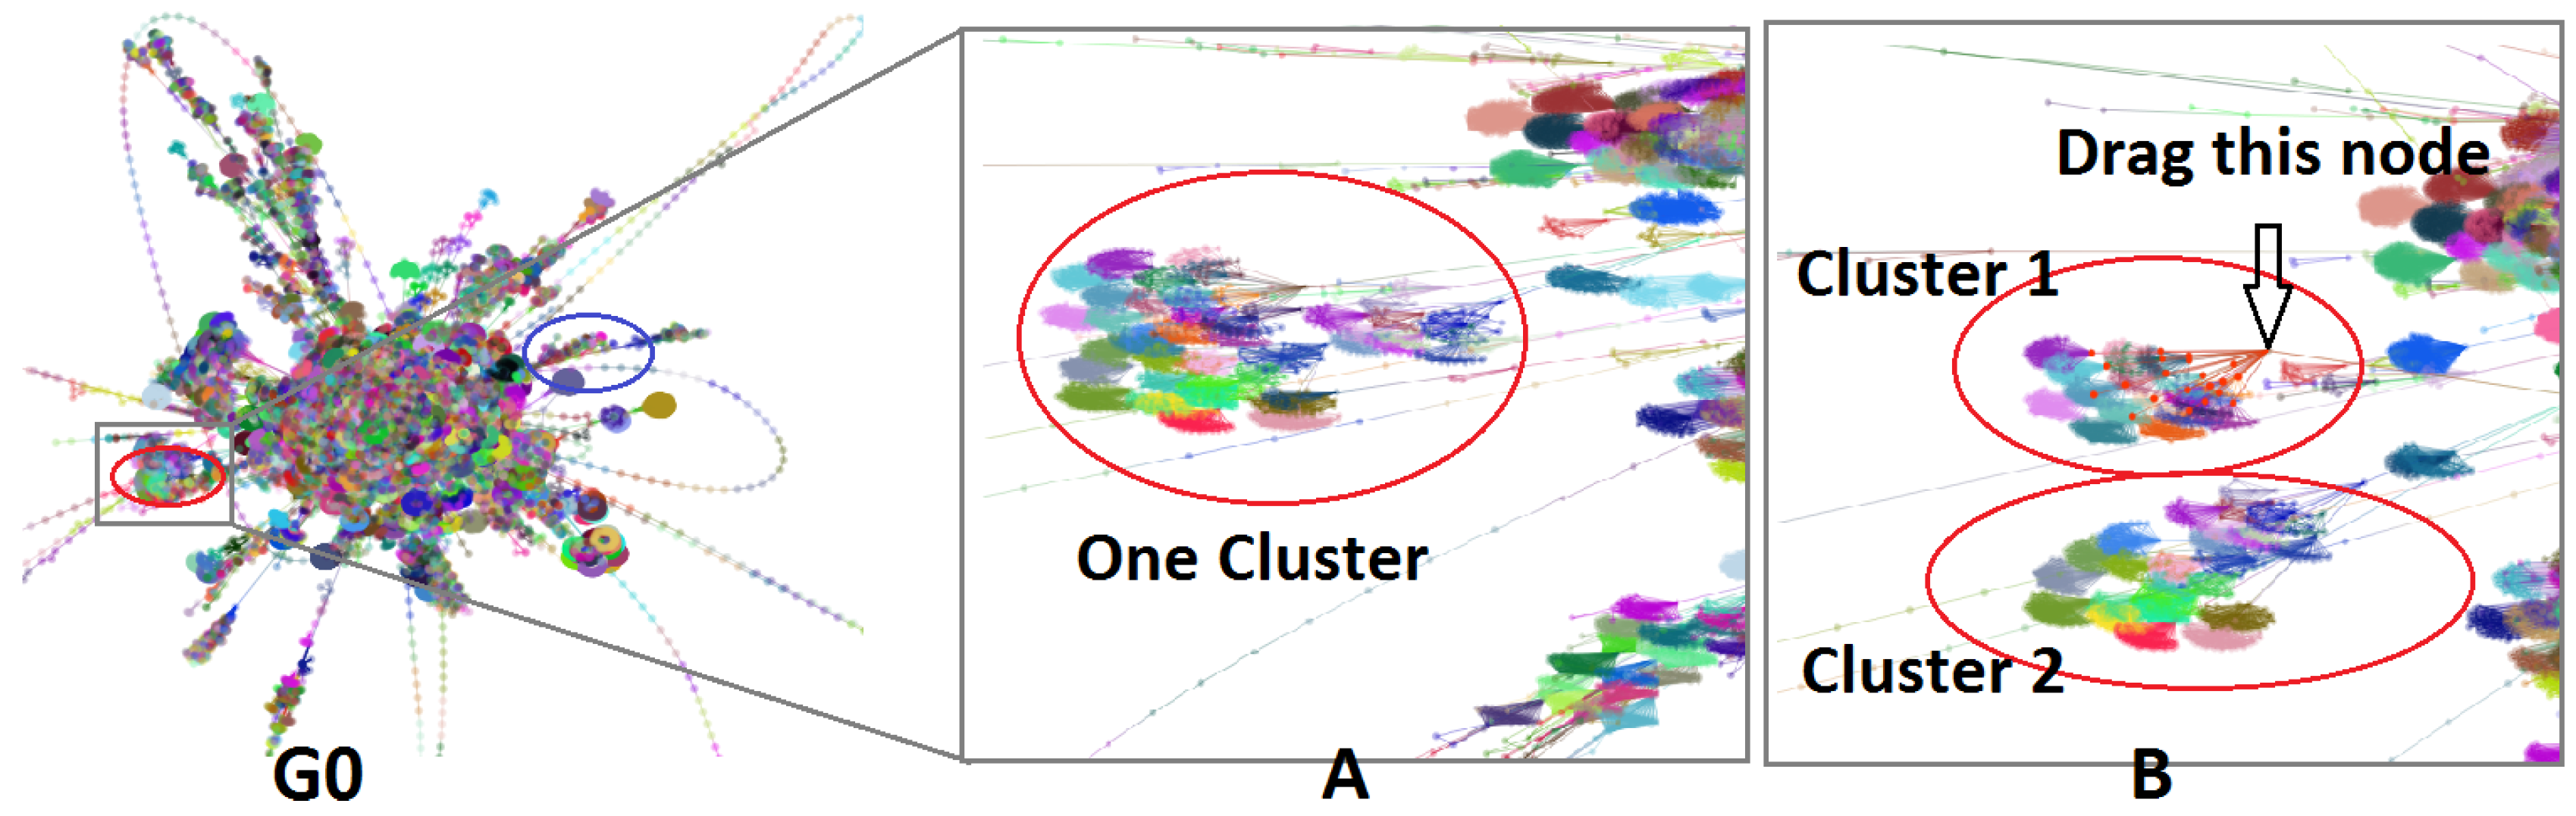
Figure 2.
Left: the original graph . Right: its coarsened graph .
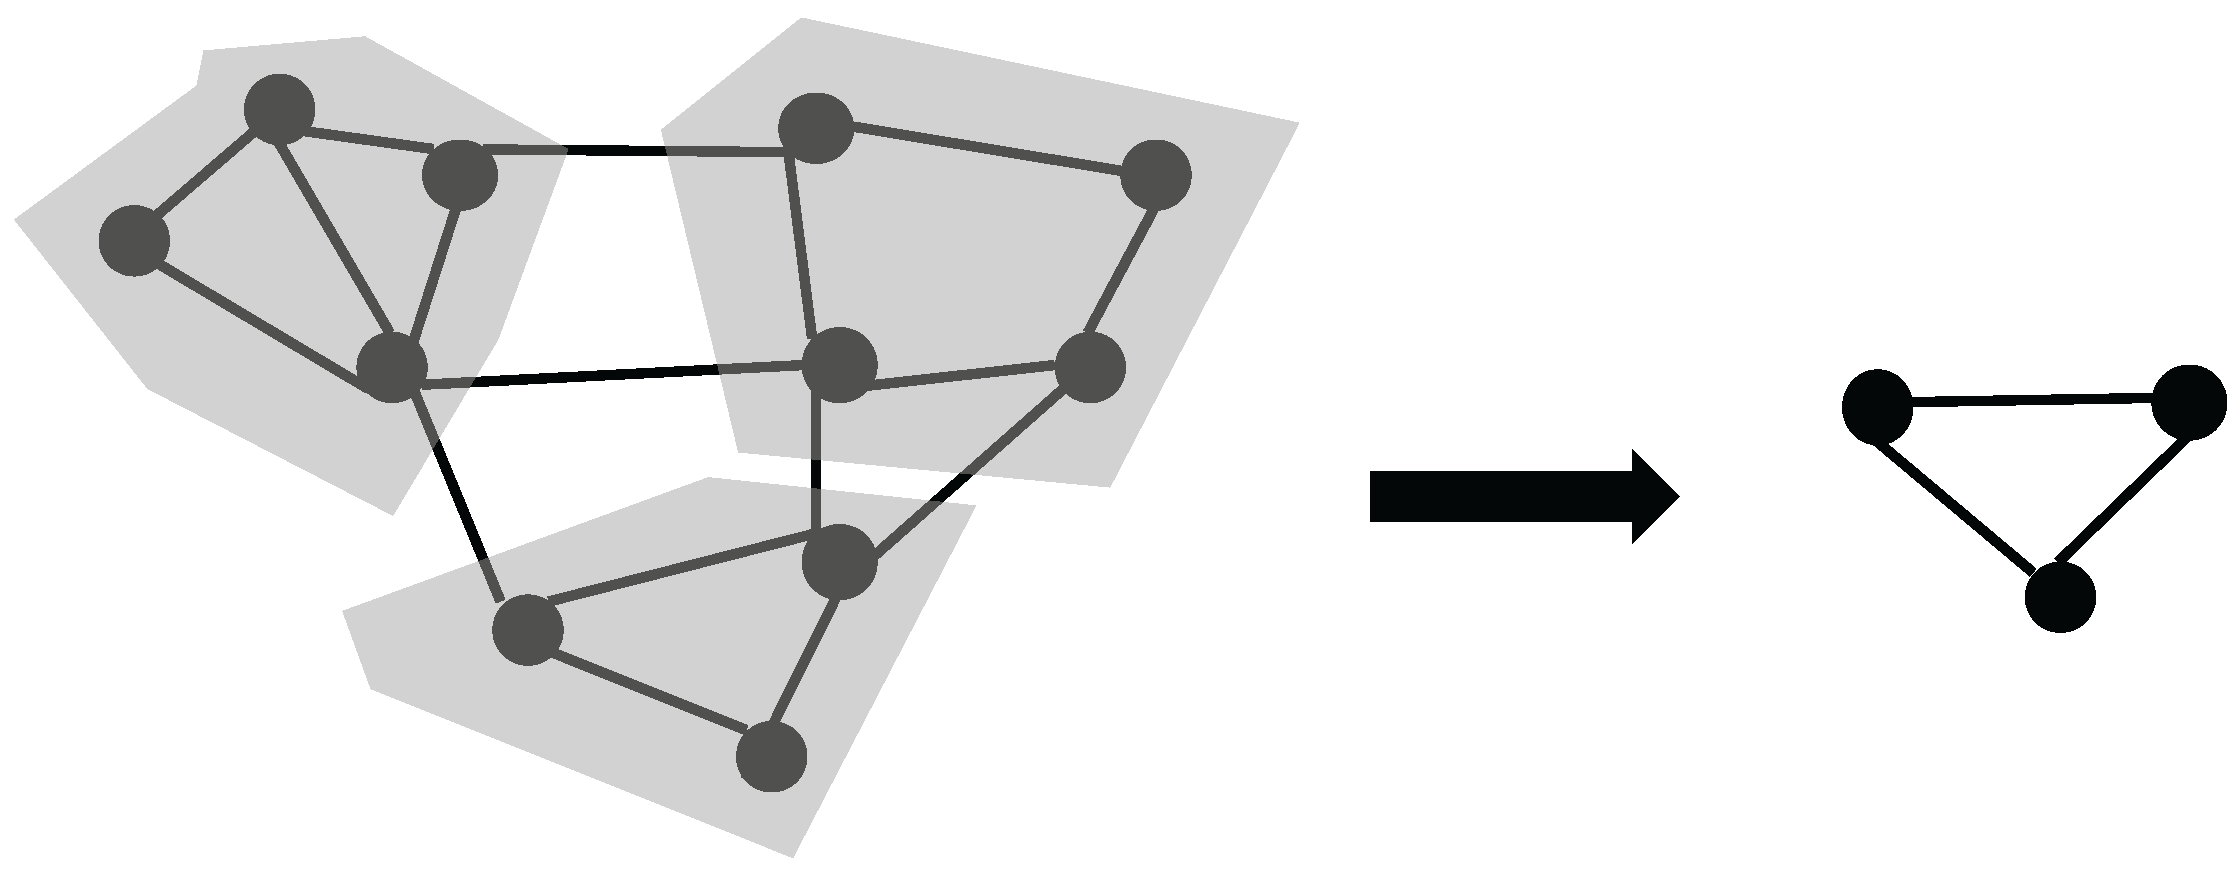
Figure 3.
An example of the GPU memory organization of three-levels of graphs. Node-link diagrams (right) show the corresponding level graphs. Several data arrays (left) are stored in GPU memory to represent these graphs. In this figure, is the original graph, which is partitioned into four sub-graphs. is the coarsened graph of the original graph, and is partitioned into two sub-graphs. is the coarsest graph.

Figure 4.
The GPU computation flowchart for a single level graph layout. The kernels of attractive forces and approximated repulsive forces are described in Algorithms 1 and 2.
Figure 4.
The GPU computation flowchart for a single level graph layout. The kernels of attractive forces and approximated repulsive forces are described in Algorithms 1 and 2.
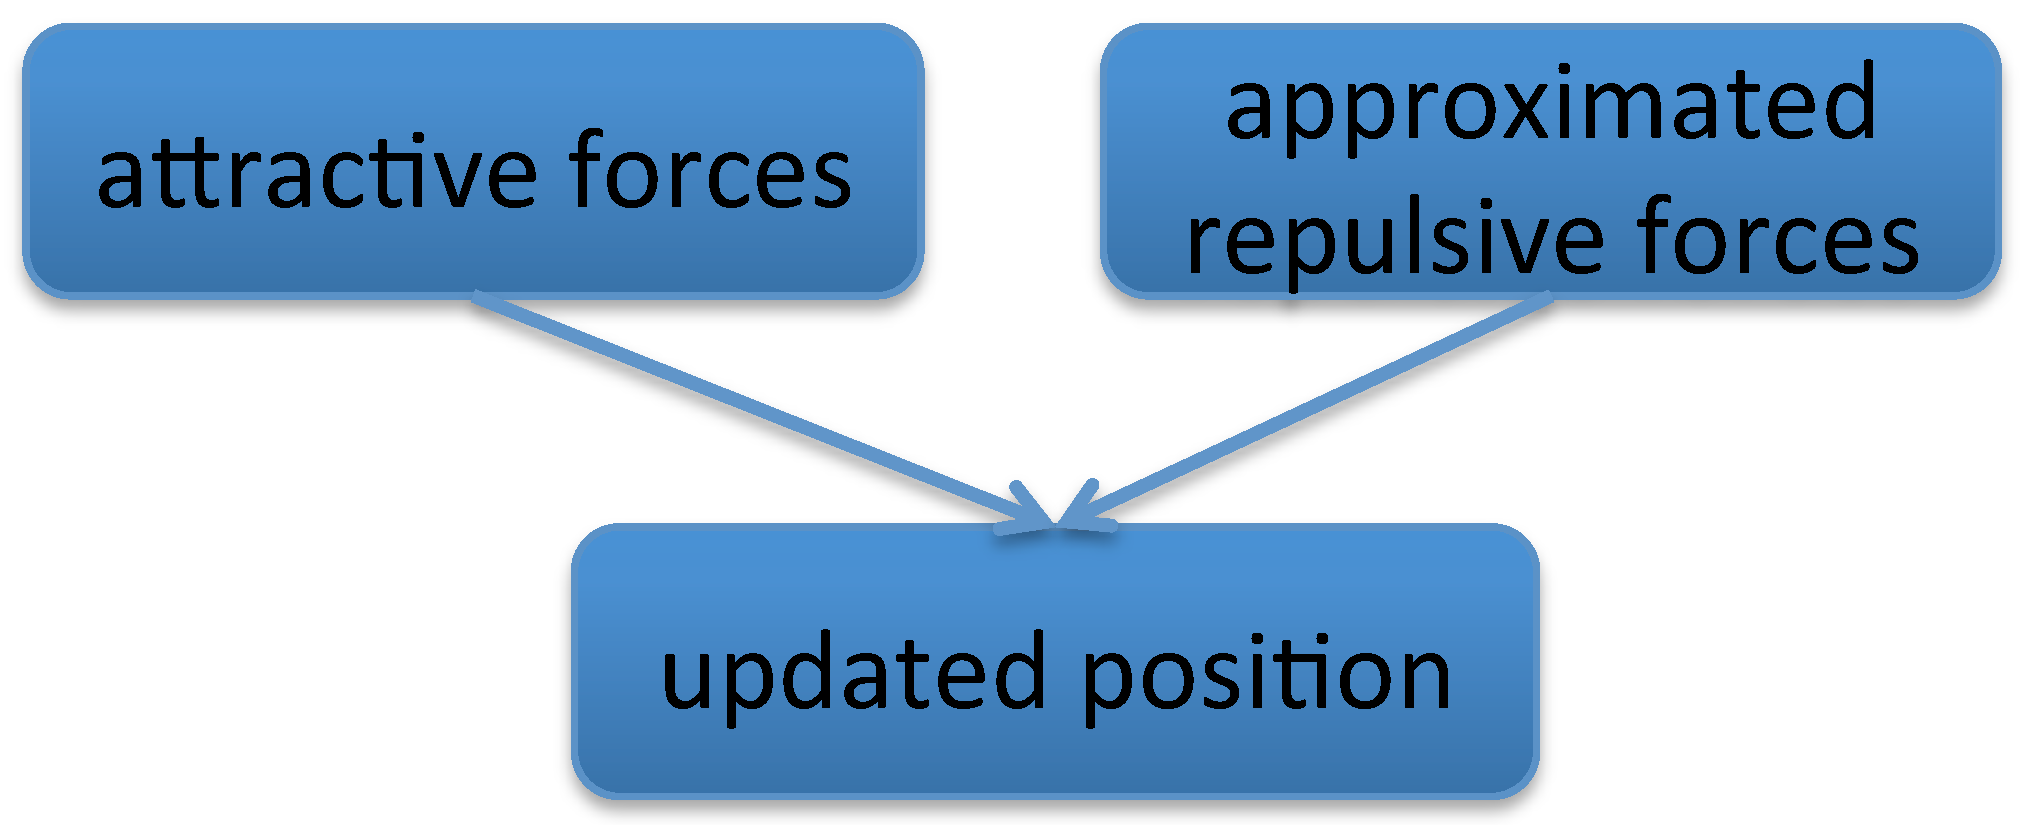
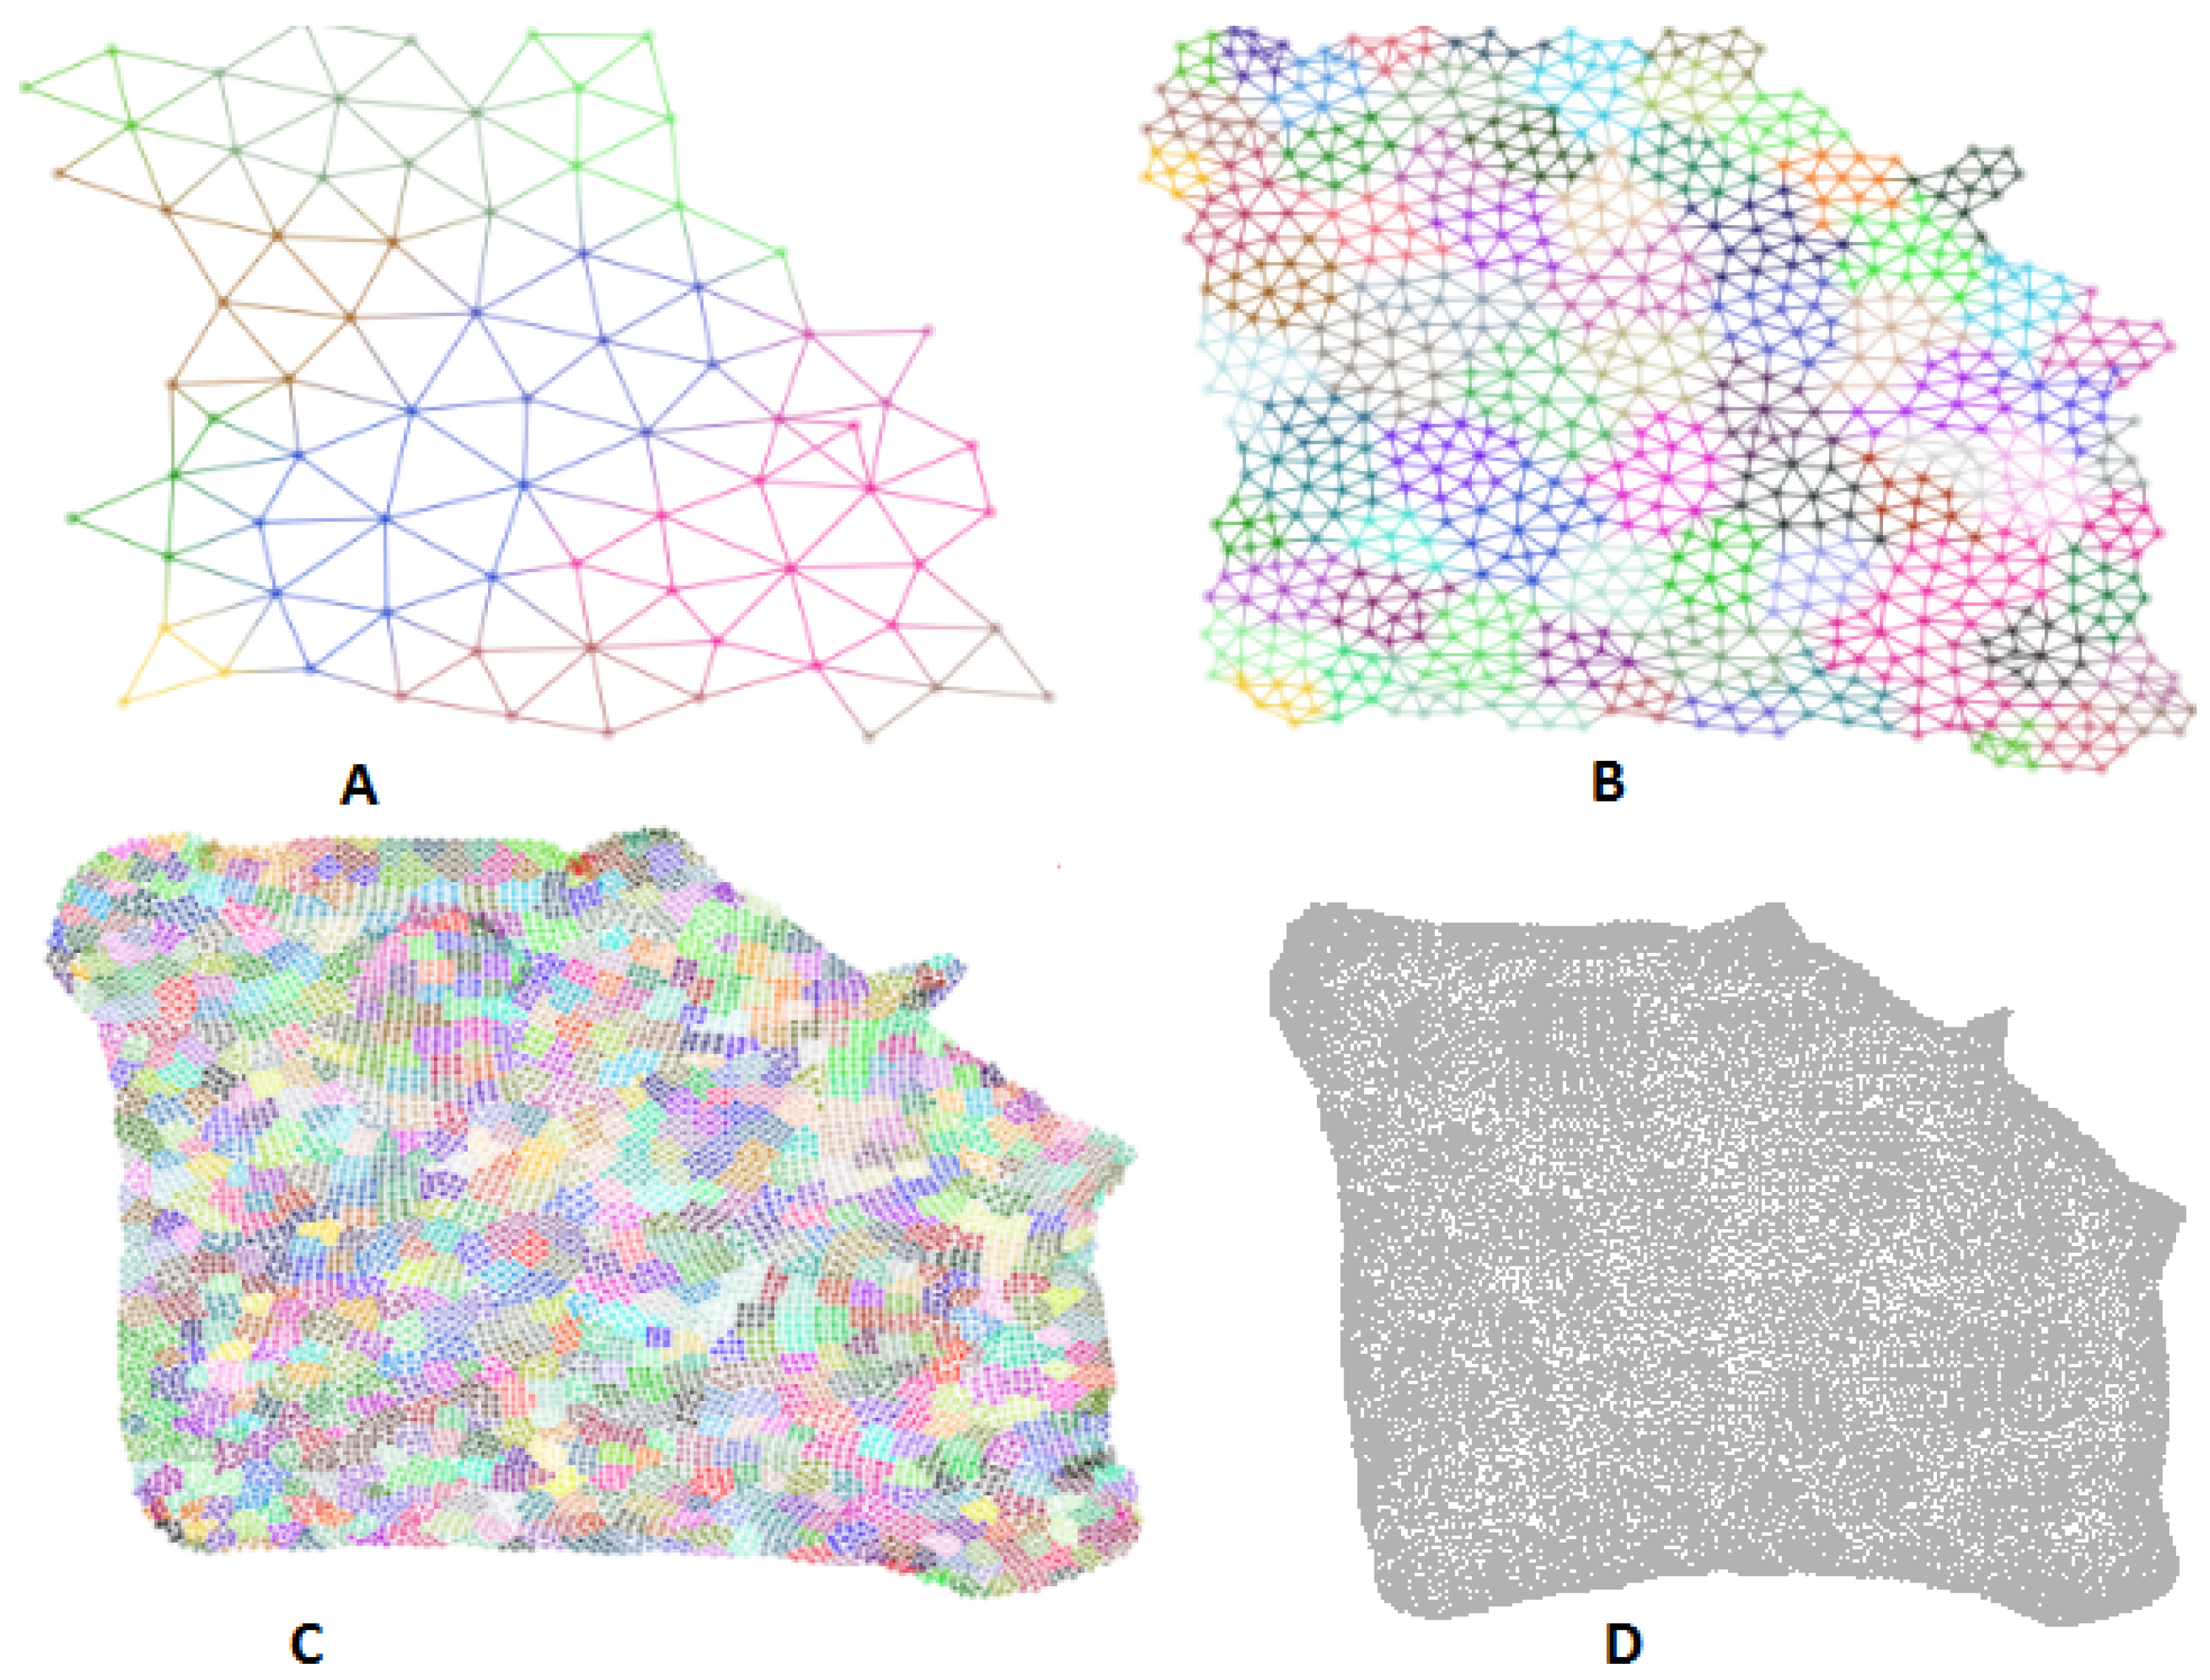
Figure 5.
The crack layout results. (A–C) are three levels of coarsened graphs generated by our algorithm (graph nodes colored by cluster membership); (D) is the result from implemented by ODGF [40].
Figure 5.
The crack layout results. (A–C) are three levels of coarsened graphs generated by our algorithm (graph nodes colored by cluster membership); (D) is the result from implemented by ODGF [40].

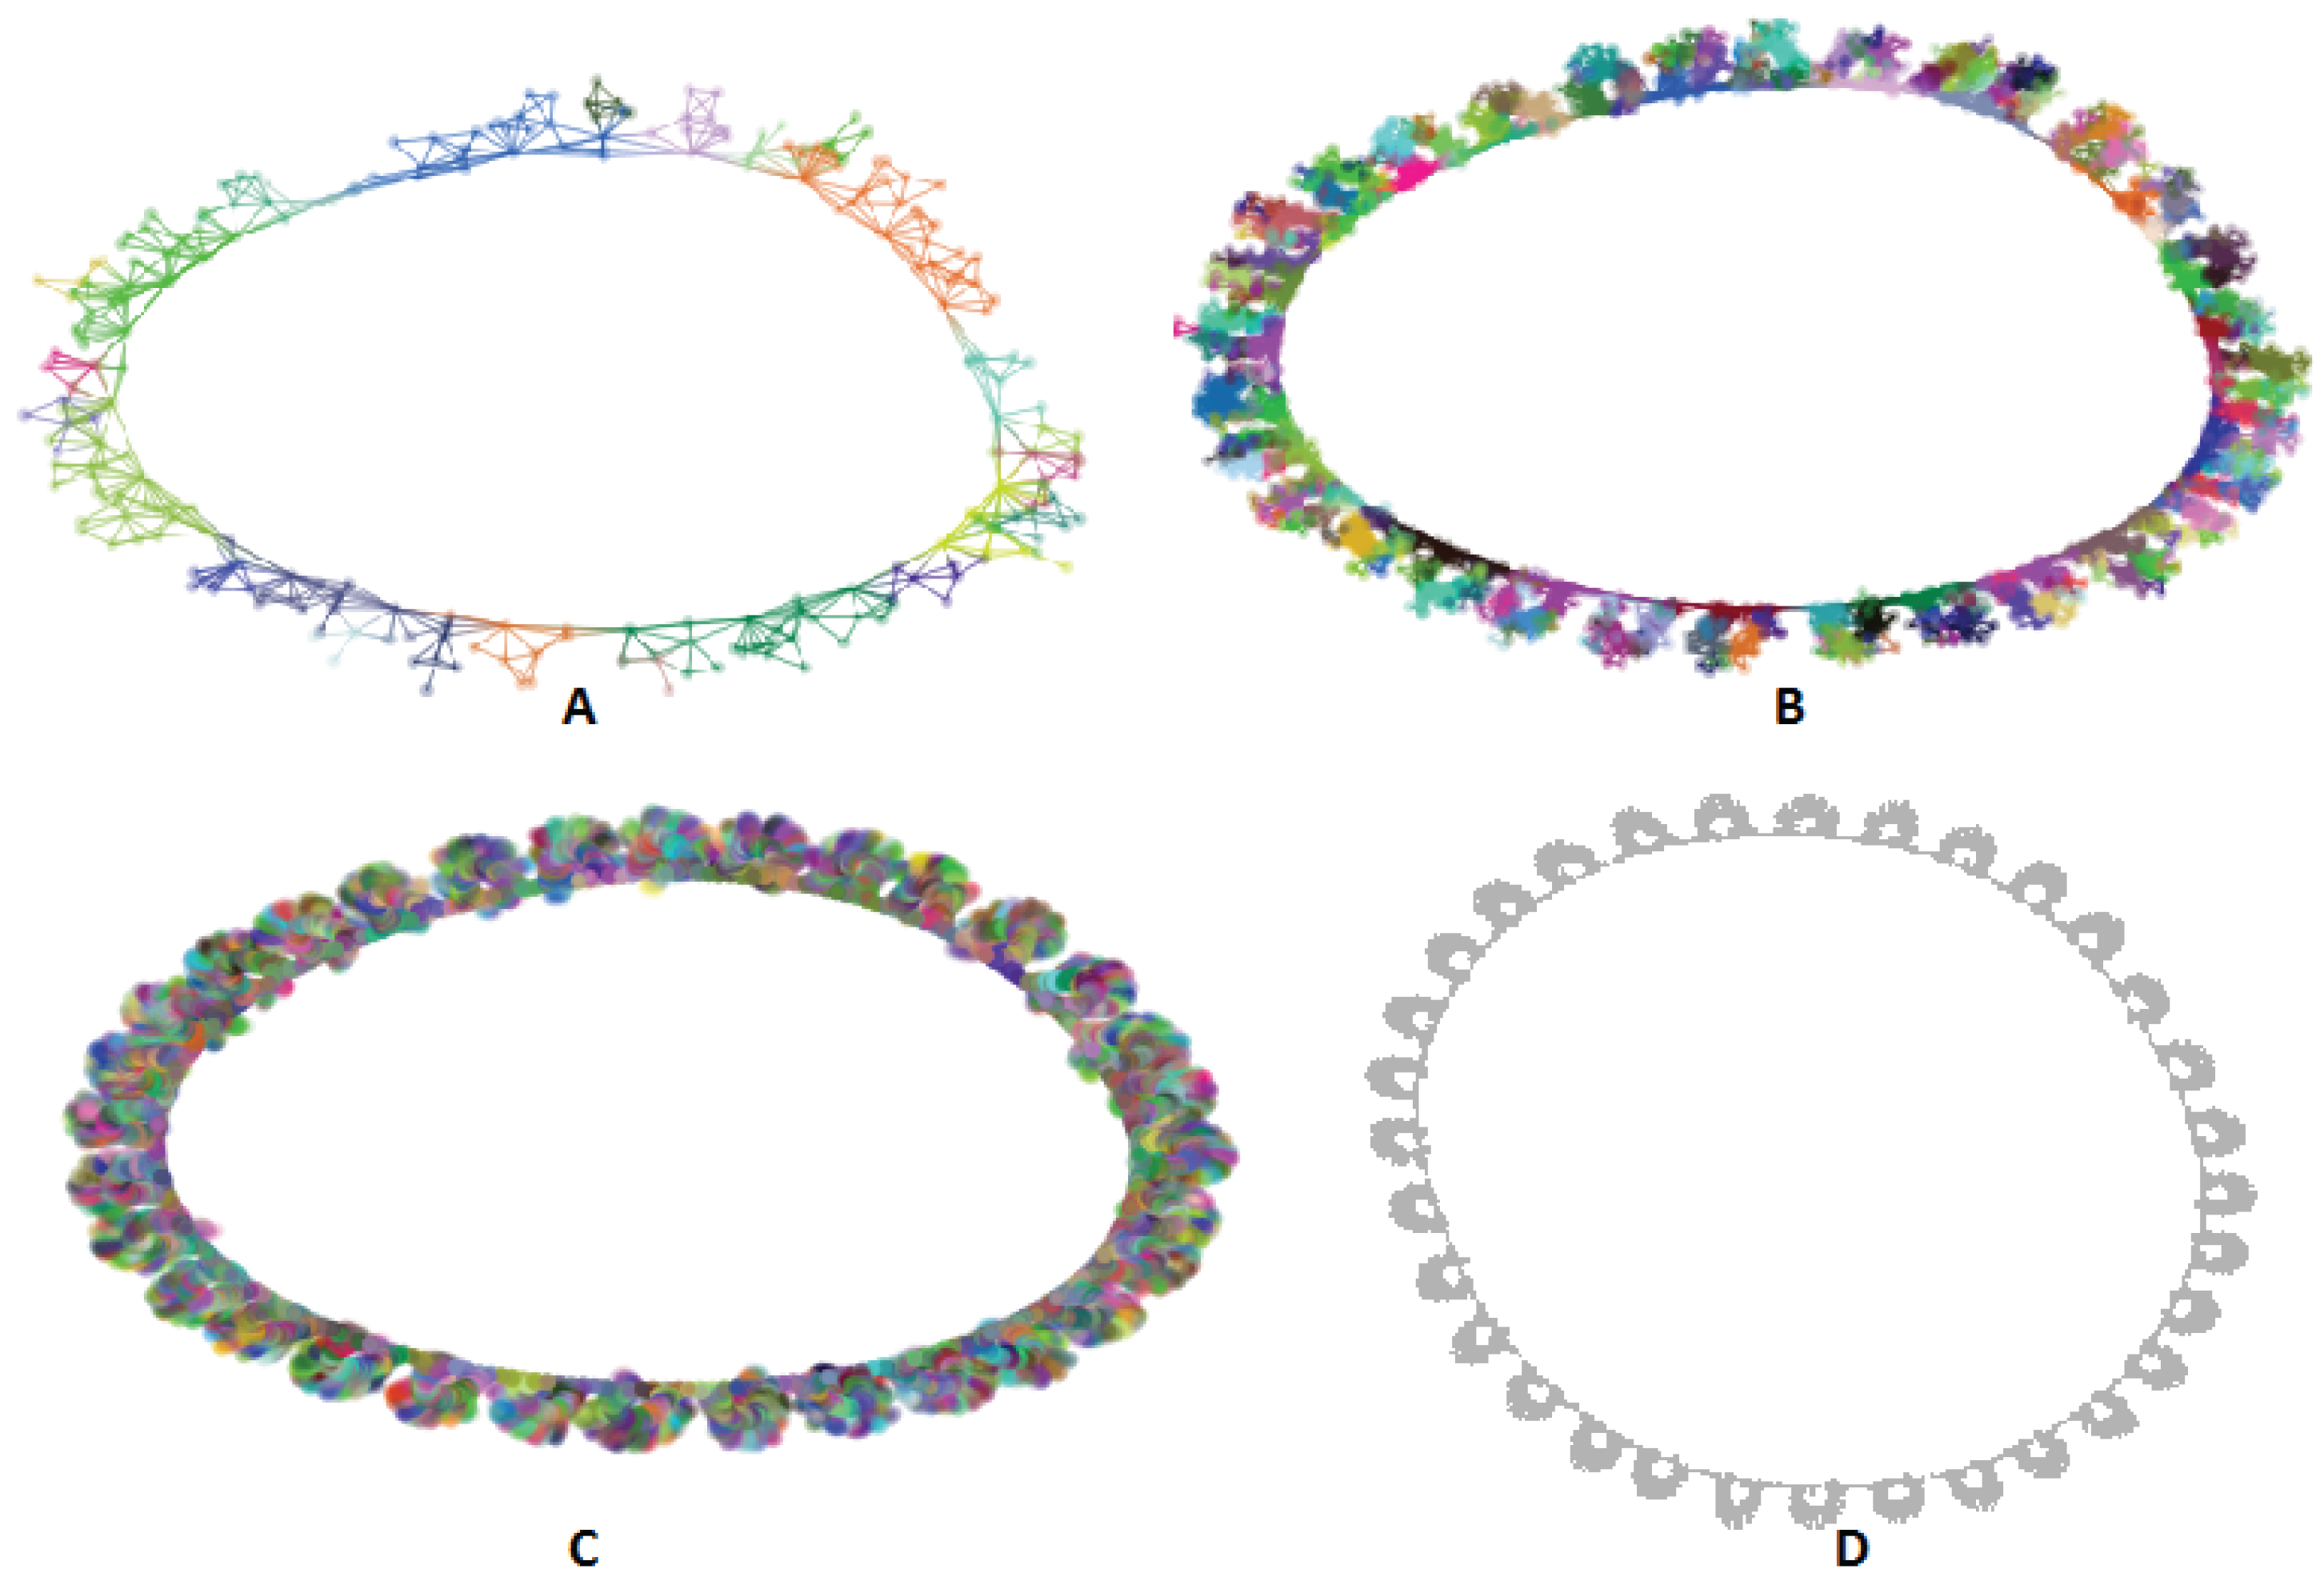
Figure 6.
The finan512 layout results. (A–C) are three levels of coarsened graphs generated by our algorithm (graph nodes colored by cluster membership); (D) is the result from implemented by ODGF [40].
Figure 6.
The finan512 layout results. (A–C) are three levels of coarsened graphs generated by our algorithm (graph nodes colored by cluster membership); (D) is the result from implemented by ODGF [40].

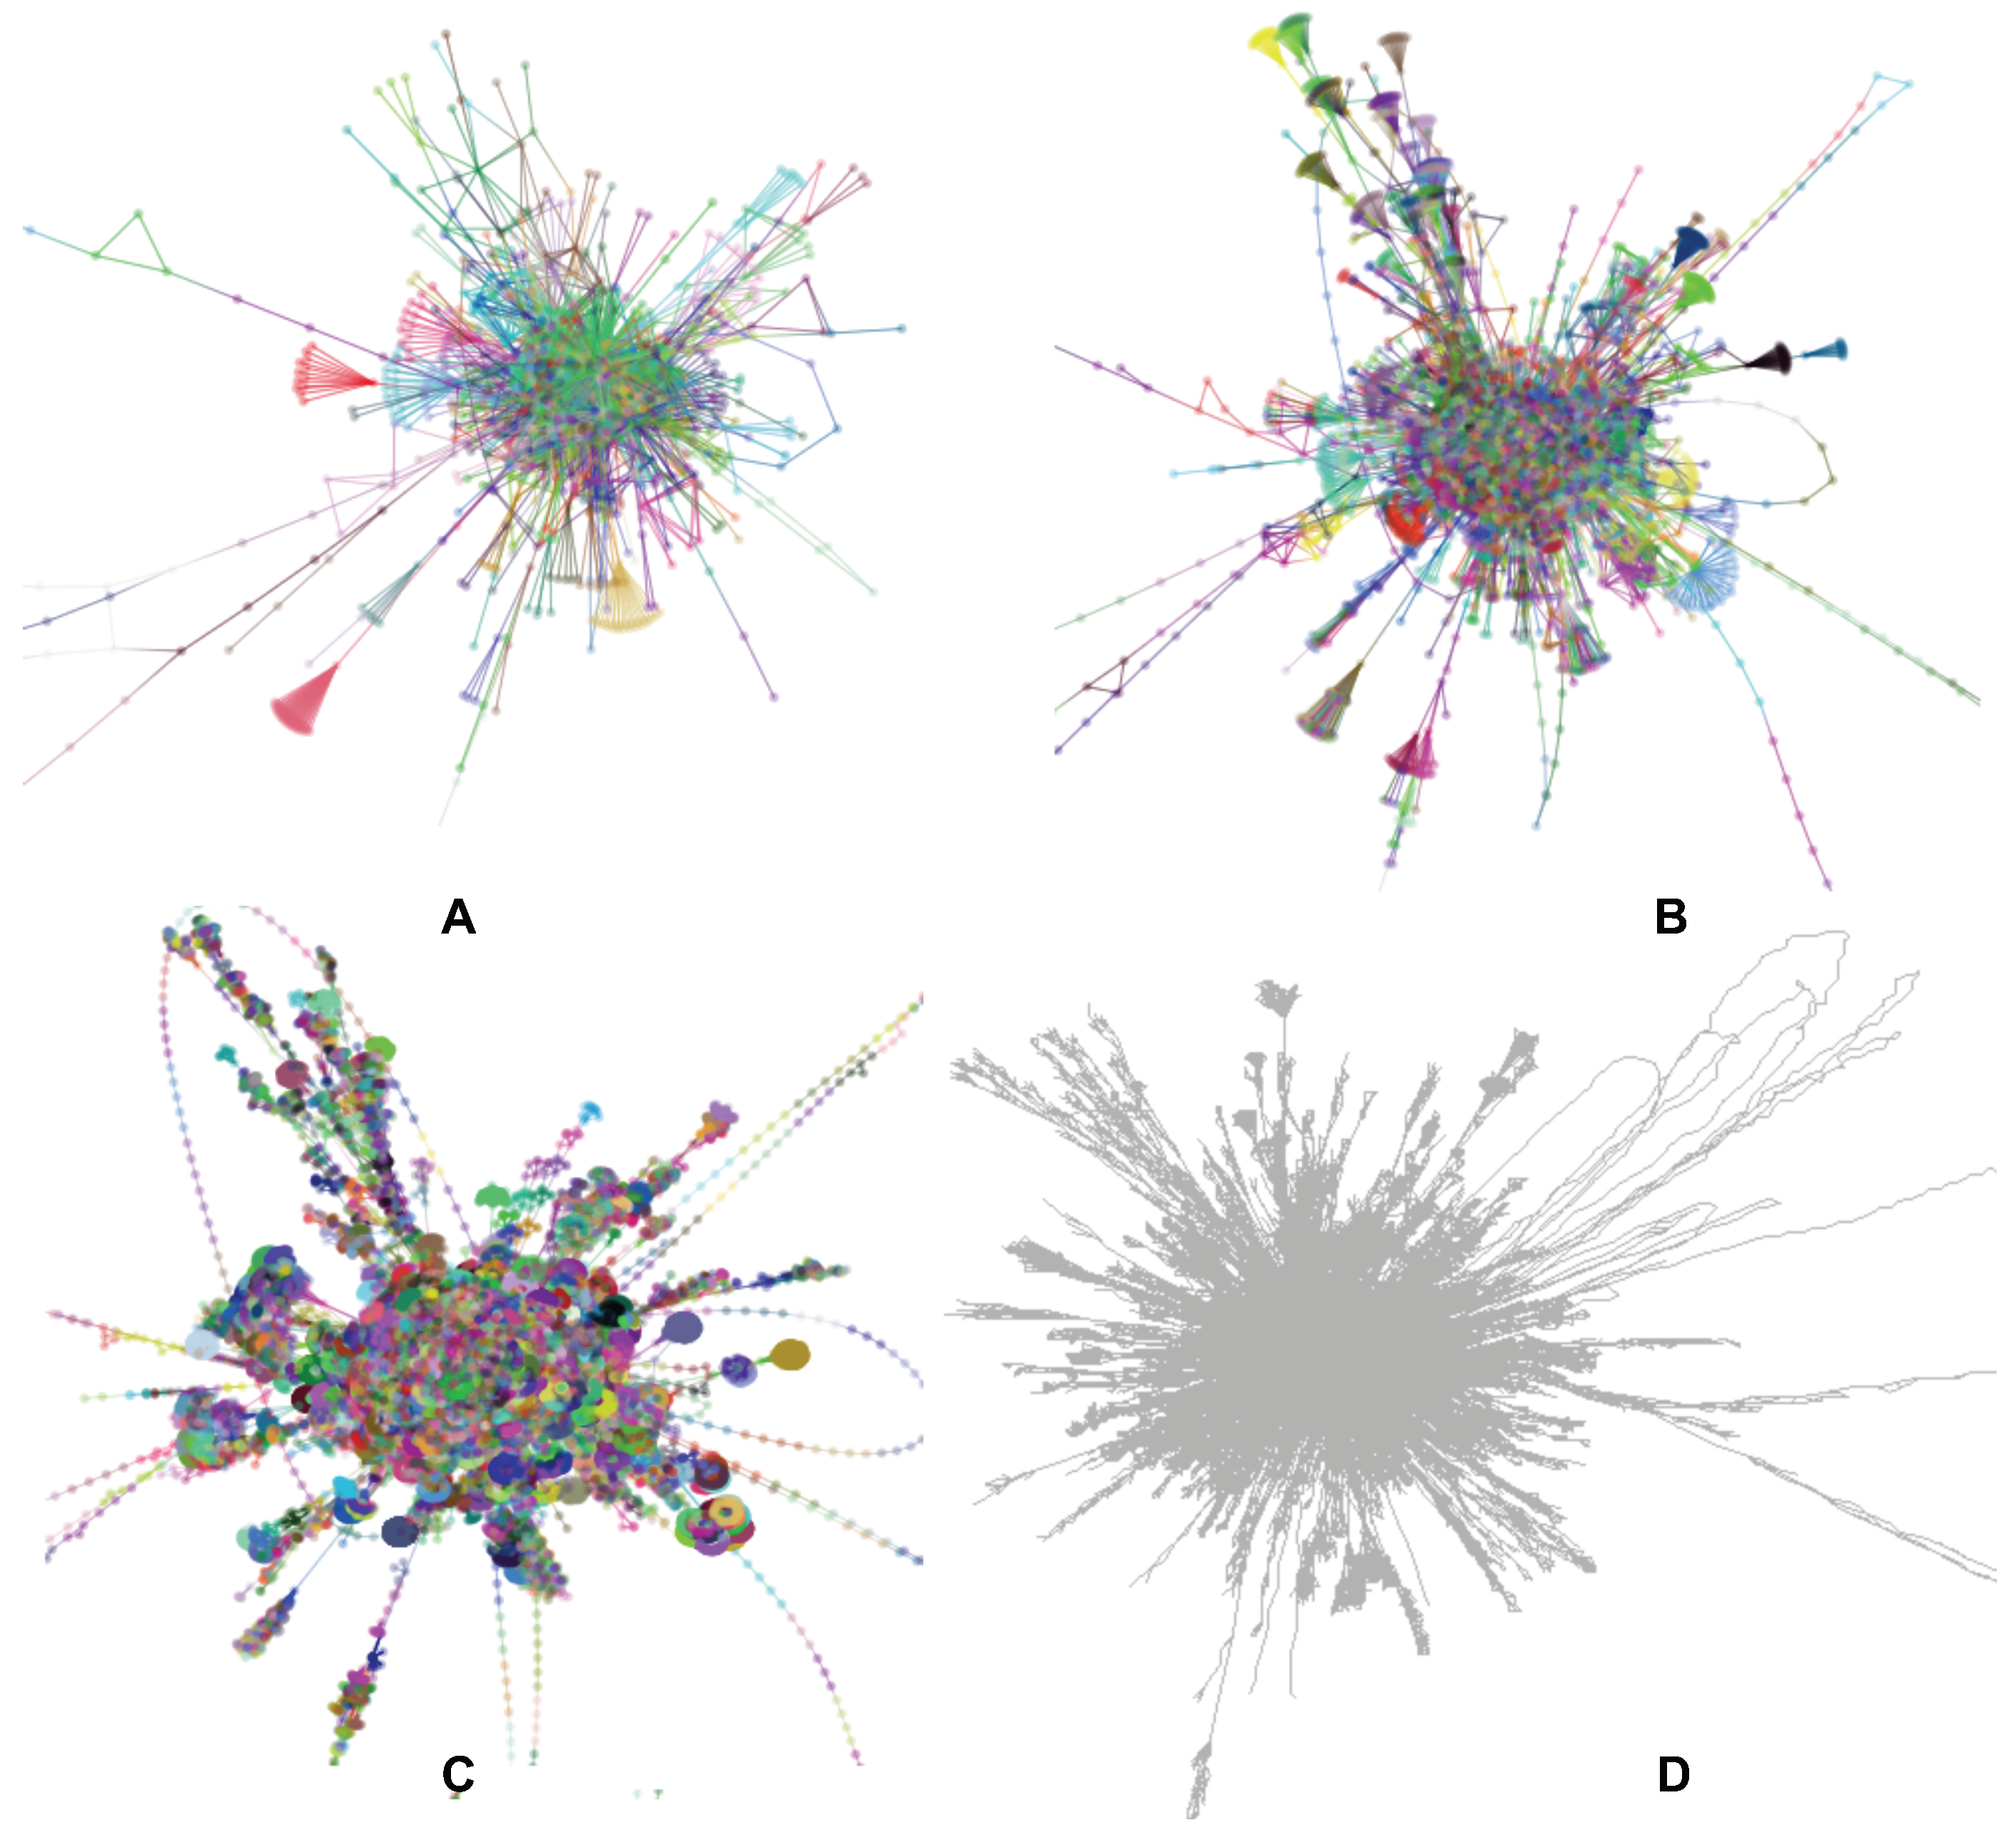
Figure 7.
The web-Stanford layout results. (A–C) are three levels of coarsened graphs generated by our algorithm (graph nodes colored by cluster membership); (D) is the result from implemented by ODGF [40].
Figure 7.
The web-Stanford layout results. (A–C) are three levels of coarsened graphs generated by our algorithm (graph nodes colored by cluster membership); (D) is the result from implemented by ODGF [40].

Figure 8.
The sub-graph distribution of web-Stanford. The X-axis is the number of nodes, the Y-axis is the number of sub graphs containing that many nodes. It follows a power law distribution.
Figure 8.
The sub-graph distribution of web-Stanford. The X-axis is the number of nodes, the Y-axis is the number of sub graphs containing that many nodes. It follows a power law distribution.
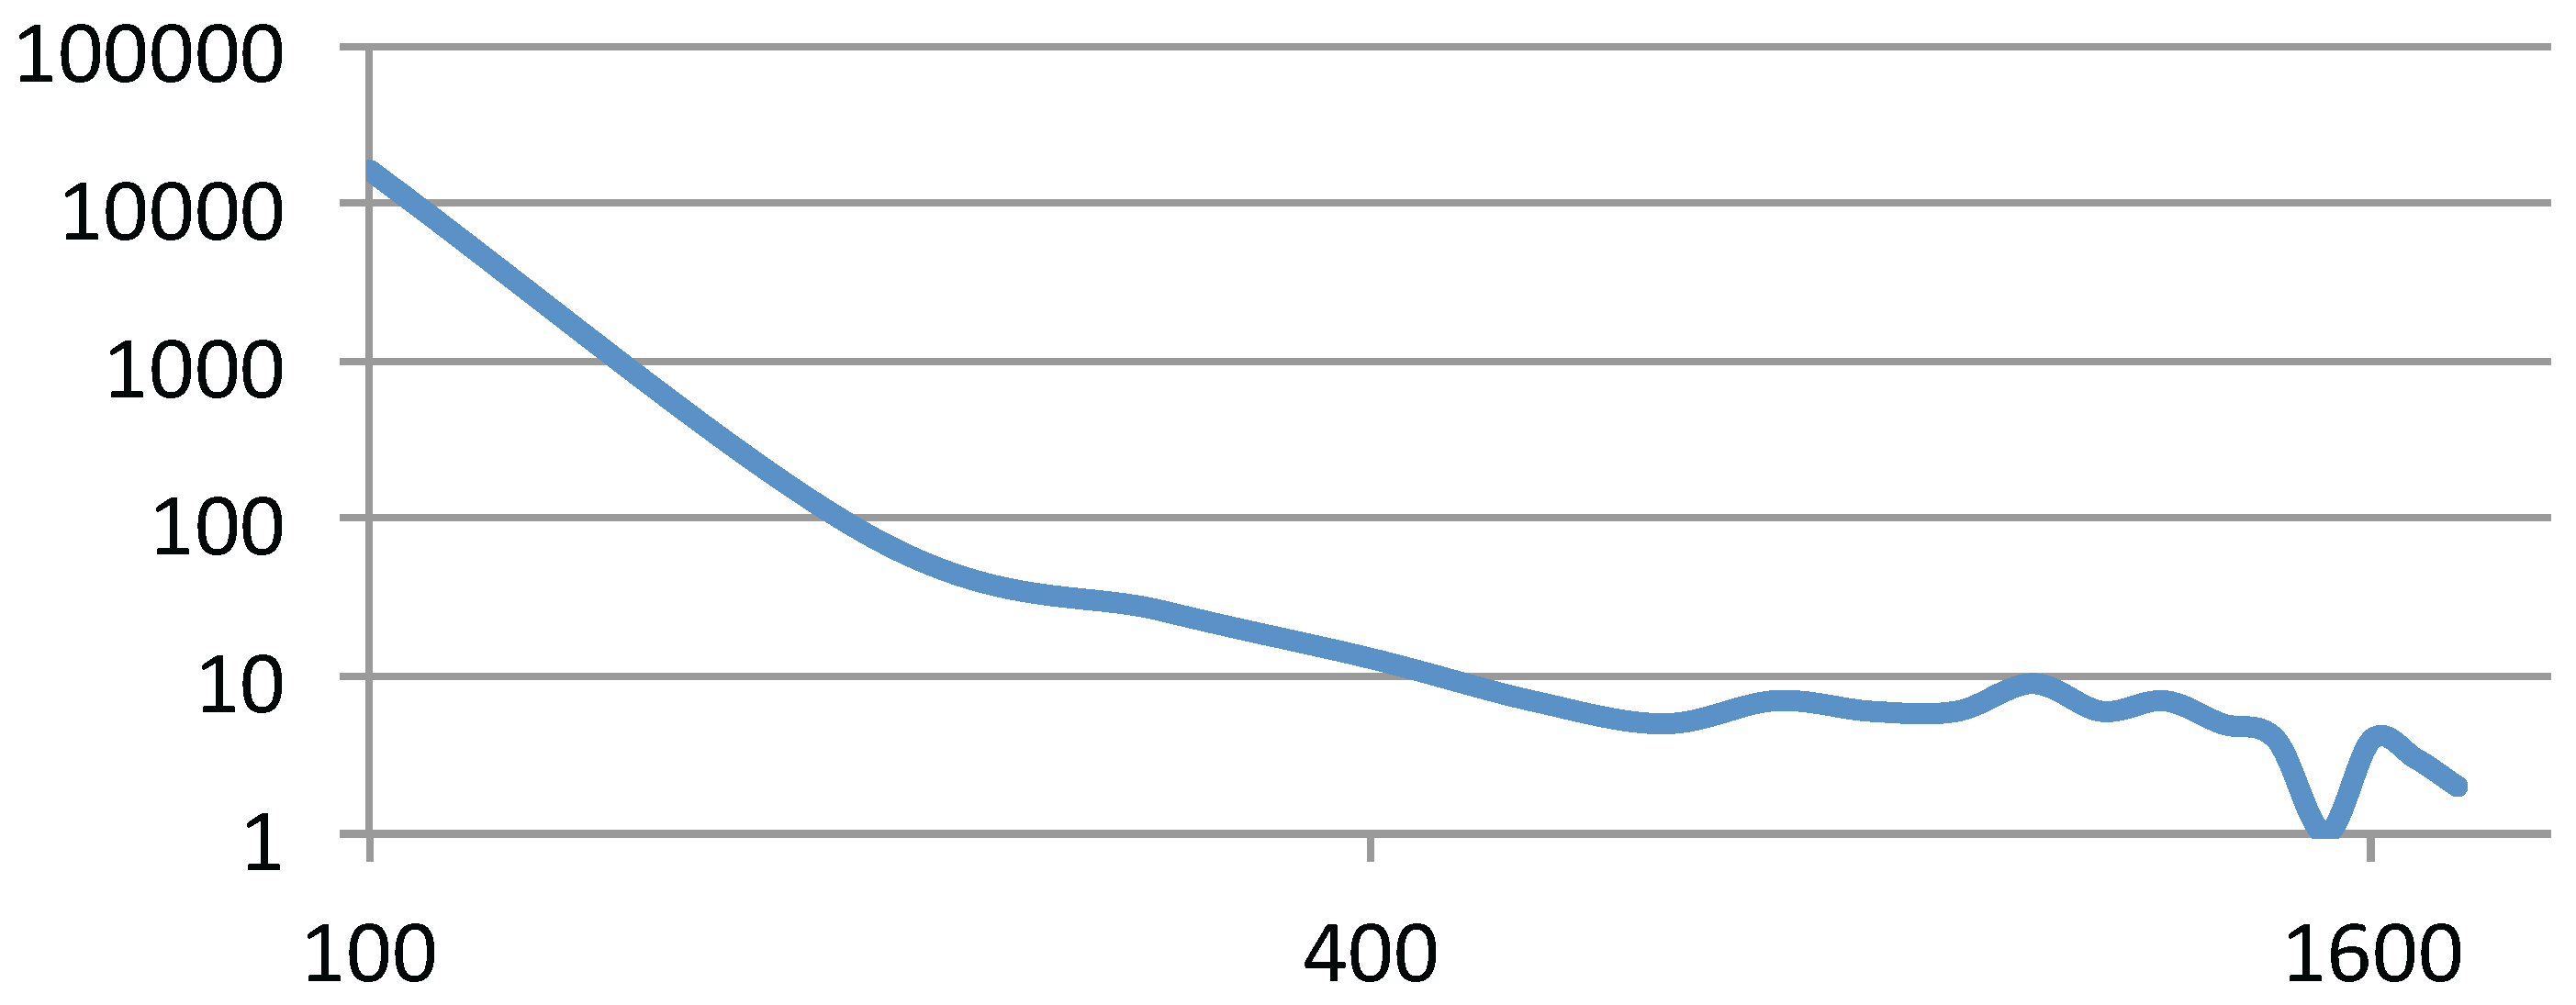
Figure 9.
The performance of grid-mesh layouts. The X-axis is the number of vertices, and the Y-axis is the performance time. The average P of each cluster is 9, based on the solar merger algorithm.
Figure 9.
The performance of grid-mesh layouts. The X-axis is the number of vertices, and the Y-axis is the performance time. The average P of each cluster is 9, based on the solar merger algorithm.

Figure 10.
Four level coarsen graph layout of web-Stanford data (graph nodes colored by cluster membership). From coarse to fine, the graph levels are ,,,. The red and blue circles are highlighted sub-graphs.
Figure 10.
Four level coarsen graph layout of web-Stanford data (graph nodes colored by cluster membership). From coarse to fine, the graph levels are ,,,. The red and blue circles are highlighted sub-graphs.

Figure 11.
The graph layout of the DBLP co-authorship network, showing a series of interactions. (A) shows the initial graph layout using the algorithm. The remaining figures show the very similar, but interactive, layout using our algorithm. In (B), Jean-Daniel Fekete is dragged away from the network center (the user selected community is automatically highlighted in green). (C, D) are snapshots of the resulting dynamic layout movement. In (E), Hans Hagen is dragged away from the network center. (F, G, H) show resulting node movement.

Figure 12.
The flow chart of the iteration cycle of our large graph layout system. User interactions are inserted into iterative graph layout algorithm. During each iteration of the force directed layout algorithm, user interaction data are passed to the GPU to compute forces, and then visual primitives are updated based on the force calculations. To support interactivity, these iterations must be as light-weight as possible.


| Graph | Number of Vertices | Number of Edges |
|---|---|---|
| crack | 10,240 | 30,380 |
| finan512 | 74,752 | 261,120 |
| web-Stanford | 255,265 | 1,941,926 |
| grid-mesh | 1,000,000 | 1,998,000 |
| roadNet-TX | 1,379,917 | 3,843,320 |
| Performance | Crack | Finan512 | Web-Stanford | Grid-Mesh | RoadNet-TX |
|---|---|---|---|---|---|
| on CPU | 63.900 | 630.000 | 2581.399 | 7814.100 | 11,484.799 |
| Our approximated force calculation on CPU | 6.799 | 83.738 | 337.049 | 476.548 | 473.564 |
| GPU Kernel Attractive-Force | 0.315 | 0.660 | 38.177 | 1.287 | 1.767 |
| GPU Kernel Approximated Repulsive-Force | 2.099 | 3.887 | 28.184 | 14.484 | 17.819 |
| GPU Kernel Updated-Position | 0.007 | 0.008 | 0.015 | 0.013 | 0.011 |
| GPU Others | 0.302 | 0.383 | 0.728 | 1.296 | 1.727 |
| GPU Total | 2.732 | 4.938 | 67.104 | 17.080 | 21.324 |
| Rendering (graph nodes) | 0.809 | 1.288 | 2.252 | 4.958 | 9.727 |
© 2016 by the authors; licensee MDPI, Basel, Switzerland. This article is an open access article distributed under the terms and conditions of the Creative Commons Attribution license ( http://creativecommons.org/licenses/by/4.0/).
Share and Cite
MDPI and ACS Style
Mi, P.; Sun, M.; Masiane, M.; Cao, Y.; North, C. Interactive Graph Layout of a Million Nodes. Informatics 2016, 3, 23. https://doi.org/10.3390/informatics3040023
AMA Style
Mi P, Sun M, Masiane M, Cao Y, North C. Interactive Graph Layout of a Million Nodes. Informatics. 2016; 3(4):23. https://doi.org/10.3390/informatics3040023
Chicago/Turabian StyleMi, Peng, Maoyuan Sun, Moeti Masiane, Yong Cao, and Chris North. 2016. "Interactive Graph Layout of a Million Nodes" Informatics 3, no. 4: 23. https://doi.org/10.3390/informatics3040023
Note that from the first issue of 2016, this journal uses article numbers instead of page numbers. See further details here.