
Assessing the Cost Impact of Multiple Transportation Modes to Enhance Sustainability in an Integrated, Two Stage, Automotive Supply Chain

1
WestRock, 3950 Shackleford Rd, Duluth, GA 30096, USA
2
Department of Industrial Engineering, Clemson University, 273 Freeman Hall, Clemson, SC 29634, USA
*
Author to whom correspondence should be addressed.
Informatics 2017, 4(4), 34; https://doi.org/10.3390/informatics4040034
Submission received: 25 June 2017
/
Revised: 10 September 2017
/
Accepted: 25 September 2017
/
Published: 28 September 2017
(This article belongs to the Special Issue Decision Support for Sustainable Supply Chain Design and Management)
Abstract
:As the automotive industry has been striving to enhance its efficiency, competitiveness, and sustainability, great focus is often placed on opportunities for improving its supply chain operations. We study the effect of introducing multiple modes of transportation in an industry-motivated production and transportation problem involving short-term automotive supply chain planning. We consider multiple, heterogeneous modes of transportation that offer a cost vs. delivery time option to the manufacturer. Having multiple modes of transportation in the system promotes supply chain sustainability. We present an integer linear programming model that captures the availability of multiple transportation modes. We then provide a solution approach based on a hybrid simulated annealing algorithm that we use to analyze the problem. Experimental results demonstrate the impact of additional transportation mode lead times compared to costs in the integrated supply chain.
1. Introduction
In the automotive industry, companies actively seek opportunities to enhance efficiency while meeting or exceeding customer expectations and government regulations. For instance, to enhance sustainability, the industry introduced electric and hybrid vehicles, striving to reduce emissions of gasoline and diesel engines. Furthermore, great focus is often placed on opportunities for improving automotive supply chain operations. We study the impact of multiple transportation modes on total integrated cost (setup, inventory holding, transportation, and outsourcing cost) minimization in a real-world production and transportation planning problem of a Tier-1 automotive supplier dealing with short-term automotive part order planning. The two-stage automotive supply chain under study is based on several realistic conditions. In the integrated supply chain’s first stage, production, there are sequence-dependent setups on multiple injection molding machines operating in parallel, auxiliary resource assignments of overhead cranes, and multiple types of costs. The integrated supply chain’s second stage, transportation, consists of capacitated vehicles that deliver finished parts to multiple distribution centers (DCs) for meeting customers’ predefined due date requirements. Multiple transportation modes are available with fixed transportation costs from the plant to each DC. The supply chain only allows direct deliveries without any intermediate stops (i.e. only one customer per trip) via an unlimited (i.e. infinite) transportation fleet (Figure 1). Since the manufacturer subcontracts transportation, we assume any number of delivery vehicles will be available as needed.
Along with full truck load (TL), an additional mode of transportation can be intermodal, which is a combination of two or more transportation modes. In our research problem, intermodal can be: plant-truck-rail-truck-distribution center. Rail transportation has several advantages as it is fuel efficient and thus environmental friendly; it contributes to reducing traffic congestion in the road network by reducing the number of trucks on the road and thus preserving the road conditions for longer times, and it is also cost competitive. For example, it is estimated that moving freight by rail instead of truck reduces greenhouse gas emissions by 75 percent [1]. Therefore having multiple modes of transportation in the system promotes supply chain sustainability. However, it is important for decision makers to understand the impact of this strategy on total integrated cost.
While all modes of transportation deliver to the same destinations (DCs), their costs and lead times vary. Modeling this aspect of the problem helps decision makers decide between different transportation alternatives based on their impact on the objective function (i.e. total integrated cost). The goal of this research study is to provide insights for decision makers on planning for the right production, inventory, transportation, and outsourcing quantities over the planning horizon by considering the multiple modes of transportation simultaneously, enhancing the supply chain sustainability.
The rest of this paper is organized as follows. Section 2 reviews some of the related literature. Section 3 provides an integer linear programming model that captures the details of the current research problem as well as a metaheuristic solution method. Section 4 presents the numerical experiment results, including a comparison of the results from different transportation mode cost and lead time multiples. Conclusions and directions for future research are outlined in Section 5.
2. Literature Review
The literature on sustainable supply chain management in 191 papers published from 1994 to 2007 is reviewed by Seuring and Muller [2]. The review considers three aspects of sustainability: economic, environmental, and social. The paper also pinpoints barriers and supporting factors for implementing sustainable supply chains. Higher costs are one of three barriers, in addition to coordination complexity and communication in the supply chain. Next, modeling approaches for sustainable supply chain management are reviewed by Seuring [3]. The author identifies only 36 quantitative papers out of a total of over 300 papers on sustainable supply chains. The author suggests that there has been only limited empirical research published so far. Integration of economic and environmental aspects in sustainable supply chain management is reviewed by Darom and Hishamuddin [4]. The authors emphasize that future studies should include more factors from real life supply chain scenarios. A framework and further research directions for sustainable supply chain management is presented by Dubey et al. [5]. The paper attempts to develop a theoretical framework explaining the complex interactions of variables in the dynamic environment of sustainable supply chain management by using the Total Interpretive Structural Modeling technique. The sustainability of the UK automotive supply chain is assessed by Azevedo and Barros [6]. The study is based on a proposed sustainability index for the automotive industry from the literature. The authors find the sustainability of the UK automotive supply chain has improved over the last decade.
An integrated approach for multi-plant, multi-retailer, multi-item, and multi-period production and distribution planning in supply chain management is developed by Park [7]. The author proposes mixed-integer models and a heuristic for solving the problem. Results show the heuristic performs well on small-sized problems in both optimality approximation and computation time. An approach to integrate production and transportation planning and scheduling in a real-life case of a three stage, aluminum supply chain network is presented by Steinrücke [8]. The mixed-integer model minimizes production, transportation, and bonus costs. The authors develop relax-and-fix heuristics that achieve near-optimal solutions while drastically reducing computation times.
Integrated tactical planning optimization in the lumber supply chain is studied by Bajgiran et al. [9]. The authors model harvesting, procurement, production, distribution, and sale decisions in the lumber supply chain in an integrated manner. It is demonstrated that substantial cost/revenue improvement can be reached by using an integrated tactical planning model. Production and inter-facility transportation scheduling for process industries is studied by de Matta and Miller [10]. The authors develop a dynamic production and transportation decision model to simultaneously determine the cost minimizing quantities of products an intermediate plant must produce and ship to a finishing plant using different transportation modes. Furthermore, the model simultaneously determines the cost minimizing quantities of products that the finishing plant must produce to meet its customer demands on-time. One of the several benefits of coordinating production and transportation decisions is that it helps control the use of expedited transportation options through timely shipments of sufficient intermediate product quantities via the normal, “less” expensive mode to meet the input requirements of the finishing plant.
A general two-stage logistics scheduling with batching and transportation problem is presented by Chen and Lee [11]. The problem involves jobs of different importance being processed by one first-stage processor and then, in the second stage, the completed jobs must be batch-delivered to various pre-specified destinations in one of a number of available transportation modes. The objective is to minimize the sum of weighted-job delivery time and total transportation cost. The paper provides an overall picture of the problem complexity for various cases and problem parameters and gives polynomial algorithms for solvable cases. On the other hand, for the most general case, an approximation algorithm of performance guarantee is presented. Minimizing the total cost of logistics and carbon emissions in intermodal transportation is studied by Zhang et al. [12]. The authors propose an integer programming model to illustrate the impact of considering carbon emissions on intermodal transportation decisions.
A framework and models to improve order-driven planning in automotive production are presented by Volling and Spengler [13]. The presented framework involves separate, interlinked mathematical models for order promising and master production scheduling. The models are evaluated utilizing simulation with data from the automotive industry. The concept of transportation-oriented scheduling in the automotive industry is investigated by Florian et al. [14] who present a simulation model using real scheduling data to demonstrate the potential savings realized by means of smoothing and bundling demands in scheduling. The planning approach increases utilization and reduces CO2 emissions.
Integrated optimization of customer and supplier logistics at a leading automotive supplier is studied by Yildiz et al. [15]. The authors identify the opportunity for cost savings by using a mixed-integer programming model that matches opposite flows from and to customers and suppliers. It is assumed that the automotive supplier makes all transportation arrangements for its customers and suppliers. The automotive supplier utilizes the unused capacity of return trips from their customers by identifying a subset of promising customer routes that can be combined with its existing supplier routes through cross-docking, to save overall system costs.
Modeling the relationship between the adoption of lean principles and the performance of supplier companies and its application to Turkish automotive part suppliers are studied by Sezen et al. [16]. The study finds that that there is a significant relation between the adoption of lean principles by the supplier firms and their performance. An Australian perspective on strategic supply chain management issues in the automotive industry is presented by Singh et al. [17]. The exploratory study highlights a number of structural weaknesses in the industry and describes 10 important issues that characterize supply chains in the Australian automotive manufacturing industry. A mathematical cost model to study the trade-offs between kitting and line stocking for part feeding in the automotive assembly is provided by Limere et al. [18]. The authors apply the model to a case study from the automotive industry. The results show that to avoid a steep increase in costs, which would result from kitting all parts, a fraction of the parts is identified for kitting by the model that minimizes the total cost while satisfying the space constraint. A mixed-integer linear programming model for an integrated production and transportation planning problem of a Tier-1 automotive supplier is developed by Masoud and Mason [19]. The authors also present a hybrid simulated annealing algorithm to solve the problem to near optimality in a timely manner. In the automotive supply chain second stage, transportation occurs via full truck load (TL) only. The paper does not deal with having multiple modes of transportation in the supply chain to mitigate the adverse effects of using the TL mode on the environment.
In the current research, we introduce a model that recommends time-phased production, inventory, and shipping decisions. Although some research on optimization models involving production scheduling, transportation, and the automotive industry exists in the literature, none focuses on modeling heterogeneous transportation to assess the cost impact for enhancing sustainability in a two-stage, automotive supply chain at a detailed, operational level. This is the subject of our current research as we seek to fill this gap in the literature that is of practical importance to industry.
3. Methodology
3.1. Integer Linear Programming Model
The proposed ILP model for the problem with multiple transportation modes is as follows.
Index Sets
| I | set of machines, indexed by i |
| J | set of cranes, indexed by j |
| P | set of part types, indexed by p |
| W | set of distribution centers, indexed by w |
| T | set of time periods, indexed by t |
| R | set of transportation modes, indexed by r |
Parameters
| Dt, p, w | demand by distribution center w of part type p in time period t (parts) |
| unit production time (cycle time) of part type p (mins) | |
| F | length of time period (mins) |
| Si, p, p’ | changeover time from part type to part type on machine i (mins) |
| Ep | maximum quantity of parts per unit load of part type p (parts/unit load) |
| K | plant finished part warehouse capacity (unit loads) |
| G | vehicle capacity (unit loads) |
| Hp | unit inventory holding cost of part type p ($/part/period) |
| Lr, w | cost of one trip from plant to distribution center w via transportation mode r ($/trip) |
| Mi | cost of downtime on machine i ($/min) |
| Np | cost of outsourcing of part type p ($/part) |
| Ai, p | equals one if machine i is compatible with part type p, 0 otherwise |
| Bj, i | equals one if crane j can serve setup on machine i, 0 otherwise |
| Cp, p’ | equals one if setup from part type to part type requires a crane, 0 otherwise |
| duration (time periods) of trip to distribution center w via transportation mode r | |
| lead time multiple |
Decision Variables
| quantity of part type p transported to distribution center w in time period t via transportation mode r | ||
| number of trips to distribution center w via transportation mode r in time period t | ||
| quantity of finished part inventory of part type p in time period t | ||
| quantity of part type p processed on machine i in time period t | ||
| quantity of outsourcing of part type p demanded by distribution center w in time period t | ||
| equals one if machine i processes part type p in time period t, 0 otherwise | ||
| equals one if machine i changes over from part type to part type in time period t, 0 otherwise | ||
| equals one if crane j serves setup on machine i in time period t, 0 otherwise | ||
| (1) | ||
| subject to | ||
| tT, rR, wW | (2) | |
| t = 1..-1, pP, r = 1, wW | (3) | |
| t = ..|T|, pP, wW | (4) | |
| tT | (5) | |
| t = 1, pP | (6) | |
| tT, pP, t | (7) | |
| t = 1, iI, pP | (8) | |
| tT, iI, pP, t | (9) | |
| tT, iI, pP, P, t | (10) | |
| tT, iI, pP | (11) | |
| tT, iI | (12) | |
| tT, iI, t | (13) | |
| tT, jJ, iI, t | (14) | |
| tT, jJ, t | (15) | |
| tT, iI, t | (16) | |
| and integer | , pP, wW, tT | (17) |
| , , | iI,
jJ,
pP, p’P, tT | (18) |
The model’s objective function (1) minimizes total integrated cost, which is composed of setup, inventory holding, transportation, and outsourcing cost. Constraint set (2) calculates the number of trips to every distribution center at every time period via every transportation mode based on transportation capacity and unit load volumes. Constraint sets (3) and (4) compute the quantities of outsourcing required for every part type at each DC from the first time period to the one preceding the lead time multiple, for the first transportation mode and all subsequent time periods, for all transportation modes, respectively. Next, constraint set (5) ensures the capacity of the plant’s finished part inventory storage is not exceeded. Constraint sets (6) and (7) conserve the flow of every part type during the first and subsequent periods, respectively. Next, constraint sets (8) and (9) ensure the available capacity of every machine cannot be exceeded during any time period.
Constraint set (10) dictates that if a machine changes to a different part type after the first time period, a setup is required. Constraint set (11) ensures that every machine respects machine-part type matching restrictions. Constraint set (12) limits the number of part types produced by a machine to one per time period, while constraint set (13) enforces that a machine setup requiring a crane (i.e. a tooling changeover) occurs if and only if a crane serves the setup. Constraint set (14) dictates that every crane respects crane-machine compatibility restrictions, while constraint sets (15) and (16) limit the number of machine setups per time period to a maximum of one per crane and one per machine, respectively. Finally, constraint sets (17) and (18) are non-negativity, integer, and binary value constraints, respectively. Because of the model’s complexity, there is no existing algorithm that can solve the current research problem to optimality in polynomial time. Therefore, we provide a hybrid metaheuristic algorithm for achieving near-optimal solutions in a timely manner in the next section.
3.2. Hybrid Simulated Annealing Algorithm
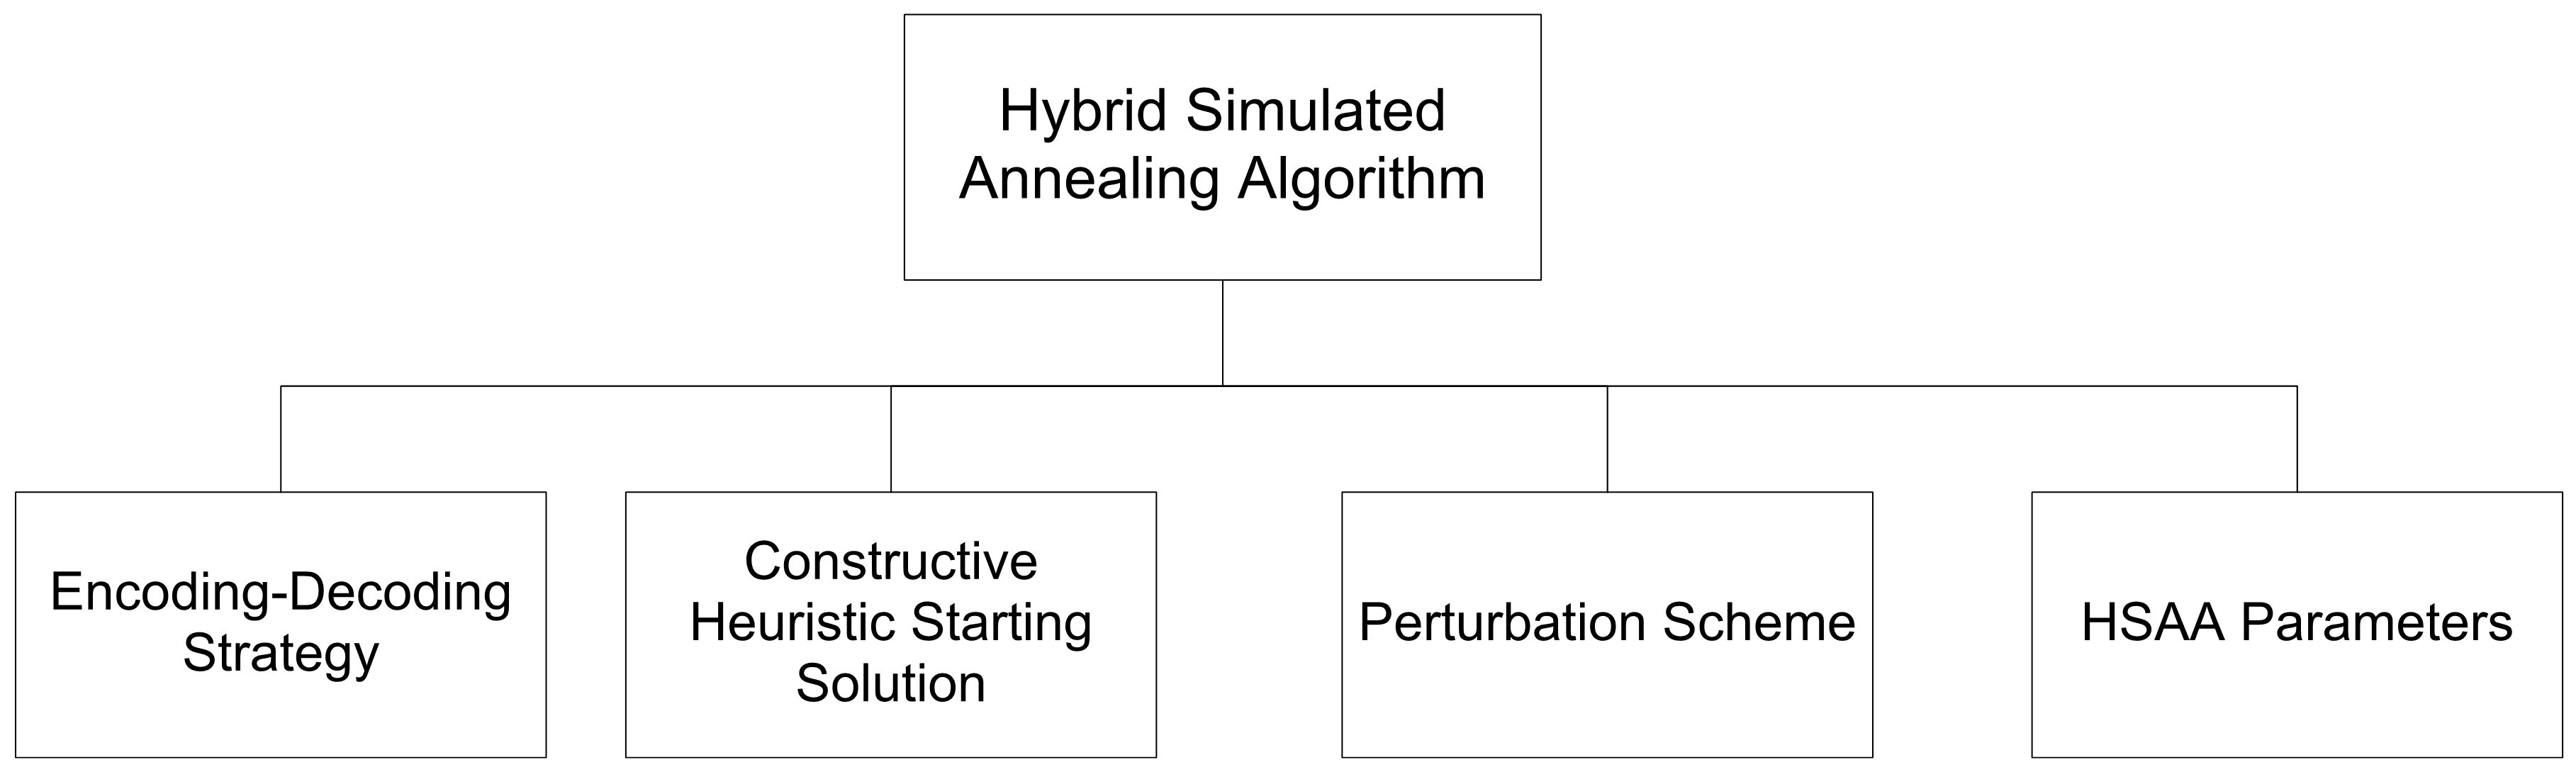
We adapt the hybrid simulated annealing algorithm (HSAA) presented by Masoud and Mason [19] to solve the ILP model proposed in Section 3.1. The elements of HSAA are depicted in Figure 2. The original encoding-decoding strategy is used in the current study, but a necessary decoding modification is made to accommodate the multiple modes of transportation. Once the matrix of priority lists is decoded into machine-part type and crane-machine assignments, the values of all binary variables become fixed, producing a reduced integer linear program (ILP) with the original binary variables becoming input parameters in the reduced model.
The next step is to solve the reduced ILP to finish the decoding and objective function evaluation procedure, including solving for the shipping quantities via each transportation mode. However, since even the reduced ILP can sometimes need a significant amount of time to solve to optimality, we set a time limit of five seconds to speed up the algorithm performance. This time limit, multiplied by the number of iterations the proposed HSAA search performs, sets an upper bound on the overall algorithm’s run time. Nevertheless, the five-second time limit is not reached in most cases, and therefore the HSAA often solves single instances quite quickly.
Moreover, since the required modification involves the decoding stage only and the constructive heuristic starting solution works in the encoding space, the latter is used here without any changes. The HSAA is coded in MATLAB 8.1, and all problem instances are run on an Intel Core i7, 3.4 GHz processor, 8 GB of RAM, 64-bit, Windows 7 workstation, while the reduced ILP model is coded in AMPL and solved using CPLEX 11.2. According to preliminary results from some pilot test runs, the number of iterations is set to equal 3000, and the starting temperature equals 5000. Only one perturbation scheme is used: the one resulting in the best results in previous research. This perturbation scheme swaps two terms randomly in a random row of the encoding matrix of priority lists. Finally, the cooling schedule parameter is set to equal 0.9.
3.3. Experimentation Strategy
We focus on analyzing the impact of availability of multiple transportation modes in the two-stage, automotive supply chain system. Three problem instance sets of three sizes that we term “small,” “medium,” and “large” are the subject of analysis in the current study. These three problem test instance sets are outlined in Table 1, Table 2, Table 3, Table 4 and Table 5. The generation of test instance data reflects a wide range of realistic conditions in the automotive supply chain, resulting from interacting with our industry partner. We vary the cost and lead time of the additional transportation mode as multiples of those of the existing TL mode. The combinations of five cost and seven lead time multiples result in 35 instances per every instance set, and the proposed, adapted HSAA is used to solve all instances. The cost and time multiples reflect the different possible longer lead times and lower costs of the additional transportation mode (intermodal).
4. Results and Discussion
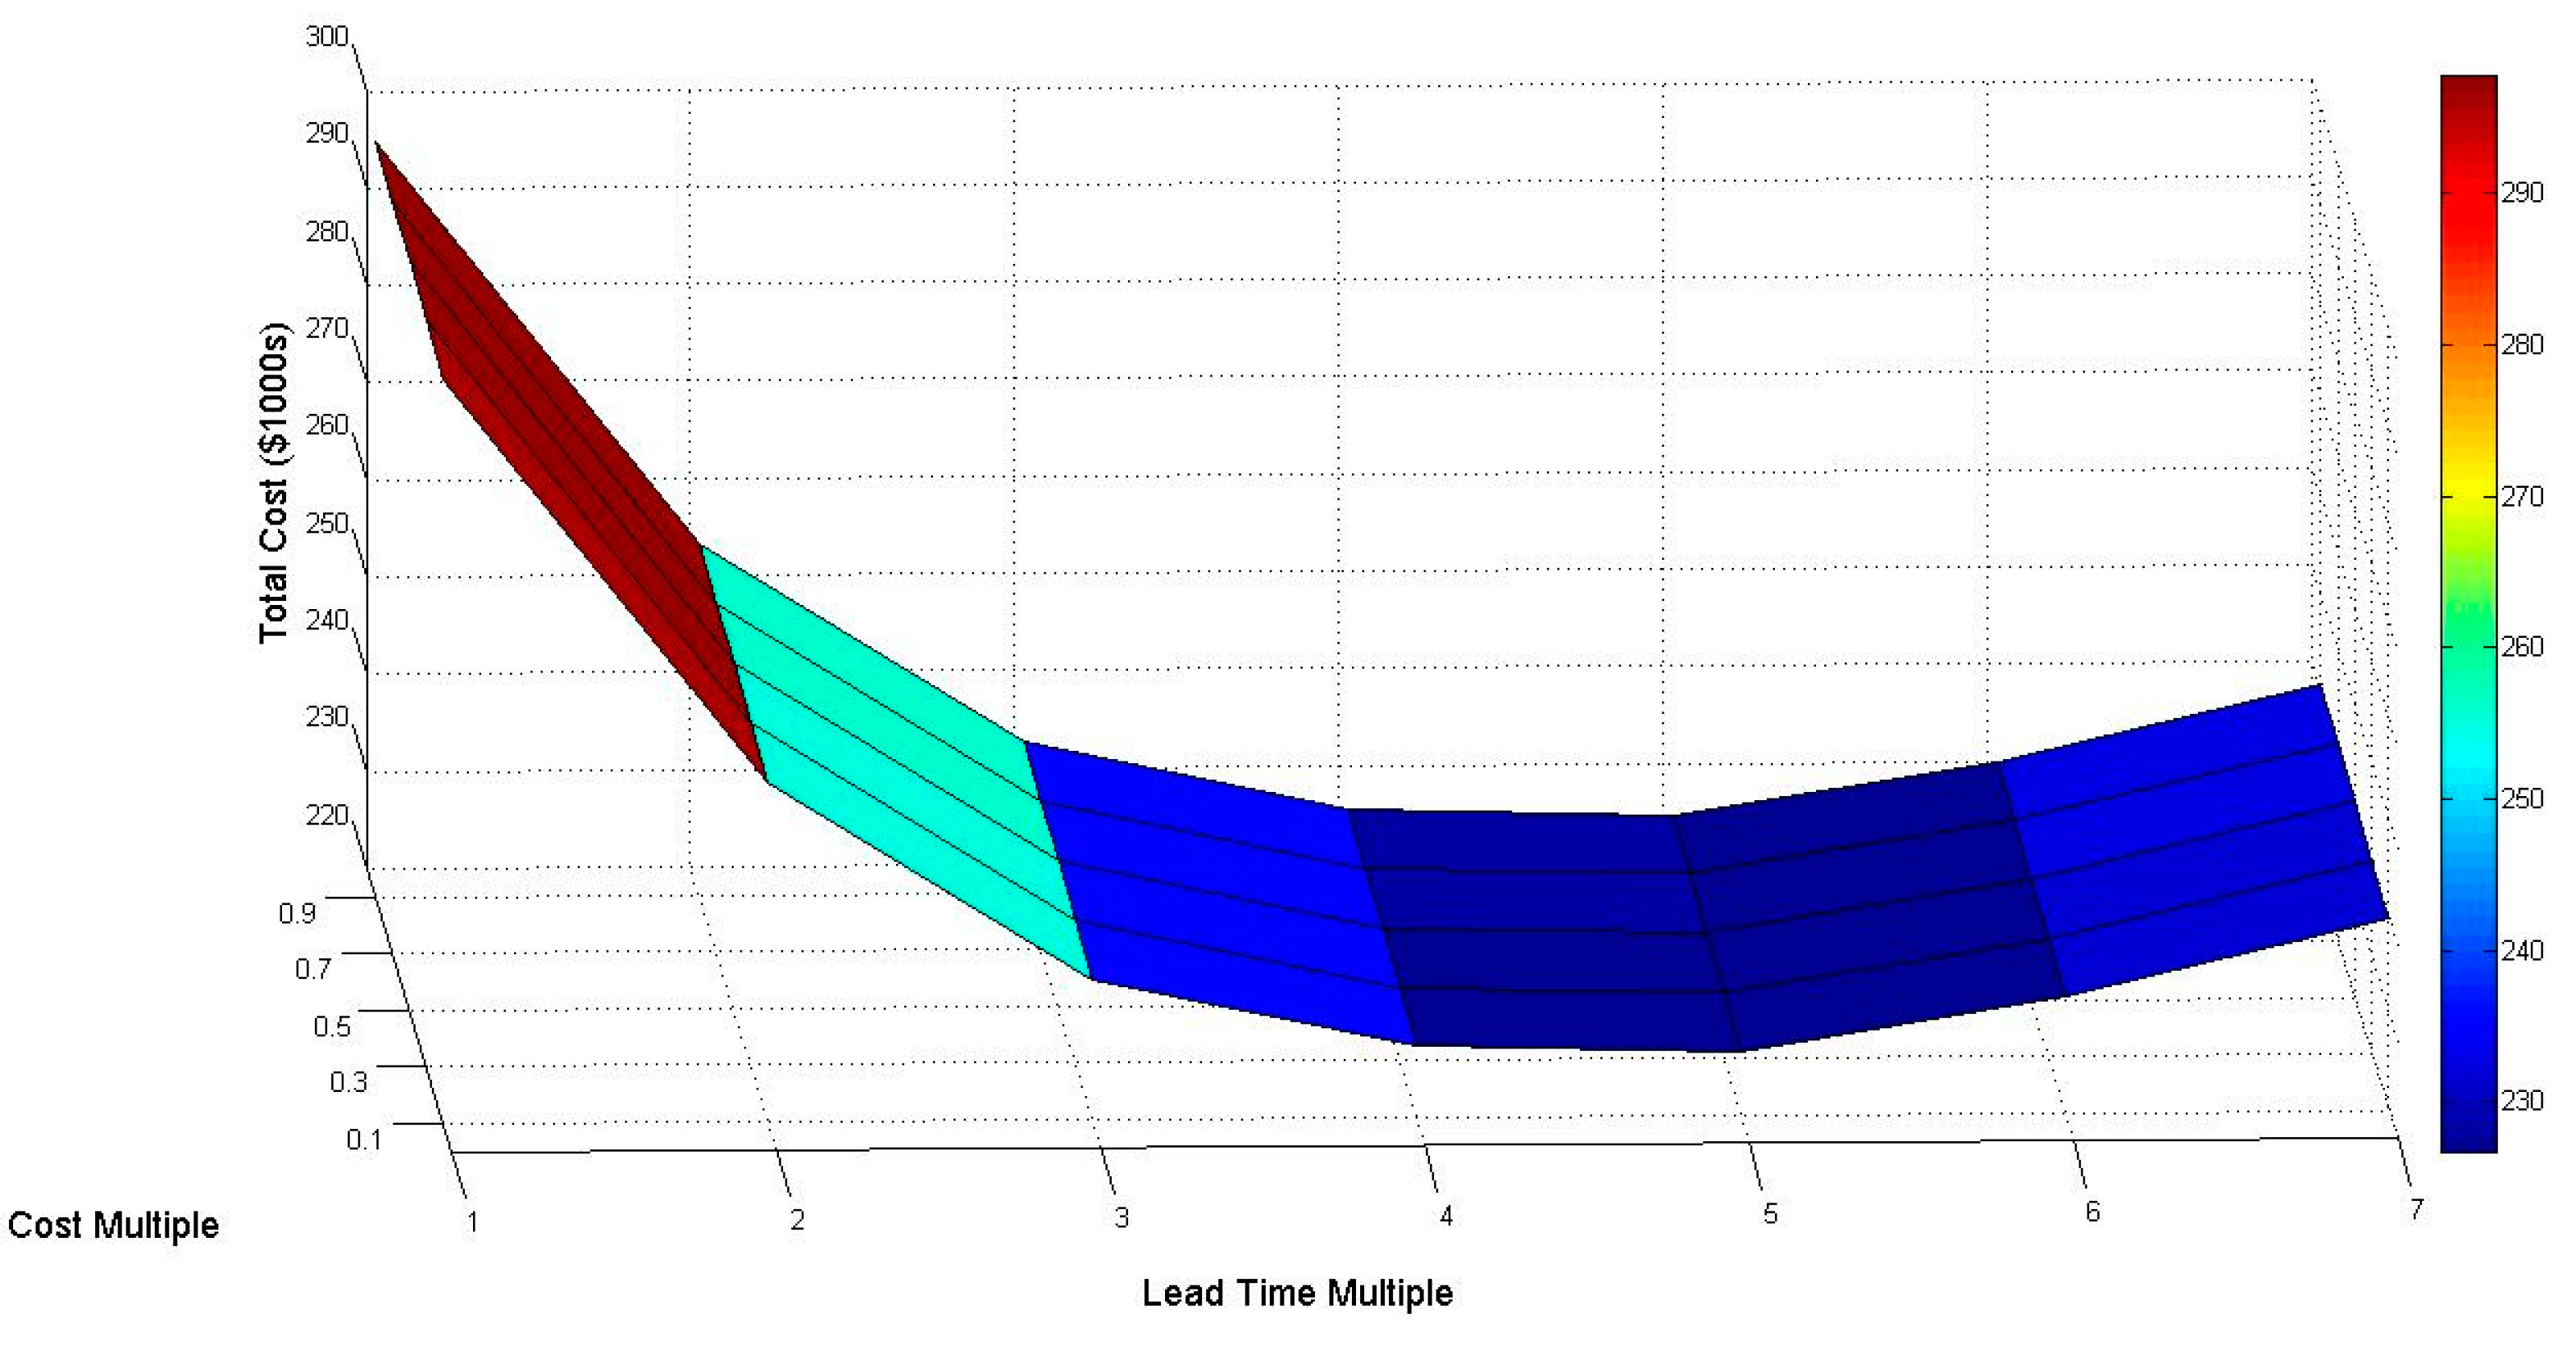
Every problem instance is solved using HSAA five times independently, resulting in a total of 525 problem instance runs. Given the problem’s NP-hard computational complexity, HSAA can find approximate solutions in a timely manner for industry use (3828 s, on average). The resulting total integrated costs (averages over five runs per instance) are listed in Table 6, Table 7 and Table 8. Figure 3, Figure 4 and Figure 5 show the variation of total integrated costs across the different cost and lead time multiples of the additional transportation mode.
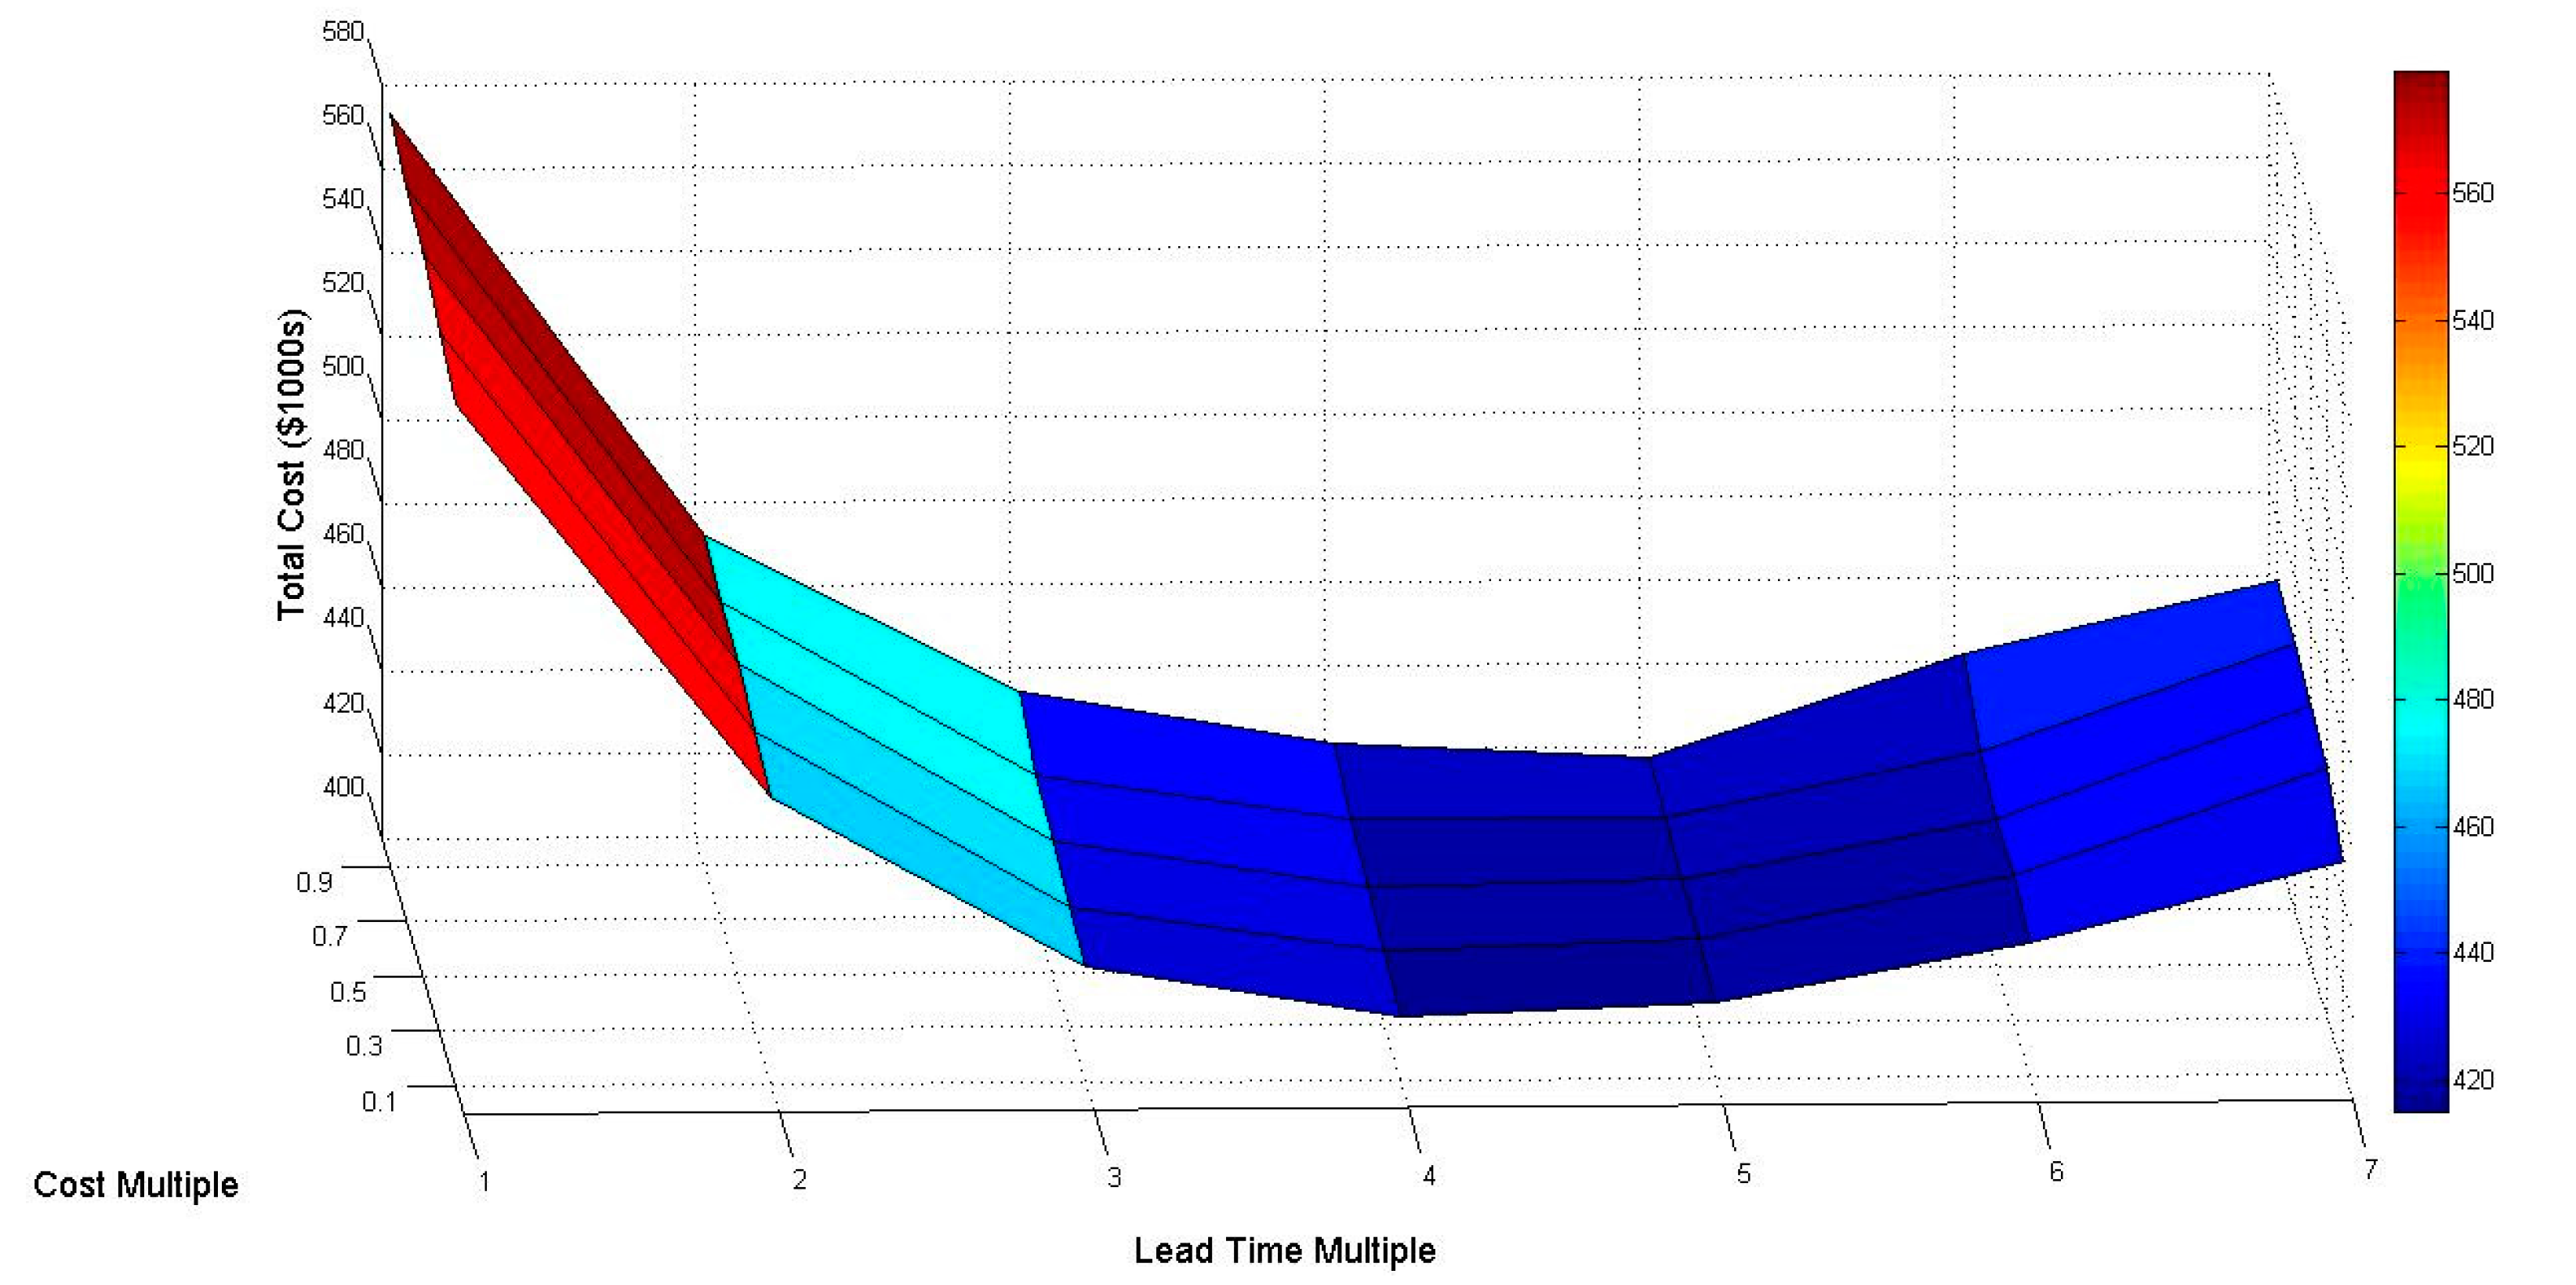
From Figure 3, Figure 4 and Figure 5, it is evident that introducing an additional transportation mode with a cheaper transportation cost but a longer lead time can have a dramatic effect on the total integrated cost. Also, further increasing the lead time multiple reduces the total integrated cost, especially in the large and medium-sized problem instance sets. As the lead time multiple increases, there is a larger opportunity for cost saving through reducing the more expensive transportation mode as well as storage costs. Moreover, as the cost multiple increases, so does the total integrated cost. This is expected since increasing the cost multiple has a direct effect on increasing the total integrated cost. However, the effect of the lead time multiple is much higher than that of the cost multiple.
Using the low-cost, longer lead-time transportation mode cuts some of the cost of the higher-cost transportation mode and also saves some production setup and storage costs. The slower mode of transportation allows early production of some part type quantities that are demanded at later periods, which saves production setup cost. Furthermore, once these parts are produced, they are shipped via the slower transportation mode, and thus the company saves the cost for storing these parts. These cost savings are possible because of the synergies identified by applying our proposed solution method to minimize the total integrated cost.
In the case of a small-sized instance set (Figure 4), beyond a lead time multiple of two, the effect is not as large as in the cases of medium and large-sized sets. Also in all instance sets, as the second transportation mode lead time multiple increases beyond four or five, the total integrated cost increases. This is explained by the fact that when the lead time multiple is so long, there is less opportunity for making use of the less expensive second transportation mode over the planning horizon. In other words, although the quality (potential inventory holding cost savings per time period) increases, the quantity (how many times these savings can be realized) decreases, and the resulting total integrated cost actually increases. Overall, our results indicate that as the problem size increases, so does the opportunity for higher cost savings through an additional transportation mode with longer lead time. These insights can be used in practice by automotive supply chain decision makers towards assessing the impact of having multiple transportation modes, enhancing the supply chain sustainability and decreasing the total integrated cost.
5. Conclusions and Future Research
We present a mathematical model and an algorithm to analyze a problem that is faced by industry. The goal of our analysis is to support decision makers of a tier-1 automotive supplier while considering the effect of multiple modes of transportation, which enhances supply chain sustainability, on the total integrated cost. The proposed model and method constitute a proof of concept, and they can be implemented as part of an enterprise-wide IT system, such as an ERP system. Alternatively, they can be implemented as a standalone system to support such decisions. To assess the cost impact of different transportation options for enhancing sustainability in a two stage, automotive supply chain, our integer linear programming model includes multiple transportation options offering different lead times at varying costs. Our analysis demonstrates the different effects the cost and lead time of an additional transportation mode have on the total integrated cost. The insights gained from this research highlight the impact of the additional transportation mode lead time on reducing the total integrated cost by reducing the inventory holding and transportation costs over the single transportation mode case. These insights are valuable for decision makers when considering additional supply chain transportation modes to enhance sustainability. In future research, the objective function can be modified to take into account the environmental costs or incentives that would result from selecting a particular mode of transportation. It is also possible to optimize economic and sustainability objectives, as separate objectives, by applying the multiobjective optimization methodology to the research problem. Furthermore, the performance of the presented HSAA can be compared to that of other methods, such as different types of metaheuristics.
Author Contributions
All authors conceived, designed and performed the experiments; analyzed the data and wrote the paper.
Conflicts of Interest
The authors declare no conflict of interest.
References
- Freight Railroads Help Reduce Greenhouse Gas Emissions, Association of American Railroads. 2017. Available online: https://www.aar.org/BackgroundPapers/Railroads%20and%20Greenhouse%20Gas%20Emissions.pdf (accessed on 24 June 2017).
- Seuring, S.; Müller, M. From a literature review to a conceptual framework for sustainable supply chain management. J. Clean. Prod. 2008, 16, 1699–1710. [Google Scholar] [CrossRef]
- Seuring, S. A review of modeling approaches for sustainable supply chain management. Decis. Support Syst. 2013, 54, 1513–1520. [Google Scholar] [CrossRef]
- Darom, N.A.M.; Hishamuddin, H. Integration of economic and environmental aspects in sustainable supply chain management: A review. In Proceedings of the 6th International Conference on Industrial Engineering and Operations Management in Kuala Lumpur, Kuala Lumpur, Malaysia, 8–10 March 2016. [Google Scholar]
- Dubey, R.; Gunasekaran, A.; Papadopoulos, T.; Childe, S.J.; Shibin, K.T.; Wamba, S.F. Sustainable supply chain management: Framework and further research directions. J. Clean. Prod. 2017, 142, 1119–1130. [Google Scholar] [CrossRef]
- Azevedo, S.; Barros, M. The application of the triple bottom line approach to sustainability assessment: The case study of the UK automotive supply chain. J. Ind. Eng. Manag. 2017, 10, 286. [Google Scholar] [CrossRef]
- Park, Y.B. An integrated approach for production and distribution planning in supply chain management. Int. J. Prod. Res. 2015, 43, 1205–1224. [Google Scholar] [CrossRef]
- Steinrücke, M. An approach to integrate production-transportation planning and scheduling in an aluminium supply chain network. Int. J. Prod. Res. 2011, 49, 6559–6583. [Google Scholar] [CrossRef]
- Bajgiran, O.S.; Zanjani, M.K.; Nourelfath, M. The value of integrated tactical planning optimization in the lumber supply chain. Int. J. Prod. Econ. 2016, 171, 22–33. [Google Scholar] [CrossRef]
- de Matta, R.; Miller, T. Production and inter-facility transportation scheduling for a process industry. Eur. J. Oper. Res. 2004, 158, 72–88. [Google Scholar] [CrossRef]
- Chen, B.; Lee, C. Logistics scheduling with batching and transportation. Eur. J. Oper. Res. 2008, 189, 871–876. [Google Scholar] [CrossRef]
- Zhang, J.; Ding, H.W.; Wang, X.Q.; Yin, W.J.; Zhao, T.Z.; Dong, J. Mode choice for the intermodal transportation considering carbon emissions. In Proceedings of the IEEE International Conference on Service Operations, Logistics, and Informatics (SOLI), Beijing, China, 10–12 July 2011. [Google Scholar]
- Volling, T.; Spengler, T.S. Modeling and simulation of order-driven planning policies in build-to-order automobile production. Int. J. Prod. Econ. 2011, 131, 183–193. [Google Scholar] [CrossRef]
- Florian, M.; Kemper, J.; Sihn, W.; Hellingrath, B. Concept of transport-oriented scheduling for reduction of inbound logistics traffic in the automotive industries. CIRP J. Manuf. Sci. Technol. 2011, 4, 252–257. [Google Scholar] [CrossRef]
- Yildiz, H.; Ravi, R.; Fairey, W. Integrated optimization of customer and supplier logistics at Robert Bosch LLC. Eur. J. Oper. Res. 2010, 207, 456–464. [Google Scholar] [CrossRef]
- Sezen, B.; Karakadilar, I.S.; Buyukozkan, G. Roposition of a model for measuring adherence to lean practices: Applied to Turkish automotive part suppliers. Int. J. Prod. Res. 2012, 50, 3878–3894. [Google Scholar] [CrossRef]
- Singh, P.J.; Smith, A.; Sohal, A.S. Strategic supply chain management issues in the automotive industry: An Australian perspective. Int. J. Prod. Res. 2005, 43, 3375–3399. [Google Scholar] [CrossRef]
- Limere, V.; Landeghem, H.V.; Goetschalckx, M.; Aghezzaf, E.-H.; McGinnis, L.F. Optimising part feeding in the automotive assembly industry: Deciding between kitting and line stocking. Int. J. Prod. Res. 2012, 50, 4046–4060. [Google Scholar] [CrossRef]
- Masoud, S.A.; Mason, S.J. Integrated cost optimization in a two-stage, automotive supply chain. Comput. Oper. Res. 2016, 67, 1–11. [Google Scholar] [CrossRef]
Figure 1.
The two-stage automotive supply chain system with heterogeneous transportation.
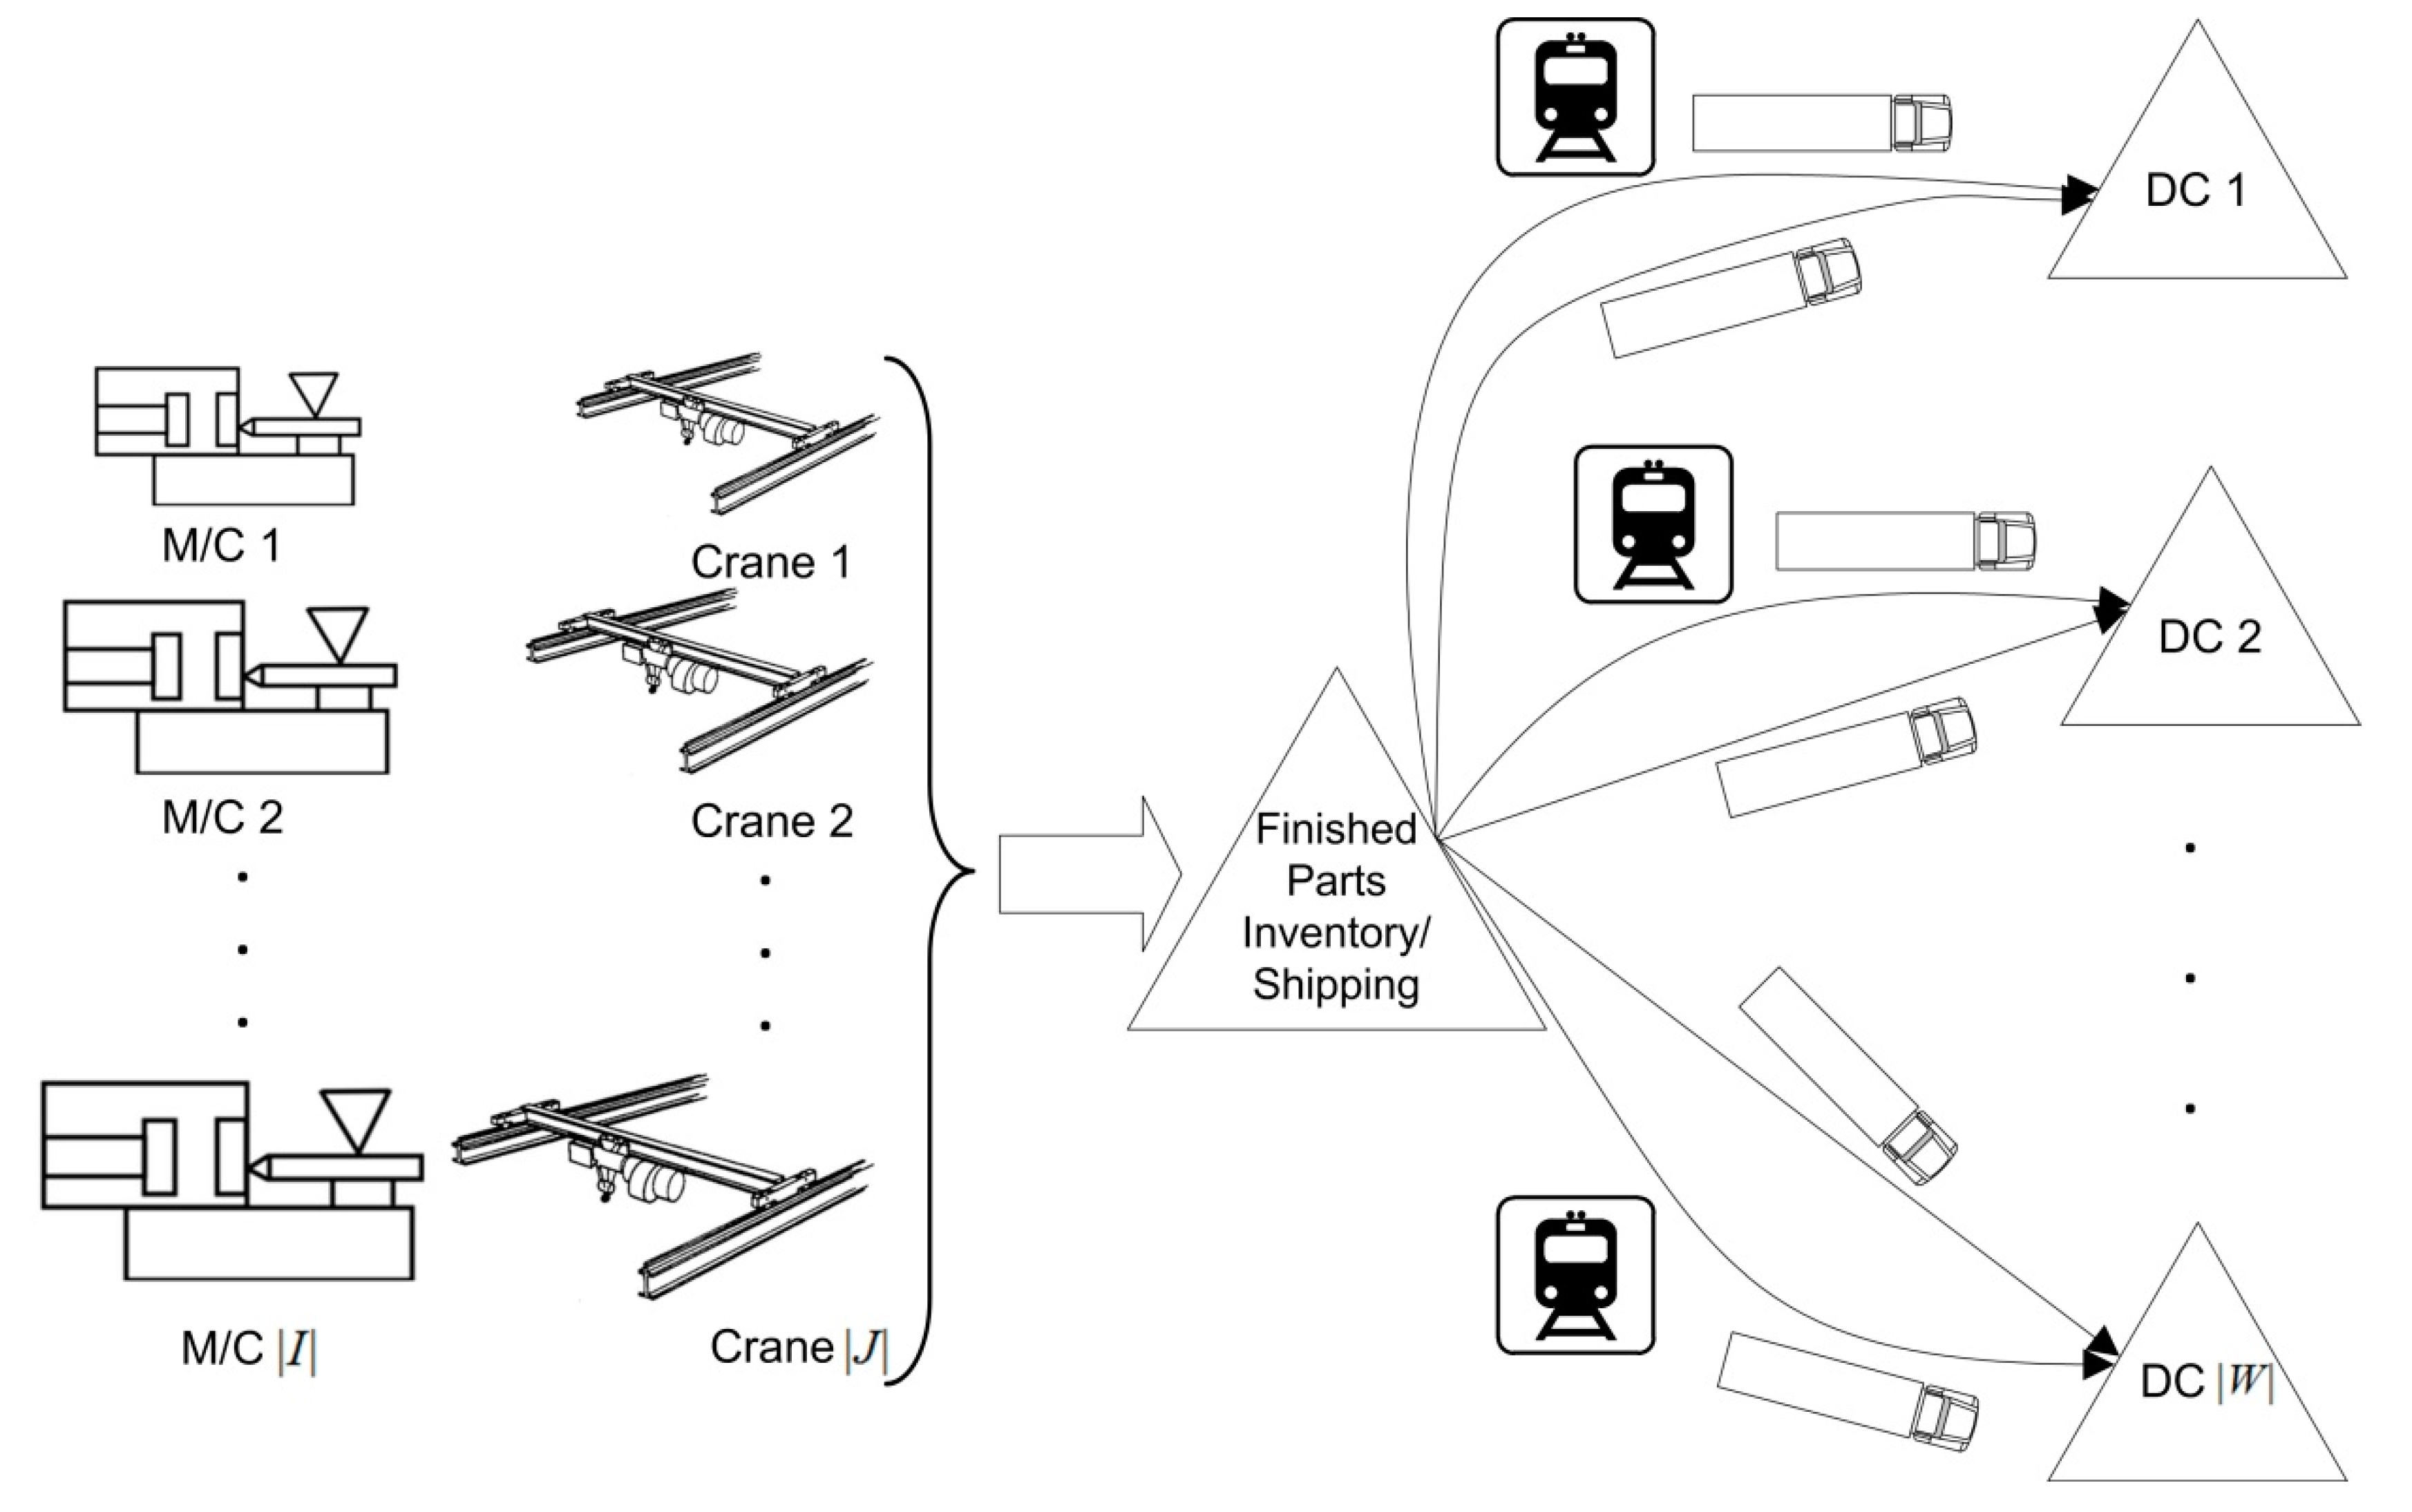
Figure 2.
The elements of HSAA.

Figure 3.
Results for the large instance set.

Figure 4.
Results for the small instance set.
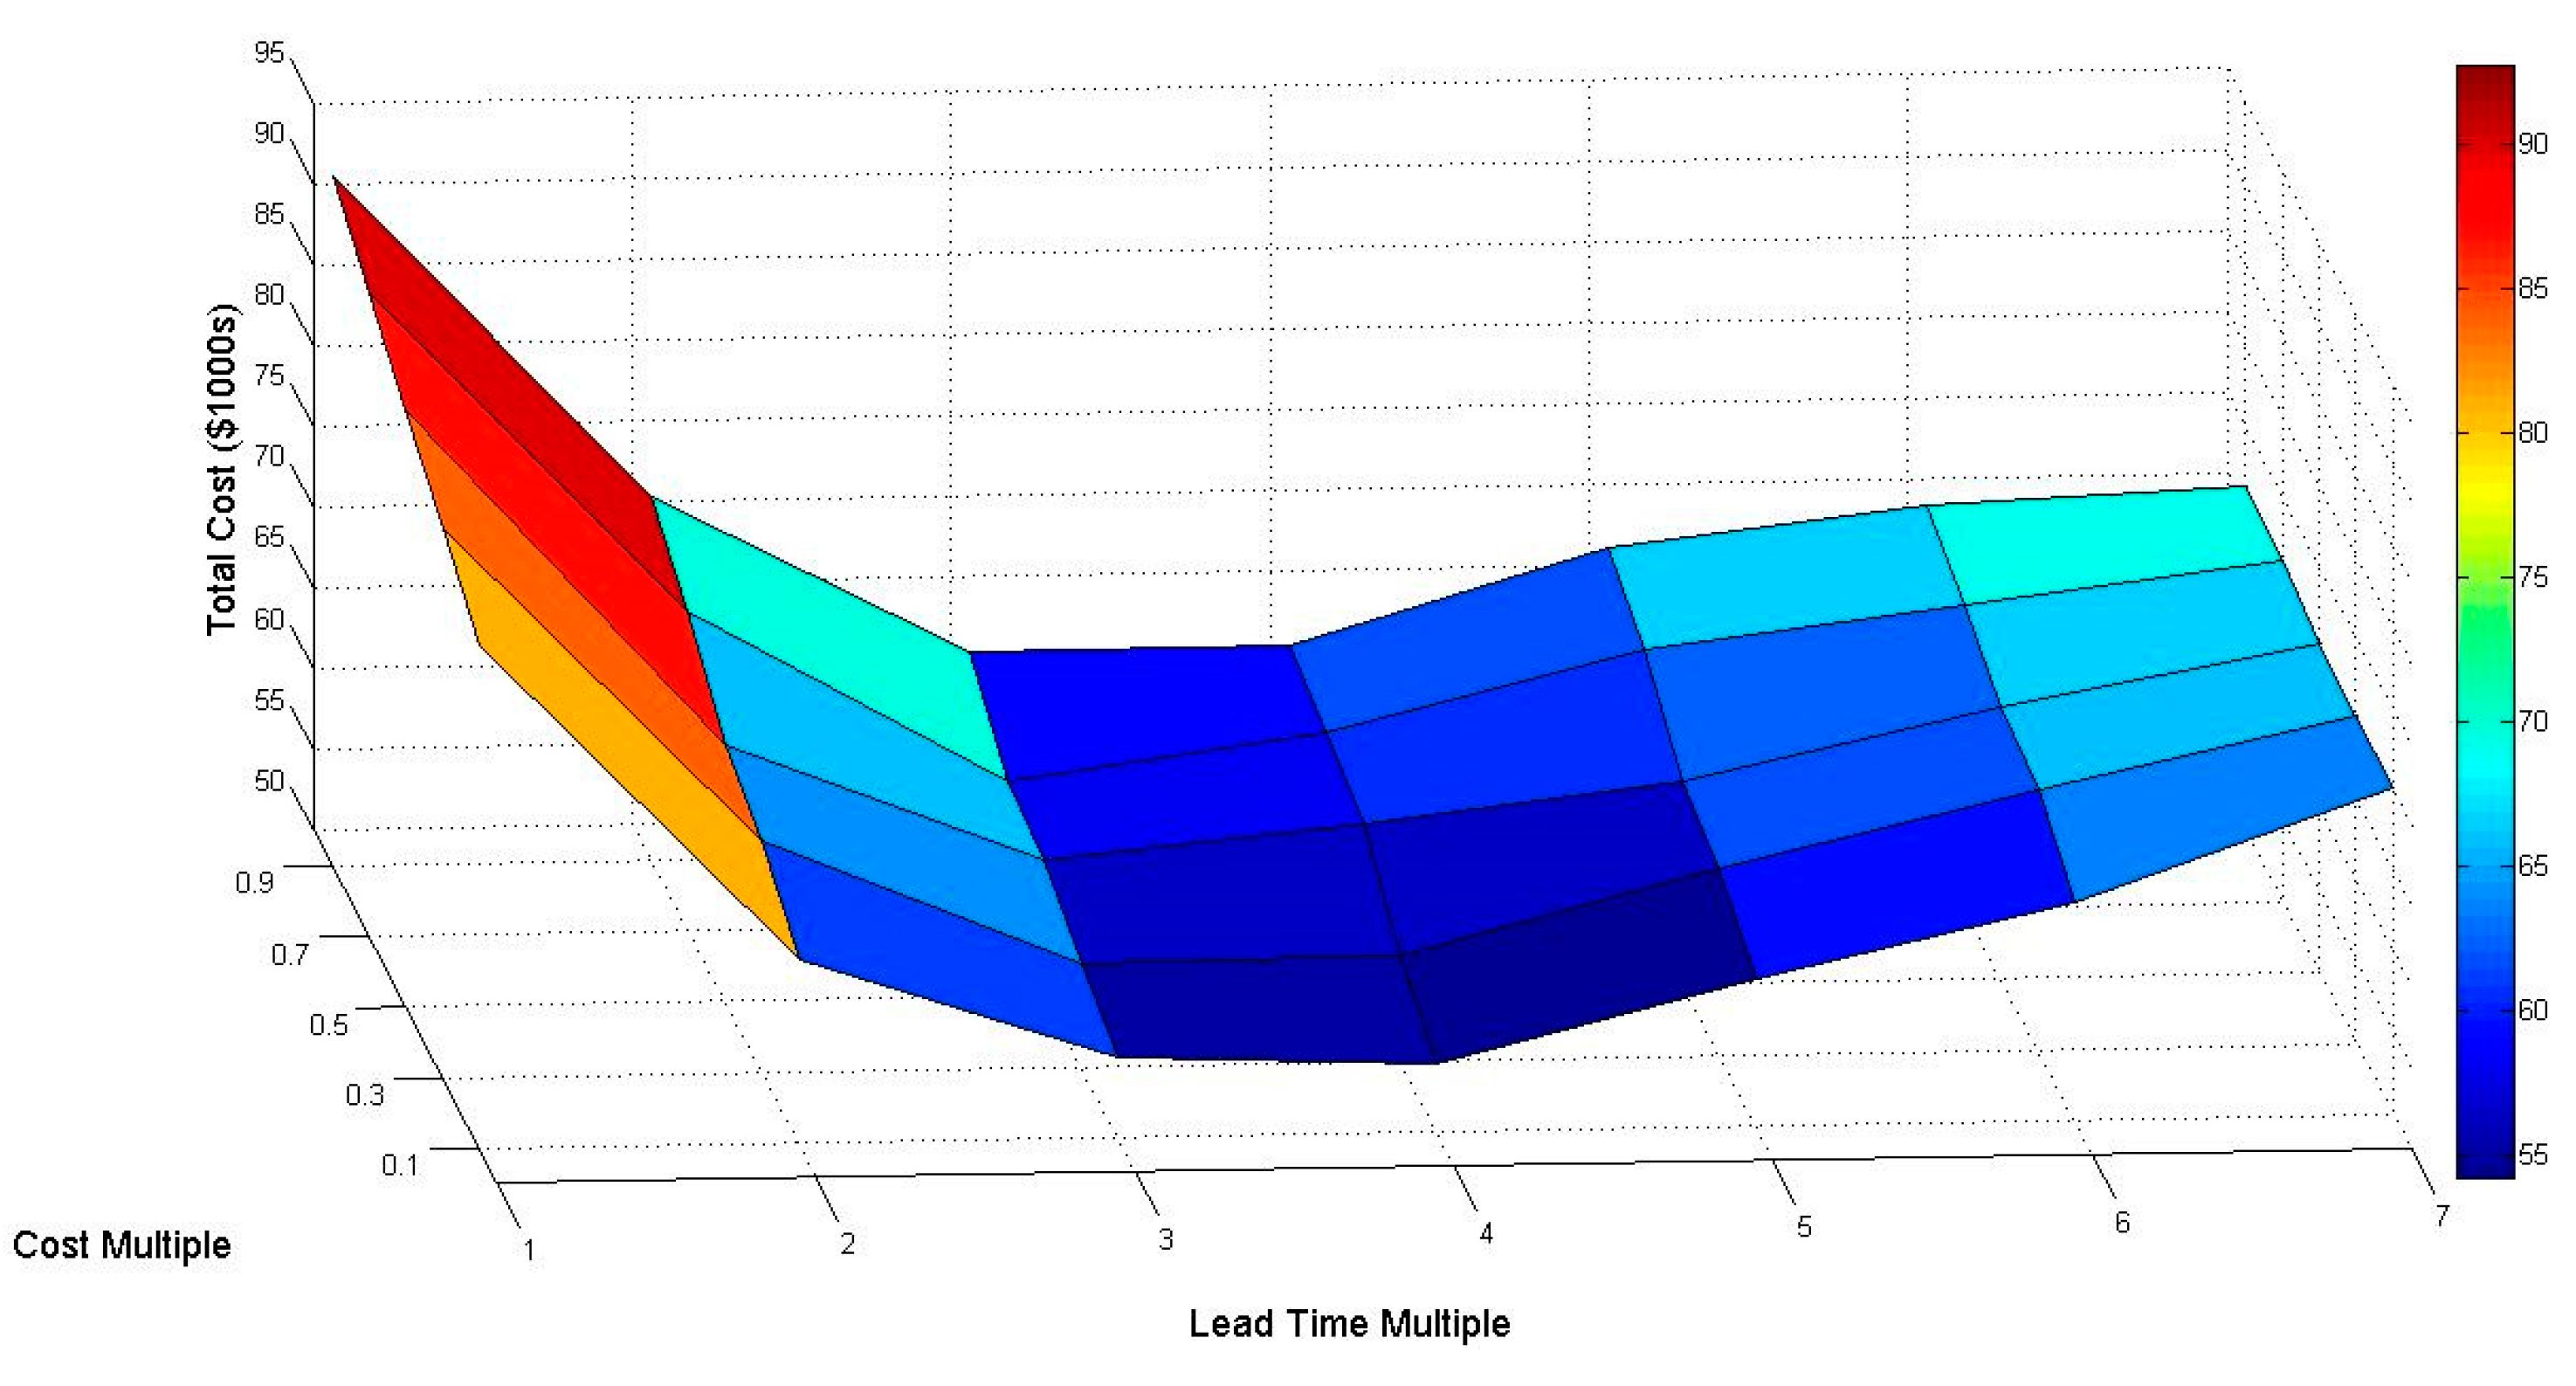
Figure 5.
Results for the medium instance set.

Table 1.
Description of problem test instance sets.
| Instance Set | Part Type (Machine) Mix | Number of Part Types (|P|) | Number of Machines (|I|) | Number of Cranes (|J|) | Number of Time Periods (|T|) | Number of DCs (|W|) |
|---|---|---|---|---|---|---|
| 1 (large) | 2 | 25 | 10 | 5 | 16 | 3 |
| 2 (small) | 1 | 5 | 5 | 5 | 16 | 3 |
| 3 (medium) | 0 | 25 | 5 | 3 | 16 | 1 |
Table 2.
Constituents of part type and machine mixes.
| Part Type (Machine) Mix | Small (%) | Medium (%) | Large (%) |
|---|---|---|---|
| Mi× 0 | 60 | 20 | 20 |
| Mi× 1 | 20 | 60 | 20 |
| Mi×2 | 20 | 20 | 60 |
Table 3.
Other experimental parameter values.
| Parameters | Values |
|---|---|
| Si,p,p’ | 15, 30, 40, 45, 55 |
| Small: DU [10, 45], Medium: DU [46, 80], Large: DU [81, 120] | |
| Np | Small: DU [10, 40], Medium: DU [41, 70], Large: DU [71, 100] |
| Hp | Small: DU [1, 4], Medium: DU [5, 7], Large: DU [8, 10] |
| Ep | Small: DU [201, 5000], Medium: DU [51, 200], Large: DU [10, 50] |
| Mi | Small: DU [10, 40], Medium: DU [41, 70], Large: DU [71, 100] |
| K | 7|I| |
| G | 10 |
| Lw | DC1: 100, DC2: 300, DC3: 500 |
| F | 6 |
Table 4.
Experimental setup time values.
| S (mins) | Tool Change | Color Change |
|---|---|---|
| Small machine | 40 | 15 |
| Medium machine | 45 | 30 |
| Large machine | 55 | 45 |
Table 5.
Details for generating experimental parameters D, A, B, and C.
| Parameter | Assumptions |
|---|---|
| Dt, p, w |
|
| Ai, p |
|
| Bj, i |
|
| Cp, p’ |
|
Table 6.
Total integrated costs for the large test instance set in $1000s.
| Cost Multiples | Time Multiples | ||||||
|---|---|---|---|---|---|---|---|
| 1 | 2 | 3 | 4 | 5 | 6 | 7 | |
| 0.1 | 562.5 | 468.3 | 427.6 | 415.1 | 418.0 | 431.9 | 450.9 |
| 0.3 | 566.5 | 470.8 | 428.7 | 417.8 | 419.9 | 434.8 | 460.1 |
| 0.5 | 572.1 | 474.3 | 431.2 | 419.8 | 421.3 | 434.9 | 461.7 |
| 0.7 | 575.2 | 475.7 | 433.8 | 422.8 | 422.8 | 438.4 | 463.5 |
| 0.9 | 579.4 | 478.3 | 440.6 | 428.1 | 423.9 | 448.1 | 465.3 |
Table 7.
Total integrated costs for the small test instance set in $1000s.
| Cost Multiples | Time Multiples | ||||||
|---|---|---|---|---|---|---|---|
| 1 | 2 | 3 | 4 | 5 | 6 | 7 | |
| 0.1 | 81.1 | 61.3 | 54.9 | 54.2 | 59.1 | 63.4 | 70.2 |
| 0.3 | 84.0 | 64.3 | 56.3 | 56.5 | 61.5 | 66.0 | 70.3 |
| 0.5 | 86.9 | 65.9 | 58.4 | 60.3 | 62.6 | 66.8 | 70.4 |
| 0.7 | 89.8 | 69.7 | 58.9 | 61.5 | 66.3 | 68.7 | 71.1 |
| 0.9 | 92.7 | 72.5 | 62.5 | 62.6 | 68.3 | 70.5 | 71.4 |
Table 8.
Total integrated costs for the medium test instance set in $1000s.
| Cost Multiples | Time Multiples | ||||||
|---|---|---|---|---|---|---|---|
| 1 | 2 | 3 | 4 | 5 | 6 | 7 | |
| 0.1 | 296.4 | 254.9 | 234.4 | 227.3 | 226.6 | 231.9 | 239.8 |
| 0.3 | 296.7 | 255.2 | 234.7 | 227.5 | 226.9 | 232.1 | 240.0 |
| 0.5 | 297.1 | 255.5 | 235.0 | 227.8 | 227.1 | 232.4 | 240.2 |
| 0.7 | 297.4 | 255.8 | 235.3 | 228.1 | 227.4 | 232.8 | 240.4 |
| 0.9 | 297.7 | 256.1 | 235.5 | 228.3 | 227.6 | 232.8 | 240.6 |
© 2017 by the author. Licensee MDPI, Basel, Switzerland. This article is an open access article distributed under the terms and conditions of the Creative Commons Attribution (CC BY) license (http://creativecommons.org/licenses/by/4.0/).
Share and Cite
MDPI and ACS Style
Masoud, S.A.; Mason, S.J. Assessing the Cost Impact of Multiple Transportation Modes to Enhance Sustainability in an Integrated, Two Stage, Automotive Supply Chain. Informatics 2017, 4, 34. https://doi.org/10.3390/informatics4040034
AMA Style
Masoud SA, Mason SJ. Assessing the Cost Impact of Multiple Transportation Modes to Enhance Sustainability in an Integrated, Two Stage, Automotive Supply Chain. Informatics. 2017; 4(4):34. https://doi.org/10.3390/informatics4040034
Chicago/Turabian StyleMasoud, Sherif A., and Scott J. Mason. 2017. "Assessing the Cost Impact of Multiple Transportation Modes to Enhance Sustainability in an Integrated, Two Stage, Automotive Supply Chain" Informatics 4, no. 4: 34. https://doi.org/10.3390/informatics4040034
Note that from the first issue of 2016, this journal uses article numbers instead of page numbers. See further details here.